Embed Size (px)
Citation preview
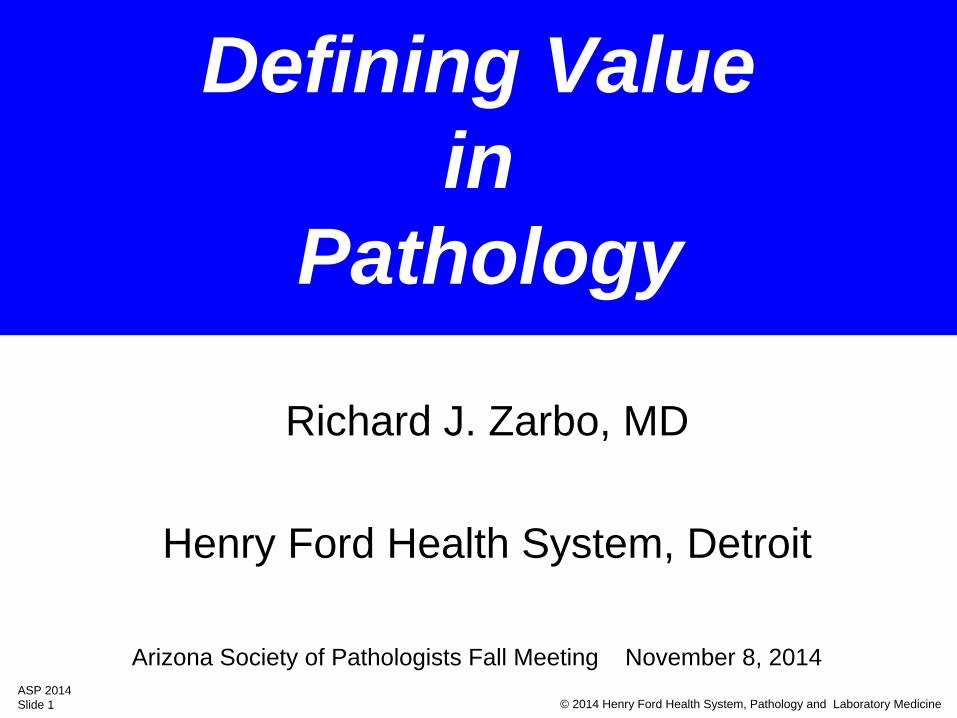
© 2014 Henry Ford Health System, Pathology and Laboratory MedicineASP 2014Slide 1
Defining Value in
Pathology
Richard J. Zarbo, MD
Henry Ford Health System, Detroit
Arizona Society of Pathologists Fall Meeting November 8, 2014
© 2014 Henry Ford Health System, Pathology and Laboratory MedicineASP 2014Slide 2
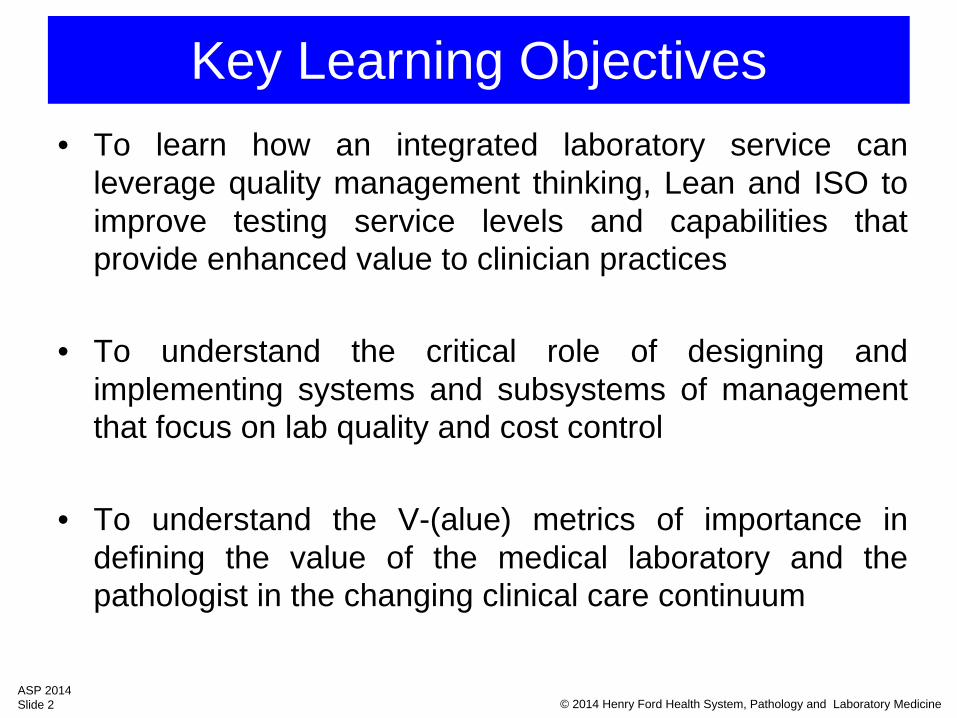
Key Learning Objectives• To learn how an integrated laboratory service can
leverage quality management thinking, Lean and ISO to improve testing service levels and capabilities that provide enhanced value to clinician practices
• To understand the critical role of designing and implementing systems and subsystems of management that focus on lab quality and cost control
• To understand the V-(alue) metrics of importance in defining the value of the medical laboratory and the pathologist in the changing clinical care continuum
© 2014 Henry Ford Health System, Pathology and Laboratory MedicineASP 2014Slide 3
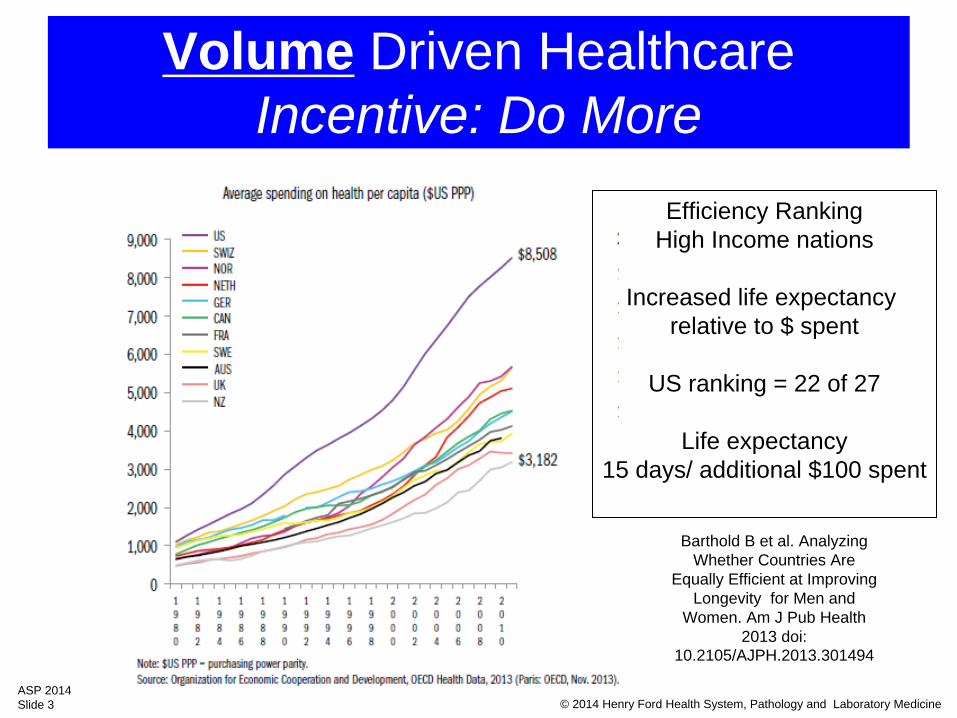
Volume Driven HealthcareIncentive: Do More
Efficiency RankingHigh Income nations
Increased life expectancy relative to $ spent
US ranking = 22 of 27
Life expectancy15 days/ additional $100 spent
Barthold B et al. Analyzing Whether Countries Are
Equally Efficient at Improving Longevity for Men and
Women. Am J Pub Health 2013 doi:
10.2105/AJPH.2013.301494
© 2014 Henry Ford Health System, Pathology and Laboratory MedicineASP 2014Slide 4
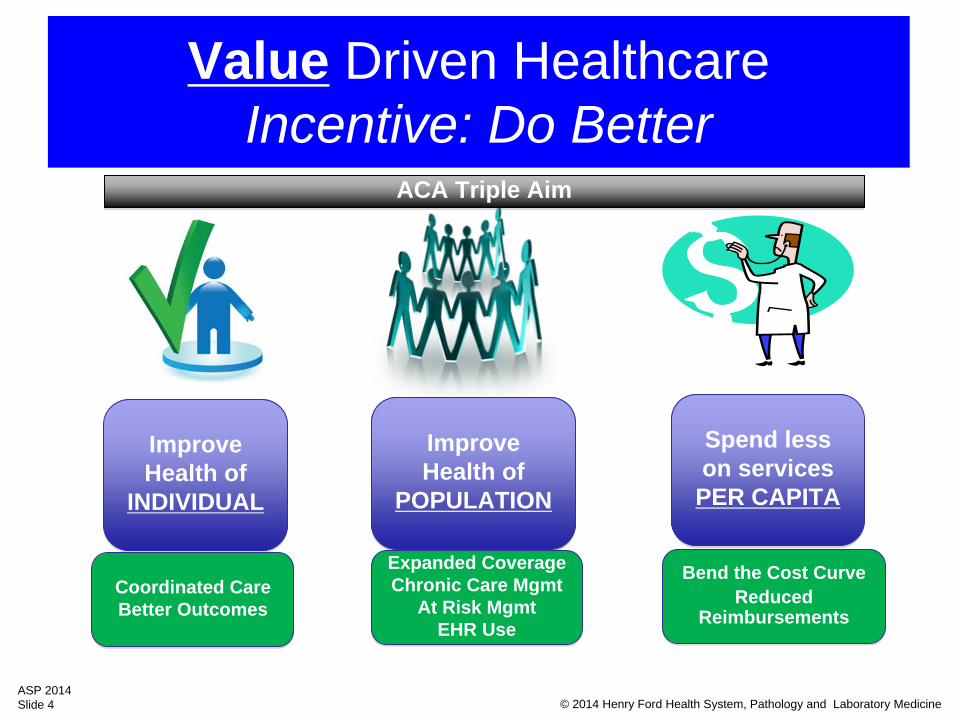
Value Driven HealthcareIncentive: Do Better
ImproveHealth of
INDIVIDUAL
ImproveHealth of
INDIVIDUAL
ImproveHealth of
POPULATION
ImproveHealth of
POPULATION
Spend lesson services
PER CAPITA
Spend lesson services
PER CAPITA
Coordinated CareBetter OutcomesCoordinated CareBetter Outcomes
Expanded CoverageChronic Care Mgmt
At Risk MgmtEHR Use
Expanded CoverageChronic Care Mgmt
At Risk MgmtEHR Use
Bend the Cost CurveReduced
Reimbursements
Bend the Cost CurveReduced
Reimbursements
ACA Triple AimACA Triple Aim
© 2014 Henry Ford Health System, Pathology and Laboratory MedicineASP 2014Slide 5
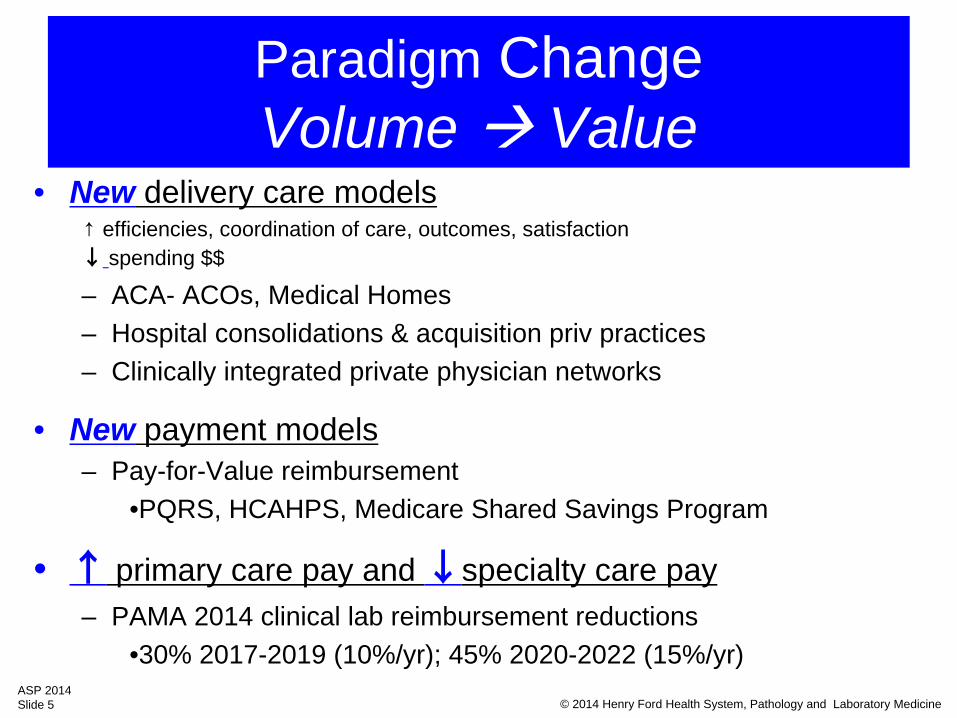
Paradigm Change Volume Value
• New delivery care models↑
efficiencies, coordination of care, outcomes, satisfaction ↓ spending $$
– ACA- ACOs, Medical Homes– Hospital consolidations & acquisition priv practices– Clinically integrated private physician networks
• New payment models– Pay-for-Value reimbursement
•PQRS, HCAHPS, Medicare Shared Savings Program
• ↑ primary care pay and ↓specialty care pay– PAMA 2014 clinical lab reimbursement reductions
•30% 2017-2019 (10%/yr); 45% 2020-2022 (15%/yr)
© 2014 Henry Ford Health System, Pathology and Laboratory MedicineASP 2014Slide 6
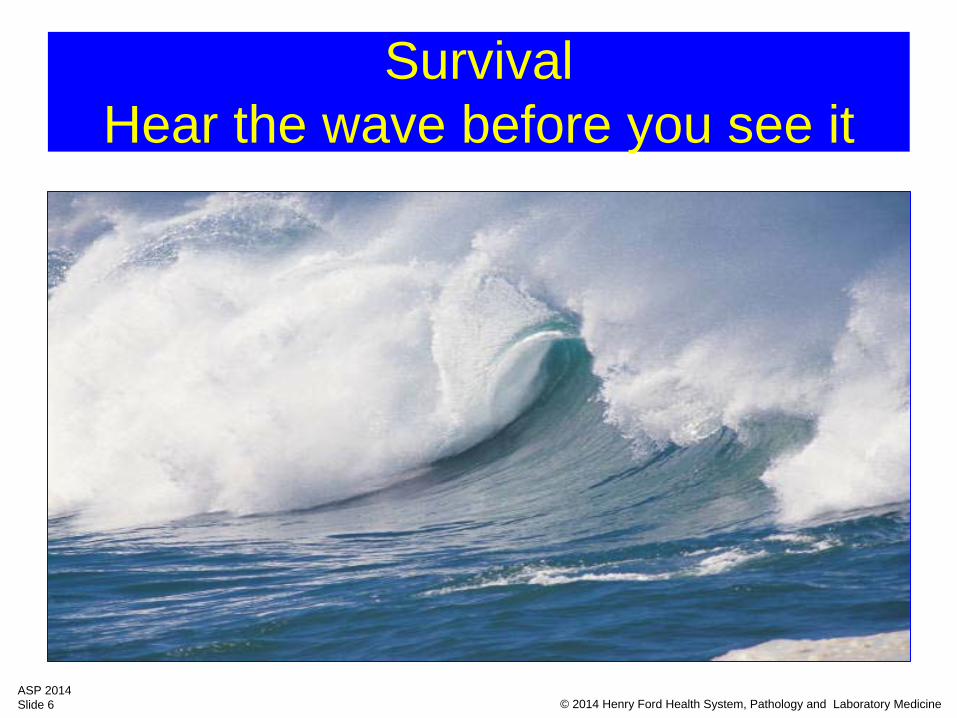
Survival Hear the wave before you see it
© 2014 Henry Ford Health System, Pathology and Laboratory MedicineASP 2014Slide 7
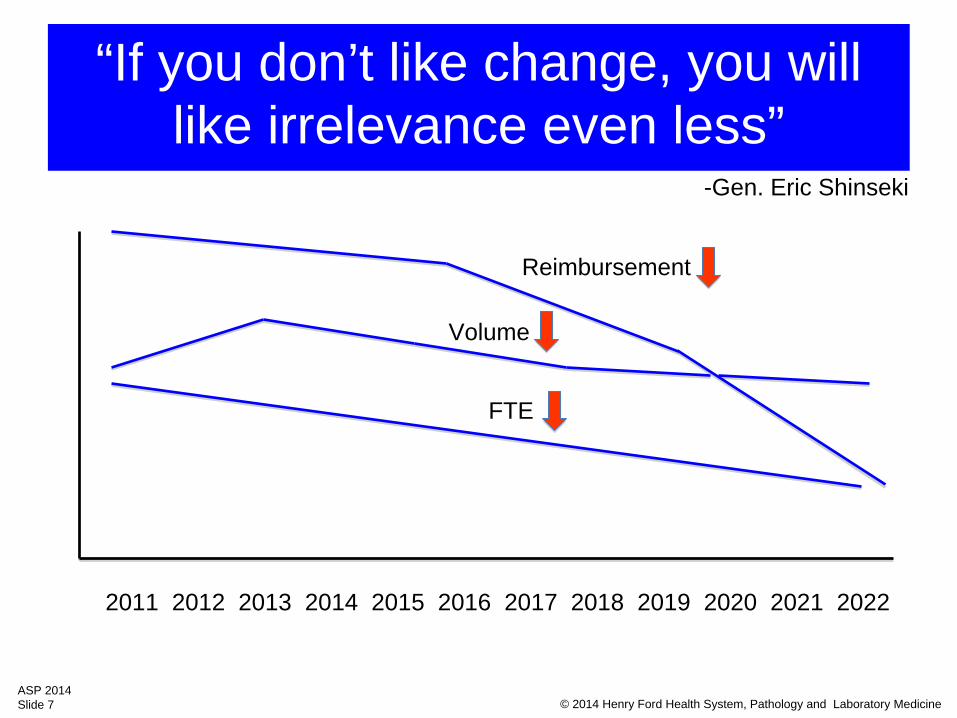
Volume
FTE
“If you don’t like change, you will like irrelevance even less”
2011 2012 2013 2014 2015 2016 2017 2018 2019 2020 2021 2022
Reimbursement
-Gen. Eric Shinseki
© 2014 Henry Ford Health System, Pathology and Laboratory MedicineASP 2014Slide 8
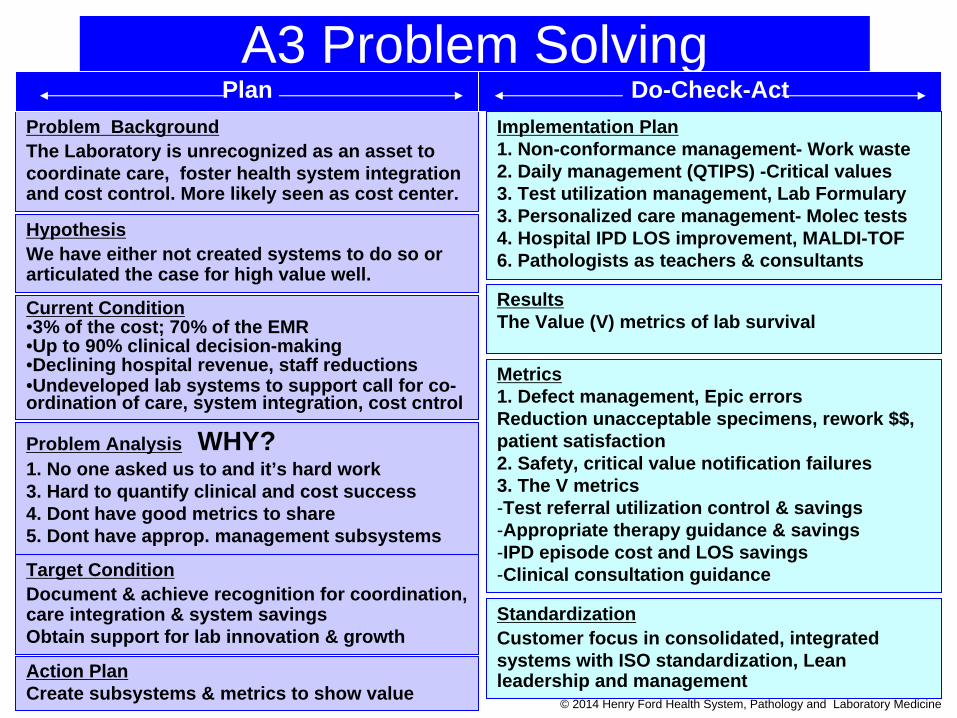
Problem BackgroundThe Laboratory is unrecognized as an asset to coordinate care, foster health system integration and cost control. More likely seen as cost center.
Current Condition•3% of the cost; 70% of the EMR•Up to 90% clinical decision-making•Declining hospital revenue, staff reductions•Undeveloped lab systems to support call for co- ordination of care, system integration, cost cntrol
Problem Analysis WHY?1. No one asked us to and it’s hard work3. Hard to quantify clinical and cost success4. Dont have good metrics to share5. Dont have approp. management subsystems
Target ConditionDocument & achieve recognition for coordination, care integration & system savingsObtain support for lab innovation & growth
ResultsThe Value (V) metrics of lab survival
Action PlanCreate subsystems & metrics to show value
Metrics 1. Defect management, Epic errorsReduction unacceptable specimens, rework $$,patient satisfaction2. Safety, critical value notification failures 3. The V metrics-Test referral utilization control & savings-Appropriate therapy guidance & savings -IPD episode cost and LOS savings -Clinical consultation guidance
A3 Problem SolvingPlan Do-Check-Act
Implementation Plan1. Non-conformance management- Work waste2. Daily management (QTIPS) -Critical values3. Test utilization management, Lab Formulary 3. Personalized care management- Molec tests4. Hospital IPD LOS improvement, MALDI-TOF6. Pathologists as teachers & consultants
HypothesisWe have either not created systems to do so or articulated the case for high value well.
StandardizationCustomer focus in consolidated, integrated systems with ISO standardization, Lean leadership and management
© 2014 Henry Ford Health System, Pathology and Laboratory MedicineASP 2014Slide 9
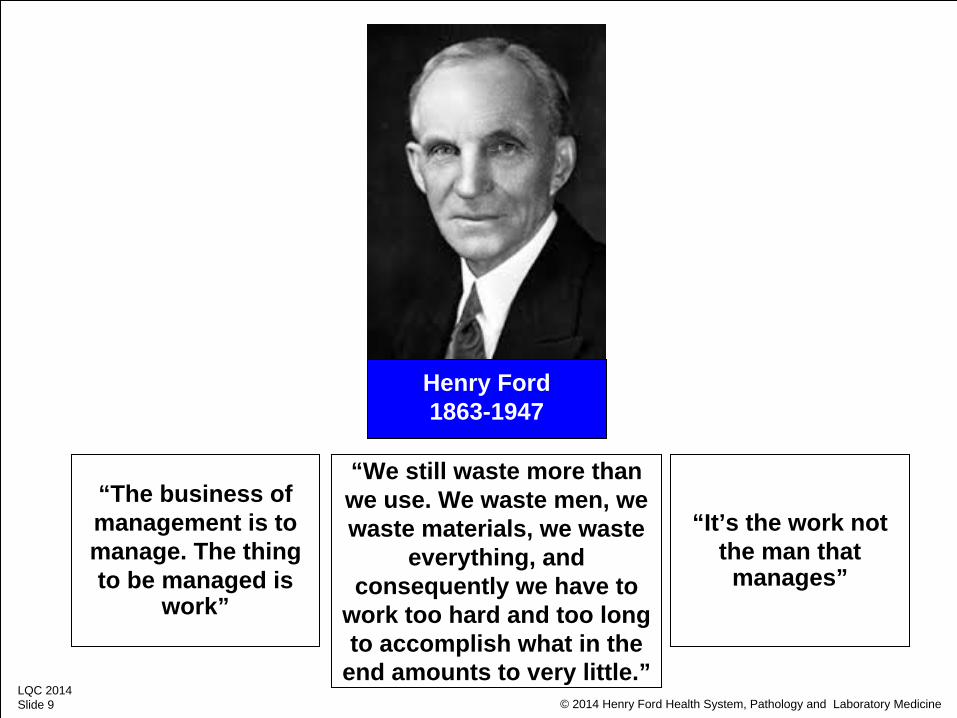
Henry Ford1863-1947Henry Ford1863-1947
“It’s the work not the man that
manages”
“The business of management is to manage. The thing to be managed is
work”
© 2014 Henry Ford Health System, Pathology and Laboratory MedicineLQC 2014Slide 9
“We still waste more than we use. We waste men, we waste materials, we waste
everything, and consequently we have to
work too hard and too long to accomplish what in the
end amounts to very little.”
© 2014 Henry Ford Health System, Pathology and Laboratory MedicineASP 2014Slide 10
The Value (V) KPI Metric
• The currency of healthcare is now $$ rather than time -John Waugh
• Are you still pursuing TAT as your lab’s measure of success?
© 2014 Henry Ford Health System, Pathology and Laboratory MedicineASP 2014Slide 11
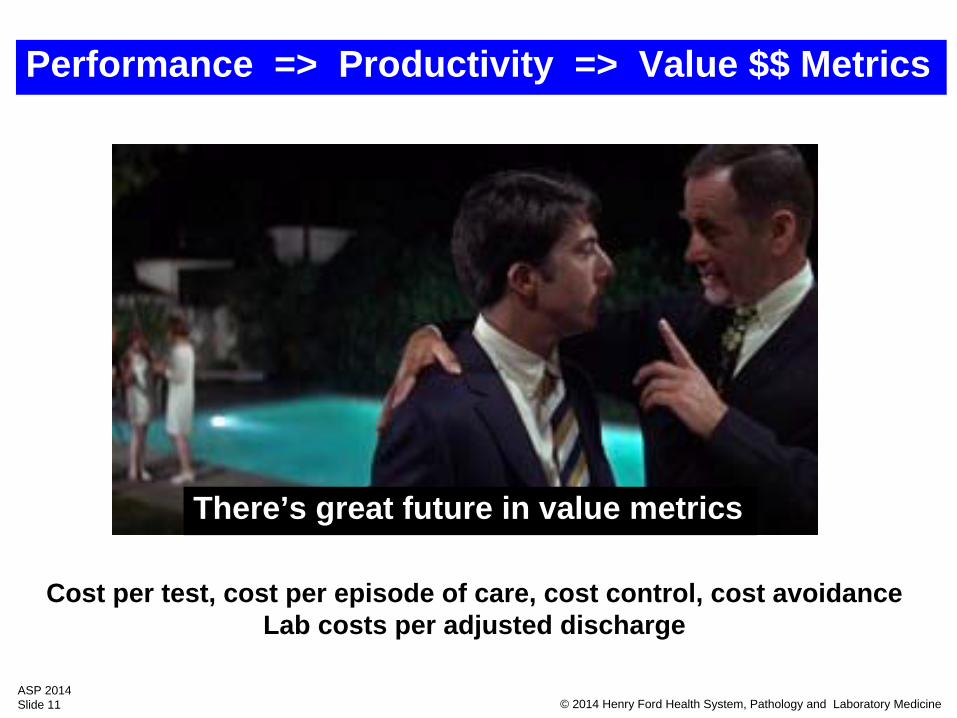
There’s great future in value metrics
Performance => Productivity => Value $$ Metrics
Cost per test, cost per episode of care, cost control, cost avoidanceLab costs per adjusted discharge
© 2014 Henry Ford Health System, Pathology and Laboratory MedicineASP 2014Slide 12
The VALUE Metric
© 2014 Henry Ford Health System, Pathology and Laboratory MedicineASP 2014Slide 13
The VALUE Metric
© 2014 Henry Ford Health System, Pathology and Laboratory MedicineASP 2014Slide 14
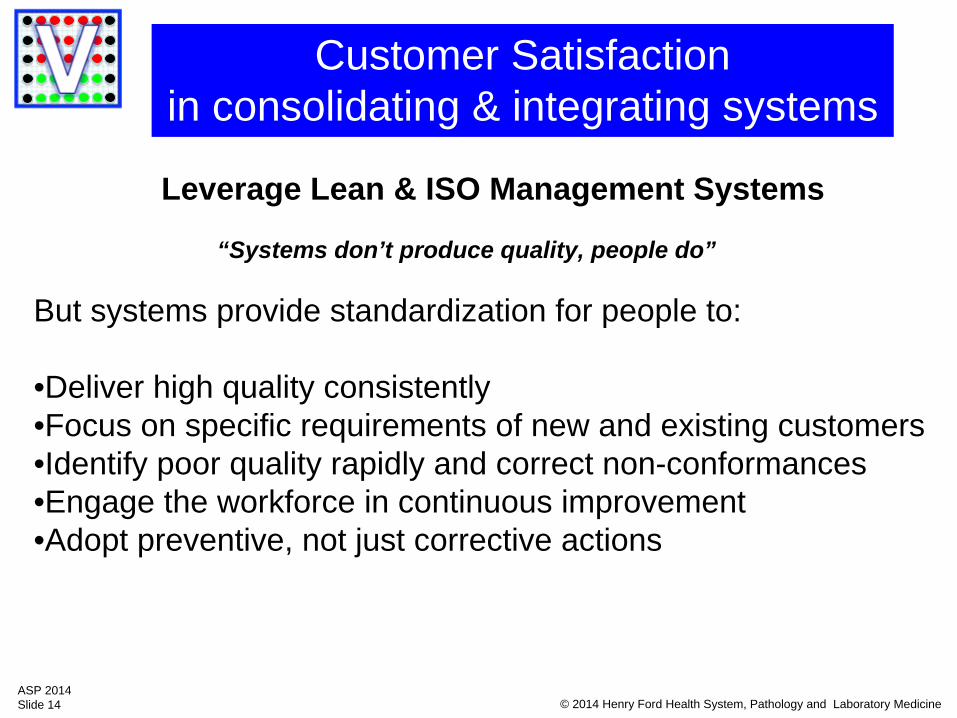
Customer Satisfaction in consolidating & integrating systems
“Systems don’t produce quality, people do”
But systems provide standardization for people to:
•Deliver high quality consistently•Focus on specific requirements of new and existing customers•Identify poor quality rapidly and correct non-conformances•Engage the workforce in continuous improvement•Adopt preventive, not just corrective actions
Leverage Lean & ISO Management Systems
© 2014 Henry Ford Health System, Pathology and Laboratory MedicineASP 2014Slide 15
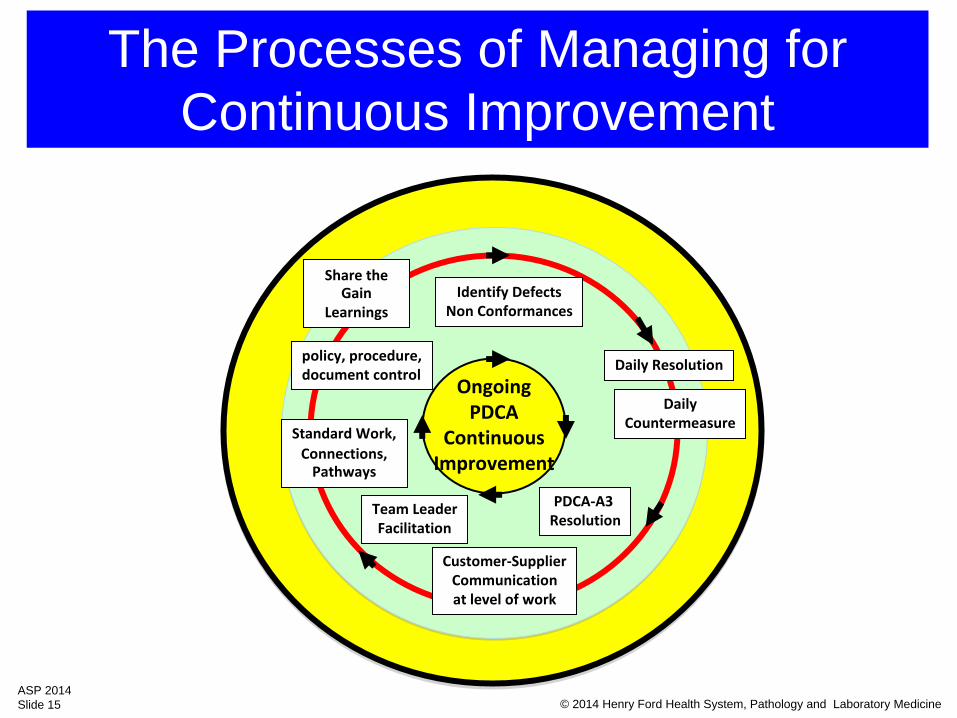
The Processes of Managing for Continuous Improvement
OngoingPDCA
ContinuousImprovement
Daily Resolution
PDCA‐A3 Resolution
Customer‐SupplierCommunicationat level of work
DailyCountermeasure
policy, procedure, document control
Identify DefectsNon Conformances
Team LeaderFacilitation
Standard Work,Connections,
Pathways
Share the
Gain Learnings
© 2014 Henry Ford Health System, Pathology and Laboratory MedicineASP 2014Slide 16
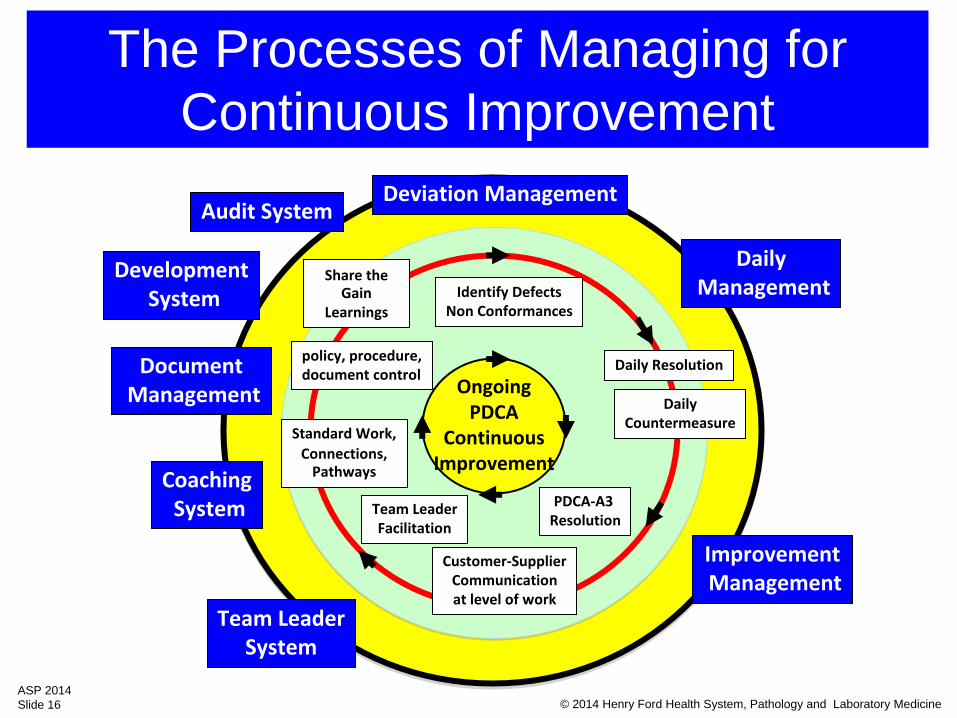
The Processes of Managing for Continuous Improvement
Deviation Management
DailyManagement
DocumentManagement
ImprovementManagement
OngoingPDCA
ContinuousImprovement
Daily Resolution
PDCA‐A3 Resolution
Customer‐SupplierCommunicationat level of work
DailyCountermeasure
policy, procedure, document control
Identify DefectsNon Conformances
Team LeaderFacilitation
Standard Work,Connections,
Pathways
Share the
Gain Learnings
Team LeaderSystem
CoachingSystem
DevelopmentSystem
Audit System
© 2014 Henry Ford Health System, Pathology and Laboratory MedicineASP 2014Slide 17
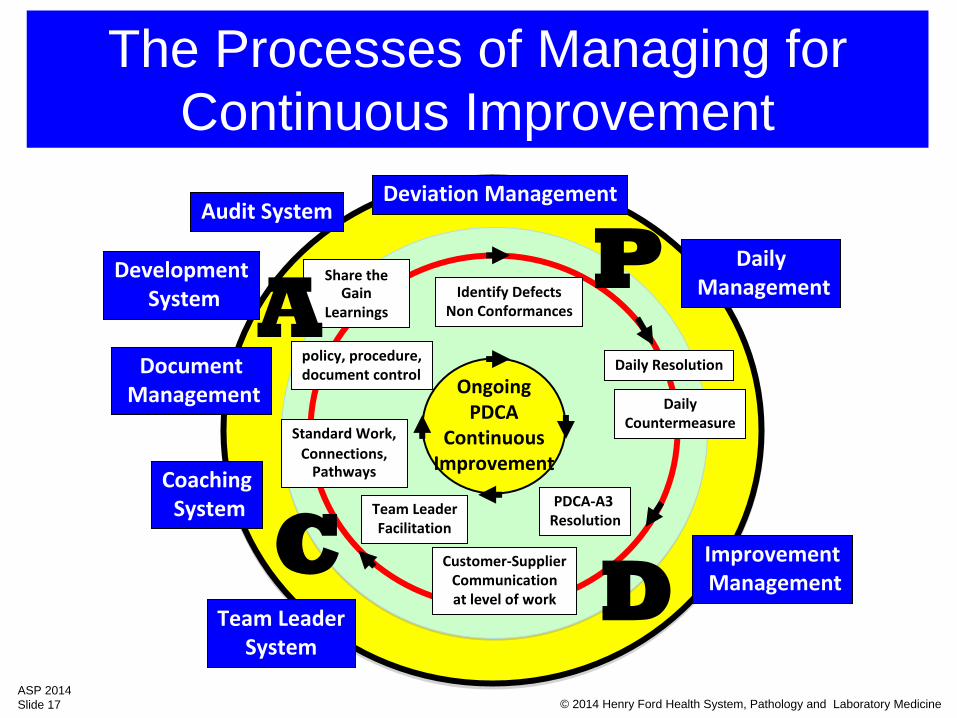
The Processes of Managing for Continuous Improvement
Deviation Management
DailyManagement
DocumentManagement
ImprovementManagement
OngoingPDCA
ContinuousImprovement
Daily Resolution
PDCA‐A3 Resolution
Customer‐SupplierCommunicationat level of work
DailyCountermeasure
policy, procedure, document control
Identify DefectsNon Conformances
Team LeaderFacilitation
Standard Work,Connections,
Pathways
Share the
Gain Learnings
Team LeaderSystem
CoachingSystem
DevelopmentSystem
Audit System
P
DC
A
© 2014 Henry Ford Health System, Pathology and Laboratory MedicineASP 2014Slide 18
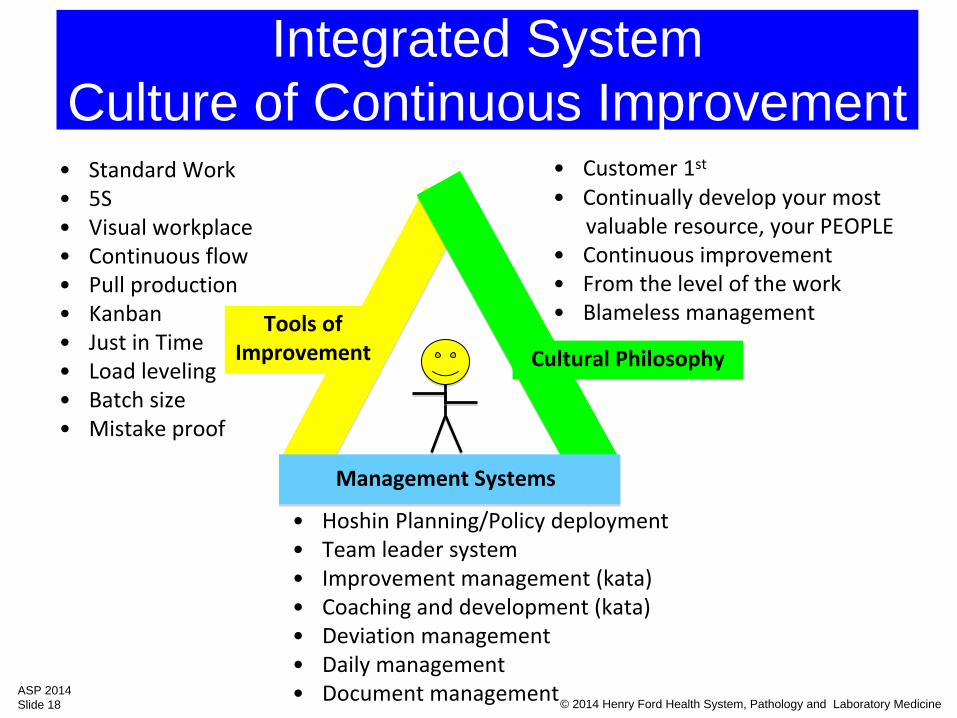
Integrated System Culture of Continuous Improvement
Tools ofImprovement Cultural Philosophy
Management Systems
•
Standard Work•
5S•
Visual workplace•
Continuous flow•
Pull production•
Kanban•
Just in Time•
Load leveling•
Batch size•
Mistake proof
•
Customer 1st
•
Continually develop your most valuable resource, your PEOPLE
•
Continuous improvement •
From the level of the work•
Blameless management
•
Hoshin
Planning/Policy deployment •
Team leader system•
Improvement management (kata)•
Coaching and development (kata)•
Deviation management•
Daily management•
Document management
© 2014 Henry Ford Health System, Pathology and Laboratory MedicineASP 2014Slide 19
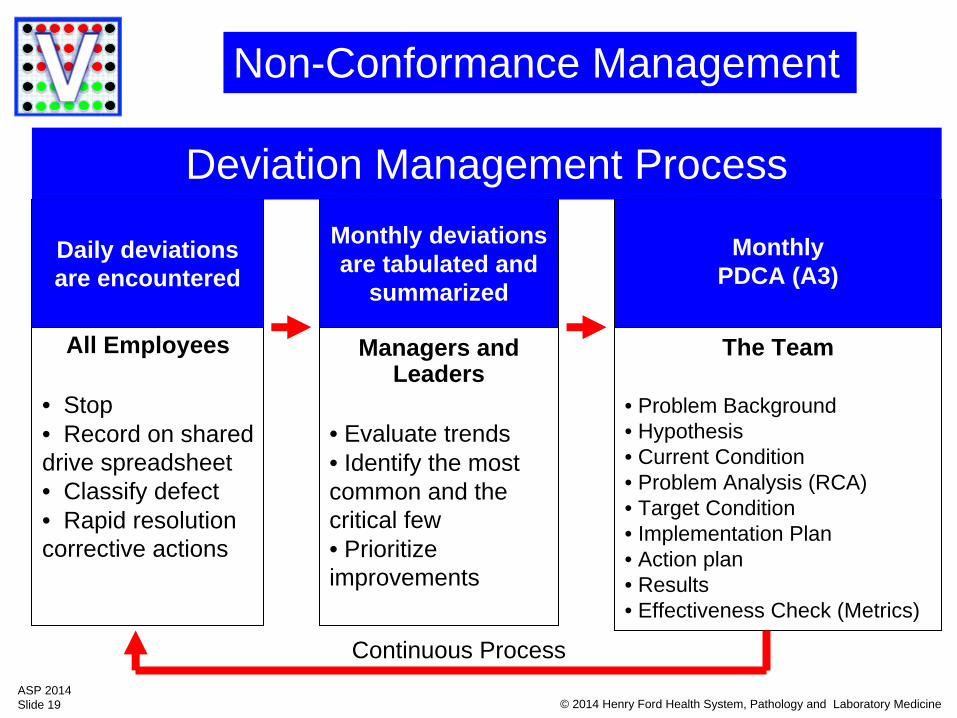
Deviation Management Process
Daily deviations are encountered
Monthly deviations are tabulated and
summarized
MonthlyPDCA (A3)
The Team
• Problem Background• Hypothesis • Current Condition• Problem Analysis (RCA)• Target Condition • Implementation Plan • Action plan • Results • Effectiveness Check (Metrics)
All Employees
• Stop• Record on shared drive spreadsheet• Classify defect• Rapid resolution corrective actions
Managers and Leaders
• Evaluate trends• Identify the most common and the critical few• Prioritize improvements
Continuous Process
Non-Conformance Management
© 2014 Henry Ford Health System, Pathology and Laboratory MedicineASP 2014Slide 20
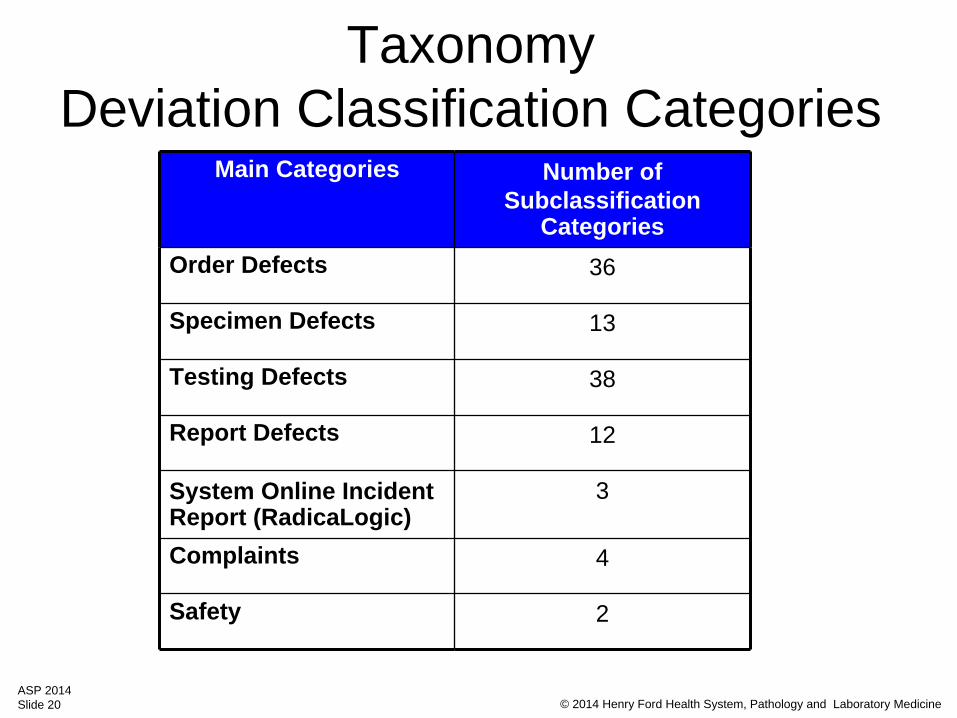
Taxonomy Deviation Classification Categories
Main Categories Number of Subclassification
Categories Order Defects 36
Specimen Defects 13
Testing Defects 38
Report Defects 12
System Online Incident Report (RadicaLogic)
3
Complaints 4
Safety 2
© 2014 Henry Ford Health System, Pathology and Laboratory MedicineASP 2014Slide 21
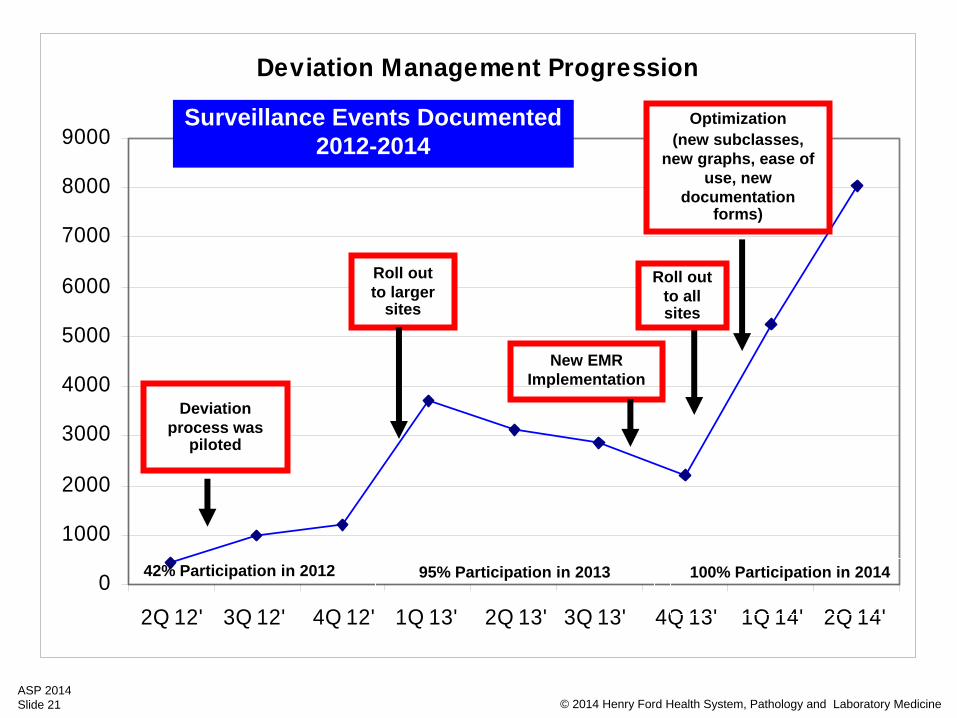
Deviation Management Progression
0
1000
2000
3000
4000
5000
6000
7000
8000
9000
2Q 12' 3Q 12' 4Q 12' 1Q 13' 2Q 13' 3Q 13' 4Q 13' 1Q 14' 2Q 14'
42% Participation in 2012 95% Participation in 2013 100% Participation in 2014
New EMR Implementation
Roll out to larger
sites
Optimization (new subclasses,
new graphs, ease of use, new
documentation forms)
Roll out to all sites
Deviation process was
piloted
Surveillance Events Documented2012-2014
© 2014 Henry Ford Health System, Pathology and Laboratory MedicineASP 2014Slide 22
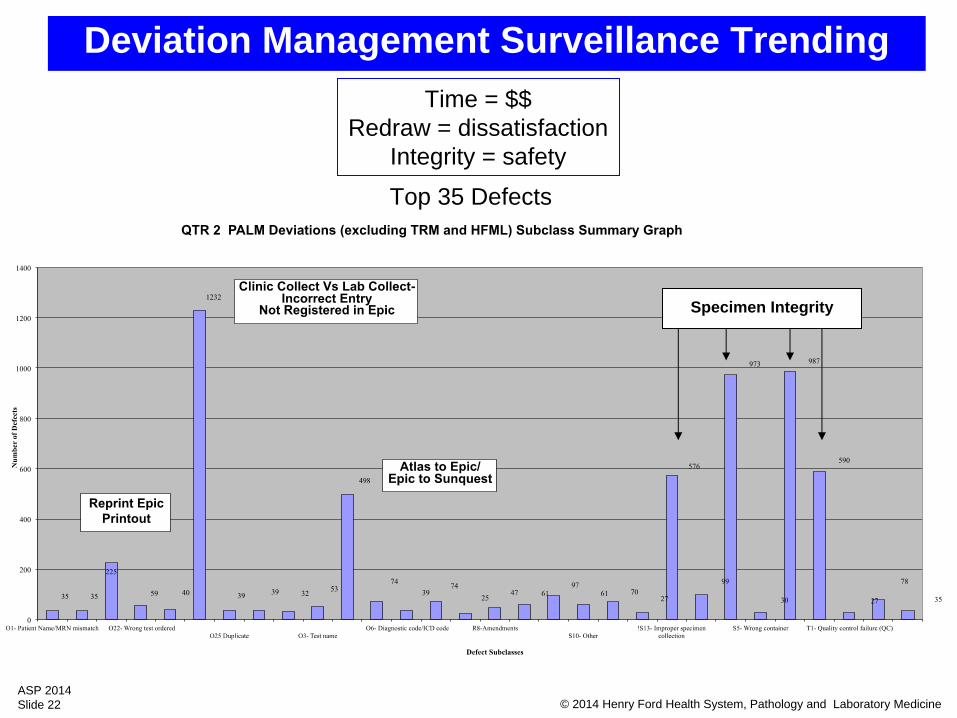
Top 35 Defects
Specimen Integrity
Deviation Management Surveillance TrendingTime = $$
Redraw = dissatisfactionIntegrity = safety
© 2014 Henry Ford Health System, Pathology and Laboratory MedicineASP 2014Slide 23
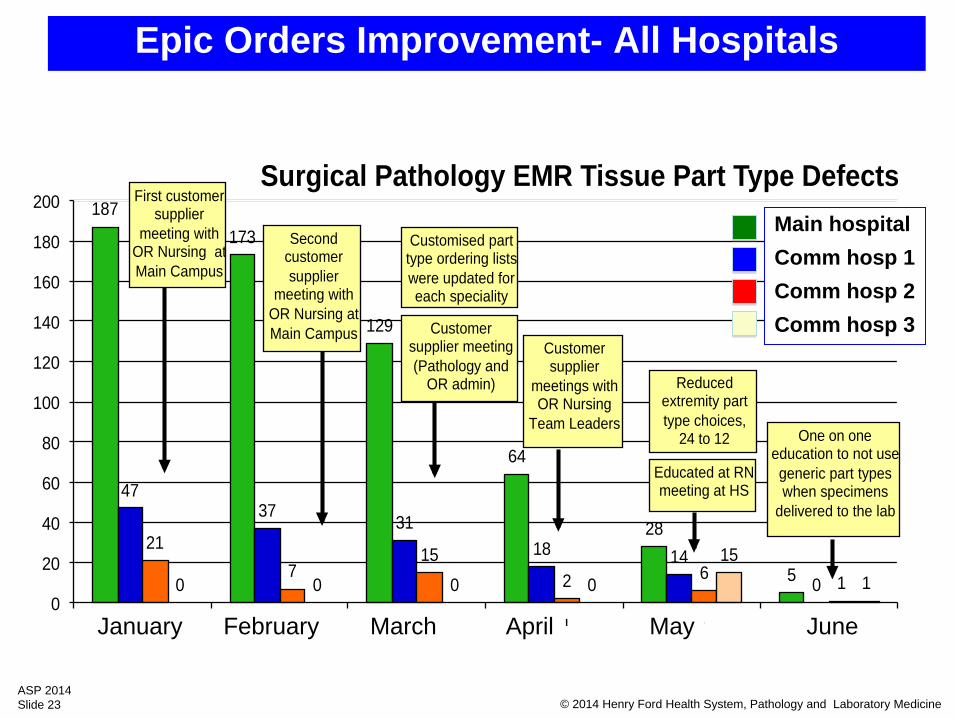
187 173
129
64
28
5
47 37 31
18 14 0
21 7
15 2 6 1 0 0 0 0
15 1
0
20
40
60
80
100
120
140
160
180
200
Jan Feb Mar April May June
Surgical Pathology EMR Tissue Part Type Defects
Customer supplier
meetings with OR Nursing
Team Leaders
Educated at RN meeting at HS
One on one education to not use generic part types when specimens
delivered to the lab
Reduced extremity part type choices,
24 to 12
Customised part type ordering lists were updated for each speciality
First customer supplier
meeting with OR Nursing at Main Campus
Second customer supplier
meeting with OR Nursing at Main Campus Customer
supplier meeting (Pathology and
OR admin)
Epic Orders Improvement- All Hospitals
Main hospitalComm hosp 1Comm hosp 2Comm hosp 3
January February March April May June
© 2014 Henry Ford Health System, Pathology and Laboratory MedicineASP 2014Slide 24
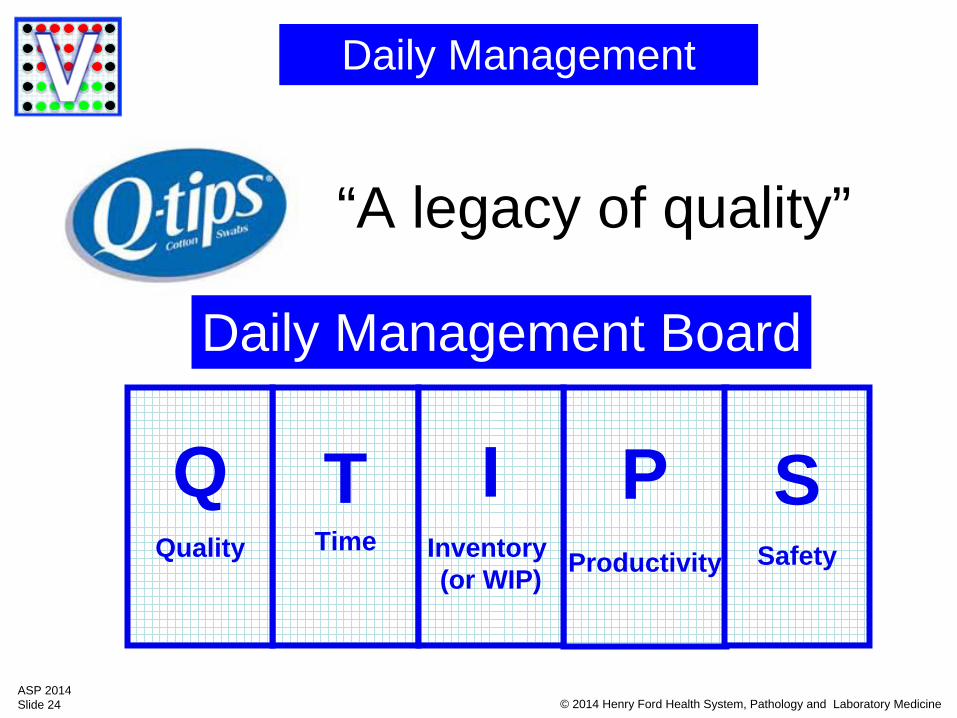
“A legacy of quality”
PProductivity
TTime
QQuality
IInventory (or WIP)
SSafety
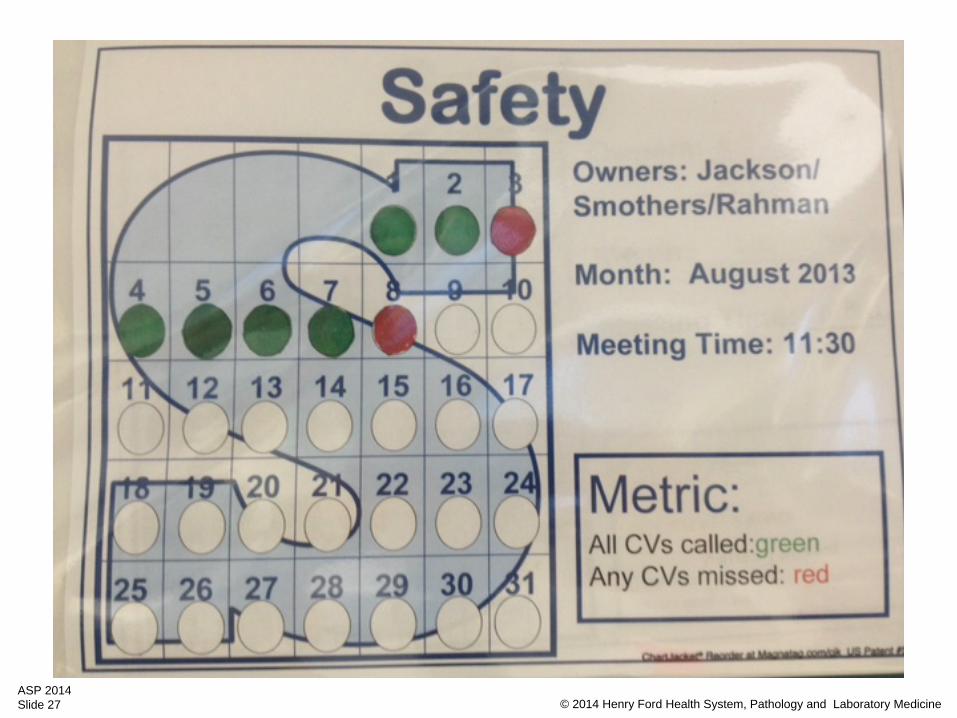
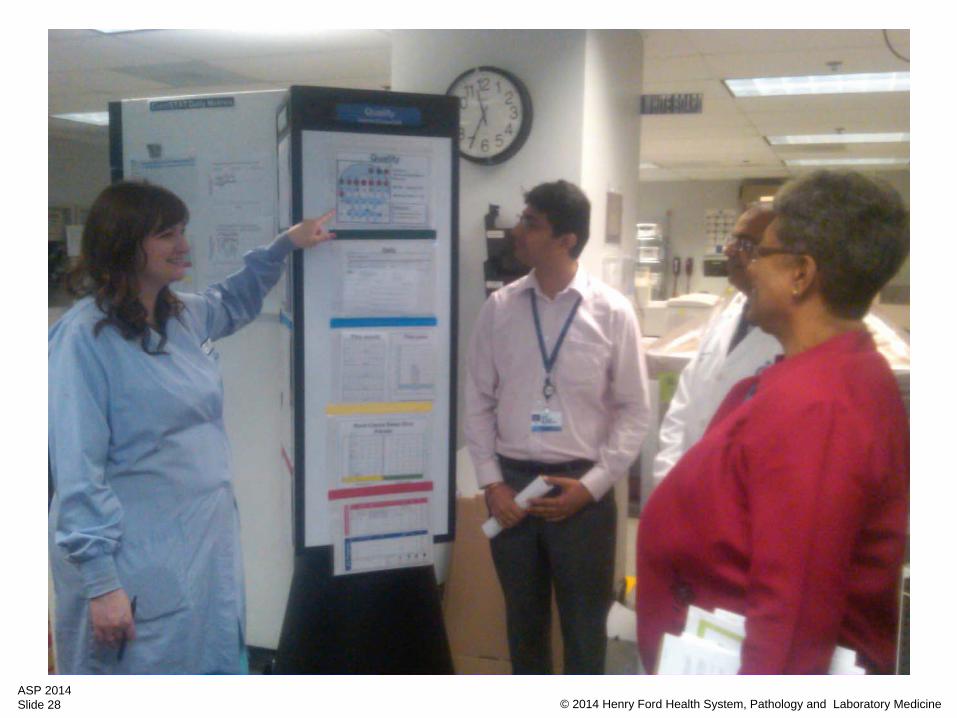
Daily Management Board
Daily Management
© 2014 Henry Ford Health System, Pathology and Laboratory MedicineASP 2014Slide 25
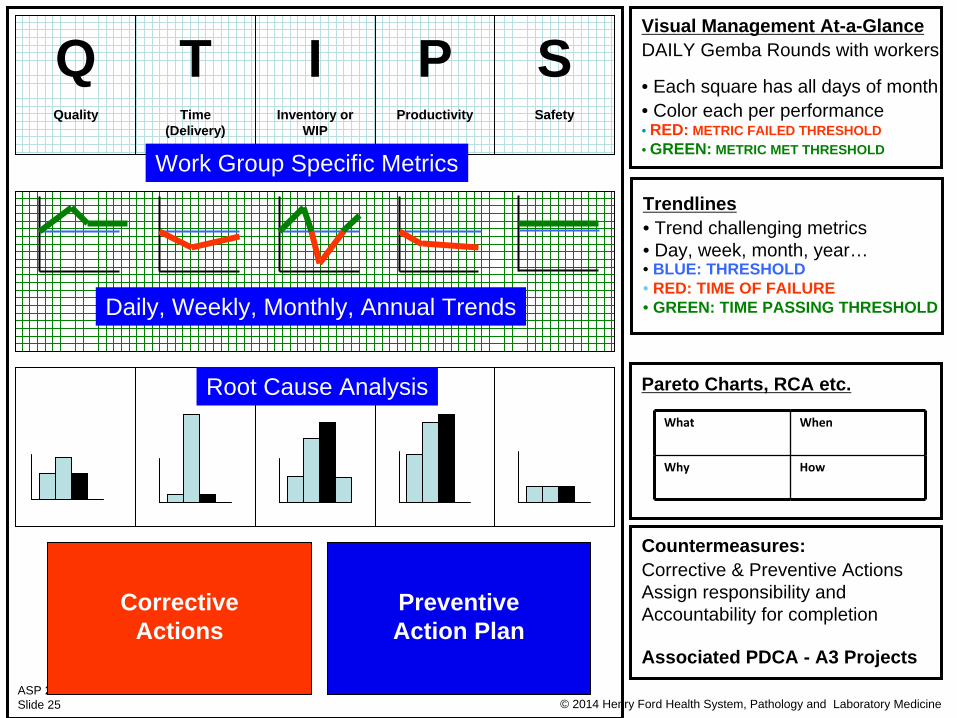
TTime
(Delivery)
QQuality
Visual Management At-a-GlanceDAILY Gemba Rounds with workers
• Each square has all days of month • Color each per performance• RED: METRIC FAILED THRESHOLD• GREEN: METRIC MET THRESHOLD
Trendlines• Trend challenging metrics• Day, week, month, year…• BLUE: THRESHOLD• RED: TIME OF FAILURE• GREEN: TIME PASSING THRESHOLD
Pareto Charts, RCA etc.
Countermeasures:Corrective & Preventive ActionsAssign responsibility andAccountability for completion
Associated PDCA - A3 Projects
What When
Why How
IInventory or
WIP
PProductivity
SSafety
Daily, Weekly, Monthly, Annual Trends
Work Group Specific Metrics
Root Cause Analysis
CorrectiveActions
PreventiveAction Plan
© 2014 Henry Ford Health System, Pathology and Laboratory MedicineASP 2014Slide 26
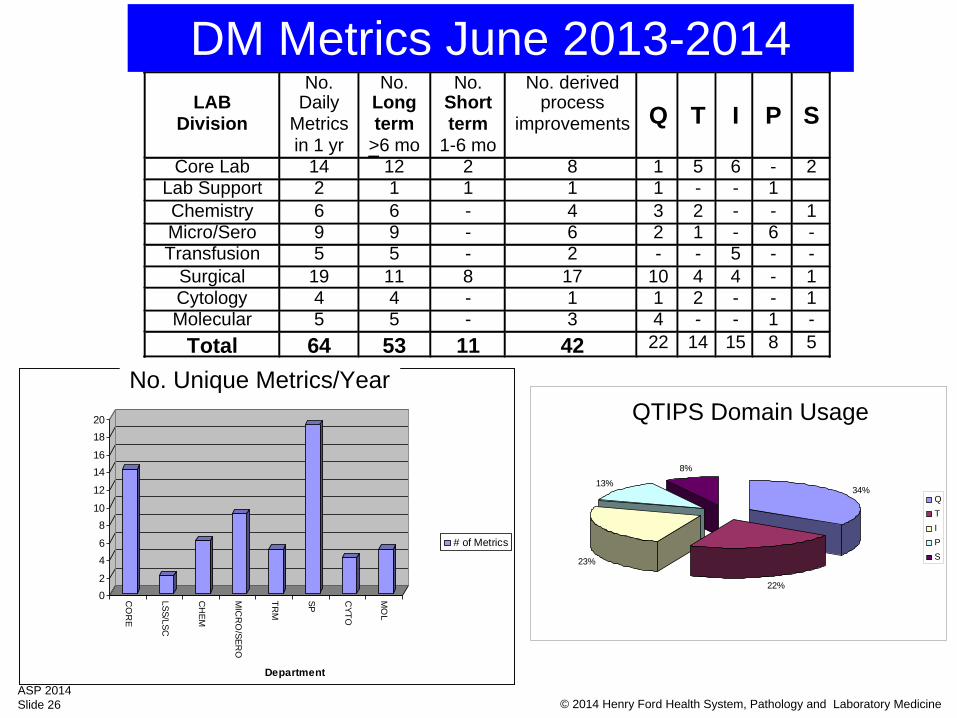
"QTIPS" Domian Usage
34%
22%
23%
13%
8%
QTIPS
LAB
Division
No. Daily
Metrics in 1 yr
No. Long term
>6 mo
No.Short term
1-6 mo
No. derivedprocess
improvements
Q
T
I
P
S
Core Lab 14 12 2 8 1 5 6 - 2Lab Support 2 1 1 1 1 - - 1Chemistry 6 6 - 4 3 2 - - 1Micro/Sero 9 9 - 6 2 1 - 6 -Transfusion 5 5 - 2 - - 5 - -
Surgical 19 11 8 17 10 4 4 - 1Cytology 4 4 - 1 1 2 - - 1Molecular 5 5 - 3 4 - - 1 -
Total 64 53 11 42 22 14 15 8 5
02
46
810
12
1416
1820
CO
RE
LSS/LSC
CH
EM
MIC
RO
/SERO
TRM
SP CYTO
MO
L
Department
# of Metrics
# of Metrics
DM Metrics June 2013-2014
QTIPS Domain UsageNo. Unique Metrics/Year
© 2014 Henry Ford Health System, Pathology and Laboratory MedicineASP 2014Slide 27
© 2014 Henry Ford Health System, Pathology and Laboratory MedicineASP 2014Slide 28
© 2014 Henry Ford Health System, Pathology and Laboratory MedicineASP 2014Slide 29
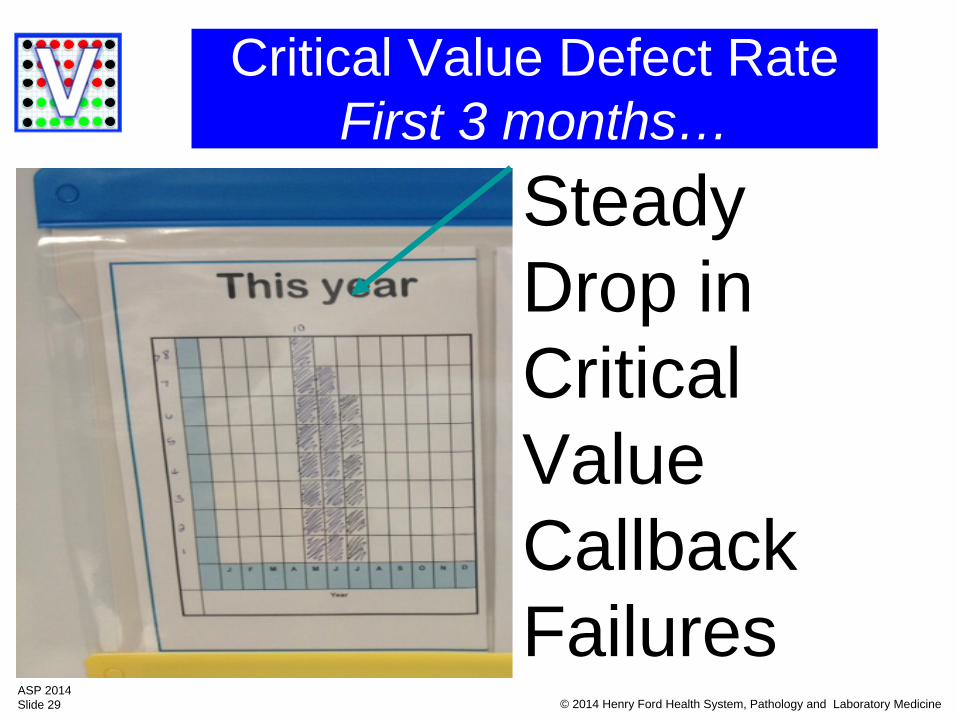
SteadyDrop inCriticalValueCallbackFailures
Critical Value Defect RateFirst 3 months…
© 2014 Henry Ford Health System, Pathology and Laboratory MedicineASP 2014Slide 30
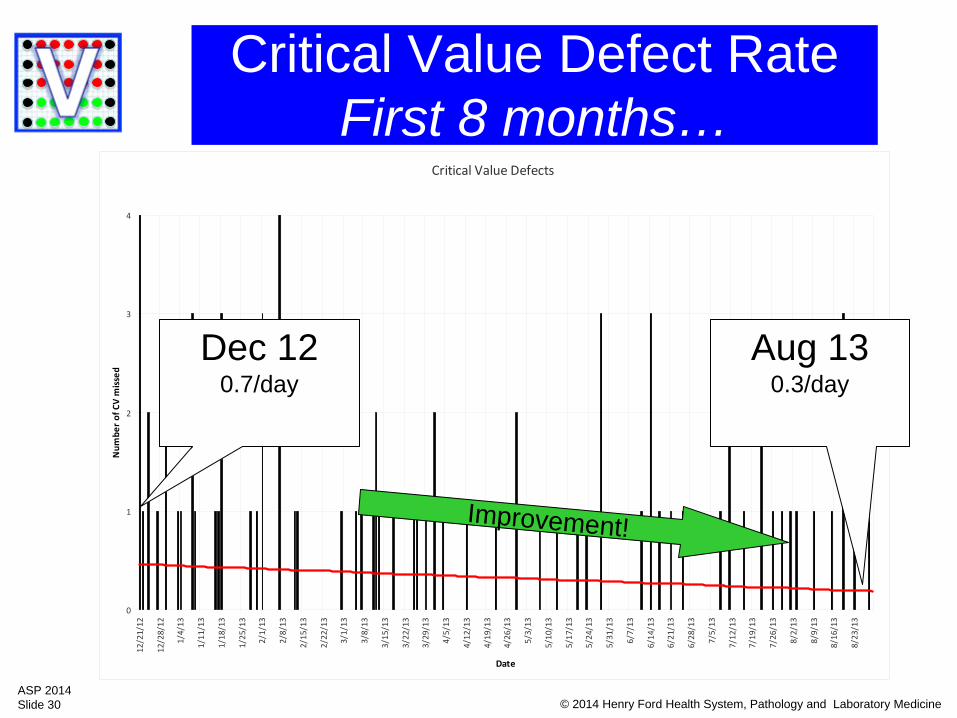
Critical Value Defect Rate First 8 months…
Critical Value Defects
0
1
2
3
4
12/21/12
12/28/12
1/4/13
1/11/13
1/18/13
1/25/13
2/1/13
2/8/13
2/15/13
2/22/13
3/1/13
3/8/13
3/15/13
3/22/13
3/29/13
4/5/13
4/12/13
4/19/13
4/26/13
5/3/13
5/10/13
5/17/13
5/24/13
5/31/13
6/7/13
6/14/13
6/21/13
6/28/13
7/5/13
7/12/13
7/19/13
7/26/13
8/2/13
8/9/13
8/16/13
8/23/13
Date
Num
ber of CV m
issed
Dec 120.7/day
Aug 130.3/day
Improvement!
© 2014 Henry Ford Health System, Pathology and Laboratory MedicineASP 2014Slide 31
Num
ber o
f crit
ical
val
ue d
efec
ts/m
onth
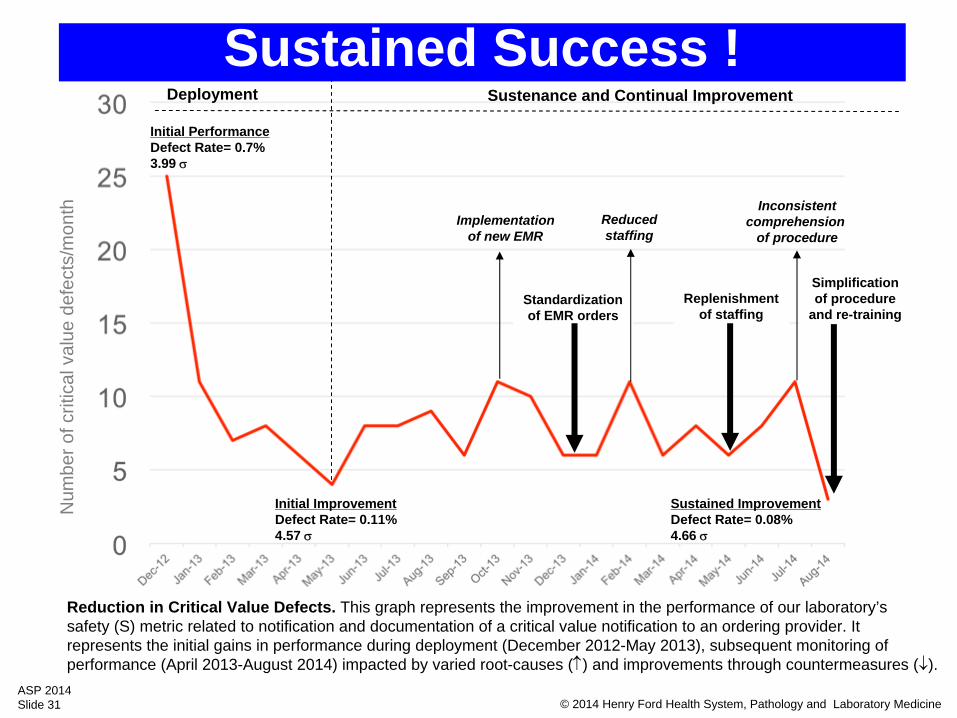
Initial PerformanceDefect Rate= 0.7%3.99
Sustained ImprovementDefect Rate= 0.08%4.66
Deployment
Implementationof new EMR
Standardizationof EMR orders
Reducedstaffing
Replenishmentof staffing
Inconsistentcomprehension
of procedure
Simplificationof procedure
and re-training
Sustenance and Continual Improvement
Reduction in Critical Value Defects. This graph represents the improvement in the performance of our laboratory’s safety (S) metric related to notification and documentation of a critical value notification to an ordering provider. It represents the initial gains in performance during deployment (December 2012-May 2013), subsequent monitoring of performance (April 2013-August 2014) impacted by varied root-causes () and improvements through countermeasures ().
Initial ImprovementDefect Rate= 0.11%4.57
Sustained Success !
© 2014 Henry Ford Health System, Pathology and Laboratory MedicineASP 2014Slide 32
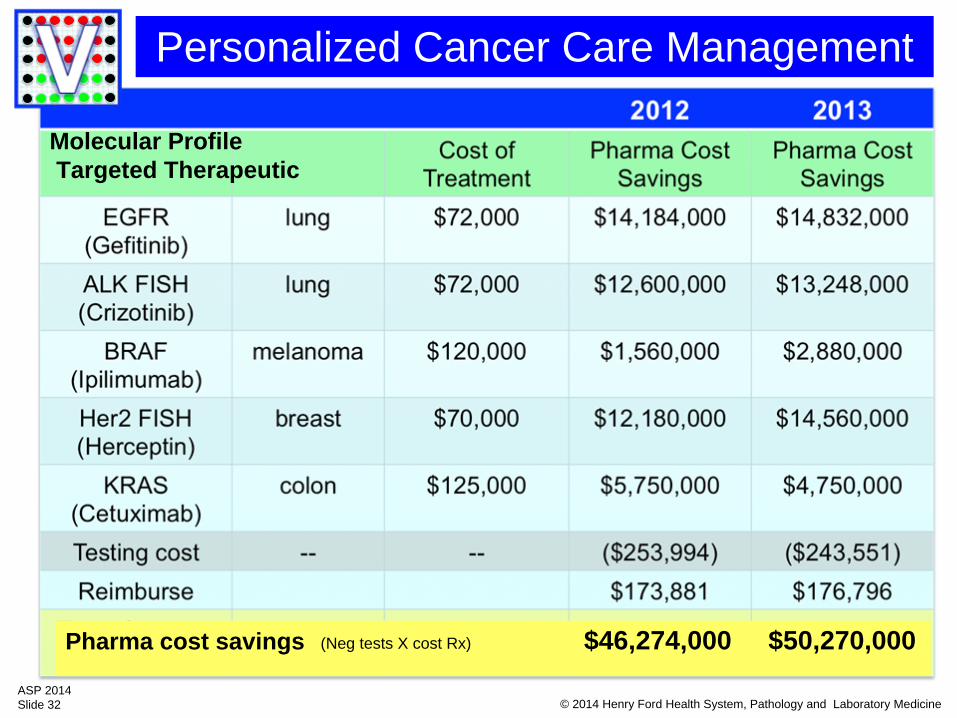
Personalized Cancer Care Management
Molecular ProfileTargeted Therapeutic
Pharma cost savings $46,274,000 $50,270,000(Neg tests X cost Rx)
© 2014 Henry Ford Health System, Pathology and Laboratory MedicineASP 2014Slide 33
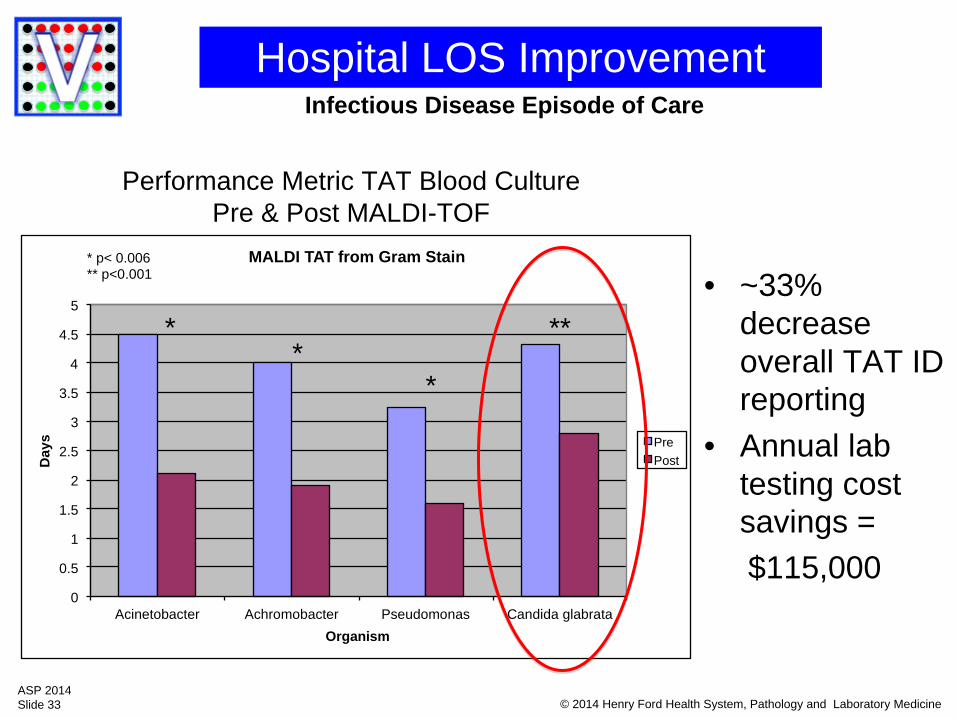
Hospital LOS Improvement
0
0.5
1
1.5
2
2.5
3
3.5
4
4.5
5
Acinetobacter Achromobacter Pseudomonas Candida glabrata
Day
s
Organism
MALDI TAT from Gram Stain
Pre Post
* *
*
**
* p< 0.006 ** p<0.001
Performance Metric TAT Blood Culture Pre & Post MALDI-TOF
• ~33% decrease overall TAT ID reporting
• Annual lab testing cost savings =$115,000
Infectious Disease Episode of Care
© 2014 Henry Ford Health System, Pathology and Laboratory MedicineASP 2014Slide 34
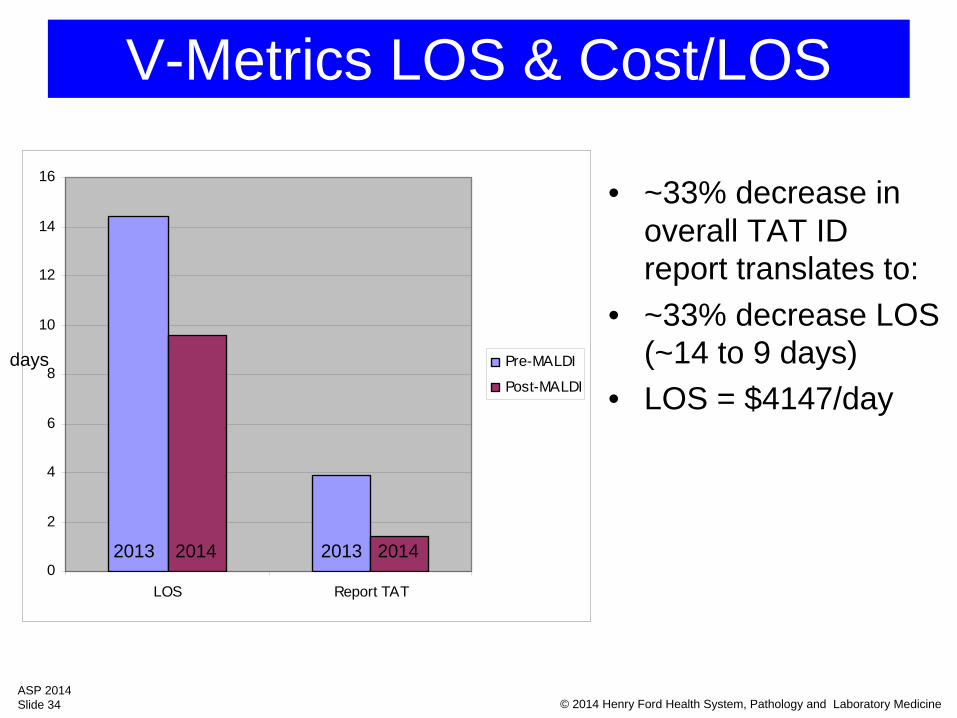
V-Metrics LOS & Cost/LOS
0
2
4
6
8
10
12
14
16
LOS Report TAT
Pre-MALDI
Post-MALDI
• ~33% decrease in overall TAT ID report translates to:
• ~33% decrease LOS (~14 to 9 days)
• LOS = $4147/day
2013 2014 2013 2014
days
© 2014 Henry Ford Health System, Pathology and Laboratory MedicineASP 2014Slide 35
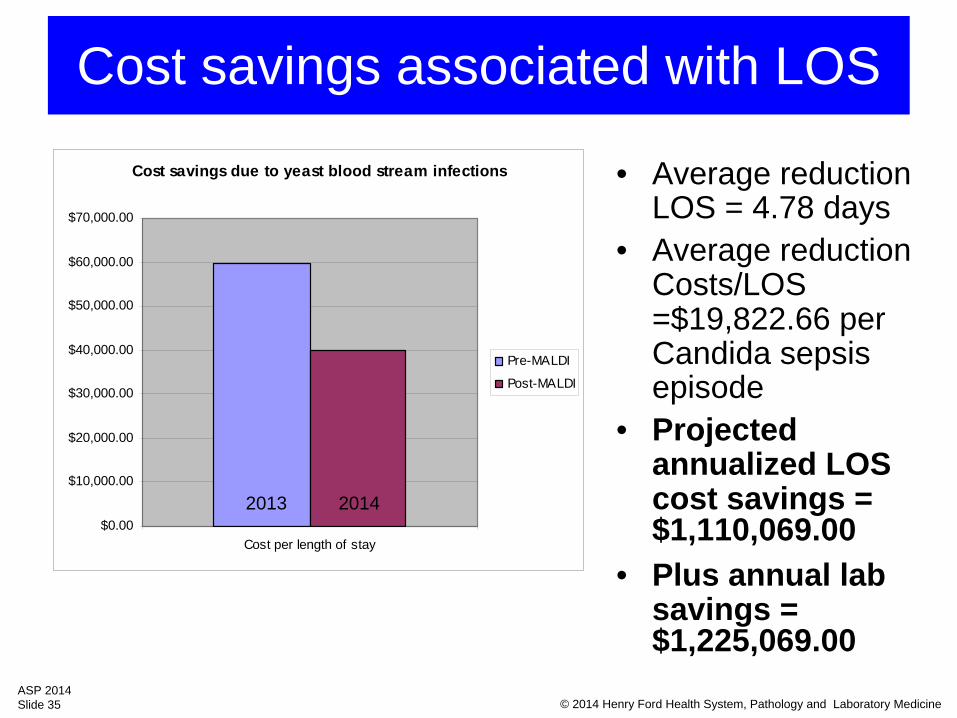
Cost savings associated with LOS
• Average reduction LOS = 4.78 days
• Average reduction Costs/LOS =$19,822.66 per Candida sepsis episode
• Projected annualized LOS cost savings = $1,110,069.00
• Plus annual lab savings = $1,225,069.00
Cost savings due to yeast blood stream infections
$0.00
$10,000.00
$20,000.00
$30,000.00
$40,000.00
$50,000.00
$60,000.00
$70,000.00
Cost per length of stay
Pre-MALDI
Post-MALDI
2013 2014
© 2014 Henry Ford Health System, Pathology and Laboratory MedicineASP 2014Slide 36
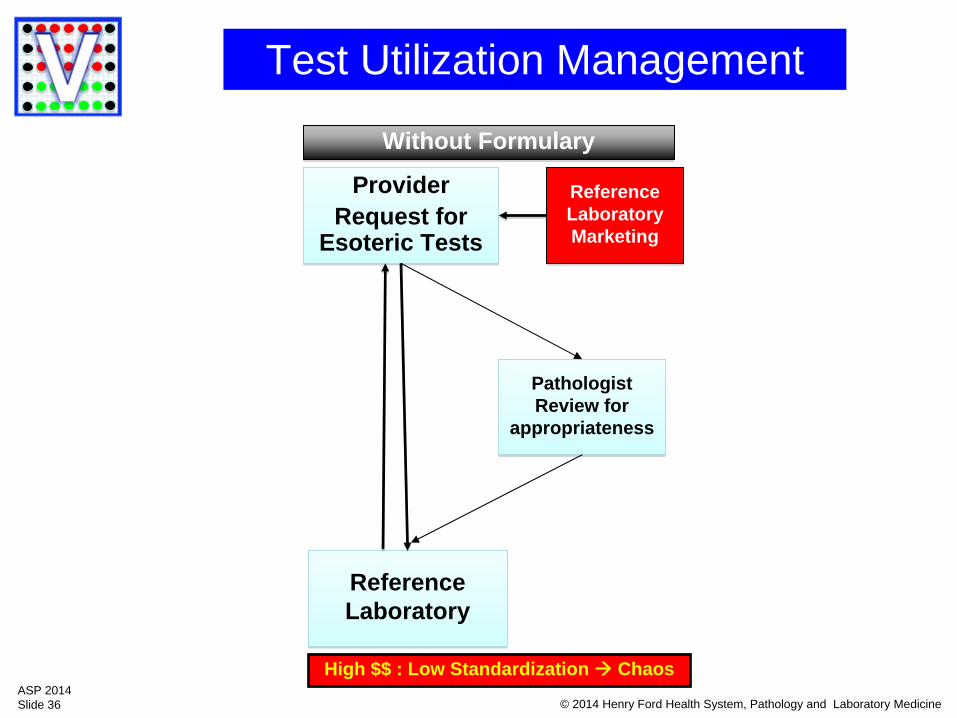
Test Utilization Management
ProviderRequest for
Esoteric Tests
ProviderRequest for
Esoteric Tests
PathologistReview for
appropriateness
PathologistReview for
appropriateness
ReferenceLaboratoryReferenceLaboratory
ReferenceLaboratoryMarketing
ReferenceLaboratoryMarketing
Without FormularyWithout Formulary
High $$ : Low Standardization Chaos
© 2014 Henry Ford Health System, Pathology and Laboratory MedicineASP 2014Slide 37
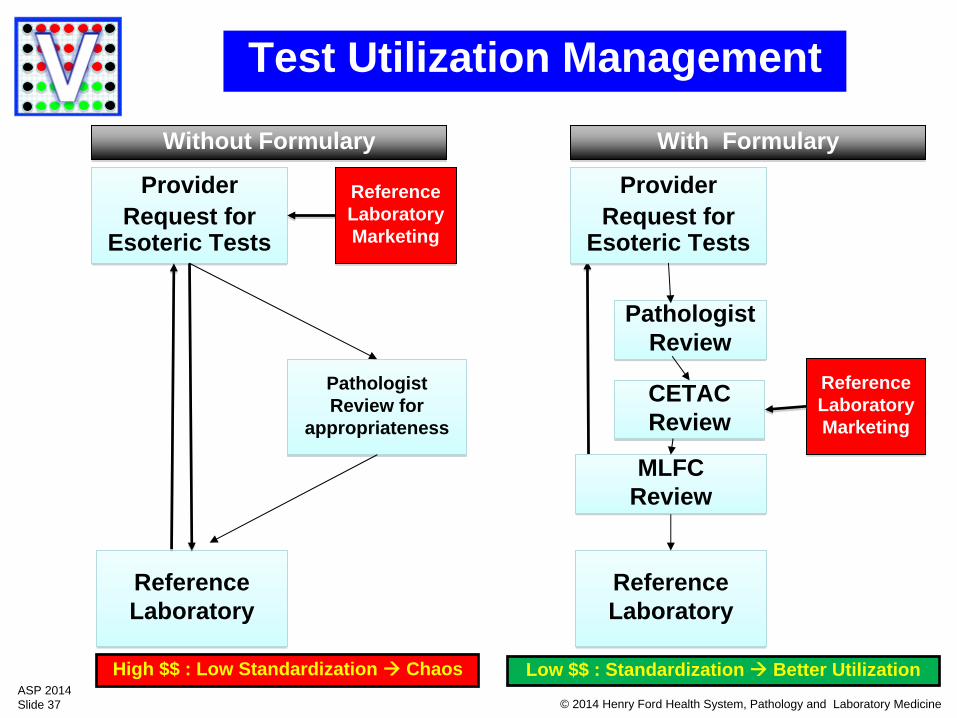
Test Utilization Management
ProviderRequest for
Esoteric Tests
ProviderRequest for
Esoteric Tests
PathologistReview for
appropriateness
PathologistReview for
appropriateness
ReferenceLaboratoryReferenceLaboratory
ReferenceLaboratoryMarketing
ReferenceLaboratoryMarketing
ProviderRequest for
Esoteric Tests
ProviderRequest for
Esoteric Tests
PathologistReview
PathologistReview
ReferenceLaboratoryReferenceLaboratory
ReferenceLaboratoryMarketing
ReferenceLaboratoryMarketing
CETACReviewCETACReview
MLFCReviewMLFC
Review
Without FormularyWithout Formulary With FormularyWith Formulary
High $$ : Low Standardization Chaos Low $$ : Standardization Better Utilization
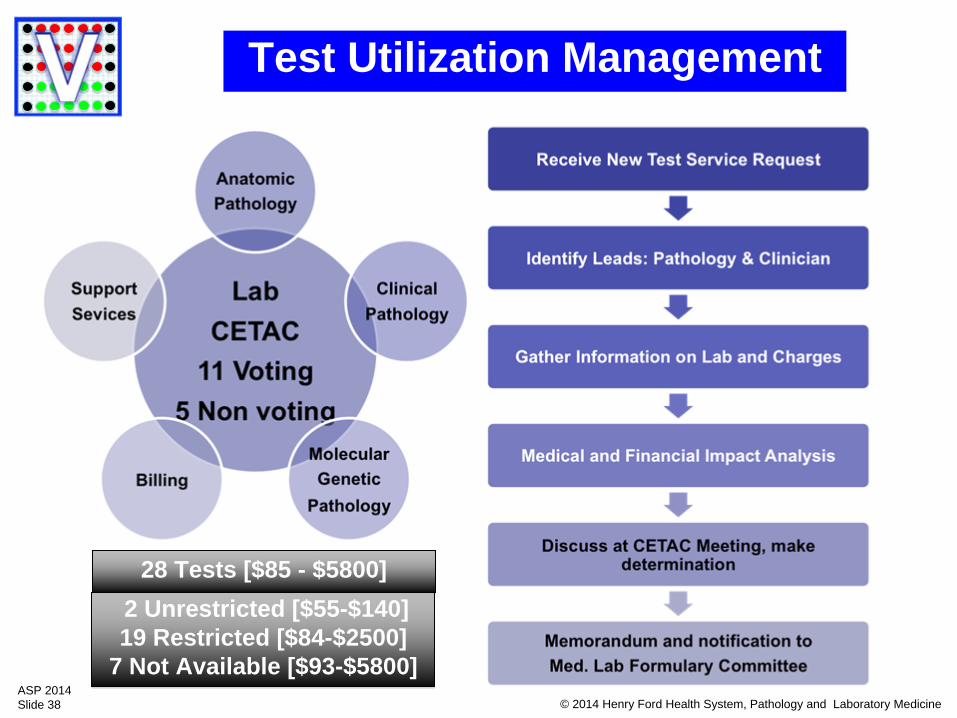
© 2014 Henry Ford Health System, Pathology and Laboratory MedicineASP 2014Slide 38
Test Utilization Management
28 Tests [$85 - $5800]28 Tests [$85 - $5800]
2 Unrestricted [$55-$140]19 Restricted [$84-$2500]
7 Not Available [$93-$5800]
2 Unrestricted [$55-$140]19 Restricted [$84-$2500]
7 Not Available [$93-$5800]
© 2014 Henry Ford Health System, Pathology and Laboratory MedicineASP 2014Slide 39
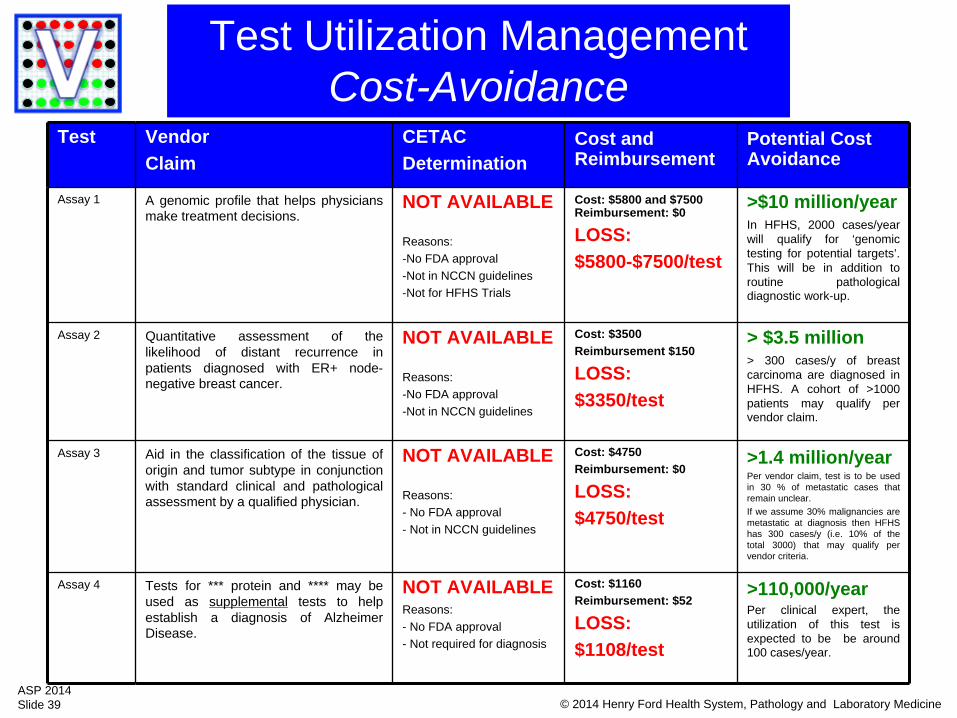
Test Vendor Claim
CETACDetermination
Cost and Reimbursement
Potential Cost Avoidance
Assay 1 A genomic profile that helps physicians make treatment decisions.
NOT AVAILABLE
Reasons:-No FDA approval-Not in NCCN guidelines-Not for HFHS Trials
Cost: $5800 and $7500 Reimbursement: $0
LOSS: $5800-$7500/test
>$10 million/yearIn HFHS, 2000 cases/year will qualify for ‘genomic testing for potential targets’. This will be in addition to routine pathological diagnostic work-up.
Assay 2 Quantitative assessment of the likelihood of distant recurrence in patients diagnosed with ER+ node- negative breast cancer.
NOT AVAILABLE
Reasons:-No FDA approval-Not in NCCN guidelines
Cost: $3500 Reimbursement $150
LOSS: $3350/test
> $3.5 million> 300 cases/y of breast carcinoma are diagnosed in HFHS. A cohort of >1000 patients may qualify per vendor claim.
Assay 3 Aid in the classification of the tissue of origin and tumor subtype in conjunction with standard clinical and pathological assessment by a qualified physician.
NOT AVAILABLE
Reasons:- No FDA approval- Not in NCCN guidelines
Cost: $4750Reimbursement: $0
LOSS: $4750/test
>1.4 million/yearPer vendor claim, test is to be used in 30 % of metastatic cases that remain unclear. If we assume 30% malignancies are metastatic at diagnosis then HFHS has 300 cases/y (i.e. 10% of the total 3000) that may qualify per vendor criteria.
Assay 4 Tests for *** protein and **** may be used as supplemental tests to help establish a diagnosis of Alzheime r Disease.
NOT AVAILABLEReasons:- No FDA approval- Not required for diagnosis
Cost: $1160Reimbursement: $52
LOSS: $1108/test
>110,000/yearPer clinical expert, the utilization of this test is expected to be be around 100 cases/year.
Test Utilization ManagementCost-Avoidance
© 2014 Henry Ford Health System, Pathology and Laboratory MedicineASP 2014Slide 40
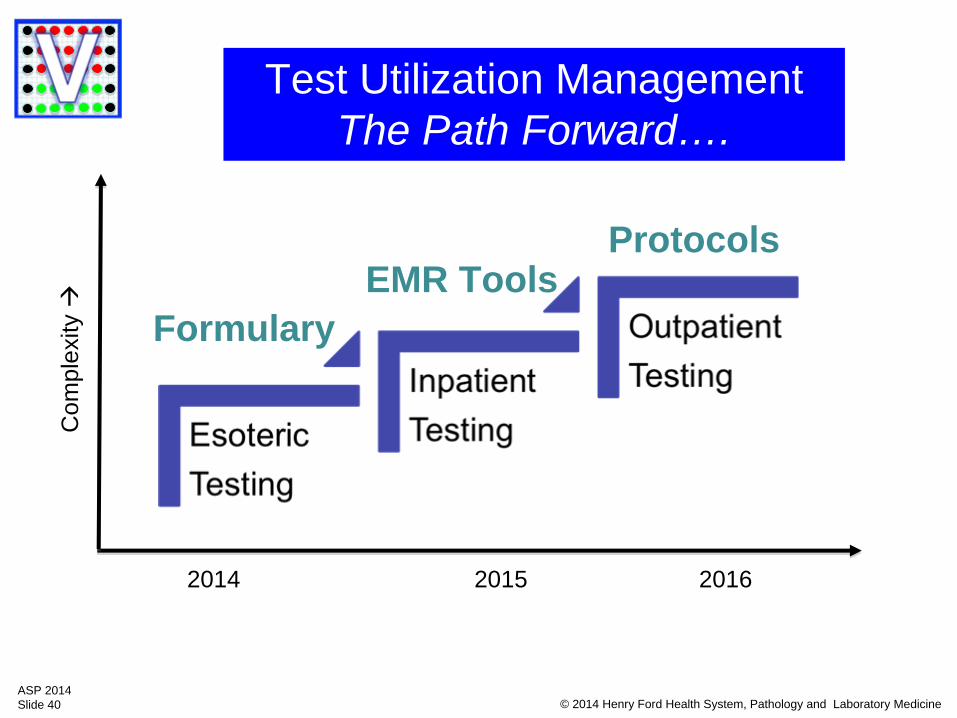
Test Utilization ManagementThe Path Forward….
FormularyEMR Tools
Protocols
Com
plex
ity
2014 2015 2016
© 2014 Henry Ford Health System, Pathology and Laboratory MedicineASP 2014Slide 41
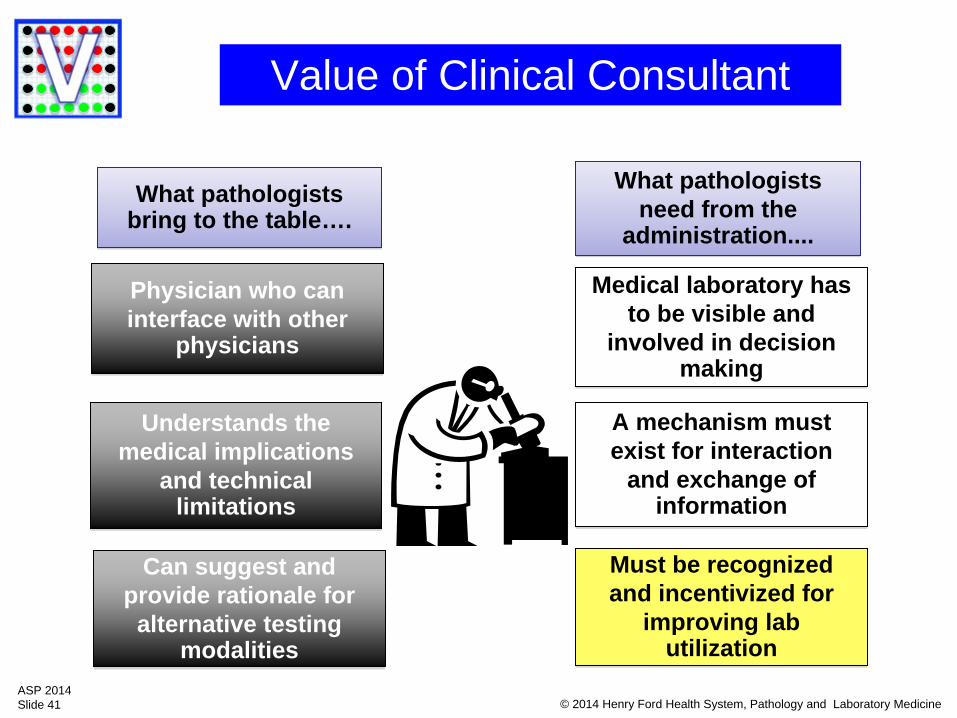
Value of Clinical Consultant
Physician who can interface with other
physicians
Physician who can interface with other
physicians
Understands the medical implications
and technical limitations
Understands the medical implications
and technical limitations
Can suggest and provide rationale for
alternative testing modalities
Can suggest and provide rationale for
alternative testing modalities
Medical laboratory has to be visible and
involved in decision making
Medical laboratory has to be visible and
involved in decision making
A mechanism must exist for interaction
and exchange of information
A mechanism must exist for interaction
and exchange of information
Must be recognized and incentivized for
improving lab utilization
Must be recognized and incentivized for
improving lab utilization
What pathologists bring to the table…. What pathologists
bring to the table….What pathologists
need from the administration....
What pathologists need from the
administration....
© 2014 Henry Ford Health System, Pathology and Laboratory MedicineASP 2014Slide 42
Value Metrics
Won’t always be cost and productivity but….
Downstream episode of care efficiencies and clinical outcomes
© 2014 Henry Ford Health System, Pathology and Laboratory MedicineASP 2014Slide 43
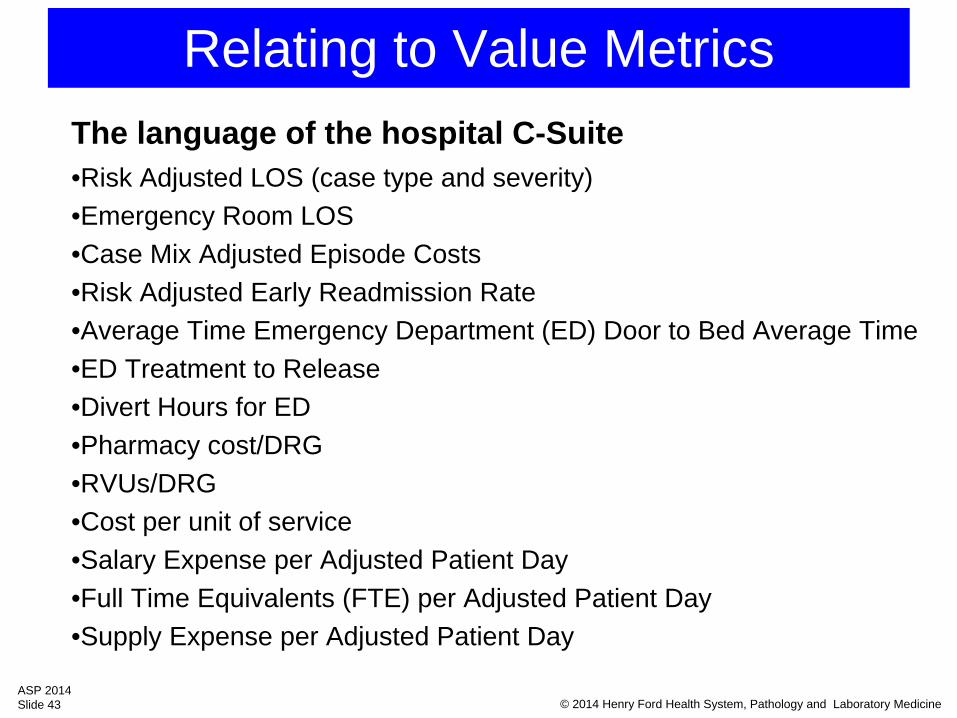
Relating to Value MetricsThe language of the hospital C-Suite•Risk Adjusted LOS (case type and severity)•Emergency Room LOS•Case Mix Adjusted Episode Costs•Risk Adjusted Early Readmission Rate•Average Time Emergency Department (ED) Door to Bed Average Time •ED Treatment to Release •Divert Hours for ED •Pharmacy cost/DRG•RVUs/DRG•Cost per unit of service•Salary Expense per Adjusted Patient Day •Full Time Equivalents (FTE) per Adjusted Patient Day •Supply Expense per Adjusted Patient Day

© 2014 Henry Ford Health System, Pathology and Laboratory MedicineASP 2014Slide 44
Are You Ready to Unleash the Power of Pathology’s V-Man?
© 2014 Henry Ford Health System, Pathology and Laboratory MedicineASP 2014Slide 45
© 2014 Henry Ford Health System, Pathology and Laboratory MedicineASP 2014Slide 46
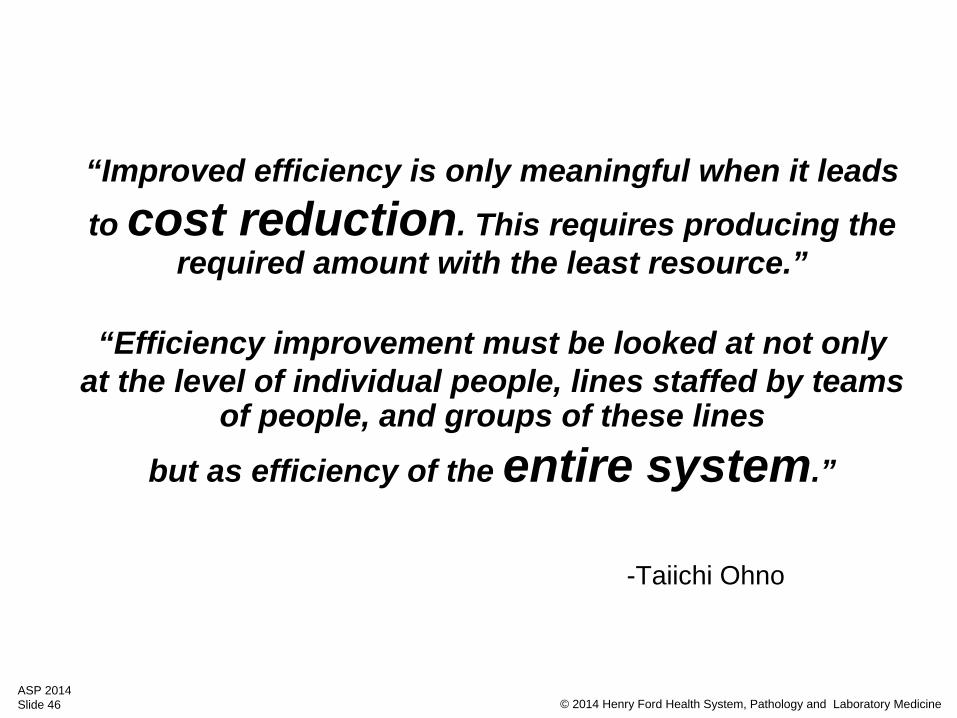
“Improved efficiency is only meaningful when it leads to cost reduction. This requires producing the
required amount with the least resource.”
“Efficiency improvement must be looked at not only at the level of individual people, lines staffed by teams
of people, and groups of these lines
but as efficiency of the entire system.”
-Taiichi Ohno