Embed Size (px)
Citation preview

Defining the mode of medulloblastoma growth using the Ptch1 heterozygous mouse model
by
Robert James Vanner
A thesis submitted in conformity with the requirements for the degree of Doctor of Philosophy
Molecular Genetics University of Toronto
© Copyright by Robert James Vanner, 2015
ii
Defining the mode of medulloblastoma growth using the Ptch1
heterozygous mouse model
Robert James Vanner
Doctor of Philosophy
Molecular Genetics University of Toronto
2015
Abstract
Single cancers can be comprised of highly heterogeneous cell populations. In brain tumours,
including the malignant pediatric brain tumour medulloblastoma, how the distinct cell types that
comprise a tumour contribute to growth and relapse are unclear. Transplantation of human and
mouse medulloblastomas have prospectively identified cells with the cardinal stem cell
properties of self-renewal and differentiation capacity, but the identity, biology and relevance of
these cells in primary tumours are unknown. Here, using Ptch1 heterozygous mice irradiated at
birth, I define the cellular mechanism of mouse medulloblastoma growth. Kinetic studies using
thymidine analogues showed that rare, Sox2+ cells are relatively quiescent compared to the
common, proliferating progenitors expressing Doublecortin (DCX) that differentiate into post-
mitotic NeuN+ cells. Transplantation and lineage tracing experiments show that Sox2+ cells act
as medulloblastoma stem cells: self-renewing and differentiating to drive growth in transplants
and primary tumours. Lineage tracing revealed that tumours grow as a caricature of a neurogenic
system. Investigating cell-type specific drug responses revealed that Sox2+ cells are selected for
by anti-mitotic and Shh pathway-targeted therapies, creating a reservoir for relapse. Accordingly,
high expression of a Sox2+ cell gene signature and high frequencies of Sox2+ cells in human
tumours predict poor prognosis. Sox2-expressing primary medulloblastoma cultures were

iii
screened in serum free conditions in vitro to identify compounds that inhibit Sox2+
medulloblastoma cell growth. The aureolic acid mithramycin triggered Sox2+ cell apoptosis in
vitro, blocked self-renewal and extended Ptch1+/- mouse survival in vivo, and completely
prevented tumour regrowth in transplantation experiments. Therefore, targeting self-renewal in
medulloblastoma by disrupting the stem cell hierarchy may be of therapeutic benefit. These
findings confirm the hierarchical growth paradigm described for medulloblastoma based on
transplantation experiments, define the biology of tumours’ constituent cell types and identify a
novel approach to prolong medulloblastoma remission by targeting self-renewing cells.

iv
Acknowledgments
I would like to thank all members of the Dirks lab for their guidance, support, and friendship
during my time there. Specifically, thanks to Marco, Fiona, Lilian, Michelle, Renée, Ian,
Hayden, Nicole, Kevin, and Sonam. You all gave me reasons to want to come in to work each
day. This thesis builds on the excellent work of Dr. Ryan Ward, a former PhD student in the
Dirks lab, and I would like to thank him for helping me get started. Lastly, I have to thank Peter
Dirks for the opportunity to work in his group, pushing me to think differently, his mentorship,
and sharing his vast knowledge of music. You’ve been an inspiration.
This thesis is dedicated to my parents, Leslie and Stephen, sisters, Catherine and Stephanie, and
fiancée, Julia. You have all shaped me and continue to inspire me. Thank you, Julia, for always
being there for me; you’re the best thing that happened to me in the lab.

v
“He not busy being born,
Is busy dying.”
It’s Alright Ma (I’m Only Bleeding)
Bob Dylan
vi
Table of Contents
Abstract …………………………………………………………………………………………...ii
Acknowledgments ……………………………………………………………………………….iv
List of figures …………………………………………………………………………………......x
List of abbreviations …………………………………………………………………………….xii
Chapter 1: Introduction ……………………………………………………………………….1
1.1 Cancer, stem cells and cancer stem cells …………………………………………1
1.1.1 Cancer ………………………………………………………………………1
1.1.2 Stem cells …………………………………………………………………...2
1.1.3 Origins of the cancer stem cell hypothesis ………………………………….4
1.1.4 Cancer stem cell renaissance: assays and evidence ………………………...5
1.1.5 Cancer stem cells: atop a hierarchy or a stochastic state? …………………..8
1.1.6 Cancer stem cells’ clinical relevance …………………………………….....9
1.2 The cerebellum, hedgehog signaling and medulloblastoma …………………….12
1.2.1 Structure and function of the cerebellum ………………………………….12
1.2.2 Cerebellar development …………………………………………………...13
1.2.3 The hedgehog signaling pathway ………………………………………….15
1.2.4 Medulloblastoma …………………………………………………………..19
1.2.5 Medulloblastoma therapy ………………………………………………….19
1.2.6 Causes of medulloblastoma ……………………………………………….21
vii
1.2.7 Medulloblastoma subgrouping …………………………………………….22
1.2.8 Sonic hedgehog subgroup medulloblastoma ……………………………...23
1.2.9 Mouse models of medulloblastoma ……………………………………….24
1.3 SOX2: the quintessential stem cell gene ………………………………………...28
1.3.1 The Sox2 gene ……………………………………………………………..28
1.3.2 Function of the Sox2 gene …………………………………………………28
1.3.3 Regulation of the Sox2 protein ……………………………………………31
1.4 Cellular quiescence ……………………………………………………………...34
1.4.1 Overview …………………………………………………………………..34
1.4.2 Detecting quiescent cells …………………………………………………..34
1.4.3 Quiescence and self-renewal ………………………………..………...…...36
1.4.4 Mechanisms regulating quiescence ………………………………………..38
1.4.5 Quiescent cancer stem cells: evidence and therapeutic implications ……...40
1.5 Specific aims and hypotheses …………………………………………………...43
Chapter 2: Defining the mode of Ptc medulloblastoma growth …………………………….45
2.1 Published material and author contributions …………………………………….45
2.2 Introduction ……………………………………………………………………...46
2.3 Methods ………………………………………………………………………….51
2.4 Results …………………………………………………………………………...54
2.4.1 Ptc medulloblastoma resembles a dysregulated neurogenic system ………54
viii
2.4.2 Sox2+ cells are quiescent compared to rapidly cycling tumour bulk ……...57
2.4.3 Sox2+ cells slowly cycle …………………………………………………..59
2.4.4 NeuN+ cells are short-lived progeny of DCX+ cells …...………………….61
2.4.5 Tumour-propagating cells express Sox2 …...……………………………...66
2.4.6 Lineage tracing confirms Sox2+ cells are tumour-propagating …………...72
2.5 Discussion
Chapter 3: Targeting Sox2+ cells in SHH subgroup medulloblastoma …….…………….....92
3.1 Published material and author contributions …………………………………….92
3.2 Introduction ……………………………………………………………………...94
3.3 Methods ………………………………………………………………………...100
3.4 Results ………………………………………………………………………….111
3.4.1 Sox2+ cells express a quiescent stem cell gene signature ………………..111
3.4.2 A Sox2+ gene signature defines SHH MB patients with poor prognosis ...117
3.4.3 Sox2+ cells are enriched after anti-mitotic and Shh-targeted therapy ……124
3.4.4 Targeting Sox2+ cells in SHH medulloblastoma …………….…………..131
3.5 Discussion ……………………………………………………………………...147
Chapter 4: Conclusions and Future directions……………………………………………...152
4.1 Conclusions …………………………………………………………………….152
4.2 Future directions ……………………………………...………………………..157
4.2.1 Exploring heterogeneity in the Sox2+ cell population …………………...157
ix
4.2.2 Testing the hierarchical model of medulloblastoma growth ……………..159
4.2.3 Controlling tumour growth by eliminating Sox2+ cells ………………….160
4.2.4 Defining the role of the Sox2 gene in medulloblastoma growth …………161
4.2.5 Defining the role of Sox2 protein in medulloblastoma …………………..162
4.3 Concluding remarks ……………………………………………………………164
References ……………………………………………………………………………………...165
x
List of Figures
Figure 1.1 A stem cell hierarchy…………………………………………………………………..3
Figure 1.2 Development of the cerebellum …………………………………………………..….14
Figure 1.3 The Hedgehog signaling pathway ………………………………………………..….18
Figure 2.1 Predicted results for functional assessment of a cancer stem cell hierarchy………....49
Figure 2.2 Expression of stem cell and neuronal markers in Ptc medulloblastoma …………….55
Figure 2.3 Expression of cerebellar neuronal subtype markers in Ptc medulloblastoma …….....56
Figure 2.4 Sox2+ Ptc medulloblastoma cells are quiescent ………………………………..……58
Figure 2.5 Sox2+ Ptc medulloblastoma cells continuously cycle ………………………..……...60
Figure 2.6 NeuN+ cells are short-lived differentiated progeny of cycling DCX+ cells …….…...62
Figure 2.7 NeuN+ cells are susceptible to death by apoptosis ……………………………..……65
Figure 2.8 Phenotyping Ptc; Sox2-eGFP tumours ………………………………………………67
Figure 2.9 Sox2+ medulloblastoma cells are tumour-propagating ..………..…………………....69
Figure 2.10 Sox2+ cells are required for serial transplantation of Ptc tumours ..………………..71
Figure 2.11 Tamoxifen induced recombination in Sox2creER; Ptc tumors …………..…………73
Figure 2.12 Sox2+ cells propagate Ptc medulloblastoma in situ ……………………..………… 75
Figure 2.13 Sox2+ cells self-renew and differentiate to grow Ptc medulloblastoma ……..……..77
Figure 2.14 Colocalization of tdTomato with glial markers in Sox2creER; Ptc tumour traces …78
Figure 2.15 Lineage tracing in the Ptc; DCXcreER mouse ……………..………………………80
Figure 2.16 tdTomato fluorescence in DCXcreER tumours 48 hours post tamoxifen ..………...82
xi
Figure 3.1 Targeting brain tumour bulk and stem cells …………………………………………96
Figure 3.2 Sox2+ medulloblastoma cells have a distinct gene expression profile ……………..112
Figure 3.3 Sox2+ medulloblastoma cells have a quiescent stem cell gene signature …………..114
Figure 3.4 Shh pathway target gene expression in Sox2+ and Sox2- Ptc cells …………….......116
Figure 3.5 A Ptc Sox2+ cell signature stratifies human SHH MB patients into three expression
groups …………………………………………………………………………………………..118
Figure 3.6 Frequency and pathology of the three Sox2+ signature-defined SHH MB groups ...121
Figure 3.7 The Sox2+ cell signature predicts poor prognosis in human SHH MB …………….123
Figure 3.8 MPCs are enriched following anti-mitotic chemotherapy ……………………….....125
Figure 3.9 MPCs are enriched following smoothened inhibition ……………………………...127
Figure 3.10 Sox2+ cells and their progeny are enriched following smoothened inhibition …....130
Figure 3.11 SOX2+ primary SHH medulloblastoma cultures are resistant to GDC-0449 ..……132
Figure 3.12 Genetic analysis of M693 ………………..……………………………………......133
Figure 3.13 Genetic analysis of M698 ……………………..…………………………………..134
Figure 3.14 SOX2+ cells can be targeted using mithramycin ………………..………………...136
Figure 3.15 Mithramycin inhibits transcription of SOX2, MYCN and HDAC4 ……………..…138
Figure 3.16 Mithramycin triggers apoptosis in SHH medulloblastoma cultures ……………....140
Figure 3.17 Mithramycin inhibits proliferation in Ptc tumours ………..………………………142
Figure 3.18 Mithramycin reduces self-renewal in vivo …………………..…………………….144
Figure 3.19 Mithramycin extends survival of Ptc mice ………………..………………………146
xii
List of Abbreviations
5-FU – 5-Fluorouracil
7AAD – 7 Aminoactinomycin D
A – adenosine
ABL – Abelson murine leukemia viral
oncogene homolog 1
AC3 – activated-caspase 3
Akt – protein kinase B
ALL – acute lymphoblastic leukemia
AML –acute myeloid leukemia
ANOVA – analysis of variance
APC – adenomatous polyposis coli
Ara-C – arabinofuranosyl cytarabine
Atoh1 – atonal homolog 1
BCGSC – British Columbia Genome
Sciences Centre
BMI1 - B lymphoma Mo-MLV insertion
region 1 homolog
BMP – bone morphogenetic protein
BMPR1A –BMP receptor 1 A
BrdU – 5’-bromo-2’-deoxyuridine
Brn2 – POU domain, class 3, transcription
factor 2
C - cytosine
cAMP – 3’,5’-cyclic adenosine
monophosphate
CCL3 – chemokine (C-C motif) ligand 3
CD133 – cluster of differentiation 133
CD15 – cluster of differentiation 15
CD34 – cluster of differentiation 34
CD38 – cluster of differentiation 38
CD45 – cluster of differentiation 45
CDKN1A – cyclin-dependent kinase
inhibitor 1A
CDKN1B – cyclin-dependent kinase
inhibitor 1B
cDNA – complementary DNA
chr - chromosome
CFC – colony-forming cell
CFSE – carboxyfluorescein succinimidyl
ester
xiii
Chd7 – chromodomain-helicase binding
protein 7
CK1 – casein kinase 1
CldU – 5’-chloro-2’-deoxyuridine
Crygd – gamma-crystallin D
DAPI – 4’6-diaminido-2-phenylindole
DCX – doublecortin
DEPC – diethylpyrocarbonate
DKK1 – dickkopf 1
DMBA - 7,12-Dimethylbenz(a)anthracene
DMSO – dimethyl sulfoxide
dNTP – deoxyribonucleotide
DTA – diphtheria toxin fragment A
dTTP – deoxyribothymidine
dUTP – deoxyribouracil
E – glutamate
EdU – 5-ethinyl-2’-deoxyuridine
EGF – epidermal growth factor
EGL – external granule layer
F – phenylalanine
FACS – fluorescence-activated cell sorting
FDR – false discovery rate
FGF – fibroblast growth factor
FGF14 – fibroblast growth factor 14
FGF 8 – fibroblast growth factor 8
G – guanine
G-CSF – granulocyte-colony stimulating
factor
G0 – Growth phase 0
GAB1 – GRB2-associated binding protein 1
GABA – gamma -aminobutyric acid
GABARα6 – GABA receptor alpha 6
Gfap – glial fibrillary acidic protein
GFP – green fluorescent protein
GI – growth index
Gli1 – Gli family zinc finger 1
Gli2 – Gli family zinc finger 2
Gli3 – Gli family zinc finger 2
GNPC – granule neuron progenitor cell
GSEA – gene set enrichment analysis
GSK3 – glycogen synthase kinase 3
Gy – Gray
xiv
H2B – histone 2 B
HCL – hierarchical clustering
HGF – hepatocyte growth factor
Hh – hedgehog
HMG – high mobility group
Hoxa2 – homeobox A2
IdU – 5-Iodo-2’-deoxyuridine
IGFR – Insulin-like growth factor 1 receptor
IGL – internal granule layer
Ink4c – cyclin-dependent kinase inhibitor
2C
Jag1 – jagged 1
JARID1B – lysine-specific demethylase 5B
K14 – keratin 14
KCNA1 - potassium voltage-gated channel,
shaker-related subfamily, member 1
Kif7 – kinesin-like protein 7
L - leucine
LCA – large cell anaplastic
LDA – limiting dilution assay
M – methionine
Math1 – mouse atonal homolog 1
MB – medulloblastoma
MM – mithramycin
MPC – medulloblastoma propagating cell
mRNA – messenger RNA
MYCN – n-myc proto-oncogene protein
NCI – National Cancer Institute
NeuN – neuronal nuclei
NeuroD1 – neurogenic differentiation 1
NF1 – neurofibromatosis type 1
NO – nitric oxide
NPR4 – NPR1-like gene 4
NSCLC – non-small cell lung cancer
NSG – NOD.Cg-Prkdcscid Il2rgtm1Wjl/Szj
OCT3 – octamer-binding transcription factor
3
OCT4 – octamer-binding transcription factor
4
Otx2 – orthodenticle homeobox 2
p300 – p300-CBP coactivator family
p53 – tumor protein 53
xv
Pax6 – paired box 6
PCA – principle component analysis
PCR – polymerase chain reaction
PDGF – platelet-derived growth factor
PFA – paraformaldehyde
PLO – poly-L-ornithine
PML – promyelocytic leukemia
PNET – primitive neuroectodermal tumour
Prkci – protein kinase c iota
PTCH1 – patched 1
Pten – phosphatase and tensin homolog
PVDF – polyvinylidine fluoride
Q – Glutamine
RCAS - Replication-Competent ASLV long
terminal repeat (LTR) with a Splice acceptor
RMA – robust multichip average
RMST – rhabdomyosarcoma 2 associated
transcript
RNA – ribonucleic acid
Rosa26 - ROSAβgeo26
S – serine
SCID – severe combined imunnodeficiency
SEM – standard error of the mean
SFC – sphere-forming cell
SFRP1 – secreted-frizzled related protein 1
Shh – sonic hedgehog
Smo – smoothened
SNV – single nucleotide variant
Sox2 – Sry-box 2
Sry – sex determining region Y
SSEA-1 – stage-specific embryonic antigen
1
Sufu – suppressor of fused
T – threonine
Tet-OFF – tetracycline off
Tet-ON – tetracycline on
TK – thymidine kinase
Tlx – Nuclear receptor TLX
TP53 – tumor protein 53
TUNEL – terminal deoxynucleotidal
transferase dUTP nick end labeling
tva – avian sarcoma leucosis virus receptor
A
xvi
Tween – polysorbate
UCSC – University of California, Santa
Cruz
UNG – Uracil-DNA glycosylase
WGS – whole genome sequencing
Wnt – wingless
Wnt1 – wingless-type MMTV integration
site family, member 1
1
Chapter 1 Introduction
1.1 Cancer, stem cells and cancer stem cells
1.1.1 Cancer
Cancer is a disease of unregulated clonal growth. A progressive series of DNA mutations and
epigenetic modifications that begin in a single cell produce a malignant clone that can bypass
cell cycle and DNA damage checkpoints, ignore differentiation signals, suppress apoptosis and
evade the immune system, to continually expand. Cells within the clone are subject to natural
selection and thus can genetically diverge in a process of branching evolution. By invading
restrictive membranes and entering the bloodstream, lymphatic system or cerebrospinal fluid,
many cancers spread beyond their site of origin to colonize new tissues in a process called
metastasis. Cancer cells’ unrelenting growth leads them to overtake healthy cells, causing organs
to fail and in many cases patients to die. Cancer is the most common cause of death in Canada:
over 40% of Canadians will develop cancer in their lifetime and approximately 25% of
Canadians will die from cancer (CCS, 2014). While many discussions of cancer focus on the
gloomy statistics, scientific ‘wrong turns’, and myriad clinical failures, the narrative arc of
cancer research is, in my opinion, positive. Basic science and clinical cancer research have vastly
expanded humanity’s understanding of the disease and improved our treatment efficacy over the
past 50 years. Not only do contemporary patients survive longer, many of those diagnosed today
will be cured of cancers to which they would have rapidly succumbed just several decades ago.
2
This is thanks to many technological, surgical and pharmacological innovations that are products
of over a century of research. Current efforts to cure cancer comprise one of the most significant
research endeavors in human history. Continual progress will be made. By interrogating the
fundamental biology of medulloblastoma growth I hope that this thesis will contribute to the
understanding and, perhaps someday, treatment of cancer.
1.1.2 Stem cells
Development, gamete production and tissue homeostasis in most multicellular eukaryotes are
dependent upon stem cells. Stem cells are defined by their ability to self-renew. Self-renewal is
the capacity for a cell to divide and generate at least one daughter that is also a stem cell. Self-
renewing divisions occur when a stem cell divides to produce two daughters that can also self-
renew (a symmetric division) or one daughter cell that can self-renew and one that cannot (an
asymmetric division). The other key stem cell attribute is the capacity to differentiate and
produce non-stem cell progeny. Single stem cells can both self-renew and generate differentiated
progeny of one or multiple forms. Differentiated cells most often outnumber stem cells within an
embryo or adult tissue and generally execute the specific functions required of an organ. During
tissue growth or maintenance stem cells produce differentiated cells that do not return to the stem
cell state, becoming continually more specified instead. Since stem cells are at the root of this
unidirectional process, tissues are often referred to as hierarchies with stem cells at the apex
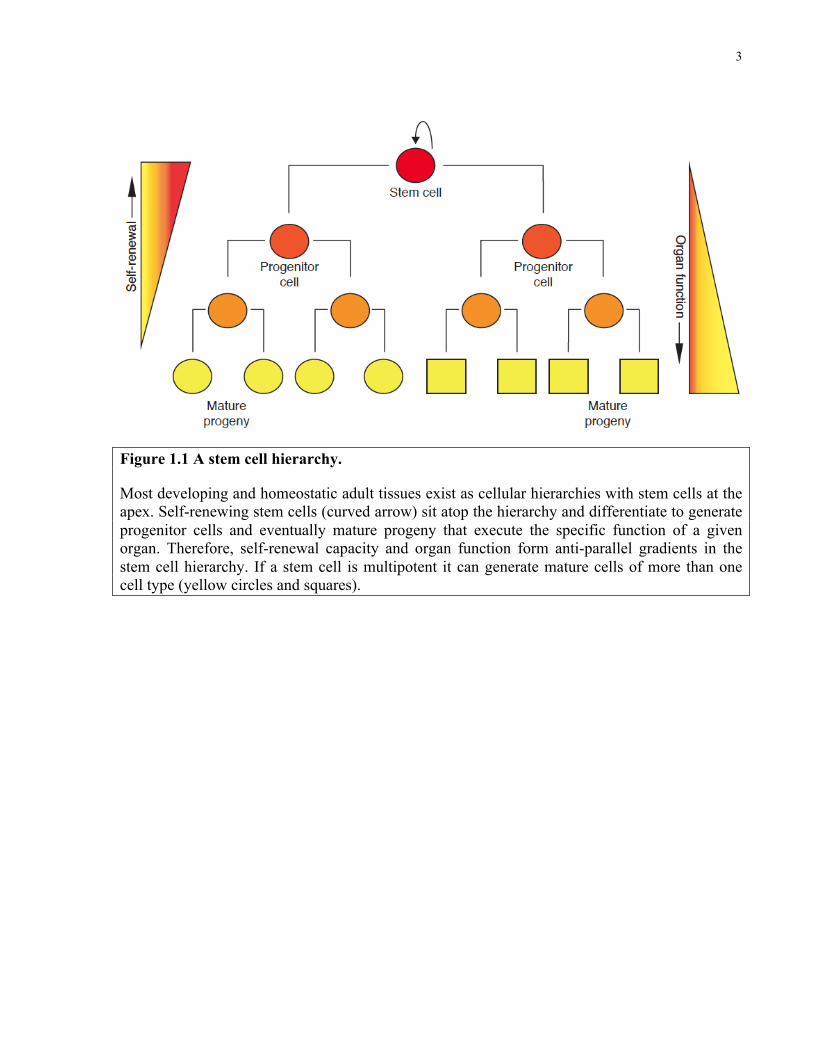
(Figure 1.1).
3
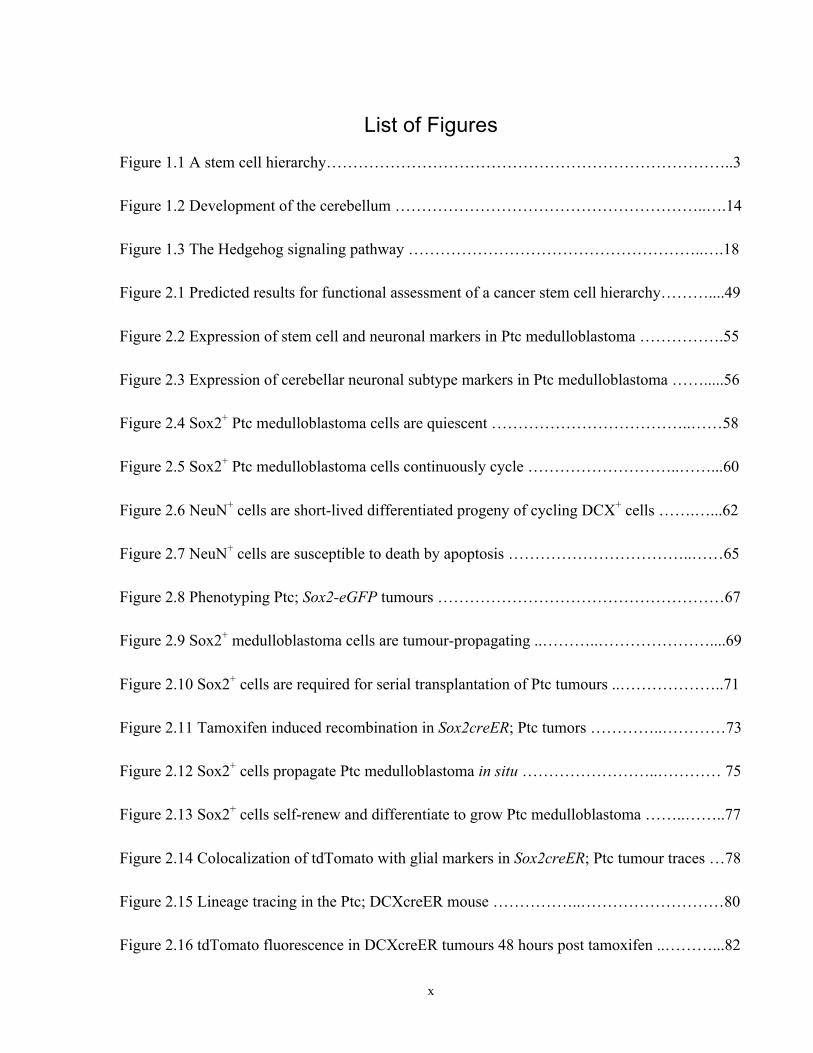
Figure 1.1 A stem cell hierarchy.
Most developing and homeostatic adult tissues exist as cellular hierarchies with stem cells at the apex. Self-renewing stem cells (curved arrow) sit atop the hierarchy and differentiate to generate progenitor cells and eventually mature progeny that execute the specific function of a given organ. Therefore, self-renewal capacity and organ function form anti-parallel gradients in the stem cell hierarchy. If a stem cell is multipotent it can generate mature cells of more than one cell type (yellow circles and squares).
4
Intriguingly, in some cases of stem cell injury or ablation, differentiated progeny revert to fully
functioning stem cells and can reestablish homeostasis (Brawley and Matunis, 2004; Grafi, 2004;
Kai and Spradling, 2004; Kragl et al., 2009). Natural selection’s generation of this redundancy
hints at stem cells’ critical role. Hierarchical growth is essential to organism development and
tissue homeostasis: without stem cells, embryogenesis does not occur and adult tissues cannot be
sustained. Strikingly, many cancers have an analogous dependence on restricted populations of
malignant cells.
1.1.3 Origins of the cancer stem cell hypothesis
Individual cancers are highly heterogeneous. Histological stains showed early pathologists that
tumours are comprised of a diversity of cells that vary in their morphology, mitotic activity and
chromosomal content. Genetically distinct tumour subclones have long been recognized in both
mouse (Klein and Klein, 1956; Makino, 1956) and human neoplasms (Levan et al., 1963;
Shapiro et al., 1981) but do not account for all tumour heterogeneity as clonal cell lines (Bennett
et al., 1978; Hager et al., 1981) and tumours (Bennett et al., 1978; Kleinsmith and Pierce, 1964)
contain a variety of cell types. Functional heterogeneity was observed in early transplantation
assays, as Furth and Kahn showed in 1937 that only 5 of 97 singly transplanted mouse leukemia
cells caused the disease in recipients (Furth, 1937). Subsequent transplantation studies confirmed
that single cells seldom form tumour grafts (Hauschka, 1953; Klein and Klein, 1956; Makino,
1956). Transplantation of clonal mouse melanoma cell lines into syngeneic hosts demonstrated
that only a fraction of cells from a single tumour have metastatic potential (Fidler and Kripke,
1977). In a series of morally dubious experiments, Chester Southam found that inoculation of
human cancer patients with autologous cell suspensions would only reliably generate tumours
5
with one million or more cells (Brunschwig et al., 1965; Southam, 1961), hinting that only rare
cells within tumours drive growth. Pulse-labeling human leukemia patients with tritiated
thymidine revealed considerable proliferative heterogeneity: large blast cells in the bone marrow
were highly proliferative and immediately acquired H3-thymidine while small blasts circulating
in the blood were initially unlabeled (Clarkson et al., 1970; Gavosto et al., 1967; Pileri et al.,
1967). Over time, large blast cells differentiated and label appeared in a medium-sized bone
marrow intermediate before being detected in the small blasts in peripheral blood. Label was
quickly lost from the post-mitotic small blasts, suggesting that the differentiated population was
short-lived and dependent upon the proliferating marrow cells for constant replenishment. This
defined a proliferative hierarchy and suggested that continual leukemic growth was driven by a
subpopulation of malignant cells. Meticulous tracking of transplanted mouse teratocarcinomas
by Pierce and colleagues showed that tumour formation began with proliferation of
undifferentiated embryonal carcinoma cells that mature with time to yield differentiated, post-
mitotic cell types (Pierce et al., 1960). Strong support for the stem cell theory of cancer came
when Pierce’s group showed that single, multipotent embryonal carcinoma cells could self-renew
and differentiate to recapitulate parental tumours upon transplantation (Kleinsmith and Pierce,
1964). These findings created a paradigm for cancer as a caricature of normal tissue development
in which ‘more malignant’ stem cells not only propagate the disease but also give rise to a ‘more
benign’ population of cells that most often comprise the bulk of the malignancy (Nguyen et al.,
2012).
1.1.4 Cancer stem cell renaissance: assays and evidence
6
Testing the cancer stem cell model required a robust, quantitative assay to measure tumour
propagating potential. After injecting mice with serial dilutions of murine lymphoma cells,
quantification of the number of colonies formed per spleen showed a linear relationship with the
number of cells injected, suggesting that each colony formed from a single cell (Bruce and Van
Der Gaag, 1963). This created a method with which to calculate the frequency of colony-forming
units in a population. This experiment also demonstrated functional heterogeneity within the
lymphoma population as only rare cells formed splenic colonies. Improved strains of
immunodeficient mice supporting growth of human hematopoietic stem cells (Kamel-Reid and
Dick, 1988) and leukemia (Kamel-Reid et al., 1989) provided a reliable xenograft assay to
measure stem cell potential. In 1994 Lapidot and Dick demonstrated that leukemia only
developed in SCID mice injected with CD34+CD38- acute myeloid leukemia (AML) cells
(Lapidot et al., 1994). This was the first prospective isolation of a cancer stem cell. The
differentiation capacity of leukemia-initiating cells was later confirmed by showing that
CD34+CD38- leukemia grafts recapitulated the heterogeneity of the patient samples from which
they were derived, providing evidence that AML is organized as a hierarchy with a primitive cell
at the apex (Bonnet and Dick, 1997). The prospective isolation of xenograft-forming cells from
primary tumours has subsequently shown evidence of a hierarchy in many cancers including
breast (Al-Hajj et al., 2003), brain (Singh et al., 2004; Son et al., 2009), pancreatic (Hermann et
al., 2007; Li et al., 2007), lung (Eramo et al., 2008), prostate (Collins et al., 2005), head and neck
(Prince et al., 2007), colorectal (O'Brien et al., 2007; Ricci-Vitiani et al., 2007), ovarian (Curley
et al., 2009), melanoma (Boiko et al., 2010) and sarcoma (Wu et al., 2007). However, melanoma
formation by as many as one in three primary tumour cells in increasingly immunocompromised
7
mice cast doubt on the hierarchical nature of the disease (Quintana et al., 2010; Quintana et al.,
2008). In a number of other cancers, tumour-initiating cells remained rare even in NOD.Cg-
Prkdcscid Il2rgtm1wjl/SzJ (NSG) mice (Ishizawa et al., 2010). Xenografting in NSG mice revealed
leukemia-initiating cell activity in non-CD34+CD38- cells (Taussig et al., 2008). While up to
50% of human AML samples may show leukemia propagating potential outside of the
CD34+CD38- compartment, this fraction is almost always enriched for leukemia-initiating cells
(Eppert et al., 2011; Kreso and Dick, 2014). Immunophenotype is therefore insufficient to
identify cancer stem cells and must be combined with functional assays to define the self-
renewing population. An underappreciated caveat to transplantation experiments is that highly
proliferative cells may be graft-forming but lack the capacity to propagate the disease long term
(Blackburn et al., 2014; Hope et al., 2004; Kreso et al., 2013). This makes serial transplantation
of a putative stem cell fraction the gold standard test for cancer stem cell potential.
Allograft and xenograft approaches create intense selection pressure for cells that can survive
transplantation and integrate into the new microenvironment. Accordingly, researchers have
questioned whether these assays faithfully identify the cells that are driving primary cancer
growth in patients (Clevers, 2011). Two recent studies have used lineage tracing in primary
mouse models of squamous skin tumours and intestinal adenomas to identify stem cells in
unmanipulated tumours. An elegant study by Blanpain and colleagues showed that K14+ cells
drive tumour growth in DMBA/TPA induced skin cancer (Driessens et al., 2012). Rare K14+
cells remained in the basal stem cell niche and also generated significant clonal outgrowths full
of differentiated cells. In intestinal adenomas, tracing from Lgr5+ cells demonstrated their self-
renewal and differentiation potential in situ (Schepers et al., 2012). Transplantation and lineage
8
tracing were finally reconciled to show that Tlx+ cells in a PDGF-induced mouse glioma model
drive primary tumour growth and are enriched for tumour-propagating capacity (Zhu et al.,
2014). While these results support the hypothesis that the xenograft forming cells from human
tumours are also driving clonal growth in patients, replication in other systems is required.
1.1.5 Cancer stem cells: atop a hierarchy or a stochastic state?
Transplantation assays a cell’s potential at a specific moment in time. Accordingly, this
technique cannot determine the potential for a non stem cell to dedifferentiate and acquire self-
renewal. In plants, the female drosophila germline, mouse testis, mouse intestine and salamander
limb, among others, differentiated cells can regain self-renewal capacity following ablation of
stem cells in their niche (Brawley and Matunis, 2004; Grafi, 2004; Kai and Spradling, 2004;
Kragl et al., 2009). Whether similar state transitions occur in cancer hierarchies during tumour
progression or in response to therapy is unclear. In vitro studies of breast cancer cell lines found
that transitions between luminal, basal and stem cell states occurred with a low but reliable
frequency (Gupta et al., 2011). These stochastic transitions meant that cells from each population
would establish and maintain equilibrium proportions in a culture. Paclitaxel or 5-FU treatment
caused an equilibrium shift as transitions to chemoresistant states were favored. Studies of the
PC-9 NSCLC line described a ‘drug-tolerant persister’ cell state that was random and reversible,
but dependent on IGFR induced chromatin remodeling (Sharma et al., 2010). The histone
demethylase JARID1B identified and was required by rare, self-renewing melanoma cells in
vitro and in vivo (Roesch et al., 2010). Cloning individual JARID1B+ and JARID1B- cells
showed that each cell type could form the other and that both were tumourigenic. Particularly in
9
vitro, functional heterogeneity can be a product of stochastic transitions between distinct
epigenetic states.
In vivo state transitions have been observed when non stem cells are exposed to key self-renewal
signals. Colorectal cancer stem cells are maintained by wnt signaling from multiple sources
including tumour stroma. Coinjection of wntlow non-stem cell cultures with HGF-secreting
myofibroblasts activated wnt-reporter activity and imbued the cells with tumour-initiating
potential (Vermeulen et al., 2010). Nitric Oxide (NO) is a niche-derived factor promoting self-
renewal of glioma stem cells (Charles et al., 2010). Stimulating NO production in mouse gliomas
increased the stem cell frequency in tumours, presumably by triggering dedifferentiation. In
human glioma xenografts, temozolomide treatment increases stem cell marker frequency. In
vitro, CD133- cells upregulated CD133 and exhibited greater self-renewal following
temozomolide exposure, but whether this dedifferentiation happens in vivo was not examined. In
mouse squamous skin cancer, Sox2+ cells are tumour-propagating cells and their frequency is
enriched with serial transplantation (Boumahdi et al., 2014). Sox2- cells from this model formed
tumours at high cell doses and these grafts contained rare Sox2+ cells that may have been
produced by dedifferentiation. However, attempts at serially transplanting these tumours failed,
meaning that either the transition to Sox2+ stem cell state was incomplete or the fraction of
Sox2+ cells was too low to sustain a secondary tumour. Careful, clonal-level in vivo experiments
and in situ fate mapping are required to determine the extent, causes and relevance of tumour cell
fate switching.
1.1.6 Cancer stem cells’ clinical relevance
10
The cancer stem cell model has considerable potential to influence oncology practice but its
clinical implications are just now being realized. In breast (Liu et al., 2007), colon (Merlos-
Suarez et al., 2011), non-small cell lung cancer (Zheng et al., 2013), glioma (Murat et al., 2008)
and leukemia (Eppert et al., 2011), patients whose tumours express higher levels of a cancer stem
cell signature experience significantly greater morbidity and mortality. Similarly, brain cancer
patients whose tumour cells self-renew and form tumourspheres in vitro have worse outcomes
(Laks et al., 2009; Pallini et al., 2008; Panosyan et al., 2010). Cells with long term propagating
potential will be positively selected and may therefore increase in frequency with cancer
progression (Clevers, 2011; Kreso and Dick, 2014). Greater stemness features may be a
reflection of advanced and thus more aggressive disease. Resistance to conventional therapies is
another feature common to cancer stem cells in multiple malignancies, including
medulloblastoma (Chen et al., 2012; Corbin et al., 2011; Hambardzumyan et al., 2008; Ishikawa
et al., 2007; Kreso et al., 2013; O'Brien et al., 2012). As a result, stem cells may become
enriched following therapy (Auffinger et al., 2014; Ishikawa et al., 2007) and are the likely
source of relapse (Chen et al., 2012). Targeting self-renewing cells is highly desired but may not
be sufficient if non-stem cells have considerable proliferative potential or can revert to the stem
cell state. Genetic ablation of quiescent, temozolomide-resistant nestin+ cells in mouse glioma
extended survival but showed the greatest benefit when combined with temozolomide ablation of
cycling cells (Chen et al., 2012). In colon cancer xenografts, targeting the essential stem cell
regulator Bmi-1 not only shrunk tumours to control disease but also completely curbed self-
renewal potential (Kreso et al., 2014). Small molecule inhibitors of Notch signaling are in
glioblastoma clinical trials to block self-renewal in patients with recurrent disease. Another trial

11
for recurrent glioblastoma is applying an innovative approach to immunotherapy: patients’
tumours are resected and used to establish a gliomasphere line, mRNA from which is transduced
into patients’ own dendritic cells prior to their re-injection to generate an anti-tumour humoural
response. The results of cancer stem cell-targeting clinical trials will be the ultimate test of the
concept, with the scientific and clinical communities eagerly awaiting their results.
12
1.2 The cerebellum, hedgehog signaling and medulloblastoma
1.2.1 Structure and function of the cerebellum
The cerebellum is located in the posterior fossa beneath the tentorium cerebelli and above the
brain stem. It receives input from the cortex and peripheral nervous system and sends output
through the superior cerebellar peduncle by way of the deep cerebellar nuclei. In so doing, the
cerebellum is essential for coordinating movement, the vestibulo-ocular reflex and certain
aspects of learning and memory. There are two cerebellar lobes, anterior and posterior, which
both have lateral hemispheres that are divided by a longitudinal midline structure called the
vermis. The adult cerebellum is a laminar structure with a series of core nuclei. Surrounding the
innermost nuclei of the ten folia that comprise the cerebellar hemispheres of mammalian
cerebella is the internal granule layer (Ramnani, 2006). It is densely packed with granule
neurons, of which there are more than all types of neurons in the cortex combined (Ramnani,
2006). Granule neurons release the neurotransmitter glutamate and are the only excitatory
neurons in the cerebellum. Immediately superficial to the granule layer is the Purkinje cell layer.
This layer contains Purkinje cells, as well as Bergmann glia and several interneuron classes
called golgi, stellate, basket, lugaro and candelabra neurons (Hatten and Roussel, 2011). The
molecular layer lies beyond the Purkinje cell layer and below the pial surface. It is the site of
extensive Purkinje cell arborisations, through which they receive input from the pontine nuclei
via parallel fibres and the inferior olive nucleus via climbing fibres (Ramnani, 2006). Purkinje
cells are the principle output neuron of the cerebellum, responsible for integrating complex input
13
signals and releasing GABA at the deep cerebellar nuclei to modulate their output to the
midbrain and cortex (Figure 1.2D) (Ramnani, 2006).
1.2.2 Cerebellar development
The cerebellum develops from the first rhombomere and its specification requires Wnt1 secretion
from the caudal midbrain (Thomas and Capecchi, 1990) and FGF8 release from the isthmus
(Irving and Mason, 2000). Wnt1 and FGF8-induced Otx2 expression delineates the anterior
border (Millet et al., 1996; Wingate and Hatten, 1999) of rhombomere 1 whereas Hoxa2
demarcates the posterior border (Barrow et al., 2000). From this region, two neurogenic zones
emerge that together produce virtually the entire cerebellum. The ventricular zone lines the
fourth ventricle and gives rise to Purkinje neurons and the cerebellum’s inhibitory GABAergic
interneurons such as Golgi, basket and stellate cells. Multipotent neural stem cells in the
ventricular zone also produce cerebellar glia and oligodendrocytes. Beginning at E10.25,
progenitor cells begin to differentiate, exit the cell cycle and migrate dorsally along the fibres of
radial glial cells to generate the molecular layer and cerebellar nuclei (Hatten and Roussel,
2011). The rhombic lip is the second neurogenic region established at E12.5 along the anterior
and dorsal aspect of the cerebellar anlage (Figure 1.2A,B) (Morales and Hatten, 2006).
Progenitors in the rhombic lip express Atoh1/Math1 and migrate dorsally and rostrally to coat the
surface of the developing cerebellum beginning at approximately E14.5 (Morales and Hatten,
2006). This forms the external granule layer or external germinal layer (EGL). The EGL is
composed primarily of granule neuron progenitor cells (GNPCs) that are Math1+ and proliferate
in response
14
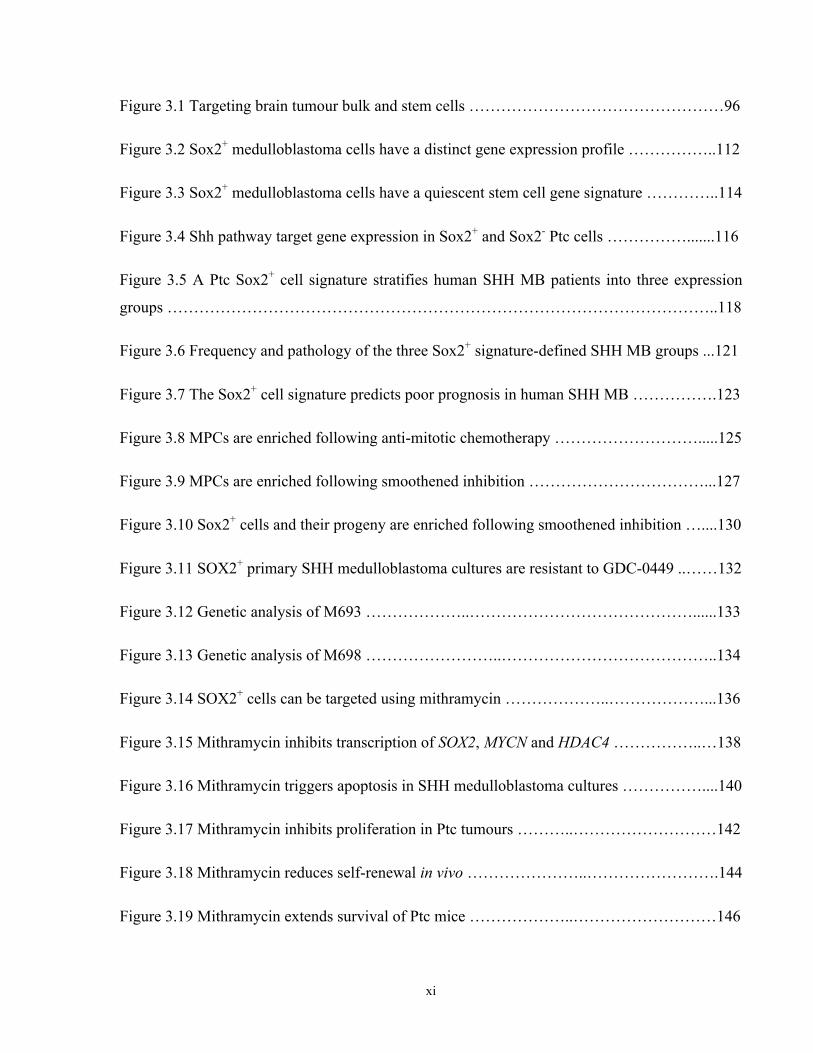
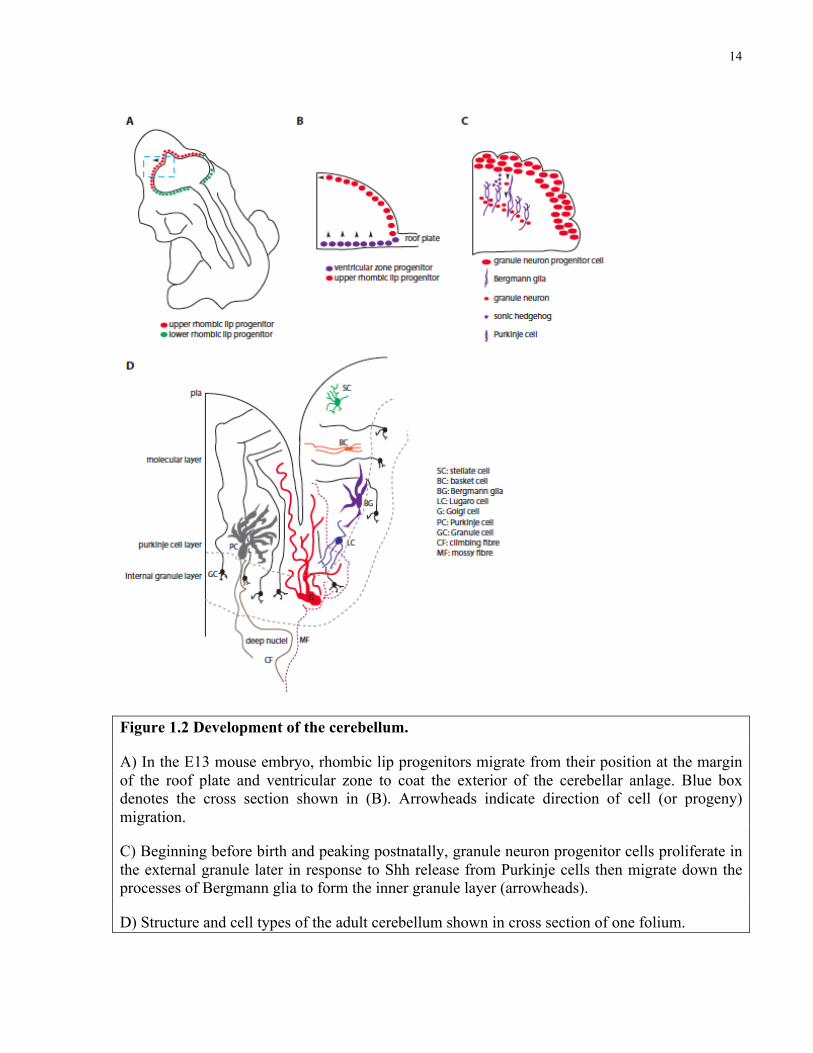
Figure 1.2 Development of the cerebellum.
A) In the E13 mouse embryo, rhombic lip progenitors migrate from their position at the margin of the roof plate and ventricular zone to coat the exterior of the cerebellar anlage. Blue box denotes the cross section shown in (B). Arrowheads indicate direction of cell (or progeny) migration.
C) Beginning before birth and peaking postnatally, granule neuron progenitor cells proliferate in the external granule later in response to Shh release from Purkinje cells then migrate down the processes of Bergmann glia to form the inner granule layer (arrowheads).
D) Structure and cell types of the adult cerebellum shown in cross section of one folium.
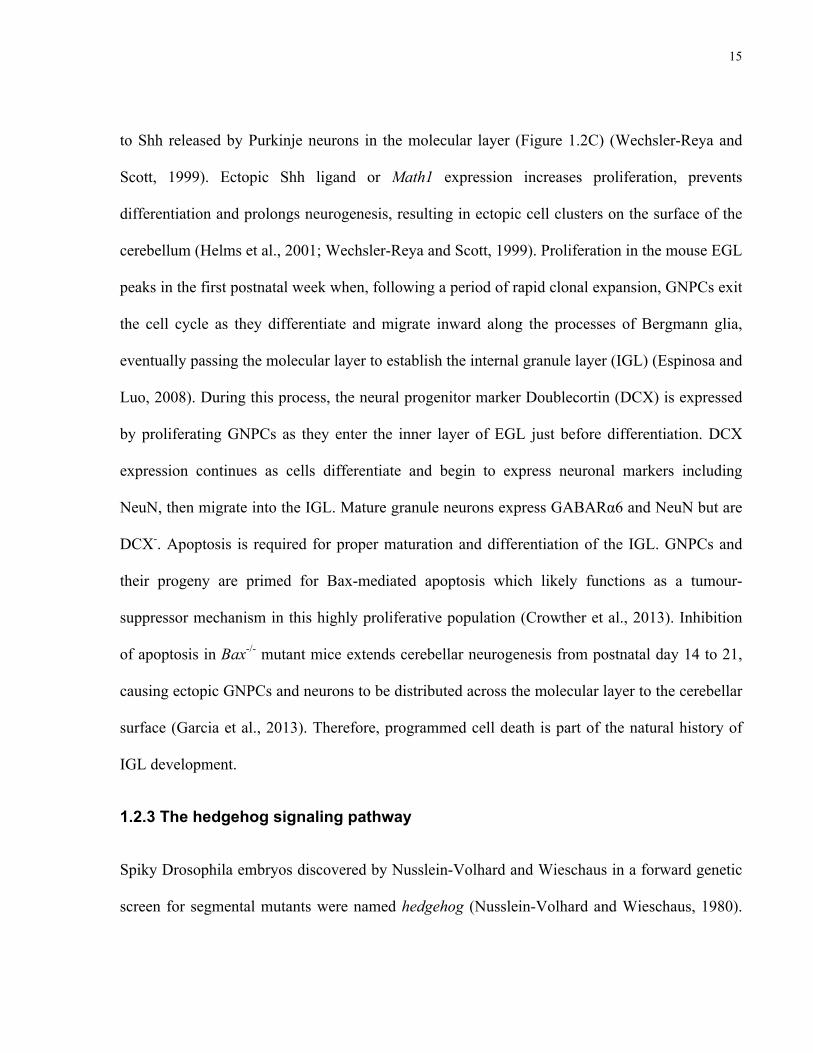
15
to Shh released by Purkinje neurons in the molecular layer (Figure 1.2C) (Wechsler-Reya and
Scott, 1999). Ectopic Shh ligand or Math1 expression increases proliferation, prevents
differentiation and prolongs neurogenesis, resulting in ectopic cell clusters on the surface of the
cerebellum (Helms et al., 2001; Wechsler-Reya and Scott, 1999). Proliferation in the mouse EGL
peaks in the first postnatal week when, following a period of rapid clonal expansion, GNPCs exit
the cell cycle as they differentiate and migrate inward along the processes of Bergmann glia,
eventually passing the molecular layer to establish the internal granule layer (IGL) (Espinosa and
Luo, 2008). During this process, the neural progenitor marker Doublecortin (DCX) is expressed
by proliferating GNPCs as they enter the inner layer of EGL just before differentiation. DCX
expression continues as cells differentiate and begin to express neuronal markers including
NeuN, then migrate into the IGL. Mature granule neurons express GABARα6 and NeuN but are
DCX-. Apoptosis is required for proper maturation and differentiation of the IGL. GNPCs and
their progeny are primed for Bax-mediated apoptosis which likely functions as a tumour-
suppressor mechanism in this highly proliferative population (Crowther et al., 2013). Inhibition
of apoptosis in Bax-/- mutant mice extends cerebellar neurogenesis from postnatal day 14 to 21,
causing ectopic GNPCs and neurons to be distributed across the molecular layer to the cerebellar
surface (Garcia et al., 2013). Therefore, programmed cell death is part of the natural history of
IGL development.
1.2.3 The hedgehog signaling pathway
Spiky Drosophila embryos discovered by Nusslein-Volhard and Wieschaus in a forward genetic
screen for segmental mutants were named hedgehog (Nusslein-Volhard and Wieschaus, 1980).
16
The hedgehog gene encodes a secreted ligand (Lee et al., 1992) that activates an evolutionarily
conserved pathway involved in development, homeostasis and disease, known as the hedgehog
signaling pathway. In Drosophila, hedgehog ligand (Hh) binds to the 12-pass transmembrane
receptor Patched (Chen and Struhl, 1996). Hedgehog and Smoothened, a gene encoding a G-
protein coupled receptor, mutant flies have a similar phenotype and Smoothened was initially
thought to be the Hh receptor (Alcedo et al., 1996; van den Heuvel and Ingham, 1996). Epistasis
studies and physical binding of Hh to Patched showed that Hh ligand inactivates Patched to
relieve its inhibition of Smoothened (Smo), thus activating the pathway (Ingham et al., 1991;
Stone et al., 1996). Patched and Smoothened show reciprocal trafficking at the cell membrane:
when Hh binds Patched it stimulates endocytosis and simultaneous localization of Smoothened
to the surface (Hui and Angers, 2011). Smoothened is the positive transducer of the Hh pathway
and acts by indirectly regulating the balance of zinc finger transcription factor Cubitus
interruptus’ activator and repressor activity.
Due to evolutionary divergence in the function of pathway members between invertebrates and
vertebrates, I will focus on the mechanism of intracellular signaling in the vertebrate Hedgehog
pathway. Rather than a single Cubitus interruptus, vertebrates have three homologous zinc finger
transcription factors named Gli1-3 that are the transcriptional effectors of the Hh pathway
(Varjosalo and Taipale, 2008). Gli1 possesses a C-terminal transcriptional activation domain,
while Gli2 and Gli3 both have a C-terminal activation domain and N-terminal repressor domains
(Sasaki et al., 1999). In the absence of Hh, protein kinases PKA, GSK3 and CK1 phosphorylate
Gli2 and Gli3, leading to their ubiquitination and proteosomal degradation. This process is
thought to occur at the base of the primary cilium (Hui and Angers, 2011). While the proteolysis
17
of most of the Gli3 pool is incomplete, releasing its N-terminal repressor form, most Gli2
proteins are completely degraded. Gli3-repressor translocates to the nucleus and inhibits Hh
target gene expression. Gli1 is post-translationally regulated by a proteolytic mechanism distinct
from that of Gli2 and Gli3, but producing similar results (Hui and Angers, 2011). Glis are
normally sequestered to the basal body of the primary cilium by negative Hh pathway regulator
Suppressor of fused (Sufu), which has the dual effect of preventing their nuclear translocation
and promoting their degradation.
In vertebrates, Hh binding to Patched to derepress Smo is conserved (Figure 1.3). Vertebrates
have two copies of Patched, with Patched1 being the primary and necessary Hh receptor.
Duplication of the hedgehog gene in vertebrates produced three distinct loci each encoding a
distinct, Patched-binding Hh ligand: Sonic hedgehog (SHH), Indian Hedgehog and Desert
hedgehog. Binding of a Hedgehog ligand to Patched inactivates it and relieves its catalytic
inhibition of Smo (Taipale et al., 2002). Activated Smo is proposed to localize to the distal tip of
the primary cilium where it transduces the Hh signal within the cell (Corbit et al., 2005). Smo
promotes the dissociation of Glis from Sufu, preventing their proteosomal degradation and
freeing them from sequestration. Full-length activator forms of Gli accumulate and are carried by
kinesins including Kif7 along microtubules to the nucleus where they bind DNA in sequence-
specific fashion to modulate transcription. Gli2 is the primary activator of the Hh pathway (Hui
and Angers, 2011).
18
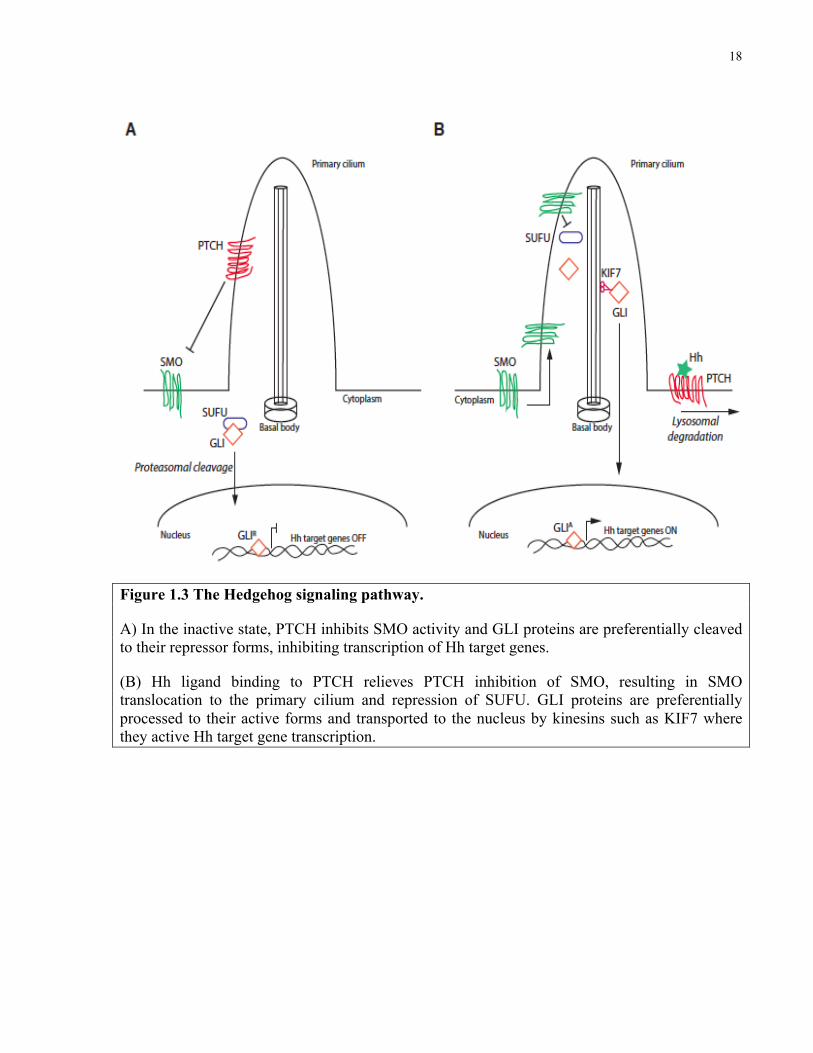
Figure 1.3 The Hedgehog signaling pathway.
A) In the inactive state, PTCH inhibits SMO activity and GLI proteins are preferentially cleaved to their repressor forms, inhibiting transcription of Hh target genes.
(B) Hh ligand binding to PTCH relieves PTCH inhibition of SMO, resulting in SMO translocation to the primary cilium and repression of SUFU. GLI proteins are preferentially processed to their active forms and transported to the nucleus by kinesins such as KIF7 where they active Hh target gene transcription.
19
1.2.4 Medulloblastoma
Medulloblastoma is a malignant brain tumour that arises in the cerebellum. Children are ten fold
more likely to be diagnosed with medulloblastoma than adults, leading to its definition as a
pediatric brain tumour (Smoll and Drummond, 2012). Medulloblastoma accounts for 16% of
pediatric brain tumour diagnoses and is the most common malignant pediatric brain tumour
(Ostrom et al., 2014). The incidence of medulloblastoma is approximately 1 in 141 000 children
aged 0-14 in the United States of America (McKean-Cowdin et al., 2013). Males are
disproportionately affected at a 1.4:1 male:female ratio (McKean-Cowdin et al., 2013) but
survival rates are equal between sexes (Davis et al., 1998). The name medulloblastoma was
given for tumour cells’ similar appearance to the multipotent blasts that line the medullary
epithelium of the developing neural tube (Bailey and Cushing, 1926). While tumours exhibit
significant intra- as well as intertumoural heterogeneity, medulloblastomas are primitive
neuroectodermal tumours comprised mostly of undifferentiated and neuronal-like cells with a
lesser glial cell component (Bailey and Cushing, 1926; Coffin et al., 1990). The contribution of
each of the heterogeneous cell types to tumour growth is unclear.
1.2.5 Medulloblastoma therapy
Medulloblastoma patients usually present with vomiting, headache, ataxia, and nausea (Crawford
et al., 2007). Patients undergo computerized tomography imaging and following surgical biopsy
medulloblastoma is formally diagnosed based on histological criteria (Louis et al., 2007). There
is a spectrum of differentiation in medulloblastoma histology with reticulum-rich Desmoplastic
tumours most differentiated, small, round blue cell ‘Classic’ medulloblastomas intermediate and
20
also most common, and Large Cell Anaplastic tumours considered least differentiated and most
aggressive (Huse and Holland, 2010; Louis et al., 2007). The three pillars of medulloblastoma
treatment are surgery, radiation and chemotherapy. Patients that are surgical candidates have
their tumours resected and are then classified as either high risk or intermediate risk based on
extent of resection (high risk is greater than 1.5cm3 residual disease) and metastatic status (high
risk patients have metastatic cells in the cerebrospinal fluid or visible metastatic lesions on
imaging) (Crawford et al., 2007). Treatment protocols, which vary from site to site, are generally
a variation on high dose 55 Gy irradiation to the posterior fossa and 23.4 Gy radiation to the
cerebrospinal axis followed by adjuvant chemotherapy for intermediate risk patients (Crawford
et al., 2007). High risk patients receive 36 rather than 23.4 Gy of central nervous system
irradiation and infants under the age of three are not irradiated irrespective of risk status
(Crawford et al., 2007). Chemotherapy is standard of care for all medulloblastoma patients and
consists of vincristine, cisplatin, lomustine, etoposide, cyclophosphamide and methotrexate alone
or in combination (Crawford et al., 2007; Gajjar et al., 2006; Grill et al., 2005). 5-year overall
survival for intermediate risk patients was 85% in a prospective trial of 134 children treated with
radiation and cyclophosphamide-based high dose chemotherapy with stem cell rescue (Gajjar et
al., 2006). 70% of high-risk patients enrolled in the trial were alive at 5 years. The relatively high
survival rates achieved with modern treatment protocols come at a significant cost to the patient.
Treatment induced morbidities include significant IQ decline and cognitive delay,
neuroendocrine disruption, motor deficits, emotional instability, and short stature (Mulhern et al.,
2004). Irradiation of the developing nervous system is particularly to blame and its effects are
dose dependent (Silber et al., 1992). Put bluntly, most survivors never reach their full potential,
21
lead a lesser quality of life and can constantly require care for secondary sequellae (Mulhern et
al., 2004). Medulloblastoma is a treatable and in many cases curable disease. Chemotherapy
alone can successfully treat some children with non-metastatic medulloblastoma who undergo
gross total resection, though drug toxicity is also related to neurocognitive impairment (Grill et
al., 2005; Rutkowski et al., 2005; von Bueren et al., 2011). The effects of current protocols
demand development of new, targeted therapies that will allow for de-escalation of today’s toxic
treatments.
1.2.6 Causes of medulloblastoma
The cause of most medulloblastomas is unknown. Maternal or infant radiation exposure as part
of medical diagnostic imaging has been associated with a modest but increased risk of
developing a pediatric brain tumour (Linet et al., 2009). Atomic bomb survivors (Preston et al.,
2002) and childhood cancer survivors (Hawkins et al., 1987; Little et al., 1998; Ron et al., 1988)
exposed to high doses of radiation had a significantly elevated incidence of brain tumours
including medulloblastoma. Ionizing radiation increased brain tumour risk in a dose dependent
manner in a study of 28 000 infants with skin hemangioma (Karlsson et al., 1998). Age of
exposure was a critical factor in all studies: patients irradiated at younger ages were more likely
to develop tumours. An early association between maternal consumption of N-Nitroso
compounds and pediatric brain tumour development (Preston-Martin et al., 1982) was not
significant in larger cohorts (Bunin et al., 1993; Bunin et al., 2005). Parental occupational
exposure to paints and other polycyclic aromatic hydrocarbons in the petroleum, automotive and
chemical sectors is associated with increased risk of childhood brain tumours in offspring (Colt
22
and Blair, 1998; Savitz and Chen, 1990). Maternal exposure to concentrated solvents was also
linked to offspring developing PNETs (Cordier et al., 1997). The most significant risk factors for
developing medulloblastoma are a series of genetic syndromes in which tumour suppressor genes
are mutated. Germline mutations in TP53 (Li-Fraumeni Syndrome), SUFU, APC (Turcot
Syndrome), and PTCH1 (Gorlin Syndrome) all predispose to medulloblastoma (Northcott et al.,
2012a). While syndromic patients are responsible for a minority of cases, the biological and
clinicopathological differences between the medulloblastomas that arise in different syndromes
have helped researchers understand intertumoural heterogenetiy at the molecular genetic level
(Searles Nielsen et al., 2008).
1.2.7 Medulloblastoma subgrouping
Large-cohort genome wide mutation and gene expression studies support grouping
medulloblastoma patients into four molecular categories: Wnt, Sonic hedgehog (SHH), Group 3
and Group 4 (Taylor et al., 2012). These subgroups emerged from retrospective analyses of
tumours in which intertumoural heterogeneity was better explained by differences in gene
expression, mutational spectra, and DNA methylation patterns than by conventional histology,
patient age, gender or metastasis stage (Cho et al., 2011; Kool et al., 2008; Northcott et al., 2011;
Schwalbe et al., 2013). Subgroups differ in key demographic and clinical categories including
patient age, outcome, propensity to metastasize and location of relapse (Ramaswamy et al.,
2013), leading to the conclusion that medulloblastoma is a diagnosis that comprises four distinct
diseases (Northcott et al., 2012b; Taylor et al., 2012). Wnt subgroup tumours make up
approximately 10% of diagnoses and are associated with favourable outcome. 30% of diagnoses
23
are SHH subgroup. SHH patients are most often either infants or adults. Group 4 tumours
account for 35% of medulloblastoma cases and, like their SHH-counterparts, 75% of Group 4
patients are alive 5 years after diagnosis. While Group 3 patients comprise only 25% of
diagnoses, this medulloblastoma subgroup experiences the worst outcomes: approximately 40%
of patients present with metastases and just 50% survive 5 years. Nuclear β-Catenin and DKK1
are robust immunohistochemical markers for identifying Wnt tumours while antibodies raised
against SFRP1, GLI1 and GAB1 all serve as SHH identifiers (Taylor et al., 2012). NPR4 and
KCNA1 immunoreactivity have been associated with Group 3 and Group 4 tumours,
respectively, though tumours from these groups are most reliably identified as those that cluster
with known Group 3 or 4 tumours based on gene expression or DNA methylation (Northcott et
al., 2011; Schwalbe et al., 2013; Taylor et al., 2012). The clinical utility of this novel
stratification scheme has yet to be demonstrated but holds promise for the development of
targeted, subgroup specific therapies.
1.2.8 Sonic hedgehog subgroup medulloblastoma
SHH group tumours are defined by deletions and loss of function mutations in negative
regulators and amplification or activating mutation in positive transducers of the SHH signaling
pathway. These mutations lead to ectopic expression of SHH target genes presumed to drive
growth. Multiple distinct mutations can activate the SHH pathway in medulloblastoma and are
usually mutually exclusive. PTCH1 encodes the transmembrane receptor Patched1 that binds
SHH ligand and is a negative regulator of the pathway (Chen and Struhl, 1996). Loss of function
mutation or genetic loss of PTCH1 occurs in 30% of SHH group tumours making it the most
24
common genetic event (Northcott et al., 2012a). Activating mutations in SMO, amplification of
the transcription factor GLI2 and inactivating mutations in SUFU are the most common
alternative mechanisms of SHH pathway activation (Kool et al., 2014). N-Myc is activated by
SHH signaling and its genetic locus MYCN is amplified in nearly 10% of SHH medulloblastomas
(Northcott et al., 2012a). 14% of SHH group tumours have inactivated p53 either by genetic loss
or inactivating mutation (Northcott et al., 2012a); many of these patients have Li-Fraumeni
syndrome (Rausch et al., 2012). Small molecule inhibitors of SHH signaling are well tolerated
by patients and have been touted as a subgroup specific treatment that represents the future of
medulloblastoma therapy. Two such agents undergoing separate clinical trials, LDE-225 and
GDC-0449, or vismodegib, block Smoothened, the serpentine G-protein coupled receptor and
positive signal transducer that is normally inhibited by Patched1. In preclinical studies, early
case reports and Phase 1 trials, Smoothened inhibitors effectively shrink tumour masses but are
not curative: animal models and patients almost uniformly relapse (Gajjar et al., 2013; Yauch et
al., 2009). In some cases, intense selection pressure results in outgrowth of resistant clones while
in other tumours with mutations activating the SHH pathway downstream of Smo, all cells may
be inherently resistant (Kool et al., 2014). Cell-type specific responses to Smo inhibitors and
their contribution to relapse have not been explored.
1.2.9 Mouse models of medulloblastoma
Animal models provide insight into disease aetiology and allow for functional interrogation and
preclinical testing of primary, spontaneous malignancies that is simply not achievable with
human samples or cell lines. Medulloblastoma mouse models are subgroup specific and are the
25
product of the introduction of genetic lesions causing human tumours into the murine germline
or specific cell types of the developing cerebellum (Huse and Holland, 2010). The wnt subgroup
can be modeled using Blbp-Cre;Ctnnb1+/lox(Ex3);Trp53flx/flx mice that develop medulloblastoma
with a 15% penetrance in one year (Gibson et al., 2010). Constitutively activating PI3K signaling
in this model by crossing it to Pik3caE545K mice generates tumours in 100% of animals by 85
days (Robinson et al., 2012). Glt1-tTA;TRE-MycN;Luc mice constitutively expressing MycN in
radial glial cells develop tumours that resemble Group 3 and Group 4 medulloblastoma (Wefers
et al., 2014). Trp53-/- GNPCs retrovirally transduced with Myc (Kawauchi et al., 2012) or
cerebellar stem cells infected with Myc and a dominant negative Trp53 (Pei et al., 2012) will
form Group 3-like tumours upon transplantation into immunodeficient mouse cerebella. There
are currently no spontaneous Group 3 tumour models.
More mouse models exist for SHH subgroup medulloblastoma than any other. The Ptch1
heterozygous mouse was generated by knock-in of a LacZ;neomycinr cassette to the first exon of
Ptch1 resulting in a loss of function allele (Goodrich et al., 1997). Ptch1+/- mice spontaneously
develop medulloblastoma with a penetrance of between 7 and 40%, depending on background
(Pazzaglia et al., 2009). Cre-mediated inactivation of both Ptch1 alleles in Ptch1flox/flox mice
produces medulloblastoma in 100% of Gfap-cre and Math1-cre mice (Yang et al., 2008).
Administering 3 Gy whole-body γ-irradiation to Ptch1+/- mice at birth increases the penetrance of
medulloblastoma from 7% to beyond 85% on the CD1 background (Goodrich et al., 1997;
Pazzaglia et al., 2002; Pazzaglia et al., 2009). Trp53 (Wetmore et al., 2001), Ink4c (Uziel et al.,
2005), Pten (Metcalfe et al., 2013), and Cdkn1b (Ayrault et al., 2009) are all tumour suppressor
genes whose deletion accelerates medulloblastoma formation and increases penetrance in
26
Ptch1+/- mice. Genetic inhibition of apoptosis via deletion of Pten (Metcalfe et al., 2013) or Bax
(Garcia et al., 2013) in Ptch1 mutants yields tumours with shorter latency but greater neuronal
differentiation. Shh-expressing retroviruses targeted to the E13.5 cerebellum (Weiner et al.,
2002) or Nestin+ cerebellar progenitors using the RCAS-TVA system cause medulloblastoma in
76 and 20% of mice, respectively. Point-mutant alleles encoding constitutively signaling
Smoothened variants, known as Smo:A1, Smo:A2, and Smo:M2 have been cloned from human
basal cell carcinomas (Reifenberger et al., 1998; Taipale et al., 2000; Xie et al., 1998). Driving
Smo:A1 or Smo:A2 expression with NeuroD1 promoter and enhancer elements causes
medulloblastoma in 50% of heterozygous and 100% of homozygous mice (Hallahan et al.,
2004). Induction of Smo:M2 expression from the ROSA26 locus in the progeny of neural stem
cells and GNPCs using Gfap-cre and Math1-cre, respectively, yields aggressive medulloblastoma
in all progeny (Schuller et al., 2008). Disruption of DNA repair (Uziel et al., 2005) or cell cycle
checkpoints (Lee et al., 2003; Marino et al., 2000; Uziel et al., 2006; Zindy et al., 2003) can
cooperate with trp53 loss to cause SHH group medulloblastoma without direct perturbation of
the SHH pathway. A transposon-mediated mutagenesis model of SHH medulloblastoma
generated for functional genomic studies develops highly aggressive tumours with common
leptomeningeal metastasis throughout the CNS (Wu et al., 2012). These mice undergo random
mutagenesis due to mobility of the Sleeping Beauty transposon on the backround of Ptch1+/- or
Trp53+/-.
Genomic analysis comparing subgroup specific mouse to human medulloblastomas confirmed
that Blbp-Cre;Ctnnb1+/lox(Ex3);Trp53flx/flx tumours faithfully match their wnt human counterparts
while Glt1-tTA;TRE-MycN;Luc medulloblastomas transcriptionally resemble Group 3 and not

27
Group 4 samples. All SHH models tested were more similar to adult than pediatric cases,
suggesting they may represent a subset of SHH diagnoses (Poschl et al., 2014). Both retrovirally
induced Group 3 models clustered with human SHH and not Group 3 tumours. Therefore, mice
can faithfully recapitulate the biology of human disease and whether the discrepancies are due to
poor modeling, difficulties in cross-species mapping or biases in human subgroup definition
must be investigated.
28
1.3 SOX2: the quintessential stem cell gene
1.3.1 The Sox2 gene
The discovery that Sox2 could reprogram fibroblasts to the embryonic stem cell state as part of a
cocktail of transcription factors cemented its reputation as an archetypal stem cell gene
(Takahashi and Yamanaka, 2006). Sry-related HMG box-containing 2 (Sox2) was cloned from a
mouse 8.5 days post conception cDNA library as part of a family of genes with homology to the
mammalian sex determining gene sry (Gubbay et al., 1990). The human SOX2 gene was later
cloned out of a fetal brain cDNA library using the mouse Sox2 cDNA as a probe (Stevanovic et
al., 1994). As the name suggests, SOX family members have a DNA-binding domain known as
the high-mobility group box (HMG) (Sinclair et al., 1990). The HMG family is over one billion
years old and is conserved from fungi to mammals (Laudet et al., 1993). HMG domains bind to
the minor groove of DNA in a sequence-specific manner, causing a bend in the DNA that alters
chromatin structure (Laudet et al., 1993; Pevny and Lovell-Badge, 1997). This can activate or
repress transcription. The common presence of an HMG box makes SOX genes a family of
transcription factors: 20 genes with diverse and sometimes overlapping roles in gene regulation,
subdivided into 9 subfamilies based on homology (Sarkar and Hochedlinger, 2013). Minimum
50% sequence similarity with Sry is required for SOX family status (Pevny and Lovell-Badge,
1997).
1.3.2 Function of the Sox2 gene
29
Sox2 is part of the SoxB1 family that includes Sox1 and Sox3. SoxB1 genes were initially
detected most robustly during development of the central nervous system, hinting they play key
regulatory roles in this dynamic process (Collignon et al., 1996). Sox2 is now known to be
required for multiple developmental and stem cell processes in systems ranging from the early
embryo to malignancy (Sarkar and Hochedlinger, 2013). Maternal and embryonic Sox2 are
expressed and required as early as the 2-cell stage embryo, where Sox2 knockdown prevents
trophectoderm formation and cavitation (Keramari et al., 2010). Pluripotent cells in the epiblast
are lost in pre-implantation Sox2 knockout embryos, making the deletion embryonic lethal
(Avilion et al., 2003). Embryonic stem cell (ESC) lines cannot be established from Sox2 null
embryos and deletion of Sox2 from established ESC cultures causes differentiation to the
trophoectoderm state (Masui et al., 2007). Therefore, Sox2 is required to maintain the pluripotent
stem cell state. Post-gastrulation, Sox2 is detected in neuroectoderm, sensory placodes, brachial
arches, gut endoderm and the primordial germ cells (Sarkar and Hochedlinger, 2013). Bipotent
axial stem cells are pushed to form neural plate at the expense of paraxial mesoderm by Sox2,
demonstrating its fundamental role in CNS formation (Takemoto et al., 2011). In development of
the central nervous system, a common theme applies to Sox2’s impact on stem/progenitor cells:
overexpression stimulates progenitor proliferation and knockdown or deletion triggers
precocious differentiation (Bylund et al., 2003; Ferri et al., 2004; Graham et al., 2003; Miyagi et
al., 2008). Retinal progenitor cells deficient for Sox2 prematurely exit the cell cycle and cannot
generate the mature neurons required for a functioning retina (Taranova et al., 2006). Sox2 is also
necessary for proper development of endoderm and mesoderm-derived structures including the
esophagus (Que et al., 2009) and dermal papilla (Driskell et al., 2009), respectively. Multiple
30
adult stem cell populations require Sox2 to maintain self-renewal. For example, Sox2 knockdown
in vitro (Cavallaro et al., 2008) or conditional ablation in vivo (Ferri et al., 2004) causes neural
stem cells to exit the cell cycle, downregulate stem cell markers including Nestin and Gfap, and
differentiate. Lineage tracing identified Sox2 expressing stem cells in the testes, glandular
stomach and lens (Arnold et al., 2011). Ectopic expression of SOX2 in terminally differentiated
somatic cells can reprogram them to the stem cell state. Overexpression of SOX2 in mouse or
human fibroblasts reprograms them to the neural stem cell state (Ring et al., 2012) and in vivo
induction of Sox2 in adult mouse astrocytes reprograms them into neural stem cell-like
neuroblasts (Niu et al., 2013). In at least some cases, Sox2 is not only necessary but also
sufficient to maintain the self-renewing state.
In humans, SOX2 is found on chromosome 3q and its mutation causes anophthalmia or
micropthalmia, a severe eye malformation (Fantes et al., 2003). Germline mutations can also
cause hearing loss (Hagstrom et al., 2005), brain abnormalities (Hagstrom et al., 2005),
hypogonadism (Williamson et al., 2006), esophageal atresisa (Williamson et al., 2006) and
ocular coloboma (Wang et al., 2008), indicating that SOX2 functions similarly to its mouse
homologue. SOX2 is amplified in 23% of squamous cell and small cell lung cancers, 15% of
esophageal cancers and 14% of glioblastomas (Annovazzi et al., 2011; Bass et al., 2009; Rudin
et al., 2012), presumably being selected to upregulate embryonic gene expression programs that
drive tumour growth. Chromosome 3q is commonly amplified in SHH medulloblastoma but
focal amplifications of SOX2 have not been detected (Shih et al., 2014). Amplification serves to
upregulate SOX2 expression that, as in somatic stem cells, is required to maintain self-renewal in
glioma stem cells and proliferation in small cell lung cancer (Rudin et al., 2012) and
31
medulloblastoma cells (Ahlfeld et al., 2013). Human squamous skin cancers also overexpress
SOX2, though the gene itself is not amplified (Boumahdi et al., 2014). Sox2 is one of the most
highly expressed genes in DMBA/TPA induced mouse squamous skin cancers compared to
normal epidermis. Conditional ablation of Sox2 from K14-creER:SOX2fl/fl mouse tumours
virtually abolishes established low-grade skin papillomas, which almost completely regress
within two weeks. In higher-grade squamous skin cancers, tumour growth stagnates following
tamoxifen administration. Sox2 conditional knock-out tumours have considerably lower
frequencies of tumour-propagating cells, indicating that the gene not only controls growth, but
also self-renewal. Loss of Sox2 from squamous skin tumours results in downregulation of
stemness, proliferation, pro-survival and invasion related genes (Boumahdi et al., 2014). SOX2
likely maintains self-renewal in the other malignancies in which the gene is commonly amplified
and overexpressed. Therefore, understanding the role of SOX2 in one disease may have broad
clinical relevance given its widespread expression in human cancers.
1.3.3 Regulation of the SOX2 protein
The SOX2 protein is 317 amino acids and contains a 79 amino-acid HMG box DNA binding
domain (Miyagi et al., 2009). Amino acid changes in S83 and E93 of the HMG domain or Q177
impair SOX2 binding to DNA (Fantes et al., 2003). Like other Sox family members, its binding
sites are enriched in the 5’-A/TA/TCAAA/TG-3’ motif (Harley et al., 1994). Post-translational
modifications alter Sox2’s interaction with other proteins, subcellular localization, stability and
affinity for DNA (Sarkar and Hochedlinger, 2013). Sox2 phosphorylation at serines 246 or 249,
250 and 251 induces its sumoylation at lysine 247 (Van Hoof et al., 2009). In ESCs, this impairs
32
its DNA binding and decreases expression of target genes including FGF4 (Tsuruzoe et al.,
2006). Reprogramming to pluripotency requires Akt to phosphorylate Sox2, stimulating it to
activate the embryonic stem cell regulatory network (Jeong et al., 2010). Prkcι phosphorylation
of Sox2 in squamous cell lung cancer stem cells stimulates Sox2’s nuclear translocation that
activates a pro-self-renewal autocrine SHH signaling loop (Justilien et al., 2014). Therefore,
phosphorylation effects are site- and context-specific. p300/cAMP-response-element-binding
protein can phosphorylate Sox2 at lysine 75 (Baltus et al., 2009). Acetylation of Sox2 in
embryonic stem cells promotes its nuclear export and subsequently cellular differentiation
(Baltus et al., 2009). Strangely, histone deacetylase inhibitors can promote chemical
reprogramming, though this may not be SOX2-dependent (Han et al., 2010). Self-association of
Sox2 is increased when methylated at arginine 113 by coactivator-associated arginine
methyltransferase 1 in embryonic stem cells (Zhao et al., 2011). Ubiquitination is influenced by
other post-translational modifications and targets SOX2 for proteasomal degradation
(Ramakrishna et al., 2014). Interestingly, SOX2 was recently found to interact with and require
the long noncoding RNA RMST to regulate transcription of 89 genes during in vitro neurogenesis
(Ng et al., 2013).
Context dependent interactions with other transcription factors ultimately determine the function
of SOX2. SOX2 does not function in isolation and only alters chromatin conformation and gene
expression when acting with a partner transcription factor. Therefore, cell context specific
protein-protein interactions and post-translational modifications determine which of SOX2’s
transcriptional programs will be activated. A ChIP-seq comparison of Sox2 binding sites in
isogenic ESCs and NSCs found just 5% overlap between the two cell types (Lodato et al., 2013).
33
In embryonic stem cells SOX2 physically interacts with OCT3/4 to drive expression of a
network of pluripotency genes (Nishimoto et al., 1999). Sox2 and Chd7 are part of a complex in
neural progenitor cells that regulates genes essential to neural development including Jag1, Gli3
and Mycn (Engelen et al., 2011). Sox2 promotes the NSC state by acting together with a number
of other neural-specific transcription factors including Brn2 (Tanaka et al., 2004) and Tlx
(Tanaka et al., 2004) to activate stem cell and repress differentiation genes. The extent to which
these studies describe distinct partnerships versus one or two Sox2-protein complexes that
include each co-factor is unknown. Development of the cornea requires Sox2-Pax6 interaction to
upregulate lens-specific genes like Crygd (Kamachi et al., 2001). In glioblastoma cell lines,
SOX2 interacts with a number of ribonuclear proteins indicating it may function in post-
transcriptional modification in addition to its traditional role as a transcription factor (Fang et al.,
2011).
34
1.4 Cellular quiescence
1.4.1 Overview
Cells can reversibly withdraw from the cell cycle and enter the G0 or ‘quiescent’ phase. In his
studies on the proliferation of primary liver cell cultures, Lajtha observed that a wave of
proliferation began after a defined period post-explant (Lajtha, 1963). He reasoned that if cells
were distributed throughout the cell cycle there would be no synchronous delay prior to division:
the cells that had nearly completed mitosis would be the first to divide. Lajtha defined the new
cell cycle phase G0, predicting that it came prior to the G1 growth phase that precedes DNA
synthesis. Models were quickly generated to show that a quiescent stem cell could lie at the root
of tissues producing considerable numbers of new cells, such as the hematopoietic system
(Lajtha et al., 1962). Such models are dependent on a cell that can integrate diverse pro and anti-
growth signals as part of a feedback circuit that maintains homeostasis. Since this time, a
multitude of assays have been developed to show that many but not all adult tissues contain
quiescent stem cells with the greatest capacity for long-term lineage reconstitution (Li and
Clevers, 2010). Furthermore, cancer stem cells in multiple malignancies are quiescent, posing a
considerable therapeutic challenge as most conventional interventions target cycling cells.
1.4.2 Detecting quiescent cells
Detection of quiescent cells usually involves functional assays that exploit their low frequency of
cell division. Most simply, quiescent cells are determined to be negative for the proliferation
marker Ki67 – a nucleolar protein exclusively expressed in cells from early G1 through to M
35
phase (Scholzen and Gerdes, 2000). Quiescent cells transcribe fewer RNAs than cycling cells
and this can be measured using fluorescent RNA binding dyes including Pyronin Y. Pyronin Y
low/Ki67- or Pyronin Y low cells with 2n DNA content are classified as G0. Many functional
assays depend on incorporation of thymidine analogues into the DNA of dividing cells as they
pass through S-phase. DNA labels are partitioned equally amongst daughter cells at division and
can be diluted over time following 4-5 exponential decays. In the presence of a thymidine
analogue, quiescent cells are less likely to become labelled than their cycling peers. In contrast,
during a ‘chase’ period following labelling, if quiescent cells were previously marked with a
thymidine analogue they will undergo fewer label-diluting divisions and are thus label-retaining.
Pulse-chase labeling with thymidine analogues including H3-thymidine, BrdU, and EdU has been
used to identify quiescent cells in many tissues including the bone marrow, intestinal crypt, hair
follicle and subventricular zone (Li and Clevers, 2010). Label-retaining cells are not necessarily
quiescent, as some stem cell populations can selectively maintain ‘immortal’ template strands of
DNA that will remain labelled through multiple replication cycles (Karpowicz et al., 2005).
Testing the kinetics of label uptake and dilution is important to rule out label-retention by
immortal-strand segregation.
Most thymidine analogue labeling requires cell fixation prior to detection, prohibiting functional
analysis. Recent studies have addressed this problem by using fluorescently labelled thymidine
analogues. Other label-chase approaches involve pulsing cells with fluorescent cytoplasmic or
cell membrane dyes, such as CFSE or PKH26, respectively. Similar principles apply, for on
average cells partition equal quantities of cytoplasm and membrane, and thus label, to both
daughters. By chasing a labelled population over time, cells that maintain their fluorescence can
36
be isolated by FACS as quiescent, label-retaining cells. Several caveats include: cells may share
cytoplasmic contents or membrane by exchanging vesicles and variable protein turnover can
produce differences in signal loss between cells. Most importantly, labelling with these dyes
must be done ex vivo, precluding study of primary tissues without manipulation. Doxycyline
inducible expression of a fluoresecently tagged core histone protein H2B is routinely used to
label cells in situ. Following incorporation into nucleosomes, tagged H2B will be divided equally
amongst daughter cells. New nucleosomes are required during DNA synthesis and thus
fluorescence declines exponentially with each division. Fluorescent H2B expression is either
turned on by administering doxycycline during a defined label in a Tet-ON system or
doxycycline is used to initiate and maintain a chase in an otherwise constitutively transcribed
Tet-OFF system. FACS effectively identifies label-retaining cells in both systems. Recently, an
elegant approach showed that label-retaining cells in the mouse intestinal crypt only function as
stem cells after injury (Buczacki et al., 2013). An inducible form of cre-recombinase was fused
to H2B and in a pulse-chase experiment was only active in quiescent +4 crypt cells. Lineage
traces from label-retaining cells showed multilineage potential after injury but not during
homeostasis.
1.4.3 Quiescence and self-renewal
Self-renewing cells are quiescent in many tissues. An elegant early demonstration of this
principle in the hematopoietic system came from Becker and colleagues who showed that killing
off dividing cells with a 20 minute H3-thymidine pulse impaired spleen colony formation in
irradiated mice injected with fetal liver cells but not adult bone marrow or spleen (Becker et al.,
37
1965). The interpretation was that colony-forming cells are cycling during development but
quiescent during adult homeostasis; this conclusion is supported by subsequent studies. H3-
thymidine or BrdU label-retaining cells were later found in stem cell niches such as the intestinal
crypt (Potten, 1977; Potten et al., 1974) and hair follicle bulge (Cotsarelis et al., 1990). Visual
tracking of H2B:GFP-retaining hair follicle stem cells showed that they are the multipotent stem
cells that generate a new hair follicle during anagen (Tumbar et al., 2004). While functional
analysis of the intestinal stem cell niche has produced conflicting results, it appears that in
homeostasis the intestinal stem cell is actively dividing but that after injury quiescent cells can
completely regenerate damaged crypts (Buczacki et al., 2013). Neural stem cells of the murine
subventricular zone and dentate gyrus are also slowly cycling. The subventricular zone stem cell
was identified based in part on its neurogenic capacity following proliferative ablation with ara-c
(Doetsch et al., 1997). In the adult dentate gyrus, BMP-signaling through BMPR1A is required
to maintain neural stem cell quiescence and self-renewal (Mira et al., 2010). Interestingly,
deletion of Cdkn1a from mouse neural stem cells activated their proliferation, increasing the
number of neurospheres that could be derived from the brains of young mice but decreasing the
number of neurosphere-forming cells in adults (Kippin et al., 2005). Similarly, deletion of
Cdkn1a from hematopoietic stem cells caused their proliferative exhaustion in serial
transplantation experiments and impaired animals’ ability to respond to myelotoxic stress (Cheng
et al., 2000). Quiescence may be a mechanism regulating self-renewal in multiple populations.
Another interpretation is that certain stem cell populations do not self-renew indefinitely but
rather reach their own ‘Hayflick limit’ after constant, unrestrained division. Keeping cells
38
quiescent except when absolutely required would prevent them from reaching this limit during a
normal lifespan.
1.4.4 Mechanisms regulating quiescence
Quiescence is an actively maintained state with a distinct transcriptional and metabolic profile
(Coller, 2011). Logically, many of the genes discovered to play a role in quiescence are known
to regulate progression checkpoints during G1 phase in cycling cells. Many of these genes can
also function as tumour suppressors. Cdkn1a, or p21, blocks S phase entry at the G1-S
checkpoint and when its encoding gene Cdkn1a is deleted in mice both neural stem cells and
hematopoietic stem cells break their quiescence to enter cycle (Kippin et al., 2005; Cheng et al.,
2000). In human hematopoietic stem cells, proliferative signals activate CDK6 to cause transition
from quiescence to G1 (Laurenti et al., 2015). In colon cancer stem cells ID1/ID3 activate p21 to
restrict cell cycling and maintain self-renewal (O'Brien et al., 2012). Therefore, p21 does not
always act as a tumour suppressor but can also promote cancer progression by preserving
quiescent stem cells. p57 and p27 collaborate with p21 to regulate hematopoietic stem cell exit
from quiescence in part by preventing nuclear import of Cyclin D complexes that lead to Rb
phosphorylation and cell cycle progression (Matsumoto et al., 2011; Zou et al., 2011). While p21
and p27 are both highly expressed in quiescent, label-retaining muscle stem cells, only p27 is
required to maintain the quiescent population (Chakkalakal et al., 2014). Curiously, loss of p21
predominantly affected the cycling muscle stem cell population, impairing their differentiation.
Deletion of the tp53 tumour suppressor protein in mice activated neural stem cell and
hematopoietic stem cell cycling (Gil-Perotin et al., 2006; Liu et al., 2009). The discovery that
39
p16(INK4a) expression pushes quiescent muscle stem cells into irreversible senescence
highlights that quiescent cells are tightly regulated – they are not simply produced by an
abundance of negative cell cycle regulators (Sousa-Victor et al., 2014).
Factors beyond the canonical cell cycle genes actively maintain quiescent stem cell
populations. Target of rapamycin (TOR) and its mammalian homologue (mTORC1) integrate
diverse growth and nutritional signals to regulate cell metabolism and cycling. In quiescent stem
cells as divergent as Drosophila neuroblasts and mouse muscle stem cells, TOR or mTORC1
activity, respectively, mobilizes cells from quiescence to enter G1 (Rodgers et al., 2014; Sousa-
Nunes et al., 2011). The ubiquitin ligase Fbxw7 decreases c-Myc levels in CML stem cells
relative to tumour bulk by targeting it for proteasomal degradation (Takeishi et al., 2013).
Reduced c-Myc preserves quiescence of the self-renewing fraction. The RING-type zinc finger
transcription factor PML also contributes to CML stem cell quiescence, though its target genes
have not been identified in this context (Ito et al., 2008). MicroRNAs (miRs) govern several cell
cycle checkpoints by restricting expression of key target genes. miR-489 is highly expressed in
quiescent muscle stem cells and rapidly down regulated upon activation (Cheung et al., 2012).
Another microRNA promoting muscle stem cell quiescence, miR-31, is sequestered in granules
within quiescent cells along with one of its target RNAs, Myf5 (Crist et al., 2012). Upon receipt
of a proliferative stimulus, granules dissociate and miR-31 levels decrease, allowing rapid
translation of Myf5 RNA and cell cycle entry. This is an excellent example of how quiescent
cells can be primed for proliferation, further distinguishing them from senescent cells. miR-126
dampens the hematopoietic stem cell response to extracellular growth signals by inhibiting the
PI3K/AKT/GSK3β pathway which prevents cell cycle entry (Lechman et al., 2012). mTORC1
40
also regulates PI3K/AKT/GSK3β signaling, making this another example of mTORC1
regulation of the G0-G1 transition. Surprisingly, blocking miR-126 activity using lentiviral
sponges increased HSC cycling and expanded the stem cell pool without decreasing cells’
capacity to self-renew. This suggests that the quiescent state can have separate effects on cell
proliferation and self-renewal. The genes and pathways described herein are not meant to be an
exhaustive list of the factors regulating stem cell quiescence. Rather, the redundancy and
ubiquity of some molecules should demonstrate that multiple disparate stem cell populations can
use common mechanisms to stay in the G0 quiescent state.
1.4.5 Quiescent cancer stem cells: evidence and therapeutic implications
Just as not every malignant cell can continually propagate a tumour, not every malignant cell
divides with the same frequency. This has considerable implications for understanding cancer
stem cell biology and for curing disease. In Clarkson et al.’s H3-thymidine labelling studies of
leukemia patients, continuous infusion for 10 days was insufficient to label 100% of malignant
blasts (Clarkson et al., 1970). It was not possible to distinguish between the unlabeled cells being
terminally differentiated, completely dormant, or having an average cell cycle time of
considerably longer than 10 days. However, they did suppose that the unlabeled population of
quiescent cells was not significantly contributing to division based on the kinetics of label uptake
in large blasts of the bone marrow. In mice bearing grafts of the autochthonous breast cancer
C3H, continuous infusion of H3-thymidine for 7 days labelled a maximum of 90% of cells
(Mendelsohn, 1962). Tumours were first examined 4 days after labelling, unfortunately allowing
for the possibility that unlabeled cells had simply divided multiple times to dilute out H3-
41
thymidine, and the conclusion was made that a subpopulation of breast cancer cells divides less
frequently than once per week. Quiescent, label-retaining cells have since been identified in
numerous malignancies, including pancreatic adenoma (Dembinski and Krauss, 2010), ovarian
adenocarcinoma (Gao et al., 2010; Kusumbe and Bapat, 2009), glioma (Deleyrolle et al., 2011)
and melanoma (Roesch et al., 2010). Rare, relatively quiescent melanoma cells expressing
JARID1B were enriched for clonogenicity and required for sustained tumour growth (Roesch et
al., 2010). However, JARID1B- cells could interconvert with the JARID1B+ pool, arguing
against a strict hierarchy driven by a quiescent melanoma stem cell. Quiescent cells isolated from
in vitro cultures of human CML cells (Holyoake et al., 1999) and human AML samples (Guan et
al., 2003) showed the greatest self-renewal in colony forming and in vivo limiting dilution
assays, respectively. Since most chemotherapies target cycling cells, quiescent cells with
clonogenic potential are likely to be major contributors to disease relapse.
Chronic myeloid leukemia (CML) is a prime example of a disease fueled by quiescent,
chemoresistant cancer stem cells. Imatinib mesylate (STI571 or Glivec) is an inhibitor of the
tyrosine kinase abl that is aberrantly activated by genomic rearrangement in CML. While it is
potent and effective at controlling disease burden and eradicating proliferating blasts from the
blood and marrow, patients often relapse if therapy is discontinued. One explanation for this is
that quiescent CML stem cells are not killed by Imatinib and can reconstitute the malignant clone
after treatment (Graham et al., 2002). Likewise, CD34+ CD38- AML stem cells in the endosteal
niche were resistant to ara-c in mouse xenografts (Ishikawa et al., 2007). Quiescent nestin+ cells
in Nf1+/-; Pten+/-; trp53+/- mouse glioma survived the alkylating agent temozolomide that
eradicated the cycling tumour bulk and began to proliferate following treatment, presumably to
42
regrow the tumour (Chen et al., 2012). Genetically ablating nestin+ cells in parallel to eradicating
cycling cells with temozolomide prolonged mouse survival to a greater extent than either
treatment alone. In primary human glioblastoma cells, expression of a stem cell signature was
inversely correlated with cell cycling, supporting the mouse data and suggesting that the glioma
propagating cell is quiescent. In a medulloblastoma mouse model, nestin+ cells in the
perivascular niche withdrew from cell cycle in response to radiation but by three days post-
treatment had reentered the cell cycle (Hambardzumyan et al., 2008). The Akt inhibitor
perifosine sensitized these cells to radiation in another example of the efficacy of parallel
targeting of quiescent and cycling cells. Inducing CD34+ CD38- cells to divide in culture with
granulocyte-colony stimulating factor (G-CSF) improved the pro-apoptotic effects of Imatinib
(Holtz et al., 2007). Similarly, genetically or pharmacologically inactivating promyelocytic
leukemia (PML) in a mouse model of CML eradicated quiescent leukemia stem cells (Ito et al.,
2008). In AML xenografts, leukemia propagating cells could be virtually eliminated with ara-c
after being stimulated to divide with G-CSF (Saito et al., 2010). Collectively, these studies show
the significant therapeutic potential for targeting quiescent cancer stem cells in parallel to their
proliferating progeny.
43
1.5 Specific aims and hypotheses
Medulloblastoma is a heterogeneous disease. How this heterogeneity reflects the determinants of
tumour growth and contributes to treatment resistance is unclear. Primary tumour cells exhibit
functional heterogeneity in sphere-forming and orthotopic transplantation assays, as the markers
CD133 and CD15 can prospectively enrich for tumour-propagating cells from mouse and human
medulloblastoma, respectively. The identity, biology and growth contribution of these cells to
primary tumours is unclear. Here I used thymidine analogue labelling, cell transplantation, and
lineage tracing to investigate the mechanism of medulloblastoma growth and relapse in the
Ptch1+/- mouse. Molecular profiling and cell culture of primary human medulloblastomas were
used for clinical validation and drug screening to identify new therapeutic approaches addressing
tumour heterogeneity.
Specific Aim 1: To define the kinetic properties and self-renewal potential of Ptch1+/-
medulloblastoma’s constituent cell types.
I hypothesize that phenotypically distinct cell types within Ptch1+/- medulloblastoma will cycle at
different rates and differentially contribute to tumour growth. Defining the biology of the cell
types that comprise medulloblastoma will provide a model for the mode of tumour growth and
identify cells that must be eradicated by therapy.
Specific Aim 2: To determine the cell-type specific effects of medulloblastoma therapy and how
these can be addressed to improve treatment efficacy.
44
I hypothesize that therapy will differentially effect the phenotypically distinct cell populations
within medulloblastoma. Cells that are less sensitive to therapy are predicted to be enriched by
treatment and thus more likely to contribute to tumour relapse. If a particular biology is
associated with treatment resistance, this cell’s properties may be associated with worse outcome
in human patients. Targeting the biology of the resistant cell may yield a novel therapeutic
strategy to prevent the recurrence of medulloblastoma.
45
Chapter 2 Defining the mode of Ptc medulloblastoma growth
2.1 Published material and author contributions
Sections of this chapter have been published as:
Vanner RJ, Remke M, Gallo M, Selvadurai HJ, Coutinho F, Lee L, Kushida M, Head R,
Morrissy S, Zhu X, Aviv T, Voisin V, Clarke ID, Li Y, Mungall AJ, Moore RA, Ma Y, Jones
SJM, Marra MA, Malkin D, Northcott PA, Kool M, Pfister SM, Bader G, Hochedlinger K,
Korshunov A, Taylor MD, Dirks PB. 2014. Quiescent Sox2+ Cells Drive Hierarchical Growth
and Relapse in Sonic Hedgehog Subgroup Medulloblastoma. Cancer Cell 26(1):33-47.
Portions of text and figures have been reproduced in this chapter with permission from Cancer
Cell.
I conducted all experiments and data analysis for the results described in this chapter. L Lee, HJ
Selvadurai and X Zhu provided assistance with animal care. M Gallo, ID Clarke and T Aviv
made intellectual contributions. K Hochedlinger provided Sox2creER mice. Experiments were
conducted in the laboratory of Dr. Peter B Dirks who helped to conceive of and supervised the
project.
46
2.2 Introduction
Medulloblastoma was named for its histological similarity to the embryonic brain (Bailey
and Cushing, 1925) and exhibits significant intratumoral heterogeneity. How this heterogeneity
reflects the determinants of tumour growth and contributes to treatment resistance is unclear. The
constituent MB cell types heterogeneously express stem, astroglial and neuronal markers, and
their contributions to tumour growth are undefined. Both mouse and human MBs are
functionally heterogeneous for the ability to self-renew in tumor-propagating cell assays (Read et
al., 2009; Singh et al., 2004; Ward et al., 2009). Primary CD133+ cells from human
medulloblastomas formed xenografts when injected into the brains of immunodeficient mice
while CD133- cells from the same patients were not tumour-forming (Singh et al., 2004).
Similarly, CD15+ cells from Ptch1+/- mouse medulloblastomas were significantly enriched for in
vitro sphere-forming and orthotopic tumour-propagating cells (Read et al., 2009; Ward et al.,
2009). CD15 immunostaining in primary Ptc tumours was noted to be higher at the tumour
periphery, though co-expression of other markers was not tested. Therefore, in both human and
mouse tumours, the medulloblastoma-propagating cell can be prospectively identified from
dissociated tumours, but its in situ identity is unknown. Furthermore, whether and how the cell
that propagates medulloblastoma in a transplantation assay contributes to growth in the tumour
from which it was derived is not clear. The hierarchical growth paradigm for many cancers has
been inferred based on the presence of non-transplantable cells in the in vivo grafts generated by
prospectively-identified transplantable cells (Bonnet and Dick, 1997; Meacham and Morrison,
2013). The limitations of this assay lead to several key questions, including: do transplantable
47
cells differentiate into the non-transplantable cell types in primary tumours? If so, does this occur
in a unidirectional, hierarchical fashion?
These questions can be answered by combining functional assays of dissociated tumour
cells with careful characterization of primary tumours. First, it is essential to establish the
phenotype of the tumour’s constituent cell types. Which markers are expressed and what are the
properties of the cells expressing those markers? Ptch1+/- mouse medulloblastomas contain cells
expressing neuronal, astroglial and neural stem cell markers. While the resemblance to the
developing cerebellum was noted, whether any of the neuronal cells terminally differentiate and
express markers of the functional neurons in the adult cerebellum was not tested. Little is known
about the kinetic properties of phenotypically distinct medulloblastoma cells. Thymidine
analogue labeling is an effective method for kinetic analyses of primary tumours, can be used to
define the cycling properties of distinct cell types within a hierarchy, and pairs well with
immunostaining of primary tumour sections. A prior study reported that medulloblastoma cells
expressing the neural stem cell marker nestin withdraw from cell cycle in response to radiation,
though their tumor-propagating capacity was not defined (Hambardzumyan et al., 2008). Since
quiescent, self-renewing cancer cells have been identified in several malignancies (Guan et al.,
2003; Holyoake et al., 1999; Roesch et al., 2010; Saito et al., 2010) and are often resistant to
conventional chemotherapy and radiation, further characterization of a potential quiescent
medulloblastoma population is desirable.
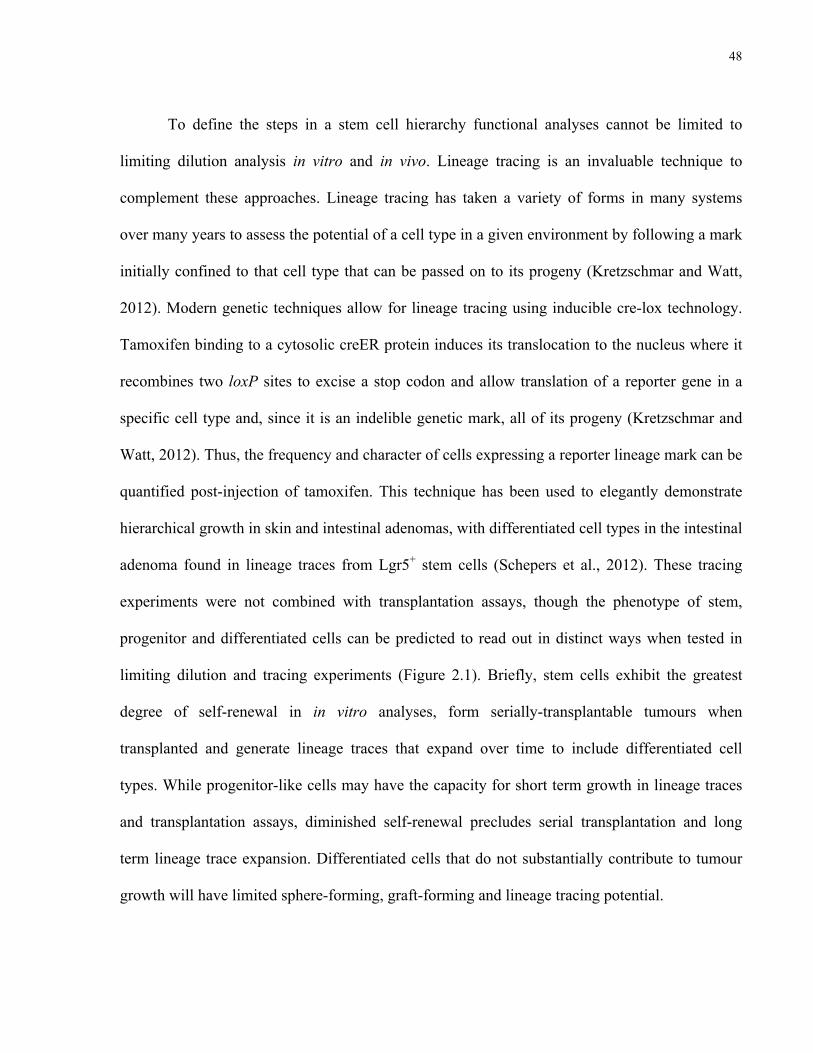
48
To define the steps in a stem cell hierarchy functional analyses cannot be limited to
limiting dilution analysis in vitro and in vivo. Lineage tracing is an invaluable technique to
complement these approaches. Lineage tracing has taken a variety of forms in many systems
over many years to assess the potential of a cell type in a given environment by following a mark
initially confined to that cell type that can be passed on to its progeny (Kretzschmar and Watt,
2012). Modern genetic techniques allow for lineage tracing using inducible cre-lox technology.
Tamoxifen binding to a cytosolic creER protein induces its translocation to the nucleus where it
recombines two loxP sites to excise a stop codon and allow translation of a reporter gene in a
specific cell type and, since it is an indelible genetic mark, all of its progeny (Kretzschmar and
Watt, 2012). Thus, the frequency and character of cells expressing a reporter lineage mark can be
quantified post-injection of tamoxifen. This technique has been used to elegantly demonstrate
hierarchical growth in skin and intestinal adenomas, with differentiated cell types in the intestinal
adenoma found in lineage traces from Lgr5+ stem cells (Schepers et al., 2012). These tracing
experiments were not combined with transplantation assays, though the phenotype of stem,
progenitor and differentiated cells can be predicted to read out in distinct ways when tested in
limiting dilution and tracing experiments (Figure 2.1). Briefly, stem cells exhibit the greatest
degree of self-renewal in in vitro analyses, form serially-transplantable tumours when
transplanted and generate lineage traces that expand over time to include differentiated cell
types. While progenitor-like cells may have the capacity for short term growth in lineage traces
and transplantation assays, diminished self-renewal precludes serial transplantation and long
term lineage trace expansion. Differentiated cells that do not substantially contribute to tumour
growth will have limited sphere-forming, graft-forming and lineage tracing potential.
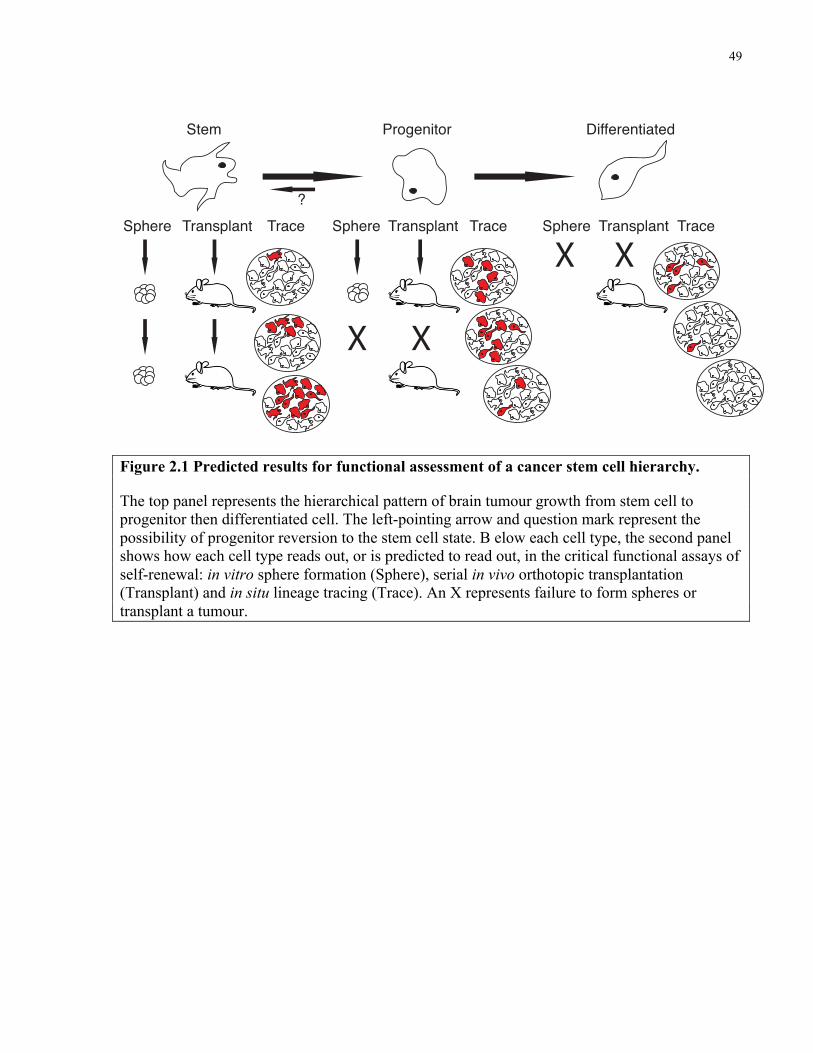
49
Figure 2.1 Predicted results for functional assessment of a cancer stem cell hierarchy.
The top panel represents the hierarchical pattern of brain tumour growth from stem cell to progenitor then differentiated cell. The left-pointing arrow and question mark represent the possibility of progenitor reversion to the stem cell state. B elow each cell type, the second panel shows how each cell type reads out, or is predicted to read out, in the critical functional assays of self-renewal: in vitro sphere formation (Sphere), serial in vivo orthotopic transplantation (Transplant) and in situ lineage tracing (Trace). An X represents failure to form spheres or transplant a tumour.
X
X
X
XSphere Sphere SphereTransplant Transplant TransplantTrace Trace Trace
Stem Progenitor Differentiated
?
Figure 1
50
In this first chapter my aim is to define the kinetic properties and self-renewal potential of
Ptch1+/- medulloblastoma’s constituent cell types. To this end, Ptch1+/- mouse medulloblastoma
was interrogated using immunohistochemical characterization, thymidine analogue labeling, cell
transplantation and lineage tracing. I hypothesize that phenotypically distinct cell types within
Ptch1+/- medulloblastoma will cycle at different rates and differentially contribute to tumour
growth. Defining the biology of the cell types that comprise medulloblastoma will provide a
model for the mode of tumour growth and identify the cells that must be eradicated by therapy.
51
2.3 Methods
Mice
Ptch1+/- mice (Goodrich et al., 1997) were maintained by breeding with CD1 mice from The
Jackson Laboratory. Sox2creER mice (Arnold et al., 2011) and Sox2-eGFP mice (Ellis et al.,
2004) (provided by Dr. Freda Miller, Toronto Hospital for Sick Children) were crossed to CD1
Patched1+/- mice. B6;129S6-Gt(ROSA)26Sortm9(CAG-tdTomato)Hze/J (Rosa-CAG-LSL-tdTomato) and
5-7 week old NOD.Gc-Prkdcscid Il2rgtm1Wjl/SzJ (NSG) mice were purchased from The Jackson
Laboratory. C57BL/6J-Tg(DCX-cre/ERT2)1Mull/Mmmh mice were obtained from the
MMRRC and called DCXcreER1. DCX-BAC-CreERT2 mice were a generous gift from Hongjun
Song and named DCXcreER2. Experimental Ptc mice were administered 3Gy γ-radiation from a
Cesium-137 source at birth. Cre-recombination for lineage tracing was achieved by injecting 6
week old mice intraperitoneally with 5 mg tamoxifen (Sigma) dissolved in sesame oil. Mice
were housed at The Hospital for Sick Children Laboratory Animal Services. To chronically label
tumours with EdU mice were administered 0.82 mg/mL EdU (Invitrogen) drinking water
protected from light. CldU (0.74mg/mL) and IdU (1mg/mL) were administered in the same
manner. Water was refreshed daily for all thymidine analogues given. For single-dose EdU
labeling, mice were injected intraperitoneally with 30mg/kg EdU in 0.9% saline. All
experimental procedures were approved by The Hospital for Sick Children’s Animal Care
Committee.
FACS and flow cytometry
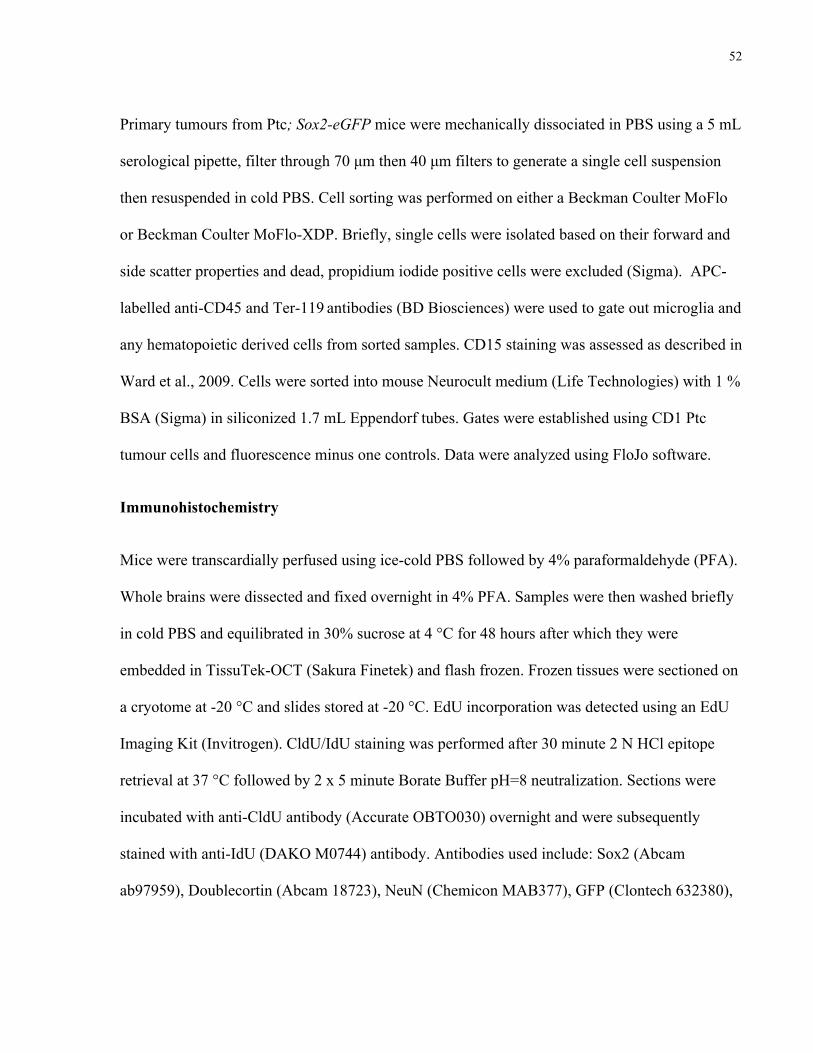
52
Primary tumours from Ptc; Sox2-eGFP mice were mechanically dissociated in PBS using a 5 mL
serological pipette, filter through 70 µm then 40 µm filters to generate a single cell suspension
then resuspended in cold PBS. Cell sorting was performed on either a Beckman Coulter MoFlo
or Beckman Coulter MoFlo-XDP. Briefly, single cells were isolated based on their forward and
side scatter properties and dead, propidium iodide positive cells were excluded (Sigma). APC-
labelled anti-CD45 and Ter-119 antibodies (BD Biosciences) were used to gate out microglia and
any hematopoietic derived cells from sorted samples. CD15 staining was assessed as described in
Ward et al., 2009. Cells were sorted into mouse Neurocult medium (Life Technologies) with 1 %
BSA (Sigma) in siliconized 1.7 mL Eppendorf tubes. Gates were established using CD1 Ptc
tumour cells and fluorescence minus one controls. Data were analyzed using FloJo software.
Immunohistochemistry
Mice were transcardially perfused using ice-cold PBS followed by 4% paraformaldehyde (PFA).
Whole brains were dissected and fixed overnight in 4% PFA. Samples were then washed briefly
in cold PBS and equilibrated in 30% sucrose at 4 °C for 48 hours after which they were
embedded in TissuTek-OCT (Sakura Finetek) and flash frozen. Frozen tissues were sectioned on
a cryotome at -20 °C and slides stored at -20 °C. EdU incorporation was detected using an EdU
Imaging Kit (Invitrogen). CldU/IdU staining was performed after 30 minute 2 N HCl epitope
retrieval at 37 °C followed by 2 x 5 minute Borate Buffer pH=8 neutralization. Sections were
incubated with anti-CldU antibody (Accurate OBTO030) overnight and were subsequently
stained with anti-IdU (DAKO M0744) antibody. Antibodies used include: Sox2 (Abcam
ab97959), Doublecortin (Abcam 18723), NeuN (Chemicon MAB377), GFP (Clontech 632380),
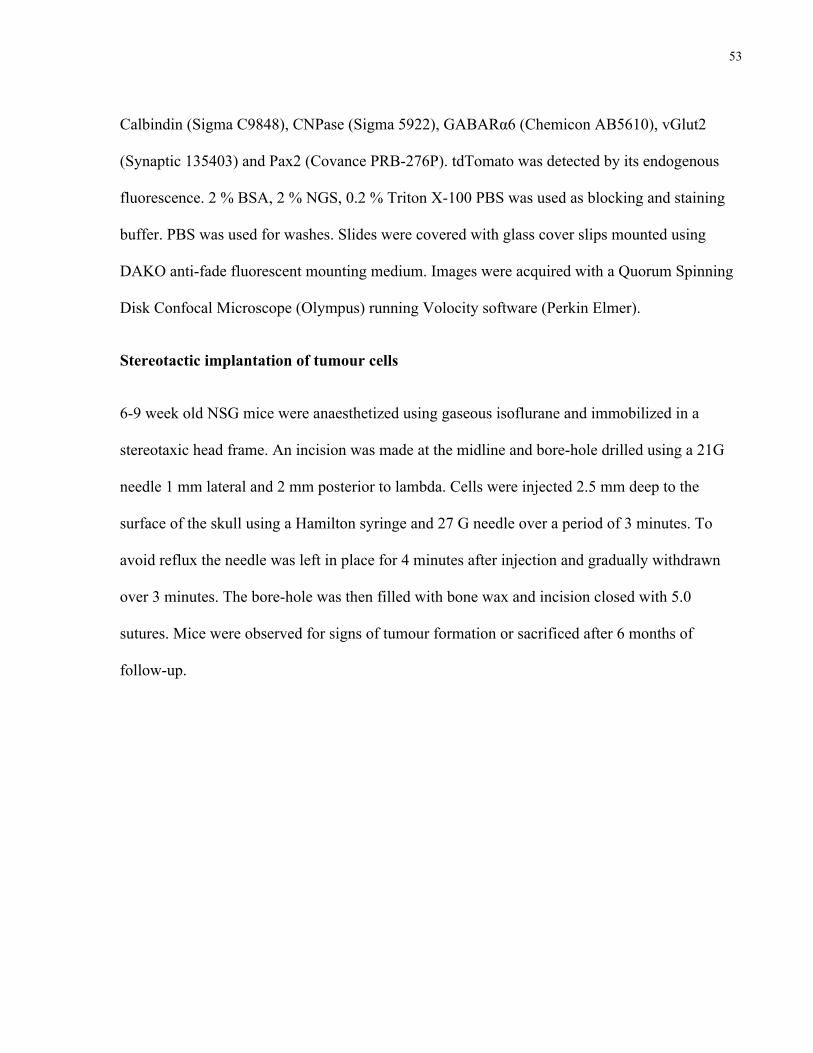
53
Calbindin (Sigma C9848), CNPase (Sigma 5922), GABARα6 (Chemicon AB5610), vGlut2
(Synaptic 135403) and Pax2 (Covance PRB-276P). tdTomato was detected by its endogenous
fluorescence. 2 % BSA, 2 % NGS, 0.2 % Triton X-100 PBS was used as blocking and staining
buffer. PBS was used for washes. Slides were covered with glass cover slips mounted using
DAKO anti-fade fluorescent mounting medium. Images were acquired with a Quorum Spinning
Disk Confocal Microscope (Olympus) running Volocity software (Perkin Elmer).
Stereotactic implantation of tumour cells
6-9 week old NSG mice were anaesthetized using gaseous isoflurane and immobilized in a
stereotaxic head frame. An incision was made at the midline and bore-hole drilled using a 21G
needle 1 mm lateral and 2 mm posterior to lambda. Cells were injected 2.5 mm deep to the
surface of the skull using a Hamilton syringe and 27 G needle over a period of 3 minutes. To
avoid reflux the needle was left in place for 4 minutes after injection and gradually withdrawn
over 3 minutes. The bore-hole was then filled with bone wax and incision closed with 5.0
sutures. Mice were observed for signs of tumour formation or sacrificed after 6 months of
follow-up.
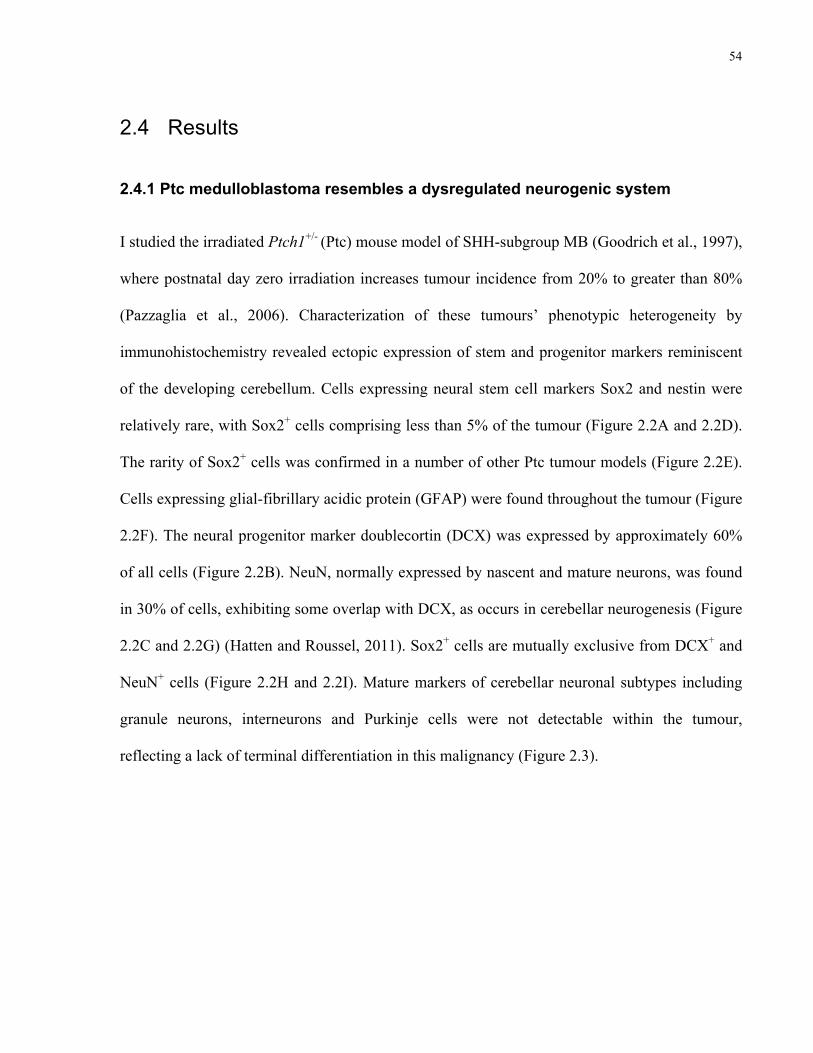
54
2.4 Results
2.4.1 Ptc medulloblastoma resembles a dysregulated neurogenic system
I studied the irradiated Ptch1+/- (Ptc) mouse model of SHH-subgroup MB (Goodrich et al., 1997),
where postnatal day zero irradiation increases tumour incidence from 20% to greater than 80%
(Pazzaglia et al., 2006). Characterization of these tumours’ phenotypic heterogeneity by
immunohistochemistry revealed ectopic expression of stem and progenitor markers reminiscent
of the developing cerebellum. Cells expressing neural stem cell markers Sox2 and nestin were
relatively rare, with Sox2+ cells comprising less than 5% of the tumour (Figure 2.2A and 2.2D).
The rarity of Sox2+ cells was confirmed in a number of other Ptc tumour models (Figure 2.2E).
Cells expressing glial-fibrillary acidic protein (GFAP) were found throughout the tumour (Figure
2.2F). The neural progenitor marker doublecortin (DCX) was expressed by approximately 60%
of all cells (Figure 2.2B). NeuN, normally expressed by nascent and mature neurons, was found
in 30% of cells, exhibiting some overlap with DCX, as occurs in cerebellar neurogenesis (Figure
2.2C and 2.2G) (Hatten and Roussel, 2011). Sox2+ cells are mutually exclusive from DCX+ and
NeuN+ cells (Figure 2.2H and 2.2I). Mature markers of cerebellar neuronal subtypes including
granule neurons, interneurons and Purkinje cells were not detectable within the tumour,
reflecting a lack of terminal differentiation in this malignancy (Figure 2.3).
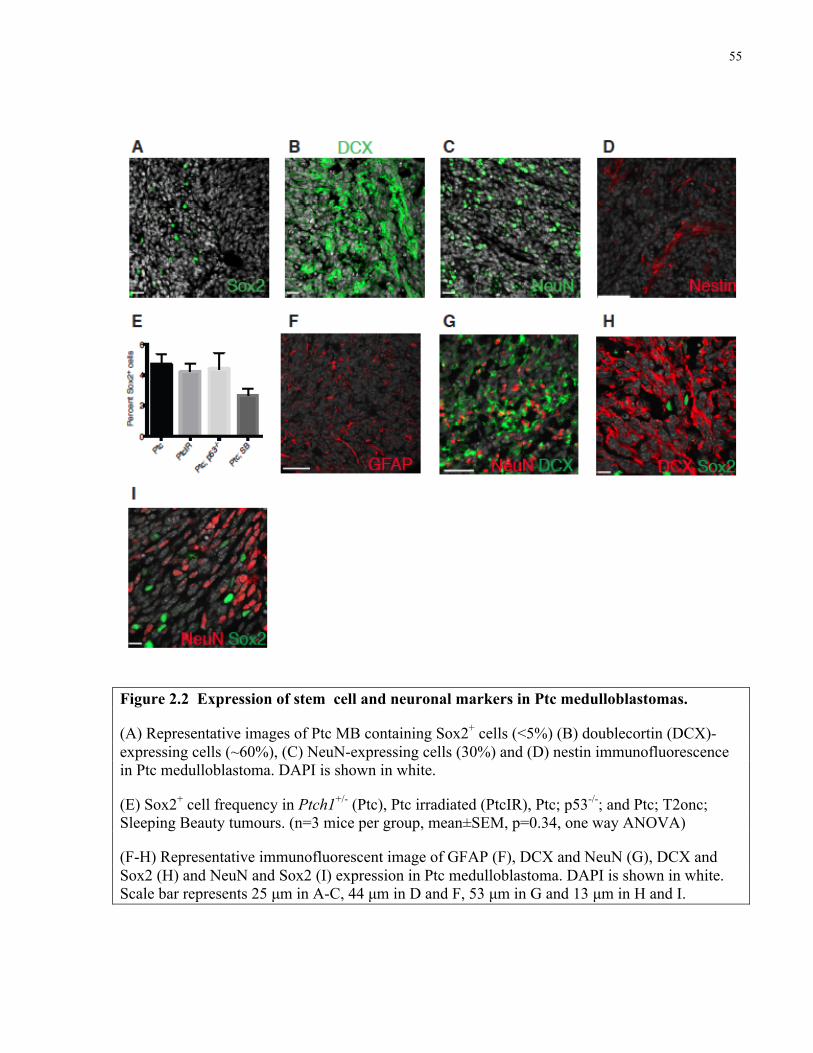
55
Figure 2.2 Expression of stem cell and neuronal markers in Ptc medulloblastomas.
(A) Representative images of Ptc MB containing Sox2+ cells (<5%) (B) doublecortin (DCX)-expressing cells (~60%), (C) NeuN-expressing cells (30%) and (D) nestin immunofluorescence in Ptc medulloblastoma. DAPI is shown in white.
(E) Sox2+ cell frequency in Ptch1+/- (Ptc), Ptc irradiated (PtcIR), Ptc; p53-/-; and Ptc; T2onc; Sleeping Beauty tumours. (n=3 mice per group, mean±SEM, p=0.34, one way ANOVA)
(F-H) Representative immunofluorescent image of GFAP (F), DCX and NeuN (G), DCX and Sox2 (H) and NeuN and Sox2 (I) expression in Ptc medulloblastoma. DAPI is shown in white. Scale bar represents 25 µm in A-C, 44 µm in D and F, 53 µm in G and 13 µm in H and I.
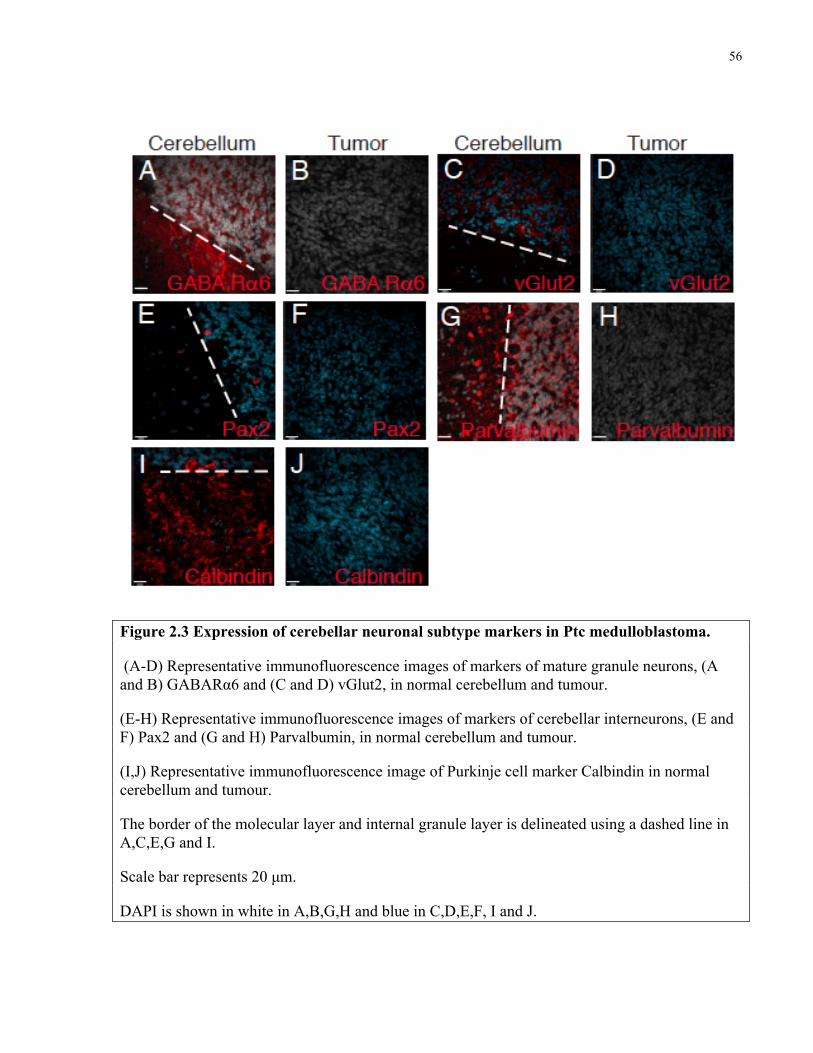
56
Figure 2.3 Expression of cerebellar neuronal subtype markers in Ptc medulloblastoma.
(A-D) Representative immunofluorescence images of markers of mature granule neurons, (A and B) GABARα6 and (C and D) vGlut2, in normal cerebellum and tumour.
(E-H) Representative immunofluorescence images of markers of cerebellar interneurons, (E and F) Pax2 and (G and H) Parvalbumin, in normal cerebellum and tumour.
(I,J) Representative immunofluorescence image of Purkinje cell marker Calbindin in normal cerebellum and tumour.
The border of the molecular layer and internal granule layer is delineated using a dashed line in A,C,E,G and I.
Scale bar represents 20 µm.
DAPI is shown in white in A,B,G,H and blue in C,D,E,F, I and J.
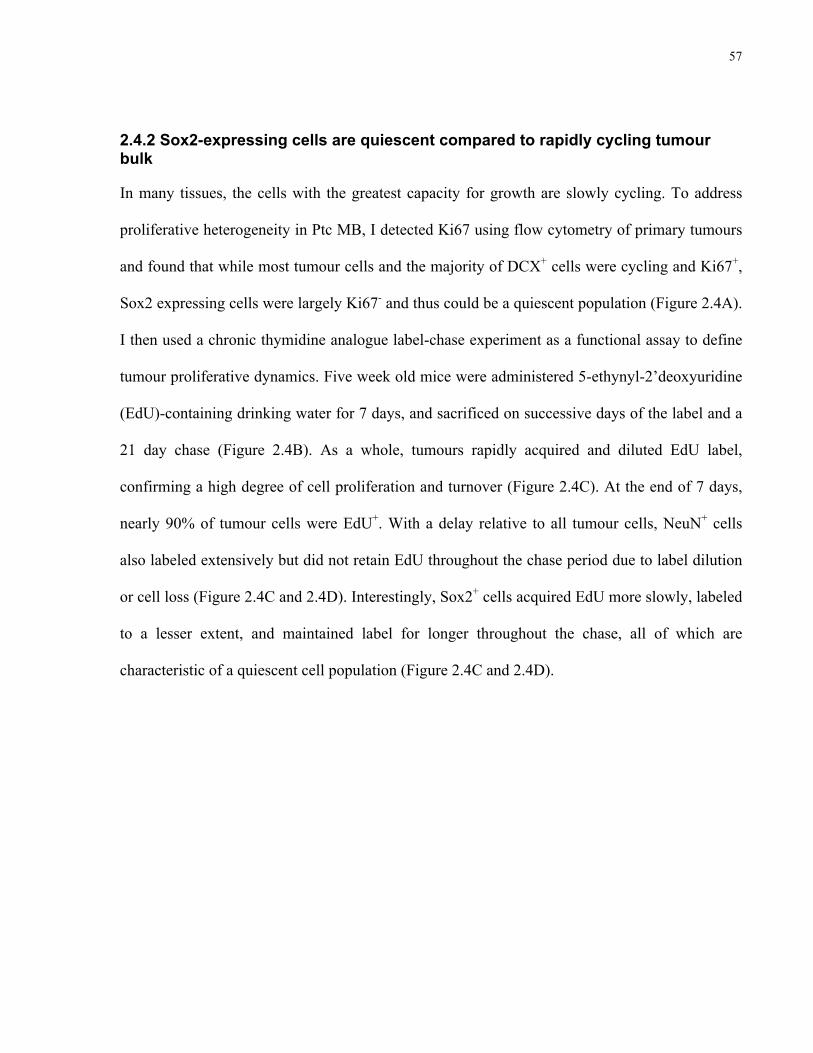
57
2.4.2 Sox2-expressing cells are quiescent compared to rapidly cycling tumour bulk
In many tissues, the cells with the greatest capacity for growth are slowly cycling. To address
proliferative heterogeneity in Ptc MB, I detected Ki67 using flow cytometry of primary tumours
and found that while most tumour cells and the majority of DCX+ cells were cycling and Ki67+,
Sox2 expressing cells were largely Ki67- and thus could be a quiescent population (Figure 2.4A).
I then used a chronic thymidine analogue label-chase experiment as a functional assay to define
tumour proliferative dynamics. Five week old mice were administered 5-ethynyl-2’deoxyuridine
(EdU)-containing drinking water for 7 days, and sacrificed on successive days of the label and a
21 day chase (Figure 2.4B). As a whole, tumours rapidly acquired and diluted EdU label,
confirming a high degree of cell proliferation and turnover (Figure 2.4C). At the end of 7 days,
nearly 90% of tumour cells were EdU+. With a delay relative to all tumour cells, NeuN+ cells
also labeled extensively but did not retain EdU throughout the chase period due to label dilution
or cell loss (Figure 2.4C and 2.4D). Interestingly, Sox2+ cells acquired EdU more slowly, labeled
to a lesser extent, and maintained label for longer throughout the chase, all of which are
characteristic of a quiescent cell population (Figure 2.4C and 2.4D).
58
Figure 2.4 Sox2+ Ptc MB cells are quiescent.
(A) Frequency of Ki67 expression in primary tumour cells: all counts, DCX+ cells and Sox2+ cells. (n=3, mean ± SEM, two-tailed unpaired t-test).
(B) Experimental design for panels C and D. 31 day old Ptc mice were administered 0.82 mg/mL EdU drinking water for 7 days (experimental day 0-7), followed by a 21 day chase. Mice were sacrificed on the indicated days of label or chase.
(C) The frequency of all EdU+ cells as well as NeuN+ and Sox2+ cells that are also EdU+ was quantified from primary tumour sections throughout the label and chase. (n=3 per group, mean ± SEM).
(D) Representative immunofluorescence images at the end of the chase (day 28).
DAPI is shown in white. Scale bar represents 14 µm.
59
2.4.3 Sox2+ cells slowly cycle
To determine if Sox2+ cells continually cycle, mice were subjected to a pulse-chase-pulse
regimen of 7 days 5-Chloro-2’-deoxyuridine (CldU) drinking water – 2 weeks chase – 7 days 5-
Iodo-2’-deoxyuridine (IdU)-containing drinking water (Figure 2.5A). Slowly cycling cells were
marked with both CldU and IdU, having retained the first label (CldU) and divided at least once
during the week of IdU labeling prior to sacrifice. Only rare cells (<0.5%) were positive for both
proliferative markers, but nearly all double-labeled cells were Sox2+, confirming this population
to be continuously slowly cycling and not merely label-retaining (Figure 2.5B and 2.5C). Less
than 10% of Sox2+ cells were double-labeled, having divided during the initial CldU pulse and
again during the 7 days prior to sacrifice.
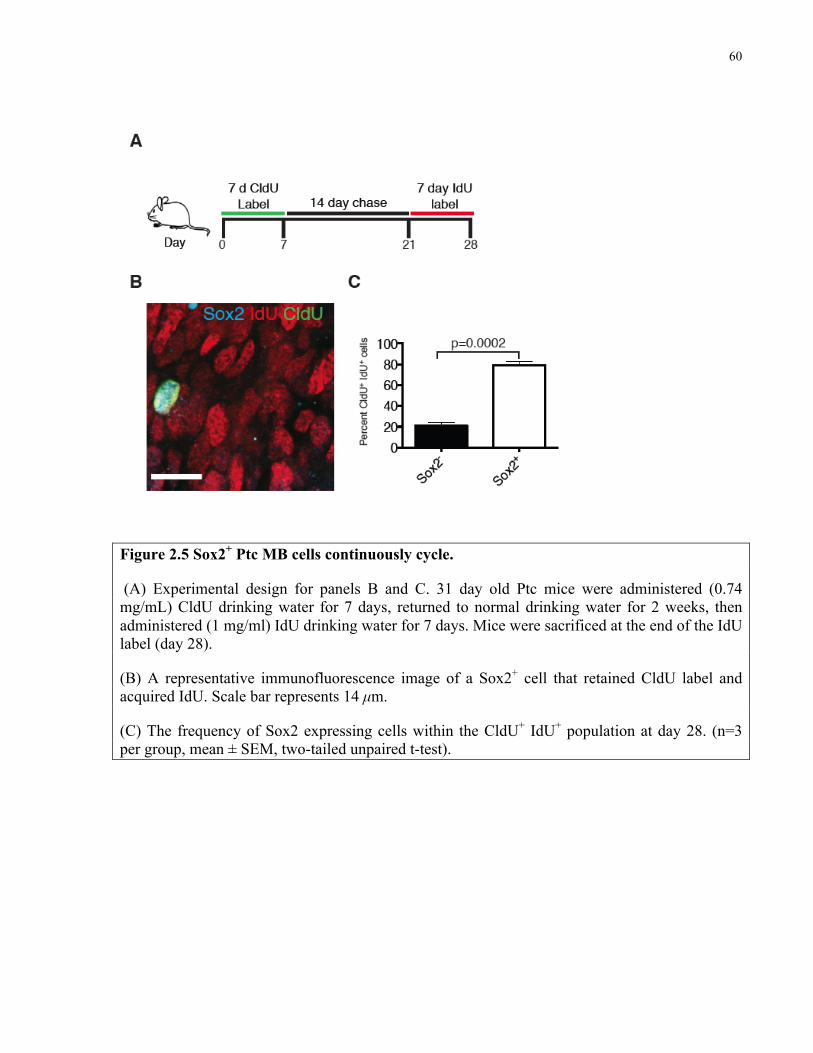
60
Figure 2.5 Sox2+ Ptc MB cells continuously cycle.
(A) Experimental design for panels B and C. 31 day old Ptc mice were administered (0.74 mg/mL) CldU drinking water for 7 days, returned to normal drinking water for 2 weeks, then administered (1 mg/ml) IdU drinking water for 7 days. Mice were sacrificed at the end of the IdU label (day 28).
(B) A representative immunofluorescence image of a Sox2+ cell that retained CldU label and acquired IdU. Scale bar represents 14 µm.
(C) The frequency of Sox2 expressing cells within the CldU+ IdU+ population at day 28. (n=3 per group, mean ± SEM, two-tailed unpaired t-test).
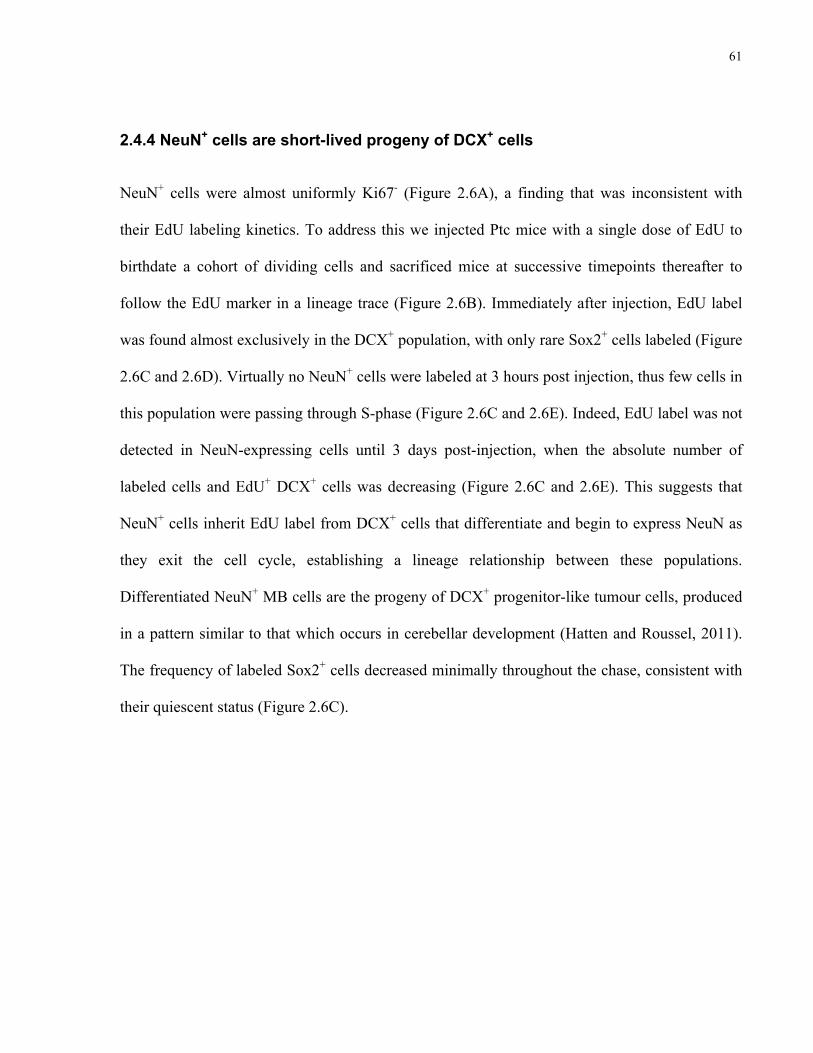
61
2.4.4 NeuN+ cells are short-lived progeny of DCX+ cells
NeuN+ cells were almost uniformly Ki67- (Figure 2.6A), a finding that was inconsistent with
their EdU labeling kinetics. To address this we injected Ptc mice with a single dose of EdU to
birthdate a cohort of dividing cells and sacrificed mice at successive timepoints thereafter to
follow the EdU marker in a lineage trace (Figure 2.6B). Immediately after injection, EdU label
was found almost exclusively in the DCX+ population, with only rare Sox2+ cells labeled (Figure
2.6C and 2.6D). Virtually no NeuN+ cells were labeled at 3 hours post injection, thus few cells in
this population were passing through S-phase (Figure 2.6C and 2.6E). Indeed, EdU label was not
detected in NeuN-expressing cells until 3 days post-injection, when the absolute number of
labeled cells and EdU+ DCX+ cells was decreasing (Figure 2.6C and 2.6E). This suggests that
NeuN+ cells inherit EdU label from DCX+ cells that differentiate and begin to express NeuN as
they exit the cell cycle, establishing a lineage relationship between these populations.
Differentiated NeuN+ MB cells are the progeny of DCX+ progenitor-like tumour cells, produced
in a pattern similar to that which occurs in cerebellar development (Hatten and Roussel, 2011).
The frequency of labeled Sox2+ cells decreased minimally throughout the chase, consistent with
their quiescent status (Figure 2.6C).
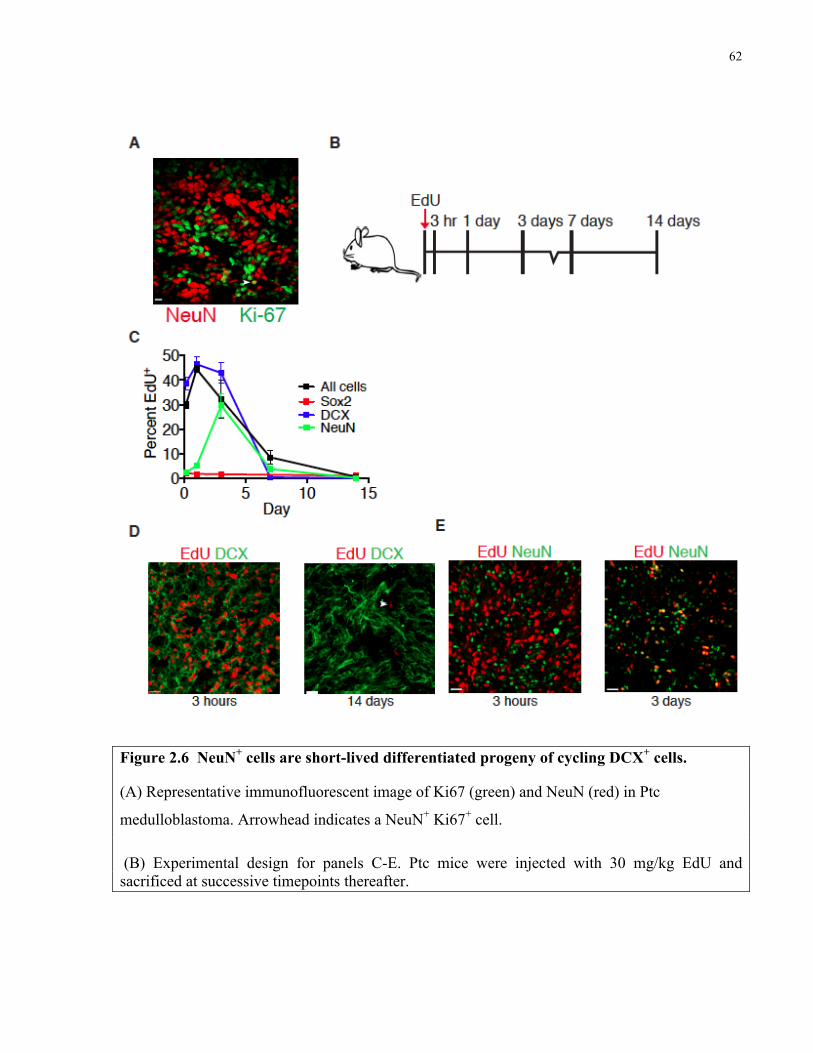
62
Figure 2.6 NeuN+ cells are short-lived differentiated progeny of cycling DCX+ cells.
(A) Representative immunofluorescent image of Ki67 (green) and NeuN (red) in Ptc
medulloblastoma. Arrowhead indicates a NeuN+ Ki67+ cell.
(B) Experimental design for panels C-E. Ptc mice were injected with 30 mg/kg EdU and sacrificed at successive timepoints thereafter.
63
(C) The frequency of all EdU+ cells as well as DCX+, NeuN+ and Sox2+ cells that were also EdU+ was quantified in primary tumour sections at each post-injection timepoint. (n=3 per group, mean ± SEM).
(D) Representative immunofluorescence images of DCX and EdU at 3 hours and 14 days post-injection. Arrowhead indicates a rare EdU+ label-retaining cell.
(E) Representative immunofluorescence images of NeuN and EdU at 3 hours and 3 days post injection.
Scale bar represents 20 µm.
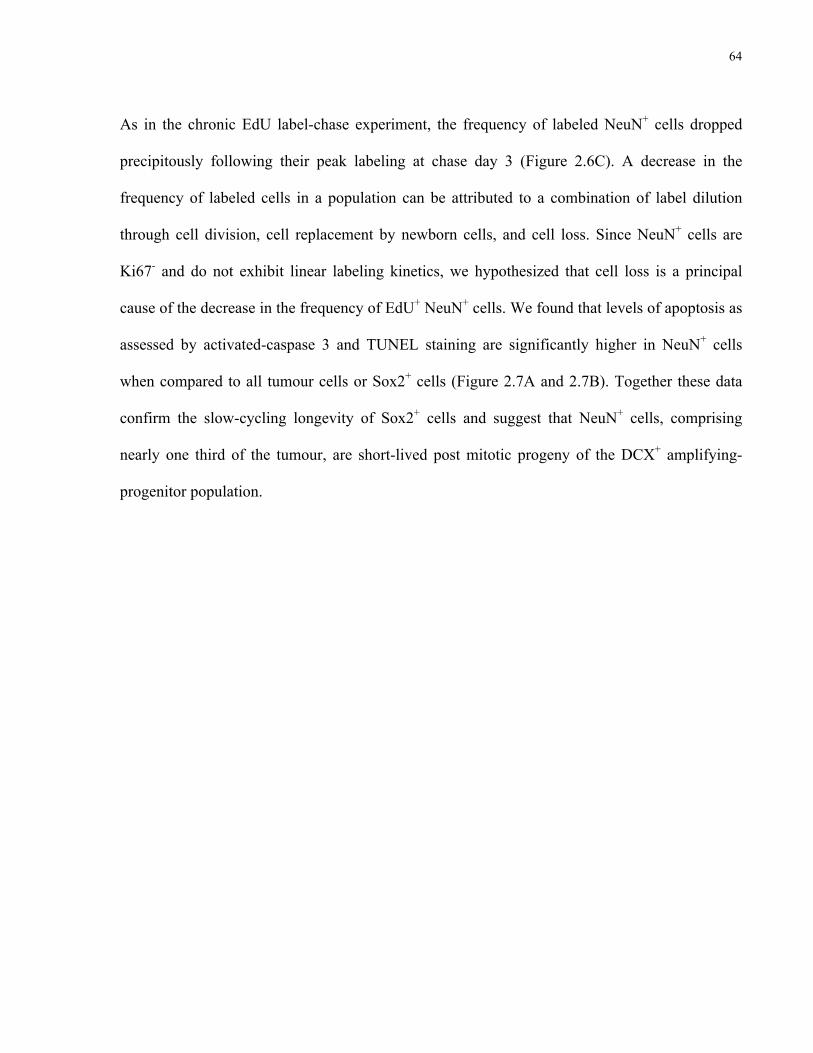
64
As in the chronic EdU label-chase experiment, the frequency of labeled NeuN+ cells dropped
precipitously following their peak labeling at chase day 3 (Figure 2.6C). A decrease in the
frequency of labeled cells in a population can be attributed to a combination of label dilution
through cell division, cell replacement by newborn cells, and cell loss. Since NeuN+ cells are
Ki67- and do not exhibit linear labeling kinetics, we hypothesized that cell loss is a principal
cause of the decrease in the frequency of EdU+ NeuN+ cells. We found that levels of apoptosis as
assessed by activated-caspase 3 and TUNEL staining are significantly higher in NeuN+ cells
when compared to all tumour cells or Sox2+ cells (Figure 2.7A and 2.7B). Together these data
confirm the slow-cycling longevity of Sox2+ cells and suggest that NeuN+ cells, comprising
nearly one third of the tumour, are short-lived post mitotic progeny of the DCX+ amplifying-
progenitor population.
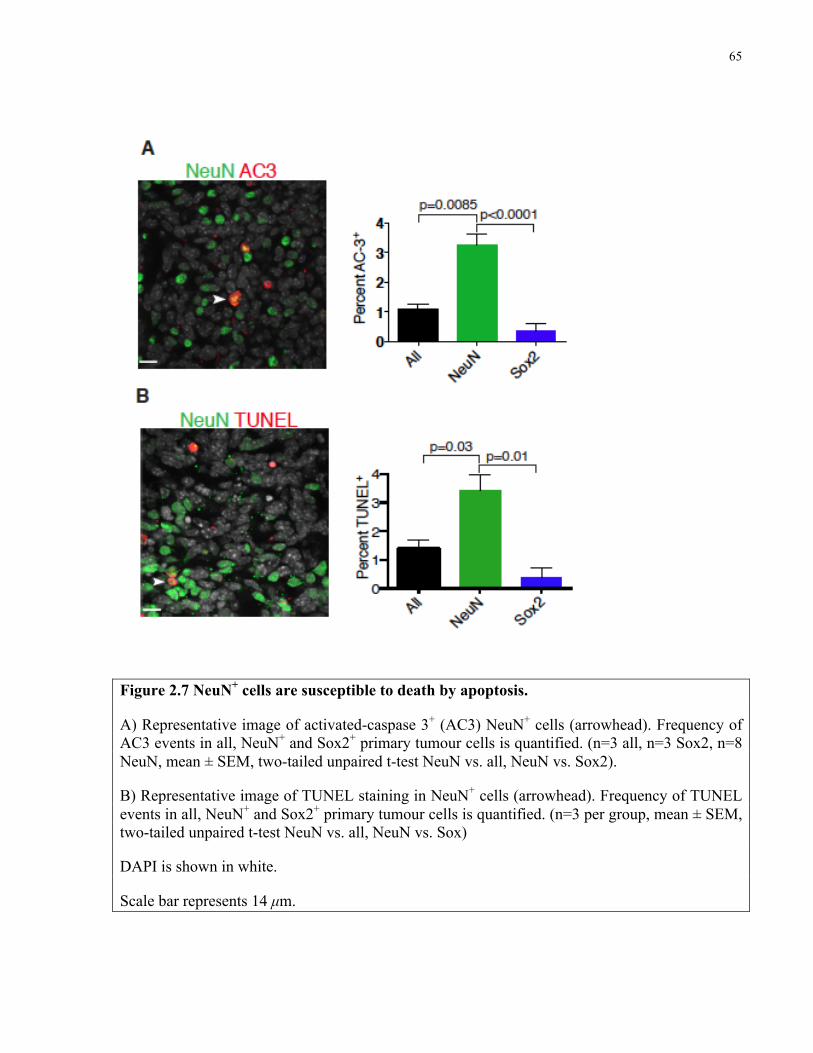
65
Figure 2.7 NeuN+ cells are susceptible to death by apoptosis.
A) Representative image of activated-caspase 3+ (AC3) NeuN+ cells (arrowhead). Frequency of AC3 events in all, NeuN+ and Sox2+ primary tumour cells is quantified. (n=3 all, n=3 Sox2, n=8 NeuN, mean ± SEM, two-tailed unpaired t-test NeuN vs. all, NeuN vs. Sox2).
B) Representative image of TUNEL staining in NeuN+ cells (arrowhead). Frequency of TUNEL events in all, NeuN+ and Sox2+ primary tumour cells is quantified. (n=3 per group, mean ± SEM, two-tailed unpaired t-test NeuN vs. all, NeuN vs. Sox)
DAPI is shown in white.
Scale bar represents 14 µm.
66
2.4.5 Tumour-propagating cells express Sox2
Many quiescent stem cell populations, including Sox2 expressing neural stem cells, exhibit
greater self-renewal than their proliferating progeny. To determine if Sox2+ MB cells self-renew
in tumour-propagating cell assays, I crossed Sox2-eGFP reporter mice to the Ptc MB model for
functional analysis, specifically marking Sox2+ cells with GFP (Figure 2.8A). Sox2-expressing
cells were isolated as a discrete eGFPhigh population from primary tumours depleted of microglia,
leukocytes and red blood cells (Figure 2.8B). On average, CD15/Lewis-x/SSEA-1 marks 40% of
Ptc tumour cells and can be used to enrich for cells with tumour-propagating capacity (Read et
al., 2009; Ward et al., 2009). Greater than 80% of Sox2+ cells are CD15+ and Sox2+ cells
comprise a minority (<10%) of the CD15+ population (Figure 2.8C and 2.8D).
67
Figure 2.8 Phenotyping Ptc; Sox2-eGFP tumours.
(A) Representative immunofluorescent image of GFP (green) and Sox2 (red) in a Ptc; Sox2eGFP tumour. DAPI is shown in white. Scale bar represents 10 µm.
(B) Representative gating scheme with typical GFP+ and GFP- frequencies for FACS of a Ptc; Sox2-eGFP tumour depleted for cells expressing CD45 or Ter-119.
(C) Typical FACS plot showing CD15+ and Sox2+ cell frequencies in primary Ptc; Sox2-eGFP tumour cells.
(D) Breakdown of Sox2+ cells by their expression of CD15 (top) and CD15+ cells by their expression of Sox2 (bottom). (n=3 per group, mean ± SEM).
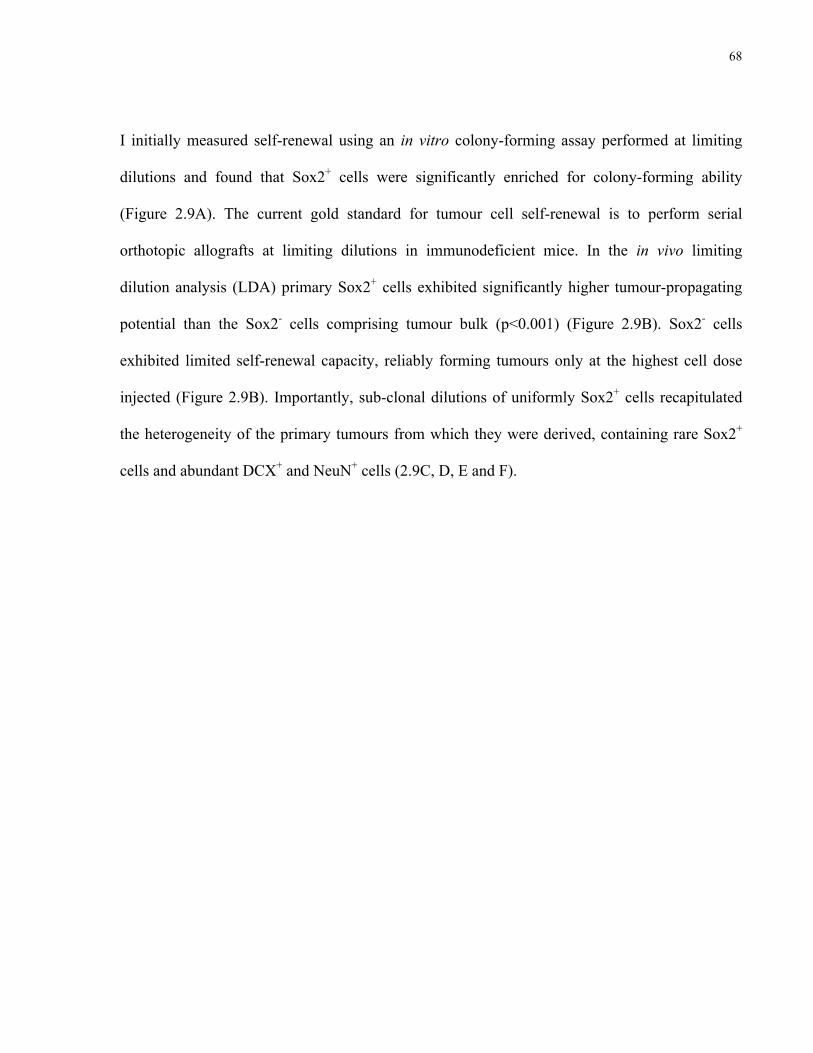
68
I initially measured self-renewal using an in vitro colony-forming assay performed at limiting
dilutions and found that Sox2+ cells were significantly enriched for colony-forming ability
(Figure 2.9A). The current gold standard for tumour cell self-renewal is to perform serial
orthotopic allografts at limiting dilutions in immunodeficient mice. In the in vivo limiting
dilution analysis (LDA) primary Sox2+ cells exhibited significantly higher tumour-propagating
potential than the Sox2- cells comprising tumour bulk (p<0.001) (Figure 2.9B). Sox2- cells
exhibited limited self-renewal capacity, reliably forming tumours only at the highest cell dose
injected (Figure 2.9B). Importantly, sub-clonal dilutions of uniformly Sox2+ cells recapitulated
the heterogeneity of the primary tumours from which they were derived, containing rare Sox2+
cells and abundant DCX+ and NeuN+ cells (2.9C, D, E and F).
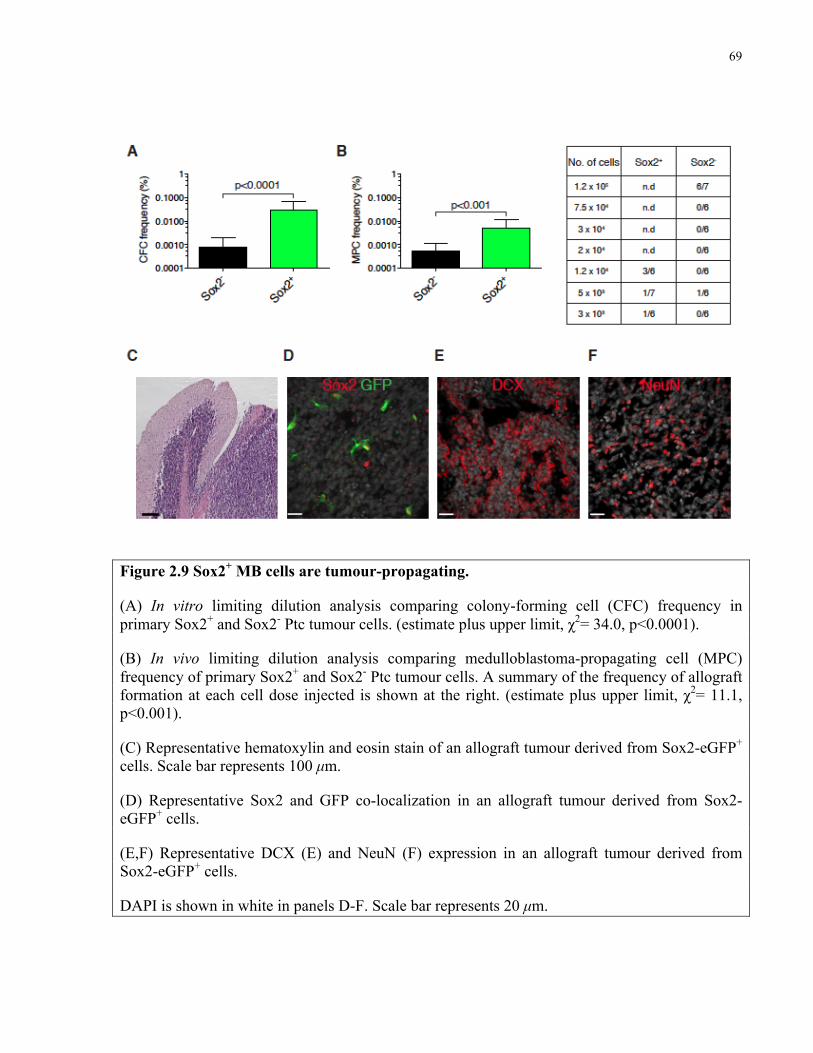
69
Figure 2.9 Sox2+ MB cells are tumour-propagating.
(A) In vitro limiting dilution analysis comparing colony-forming cell (CFC) frequency in primary Sox2+ and Sox2- Ptc tumour cells. (estimate plus upper limit, χ2= 34.0, p<0.0001).
(B) In vivo limiting dilution analysis comparing medulloblastoma-propagating cell (MPC) frequency of primary Sox2+ and Sox2- Ptc tumour cells. A summary of the frequency of allograft formation at each cell dose injected is shown at the right. (estimate plus upper limit, χ2= 11.1, p<0.001).
(C) Representative hematoxylin and eosin stain of an allograft tumour derived from Sox2-eGFP+ cells. Scale bar represents 100 µm.
(D) Representative Sox2 and GFP co-localization in an allograft tumour derived from Sox2-eGFP+ cells.
(E,F) Representative DCX (E) and NeuN (F) expression in an allograft tumour derived from Sox2-eGFP+ cells.
DAPI is shown in white in panels D-F. Scale bar represents 20 µm.
70
To test self-renewal in a serial transplantation assay, secondary NSG mice were injected with 1.2
x 105 cells derived from a primary allograft produced by Sox2-GFP+ cells, unsorted cells, or
Sox2-GFP- cells. 2/3 transplants from Sox2+ primary allografts and 2/3 transplants from unsorted
cell allografts yielded secondary tumours (Figure 2.10). Tumours formed from Sox2- cells could
not be serially propagated as 0/5 injections formed secondary grafts (Figure 2.10). Therefore,
Sox2+ cells both self-renew and differentiate in vivo, are MB-propagating cells (MPCs) and are
required for serial tumour engraftment.
71
Figure 2.10 Sox2+ cells are required for serial transplantation of Ptc tumours.
Primary tumour cells from Ptc; Sox2-eGFP mice sorted into Sox2+ GFP+ and Sox2- GFP- fractions, or primary unsorted Ptc cells generated allografts in primary NSG recipient mice. 1.2 x 10⁵ cells from the resultant tumours were engrafted into secondary NSG recipients. While secondary grafts formed from 2/3 Sox2+ derived and unsorted derived allografts, tumours from Sox2- cells could not be serially propagated.
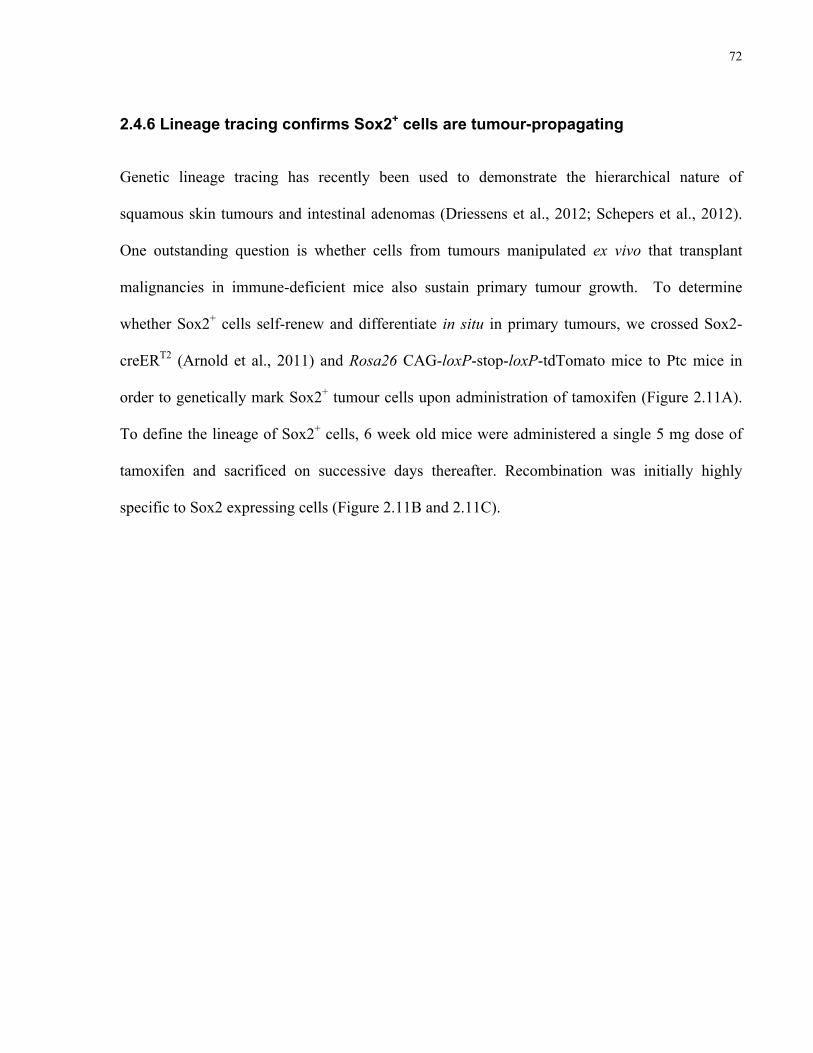
72
2.4.6 Lineage tracing confirms Sox2+ cells are tumour-propagating
Genetic lineage tracing has recently been used to demonstrate the hierarchical nature of
squamous skin tumours and intestinal adenomas (Driessens et al., 2012; Schepers et al., 2012).
One outstanding question is whether cells from tumours manipulated ex vivo that transplant
malignancies in immune-deficient mice also sustain primary tumour growth. To determine
whether Sox2+ cells self-renew and differentiate in situ in primary tumours, we crossed Sox2-
creERT2 (Arnold et al., 2011) and Rosa26 CAG-loxP-stop-loxP-tdTomato mice to Ptc mice in
order to genetically mark Sox2+ tumour cells upon administration of tamoxifen (Figure 2.11A).
To define the lineage of Sox2+ cells, 6 week old mice were administered a single 5 mg dose of
tamoxifen and sacrificed on successive days thereafter. Recombination was initially highly
specific to Sox2 expressing cells (Figure 2.11B and 2.11C).
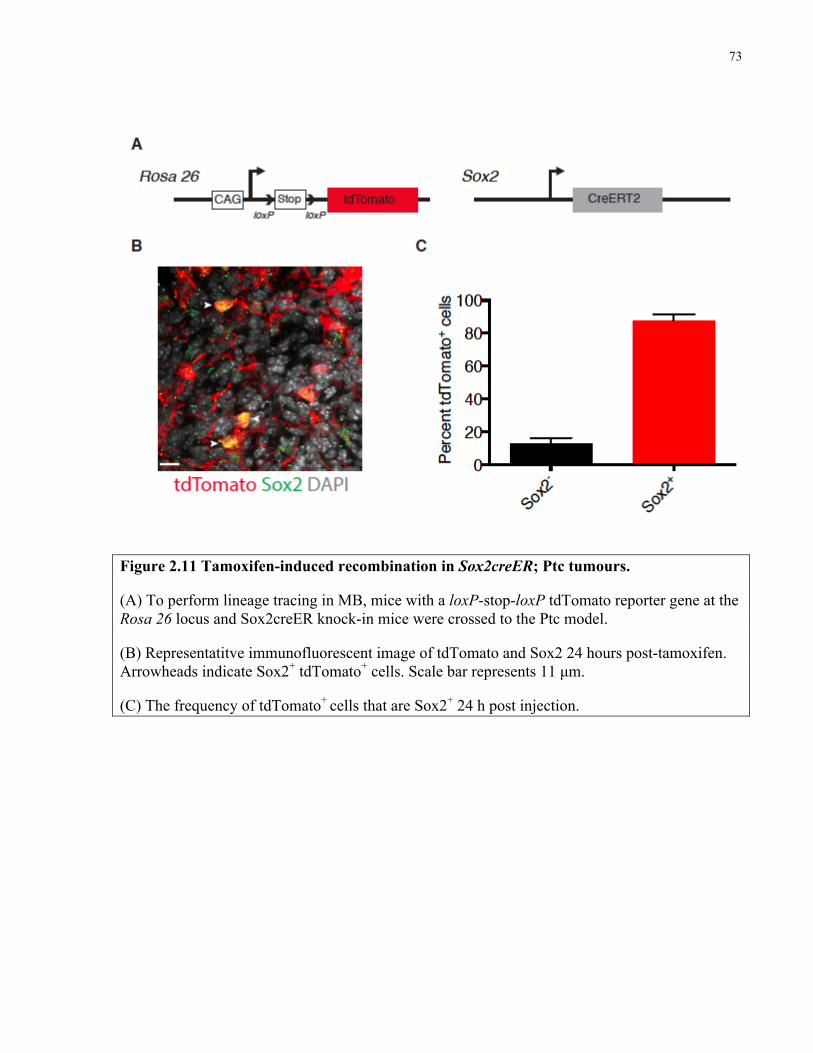
73
Figure 2.11 Tamoxifen-induced recombination in Sox2creER; Ptc tumours.
(A) To perform lineage tracing in MB, mice with a loxP-stop-loxP tdTomato reporter gene at the Rosa 26 locus and Sox2creER knock-in mice were crossed to the Ptc model.
(B) Representatitve immunofluorescent image of tdTomato and Sox2 24 hours post-tamoxifen. Arrowheads indicate Sox2+ tdTomato+ cells. Scale bar represents 11 µm.
(C) The frequency of tdTomato+ cells that are Sox2+ 24 h post injection.

74
The frequency of marked Sox2+ cells remained constant throughout the tracing period,
confirming that this population is self-renewing (Figure 2.12A). Over time the frequency of
tdTomato+ tumour cells progressively increased until after 6 weeks nearly one third of tumour
cells were positive and thus derived from the Sox2+ cells marked at the time of injection (Figure
2.12B and 2.12C).
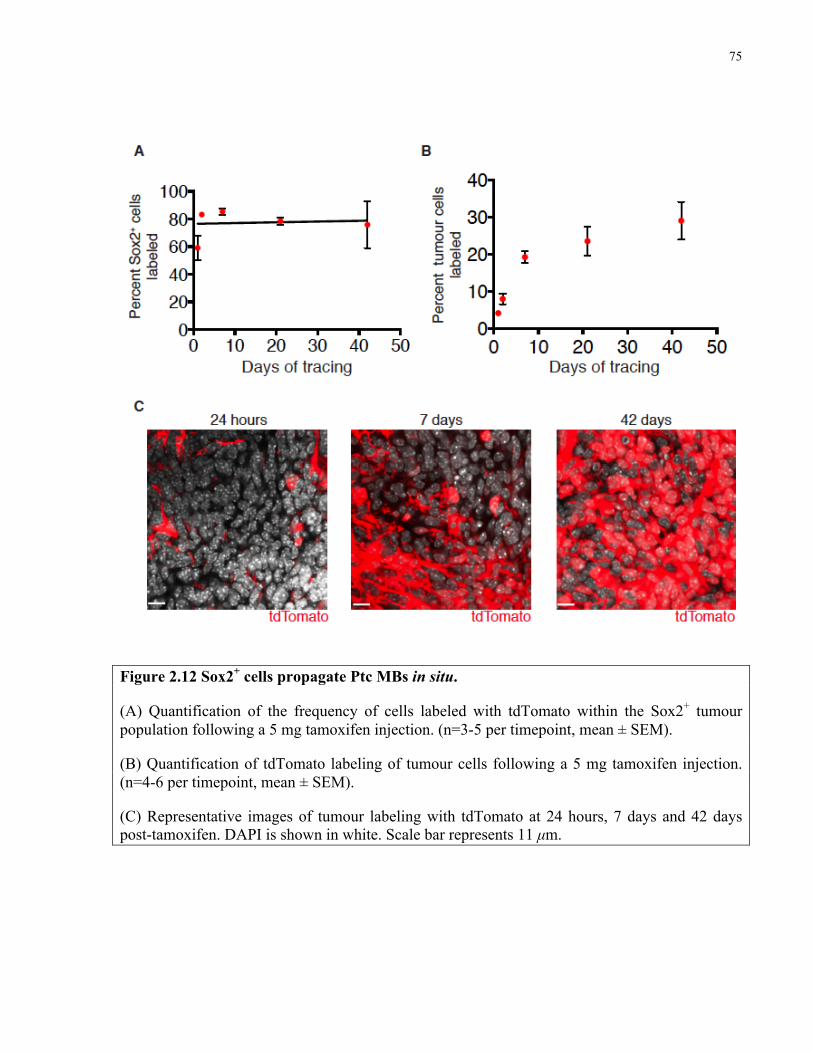
75
Figure 2.12 Sox2+ cells propagate Ptc MBs in situ.
(A) Quantification of the frequency of cells labeled with tdTomato within the Sox2+ tumour population following a 5 mg tamoxifen injection. (n=3-5 per timepoint, mean ± SEM).
(B) Quantification of tdTomato labeling of tumour cells following a 5 mg tamoxifen injection. (n=4-6 per timepoint, mean ± SEM).
(C) Representative images of tumour labeling with tdTomato at 24 hours, 7 days and 42 days post-tamoxifen. DAPI is shown in white. Scale bar represents 11 µm.
76
At 21 days post-tamoxifen, tdTomato expression was maintained in the Sox2+ fraction and also
observed in cells expressing neuronal markers DCX, βIII-tubulin and NeuN as well as cells
expressing glial markers GFAP or S100-β (Figure 2.13A-D, Figure 2.14A and 16B). Therefore,
rare Sox2+ cells both self-renew and differentiate into the fast dividing progenitor-like cells and
post-mitotic neuron-like cells that comprise the majority of the tumour. The frequency of
tdTomato+ cells expressing NeuN increased with similar kinetics to tumour labeling, suggesting
that tumour growth mimics neurogenesis (Figure 2.13E). Collectively, these data support a
model for MB growth in primary tumours and allografts driven by self-renewing Sox2+ cells.
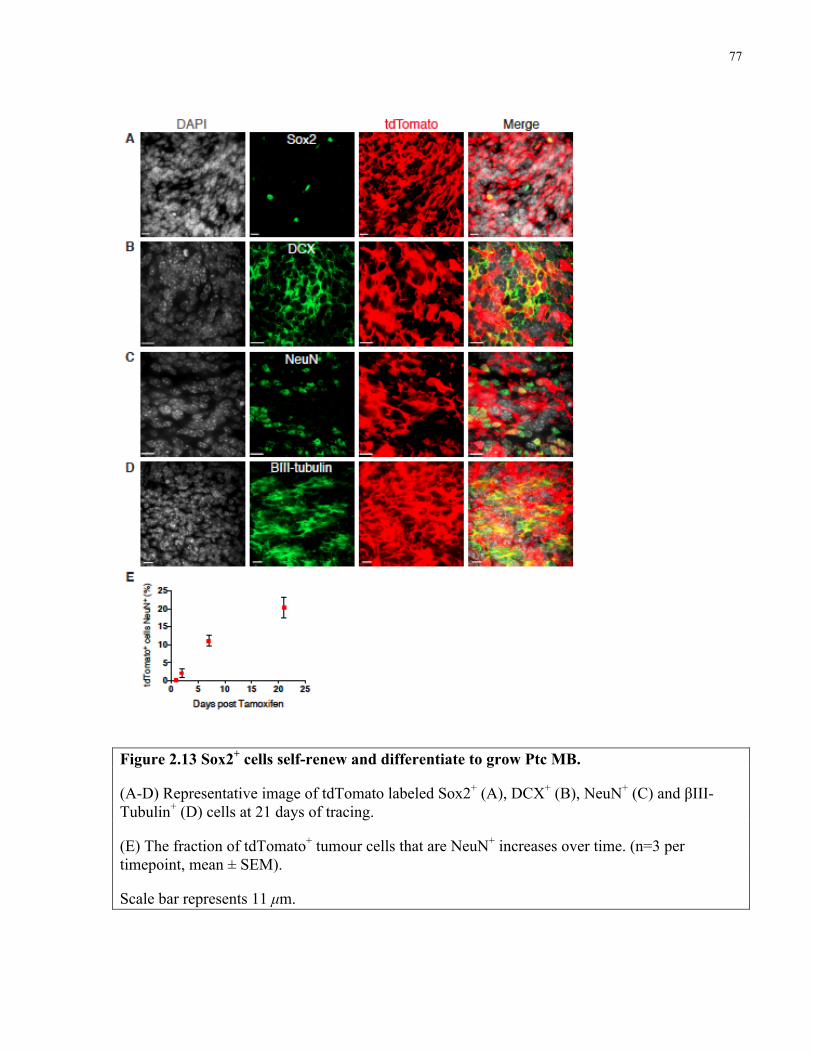
77
Figure 2.13 Sox2+ cells self-renew and differentiate to grow Ptc MB.
(A-D) Representative image of tdTomato labeled Sox2+ (A), DCX+ (B), NeuN+ (C) and βIII-Tubulin+ (D) cells at 21 days of tracing.
(E) The fraction of tdTomato+ tumour cells that are NeuN+ increases over time. (n=3 per timepoint, mean ± SEM).
Scale bar represents 11 µm.
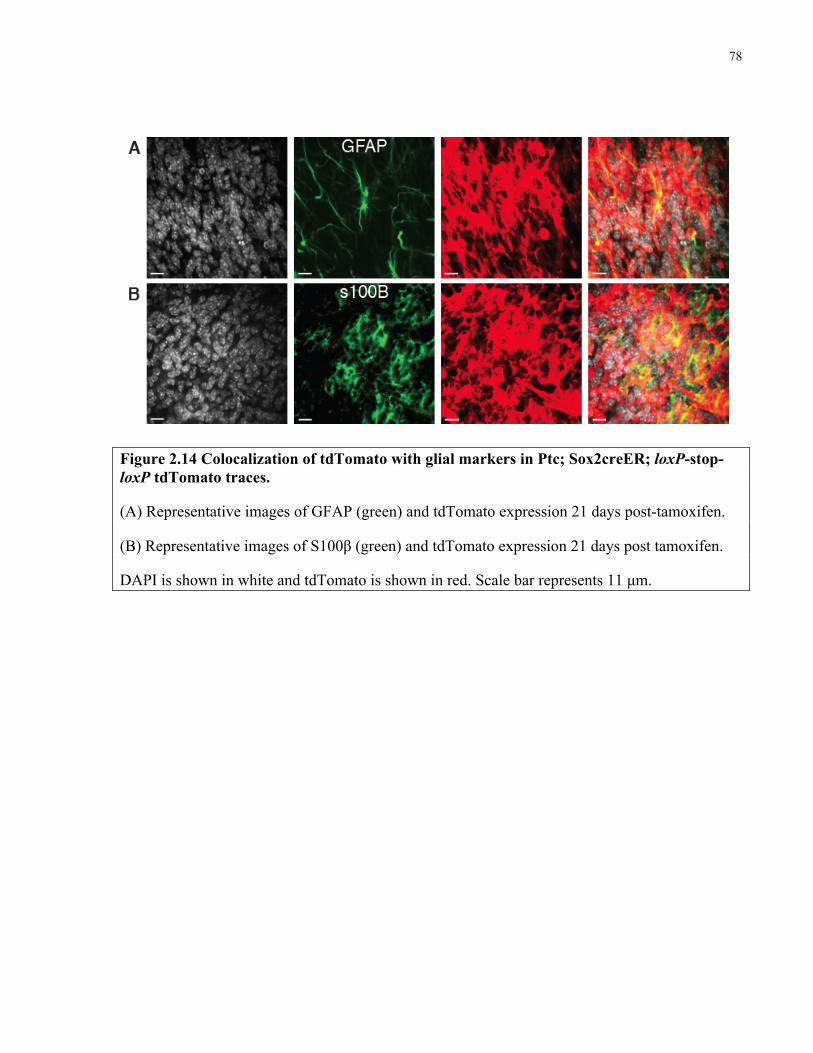
78
Figure 2.14 Colocalization of tdTomato with glial markers in Ptc; Sox2creER; loxP-stop-loxP tdTomato traces.
(A) Representative images of GFAP (green) and tdTomato expression 21 days post-tamoxifen.
(B) Representative images of S100β (green) and tdTomato expression 21 days post tamoxifen.
DAPI is shown in white and tdTomato is shown in red. Scale bar represents 11 µm.
79
Two transgenic DCXcreER mouse lines were obtained to perform lineage tracing from DCX+
cells in Ptc tumours. The first line, C57BL/6J-Tg(DCX-cre/ERT2)1Mull/Mmmh, was named
DCXcreER1. Tamoxifen administration to DCXcreER1 mice produced recombination and
tdTomato labeling in 5% of tumour cells 48 hours post tamoxifen, but recombined cells did not
express DCX (Figure 2.15A). 60% of cells first marked in these tumours are Sox2+ (Figure 17B).
Mice sacrificed at 7 and 21 days post-tamoxifen showed extensive tdtomato labelling throughout
tumours, indicating that the 40% of cells marked at 21 days post-injection are derived from the
rare cells marked at the outset (Figure 2.15C and 2.15D). Surprisingly, the fraction of tdTomato+
Sox2+ cells increased from between 2 and 21 days post-tamoxifen (p=0.03, two tailed unpaired t-
test 2 vs 21 days) (Figure 2.15E). This suggests that a fraction of Sox2+ cells may be the progeny
of cells marked at 48 hours post injection.
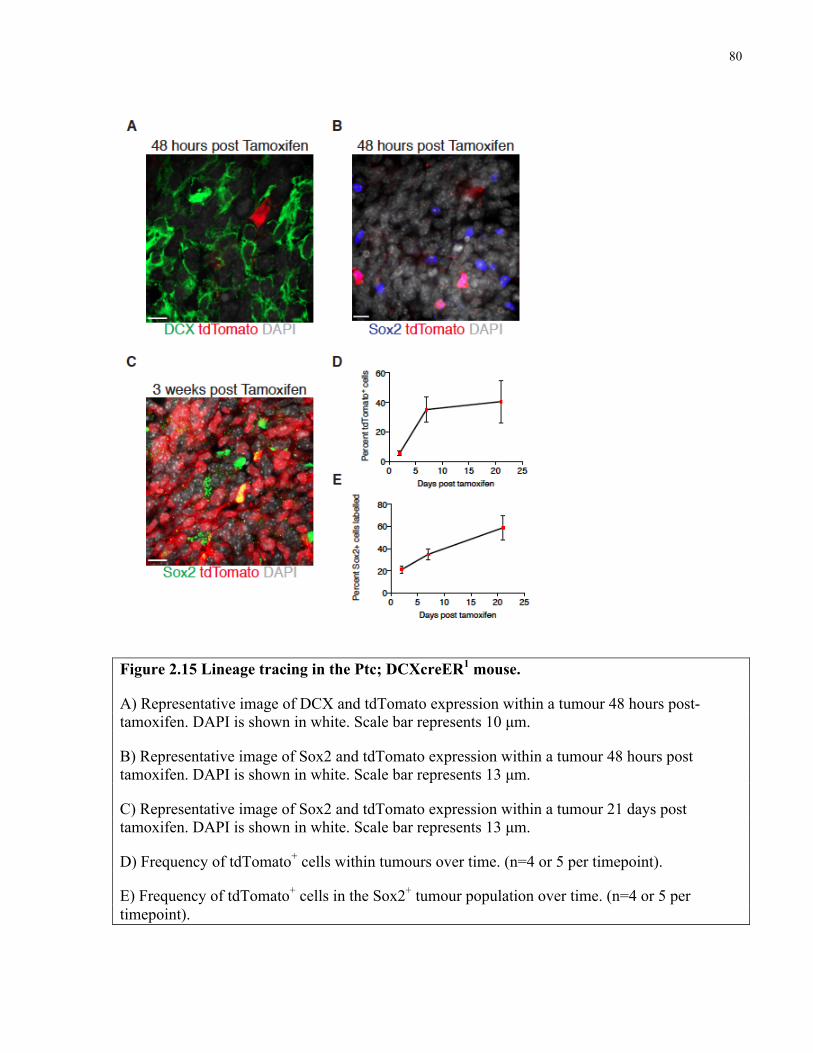
80
Figure 2.15 Lineage tracing in the Ptc; DCXcreER1 mouse.
A) Representative image of DCX and tdTomato expression within a tumour 48 hours post-tamoxifen. DAPI is shown in white. Scale bar represents 10 µm.
B) Representative image of Sox2 and tdTomato expression within a tumour 48 hours post tamoxifen. DAPI is shown in white. Scale bar represents 13 µm.
C) Representative image of Sox2 and tdTomato expression within a tumour 21 days post tamoxifen. DAPI is shown in white. Scale bar represents 13 µm.
D) Frequency of tdTomato+ cells within tumours over time. (n=4 or 5 per timepoint).
E) Frequency of tdTomato+ cells in the Sox2+ tumour population over time. (n=4 or 5 per timepoint).
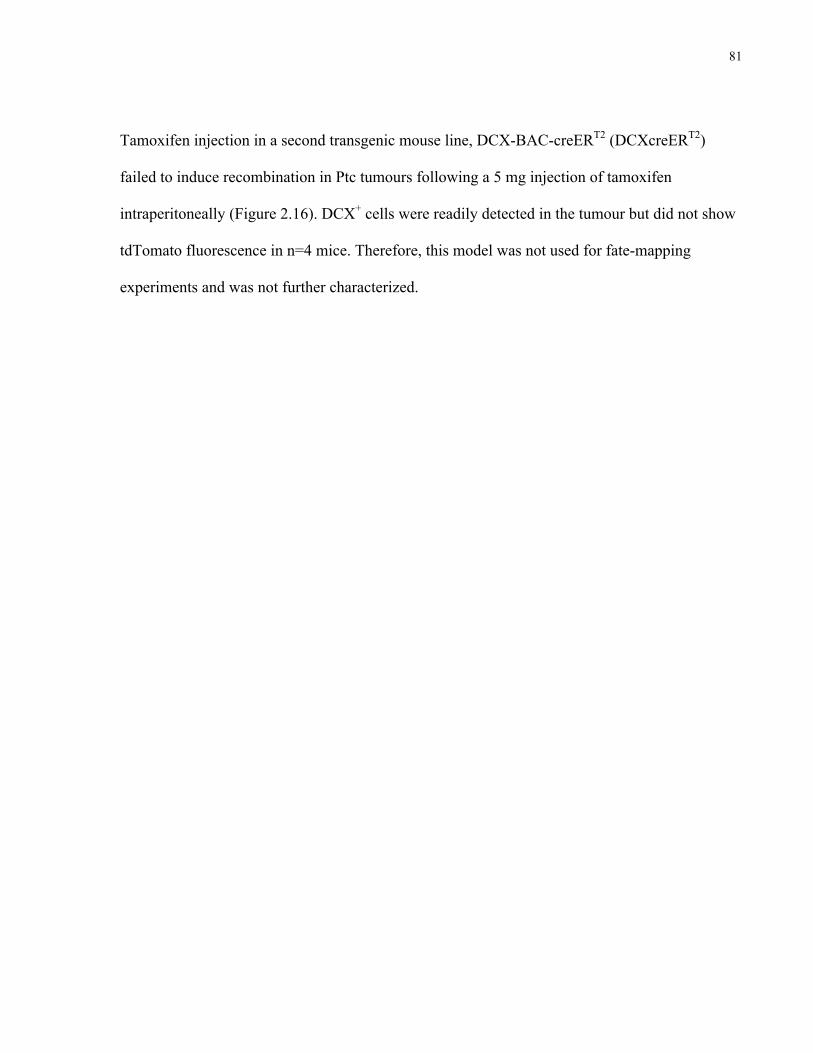
81
Tamoxifen injection in a second transgenic mouse line, DCX-BAC-creERT2 (DCXcreERT2)
failed to induce recombination in Ptc tumours following a 5 mg injection of tamoxifen
intraperitoneally (Figure 2.16). DCX+ cells were readily detected in the tumour but did not show
tdTomato fluorescence in n=4 mice. Therefore, this model was not used for fate-mapping
experiments and was not further characterized.
82
Figure 2.16 tdTomato fluorescence in DCXcreER2 tumours was not detectable 48 hours post tamoxifen.
Representative images of tdTomato, DAPI and DCX immunofluorescence 48 hours post tamoxifen show no tdTomato signal. Scale bar represents 13 µm.
83
2.5 Discussion
By dissecting the biology of Ptc medulloblastoma’s constituent cell types I have established a
paradigm for tumour expansion as a hierarchy that mirrors cerebellar neurogenesis. Adult and
developmental neurogenesis, including generation of the granule neurons in the cerebellum,
begins with multipotent neural stem cell differentiation into a progenitor pool that transiently
expands and ultimately produces mature neurons (Hatten and Roussel, 2011; Ming and Song,
2011). Rare, Sox2+ cells were quiescent in contrast to the majority of Ptc tumour cells, including
DCX+ progenitors, which were rapidly proliferating. NeuN+ cells were post-mitotic and were not
appreciably cycling. Tracking EdU label showed that differentiated NeuN+ cells are the
immediate progeny of DCX+ cells, just as occurs in cerebellar development and adult
neurogenesis. Strikingly, labelled NeuN+ cells were short-lived and susceptible to apoptosis.
Nascent NeuN+ cerebellar granule neurons are primed by Bax to undergo apoptosis as an integral
part of IGL development (Garvia et al., 2013). This biology seems to be maintained in NeuN+
tumour cells that, as a consequence of being non-proliferative and liable to apoptosis, do not
contribute to tumour expansion. Interestingly, SHH medulloblastoma models in which pro-
apoptotic genes are deleted exhibit the paradox of increased differentiation and reduced tumour
latency (Garcia et al., 2013; Metcalfe et al., 2013). I propose that in such models NeuN+ cells
accumulate due to impaired apoptosis, inflating tumour volume causing mass effects, disease
manifestation and death. In retrospective studies, patients whose medulloblastoma showed higher
levels of neuronal differentiation experienced greater overall survival (Grotzer et al., 2000;
Miyahara et al., 2013).
84
Approximately 10% of Ptc cells were unlabelled following a chronic 7 day EdU
treatment, indicating that not all cells within a tumour divide in a week. Our data suggest that
Sox2+ cells, comprising 3-5% of the tumour divide approximately once in three weeks while
DCX+ progenitors divide at least once per day. Since NeuN+ cells inherit EdU label from their
DCX+ predecessors, both of these populations are expected to label to virtually one hundred
percent, as was observed. Unlabelled cells would include Sox2+ cells that do not divide, tumour
vasculature, non-proliferative infiltrative cells, and perhaps another highly-quiescent malignant
population. The character and existence of this putative dormant population is unknown. In
chronic labelling of mouse breast tumours and human leukemia with tritiated thymidine, neither
study marked 100% of cells, though all mitoses in the breast cancers were labelled. While it is
possible that certain cells escape labelling or spuriously incorporate thymidine analogue labels as
part of DNA repair processes, my results were consistent using distinct thymidine analogues,
labeling schemes, Ki67 staining and in line with the past literature.
The single-pulse EdU labelling experiment showed that DCX+ cells are self-sustaining in
the short term as the fraction of labelled cells only decreased slightly between one and three days
post-injection. If this population differentiated and was lost immediately after proliferating the
frequency of labelled DCX+ cells would have immediately declined after 1 day of chase. The
increase in EdU+ DCX+ cells from 3 hours to 1 day post-label suggests that some DCX+ cells
divide to produce DCX+ progeny and expand the progenitor pool. Because EdU label is
eventually passed to NeuN+ cells, DCX progenitors must not divide more than 4-5 times before
differentiating, which would dilute the label below levels of detection. Therefore, Ptc progenitors
can undergo between 1 and 4 divisions before differentiating to become NeuN+. Virtually all
85
marked NeuN+ cells are gone four days after they label, suggesting that they die by apoptosis
between 1-3 days after being born.
While I cannot rule out heterogeneity in the Sox2+ population, multiple lines of evidence
point towards these cells being slowly cycling. Firstly, most cells are Ki67-. Secondly, they
acquire and dilute thymidine analogue label slowly and maintain it longer than most tumour
cells. If there were a large highly proliferative pool of Sox2+ cells, labelling would not be linear
as was observed during the chronic EdU administration and the fraction of labelled Sox2+ cells
would be much higher than the 1% observed in the single EdU label-chase experiment. The
proportion of Sox2+ cells labelled by a single EdU injection declined minimally, and only at the
latest timepoint, in a 14 day chase. Also, since some Sox2+ cells continuously slowly cycle,
being marked by both CldU and IdU in the double-labelling experiment, these cells must not all
be fast-cycling or simply dividing and acquiring label before a period of dormancy. These data
cannot rule out the possibility that there is a small fraction (<1%) of Sox2+ cells that are fast-
cycling and maintain label on an immortal template strand of DNA, though this template would
have to be the strand that gets labelled with the initial thymidine analogue exposure.
Sox2+ cells exhibited greater self-renewal in both in vitro and in vivo assays. Allograft
tumours were formed more reliably and at lower cell doses of Sox2+ cells, suggesting that this
quiescent population may be driving growth of primary tumours. Since DCX+ cells are rapidly
cycling and Sox2- transplants did reliably engraft at the highest cell dose, this fraction possesses
some tumour propagating capacity. However, this tumour propagating capability is limited. Cells
from Sox2- allografts could not generate a secondary tumour when serially propagated, while
86
cells from unsorted or Sox2-GFP+ cells reliably engrafted. Therefore, many Sox2- cells may be
highly proliferative but the population has limited self-renewal. In PDGF- or KRAS-driven
mouse gliomas, Id1low cells did not self-renew in vitro but were highly proliferative and rapidly
killed recipient mice upon transplantation, in contrast to Id1high cells which showed greater
sphere-formation but increased tumour latency (Barrett et al., 2012). The authors confirmed
Id1low cells did not revert to the Id1high state but serial transplantation was not tested. In mouse
squamous skin tumours, Sox2- cells rarely formed tumours and those that did arise could not be
serially propagated, indicating diminished self-renewal (Boumahdi et al., 2014). A rigorous
clonal analysis of zebrafish ALL demonstrated that proliferative capacity is a distinct malignant
property from self-renewal: there was no correlation between tumour latency – a measure of cell
proliferation – and the frequency of leukemia-propagating cells within a clone (Blackburn et al.,
2014). Similarly, proliferation rate and self-renewal are distinct properties in Ptc
medulloblastoma. Multiple genetically and functionally distinct stem cell fractions were recently
identified in Ptch1+/- mouse medulloblastomas (Chow et al., 2014). In this analysis, mouse
tumours were categorized as sphere-forming in EGF- and FGF-containing medium, growth
factor free medium, or non-sphere forming. These tumour classes varied in tumour-propagating
cell frequency, gene expression profile and type of genetic mutations. Intriguingly, EGF and
FGF dependent tumours were found to arise from GFAP+ neural stem cells while non-sphere
forming tumours were generated by GNPCs in Math1creER mice. Unfortunately, the authors did
not test for the potential that multiple types of tumour-propagating cells coexist within a single
tumour. Since my work was conducted with mice irradiated at birth, it is possible that mutations
hit multiple cell types to create multiple classes of tumour-propagating cells existing in constant
87
competition during tumour growth. Sox2+ cells may represent a unique class or be part of
multiple distinct compartments.
The modern definition of a cancer stem cell is one that can be prospectively isolated from
a primary malignancy to engraft an immunodeficient mouse and phenocopy the original disease.
Immunophenotype alone was subsequently shown to be inadequate for cancer stem cell
identification (Goardon et al., 2011) and cancers for which tumour-propagating cells are not rare
have been cited as evidence in favor of a stochastic versus hierarchical model for tumour growth
(Meacham and Morrison, 2013; Quintana et al., 2010). More recently, elegant studies using
animal models of intestinal adenocarcinoma and squamous skin tumours demonstrated clonal-
level hierarchical tumour growth from stem cells that self-renew and differentiate, presenting
strong evidence in favor of the cancer stem cell hypothesis (Driessens et al., 2012; Schepers et
al., 2012). My lineage tracing data show that Sox2+ cells drive growth of primary, unmanipulated
Ptc medulloblastoma by self-renewing and differentiating into the heterogeneous cell types that
comprise the tumour. Self-renewal was demonstrated based on the frequency of tdTomato-
labelled Sox2+ cells, which remained constant over time. If there were an exogenous source that
significantly contributed to the Sox2+ pool, the fraction of tdTomato+ Sox2+ cells would decrease
following tamoxifen injection. Together with the EdU labelling data, the observation that the
fraction of NeuN+ cells in the tdTomato+ population increases over time suggests that tumour
growth resembles the growth pattern of stem cell to progenitor to differentiated neuron observed
in neurogenesis. This caricature of a developmental program as a model for cancer growth is
reminiscent of Clarkson et al’s tracking of H3-thymidine from the marrow to peripheral blood in
88
leukemia, or Pierce and colleagues studying the early phase of teratoma growth from embryonal
carcinoma cell through to mature endoderm, ectoderm or mesodermal structures.
Data obtained from lineage tracing in the ‘unfaithful’ DCXcreER1 mouse corroborate a
model in which relatively rare cells contribute to tumour growth in a hierarchical fashion.
However, the observation that the number of Sox2+ cells marked with tdTomato increased over
time conflicts with the tracing data from Sox2creER mice in which the fraction of labelled Sox2+
cells remained constant. The conflicting data suggests that the Sox2+ cells labelled in 21 day
traces are produced from the cells marked 48 hours post-injection (60% of which express Sox2).
One potential interpretation of this result is that not all Sox2+ cells are self-renewing, otherwise
the fraction of marked (and unmarked) Sox2+ cells would remain constant. Since the fraction of
unmarked Sox2+ cells decreases, these cells must not be self-renewing in the long term. Whether
they are differentiated cells that do not contribute to tumour growth or simply are lost by
undergoing symmetrical differentiation divisions as they contribute to tumour growth is
unknown. This particular DCXcreER1 mouse has not been carefully characterized in the
literature and showed variable results in my experiments. Since mouse strain determines
response to mutagenizing radiation, a process already fraught with variability, the DCXcreER1
mouse background may also have contributed to the conflicting results. Another possibility is
that the Sox2+ cells that become marked over time represent that 20% of cells that are never
marked in Sox2creER traces. In the Sox2creER knock-in, approximately 80% of Sox2+ cells
were labelled with a 5 mg dose of tamoxifen, whereas with the transgenic CreER 20% of Sox2+
cells were labelled. This begs the question: are the 20% of cells marked by the transgenic CreER
line complementary to the 80% of cells marked by the Sox2creER line, together comprising the
89
entire Sox2+ population? Summing the lineage traces from both experiments would total 70% of
tumour cells marked in three weeks. This may be the upper limit of Sox2+ cell contribution to
tumour growth. If the Sox2+ cells marked in the two different mice are indeed distinct
populations, it will be of great interest to understand how and why they differ and whether they
interconvert. Furthermore, it raises the idea that there could be an intermediate cell between the
Sox2+ cell and the DCX+ progenitor, or the DCX+ progenitors themselves, that generates the
remaining 30% of tumour cells that are not marked by either Sox2-trace.
This work reconciles transplantation and lineage tracing approaches by using both
prospective isolation and genetic fate mapping to show that Sox2+ cells propagate MB. That both
methods support a Sox2+ cell-driven model suggests that functionally defined tumour-
propagating cells from human tumours may also drive growth in patients’ cancers, which would
make them essential therapeutic targets. Furthermore, my data support a hierarchical model for
Ptc tumour growth with a Sox2+ cell at the apex. Sox2+ cells were long-lived, self-renewing, and
drove growth in primary and allograft tumours. Sorted Sox2- cells exhibited a ten-fold lower
tumour-propagating cell frequency and the tumours they formed could not be serially
transplanted indicating diminished self-renewal. Despite being highly proliferative, DCX+ cells
differentiated into post-mitotic NeuN-expressing cells that are short lived, minimizing their
impact on long-term growth. In 2 of 3 tumours derived from Sox2- cells, very rare (<1%) Sox2+
GFP+ cells were detected. A similar observation was made in squamous skin cancer transplants
derived from Sox2- cells. These cells could be the products of dedifferentiation or simply
contamination from impure cell-sorts (purity of ~95%). In both my study and Boumahdi et al,
tumours derived from Sox2- cells could not be serially transplanted indicating that either the
90
fraction of Sox2+ cells was simply too low or putative dedifferentiation was incomplete.
Spontaneous dedifferentiation to the Sox2+ state is likely infrequent, if it occurs at all, since the
fraction of tdTomato+ Sox2+ cells remained constant in prolonged traces in Sox2creER mice.
I have characterized a functionally defined medulloblastoma-propagating cell population as
slowly cycling. This has important clinical implications, since most medulloblastoma therapies
including chemotherapeutic agents and ionizing radiation preferentially affect cycling cells.
Perivascular nestin+ cells were radiation resistant in a Shh-driven medulloblastoma model
(Hambardzumyan et al., 2008) and a more recent study found that quiescent nestin+ glioma cells
contribute to tumour regrowth following chemotherapy (Chen et al., 2012). Therefore, as in
hematological malignancies, quiescence may be a common trait of multiple types of brain
tumour stem cells. CFSE-retaining glioma cells were tumour-initiating in orthotopic transplants,
but their relative self-renewal compared to non-label-retaining cells was not reported (Deleyrolle
et al., 2011). My work did not directly compare the self-renewal potential of quiescent versus
cycling medulloblastoma cells and used Sox2 as a surrogate marker for slowly dividing cells.
Whether the quiescent state is integral to the self-renewal of Sox2+ medulloblastoma cells, as it is
for Sox2+ neural stem cells (Kippin et al., 2005; Mira et al., 2010), is unknown. Understanding
the mechanisms that govern the quiescent Sox2+ state may present opportunities for tailored
therapy in medulloblastom and other brain tumours. Breaking the quiescence of chronic
myelogenous leukemia stem cells by inhibiting prosurvival B-cell lymphoma 2 (BCL2) family
members or blocking promyelocytic leukemia (PML) sensitizes them to tyrosine kinase
inhibition or ara-c ablation, respectively (Goff et al., 2013; Ito et al., 2008). Disrupting regulators

91
of the quiescent state is an appealing therapeutic option for medulloblastoma that may
compromise their self-renewal or sensitize them to anti-mitotic therapies.
92
Chapter 3 Targeting Sox2+ cells in SHH subgroup medulloblastoma
3.1 Published material and author contributions
Part of this work has been published in:
Vanner RJ, Remke M, Gallo M, Selvadurai HJ, Coutinho F, Lee L, Kushida M, Head R,
Morrissy S, Zhu X, Aviv T, Voisin V, Clarke ID, Li Y, Mungall AJ, Moore RA, Ma Y, Jones
SJM, Marra MA, Malkin D, Northcott PA, Kool M, Pfister SM, Bader G, Hochedlinger K,
Korshunov A, Taylor MD, Dirks PB. 2014. Quiescent Sox2+ Cells Drive Hierarchical Growth
and Relapse in Sonic Hedgehog Subgroup Medulloblastoma. Cancer Cell 26(1):33-47.
Sections of text and figures have been reproduced in this chapter with permission from Cancer
Cell.
I conducted all experiments and data analysis besides the following: M Remke performed the
hierarchical clustering and k means consensus clustering of human tumours and correlated the
results with patient outcomes. He also scored TMA SOX2 immunoreactivity with me. V Voisin
helped to perform GSEA. F Countinho was responsible for qPCR validation of microarray
results. M Kushida helped perform the NCI library drug screen, measured subcutaneous tumour
volume and managed the NSG mouse colony. L Lee helped maintain the animal colony and
monitor mice during treatment follow-up. Y Li, AJ Mungall, RA Moore, Y Ma, SJM and MA
Marra comprised the BCGSC team that performed RNA and DNA sequencing on material from
93
tumours M693 and M698. S Morrissy analyzed the RNA and DNA sequencing results. A
Korshunov provided the tissue microarray (TMA) and an independent assessment of the SOX2
immunoreactivity. D Malkin, PA Northcott, M Kool, SM Pfister and MD Taylor contributed
primary human tumour samples or microarray gene expression data from primary human tumour
samples. All work besides the DNA and RNA sequencing was performed in the laboratory of Dr.
Peter B Dirks who helped to conceive of and supervised the project.
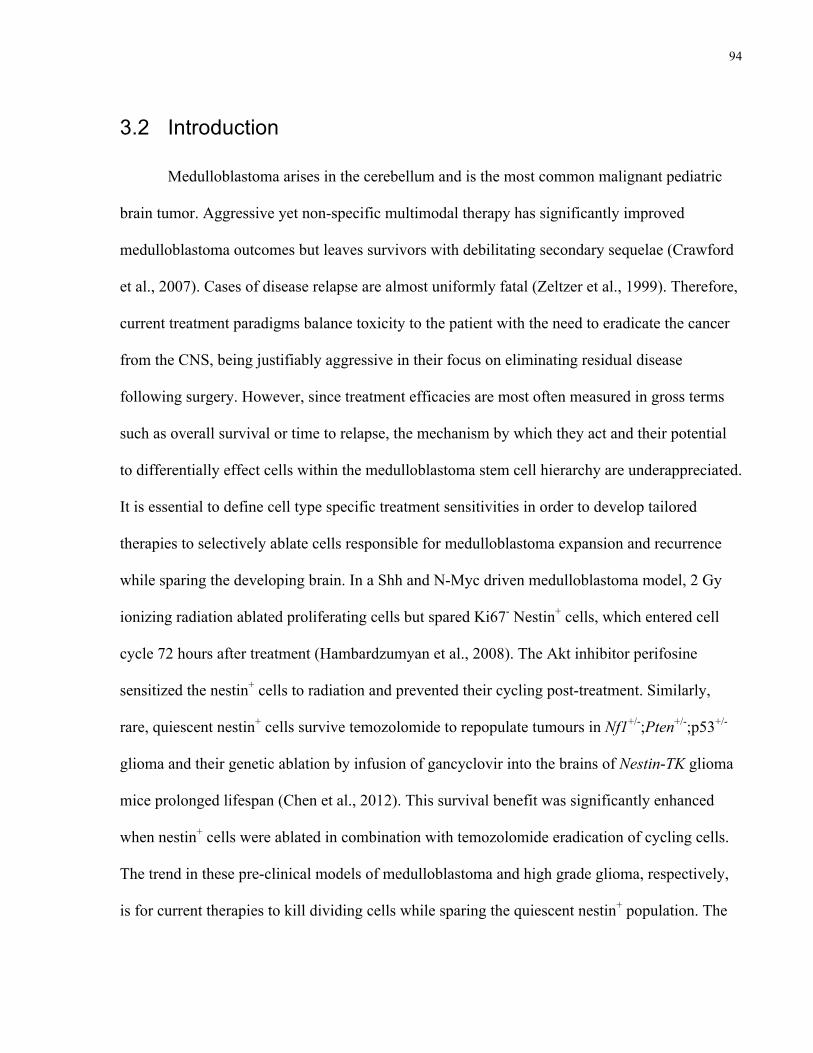
94
3.2 Introduction
Medulloblastoma arises in the cerebellum and is the most common malignant pediatric
brain tumor. Aggressive yet non-specific multimodal therapy has significantly improved
medulloblastoma outcomes but leaves survivors with debilitating secondary sequelae (Crawford
et al., 2007). Cases of disease relapse are almost uniformly fatal (Zeltzer et al., 1999). Therefore,
current treatment paradigms balance toxicity to the patient with the need to eradicate the cancer
from the CNS, being justifiably aggressive in their focus on eliminating residual disease
following surgery. However, since treatment efficacies are most often measured in gross terms
such as overall survival or time to relapse, the mechanism by which they act and their potential
to differentially effect cells within the medulloblastoma stem cell hierarchy are underappreciated.
It is essential to define cell type specific treatment sensitivities in order to develop tailored
therapies to selectively ablate cells responsible for medulloblastoma expansion and recurrence
while sparing the developing brain. In a Shh and N-Myc driven medulloblastoma model, 2 Gy
ionizing radiation ablated proliferating cells but spared Ki67- Nestin+ cells, which entered cell
cycle 72 hours after treatment (Hambardzumyan et al., 2008). The Akt inhibitor perifosine
sensitized the nestin+ cells to radiation and prevented their cycling post-treatment. Similarly,
rare, quiescent nestin+ cells survive temozolomide to repopulate tumours in Nf1+/-;Pten+/-;p53+/-
glioma and their genetic ablation by infusion of gancyclovir into the brains of Nestin-TK glioma
mice prolonged lifespan (Chen et al., 2012). This survival benefit was significantly enhanced
when nestin+ cells were ablated in combination with temozolomide eradication of cycling cells.
The trend in these pre-clinical models of medulloblastoma and high grade glioma, respectively,
is for current therapies to kill dividing cells while sparing the quiescent nestin+ population. The

95
residual cells are proposed to form a reservoir for tumour relapse but this capacity was not tested
directly. Multi-agent therapies, or broadly effective treatments that together target the stem and
differentiated tumour cell compartments, could eliminate the population driving recurrence and
may yield the greatest therapeutic effects (Figure 3.1).
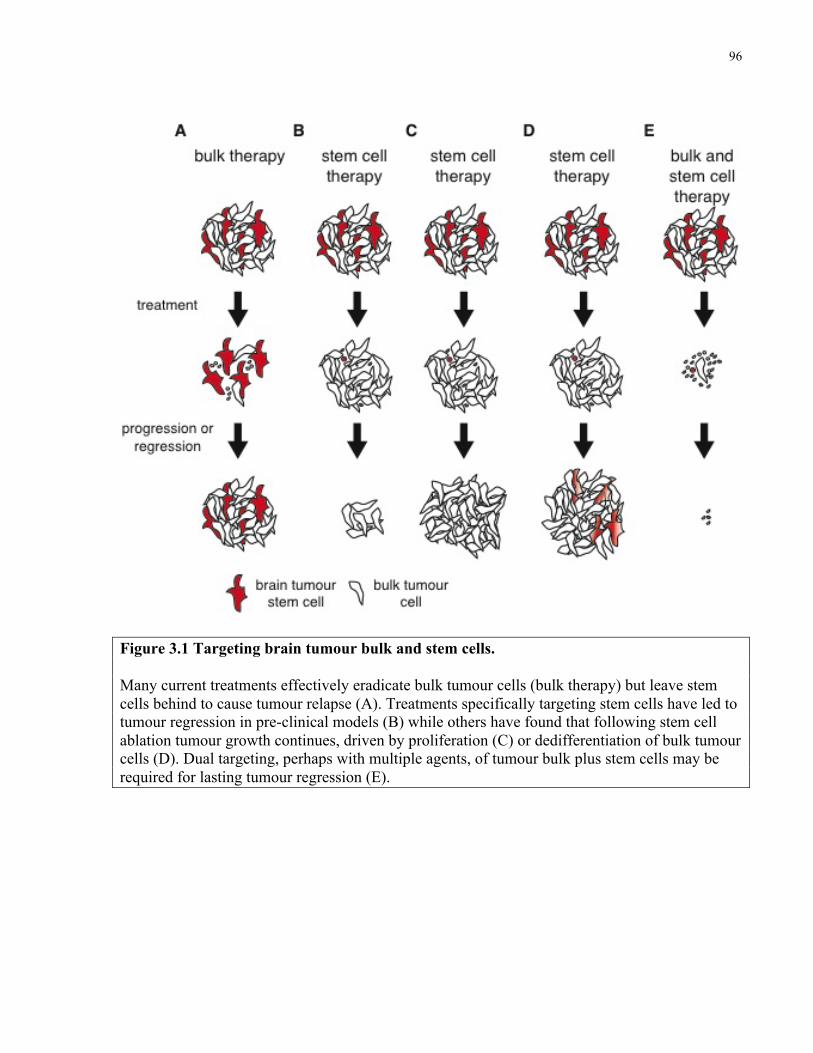
96
Figure 3.1 Targeting brain tumour bulk and stem cells. Many current treatments effectively eradicate bulk tumour cells (bulk therapy) but leave stem cells behind to cause tumour relapse (A). Treatments specifically targeting stem cells have led to tumour regression in pre-clinical models (B) while others have found that following stem cell ablation tumour growth continues, driven by proliferation (C) or dedifferentiation of bulk tumour cells (D). Dual targeting, perhaps with multiple agents, of tumour bulk plus stem cells may be required for lasting tumour regression (E).
97
Thirty percent of MB diagnoses present aberrant SHH signaling due to loss of function in
negative regulators including PTCH1 and SUFU, activating mutations in positive transducers
such as SMO and amplifications in transcriptional effectors like GLI2 (Northcott et al., 2012a).
SHH-pathway inhibitors are entering MB clinical trials to define subgroup specific therapy,
though laboratory and clinical reports of resistance suggest an insensitive cell type may be spared
(Kool et al., 2014; LoRusso et al., 2011; Rudin et al., 2009; Yauch et al., 2009). The two
principle drugs in this class currently in clinical trial for medulloblastoma are LDE-225
(Erismodegib, clinical trial NCT01708174) and GDC-0449 (Vismodegib, clinical trial
NCT01239316). Genetic determinants of relapse are well defined. Rare, pre-existing SMO
variants with SNVs preventing drug binding to Smoothened can be selected for by therapy to
generate a resistant relapse tumour (Yauch et al., 2009). Alternatively, tumours can be resistant
to Smoothened inhibitors de novo if the SHH pathway has been genetically activated
downstream of SMO by amplification of GLI2 or MYCN or loss of function mutation in SUFU
(Kool et al., 2014). How medulloblastoma’s heterogeneous cell types are differentially affected
by Smoothened inhibitors has not been investigated. Differences may reflect distinct levels of
SHH pathway activity or variable dependence on the pathway for survival. Granule neuron
progenitor cells in the mouse external granule layer of the cerebellum depend on Shh signaling to
proliferate (Wallace, V., 1999). Therefore, cycling medulloblastoma populations may be
particularly sensitive to Smoothened inhibition and Shh-pathway blockade.
A concern when studying mouse models of cancer is their relevance and applicability to human
disease. Gene expression analysis of multiple mouse models of Shh-subgroup medulloblastoma,
98
including Ptc mice, showed they transcriptionally resemble human SHH medulloblastoma
patients, although this similarity was greater for adult than pediatric patients (Poschl et al., 2014).
The gene expression signature of CD15+ cells from Ptc mouse tumours was inversely correlated
with outcome in human medulloblastoma patients of all subgroups, suggesting clinical relevance
for mouse medulloblastoma-propagating cells (Read et al., 2009). Since the biology of the Ptc
model is comparable to human tumours, it makes for an excellent preclinical tool. Correlations
between tumour self-renewal and patient outcome highlight the need to understand and eradicate
cancer stem cells. Therefore, it is imperative to determine any link between the biology of the Ptc
mouse medulloblastoma stem cell and human SHH medulloblastomas. In many retrospective
analyses, brain tumour samples with higher degrees of stem cell features are derived from
patients that suffer greater mortality: Tumoursphere formation was found to be an independent
negative prognosticator for both pediatric brain tumour (Panosyan et al., 2010) and adult high
grade glioma (Pallini et al., 2008; Laks et al., 2009) patients and the presence of proliferating
CD133+ cells in primary glioblastoma specimens predicted worse overall survival (Pallini et al.,
2011). Glioblastoma patients whose tumours express stem cell-derived signatures experience
significantly worse overall survival (Yan et al., 2011; Pietras et al., 2014, Kappadunkel et al.,
2010; Engstrom et al., 2012; Ernst et al., 2009; Murat et al., 2008; Gaspar et al., 2010; Glinsky et
al., 2010). Similarly in medulloblastoma, expression of stem cell-associated gene signatures and
immunoreactivity for stem cell markers have been negatively correlated with survival (Glinsky et
al., 2010; Read et al., 2009; Rodini et al., 2012; Sutter et al., 2010). The correlation of stem cell
characteristics with early death in brain tumours suggests that BTSCs may be driving disease
99
progression and relapse. The prognostic relevance of Sox2+ cells in human SHH
medulloblastoma has not been explored.
Here I aim to determine the clinical relevance of Sox2+ cells in SHH medulloblastoma,
identify cell-type specific responses to therapy and attempt to overcome cellular determinants of
relapse. I hypothesize that therapy will differentially effect the functionally distinct cell
populations within medulloblastoma. Cells that are less sensitive to therapy are predicted to be
enriched by treatment and thus more likely to contribute to tumour relapse. If a particular biology
is associated with treatment resistance, this cell’s properties may be associated with worse
outcome in human patients. Targeting the biology of the resistant cell may yield a novel
therapeutic strategy to prevent the recurrence of medulloblastoma.
100
3.3 Methods
Mice
Ptch1+/- mice (Goodrich et al., 1997) were maintained by breeding with CD1 mice from The
Jackson Laboratory. Sox2creER mice (Arnold et al., 2011) and Sox2-eGFP mice (Ellis et al.,
2004) (provided by Dr. Freda Miller, Toronto Hospital for Sick Children) were crossed to CD1
Patched1+/- mice. B6;129S6-Gt(ROSA)26Sortm9(CAG-tdTomato)Hze/J (Rosa-CAG-LSL-tdTomato) and
5-7 week old NOD.Gc-Prkdcscid Il2rgtm1Wjl/SzJ (NSG) mice were purchased from The Jackson
Laboratory. Experimental Ptc mice were administered 3Gy γ-radiation from a Cesium-137
source at birth. 50 mg/kg GDC-0449 (Selleck Chemical) was administered once daily in 0.5%
Methylcellulose 0.2% TWEEN 80 buffer by gastric gavage. Cytarabine (ara-c, Sigma) or 0.9%
saline vehicle was delivered by intracranial microosmotic pump for 5 days as previously
described (Doetsch et al., 1997). Cre-recombination for lineage tracing was achieved by injecting
6 week old mice intraperitoneally with 5 mg tamoxifen (Sigma) dissolved in sesame oil.
Subcutaneous-tumour bearing NSG mice were administered 1 mg/kg mithramycin (Cayman
Chemical) by intraperitoneal injection in PBS vehicle on Monday, Wednesday and Friday for a
total of 9 doses or every second day for a total of 4 doses. Ptc mice were administered 0.75
mg/kg mithramyic on Monday, Wednesday and Friday from day 28 for 6 weeks. Mice were
housed at The Hospital for Sick Children Laboratory Animal Services. All experimental
procedures were approved by The Hospital for Sick Children’s Animal Care Committee.
Patient samples
101
All tumour samples were procured after receiving informed consent from patients, and all
experimental procedures were performed in accordance with the Research Ethics Board at The
Hospital for Sick Children (Toronto, Canada) and the respective collaborating institutions.
Approval to link laboratory data to clinical and pathological data was obtained from the
respective institutional review boards.
FACS and flow cytometry
Human medulloblastoma cell cultures were detached from culture flasks using Accutase and
washed in PBS prior to being passed through 70 µm then 40 µm filters to generate a single cell
suspension. Flow cytometry was performed using a BD FACSAria III at the Sickkds Flow
Cytometry Facility. Apoptosis was measured using the BD Biosciences Annexin V apoptosis kit
according to the manufacturer’s instructions. Gates were determined using fluorescence minus
one controls. Data were analyzed using FloJo software.
Gene expression analysis
Microarray analysis was performed using the Affymetrix Mouse Gene 2.0 ST array on 4
biological replicates of matched pooled primary Sox2+ and Sox2- cells from primary Ptc; Sox2-
eGFP FACS sorted tumours (3 pooled sorts of Sox2+ or Sox2- cells to one biological replicate).
Microarray data were first processed using robust multichip analysis (RMA) normalization.
Principal component analysis (PCA) and hierarchical clustering were performed using Partek
Genomics Suite 6.6. Differentially expressed genes were detected by one-way ANOVA in Partek
Genomics Suite 6.6 with an FDR of <0.05 and analyzed by Ingenuity Pathway Analysis
(Ingenuity Systems). Gene set enrichment analysis (GSEA) was performed using GSEA v2.0.12
102
with probes ranked by t-test and significance determined by 2000 phenotype permutations
(Subramanian et al., 2005). Minimum geneset size was 8 and maximum was 650. Multiple probe
sets per gene were collapsed using the median of probes.
Microarray analysis was performed on subcutaneous PBS or mithramycin treated Ptc tumours
using the Affymetrix Mouse Transcriptome Assay 1.0 chip. RMA normalized data were
analyzed using Affymetrix Transcriptome Analysis Console Software to identify differentially
expressed genes. Genes significantly (>2 fold and p<0.05, one-way ANOVA) downregulated by
mithramycin were analyzed using DAVID software (www.david.abcc.ncifcrf.gov) to identify
KEGG pathways enriched in the gene set.
Accession numbers
Microarray data described in this publication are accessible at www.ncbi.nlm.nih.gov/geo/ under
the accession numbers GSE48766 (mouse Sox2-GFP+ and Sox2-GFP-) and GSE50765 (human
medulloblastoma samples). DNA and RNA sequencing data are accessible at
https://www.ebi.ac.uk/ega/home under the accession number EGAD00001000818.
Statistical methods
Data were analyzed and statistics performed using Graphpad Prism v6.0b. Limiting dilution
analyses were analyzed using ELDA (Hu and Smyth, 2009). Pooled data are reported as the
mean ± SEM.
Immunohistochemistry
103
Mice were transcardially perfused using ice-cold PBS followed by 4% paraformaldehyde (PFA).
Whole brains were dissected and fixed overnight in 4% PFA. Samples were then washed briefly
in cold PBS and equilibrated in 30% sucrose at 4 °C for 48 hours after which they were
embedded in TissuTek-OCT (Sakura Finetek) and flash frozen. Frozen tissues were sectioned on
a cryotome at -20 °C. EdU incorporation was detected using an EdU Imaging Kit (Invitrogen).
Antibodies used include: Sox2 (Abcam ab97959), Doublecortin (Abcam 18723), NeuN
(Chemicon MAB377), SP1 (Millipore 07-645) and phospho-histone 3 (Cell Signaling 9701).
Images were acquired with a Quorum Spinning Disk Confocal Microscope (Olympus) running
Volocity software (Perkin Elmer).
PCR
The following primers were used for quantitative PCR performed using SsoFast Evagreen
Supermix (Bio Rad) and analyzed using Opticon Monitoring Software run on a PTC-200
Thermocycler (Bio Rad): Gli1 Forward (F): 5’-CCACAGGCACACAGGATCACC-3’, Reverse
(R): 5’-ACAGACTCAGGCTCAGGCTTCTC-3’ ; Atoh1 F: 5’-
CCTTCCAGCAAACAGGTGAATG-3’, R: 5’-GTTCAGCCCGTGCATCCTG-3’ ; Sox2 F: 5’-
ACAGATGCAACCGATGCACC-3’ ; 5’- TGGAGTTGTACTGCAGGGCG-3’ ; Dcx F: 5’-
CTGGAAGAAGGGGAAAGCTATG-3’ ; R: 5’-GTCTTTACGTTGACAGACCAG-3’; Rbfox3
F: 5’-GCCGCAGGCAGATGAAG-3’, R: 5’-GGATGTTGGAGACATGTAGTCG-3’ ; Olig2 F:
5’-CACAGGAGGGACTGTGTCCT-3’ , R: 5’-GGTGCTGGAGGAAGATGACT-3’ ; Hhip F:
5’-CAAAGTGGAATAAAGGGAGGAGAC-3’, R: 5’-CCTGGTTGGTGGTATAAGACAC-3’ ;
Actb F: 5’-GAT GAC CCA GAT CAT GTT TGA GAC-3’, R: 5’- CAC AGT GTG GGT GAC
104
CCC-3’ ; Gapdh F: 5’- GAA GGT GAA GGT CGG AGT CA-3’ ; R: 5’-GAC AAG CTT CCC
GTT CTC AG-3’.
Genomic Library Construction and Sequencing
Whole genome sequencing (WGS) was performed at the BCGSC according to an established
protocol (Morin et al., 2011). Tumour DNA of the medulloblastoma sample 3431 (A43274,
referred to as M693 in the text) and matched germline blood sample 3440 (A43290) were
sequenced on the Illumina HiSeq 2000/2500 platform, generating paired-end 100-bp reads using
v3 chemistry and HiSeq Control Software version 2.0.10 to achieve 42.5x and 33.5× redundant
coverage, respectively.
Alignment and SNV analysis of WGS-seq data
Illumina paired-end whole genome sequencing reads were aligned to the hg19 reference using
BWA version 0.5.7. This reference contains chromosomes 1-22, X, Y, MT, 20 unlocalized
scaffolds and 39 unplaced scaffolds. Multiple lanes of sequences were merged and duplicated
reads were marked with Picard's MarkDuplicates version picard-tools-1.71.
After merging, samtools mpileup (version 1.17) was used for SNV detection (–C50 and –ABuf
parameters). The per-chromosome SNV lists were then concatenated and filtered with samtools
varFilter with default parameters. Finally, SNVs with quality score >=20 were annotated with
SnpEff (Ensembl 66) and SnpSift (dbSNP137).
Messenger RNA library construction and sequencing
105
Two micrograms of total RNA samples from MDT-MB-3442 (M698 in the text) were arrayed
into a 96-well plate and polyadenylated (PolyA+) messenger RNA (mRNA) was purified using
the 96-well MultiMACS mRNA isolation kit on the MultiMACS 96 separator (Miltenyi Biotec,
Germany) with on-column DNaseI-treatment as per the manufacturer's instructions. The eluted
polyA+ mRNA was ethanol precipitated and resuspended in 10µL of DEPC treated water with
1:20 SuperaseIN (Life Technologies, USA). First-strand cDNA was synthesized from the
purified polyA+ mRNA using the Superscript cDNA Synthesis kit (Life Technologies, USA) and
random hexamer primers at a concentration of 5µM along with a final concentration of 1µg/µL
Actinomycin D, followed by Ampure XP SPRI beads on a Biomek FX robot (Beckman-Coulter,
USA). The second strand cDNA was synthesized following the Superscript cDNA Synthesis
protocol by replacing the dTTP with dUTP in dNTP mix, allowing the second strand to be
digested using UNG (Uracil-N-Glycosylase, Life Technologies, USA) in the post-adapter
ligation reaction and thus achieving strand specificity. The cDNA was quantified in a 96-well
format using PicoGreen (Life Technologies, USA) and VICTOR3V Spectrophotometer
(PerkinElmer, Inc. USA). The quality was checked on a random sampling using the High
Sensitivity DNA chip Assay (Agilent). The cDNA was fragmented by Covaris E210 (Covaris,
USA) sonication for 55 seconds, using a Duty cycle of 20% and Intensity of 5. Plate-based
libraries were prepared following the BC Cancer Agency's Michael Smith Genome Sciences
Centre (BCGSC) paired-end (PE) protocol on a Biomek FX robot (Beckman-Coulter, USA).
Briefly, the cDNA was purified in 96-well format using Ampure XP SPRI beads, and was
subject to end-repair and phosphorylation by T4 DNA polymerase, Klenow DNA Polymerase,
and T4 polynucleotide kinase respectively in a single reaction, followed by cleanup using
106
Ampure XP SPRI beads and 3’ A-tailing by Klenow fragment (3’ to 5’ exo minus). After
cleanup using Ampure XP SPRI beads, picogreen quantification was performed to determine the
amount of Illumina PE adapters used in the next step of adapter ligation reaction. The adapter-
ligated products were purified using Ampure XP SPRI beads, then PCR-amplified with Phusion
DNA Polymerase (Thermo Fisher Scientific Inc. USA) using Illumina’s PE primer set, with
cycle conditions of 98°C 30 seconds followed by 10-15 cycles of 98°C 10 seconds, 65°C 30
seconds and 72°C 30 seconds, and then 72°C 5 minutes. The PCR products were purified using
Ampure XP SPRI beads, and checked with a Caliper LabChip GX for DNA samples using the
High Sensitivity Assay (PerkinElmer, Inc. USA). PCR products with a desired size range were
purified using a 96-channel size selection robot developed at the BCGSC, and the DNA quality
was assessed and quantified using an Agilent DNA 1000 series II assay and Quant-iT dsDNA
HS Assay Kit using Qubit fluorometer (Invitrogen), then diluted to 8 nM. The final concentration
was verified by Quant-iT dsDNA HS Assay. The libraries, 2 per 100 PE lane, were sequenced on
the Illumina HiSeq 2000/2500 platform using v3 chemistry and HiSeq Control Software version
2.0.10.
Alignment and SNV analysis of RNA-seq data
RNA sequencing data was aligned to GRCh37-lite genome-plus-junctions reference (Morin et
al., 2008) using BWA (version 0.5.7) (Li and Durbin, 2009). This reference is a combination of
GRCh37-lite assembly and exon-exon junction sequences with coordinates defined based on
transcripts in Ensembl (v61), Refseq and known genes from the UCSC genome browser (both
were downloaded from UCSC in November 2011; The GRCh37-lite assembly is available at
107
http://www.bcgsc.ca/downloads/genomes/9606/hg19/1000genomes/bwa_ind/genome). BWA
was run with default parameters, except for the inclusion of the (-s) option to disable the Smith-
Waterman alignment. Reads failing the Illumina chastity filter were flagged with a custom
script, and duplicated reads were flagged with Picard Tools (version 1.31). After the alignment,
the junction-aligned reads that mapped to exon-exon junctions were repositioned to the genome
as large-gapped alignments and tagged with "ZJ:Z".
After repositioning, hg19-aligned BAM files were split into positive-fragment and negative-
fragment BAM files. Unmapped and improperly paired aligned reads were put into the mix-
fragment BAM file and not used for SNV calling. SNVs were then detected using SNVMix2
(Goya et al., 2010) with parameters Mb and Q30. The SNVs were further filtered to exclude
those called based on 1) reference base N; 2) only 1 read supports the variant; 3) probability of
heterozygous and homozygous of variant allele smaller than 0.99; 4) a position overlapping with
insertions or deletions; 5) read supports from positions no more than 5 bases from read ends; 6)
supports from reads only spanning an exon-exon junction; 7) more than 0.5 proportion of
supporting reads were improper paired; 8) fewer than 2 proper-paired supporting reads. All
SNVs (without filtering) were included for genes of interest PTCH, SUFU, SMO and TP53.
These SNVs were then annotated with SnpEff (Ensembl 66) and SnpSift (dbSNP137 and
COSMIC64).
Stereotactic implantation of tumour cells
6-9 week old NSG mice were anaesthetized using gaseous isoflurane and immobilized in a
stereotaxic head frame. An incision was made at the midline and bore-hole drilled using a 21G
108
needle 1mm lateral and 2mm posterior to lambda. Cells were injected 2.5mm deep to the surface
of the skull using a Hamilton syringe and 27 G needle over a period of 3 minutes. To avoid
reflux the needle was left in place for 4 minutes after injection and gradually withdrawn over 3
minutes. The bore-hole was then filled with bone wax and incision closed with 5.0 sutures. Mice
were observed for signs of tumour formation or sacrificed after 6 months of follow-up.
Survival analysis using MPC gene signature
Genes differentially expressed between microarrays from Sox2+ and Sox2- primary Ptc cells with
an FDR of <0.05 and fold-change ≥2 were used to generate an MPC gene signature (Partek
Genomics Suite 6.6). To apply this gene signature to human samples, mouse to human probe
conversion was performed using Ensembl Biomart (www.ensembl.org) with a cutoff of ≥80%
human homology. This produced a signature of 242 genes. Human SHH medulloblastoma
samples, a subset of which have been previously published (Northcott et al., 2012c), with well-
annotated clinical data were profiled using the Affymetrix Human Gene 1.1 ST array with RMA
normalization performed using Expression Console (Affymetrix). Consensus clustering was
performed using Gene Pattern (www.genepattern.broadinstitute.org) with a k-Means clustering
algorithm measuring Euclidean distance. Unsupervised hierarchical clustering was performed
using Pearson correlation in Gene Pattern. Survival of the three groups was compared in a
Kaplan-Meier survival curve analyzed using log-rank test.
Tissue microarray
A tissue microarray of 305 human medulloblastoma and 10 normal cerebellum samples was
stained for SOX2 expression (Abcam ab97959) using the Vectastain Elite ABC Kit (Vector
109
Labs). The frequency of SOX2+ cells in each sample was evaluated semiquantitatively by three
independent observers (Andrey Korshunov, Marc Remke, Robert Vanner) blinded to clinical and
molecular variables. Samples were binned into high and low expressing groups based on a
frequency of greater or less than 20% SOX2 immunoreactivity and compared using a Kaplan-
Meier survival curve analyzed by log-rank test.
Cell culture
Human SHH-Medulloblastoma cultures were established by plating mechanically dissociated
primary human SHH-subgroup medulloblastoma cells on PLO/laminin-coated Primaria plates
(BD Falcon) in serum-free medium containing EGF and FGF as previously described (Pollard et
al., 2009). Established cultures are given the designation NS following their tumour number to
distinguish them from primary patient samples (i.e. M698NS versus M698). Primary Ptc or
SHH-subgroup human medulloblastoma tumours were mechanically dissociated to single cells
prior to culture as neurospheres in in vitro limiting dilution analyses as previously described
(Singh et al., 2004; Ward et al., 2009). Secondary sphere assays were performed by dissociating
primary neurospheres using Accutase (Simga) and replating in fresh media without drug. GDC-
0449 (Selleck Chemical) and Mithramycin (Cayman Chemical) were dissolved in DMSO. The
NCI Oncology Drug Set library was dissolved in DMSO and administered to cells at a final
concentration of 500 nM. Cell viability was assessed 5 days later by Alamar Blue. Dose response
analyses were conducted in a similar manner, with Alamar Blue used to assess cell viability after
5 days of drug treatment.
Western Blotting
110
Cells or tissues were lysed in a denaturing lysis buffer that preserves phosopho-tyrosine residues
as previously described. Protein lysates were separated on a sodium-dodecyl-sulfate (SDS)-
containing 10% polyacrylamide gel by electrophoresis then transferred by electrophoresis to a
polyvinylidenedifluoride (PVDF) membrane. PVDF membranes were blocked using 5% milk or
bovine serum albumin in a 0.1% Tween-20 Tris-buffered saline solution overnight at 4 °C then
stained sequentially with primary and secondary antibodies at room temperature in blocking
buffer. Secondary antibodies were conjugated to horseradish peroxidase and detected by
chemiluminescence with a gel dock.
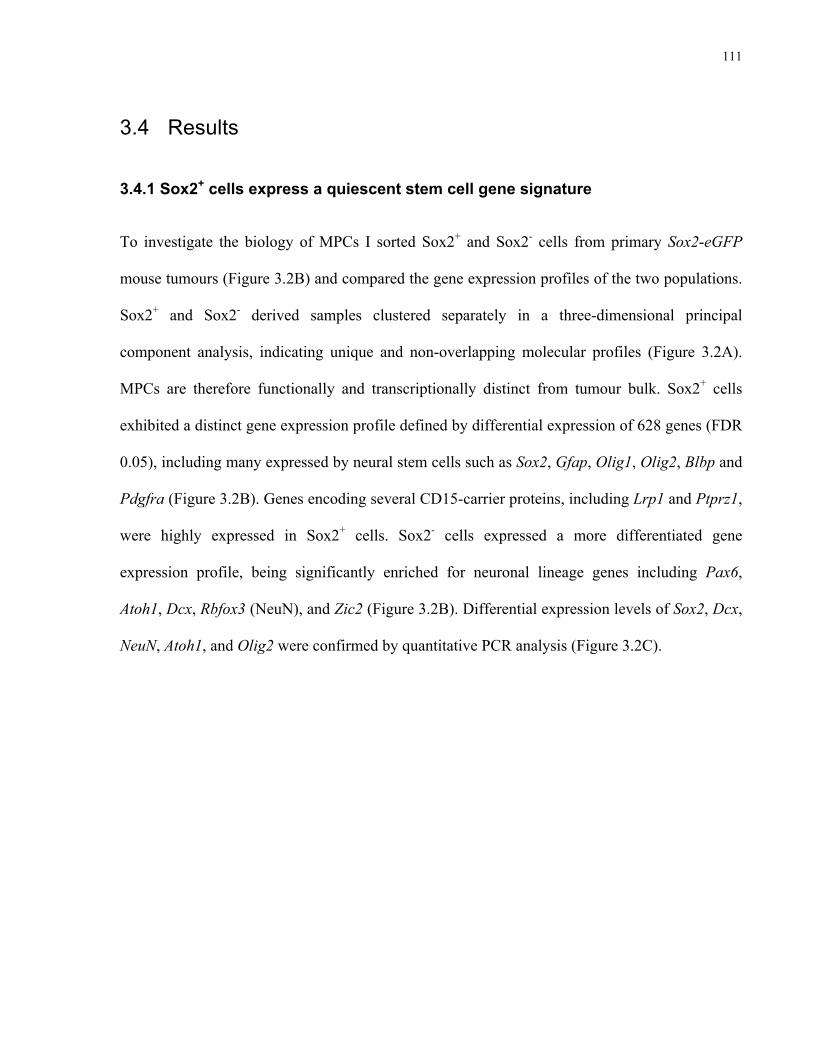
111
3.4 Results
3.4.1 Sox2+ cells express a quiescent stem cell gene signature
To investigate the biology of MPCs I sorted Sox2+ and Sox2- cells from primary Sox2-eGFP
mouse tumours (Figure 3.2B) and compared the gene expression profiles of the two populations.
Sox2+ and Sox2- derived samples clustered separately in a three-dimensional principal
component analysis, indicating unique and non-overlapping molecular profiles (Figure 3.2A).
MPCs are therefore functionally and transcriptionally distinct from tumour bulk. Sox2+ cells
exhibited a distinct gene expression profile defined by differential expression of 628 genes (FDR
0.05), including many expressed by neural stem cells such as Sox2, Gfap, Olig1, Olig2, Blbp and
Pdgfra (Figure 3.2B). Genes encoding several CD15-carrier proteins, including Lrp1 and Ptprz1,
were highly expressed in Sox2+ cells. Sox2- cells expressed a more differentiated gene
expression profile, being significantly enriched for neuronal lineage genes including Pax6,
Atoh1, Dcx, Rbfox3 (NeuN), and Zic2 (Figure 3.2B). Differential expression levels of Sox2, Dcx,
NeuN, Atoh1, and Olig2 were confirmed by quantitative PCR analysis (Figure 3.2C).
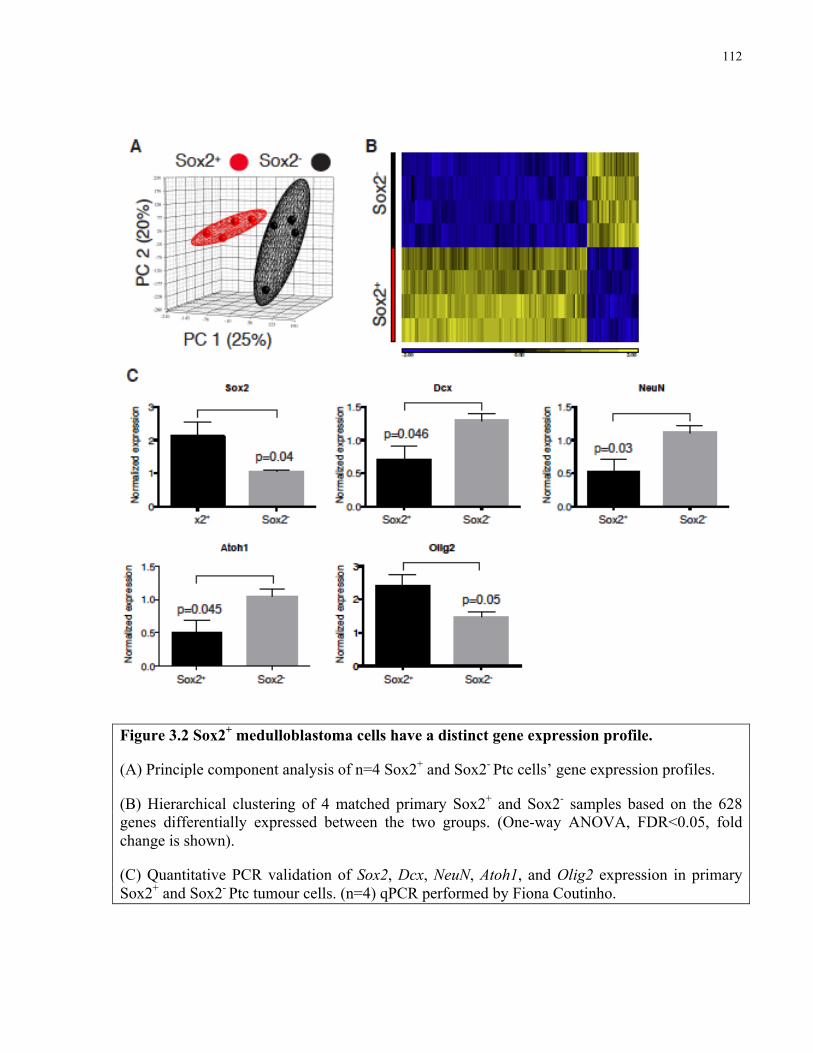
112
Figure 3.2 Sox2+ medulloblastoma cells have a distinct gene expression profile.
(A) Principle component analysis of n=4 Sox2+ and Sox2- Ptc cells’ gene expression profiles.
(B) Hierarchical clustering of 4 matched primary Sox2+ and Sox2- samples based on the 628 genes differentially expressed between the two groups. (One-way ANOVA, FDR<0.05, fold change is shown).
(C) Quantitative PCR validation of Sox2, Dcx, NeuN, Atoh1, and Olig2 expression in primary Sox2+ and Sox2- Ptc tumour cells. (n=4) qPCR performed by Fiona Coutinho.
113
Next, I used GSEA to investigate transcriptional similarities between MPCs expressing Sox2 and
previously characterized quiescent cell populations. Sets of genes significantly upregulated in
multiple quiescent stem cell populations, including neural stem cells (Martynoga et al., 2013)
were highly enriched in Sox2 expressing cells (Figure 3.3A-E). A gene set derived from rapidly
cycling granule neuron progenitor cells (Li et al., 2013) was significantly enriched in the Sox2-
population, confirming these cells’ proliferative and differentiated character (Figure 3.3F).
Therefore, MPCs exhibit a quiescent stem cell gene signature and may utilize common molecular
mechanisms to maintain their quiescence and self-renewal ability.
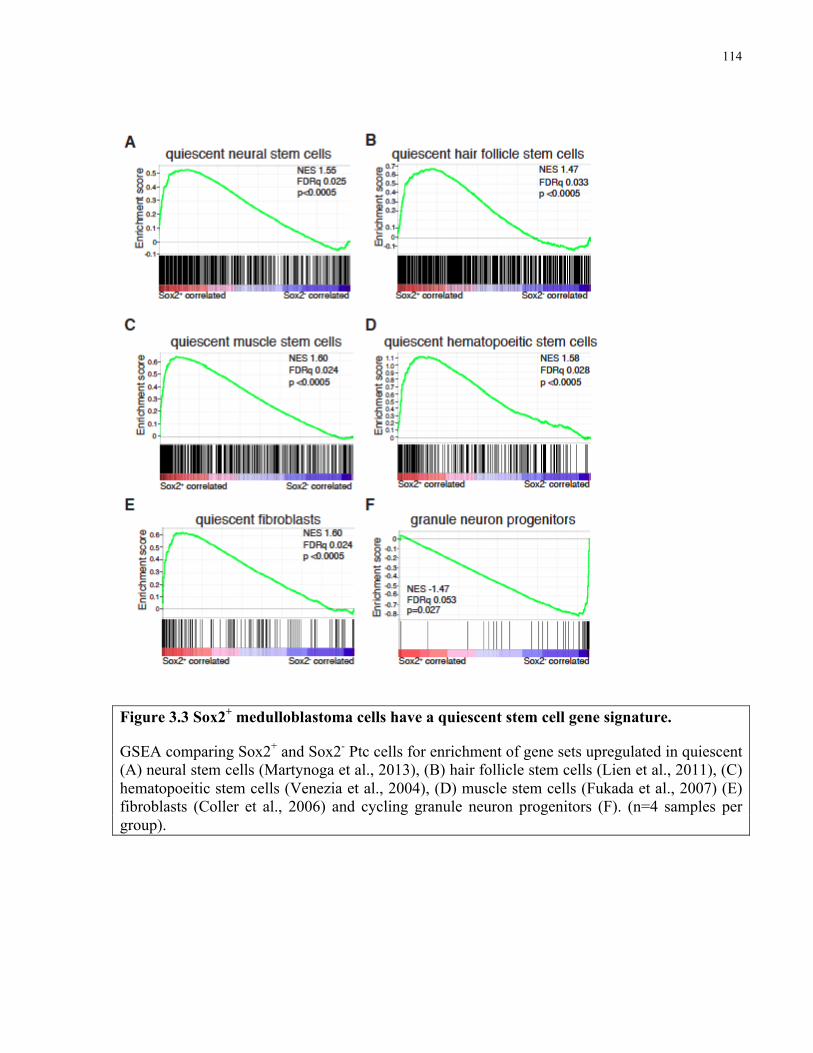
114
Figure 3.3 Sox2+ medulloblastoma cells have a quiescent stem cell gene signature.
GSEA comparing Sox2+ and Sox2- Ptc cells for enrichment of gene sets upregulated in quiescent (A) neural stem cells (Martynoga et al., 2013), (B) hair follicle stem cells (Lien et al., 2011), (C) hematopoeitic stem cells (Venezia et al., 2004), (D) muscle stem cells (Fukada et al., 2007) (E) fibroblasts (Coller et al., 2006) and cycling granule neuron progenitors (F). (n=4 samples per group).
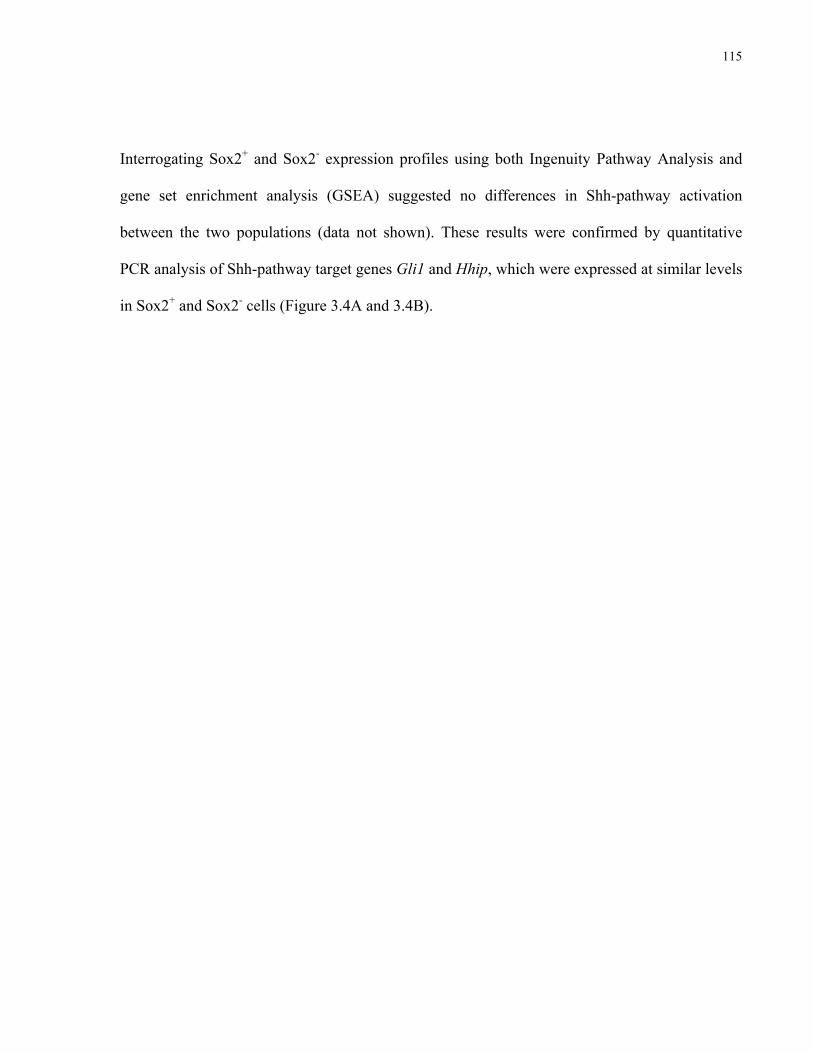
115
Interrogating Sox2+ and Sox2- expression profiles using both Ingenuity Pathway Analysis and
gene set enrichment analysis (GSEA) suggested no differences in Shh-pathway activation
between the two populations (data not shown). These results were confirmed by quantitative
PCR analysis of Shh-pathway target genes Gli1 and Hhip, which were expressed at similar levels
in Sox2+ and Sox2- cells (Figure 3.4A and 3.4B).
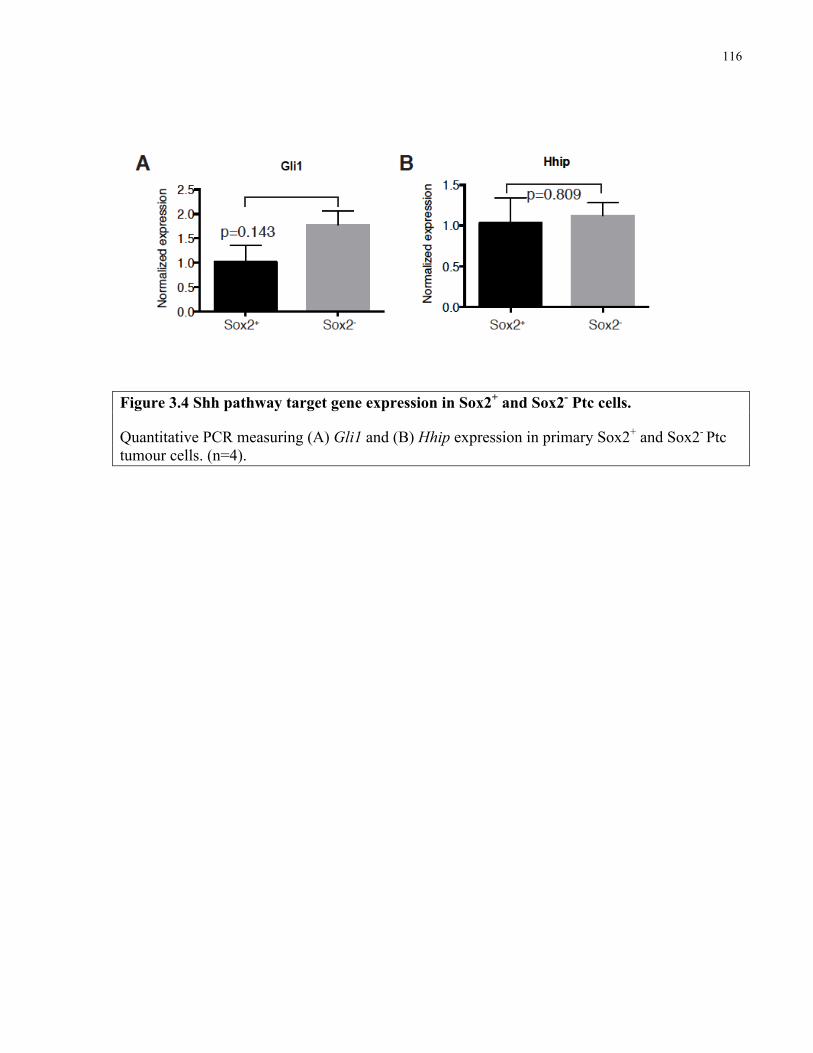
116
Figure 3.4 Shh pathway target gene expression in Sox2+ and Sox2- Ptc cells.
Quantitative PCR measuring (A) Gli1 and (B) Hhip expression in primary Sox2+ and Sox2- Ptc tumour cells. (n=4).
117
3.4.2 A Sox2+ cell signature defines SHH-MB patients with poor prognosis
For multiple malignancies, patients whose cancer exhibits greater expression of stem cell genes
have significantly worse prognosis (Eppert et al., 2011; Liu et al., 2007; Merlos-Suarez et al.,
2011; Zheng et al., 2013). To determine if this was also true for MB, I derived a MPC gene
signature from the human homologs of genes significantly differentially expressed in mouse
MPCs (Sox2+ cells) and analyzed gene expression profiles from 83 SHH-subgroup human MBs
for their relative expression of these genes (Figure 3.5). Consensus clustering and unsupervised
hierarchical clustering revealed three distinct groups with high, intermediate and low levels of
Sox2+/MPC signature expression (Figure 3.5). The three groups were highly reproducible
between the two methods, with only one discordant case.
118
Figure 3.5 A Ptc Sox2+ cell gene signature stratifies human SHH MB patients into three expression groups.
(A) Hierarchical clustering of n=82 SHH-subgroup MBs based on a mouse MPC gene signature.
(B) Consensus clustering by k-means of n=82 SHH-subgroup MBs based on a mouse MPC gene signature yields 3 identical groups save one outlier.
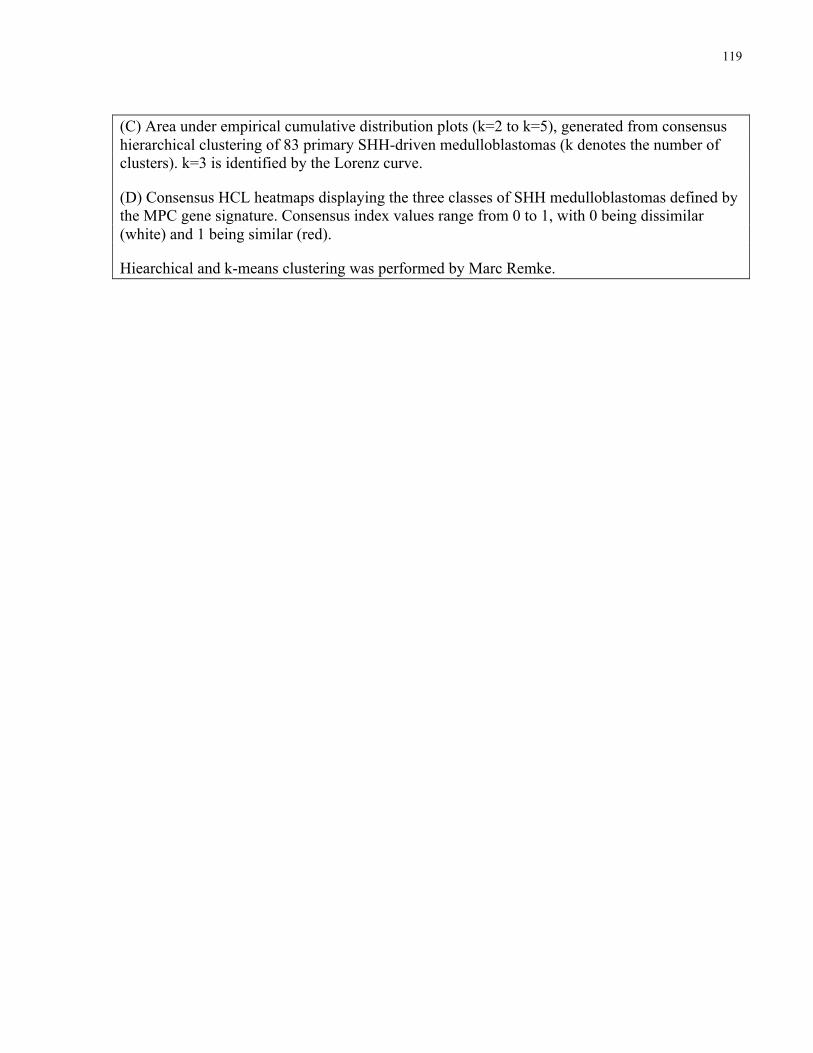
119
(C) Area under empirical cumulative distribution plots (k=2 to k=5), generated from consensus hierarchical clustering of 83 primary SHH-driven medulloblastomas (k denotes the number of clusters). k=3 is identified by the Lorenz curve.
(D) Consensus HCL heatmaps displaying the three classes of SHH medulloblastomas defined by the MPC gene signature. Consensus index values range from 0 to 1, with 0 being dissimilar (white) and 1 being similar (red).
Hiearchical and k-means clustering was performed by Marc Remke.

120
Patients with tumours of the MPC high group comprised 12% percent of all SHH-subgroup MBs
and were significantly enriched for tumours with large cell anaplastic (LCA) histology (Figure
3.6A and B).
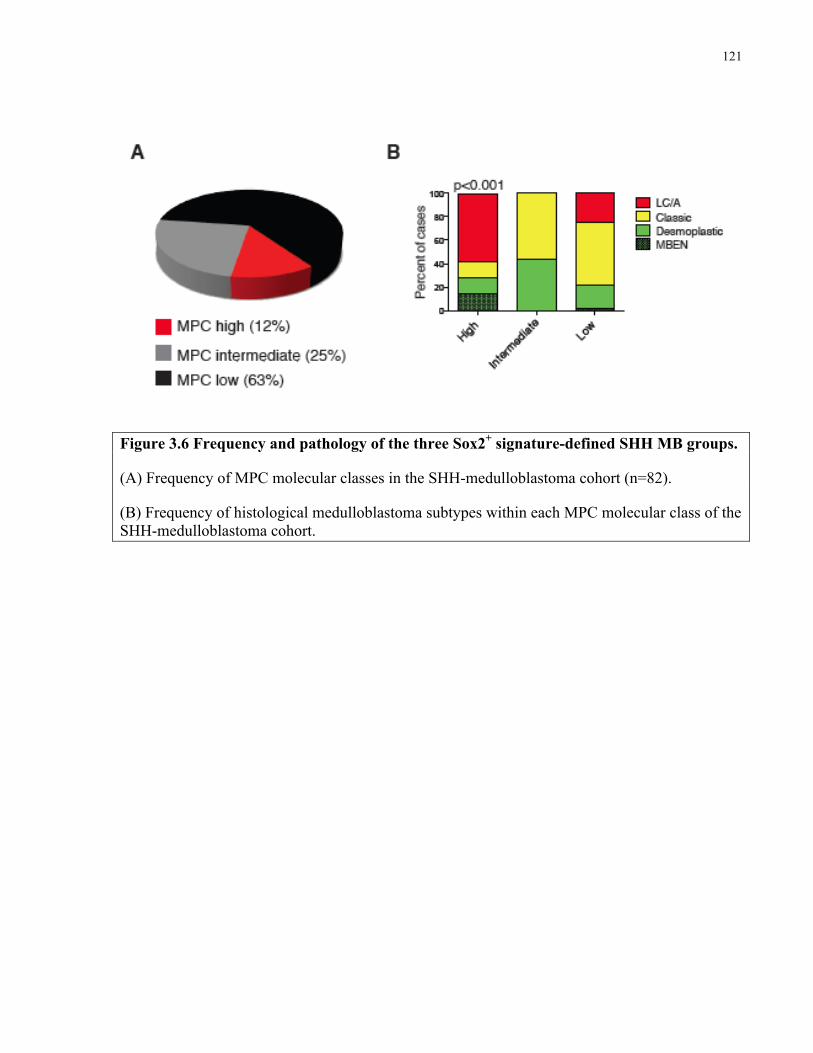
121
Figure 3.6 Frequency and pathology of the three Sox2+ signature-defined SHH MB groups.
(A) Frequency of MPC molecular classes in the SHH-medulloblastoma cohort (n=82).
(B) Frequency of histological medulloblastoma subtypes within each MPC molecular class of the SHH-medulloblastoma cohort.
122
Patients with high expression of the MPC signature had significantly worse prognosis (p=0.03)
than those in the MPC intermediate and low groups (Figure 3.7A). To substantiate the correlation
between the MPC signature and patient outcome I assessed a clinically well-annotated MB
tissue-microarray containing more than 300 primary tumour samples. The SOX2 protein level
was classified in a semi-quantitative fashion, segregating tumours into two groups: High SOX2
and Low SOX2 (Figure 3.7B). High SOX2-expressing tumours with 20% or greater
immunoreactivity were significantly more common within SHH-subgroup and Group 3 MBs
(Figure 3.7C). We found that high SOX2 expression was associated with significantly worse
overall survival in SHH-subgroup patients from this independent cohort (Figure 3.7D).
Remarkably, no patients with low SOX2 immunoreactivity died during follow-up. Taken
together, these findings indicate a clinical relevance for SOX2+ MB cells.
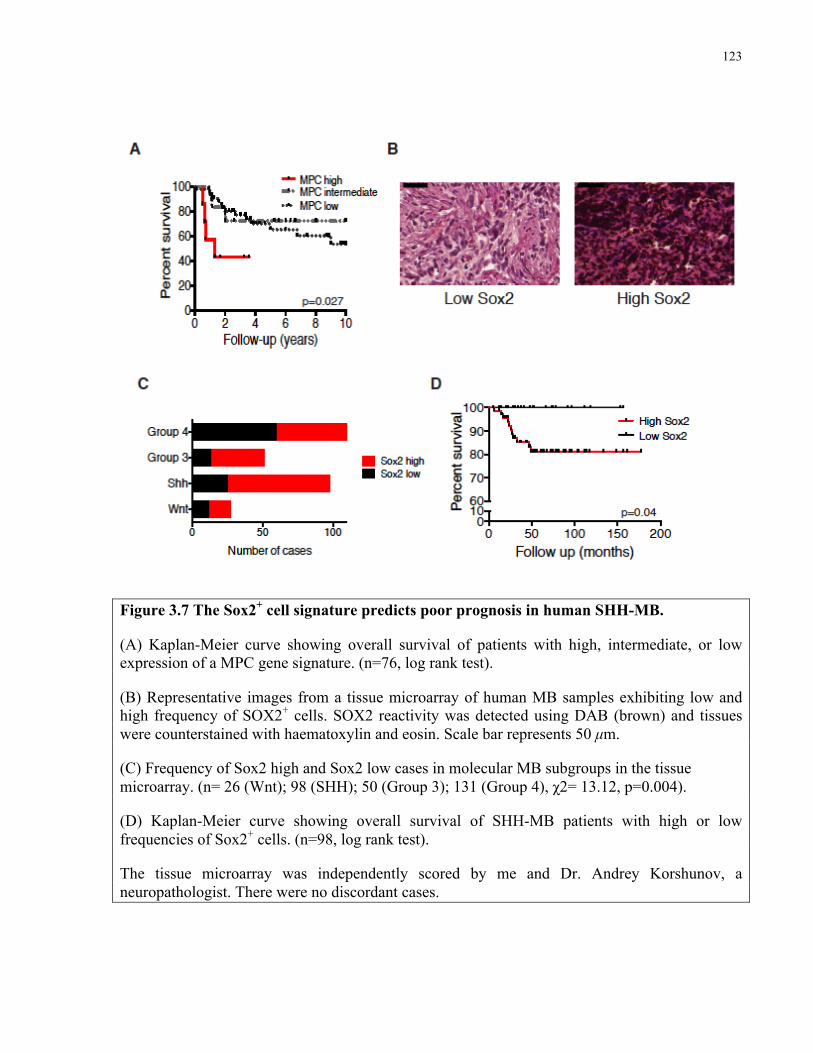
123
Figure 3.7 The Sox2+ cell signature predicts poor prognosis in human SHH-MB.
(A) Kaplan-Meier curve showing overall survival of patients with high, intermediate, or low expression of a MPC gene signature. (n=76, log rank test).
(B) Representative images from a tissue microarray of human MB samples exhibiting low and high frequency of SOX2+ cells. SOX2 reactivity was detected using DAB (brown) and tissues were counterstained with haematoxylin and eosin. Scale bar represents 50 µm.
(C) Frequency of Sox2 high and Sox2 low cases in molecular MB subgroups in the tissue microarray. (n= 26 (Wnt); 98 (SHH); 50 (Group 3); 131 (Group 4), χ2= 13.12, p=0.004).
(D) Kaplan-Meier curve showing overall survival of SHH-MB patients with high or low frequencies of Sox2+ cells. (n=98, log rank test).
The tissue microarray was independently scored by me and Dr. Andrey Korshunov, a neuropathologist. There were no discordant cases.
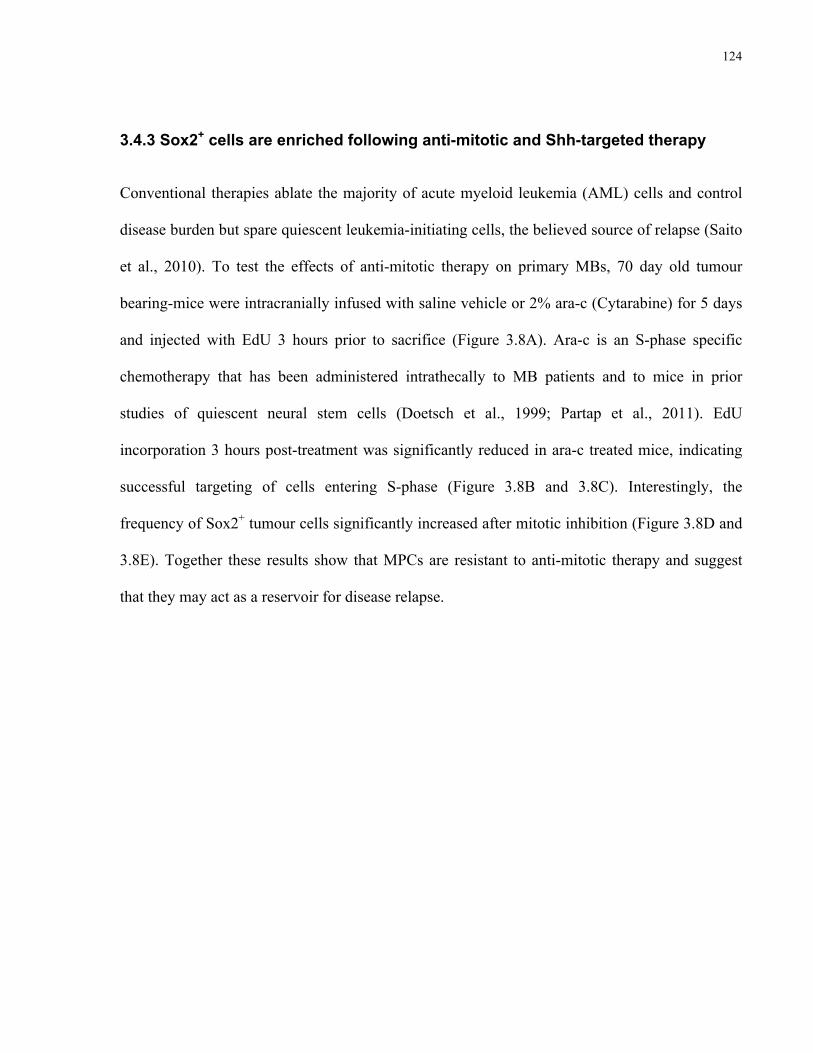
124
3.4.3 Sox2+ cells are enriched following anti-mitotic and Shh-targeted therapy
Conventional therapies ablate the majority of acute myeloid leukemia (AML) cells and control
disease burden but spare quiescent leukemia-initiating cells, the believed source of relapse (Saito
et al., 2010). To test the effects of anti-mitotic therapy on primary MBs, 70 day old tumour
bearing-mice were intracranially infused with saline vehicle or 2% ara-c (Cytarabine) for 5 days
and injected with EdU 3 hours prior to sacrifice (Figure 3.8A). Ara-c is an S-phase specific
chemotherapy that has been administered intrathecally to MB patients and to mice in prior
studies of quiescent neural stem cells (Doetsch et al., 1999; Partap et al., 2011). EdU
incorporation 3 hours post-treatment was significantly reduced in ara-c treated mice, indicating
successful targeting of cells entering S-phase (Figure 3.8B and 3.8C). Interestingly, the
frequency of Sox2+ tumour cells significantly increased after mitotic inhibition (Figure 3.8D and
3.8E). Together these results show that MPCs are resistant to anti-mitotic therapy and suggest
that they may act as a reservoir for disease relapse.
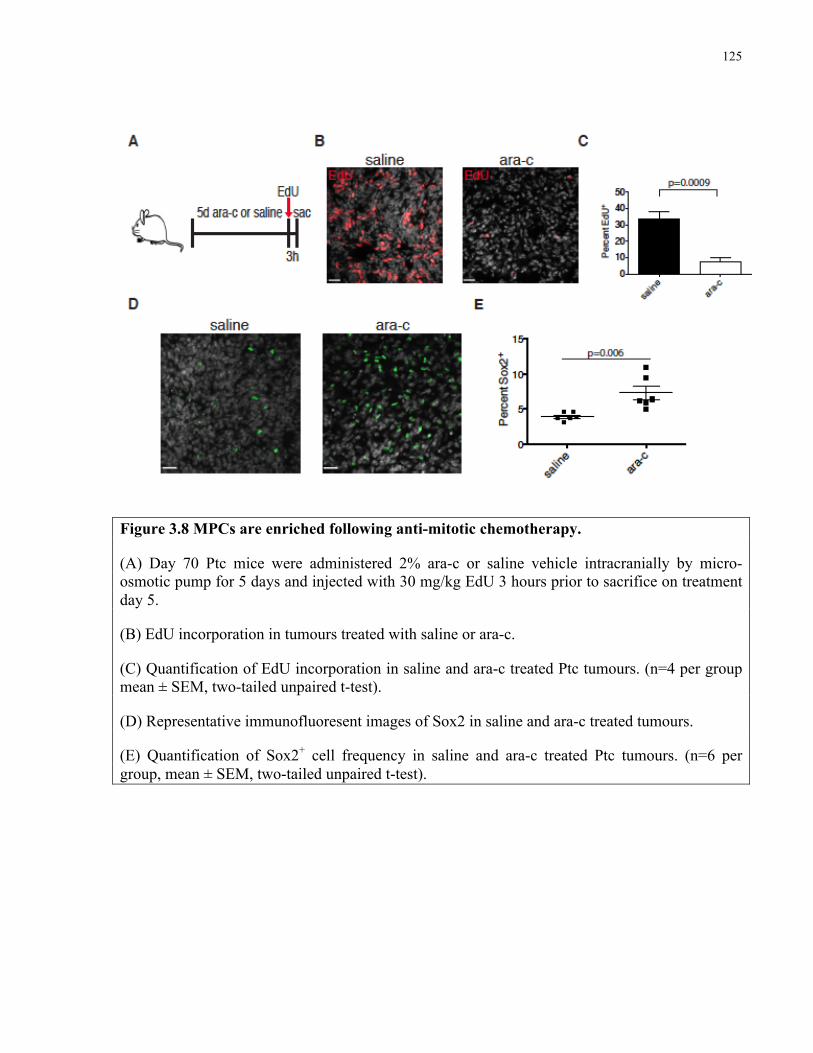
125
Figure 3.8 MPCs are enriched following anti-mitotic chemotherapy.
(A) Day 70 Ptc mice were administered 2% ara-c or saline vehicle intracranially by micro-osmotic pump for 5 days and injected with 30 mg/kg EdU 3 hours prior to sacrifice on treatment day 5.
(B) EdU incorporation in tumours treated with saline or ara-c.
(C) Quantification of EdU incorporation in saline and ara-c treated Ptc tumours. (n=4 per group mean ± SEM, two-tailed unpaired t-test).
(D) Representative immunofluoresent images of Sox2 in saline and ara-c treated tumours.
(E) Quantification of Sox2+ cell frequency in saline and ara-c treated Ptc tumours. (n=6 per group, mean ± SEM, two-tailed unpaired t-test).
126
GDC-0449 (Vismodegib), an inhibitor of SHH-signaling transducer Smoothened, is used to treat
basal cell carcinoma patients and is in clinical trials to abrogate dysregulated, oncogenic SHH-
signaling in MB and other SHH-driven cancers (Robarge et al., 2009). To examine the sensitivity
of MPCs to GDC-0449, day 70 Ptc mice were treated once daily with GDC-0449 or vehicle for 5
days and injected with EdU 3 hours prior to sacrifice (Figure 3.9A-C). EdU incorporation was
abolished in GDC-0449 treated tumours (Figure 3.9D and 3.9E), indicating a dependence of
proliferating tumour cells on Shh-signaling. Accordingly, Sox2+ cells were significantly enriched
in the residual tumours (Figure 3.9F and 3.9G). GDC-0449 treatment also increased apoptosis
and decreased the frequency of DCX+ cells (Figure 3.9H and 3.9I).
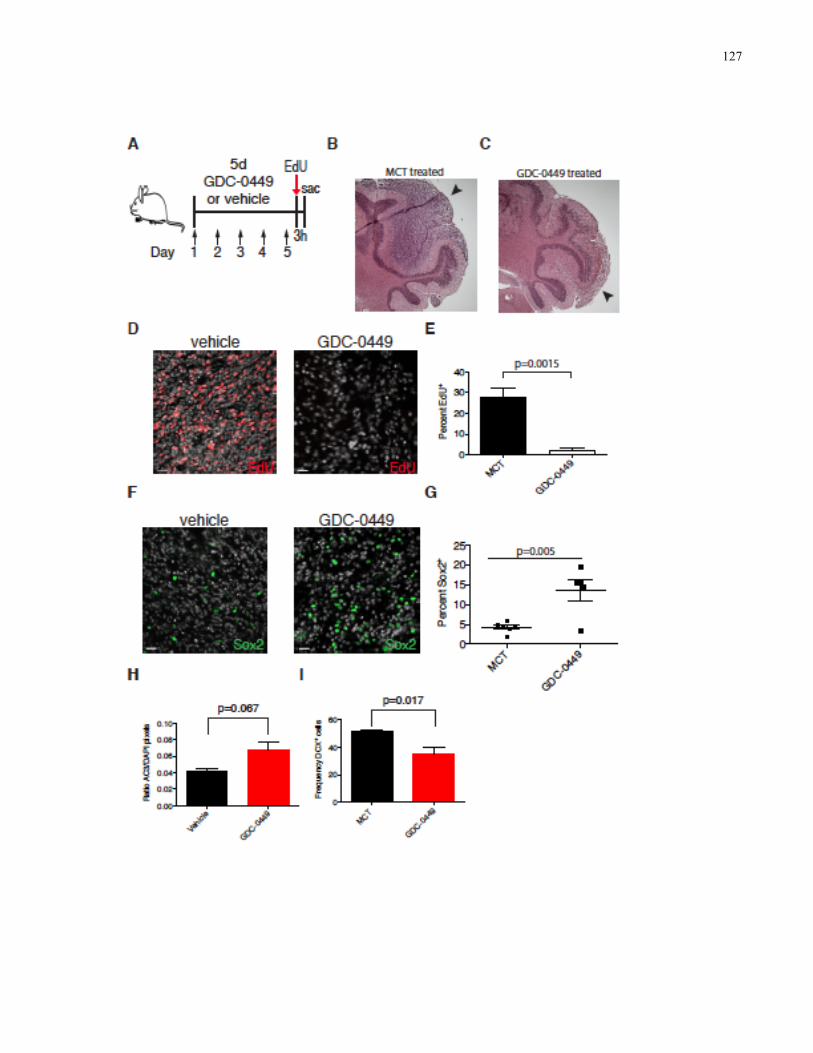
127
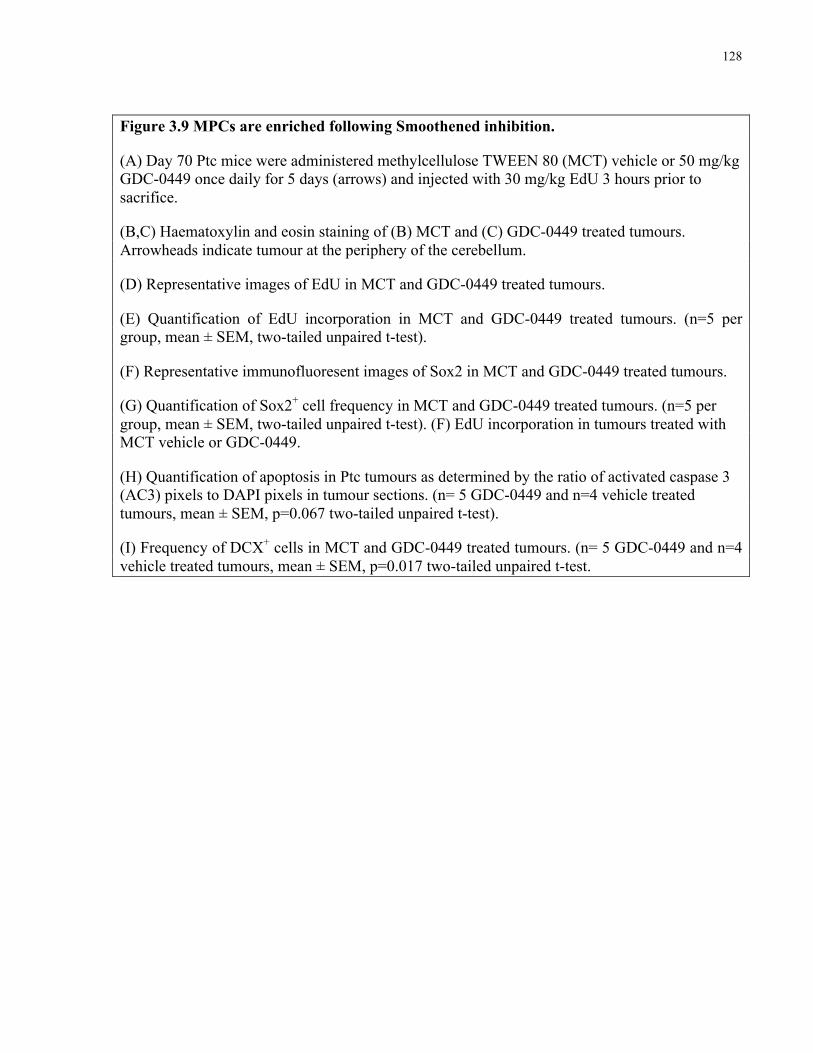
128
Figure 3.9 MPCs are enriched following Smoothened inhibition.
(A) Day 70 Ptc mice were administered methylcellulose TWEEN 80 (MCT) vehicle or 50 mg/kg GDC-0449 once daily for 5 days (arrows) and injected with 30 mg/kg EdU 3 hours prior to sacrifice.
(B,C) Haematoxylin and eosin staining of (B) MCT and (C) GDC-0449 treated tumours. Arrowheads indicate tumour at the periphery of the cerebellum.
(D) Representative images of EdU in MCT and GDC-0449 treated tumours.
(E) Quantification of EdU incorporation in MCT and GDC-0449 treated tumours. (n=5 per group, mean ± SEM, two-tailed unpaired t-test).
(F) Representative immunofluoresent images of Sox2 in MCT and GDC-0449 treated tumours.
(G) Quantification of Sox2+ cell frequency in MCT and GDC-0449 treated tumours. (n=5 per group, mean ± SEM, two-tailed unpaired t-test). (F) EdU incorporation in tumours treated with MCT vehicle or GDC-0449.
(H) Quantification of apoptosis in Ptc tumours as determined by the ratio of activated caspase 3 (AC3) pixels to DAPI pixels in tumour sections. (n= 5 GDC-0449 and n=4 vehicle treated tumours, mean ± SEM, p=0.067 two-tailed unpaired t-test).
(I) Frequency of DCX+ cells in MCT and GDC-0449 treated tumours. (n= 5 GDC-0449 and n=4 vehicle treated tumours, mean ± SEM, p=0.017 two-tailed unpaired t-test.
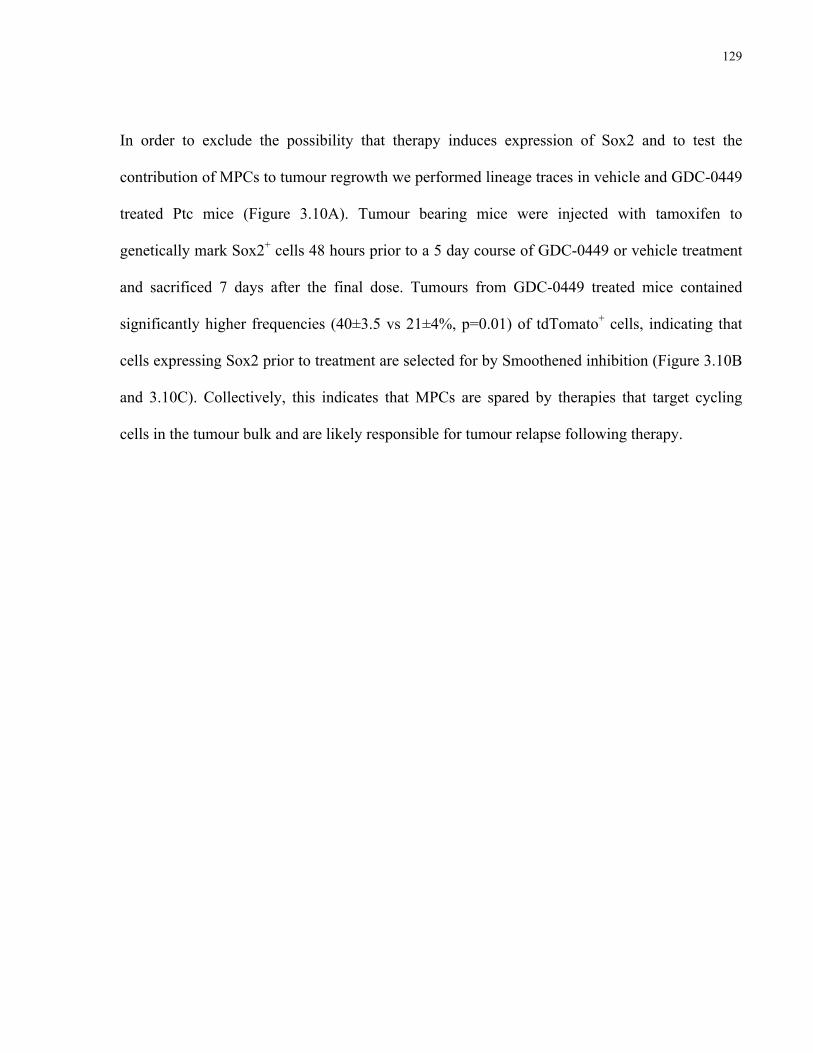
129
In order to exclude the possibility that therapy induces expression of Sox2 and to test the
contribution of MPCs to tumour regrowth we performed lineage traces in vehicle and GDC-0449
treated Ptc mice (Figure 3.10A). Tumour bearing mice were injected with tamoxifen to
genetically mark Sox2+ cells 48 hours prior to a 5 day course of GDC-0449 or vehicle treatment
and sacrificed 7 days after the final dose. Tumours from GDC-0449 treated mice contained
significantly higher frequencies (40±3.5 vs 21±4%, p=0.01) of tdTomato+ cells, indicating that
cells expressing Sox2 prior to treatment are selected for by Smoothened inhibition (Figure 3.10B
and 3.10C). Collectively, this indicates that MPCs are spared by therapies that target cycling
cells in the tumour bulk and are likely responsible for tumour relapse following therapy.
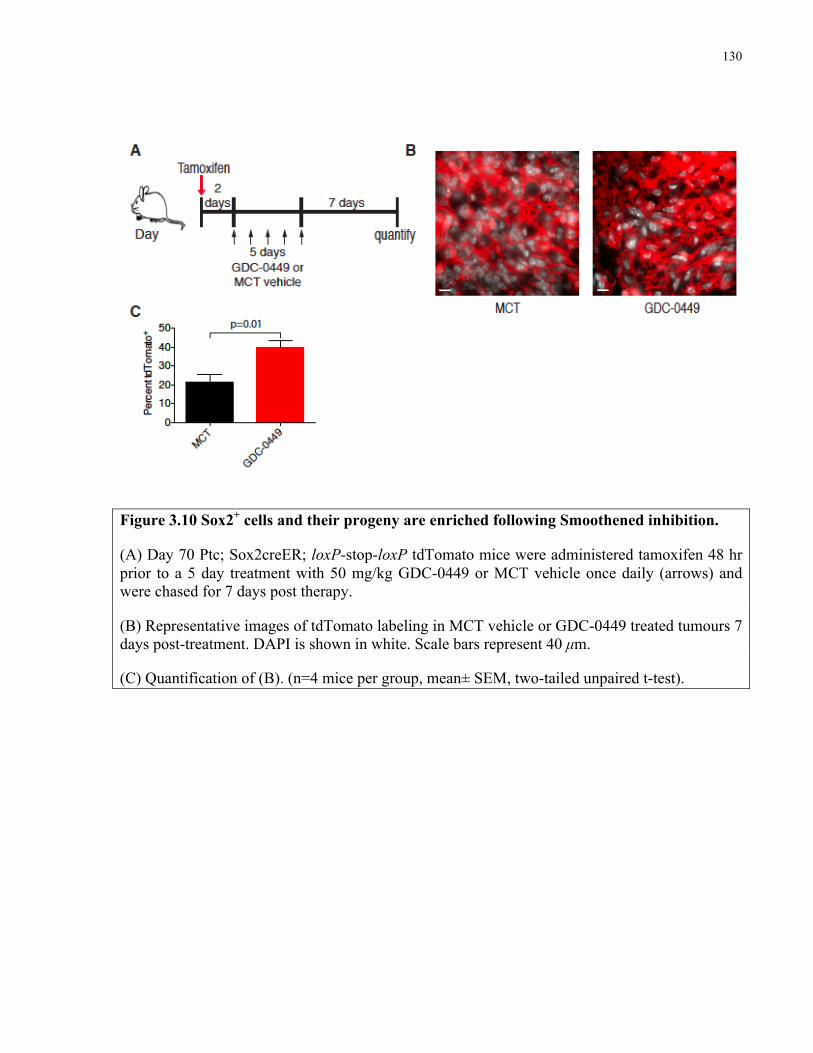
130
Figure 3.10 Sox2+ cells and their progeny are enriched following Smoothened inhibition.
(A) Day 70 Ptc; Sox2creER; loxP-stop-loxP tdTomato mice were administered tamoxifen 48 hr prior to a 5 day treatment with 50 mg/kg GDC-0449 or MCT vehicle once daily (arrows) and were chased for 7 days post therapy.
(B) Representative images of tdTomato labeling in MCT vehicle or GDC-0449 treated tumours 7 days post-treatment. DAPI is shown in white. Scale bars represent 40 µm.
(C) Quantification of (B). (n=4 mice per group, mean± SEM, two-tailed unpaired t-test).
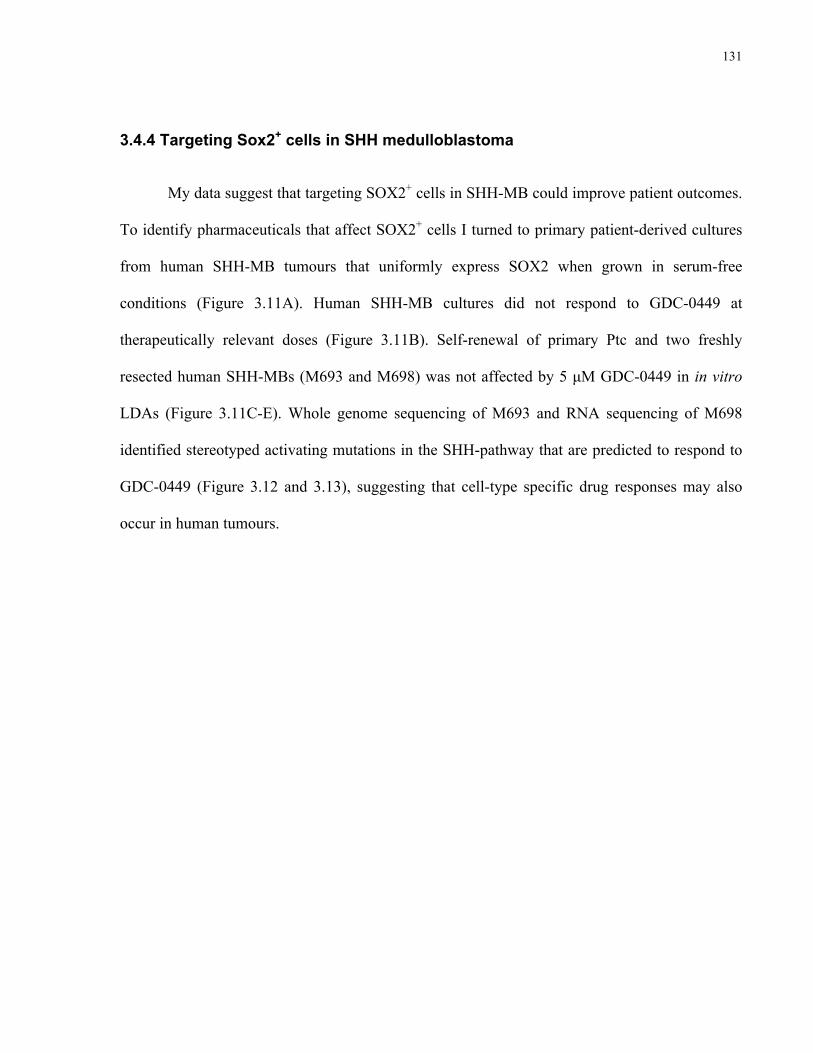
131
3.4.4 Targeting Sox2+ cells in SHH medulloblastoma
My data suggest that targeting SOX2+ cells in SHH-MB could improve patient outcomes.
To identify pharmaceuticals that affect SOX2+ cells I turned to primary patient-derived cultures
from human SHH-MB tumours that uniformly express SOX2 when grown in serum-free
conditions (Figure 3.11A). Human SHH-MB cultures did not respond to GDC-0449 at
therapeutically relevant doses (Figure 3.11B). Self-renewal of primary Ptc and two freshly
resected human SHH-MBs (M693 and M698) was not affected by 5 µM GDC-0449 in in vitro
LDAs (Figure 3.11C-E). Whole genome sequencing of M693 and RNA sequencing of M698
identified stereotyped activating mutations in the SHH-pathway that are predicted to respond to
GDC-0449 (Figure 3.12 and 3.13), suggesting that cell-type specific drug responses may also
occur in human tumours.
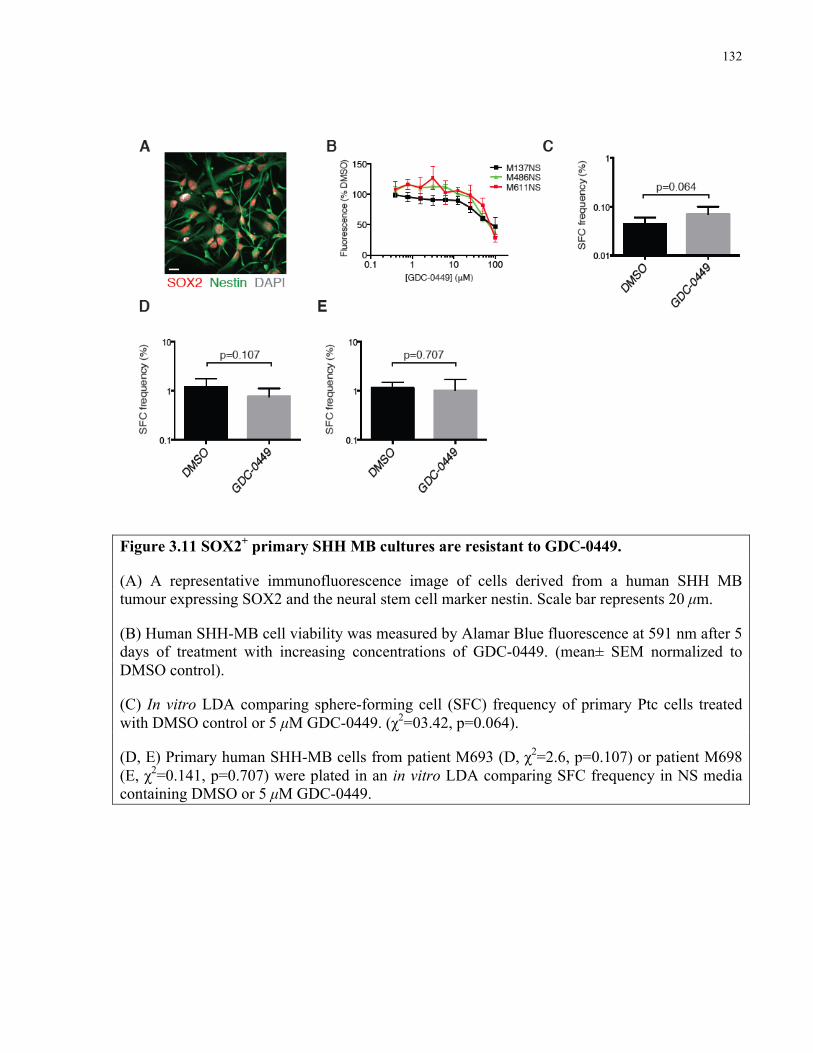
132
Figure 3.11 SOX2+ primary SHH MB cultures are resistant to GDC-0449.
(A) A representative immunofluorescence image of cells derived from a human SHH MB tumour expressing SOX2 and the neural stem cell marker nestin. Scale bar represents 20 µm.
(B) Human SHH-MB cell viability was measured by Alamar Blue fluorescence at 591 nm after 5 days of treatment with increasing concentrations of GDC-0449. (mean± SEM normalized to DMSO control).
(C) In vitro LDA comparing sphere-forming cell (SFC) frequency of primary Ptc cells treated with DMSO control or 5 µM GDC-0449. (χ2=03.42, p=0.064).
(D, E) Primary human SHH-MB cells from patient M693 (D, χ2=2.6, p=0.107) or patient M698 (E, χ2=0.141, p=0.707) were plated in an in vitro LDA comparing SFC frequency in NS media containing DMSO or 5 µM GDC-0449.
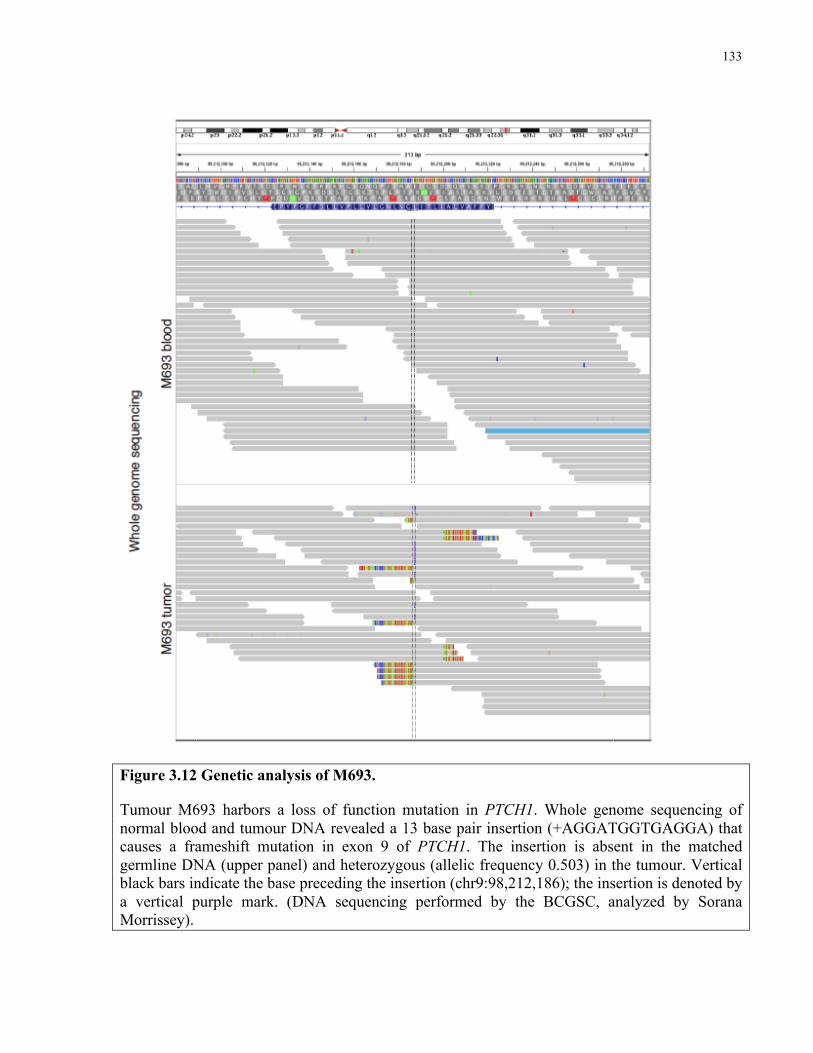
133
Figure 3.12 Genetic analysis of M693.
Tumour M693 harbors a loss of function mutation in PTCH1. Whole genome sequencing of normal blood and tumour DNA revealed a 13 base pair insertion (+AGGATGGTGAGGA) that causes a frameshift mutation in exon 9 of PTCH1. The insertion is absent in the matched germline DNA (upper panel) and heterozygous (allelic frequency 0.503) in the tumour. Vertical black bars indicate the base preceding the insertion (chr9:98,212,186); the insertion is denoted by a vertical purple mark. (DNA sequencing performed by the BCGSC, analyzed by Sorana Morrissey).
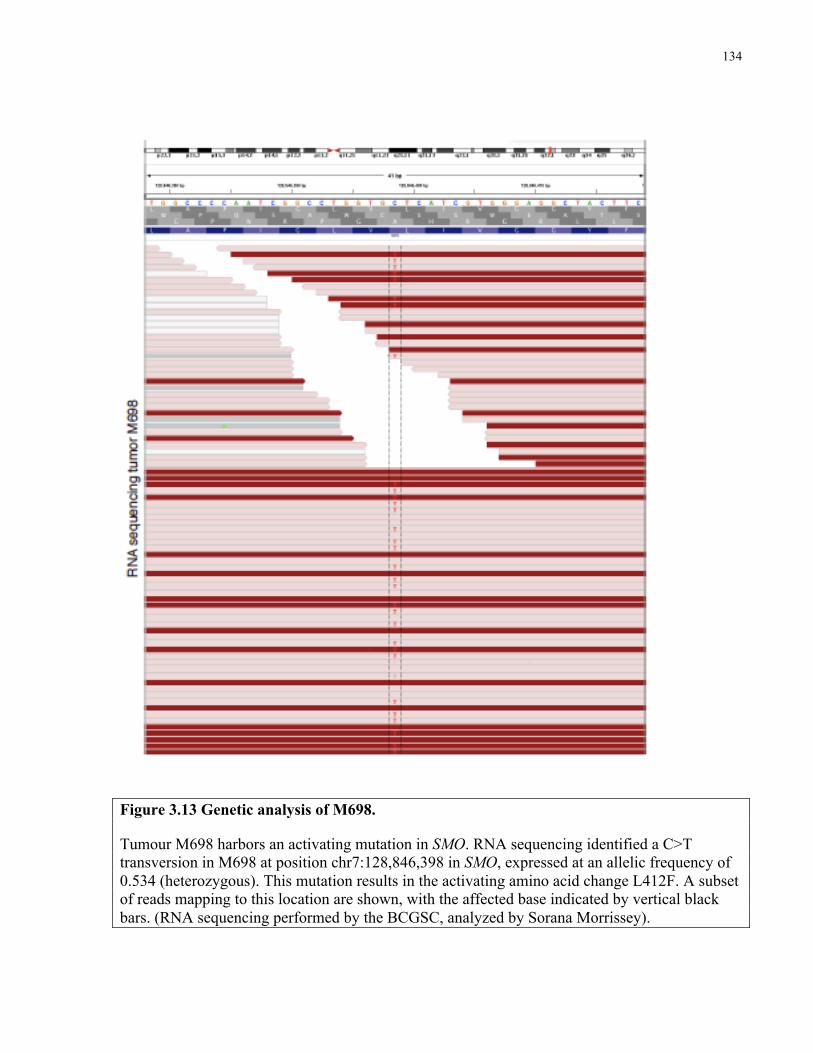
134
Figure 3.13 Genetic analysis of M698.
Tumour M698 harbors an activating mutation in SMO. RNA sequencing identified a C>T transversion in M698 at position chr7:128,846,398 in SMO, expressed at an allelic frequency of 0.534 (heterozygous). This mutation results in the activating amino acid change L412F. A subset of reads mapping to this location are shown, with the affected base indicated by vertical black bars. (RNA sequencing performed by the BCGSC, analyzed by Sorana Morrissey).
135
I then screened 4 human patient-derived SHH-MB cultures with the 97-compound NCI
Oncology Drug Set in search of agents to which SOX2+ MB cells are sensitive. The top 15 hits
(Figure 3.14A) included two aureolic acids, Dactinomycin and mithramycin (MM). Since MM is
known to cross the blood-brain barrier, it was prioritized for follow-up. Human SHH-
medulloblastoma primary cultures were sensitive to nanomolar concentrations of MM (Figure
3.14B). Similarly, 25 nM MM significantly inhibited sphere-formation by primary Ptc cells,
indicating similar effectiveness against mouse cells (Figure 3.14C). Secondary sphere formation
was abrogated in MM-treated Ptc cells even in the absence of drug (Figure 3.14D). Strikingly,
MM treatment prevented growth of subcutaneous Ptc tumour allografts (Figure 3.14E).
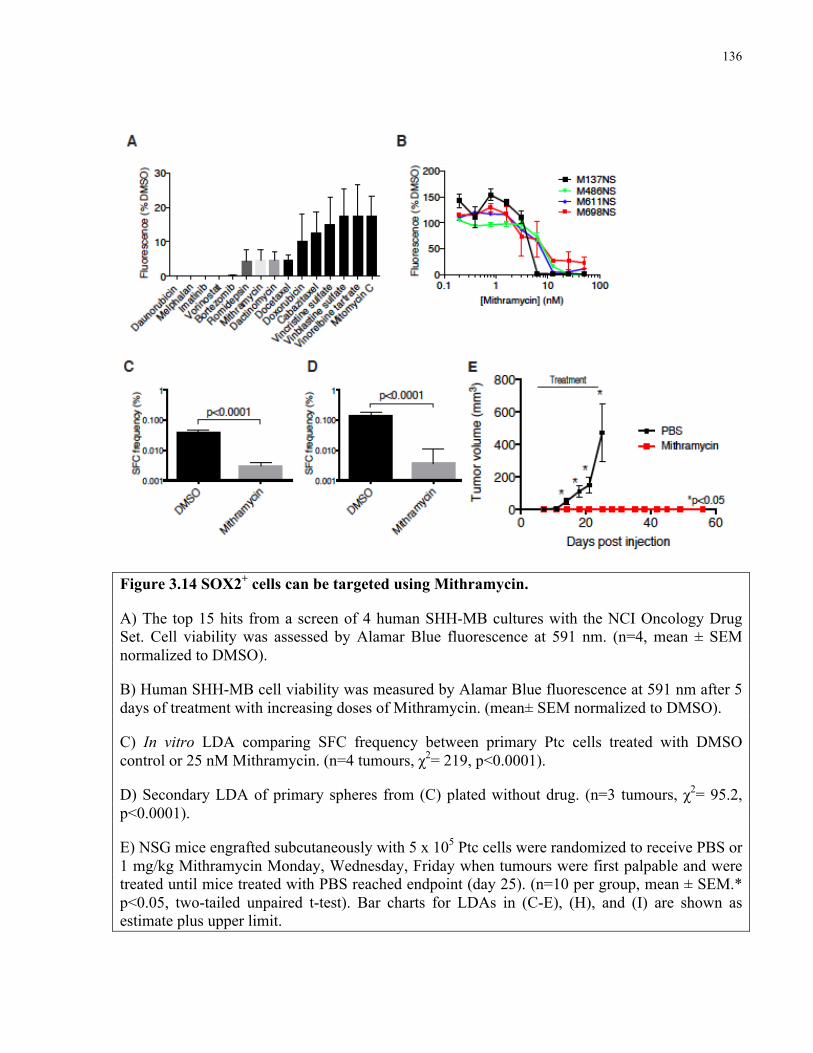
136
Figure 3.14 SOX2+ cells can be targeted using Mithramycin.
A) The top 15 hits from a screen of 4 human SHH-MB cultures with the NCI Oncology Drug Set. Cell viability was assessed by Alamar Blue fluorescence at 591 nm. (n=4, mean ± SEM normalized to DMSO).
B) Human SHH-MB cell viability was measured by Alamar Blue fluorescence at 591 nm after 5 days of treatment with increasing doses of Mithramycin. (mean± SEM normalized to DMSO).
C) In vitro LDA comparing SFC frequency between primary Ptc cells treated with DMSO control or 25 nM Mithramycin. (n=4 tumours, χ2= 219, p<0.0001).
D) Secondary LDA of primary spheres from (C) plated without drug. (n=3 tumours, χ2= 95.2, p<0.0001).
E) NSG mice engrafted subcutaneously with 5 x 10⁵ Ptc cells were randomized to receive PBS or 1 mg/kg Mithramycin Monday, Wednesday, Friday when tumours were first palpable and were treated until mice treated with PBS reached endpoint (day 25). (n=10 per group, mean ± SEM.* p<0.05, two-tailed unpaired t-test). Bar charts for LDAs in (C-E), (H), and (I) are shown as estimate plus upper limit.
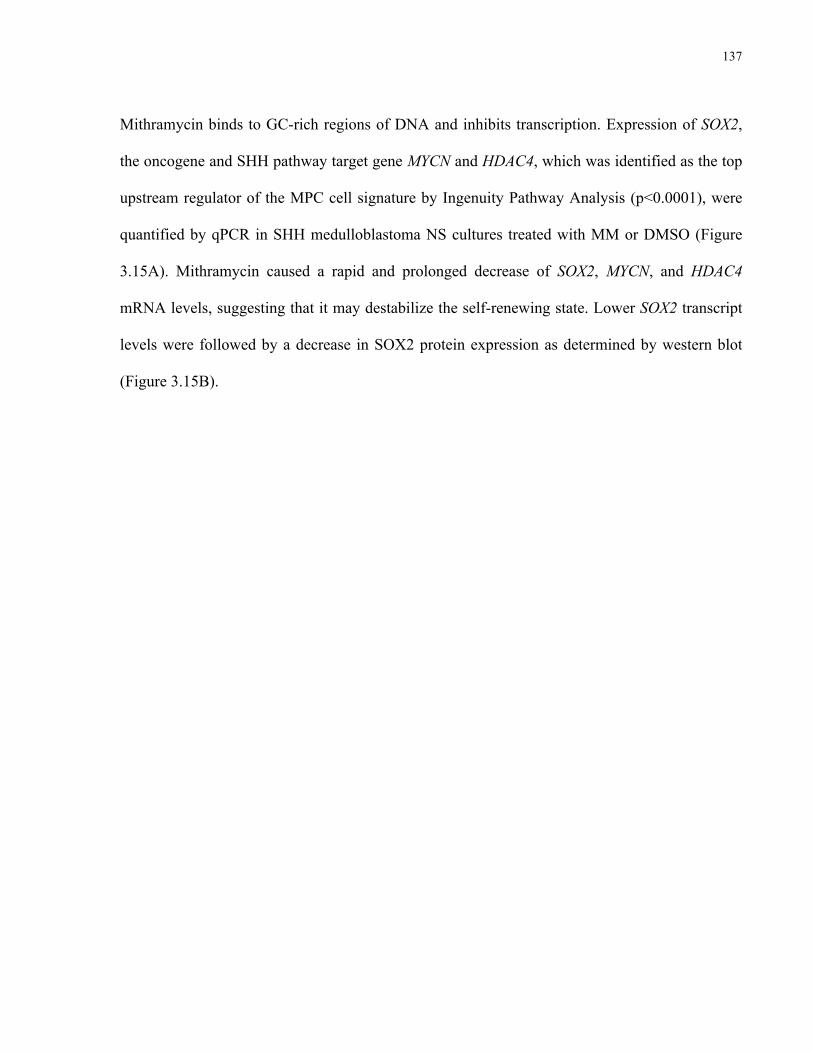
137
Mithramycin binds to GC-rich regions of DNA and inhibits transcription. Expression of SOX2,
the oncogene and SHH pathway target gene MYCN and HDAC4, which was identified as the top
upstream regulator of the MPC cell signature by Ingenuity Pathway Analysis (p<0.0001), were
quantified by qPCR in SHH medulloblastoma NS cultures treated with MM or DMSO (Figure
3.15A). Mithramycin caused a rapid and prolonged decrease of SOX2, MYCN, and HDAC4
mRNA levels, suggesting that it may destabilize the self-renewing state. Lower SOX2 transcript
levels were followed by a decrease in SOX2 protein expression as determined by western blot
(Figure 3.15B).
138
Figure 3.15 Mithramycin inhibits transcription of SOX2, MYCN, and HDAC4.
(A) SOX2, MYCN and HDAC4 transcript levels were measured in 3 primary cultures following 6, 12 and 24 hours of DMSO or 100 nM mithramycin (MM) treatment. (n=3 ± SEM normalized to ACTB and GAPDH).
(B) Western blotting of M137NS and M486NS lysates for SOX2 treated with DMSO or 100 nM mithramycin (MM) for 48 and 72 h. ACTB is shown as a loading control.
139
To determine whether apoptosis contributes to the MM-induced decrease in medulloblastoma NS
culture viability, three SHH medulloblastoma NS cultures were treated with 100 nM MM or
DMSO for 24, 48 or 96 h and apoptosis induction quantified by Annexin V and 7AAD staining.
The number of MM-treated Annexin V+ 7AAD- (undergoing apoptosis) and Annexin V+ 7AAD+
(dead) cells increased with time (Figure 3.16). Therefore, MM induces apoptosis in SOX2+ SHH
medulloblastoma cultures, contributing to the decrease in cell viability.
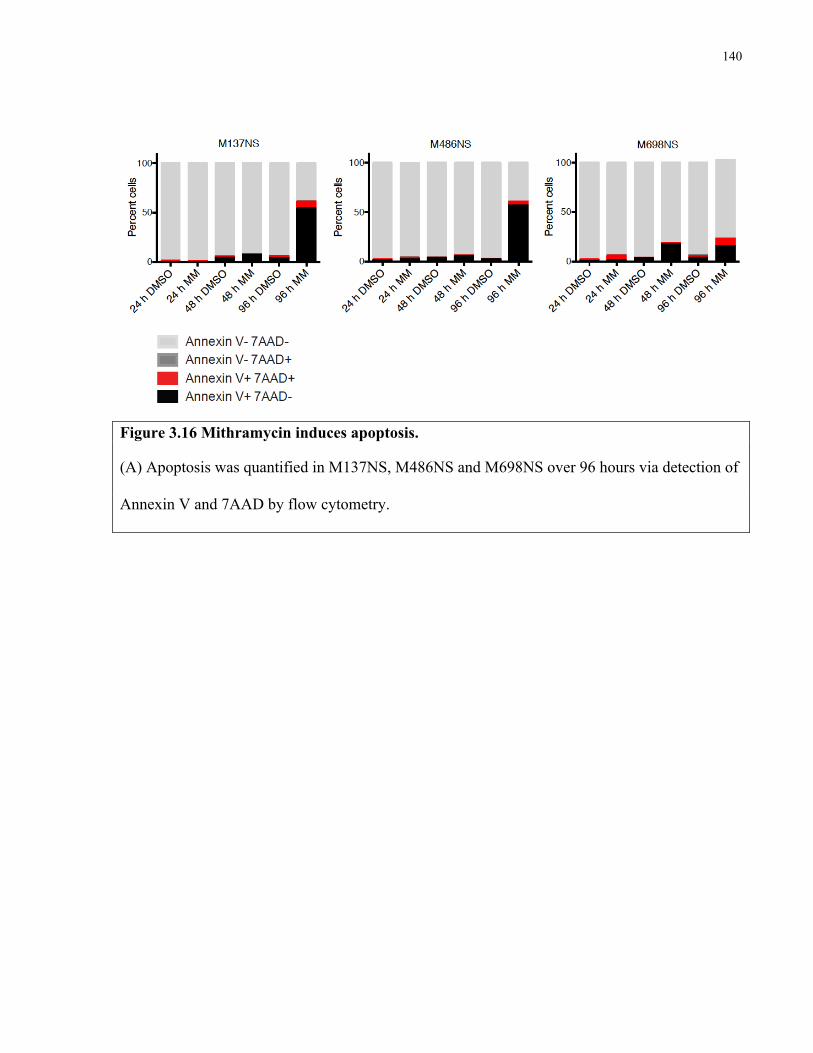
140
Figure 3.16 Mithramycin induces apoptosis.
(A) Apoptosis was quantified in M137NS, M486NS and M698NS over 96 hours via detection of
Annexin V and 7AAD by flow cytometry.
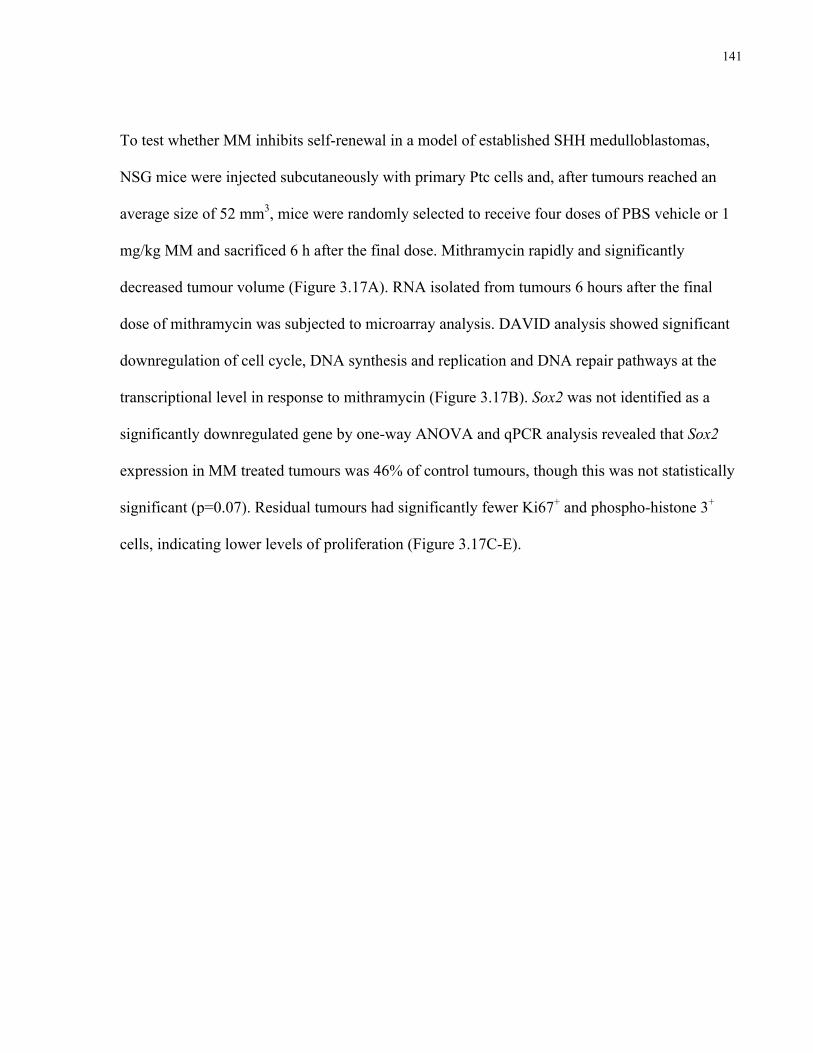
141
To test whether MM inhibits self-renewal in a model of established SHH medulloblastomas,
NSG mice were injected subcutaneously with primary Ptc cells and, after tumours reached an
average size of 52 mm3, mice were randomly selected to receive four doses of PBS vehicle or 1
mg/kg MM and sacrificed 6 h after the final dose. Mithramycin rapidly and significantly
decreased tumour volume (Figure 3.17A). RNA isolated from tumours 6 hours after the final
dose of mithramycin was subjected to microarray analysis. DAVID analysis showed significant
downregulation of cell cycle, DNA synthesis and replication and DNA repair pathways at the
transcriptional level in response to mithramycin (Figure 3.17B). Sox2 was not identified as a
significantly downregulated gene by one-way ANOVA and qPCR analysis revealed that Sox2
expression in MM treated tumours was 46% of control tumours, though this was not statistically
significant (p=0.07). Residual tumours had significantly fewer Ki67+ and phospho-histone 3+
cells, indicating lower levels of proliferation (Figure 3.17C-E).
142
Figure 3.17 Mithramycin inhibits proliferation in Ptc tumours. A) Subcutaneous Ptc tumour volume was measured pre- and post-mithramycin treatment, administered at 1 mg/kg on days 1-4. (n=8 per group, mean ± SEM, Day 1 p=0.76, Day 4 p=0.006 PBS versus mithramycin, two-tailed unpaired t-test). B) The top 10 KEGG pathways enriched in the list of genes downregulated in response to mithramycin are ranked by p value. C) Ki67 (red) staining in PBS and mithramycin treated subcutaneous tumours. DAPI is shown in white. Scale bar represents 13 µm. D) Quantification of Ki67 and (E) phospho-histone 3 staining in PBS and mithramycin treated tumours. (n=4 per group, mean ± SEM Ki67 p<0.0001, phospho-histone 3 p=0.009, two-tailed unpaired t-test).
143
The number of TUNEL+ Sox2+ cells undergoing cell death was quantified in PBS and MM
treated tumours. MM increased TUNEL staining in subcutaneous tumours (p=0.0157) (Figure
3.18A). Significantly more Sox2+ cells were TUNEL+ in MM treated tumours and therefore
could not further contribute to tumour growth (12.6% MM, 0.99% PBS p=0.02) (Figure 3.18B).
To determine whether MM alters cells’ capacity to self-renew in vivo, PBS or MM treated
tumours were dissociated and acutely engrafted subcutaneously into NSG mice in an in vivo
LDA (Figure 3.18C). Tumours formed more reliably at lower cell doses in PBS versus MM
treated tumours (Figure 3.18D and 3.18E). The fraction of tumour propagating cells in MM
treated tumours was ten-fold lower than PBS treated tumours. Therefore, MM inhibits self-
renewal in Ptc medulloblastoma.
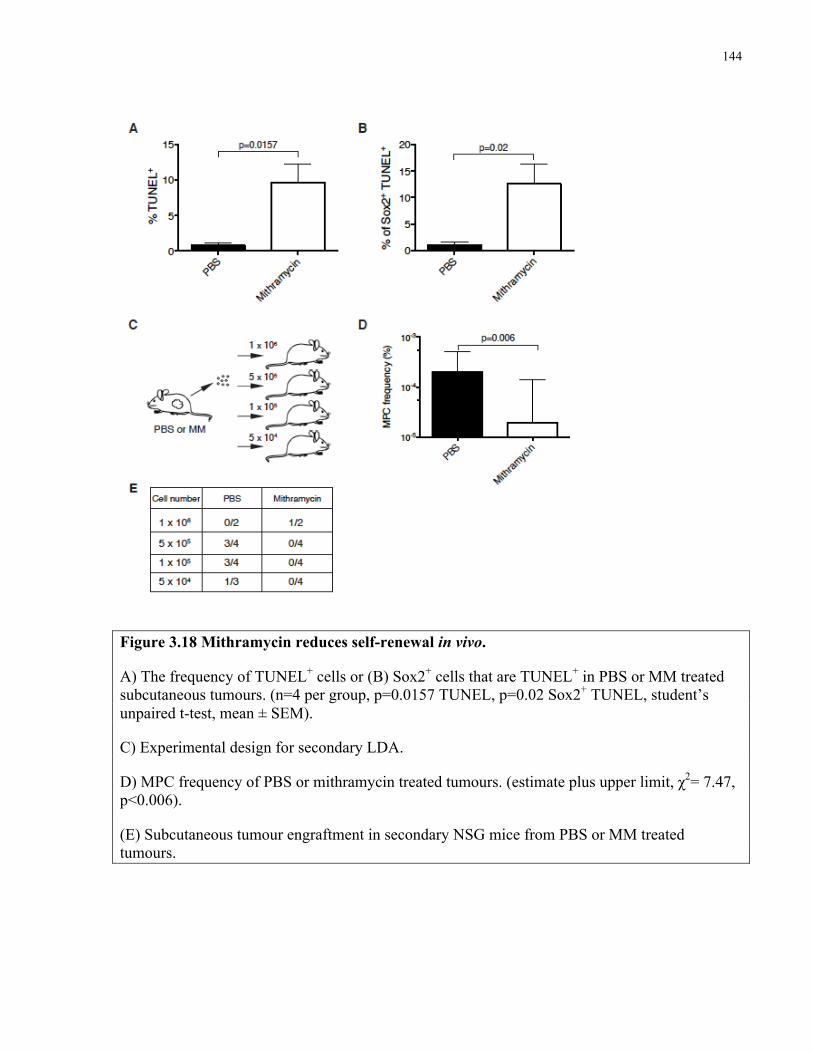
144
Figure 3.18 Mithramycin reduces self-renewal in vivo.
A) The frequency of TUNEL+ cells or (B) Sox2+ cells that are TUNEL+ in PBS or MM treated subcutaneous tumours. (n=4 per group, p=0.0157 TUNEL, p=0.02 Sox2+ TUNEL, student’s unpaired t-test, mean ± SEM).
C) Experimental design for secondary LDA.
D) MPC frequency of PBS or mithramycin treated tumours. (estimate plus upper limit, χ2= 7.47, p<0.006).
(E) Subcutaneous tumour engraftment in secondary NSG mice from PBS or MM treated tumours.
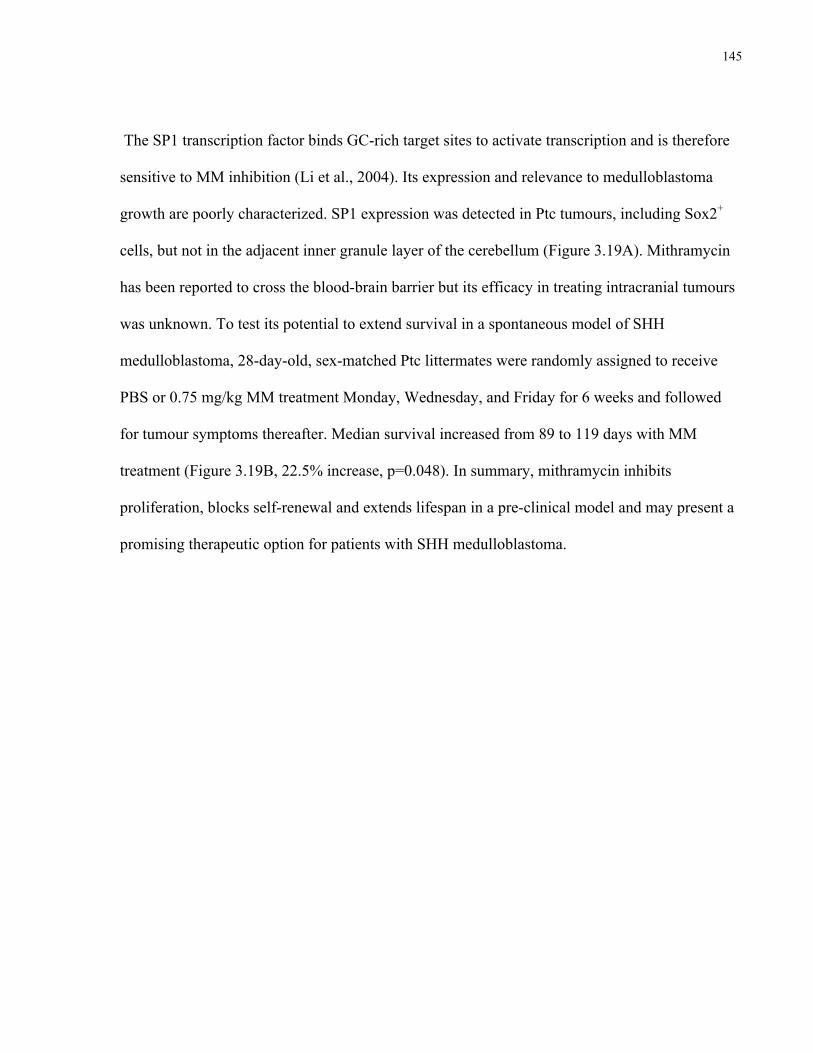
145
The SP1 transcription factor binds GC-rich target sites to activate transcription and is therefore
sensitive to MM inhibition (Li et al., 2004). Its expression and relevance to medulloblastoma
growth are poorly characterized. SP1 expression was detected in Ptc tumours, including Sox2+
cells, but not in the adjacent inner granule layer of the cerebellum (Figure 3.19A). Mithramycin
has been reported to cross the blood-brain barrier but its efficacy in treating intracranial tumours
was unknown. To test its potential to extend survival in a spontaneous model of SHH
medulloblastoma, 28-day-old, sex-matched Ptc littermates were randomly assigned to receive
PBS or 0.75 mg/kg MM treatment Monday, Wednesday, and Friday for 6 weeks and followed
for tumour symptoms thereafter. Median survival increased from 89 to 119 days with MM
treatment (Figure 3.19B, 22.5% increase, p=0.048). In summary, mithramycin inhibits
proliferation, blocks self-renewal and extends lifespan in a pre-clinical model and may present a
promising therapeutic option for patients with SHH medulloblastoma.
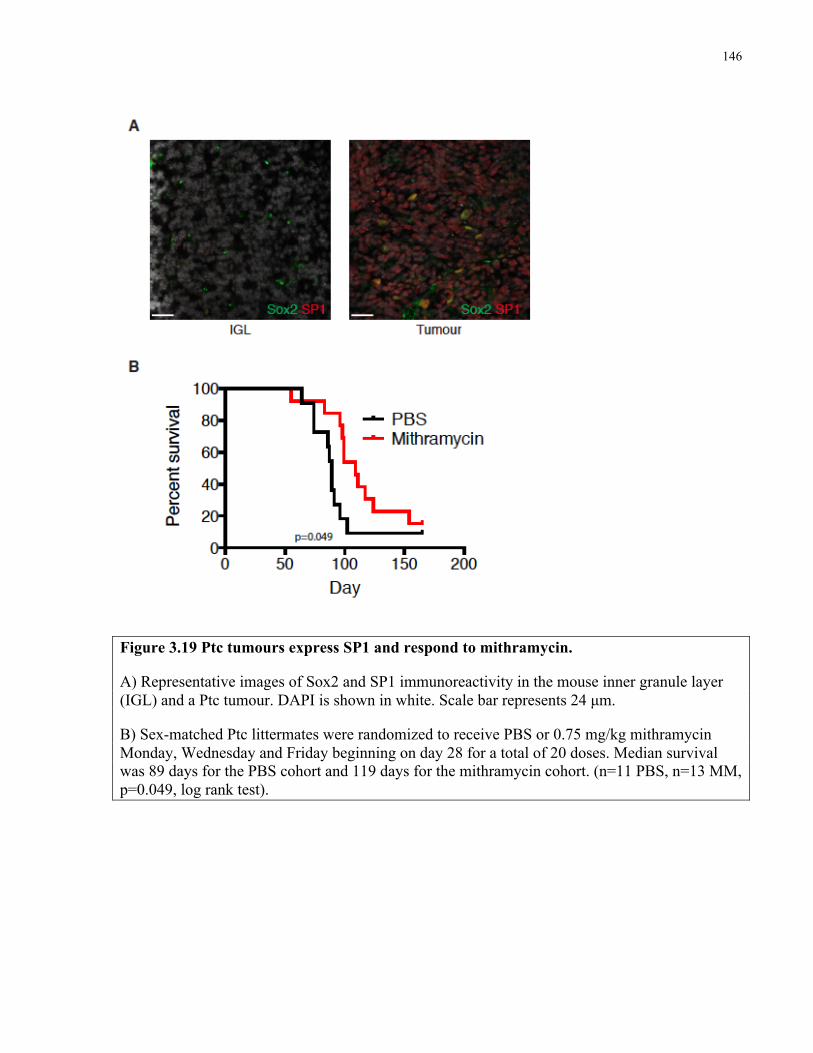
146
Figure 3.19 Ptc tumours express SP1 and respond to mithramycin.
A) Representative images of Sox2 and SP1 immunoreactivity in the mouse inner granule layer (IGL) and a Ptc tumour. DAPI is shown in white. Scale bar represents 24 µm.
B) Sex-matched Ptc littermates were randomized to receive PBS or 0.75 mg/kg mithramycin Monday, Wednesday and Friday beginning on day 28 for a total of 20 doses. Median survival was 89 days for the PBS cohort and 119 days for the mithramycin cohort. (n=11 PBS, n=13 MM, p=0.049, log rank test).
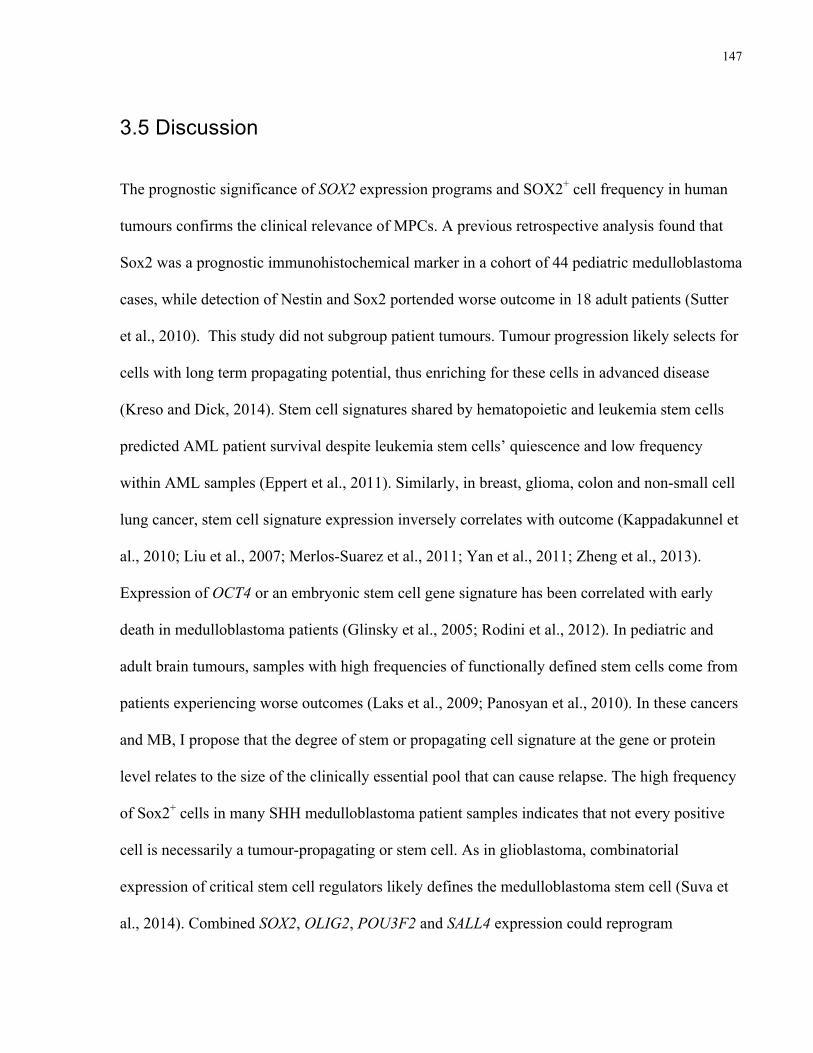
147
3.5 Discussion
The prognostic significance of SOX2 expression programs and SOX2+ cell frequency in human
tumours confirms the clinical relevance of MPCs. A previous retrospective analysis found that
Sox2 was a prognostic immunohistochemical marker in a cohort of 44 pediatric medulloblastoma
cases, while detection of Nestin and Sox2 portended worse outcome in 18 adult patients (Sutter
et al., 2010). This study did not subgroup patient tumours. Tumour progression likely selects for
cells with long term propagating potential, thus enriching for these cells in advanced disease
(Kreso and Dick, 2014). Stem cell signatures shared by hematopoietic and leukemia stem cells
predicted AML patient survival despite leukemia stem cells’ quiescence and low frequency
within AML samples (Eppert et al., 2011). Similarly, in breast, glioma, colon and non-small cell
lung cancer, stem cell signature expression inversely correlates with outcome (Kappadakunnel et
al., 2010; Liu et al., 2007; Merlos-Suarez et al., 2011; Yan et al., 2011; Zheng et al., 2013).
Expression of OCT4 or an embryonic stem cell gene signature has been correlated with early
death in medulloblastoma patients (Glinsky et al., 2005; Rodini et al., 2012). In pediatric and
adult brain tumours, samples with high frequencies of functionally defined stem cells come from
patients experiencing worse outcomes (Laks et al., 2009; Panosyan et al., 2010). In these cancers
and MB, I propose that the degree of stem or propagating cell signature at the gene or protein
level relates to the size of the clinically essential pool that can cause relapse. The high frequency
of Sox2+ cells in many SHH medulloblastoma patient samples indicates that not every positive
cell is necessarily a tumour-propagating or stem cell. As in glioblastoma, combinatorial
expression of critical stem cell regulators likely defines the medulloblastoma stem cell (Suva et
al., 2014). Combined SOX2, OLIG2, POU3F2 and SALL4 expression could reprogram
148
differentiated glioma cells to the stem cell state and these four transcription factors were co-
expressed only in a minority of primary glioblastoma cells. Single cell RNA sequencing of
human glioblastoma samples revealed a continuum of glioma stem cell signature expression in
tumour cells, suggesting that some stemness genes’ expression may ‘bleed through’ into tumour
bulk (Patel et al., 2014). The degree to which this occurs correlated with the level of stem cell
gene expression in bulk tumour samples and may also correlate with stem cell frequency. Greater
numbers of SOX2+ cells detected by immunohistochemistry may also reflect an increase in
medulloblastoma stem cell frequency and the persistence of treatment resistant biology in tumour
bulk that together correlate with the likelihood that a patient will relapse.
Tumour-propagating cells in multiple model systems exhibit resistance to traditional
therapies that effectively target tumour bulk (Chen et al., 2012; O'Brien et al., 2012; Zheng et al.,
2013). I found that while the anti-proliferative ara-c and Smoothened inhibitor GDC-0449 both
stopped tumour proliferation and killed many dividing cells, residual tumours were enriched for
Sox2+ cells. This suggests that they were spared, or at least relatively less effected, by both
therapies. EGF- and FGF-dependent sphere-forming cells from Ptch1+/- medulloblastomas
express Sox2 in vitro and do not respond to Smo inhibitors despite the drugs’ downregulation of
Shh target genes (Chow et al., 2014). Smo blockade killed growth factor independent spheres,
indicating that multiple stem cell fractions with distinct drug responses likely exist within a
single medulloblastoma. In ALL xenografts, leukemia stem cells secreted CCL3 and GDF15 to
attract support cells and create a niche that protected them from induction chemotherapy,
including ara-c (Duan et al., 2014). While gene expression profiling showed that Sox2+ cells
express a number of extracellular matrix ligands and receptors, primary Sox2+ cell cultures were
149
also resistant to GDC-0449 in vitro, suggesting that the enrichment observed in primary tumours
is not due to the effects of a protective niche (Junttila and de Sauvage, 2013). The enrichment of
Sox2+ cells following anti-mitotic therapy is unsurprising given their quiescent status. However,
with no detected differences in Shh pathway activity between Sox2+ and Sox2- cells at the gene
expression level, it is unclear why Sox2+ cells were more tolerant of GDC-0449. Multiple
potential mechanisms conferring drug resistance exist, including residing in a protective niche,
removing drugs from the cytoplasm by efflux pumps and metabolizing drugs to inactive forms
via pathways with lesser activity in differentiated cells. Which, if any, of such mechanisms are at
play in Sox2+ medulloblastoma cells is unclear.
Conventional medulloblastoma treatments successfully target proliferating cells and
GDC-0449 effectively controls tumour burden: these therapies are, at least initially, almost
always effective. Relapse, if it occurs, is nearly universally fatal and therefore must be stopped.
Greater lineage traces in GDC-0449 treated Sox2-CreER mice following therapy suggests that
Sox2+ cells are the units of selection that are responsible for medulloblastoma relapse. Genetic
resistance to GDC-0449 conferred by mutations in SMO or SUFU or amplification of
downstream Hh pathway components has been well documented (Kool et al., 2014; LoRusso et
al., 2011; Rudin et al., 2009; Yauch et al., 2009). I propose that these mutations are likely to arise
in a Sox2+ cell that, with its progeny, is selected to regenerate the tumour. Therapies targeting
Sox2+ cells may prevent this from occurring and improve patient outcomes.
I took an unbiased approach to identify drugs effective against Sox2+ medulloblastoma
cells. Three of the top 10 hits from the 97 compound NCI Oncology Drug Set were direct or
150
indirect inhibitors of histone deacetylases: vorinostat, romidepsin and mithramycin.
Mithramycin, which also acts directly as a transcriptional inhibitor by binding to the minor
groove of GC-rich DNA in the presence of divalent cations, was prioritized for follow up as it
crosses the blood brain barrier and had never been used for medulloblastoma therapy. Histone
deacetylase inhibitors, including vorinostat, can sensitize medulloblastoma cell lines to
chemotherapy (Hacker et al., 2011). Curcumin, a natural inhibitor of histone deacetylases,
slowed growth of DAOY medulloblastoma xenografts and prolonged survival in the
ND2:SmoA1 SHH medulloblastoma mouse model (Lee et al., 2011). Interestingly, HDAC4 –
identified as the top upstream regulator of the Sox2+ gene expression profile - was significantly
downregulated in curcumin treated tumours. I reasoned that disrupting the stem cell gene
expression profile may inhibit medulloblastoma growth. Mithramycin treatment caused rapid
downregulation of a number of key stem cell genes in vitro, including SOX2 and HDAC4. Since
SOX2 knockdown is sufficient to inhibit Shh medulloblastoma proliferation (Ahlfeld et al.,
2013), mithramycin was expected to be significantly more potent as a pleiotropic agent. Not only
did mithramycin decrease medulloblastoma cultures’ viability and induce apoptosis, it inhibited
treated cells’ self-renewal in a secondary sphere assay and secondary transplantation assay.
Mithramycin completely abrogated allograft tumour growth and may therefore be effective in
preventing disease relapse. Treatment of established tumours suggests that toxicity is not
necessarily specific to Sox2+ cells, as tumours immediately shrank and widespread cell death
was induced with concomitant downregulation of proliferation genes and decrease of
proliferative indices. Mithramycin’s effects on Sox2+ cells were confirmed by showing
significantly greater Sox2+ cell death in treated tumours as well as the 10-fold decrease in self-
151
renewal induced by just 4 doses of drug. Efficacy in primary Ptc tumours was lesser, perhaps
because of dose-limiting toxicity or reduced drug concentration in the cerebellum.
Dose-limiting toxicity prevented mithramycin’s widespread clinical use despite
promising early results for diseases including testicular carcinoma, a highly Sox2+ malignancy
(Baum, 1968). As a result, its clinical use was restricted to treating hypercalcemia of malignancy
on a short-term basis. Mithramycin has since been revived and is in Phase 2 clinical trial for
adult and pediatric patients with treatment refractory Ewing’s Sarcoma or relapsed extracranial
solid tumours (NCT01610570) and for adults with lung cancer, esophageal cancer or other
cancers of the chest (NCT01624090). All patients are receiving intravenous mithramycin on a 7
day-on/three week-off schedule. This dosing schedule is associated with relatively moderate side
effects including nausea, vomiting and fatigue. One possible method of escalating dosing while
minimizing comorbidities is to use a drug analogue that is structurally and functionally similar
but has a more desirable pharmacokinetic or cytotoxic profile (Nunez et al., 2012; Remsing et
al., 2003). Such analogues should be tested for potency against medulloblastoma primary
cultures and orthotopic xenograft models immediately. It will be essential to first determine
whether the drugs cross the blood-brain-barrier and may require chemical modification to
improve their pharmacokinetic profiling and potential to treat CNS malignancies. While
mithramycin may never be used in the clinic to treat medulloblastoma, I have demonstrated
proof of principle that targeting proliferation and cancer stem cell biology can stop tumour
growth and may prevent relapse.
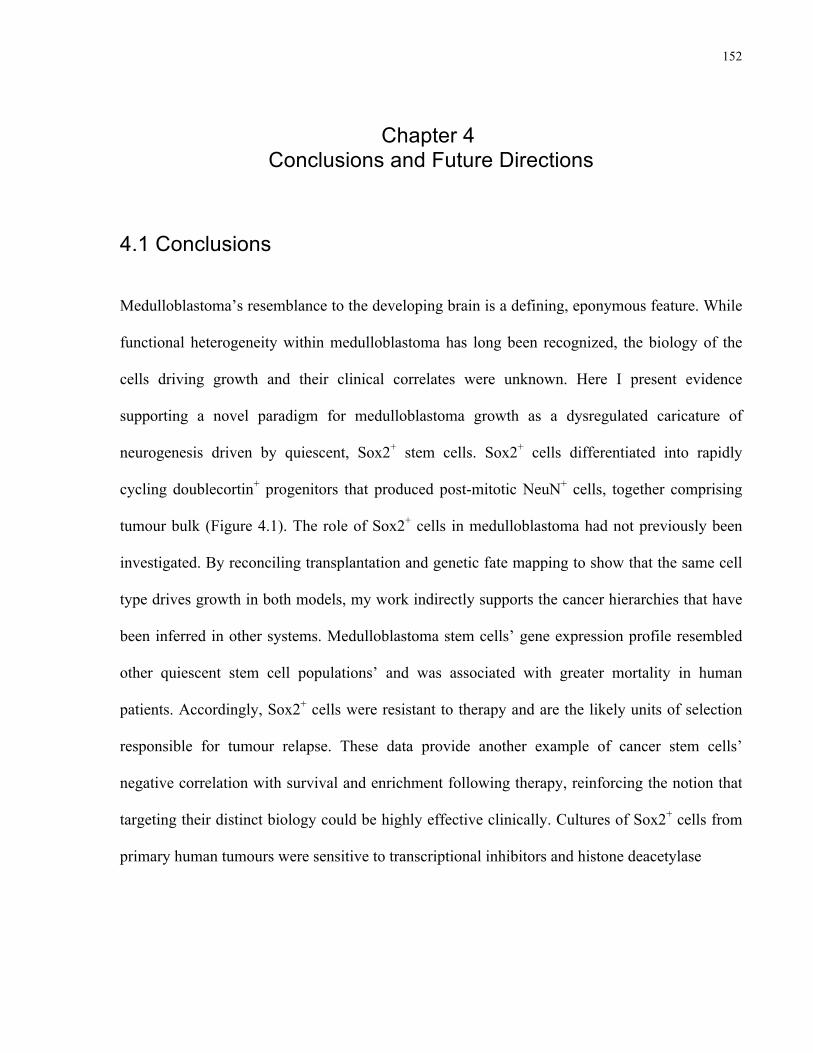
152
Chapter 4 Conclusions and Future Directions
4.1 Conclusions
Medulloblastoma’s resemblance to the developing brain is a defining, eponymous feature. While
functional heterogeneity within medulloblastoma has long been recognized, the biology of the
cells driving growth and their clinical correlates were unknown. Here I present evidence
supporting a novel paradigm for medulloblastoma growth as a dysregulated caricature of
neurogenesis driven by quiescent, Sox2+ stem cells. Sox2+ cells differentiated into rapidly
cycling doublecortin+ progenitors that produced post-mitotic NeuN+ cells, together comprising
tumour bulk (Figure 4.1). The role of Sox2+ cells in medulloblastoma had not previously been
investigated. By reconciling transplantation and genetic fate mapping to show that the same cell
type drives growth in both models, my work indirectly supports the cancer hierarchies that have
been inferred in other systems. Medulloblastoma stem cells’ gene expression profile resembled
other quiescent stem cell populations’ and was associated with greater mortality in human
patients. Accordingly, Sox2+ cells were resistant to therapy and are the likely units of selection
responsible for tumour relapse. These data provide another example of cancer stem cells’
negative correlation with survival and enrichment following therapy, reinforcing the notion that
targeting their distinct biology could be highly effective clinically. Cultures of Sox2+ cells from
primary human tumours were sensitive to transcriptional inhibitors and histone deacetylase
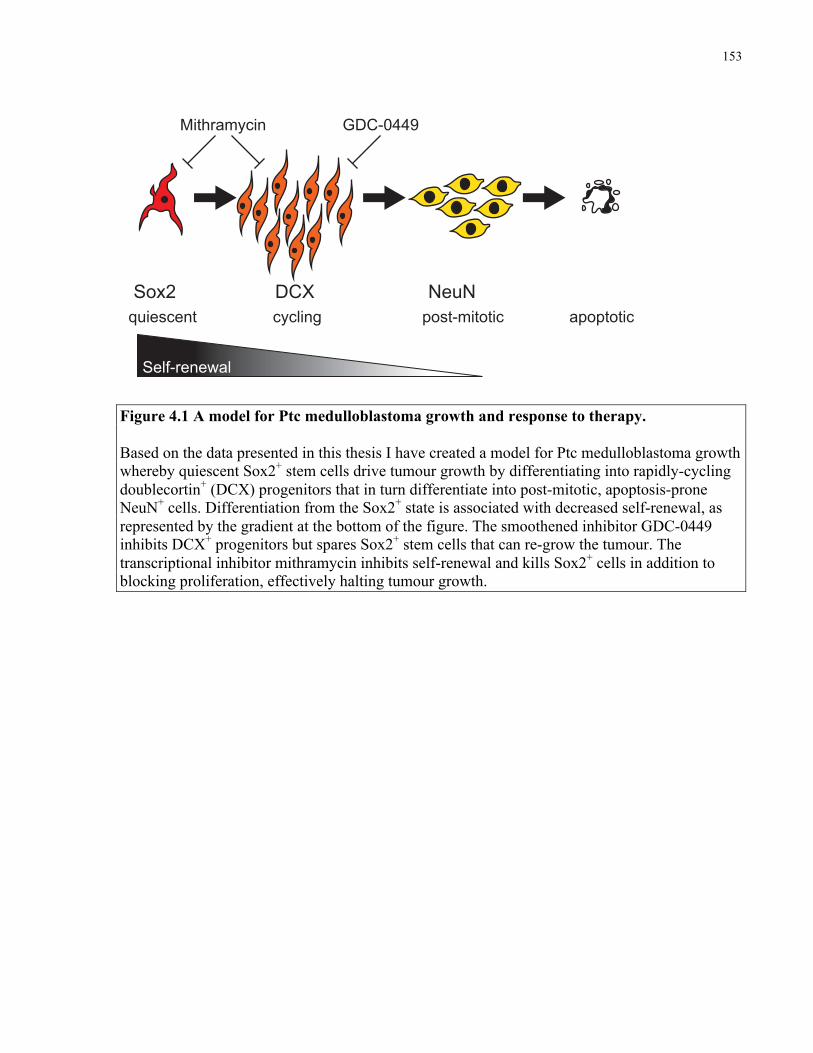
153
Figure 4.1 A model for Ptc medulloblastoma growth and response to therapy. Based on the data presented in this thesis I have created a model for Ptc medulloblastoma growth whereby quiescent Sox2+ stem cells drive tumour growth by differentiating into rapidly-cycling doublecortin+ (DCX) progenitors that in turn differentiate into post-mitotic, apoptosis-prone NeuN+ cells. Differentiation from the Sox2+ state is associated with decreased self-renewal, as represented by the gradient at the bottom of the figure. The smoothened inhibitor GDC-0449 inhibits DCX+ progenitors but spares Sox2+ stem cells that can re-grow the tumour. The transcriptional inhibitor mithramycin inhibits self-renewal and kills Sox2+ cells in addition to blocking proliferation, effectively halting tumour growth.
Sox2 DCX NeuN
Self-renewal
quiescent cycling post-mitotic apoptotic
GDC-0449Mithramycin
Lineage tracing Transplantation
Ptch1+/- Sox2creER Ptch1+/- Sox2eGFP
NSG
X
154
inhibitors, suggesting that disruption of the self-renewal network has therapeutic potential for
medulloblastoma. One such transcriptional inhibitor, mithramycin, inhibited self-renewal,
completely stopped Ptc medulloblastoma growth in subcutaneous transplants and may effectively
prevent relapse in medulloblastoma patients. The principles of dissecting the biology and
therapeutic responses of a cancer’s constituent cell types are likely to be applied broadly in the
future, yielding refined models for tumour growth, unforeseen targets and novel therapies that
together will contribute to better disease control and patient survival.
My paradigm for medulloblastoma growth provides answers and context for a number of
the outstanding questions in the brain tumour and cancer stem cell fields. The multi-level
phenotyping of a brain tumour stem cell hierarchy is, to my knowledge, the first of its kind that
goes beyond a binary stem cell and non-stem cell analysis. In doing so, this work demonstrates
that medulloblastoma growth mechanistically parallels the cerebellar developmental program,
something that was previously only inferred. Moreover, this work explains why, despite
tumours’ striking resemblance to the developing cerebellum, no mature neuronal cell types are
detectable within the cancer. This was shown to be due to the loss of NeuN+ cells through
apoptosis shortly after they are born. NeuN+ cell loss also explains the paradox found in
medulloblastoma models with genetic deletion of pro-apoptotic genes: tumours had shorter
latency but less proliferation and increased differentiation (Metcalfe et al., 2013) (Garcia et al.,
2013). Each of these findings can be explained by the accumulation of NeuN+ cells in the tumour
that would otherwise die and reduce volume.
155
This work is one of the earliest reports of a tumour-propagating cell type that generates
allografts upon transplantation and lineage traces in primary tumours. Tlx+ glioma cells in a
PDGFB-driven mouse model showed expanding lineage traces in situ and were enriched for
glioma propagating cells in orthotopic transplants, demonstrating concordance in these two
critical stem cell assays for the first time (Zhu et al., 2014). Unfortunately, this study did not test
whether the lineage mark set in Tlx+ cells was propagated to other tumour cell types, nor was any
tracing quantification performed. Therefore, self-renewal and differentiation capacity were not
confirmed. My study builds on the elegant clonal analyses of skin papillomas and ‘re-tracing’ of
intestinal adenomas that used lineage tracing to demonstrate hierarchical tumour growth
(Driessens et al., 2012; Schepers et al., 2012). Accordingly, my work was the first demonstration
of self-renewal and differentiation of a cancer stem cell in a malignant tumour model by lineage
tracing and cell transplantation. It was also one of the first to use lineage tracing to test cells’
contribution to tumour growth following therapy. I predict that, especially as the manipulation of
the mouse genome becomes faster and easier, lineage tracing will become a standard technique
in animal studies of cancer and will complement and contextualize transplantation assays
performed in parallel.
Previous studies of pre-clinical medulloblastoma models showed that cycling cells were
preferentially killed by standard treatments such as ionizing radiation (Hambardzumyan et al.,
2008). My work builds on such studies to show that the enrichment of stem cell marker positive
cells following therapy is truly due to selection and not simply marker induction. My work also
identified a cell type – the DCX+ progenitor - that is therapy-sensitive. Furthermore, this work is
one of the first to test cell-type specific drug responses to a Smoothened inhibitor, demonstrating
156
relative resistance from the cancer stem cell population. This is particularly interesting since the
stem cell and bulk tumour populations did not differ in their levels of Shh pathway activation. As
Smoothened inhibitors and other drugs targeting canonical signaling pathways driving tumour
growth enter the oncology clinic it will be essential to evaluate their effects on stem cells and
tumour bulk to identify possible treatment synergies and ideally limit drug resistance.
While this work adds to the growing list of cancer stem cells that are resistant to first-line
or nascent therapies that destroy tumour bulk (Easwaran et al., 2014; Kreso and Dick, 2014), it
also provides an alternative therapeutic approach to block proliferation and self-renewal in
medulloblastoma. Targeting self-renewal in other cancers has proved successful: genetically or
pharmacologically inhibiting BMI-1 in colorectal cancer decreased the frequency of tumour-
propagating cells and stopped growth of xenograft tumours (Kreso et al., 2014). Similarly,
deletion of critical self-renewal regulators in mouse models can shrink tumours and preclude
transplantation. Conditional deletion of Tlx or Sox2 from mouse gliomas and squamous skin
tumours, respectively, stopped tumour growth despite these genes being highly expressed only in
a minority of cells (Zhu et al., 2014; Boumahdi et al., 2014). Quiescent CML stem cells are
resistant to imatinib (Graham et al., 2002) but can be eliminated by breaking their quiescence or
disrupting the pro-survival factor BCL2 (Goff et al., 2013; Ito et al., 2008), improving survival in
animal models by killing the quiescent stem cell. My work has created a similar treatment
framework for SHH subgroup medulloblastoma, demonstrating that combined targeting of
tumour bulk and stem cells can yield lasting remission in pre-clinical models.
157
4.2 Future Directions
4.2.1 Exploring heterogeneity in the Sox2+ population.
While my thesis research has provided a paradigm for Ptc medulloblastoma growth, several key
biological and pre-clinical questions remain unanswered. Firstly, is there heterogeneity within
the Sox2+ stem cell pool? A recent analysis of mouse NSCs found that both quiescent and
cycling NSCs expressed GFAP and CD133 while only activated cells were EGFR+ (Codega et
al., 2014). While biologically distinct, quiescent and cycling populations were both multipotent
in vitro and in vivo, exhibited similar potency in lineage traces and could interconvert in culture.
Whether their unique properties were niche dependent was not explored. Tracing from Sox2+
cells in two different CreER mouse lines indicates that there may be distinct Sox2+ populations
within tumours. Gene expression profiling of tdTomato+ tumour cells sorted from each model
immediately after recombination would identify the key transcriptional differences
distinguishing these populations. Ultimately, a clonal lineage tracing approach will be required to
define the variability between individual Sox2+ cell outputs. This could be combined with single-
cell RNA-sequencing in attempt to correlate functional properties with gene expression profiles.
Sox2+ cells may exist in functionally distinct states or cycle between them. For example, some
Sox2+ cells may be biased to produce tumour cells with glial versus neuronal progeny. Capturing
individual cells’ functional properties with clonal-level lineage tracing and correlating clone
behaviors with distinct transcriptional profiles will provide a more holistic insight into the
variation with the Sox2+ pool. In analysis of skin adenomas, the majority of K14-derived clones
did not expand beyond 10 cells over 24 days and fewer than 1% of clones generated more than
158
45 cells (Driessens et al., 2012). Therefore, within the Sox2+ population it may be an even more
rarefied cell type that underlies tumour growth, or many cells each with a relatively small output.
Identifying a rarefied cell and defining its distinguishing properties as cell autonomous or
stochastic will be essential.
Secondly, it must be noted that while the Sox2+ population was defined as a label-
retaining and slowly-cycling, functionally defined quiescent or label-retaining cells were not
shown to be enriched in self-renewal properties. If Sox2+ cells transition between quiescent and
cycling states, these two populations may read out differently in functional assays and the sphere
formation, tumour transplantation and lineage tracing results could be confounded by
contributions from cycling and quiescent cells. To test whether quiescent cells are enriched in
self-renewal, one could use both in vitro and in vivo approaches. First, freshly dissociated Ptc;
Sox2-eGFP tumours could be labeled with a lipophilic red fluorescent dye such as PKH26 and
cultured for one week as spheres in NSC growth medium. Then, GFP+ cells from culture could
be sorted into label retaining (PKH26+/high) and unlabeled (PKH26-/low) fractions and compared in
an in vitro LDA. Ptc; Sox2-eGFP; tet-OFF H2B:mCherry; Rosa26-rtTA mice could be used to
compare label retaining and non-label retaining Sox2+ cells in vivo. In this model, all tumour
cells would initially be labeled and the addition of doxycycline to mouse drinking water would
inhibit H2B:mCherry expression to begin a ‘chase’ period. Following three weeks of
doxycycline treatment, tumours could be dissociated and the self-renewal of sorted Sox2-eGFP+;
H2B:mCherry+ (label-retaining) cells compared with Sox2-eGFP+; H2B:mCherry- (non-label-
retaining) in an in vivo LDA. These experiments would directly show whether the very same
159
cells that are functionally defined as slowly-cycling are also enriched for self-renewal, rather
than inferring this from population-level studies.
4.2.2 Testing the hierarchical model of medulloblastoma growth
My results suggest a hierarchical model for medulloblastoma growth with cells progressing from
one discrete, functionally distinct cell type to then next in unidirectional fashion. However, I can
not exclude the possibility that differentiated cell types revert to stem or progenitor cell types
during tumour growth. For example, an alternate interpretation of the EdU labeling results
derived from the study of NeuN+ cells is that a portion of the NeuN+ population stops expressing
NeuN and re-enters cell cycle. In this case, label would be lost through proliferation and
therefore the fraction of labeled NeuN+ cells would decrease. The most critical question in this
respect is: do Sox2- cells ever revert to the Sox2+ state? While I observed rare Sox2+ cells in two
Sox2- cell derived transplants, this could be due to contamination from cell sorting (sorts were of
approximately 95 % purity). Sox2- derived tumours were biologically distinct and could not be
serially transplanted, suggesting that functional de-differentiation does not occur. In the rare
cases of allograft formation from Sox2- squamous skin cancer cell transplants, tumours contained
Sox2+ cells but could not be serially transplanted (Boumahdi et al., 2014). The argument against
dedifferentiation is also supported by the maintenance of the tdTomato mark in the Sox2+
fraction during traces from the Sox2+ population. Were Sox2- cells to frequently revert to the
Sox2+ state, the fraction of labelled Sox2+ cells in Sox2creER traces would decrease over time.
Lineage tracing from DCX+ and NeuN+ cells will determine whether differentiated cell types
revert to the Sox2+ state. Tracing from DCXcreER mice was attempted but the DCXcreER1
160
model proved unfaithful while the DCXcreER2 model was ineffective. Mice with creER
knocked-in to the Dcx or NeuN locus should be used to perform fate-mapping experiments under
normal growth conditions and in the context of therapy. Ideally, these experiments would be
performed at the clonal level.
4.2.3 Controlling tumour growth by eliminating Sox2+ cells.
My model predicts that Sox2+ cells underlie long-term tumour growth, but is their
eradication sufficient to stop disease progression? Transplantation studies showed that
proliferative tumour bulk can engraft and kill a mouse at high cell doses. Specifically ablating
Sox2+ cells from Ptc tumours using Sox2-TK mice treated with gancyclovir or Sox2creER mice
crossed to conditional diphtheria toxin α-subunit (DTA) mice administered tamoxifen would
determine whether survival could be prolonged. Knock-in or CRISPR-mediated introduction of a
similar TK or DTA allele to the SOX2 locus of medulloblastoma xenografts would allow testing
of this hypothesis in human cells. This would provide an important validation for the model and
define the upper limit for the therapeutic efficacy of solely targeting Sox2+ cells. Sox2+ cell
ablation may be insufficient to save mice with primary tumours, but if my hypothesis is correct,
it should prevent tumour transplantation and long-term growth. Ward et al reported a survival
benefit of Ptch1+/-; Gfap-TK mice treated with gancyclovir and ablation of self-renewal in
medulloblastoma cultures treated with gancyclovir (2009). These results indicate that Sox2+ cell
eradication may be similarly effective, as Gfap is expressed in the Sox2+ fraction. If selectively
targeting Sox2+ cells in mouse and human tumours is sufficient to stop tumour growth and
161
prevent relapse, specific targeting of this cell type in patients may allow for development of less
toxic but equally or increasingly effective therapies.
In parallel, it would be interesting to genetically ablate distinct differentiated cell types
from within the tumour bulk. Faithful Dcx-creER or NeuN-creER mice crossed to a conditional
DTA mice would allow for killing of DCX+ or NeuN+ cells, respectively. Killing DCX+ cells is
predicted to slow tumour growth and may extend survival, but presumably they would be
replenished by Sox2+ cells, leading to relapse. Ablation of NeuN+ cells is unlikely to have any
significant impact on mouse survival since these cells are normally so rapidly lost from
expanding tumours.
4.2.4 Defining the role of the Sox2 gene in medulloblastoma growth
The Sox2 gene is critical to the growth and maintenance of many tissues and some
cancers. The role of Sox2 and the function of its encoded protein in medulloblastoma should be
elucidated. To determine whether Sox2 is required for tumour growth and transplantation,
Sox2flox mice, from which Sox2 can be conditionally deleted, should be crossed to Ptc;
Sox2creER mice. Tamoxifen-induced recombination would render these triple-transgenic mice
null for Sox2 in Sox2+ cells. Offspring of the cross would be administered tamoxifen and the
survival of Ptc; Sox2creER/flox mice would be compared to Ptc; Sox2creER/+, Ptc; Sox2-wt/flox
and Ptc; Sox2-wt/+ mice that maintain at least one copy of Sox2. Upregulation of Sox3
compensated for Sox2 deletion in the generation of Smo:M2-driven mouse medulloblastomas,
suggesting the gene is not required for tumour initiation (Ahlfeld et al., 2013). These
experiments would be nicely complemented with studies of primary human medulloblastoma
162
cells. SHH-subgroup tumours could be infected with SOX2 target shRNA lentiviruses and then
compared in in vitro proliferation and self-renewal assays as well as in vivo limiting dilution
analyses.
Taking the opposite approach and overexpressing Sox2 to determine its potential to
increase self-renewal may also be informative. Since Sox2 knockdown inhibits medulloblastoma
cell proliferation and self-renewal, the gene’s overall impact on tumour expansion should be
defined. These experiments could be performed in both mouse and human medulloblastoma cells
infected with a lentivirus encoding constitutively expressed Sox2 (human SOX2) or a scrambled
control construct. Infected cells would be compared in in vitro and in vivo tests of self-renewal,
with Sox2 overexpression predicted to ‘flatten’ the hierarchy: self-renewing cell frequency
should increase while the expression of differentiated cell markers like Dcx and NeuN would
decrease.
4.2.5 Defining the role of Sox2 protein in medulloblastoma growth
Sox2 is a transcription factor that mediates its effects by activating and repressing target
genes in a context-dependent manner. In embryonic stem cells and glioblastoma stem cells
SOX2 acts as a master regulator of stemness by activating self-renewal networks unique to the
pluripotent and tumourigenic states, respectively. In the former, it does so in part by forming a
complex with OCT4, another critical regulator of pluripotency. If the Sox2 gene governs self-
renewal in medulloblastoma, it presumably does so as a transcriptional regulator. Chromatin
immunoprecipitation of SOX2 followed by massively parallel sequencing of pulled-down DNA
(ChIP-seq) from primary human SHH medulloblastoma cultures would provide a landscape of
163
SOX2 binding sites throughout the tumour genome. Overlaying these data with ChIP-seq from
canonical euchromatin (H3K4me3) and heterochromatin (H3K27me3) marks and RNA-PolII
would determine whether SOX2 is associated with activation or repression of nearby genes.
Knocking-down SOX2 using shRNA transduction and examining changes in expression of genes
nearby to SOX2-binding sites would functionally test how SOX2 regulates them: genes that are
negatively regulated should increase in expression while positively regulated genes should
decrease. Integrating these datasets would identify a network of genes regulated by SOX2 in
SHH-medulloblastoma.
The SOX family of transcription factors binds to a common consensus sequence of DNA.
Whether a given protein binds to modify transcription depends on its level of expression in a
cell, post-translational modifications and physical interaction with other transcription factors.
SOX2-immunoprecipitation coupled with mass spectrometry from SHH medulloblastoma
cultures would identify peptides from transcription factors that may complex with SOX2 to
regulate transcription. Any ‘hits’ from this experiment could be validated using reciprocal co-
immunoprecipitation experiments to confirm members of a SOX2 regulatory complex. It would
be interesting to compare SOX2 binding partners in medulloblastoma cells with a control cell
type like neural stem cells to identify binding partners or transcriptional targets unique to the
medulloblastoma stem cell. Medulloblastoma data could then be compared to datasets from
SOX2-IP mass spectrometry and SOX2-ChIP seq of human glioblastoma stem cells to see if it
regulates self-renewal using similar mechanisms in this distinct brain tumour.
164
4.2 Concluding remarks
The cancer stem cell hypothesis has matured in the modern era, being borne out in many models
of disparate human and mouse malignancies. It has become increasingly clear that many of these
cancers depend on self-renewing stem cells to continually expand and recur post-treatment. This
thesis establishes Sox2+ cells as a quiescent population that drives growth and relapse in the
Ptch1+/- mouse medulloblastoma model and suggests that their ablation will improve therapeutic
efficacy in human patients. A small-scale drug screen and follow-up hints that transcriptional
inhibitors may present a novel treatment option for medulloblastom by blocking cell division and
self-renewal. Much of the data presented in this thesis was obtained by using the contemporary
versions of methods employed to generate the original stem cell model for cancer. Reflecting
upon this works shows how prescient those early models were, being based on rigorous
interpretation of solid experimental data. Over time, with the application of novel techniques to
the current framework, my model can be tested and refined to delve deeper into medulloblastoma
heterogeneity and its putative stem cell hierarchy, in doing so further elucidating the cellular and
molecular mechanisms of tumour growth.
165
References
Ahlfeld, J., Favaro, R., Pagella, P., Kretzschmar, H.A., Nicolis, S., and Schuller, U. (2013). Sox2 requirement in sonic hedgehog-associated medulloblastoma. Cancer Res 73, 3796-3807.
Al-Hajj, M., Wicha, M.S., Benito-Hernandez, A., Morrison, S.J., and Clarke, M.F. (2003). Prospective identification of tumorigenic breast cancer cells. Proc Natl Acad Sci U S A 100, 3983-3988.
Alcedo, J., Ayzenzon, M., Von Ohlen, T., Noll, M., and Hooper, J.E. (1996). The Drosophila smoothened gene encodes a seven-pass membrane protein, a putative receptor for the hedgehog signal. Cell 86, 221-232.
Annovazzi, L., Mellai, M., Caldera, V., Valente, G., and Schiffer, D. (2011). SOX2 expression and amplification in gliomas and glioma cell lines. Cancer Genomics Proteomics 8, 139-147.
Arnold, K., Sarkar, A., Yram, M.A., Polo, J.M., Bronson, R., Sengupta, S., Seandel, M., Geijsen, N., and Hochedlinger, K. (2011). Sox2(+) adult stem and progenitor cells are important for tissue regeneration and survival of mice. Cell Stem Cell 9, 317-329.
Auffinger, B., Tobias, A.L., Han, Y., Lee, G., Guo, D., Dey, M., Lesniak, M.S., and Ahmed, A.U. (2014). Conversion of differentiated cancer cells into cancer stem-like cells in a glioblastoma model after primary chemotherapy. Cell Death Differ.
Avilion, A.A., Nicolis, S.K., Pevny, L.H., Perez, L., Vivian, N., and Lovell-Badge, R. (2003). Multipotent cell lineages in early mouse development depend on SOX2 function. Genes & development 17, 126-140.
Ayrault, O., Zindy, F., Rehg, J., Sherr, C.J., and Roussel, M.F. (2009). Two tumor suppressors, p27Kip1 and patched-1, collaborate to prevent medulloblastoma. Mol Cancer Res 7, 33-40.
Bailey, P., and Cushing, H. (1925). Medulloblastoma cerebelli: A common type of midcerebellar glioma of childhood. Archives of Neurology & Psychiatry 14, 192-224.
Bailey, P., and Cushing, H. (1926). A classification of the tumors of the glioma group on a histogenetic basis with a correlated study of prognosis (Philadelphia, London etc., J.B. Lippincott Company).
Baltus, G.A., Kowalski, M.P., Zhai, H., Tutter, A.V., Quinn, D., Wall, D., and Kadam, S. (2009). Acetylation of sox2 induces its nuclear export in embryonic stem cells. Stem Cells 27, 2175-2184.
166
Barrett, L.E., Granot, Z., Coker, C., Iavarone, A., Hambardzumyan, D., Holland, E.C., Nam, H.S., and Benezra, R. (2012). Self-renewal does not predict tumor growth potential in mouse models of high-grade glioma. Cancer Cell 21, 11-24.
Barrow, J.R., Stadler, H.S., and Capecchi, M.R. (2000). Roles of Hoxa1 and Hoxa2 in patterning the early hindbrain of the mouse. Development 127, 933-944.
Bass, A.J., Watanabe, H., Mermel, C.H., Yu, S., Perner, S., Verhaak, R.G., Kim, S.Y., Wardwell, L., Tamayo, P., Gat-Viks, I., et al. (2009). SOX2 is an amplified lineage-survival oncogene in lung and esophageal squamous cell carcinomas. Nat Genet 41, 1238-1242.
Baum, M. (1968). A clinical trial of mithramycin in the treatment of advanced malignant disease. Br J Cancer 22, 176-183.
Becker, A.J., McCulloch, E.A., Siminovitch, L., and Till, J.E. (1965). The Effect of Differing Demands for Blood Cell Production on DNA Synthesis by Hemopoietic Colony-Forming Cells of Mice. Blood 26, 296-308.
Bennett, D.C., Peachey, L.A., Durbin, H., and Rudland, P.S. (1978). A possible mammary stem cell line. Cell 15, 283-298.
Blackburn, J.S., Liu, S., Wilder, J.L., Dobrinski, K.P., Lobbardi, R., Moore, F.E., Martinez, S.A., Chen, E.Y., Lee, C., and Langenau, D.M. (2014). Clonal evolution enhances leukemia-propagating cell frequency in T cell acute lymphoblastic leukemia through Akt/mTORC1 pathway activation. Cancer Cell 25, 366-378.
Boiko, A.D., Razorenova, O.V., van de Rijn, M., Swetter, S.M., Johnson, D.L., Ly, D.P., Butler, P.D., Yang, G.P., Joshua, B., Kaplan, M.J., et al. (2010). Human melanoma-initiating cells express neural crest nerve growth factor receptor CD271. Nature 466, 133-137.
Bonnet, D., and Dick, J.E. (1997). Human acute myeloid leukemia is organized as a hierarchy that originates from a primitive hematopoietic cell. Nat Med 3, 730-737.
Boumahdi, S., Driessens, G., Lapouge, G., Rorive, S., Nassar, D., Le Mercier, M., Delatte, B., Caauwe, A., Lenglez, S., Nkusi, E., et al. (2014). SOX2 controls tumour initiation and cancer stem-cell functions in squamous-cell carcinoma. Nature 511, 246-250.
Brawley, C., and Matunis, E. (2004). Regeneration of male germline stem cells by spermatogonial dedifferentiation in vivo. Science 304, 1331-1334.
Bruce, W.R., and Van Der Gaag, H. (1963). A Quantitative Assay for the Number of Murine Lymphoma Cells Capable of Proliferation in Vivo. Nature 199, 79-80.
Brunschwig, A., Southam, C.M., and Levin, A.G. (1965). Host resistance to cancer. Clinical experiments by homotransplants, autotransplants and admixture of autologous leucocytes. Ann Surg 162, 416-425.
167
Buczacki, S.J., Zecchini, H.I., Nicholson, A.M., Russell, R., Vermeulen, L., Kemp, R., and Winton, D.J. (2013). Intestinal label-retaining cells are secretory precursors expressing Lgr5. Nature 495, 65-69.
Bunin, G.R., Kuijten, R.R., Buckley, J.D., Rorke, L.B., and Meadows, A.T. (1993). Relation between maternal diet and subsequent primitive neuroectodermal brain tumors in young children. N Engl J Med 329, 536-541.
Bunin, G.R., Kushi, L.H., Gallagher, P.R., Rorke-Adams, L.B., McBride, M.L., and Cnaan, A. (2005). Maternal diet during pregnancy and its association with medulloblastoma in children: a children's oncology group study (United States). Cancer Causes Control 16, 877-891.
Bylund, M., Andersson, E., Novitch, B.G., and Muhr, J. (2003). Vertebrate neurogenesis is counteracted by Sox1-3 activity. Nat Neurosci 6, 1162-1168.
Cavallaro, M., Mariani, J., Lancini, C., Latorre, E., Caccia, R., Gullo, F., Valotta, M., DeBiasi, S., Spinardi, L., Ronchi, A., et al. (2008). Impaired generation of mature neurons by neural stem cells from hypomorphic Sox2 mutants. Development 135, 541-557.
CCS (2014). Canadian Cancer Statistics 2014 (Toronto, Canadian Cancer Society).
Chakkalakal, J.V., Christensen, J., Xiang, W., Tierney, M.T., Boscolo, F.S., Sacco, A., and Brack, A.S. (2014). Early forming label-retaining muscle stem cells require p27kip1 for maintenance of the primitive state. Development 141, 1649-1659.
Charles, N., Ozawa, T., Squatrito, M., Bleau, A.M., Brennan, C.W., Hambardzumyan, D., and Holland, E.C. (2010). Perivascular nitric oxide activates notch signaling and promotes stem-like character in PDGF-induced glioma cells. Cell Stem Cell 6, 141-152.
Chen, J., Li, Y., Yu, T.S., McKay, R.M., Burns, D.K., Kernie, S.G., and Parada, L.F. (2012). A restricted cell population propagates glioblastoma growth after chemotherapy. Nature 488, 522-526.
Chen, Y., and Struhl, G. (1996). Dual roles for patched in sequestering and transducing Hedgehog. Cell 87, 553-563.
Cheng, T., Rodrigues, N., Shen, H., Yang, Y., Dombkowski, D., Sykes, M., and Scadden, D.T. (2000). Hematopoietic stem cell quiescence maintained by p21cip1/waf1. Science 287, 1804-1808.
Cheung, T.H., Quach, N.L., Charville, G.W., Liu, L., Park, L., Edalati, A., Yoo, B., Hoang, P., and Rando, T.A. (2012). Maintenance of muscle stem-cell quiescence by microRNA-489. Nature 482, 524-528.
Cho, Y.J., Tsherniak, A., Tamayo, P., Santagata, S., Ligon, A., Greulich, H., Berhoukim, R., Amani, V., Goumnerova, L., Eberhart, C.G., et al. (2011). Integrative genomic analysis of
168
medulloblastoma identifies a molecular subgroup that drives poor clinical outcome. J Clin Oncol 29, 1424-1430.
Chow, K.H., Shin, D.M., Jenkins, M.H., Miller, E.E., Shih, D.J., Choi, S., Low, B.E., Philip, V., Rybinski, B., Bronson, R.T., et al. (2014). Epigenetic States of Cells of Origin and Tumor Evolution Drive Tumor-Initiating Cell Phenotype and Tumor Heterogeneity. Cancer Res.
Clarkson, B., Fried, J., Strife, A., Sakai, Y., Ota, K., and Okita, T. (1970). Studies of cellular proliferation in human leukemia. 3. Behavior of leukemic cells in three adults with acute leukemia given continuous infusions of 3H-thymidine for 8 or 10 days. Cancer 25, 1237-1260.
Clevers, H. (2011). The cancer stem cell: premises, promises and challenges. Nat Med 17, 313-319.
Codega, P., Silva-Vargas, V., Paul, A., Maldonado-Soto, A.R., Deleo, A.M., Pastrana, E., and Doetsch, F. (2014). Prospective identification and purification of quiescent adult neural stem cells from their in vivo niche. Neuron 82, 545-559.
Coffin, C.M., Braun, J.T., Wick, M.R., and Dehner, L.P. (1990). A clinicopathologic and immunohistochemical analysis of 53 cases of medulloblastoma with emphasis on synaptophysin expression. Mod Pathol 3, 164-170.
Coller, H.A. (2011). Cell biology. The essence of quiescence. Science 334, 1074-1075.
Collignon, J., Sockanathan, S., Hacker, A., Cohen-Tannoudji, M., Norris, D., Rastan, S., Stevanovic, M., Goodfellow, P.N., and Lovell-Badge, R. (1996). A comparison of the properties of Sox-3 with Sry and two related genes, Sox-1 and Sox-2. Development 122, 509-520.
Collins, A.T., Berry, P.A., Hyde, C., Stower, M.J., and Maitland, N.J. (2005). Prospective identification of tumorigenic prostate cancer stem cells. Cancer Res 65, 10946-10951.
Colt, J.S., and Blair, A. (1998). Parental occupational exposures and risk of childhood cancer. Environ Health Perspect 106 Suppl 3, 909-925.
Corbin, A.S., Agarwal, A., Loriaux, M., Cortes, J., Deininger, M.W., and Druker, B.J. (2011). Human chronic myeloid leukemia stem cells are insensitive to imatinib despite inhibition of BCR-ABL activity. J Clin Invest 121, 396-409.
Corbit, K.C., Aanstad, P., Singla, V., Norman, A.R., Stainier, D.Y., and Reiter, J.F. (2005). Vertebrate Smoothened functions at the primary cilium. Nature 437, 1018-1021.
Cordier, S., Lefeuvre, B., Filippini, G., Peris-Bonet, R., Farinotti, M., Lovicu, G., and Mandereau, L. (1997). Parental occupation, occupational exposure to solvents and polycyclic aromatic hydrocarbons and risk of childhood brain tumors (Italy, France, Spain). Cancer Causes Control 8, 688-697.
169
Cotsarelis, G., Sun, T.T., and Lavker, R.M. (1990). Label-retaining cells reside in the bulge area of pilosebaceous unit: implications for follicular stem cells, hair cycle, and skin carcinogenesis. Cell 61, 1329-1337.
Crawford, J.R., MacDonald, T.J., and Packer, R.J. (2007). Medulloblastoma in childhood: new biological advances. Lancet Neurol 6, 1073-1085.
Crist, C.G., Montarras, D., and Buckingham, M. (2012). Muscle satellite cells are primed for myogenesis but maintain quiescence with sequestration of Myf5 mRNA targeted by microRNA-31 in mRNP granules. Cell Stem Cell 11, 118-126.
Crowther, A.J., Gama, V., Bevilacqua, A., Chang, S.X., Yuan, H., Deshmukh, M., and Gershon, T.R. (2013). Tonic activation of Bax primes neural progenitors for rapid apoptosis through a mechanism preserved in medulloblastoma. J Neurosci 33, 18098-18108.
Curley, M.D., Therrien, V.A., Cummings, C.L., Sergent, P.A., Koulouris, C.R., Friel, A.M., Roberts, D.J., Seiden, M.V., Scadden, D.T., Rueda, B.R., et al. (2009). CD133 Expression Defines a Tumor Initiating Cell Population in Primary Human Ovarian Cancer. Stem Cells.
Davis, F.G., Freels, S., Grutsch, J., Barlas, S., and Brem, S. (1998). Survival rates in patients with primary malignant brain tumors stratified by patient age and tumor histological type: an analysis based on Surveillance, Epidemiology, and End Results (SEER) data, 1973-1991. J Neurosurg 88, 1-10.
Deleyrolle, L.P., Harding, A., Cato, K., Siebzehnrubl, F.A., Rahman, M., Azari, H., Olson, S., Gabrielli, B., Osborne, G., Vescovi, A., et al. (2011). Evidence for label-retaining tumour-initiating cells in human glioblastoma. Brain 134, 1331-1343.
Dembinski, J.L., and Krauss, S. (2010). A Distinct Slow-Cycling Cancer Stem-like Subpopulation of Pancreatic Adenocarcinoma Cells is maintained in Vivo. Cancers (Basel) 2, 2011-2025.
Doetsch, F., Caille, I., Lim, D.A., Garcia-Verdugo, J.M., and Alvarez-Buylla, A. (1999). Subventricular zone astrocytes are neural stem cells in the adult mammalian brain. Cell 97, 703-716.
Doetsch, F., Garcia-Verdugo, J.M., and Alvarez-Buylla, A. (1997). Cellular composition and three-dimensional organization of the subventricular germinal zone in the adult mammalian brain. J Neurosci 17, 5046-5061.
Driessens, G., Beck, B., Caauwe, A., Simons, B.D., and Blanpain, C. (2012). Defining the mode of tumour growth by clonal analysis. Nature 488, 527-530.
Driskell, R.R., Giangreco, A., Jensen, K.B., Mulder, K.W., and Watt, F.M. (2009). Sox2-positive dermal papilla cells specify hair follicle type in mammalian epidermis. Development 136, 2815-2823.
170
Duan, C.W., Shi, J., Chen, J., Wang, B., Yu, Y.H., Qin, X., Zhou, X.C., Cai, Y.J., Li, Z.Q., Zhang, F., et al. (2014). Leukemia propagating cells rebuild an evolving niche in response to therapy. Cancer Cell 25, 778-793.
Ellis, P., Fagan, B.M., Magness, S.T., Hutton, S., Taranova, O., Hayashi, S., McMahon, A., Rao, M., and Pevny, L. (2004). SOX2, a persistent marker for multipotential neural stem cells derived from embryonic stem cells, the embryo or the adult. Dev Neurosci 26, 148-165.
Engelen, E., Akinci, U., Bryne, J.C., Hou, J., Gontan, C., Moen, M., Szumska, D., Kockx, C., van Ijcken, W., Dekkers, D.H., et al. (2011). Sox2 cooperates with Chd7 to regulate genes that are mutated in human syndromes. Nat Genet 43, 607-611.
Eppert, K., Takenaka, K., Lechman, E.R., Waldron, L., Nilsson, B., van Galen, P., Metzeler, K.H., Poeppl, A., Ling, V., Beyene, J., et al. (2011). Stem cell gene expression programs influence clinical outcome in human leukemia. Nat Med 17, 1086-1093.
Eramo, A., Lotti, F., Sette, G., Pilozzi, E., Biffoni, M., Di Virgilio, A., Conticello, C., Ruco, L., Peschle, C., and De Maria, R. (2008). Identification and expansion of the tumorigenic lung cancer stem cell population. Cell Death Differ 15, 504-514.
Espinosa, J.S., and Luo, L. (2008). Timing neurogenesis and differentiation: insights from quantitative clonal analyses of cerebellar granule cells. J Neurosci 28, 2301-2312.
Fang, X., Yoon, J.G., Li, L., Tsai, Y.S., Zheng, S., Hood, L., Goodlett, D.R., Foltz, G., and Lin, B. (2011). Landscape of the SOX2 protein-protein interactome. Proteomics 11, 921-934.
Fantes, J., Ragge, N.K., Lynch, S.A., McGill, N.I., Collin, J.R., Howard-Peebles, P.N., Hayward, C., Vivian, A.J., Williamson, K., van Heyningen, V., et al. (2003). Mutations in SOX2 cause anophthalmia. Nat Genet 33, 461-463.
Ferri, A.L., Cavallaro, M., Braida, D., Di Cristofano, A., Canta, A., Vezzani, A., Ottolenghi, S., Pandolfi, P.P., Sala, M., DeBiasi, S., et al. (2004). Sox2 deficiency causes neurodegeneration and impaired neurogenesis in the adult mouse brain. Development 131, 3805-3819.
Fidler, I.J., and Kripke, M.L. (1977). Metastasis results from preexisting variant cells within a malignant tumor. Science 197, 893-895.
Furth, J.a.K., M. (1937). The transmission of leukemia of mice with a single cell. American Journal of Cancer 31, 7.
Gajjar, A., Chintagumpala, M., Ashley, D., Kellie, S., Kun, L.E., Merchant, T.E., Woo, S., Wheeler, G., Ahern, V., Krasin, M.J., et al. (2006). Risk-adapted craniospinal radiotherapy followed by high-dose chemotherapy and stem-cell rescue in children with newly diagnosed medulloblastoma (St Jude Medulloblastoma-96): long-term results from a prospective, multicentre trial. Lancet Oncol 7, 813-820.
171
Gajjar, A., Stewart, C.F., Ellison, D.W., Kaste, S., Kun, L.E., Packer, R.J., Goldman, S., Chintagumpala, M., Wallace, D., Takebe, N., et al. (2013). Phase I study of vismodegib in children with recurrent or refractory medulloblastoma: a pediatric brain tumor consortium study. Clin Cancer Res 19, 6305-6312.
Gao, M.Q., Choi, Y.P., Kang, S., Youn, J.H., and Cho, N.H. (2010). CD24+ cells from hierarchically organized ovarian cancer are enriched in cancer stem cells. Oncogene 29, 2672-2680.
Garcia, I., Crowther, A.J., Gama, V., Ryan Miller, C., Deshmukh, M., and Gershon, T.R. (2013). Bax deficiency prolongs cerebellar neurogenesis, accelerates medulloblastoma formation and paradoxically increases both malignancy and differentiation. Oncogene 32, 2304-2314.
Gavosto, F., Pileri, A., Gabutti, V., and Masera, P. (1967). Non-self-maintaining kinetics of proliferating blasts in human acute leukaemia. Nature 216, 188-189.
Gibson, P., Tong, Y., Robinson, G., Thompson, M.C., Currle, D.S., Eden, C., Kranenburg, T.A., Hogg, T., Poppleton, H., Martin, J., et al. (2010). Subtypes of medulloblastoma have distinct developmental origins. Nature 468, 1095-1099.
Gil-Perotin, S., Marin-Husstege, M., Li, J., Soriano-Navarro, M., Zindy, F., Roussel, M.F., Garcia-Verdugo, J.M., and Casaccia-Bonnefil, P. (2006). Loss of p53 induces changes in the behavior of subventricular zone cells: implication for the genesis of glial tumors. J Neurosci 26, 1107-1116.
Glinsky, G.V., Berezovska, O., and Glinskii, A.B. (2005). Microarray analysis identifies a death-from-cancer signature predicting therapy failure in patients with multiple types of cancer. J Clin Invest 115, 1503-1521.
Goardon, N., Marchi, E., Atzberger, A., Quek, L., Schuh, A., Soneji, S., Woll, P., Mead, A., Alford, K.A., Rout, R., et al. (2011). Coexistence of LMPP-like and GMP-like leukemia stem cells in acute myeloid leukemia. Cancer Cell 19, 138-152.
Goff, D.J., Recart, A.C., Sadarangani, A., Chun, H.J., Barrett, C.L., Krajewska, M., Leu, H., Low-Marchelli, J., Ma, W., Shih, A.Y., et al. (2013). A Pan-BCL2 inhibitor renders bone-marrow-resident human leukemia stem cells sensitive to tyrosine kinase inhibition. Cell Stem Cell 12, 316-328.
Goodrich, L.V., Milenkovic, L., Higgins, K.M., and Scott, M.P. (1997). Altered neural cell fates and medulloblastoma in mouse patched mutants. Science 277, 1109-1113.
Goya, R., Sun, M.G., Morin, R.D., Leung, G., Ha, G., Wiegand, K.C., Senz, J., Crisan, A., Marra, M.A., Hirst, M., et al. (2010). SNVMix: predicting single nucleotide variants from next-generation sequencing of tumors. Bioinformatics 26, 730-736.
Grafi, G. (2004). How cells dedifferentiate: a lesson from plants. Dev Biol 268, 1-6.
172
Graham, S.M., Jorgensen, H.G., Allan, E., Pearson, C., Alcorn, M.J., Richmond, L., and Holyoake, T.L. (2002). Primitive, quiescent, Philadelphia-positive stem cells from patients with chronic myeloid leukemia are insensitive to STI571 in vitro. Blood 99, 319-325.
Graham, V., Khudyakov, J., Ellis, P., and Pevny, L. (2003). SOX2 functions to maintain neural progenitor identity. Neuron 39, 749-765.
Grill, J., Sainte-Rose, C., Jouvet, A., Gentet, J.C., Lejars, O., Frappaz, D., Doz, F., Rialland, X., Pichon, F., Bertozzi, A.I., et al. (2005). Treatment of medulloblastoma with postoperative chemotherapy alone: an SFOP prospective trial in young children. Lancet Oncol 6, 573-580.
Grotzer, M.A., Janss, A.J., Fung, K., Biegel, J.A., Sutton, L.N., Rorke, L.B., Zhao, H., Cnaan, A., Phillips, P.C., Lee, V.M., et al. (2000). TrkC expression predicts good clinical outcome in primitive neuroectodermal brain tumors. J Clin Oncol 18, 1027-1035.
Guan, Y., Gerhard, B., and Hogge, D.E. (2003). Detection, isolation, and stimulation of quiescent primitive leukemic progenitor cells from patients with acute myeloid leukemia (AML). Blood 101, 3142-3149.
Gubbay, J., Collignon, J., Koopman, P., Capel, B., Economou, A., Munsterberg, A., Vivian, N., Goodfellow, P., and Lovell-Badge, R. (1990). A gene mapping to the sex-determining region of the mouse Y chromosome is a member of a novel family of embryonically expressed genes. Nature 346, 245-250.
Gupta, P.B., Fillmore, C.M., Jiang, G., Shapira, S.D., Tao, K., Kuperwasser, C., and Lander, E.S. (2011). Stochastic state transitions give rise to phenotypic equilibrium in populations of cancer cells. Cell 146, 633-644.
Hacker, S., Karl, S., Mader, I., Cristofanon, S., Schweitzer, T., Krauss, J., Rutkowski, S., Debatin, K.M., and Fulda, S. (2011). Histone deacetylase inhibitors prime medulloblastoma cells for chemotherapy-induced apoptosis by enhancing p53-dependent Bax activation. Oncogene 30, 2275-2281.
Hager, J.C., Fligiel, S., Stanley, W., Richardson, A.M., and Heppner, G.H. (1981). Characterization of a variant-producing tumor cell line from a heterogeneous strain BALB/cfC3H mouse mammary tumor. Cancer Res 41, 1293-1300.
Hagstrom, S.A., Pauer, G.J., Reid, J., Simpson, E., Crowe, S., Maumenee, I.H., and Traboulsi, E.I. (2005). SOX2 mutation causes anophthalmia, hearing loss, and brain anomalies. Am J Med Genet A 138A, 95-98.
Hallahan, A.R., Pritchard, J.I., Hansen, S., Benson, M., Stoeck, J., Hatton, B.A., Russell, T.L., Ellenbogen, R.G., Bernstein, I.D., Beachy, P.A., et al. (2004). The SmoA1 mouse model reveals that notch signaling is critical for the growth and survival of sonic hedgehog-induced medulloblastomas. Cancer Res 64, 7794-7800.
173
Hambardzumyan, D., Becher, O.J., Rosenblum, M.K., Pandolfi, P.P., Manova-Todorova, K., and Holland, E.C. (2008). PI3K pathway regulates survival of cancer stem cells residing in the perivascular niche following radiation in medulloblastoma in vivo. Genes Dev 22, 436-448.
Han, J., Sachdev, P.S., and Sidhu, K.S. (2010). A combined epigenetic and non-genetic approach for reprogramming human somatic cells. PLoS One 5, e12297.
Harley, V.R., Lovell-Badge, R., and Goodfellow, P.N. (1994). Definition of a consensus DNA binding site for SRY. Nucleic Acids Res 22, 1500-1501.
Hatten, M.E., and Roussel, M.F. (2011). Development and cancer of the cerebellum. Trends Neurosci 34, 134-142.
Hauschka, T.S. (1953). Methods of conditioning the graft in tumor transplantation. J Natl Cancer Inst 14, 723-739; discussion, 741-723.
Hawkins, M.M., Draper, G.J., and Kingston, J.E. (1987). Incidence of second primary tumours among childhood cancer survivors. Br J Cancer 56, 339-347.
Helms, A.W., Gowan, K., Abney, A., Savage, T., and Johnson, J.E. (2001). Overexpression of MATH1 disrupts the coordination of neural differentiation in cerebellum development. Mol Cell Neurosci 17, 671-682.
Hermann, P.C., Huber, S.L., Herrler, T., Aicher, A., Ellwart, J.W., Guba, M., Bruns, C.J., and Heeschen, C. (2007). Distinct populations of cancer stem cells determine tumor growth and metastatic activity in human pancreatic cancer. Cell Stem Cell 1, 313-323.
Holtz, M., Forman, S.J., and Bhatia, R. (2007). Growth factor stimulation reduces residual quiescent chronic myelogenous leukemia progenitors remaining after imatinib treatment. Cancer Res 67, 1113-1120.
Holyoake, T., Jiang, X., Eaves, C., and Eaves, A. (1999). Isolation of a highly quiescent subpopulation of primitive leukemic cells in chronic myeloid leukemia. Blood 94, 2056-2064.
Hope, K.J., Jin, L., and Dick, J.E. (2004). Acute myeloid leukemia originates from a hierarchy of leukemic stem cell classes that differ in self-renewal capacity. Nat Immunol 5, 738-743.
Hu, Y., and Smyth, G.K. (2009). ELDA: extreme limiting dilution analysis for comparing depleted and enriched populations in stem cell and other assays. J Immunol Methods 347, 70-78.
Hui, C.C., and Angers, S. (2011). Gli proteins in development and disease. Annu Rev Cell Dev Biol 27, 513-537.
Huse, J.T., and Holland, E.C. (2010). Targeting brain cancer: advances in the molecular pathology of malignant glioma and medulloblastoma. Nat Rev Cancer 10, 319-331.
174
Ingham, P.W., Taylor, A.M., and Nakano, Y. (1991). Role of the Drosophila patched gene in positional signalling. Nature 353, 184-187.
Irving, C., and Mason, I. (2000). Signalling by FGF8 from the isthmus patterns anterior hindbrain and establishes the anterior limit of Hox gene expression. Development 127, 177-186.
Ishikawa, F., Yoshida, S., Saito, Y., Hijikata, A., Kitamura, H., Tanaka, S., Nakamura, R., Tanaka, T., Tomiyama, H., Saito, N., et al. (2007). Chemotherapy-resistant human AML stem cells home to and engraft within the bone-marrow endosteal region. Nat Biotechnol 25, 1315-1321.
Ishizawa, K., Rasheed, Z.A., Karisch, R., Wang, Q., Kowalski, J., Susky, E., Pereira, K., Karamboulas, C., Moghal, N., Rajeshkumar, N.V., et al. (2010). Tumor-initiating cells are rare in many human tumors. Cell Stem Cell 7, 279-282.
Ito, K., Bernardi, R., Morotti, A., Matsuoka, S., Saglio, G., Ikeda, Y., Rosenblatt, J., Avigan, D.E., Teruya-Feldstein, J., and Pandolfi, P.P. (2008). PML targeting eradicates quiescent leukaemia-initiating cells. Nature 453, 1072-1078.
Jeong, C.H., Cho, Y.Y., Kim, M.O., Kim, S.H., Cho, E.J., Lee, S.Y., Jeon, Y.J., Lee, K.Y., Yao, K., Keum, Y.S., et al. (2010). Phosphorylation of Sox2 cooperates in reprogramming to pluripotent stem cells. Stem Cells 28, 2141-2150.
Junttila, M.R., and de Sauvage, F.J. (2013). Influence of tumour micro-environment heterogeneity on therapeutic response. Nature 501, 346-354.
Justilien, V., Walsh, M.P., Ali, S.A., Thompson, E.A., Murray, N.R., and Fields, A.P. (2014). The PRKCI and SOX2 oncogenes are coamplified and cooperate to activate Hedgehog signaling in lung squamous cell carcinoma. Cancer Cell 25, 139-151.
Kai, T., and Spradling, A. (2004). Differentiating germ cells can revert into functional stem cells in Drosophila melanogaster ovaries. Nature 428, 564-569.
Kamachi, Y., Uchikawa, M., Tanouchi, A., Sekido, R., and Kondoh, H. (2001). Pax6 and SOX2 form a co-DNA-binding partner complex that regulates initiation of lens development. Genes & development 15, 1272-1286.
Kamel-Reid, S., and Dick, J.E. (1988). Engraftment of immune-deficient mice with human hematopoietic stem cells. Science 242, 1706-1709.
Kamel-Reid, S., Letarte, M., Sirard, C., Doedens, M., Grunberger, T., Fulop, G., Freedman, M.H., Phillips, R.A., and Dick, J.E. (1989). A model of human acute lymphoblastic leukemia in immune-deficient SCID mice. Science 246, 1597-1600.
Kappadakunnel, M., Eskin, A., Dong, J., Nelson, S.F., Mischel, P.S., Liau, L.M., Ngheimphu, P., Lai, A., Cloughesy, T.F., Goldin, J., et al. (2010). Stem cell associated gene expression in
175
glioblastoma multiforme: relationship to survival and the subventricular zone. J Neurooncol 96, 359-367.
Karlsson, P., Holmberg, E., Lundell, M., Mattsson, A., Holm, L.E., and Wallgren, A. (1998). Intracranial tumors after exposure to ionizing radiation during infancy: a pooled analysis of two Swedish cohorts of 28,008 infants with skin hemangioma. Radiat Res 150, 357-364.
Karpowicz, P., Morshead, C., Kam, A., Jervis, E., Ramunas, J., Cheng, V., and van der Kooy, D. (2005). Support for the immortal strand hypothesis: neural stem cells partition DNA asymmetrically in vitro. J Cell Biol 170, 721-732.
Kawauchi, D., Robinson, G., Uziel, T., Gibson, P., Rehg, J., Gao, C., Finkelstein, D., Qu, C., Pounds, S., Ellison, D.W., et al. (2012). A mouse model of the most aggressive subgroup of human medulloblastoma. Cancer Cell 21, 168-180.
Keramari, M., Razavi, J., Ingman, K.A., Patsch, C., Edenhofer, F., Ward, C.M., and Kimber, S.J. (2010). Sox2 is essential for formation of trophectoderm in the preimplantation embryo. PLoS One 5, e13952.
Kippin, T.E., Martens, D.J., and van der Kooy, D. (2005). p21 loss compromises the relative quiescence of forebrain stem cell proliferation leading to exhaustion of their proliferation capacity. Genes Dev 19, 756-767.
Klein, G., and Klein, E. (1956). Conversion of solid neoplasms into ascites tumors. Ann N Y Acad Sci 63, 640-661.
Kleinsmith, L.J., and Pierce, G.B., Jr. (1964). Multipotentiality of Single Embryonal Carcinoma Cells. Cancer Res 24, 1544-1551.
Kool, M., Jones, D.T., Jager, N., Northcott, P.A., Pugh, T.J., Hovestadt, V., Piro, R.M., Esparza, L.A., Markant, S.L., Remke, M., et al. (2014). Genome Sequencing of SHH Medulloblastoma Predicts Genotype-Related Response to Smoothened Inhibition. Cancer Cell 25, 393-405.
Kool, M., Koster, J., Bunt, J., Hasselt, N.E., Lakeman, A., van Sluis, P., Troost, D., Meeteren, N.S., Caron, H.N., Cloos, J., et al. (2008). Integrated genomics identifies five medulloblastoma subtypes with distinct genetic profiles, pathway signatures and clinicopathological features. PLoS One 3, e3088.
Kragl, M., Knapp, D., Nacu, E., Khattak, S., Maden, M., Epperlein, H.H., and Tanaka, E.M. (2009). Cells keep a memory of their tissue origin during axolotl limb regeneration. Nature 460, 60-65.
Kreso, A., and Dick, J.E. (2014). Evolution of the Cancer Stem Cell Model. Cell Stem Cell 14, 275-291.
176
Kreso, A., O'Brien, C.A., van Galen, P., Gan, O.I., Notta, F., Brown, A.M., Ng, K., Ma, J., Wienholds, E., Dunant, C., et al. (2013). Variable clonal repopulation dynamics influence chemotherapy response in colorectal cancer. Science 339, 543-548.
Kreso, A., van Galen, P., Pedley, N.M., Lima-Fernandes, E., Frelin, C., Davis, T., Cao, L., Baiazitov, R., Du, W., Sydorenko, N., et al. (2014). Self-renewal as a therapeutic target in human colorectal cancer. Nat Med 20, 29-36.
Kretzschmar, K., and Watt, F.M. (2012). Lineage tracing. Cell 148, 33-45.
Kusumbe, A.P., and Bapat, S.A. (2009). Cancer stem cells and aneuploid populations within developing tumors are the major determinants of tumor dormancy. Cancer Res 69, 9245-9253.
Lajtha, L.G. (1963). ON THE CONCEPT OF THE CELL CYCLE. Journal of cellular physiology 62, SUPPL1:143-145.
Lajtha, L.G., Oliver, R., and Gurney, C.W. (1962). Kinetic model of a bone-marrow stem-cell population. British journal of haematology 8, 442-460.
Laks, D.R., Masterman-Smith, M., Visnyei, K., Angenieux, B., Orozco, N.M., Foran, I., Yong, W.H., Vinters, H.V., Liau, L.M., Lazareff, J.A., et al. (2009). Neurosphere formation is an independent predictor of clinical outcome in malignant glioma. Stem Cells 27, 980-987.
Lapidot, T., Sirard, C., Vormoor, J., Murdoch, B., Hoang, T., Caceres-Cortes, J., Minden, M., Paterson, B., Caligiuri, M.A., and Dick, J.E. (1994). A cell initiating human acute myeloid leukaemia after transplantation into SCID mice. Nature 367, 645-648.
Laudet, V., Stehelin, D., and Clevers, H. (1993). Ancestry and diversity of the HMG box superfamily. Nucleic Acids Res 21, 2493-2501.
Laurenti, E., Frelin, C., Xie, S., Ferrari, R., Dunant, C.F., Zandi, S., Neumann, A., Plumb, I., Doulatov, S., Chen, J., et al. (2015). CDK6 Levels Regulate Quiescence Exit in Human Hematopoietic Stem Cells. Cell Stem Cell 16, 302-313.
Lechman, E.R., Gentner, B., van Galen, P., Giustacchini, A., Saini, M., Boccalatte, F.E., Hiramatsu, H., Restuccia, U., Bachi, A., Voisin, V., et al. (2012). Attenuation of miR-126 activity expands HSC in vivo without exhaustion. Cell Stem Cell 11, 799-811.
Lee, J.J., von Kessler, D.P., Parks, S., and Beachy, P.A. (1992). Secretion and localized transcription suggest a role in positional signaling for products of the segmentation gene hedgehog. Cell 71, 33-50.
Lee, S.J., Krauthauser, C., Maduskuie, V., Fawcett, P.T., Olson, J.M., and Rajasekaran, S.A. (2011). Curcumin-induced HDAC inhibition and attenuation of medulloblastoma growth in vitro and in vivo. BMC Cancer 11, 144.
177
Lee, Y., Miller, H.L., Jensen, P., Hernan, R., Connelly, M., Wetmore, C., Zindy, F., Roussel, M.F., Curran, T., Gilbertson, R.J., et al. (2003). A molecular fingerprint for medulloblastoma. Cancer Res 63, 5428-5437.
Levan, A., Nichols, W.W., and NordÉN, Å. (1963). A CASE OF CHRONIC MYELOID LEUKEMIA WITH TWO LEUKEMIC STEMLINES IN THE BLOOD. Hereditas 49, 433-441.
Li, C., Heidt, D.G., Dalerba, P., Burant, C.F., Zhang, L., Adsay, V., Wicha, M., Clarke, M.F., and Simeone, D.M. (2007). Identification of pancreatic cancer stem cells. Cancer Res 67, 1030-1037.
Li, H., and Durbin, R. (2009). Fast and accurate short read alignment with Burrows-Wheeler transform. Bioinformatics 25, 1754-1760.
Li, L., and Clevers, H. (2010). Coexistence of quiescent and active adult stem cells in mammals. Science 327, 542-545.
Li, L., He, S., Sun, J.M., and Davie, J.R. (2004). Gene regulation by Sp1 and Sp3. Biochem Cell Biol 82, 460-471.
Li, P., Du, F., Yuelling, L.W., Lin, T., Muradimova, R.E., Tricarico, R., Wang, J., Enikolopov, G., Bellacosa, A., Wechsler-Reya, R.J., et al. (2013). A population of Nestin-expressing progenitors in the cerebellum exhibits increased tumorigenicity. Nat Neurosci 16, 1737-1744.
Linet, M.S., Kim, K.P., and Rajaraman, P. (2009). Children's exposure to diagnostic medical radiation and cancer risk: epidemiologic and dosimetric considerations. Pediatr Radiol 39 Suppl 1, S4-26.
Little, M.P., de Vathaire, F., Shamsaldin, A., Oberlin, O., Campbell, S., Grimaud, E., Chavaudra, J., Haylock, R.G., and Muirhead, C.R. (1998). Risks of brain tumour following treatment for cancer in childhood: modification by genetic factors, radiotherapy and chemotherapy. Int J Cancer 78, 269-275.
Liu, R., Wang, X., Chen, G.Y., Dalerba, P., Gurney, A., Hoey, T., Sherlock, G., Lewicki, J., Shedden, K., and Clarke, M.F. (2007). The prognostic role of a gene signature from tumorigenic breast-cancer cells. N Engl J Med 356, 217-226.
Liu, Y., Elf, S.E., Miyata, Y., Sashida, G., Huang, G., Di Giandomenico, S., Lee, J.M., Deblasio, A., Menendez, S., Antipin, J., et al. (2009). p53 regulates hematopoietic stem cell quiescence. Cell Stem Cell 4, 37-48.
Lodato, M.A., Ng, C.W., Wamstad, J.A., Cheng, A.W., Thai, K.K., Fraenkel, E., Jaenisch, R., and Boyer, L.A. (2013). SOX2 co-occupies distal enhancer elements with distinct POU factors in ESCs and NPCs to specify cell state. PLoS Genet 9, e1003288.
178
LoRusso, P.M., Rudin, C.M., Reddy, J.C., Tibes, R., Weiss, G.J., Borad, M.J., Hann, C.L., Brahmer, J.R., Chang, I., Darbonne, W.C., et al. (2011). Phase I trial of hedgehog pathway inhibitor vismodegib (GDC-0449) in patients with refractory, locally advanced or metastatic solid tumors. Clin Cancer Res 17, 2502-2511.
Louis, D.N., Ohgaki, H., Wiestler, O.D., Cavenee, W.K., Burger, P.C., Jouvet, A., Scheithauer, B.W., and Kleihues, P. (2007). The 2007 WHO classification of tumours of the central nervous system. Acta Neuropathol 114, 97-109.
Makino, S. (1956). Further evidence favoring the concept of the stem cell in ascites tumors of rats. Ann N Y Acad Sci 63, 818-830.
Marino, S., Vooijs, M., van Der Gulden, H., Jonkers, J., and Berns, A. (2000). Induction of medulloblastomas in p53-null mutant mice by somatic inactivation of Rb in the external granular layer cells of the cerebellum. Genes Dev 14, 994-1004.
Martynoga, B., Mateo, J.L., Zhou, B., Andersen, J., Achimastou, A., Urban, N., van den Berg, D., Georgopoulou, D., Hadjur, S., Wittbrodt, J., et al. (2013). Epigenomic enhancer annotation reveals a key role for NFIX in neural stem cell quiescence. Genes & development 27, 1769-1786.
Masui, S., Nakatake, Y., Toyooka, Y., Shimosato, D., Yagi, R., Takahashi, K., Okochi, H., Okuda, A., Matoba, R., Sharov, A.A., et al. (2007). Pluripotency governed by Sox2 via regulation of Oct3/4 expression in mouse embryonic stem cells. Nat Cell Biol 9, 625-635.
Matsumoto, A., Takeishi, S., Kanie, T., Susaki, E., Onoyama, I., Tateishi, Y., Nakayama, K., and Nakayama, K.I. (2011). p57 is required for quiescence and maintenance of adult hematopoietic stem cells. Cell Stem Cell 9, 262-271.
McKean-Cowdin, R., Razavi, P., Barrington-Trimis, J., Baldwin, R.T., Asgharzadeh, S., Cockburn, M., Tihan, T., and Preston-Martin, S. (2013). Trends in childhood brain tumor incidence, 1973-2009. J Neurooncol 115, 153-160.
Meacham, C.E., and Morrison, S.J. (2013). Tumour heterogeneity and cancer cell plasticity. Nature 501, 328-337.
Mendelsohn, M.L. (1962). Chronic infusion of tritiated thymidine into mice with tumors. Science 135, 213-215.
Merlos-Suarez, A., Barriga, F.M., Jung, P., Iglesias, M., Cespedes, M.V., Rossell, D., Sevillano, M., Hernando-Momblona, X., da Silva-Diz, V., Munoz, P., et al. (2011). The intestinal stem cell signature identifies colorectal cancer stem cells and predicts disease relapse. Cell Stem Cell 8, 511-524.
179
Metcalfe, C., Alicke, B., Crow, A., Lamoureux, M., Dijkgraaf, G.J., Peale, F., Gould, S.E., and de Sauvage, F.J. (2013). PTEN loss mitigates the response of medulloblastoma to Hedgehog pathway inhibition. Cancer Res 73, 7034-7042.
Millet, S., Bloch-Gallego, E., Simeone, A., and Alvarado-Mallart, R.M. (1996). The caudal limit of Otx2 gene expression as a marker of the midbrain/hindbrain boundary: a study using in situ hybridisation and chick/quail homotopic grafts. Development 122, 3785-3797.
Ming, G.L., and Song, H. (2011). Adult neurogenesis in the mammalian brain: significant answers and significant questions. Neuron 70, 687-702.
Mira, H., Andreu, Z., Suh, H., Lie, D.C., Jessberger, S., Consiglio, A., San Emeterio, J., Hortiguela, R., Marques-Torrejon, M.A., Nakashima, K., et al. (2010). Signaling through BMPR-IA regulates quiescence and long-term activity of neural stem cells in the adult hippocampus. Cell Stem Cell 7, 78-89.
Miyagi, S., Kato, H., and Okuda, A. (2009). Role of SoxB1 transcription factors in development. Cell Mol Life Sci 66, 3675-3684.
Miyagi, S., Masui, S., Niwa, H., Saito, T., Shimazaki, T., Okano, H., Nishimoto, M., Muramatsu, M., Iwama, A., and Okuda, A. (2008). Consequence of the loss of Sox2 in the developing brain of the mouse. FEBS Lett 582, 2811-2815.
Miyahara, H., Natsumeda, M., Yoshimura, J., Ogura, R., Okazaki, K., Toyoshima, Y., Fujii, Y., Takahashi, H., and Kakita, A. (2013). Neuronal differentiation associated with Gli3 expression predicts favorable outcome for patients with medulloblastoma. Neuropathology.
Morales, D., and Hatten, M.E. (2006). Molecular markers of neuronal progenitors in the embryonic cerebellar anlage. J Neurosci 26, 12226-12236.
Morin, R., Bainbridge, M., Fejes, A., Hirst, M., Krzywinski, M., Pugh, T., McDonald, H., Varhol, R., Jones, S., and Marra, M. (2008). Profiling the HeLa S3 transcriptome using randomly primed cDNA and massively parallel short-read sequencing. Biotechniques 45, 81-94.
Morin, R.D., Mendez-Lago, M., Mungall, A.J., Goya, R., Mungall, K.L., Corbett, R.D., Johnson, N.A., Severson, T.M., Chiu, R., Field, M., et al. (2011). Frequent mutation of histone-modifying genes in non-Hodgkin lymphoma. Nature 476, 298-303.
Mulhern, R.K., Merchant, T.E., Gajjar, A., Reddick, W.E., and Kun, L.E. (2004). Late neurocognitive sequelae in survivors of brain tumours in childhood. Lancet Oncol 5, 399-408.
Murat, A., Migliavacca, E., Gorlia, T., Lambiv, W.L., Shay, T., Hamou, M.F., de Tribolet, N., Regli, L., Wick, W., Kouwenhoven, M.C., et al. (2008). Stem cell-related "self-renewal" signature and high epidermal growth factor receptor expression associated with resistance to concomitant chemoradiotherapy in glioblastoma. J Clin Oncol 26, 3015-3024.
180
Ng, S.Y., Bogu, G.K., Soh, B.S., and Stanton, L.W. (2013). The long noncoding RNA RMST interacts with SOX2 to regulate neurogenesis. Mol Cell 51, 349-359.
Nguyen, L.V., Vanner, R., Dirks, P., and Eaves, C.J. (2012). Cancer stem cells: an evolving concept. Nat Rev Cancer 12, 133-143.
Nishimoto, M., Fukushima, A., Okuda, A., and Muramatsu, M. (1999). The gene for the embryonic stem cell coactivator UTF1 carries a regulatory element which selectively interacts with a complex composed of Oct-3/4 and Sox-2. Mol Cell Biol 19, 5453-5465.
Niu, W., Zang, T., Zou, Y., Fang, S., Smith, D.K., Bachoo, R., and Zhang, C.L. (2013). In vivo reprogramming of astrocytes to neuroblasts in the adult brain. Nat Cell Biol 15, 1164-1175.
Northcott, P.A., Jones, D.T., Kool, M., Robinson, G.W., Gilbertson, R.J., Cho, Y.J., Pomeroy, S.L., Korshunov, A., Lichter, P., Taylor, M.D., et al. (2012a). Medulloblastomics: the end of the beginning. Nat Rev Cancer 12, 818-834.
Northcott, P.A., Korshunov, A., Pfister, S.M., and Taylor, M.D. (2012b). The clinical implications of medulloblastoma subgroups. Nat Rev Neurol 8, 340-351.
Northcott, P.A., Korshunov, A., Witt, H., Hielscher, T., Eberhart, C.G., Mack, S., Bouffet, E., Clifford, S.C., Hawkins, C.E., French, P., et al. (2011). Medulloblastoma comprises four distinct molecular variants. J Clin Oncol 29, 1408-1414.
Northcott, P.A., Shih, D.J., Peacock, J., Garzia, L., Morrissy, A.S., Zichner, T., Stutz, A.M., Korshunov, A., Reimand, J., Schumacher, S.E., et al. (2012c). Subgroup-specific structural variation across 1,000 medulloblastoma genomes. Nature 488, 49-56.
Nunez, L.E., Nybo, S.E., Gonzalez-Sabin, J., Perez, M., Menendez, N., Brana, A.F., Shaaban, K.A., He, M., Moris, F., Salas, J.A., et al. (2012). A novel mithramycin analogue with high antitumor activity and less toxicity generated by combinatorial biosynthesis. J Med Chem 55, 5813-5825.
Nusslein-Volhard, C., and Wieschaus, E. (1980). Mutations affecting segment number and polarity in Drosophila. Nature 287, 795-801.
O'Brien, C.A., Kreso, A., Ryan, P., Hermans, K.G., Gibson, L., Wang, Y., Tsatsanis, A., Gallinger, S., and Dick, J.E. (2012). ID1 and ID3 regulate the self-renewal capacity of human colon cancer-initiating cells through p21. Cancer Cell 21, 777-792.
O'Brien, C.A., Pollett, A., Gallinger, S., and Dick, J.E. (2007). A human colon cancer cell capable of initiating tumour growth in immunodeficient mice. Nature 445, 106-110.
Ostrom, Q.T., Gittleman, H., Liao, P., Rouse, C., Chen, Y., Dowling, J., Wolinsky, Y., Kruchko, C., and Barnholtz-Sloan, J. (2014). CBTRUS statistical report: primary brain and central nervous system tumors diagnosed in the United States in 2007-2011. Neuro Oncol 16 Suppl 4, iv1-63.
181
Pallini, R., Ricci-Vitiani, L., Banna, G.L., Signore, M., Lombardi, D., Todaro, M., Stassi, G., Martini, M., Maira, G., Larocca, L.M., et al. (2008). Cancer stem cell analysis and clinical outcome in patients with glioblastoma multiforme. Clin Cancer Res 14, 8205-8212.
Panosyan, E.H., Laks, D.R., Masterman-Smith, M., Mottahedeh, J., Yong, W.H., Cloughesy, T.F., Lazareff, J.A., Mischel, P.S., Moore, T.B., and Kornblum, H.I. (2010). Clinical outcome in pediatric glial and embryonal brain tumors correlates with in vitro multi-passageable neurosphere formation. Pediatr Blood Cancer 55, 644-651.
Partap, S., Murphy, P.A., Vogel, H., Barnes, P.D., Edwards, M.S., and Fisher, P.G. (2011). Liposomal cytarabine for central nervous system embryonal tumors in children and young adults. J Neurooncol 103, 561-566.
Patel, A.P., Tirosh, I., Trombetta, J.J., Shalek, A.K., Gillespie, S.M., Wakimoto, H., Cahill, D.P., Nahed, B.V., Curry, W.T., Martuza, R.L., et al. (2014). Single-cell RNA-seq highlights intratumoral heterogeneity in primary glioblastoma. Science 344, 1396-1401.
Pazzaglia, S., Mancuso, M., Atkinson, M.J., Tanori, M., Rebessi, S., Majo, V.D., Covelli, V., Hahn, H., and Saran, A. (2002). High incidence of medulloblastoma following X-ray-irradiation of newborn Ptc1 heterozygous mice. Oncogene 21, 7580-7584.
Pazzaglia, S., Pasquali, E., Tanori, M., Mancuso, M., Leonardi, S., di Majo, V., Rebessi, S., and Saran, A. (2009). Physical, heritable and age-related factors as modifiers of radiation cancer risk in patched heterozygous mice. Int J Radiat Oncol Biol Phys 73, 1203-1210.
Pazzaglia, S., Tanori, M., Mancuso, M., Rebessi, S., Leonardi, S., Di Majo, V., Covelli, V., Atkinson, M.J., Hahn, H., and Saran, A. (2006). Linking DNA damage to medulloblastoma tumorigenesis in patched heterozygous knockout mice. Oncogene 25, 1165-1173.
Pei, Y., Moore, C.E., Wang, J., Tewari, A.K., Eroshkin, A., Cho, Y.J., Witt, H., Korshunov, A., Read, T.A., Sun, J.L., et al. (2012). An animal model of MYC-driven medulloblastoma. Cancer Cell 21, 155-167.
Pevny, L.H., and Lovell-Badge, R. (1997). Sox genes find their feet. Curr Opin Genet Dev 7, 338-344.
Pierce, G.B., Jr., Dixon, F.J., Jr., and Verney, E.L. (1960). Teratocarcinogenic and tissue-forming potentials of the cell types comprising neoplastic embryoid bodies. Lab Invest 9, 583-602.
Pileri, A., Gabutti, V., Masera, P., and Gavosto, F. (1967). Proliferative activity of the cells of acute leukaemia in relapse and in steady state. Acta Haematol 38, 193-199.
Pollard, S.M., Yoshikawa, K., Clarke, I.D., Danovi, D., Stricker, S., Russell, R., Bayani, J., Head, R., Lee, M., Bernstein, M., et al. (2009). Glioma stem cell lines expanded in adherent
182
culture have tumor-specific phenotypes and are suitable for chemical and genetic screens. Cell Stem Cell 4, 568-580.
Poschl, J., Stark, S., Neumann, P., Grobner, S., Kawauchi, D., Jones, D.T., Northcott, P.A., Lichter, P., Pfister, S.M., Kool, M., et al. (2014). Genomic and transcriptomic analyses match medulloblastoma mouse models to their human counterparts. Acta Neuropathol 128, 123-136.
Potten, C.S. (1977). Extreme sensitivity of some intestinal crypt cells to X and gamma irradiation. Nature 269, 518-521.
Potten, C.S., Kovacs, L., and Hamilton, E. (1974). Continuous labelling studies on mouse skin and intestine. Cell Tissue Kinet 7, 271-283.
Preston, D.L., Ron, E., Yonehara, S., Kobuke, T., Fujii, H., Kishikawa, M., Tokunaga, M., Tokuoka, S., and Mabuchi, K. (2002). Tumors of the nervous system and pituitary gland associated with atomic bomb radiation exposure. J Natl Cancer Inst 94, 1555-1563.
Preston-Martin, S., Yu, M.C., Benton, B., and Henderson, B.E. (1982). N-Nitroso compounds and childhood brain tumors: a case-control study. Cancer Res 42, 5240-5245.
Prince, M.E., Sivanandan, R., Kaczorowski, A., Wolf, G.T., Kaplan, M.J., Dalerba, P., Weissman, I.L., Clarke, M.F., and Ailles, L.E. (2007). Identification of a subpopulation of cells with cancer stem cell properties in head and neck squamous cell carcinoma. Proc Natl Acad Sci U S A 104, 973-978.
Que, J., Luo, X., Schwartz, R.J., and Hogan, B.L. (2009). Multiple roles for Sox2 in the developing and adult mouse trachea. Development 136, 1899-1907.
Quintana, E., Shackleton, M., Foster, H.R., Fullen, D.R., Sabel, M.S., Johnson, T.M., and Morrison, S.J. (2010). Phenotypic heterogeneity among tumorigenic melanoma cells from patients that is reversible and not hierarchically organized. Cancer Cell 18, 510-523.
Quintana, E., Shackleton, M., Sabel, M.S., Fullen, D.R., Johnson, T.M., and Morrison, S.J. (2008). Efficient tumour formation by single human melanoma cells. Nature 456, 593-598.
Ramakrishna, S., Kim, K.S., and Baek, K.H. (2014). Posttranslational modifications of defined embryonic reprogramming transcription factors. Cell Reprogram 16, 108-120.
Ramaswamy, V., Remke, M., Bouffet, E., Faria, C.C., Perreault, S., Cho, Y.J., Shih, D.J., Luu, B., Dubuc, A.M., Northcott, P.A., et al. (2013). Recurrence patterns across medulloblastoma subgroups: an integrated clinical and molecular analysis. Lancet Oncol 14, 1200-1207.
Ramnani, N. (2006). The primate cortico-cerebellar system: anatomy and function. Nat Rev Neurosci 7, 511-522.
183
Rausch, T., Jones, D.T., Zapatka, M., Stutz, A.M., Zichner, T., Weischenfeldt, J., Jager, N., Remke, M., Shih, D., Northcott, P.A., et al. (2012). Genome sequencing of pediatric medulloblastoma links catastrophic DNA rearrangements with TP53 mutations. Cell 148, 59-71.
Read, T.A., Fogarty, M.P., Markant, S.L., McLendon, R.E., Wei, Z., Ellison, D.W., Febbo, P.G., and Wechsler-Reya, R.J. (2009). Identification of CD15 as a marker for tumor-propagating cells in a mouse model of medulloblastoma. Cancer Cell 15, 135-147.
Reifenberger, J., Wolter, M., Weber, R.G., Megahed, M., Ruzicka, T., Lichter, P., and Reifenberger, G. (1998). Missense mutations in SMOH in sporadic basal cell carcinomas of the skin and primitive neuroectodermal tumors of the central nervous system. Cancer Res 58, 1798-1803.
Remsing, L.L., Gonzalez, A.M., Nur-e-Alam, M., Fernandez-Lozano, M.J., Brana, A.F., Rix, U., Oliveira, M.A., Mendez, C., Salas, J.A., and Rohr, J. (2003). Mithramycin SK, a novel antitumor drug with improved therapeutic index, mithramycin SA, and demycarosyl-mithramycin SK: three new products generated in the mithramycin producer Streptomyces argillaceus through combinatorial biosynthesis. J Am Chem Soc 125, 5745-5753.
Ricci-Vitiani, L., Lombardi, D.G., Pilozzi, E., Biffoni, M., Todaro, M., Peschle, C., and De Maria, R. (2007). Identification and expansion of human colon-cancer-initiating cells. Nature 445, 111-115.
Ring, K.L., Tong, L.M., Balestra, M.E., Javier, R., Andrews-Zwilling, Y., Li, G., Walker, D., Zhang, W.R., Kreitzer, A.C., and Huang, Y. (2012). Direct reprogramming of mouse and human fibroblasts into multipotent neural stem cells with a single factor. Cell Stem Cell 11, 100-109.
Robarge, K.D., Brunton, S.A., Castanedo, G.M., Cui, Y., Dina, M.S., Goldsmith, R., Gould, S.E., Guichert, O., Gunzner, J.L., Halladay, J., et al. (2009). GDC-0449-a potent inhibitor of the hedgehog pathway. Bioorg Med Chem Lett 19, 5576-5581.
Robinson, G., Parker, M., Kranenburg, T.A., Lu, C., Chen, X., Ding, L., Phoenix, T.N., Hedlund, E., Wei, L., Zhu, X., et al. (2012). Novel mutations target distinct subgroups of medulloblastoma. Nature 488, 43-48.
Rodgers, J.T., King, K.Y., Brett, J.O., Cromie, M.J., Charville, G.W., Maguire, K.K., Brunson, C., Mastey, N., Liu, L., Tsai, C.R., et al. (2014). mTORC1 controls the adaptive transition of quiescent stem cells from G0 to G(Alert). Nature 510, 393-396.
Rodini, C.O., Suzuki, D.E., Saba-Silva, N., Cappellano, A., de Souza, J.E., Cavalheiro, S., Toledo, S.R., and Okamoto, O.K. (2012). Expression analysis of stem cell-related genes reveal OCT4 as a predictor of poor clinical outcome in medulloblastoma. J Neurooncol 106, 71-79.
184
Roesch, A., Fukunaga-Kalabis, M., Schmidt, E.C., Zabierowski, S.E., Brafford, P.A., Vultur, A., Basu, D., Gimotty, P., Vogt, T., and Herlyn, M. (2010). A temporarily distinct subpopulation of slow-cycling melanoma cells is required for continuous tumor growth. Cell 141, 583-594.
Ron, E., Modan, B., Boice, J.D., Jr., Alfandary, E., Stovall, M., Chetrit, A., and Katz, L. (1988). Tumors of the brain and nervous system after radiotherapy in childhood. N Engl J Med 319, 1033-1039.
Rudin, C.M., Durinck, S., Stawiski, E.W., Poirier, J.T., Modrusan, Z., Shames, D.S., Bergbower, E.A., Guan, Y., Shin, J., Guillory, J., et al. (2012). Comprehensive genomic analysis identifies SOX2 as a frequently amplified gene in small-cell lung cancer. Nat Genet 44, 1111-1116.
Rudin, C.M., Hann, C.L., Laterra, J., Yauch, R.L., Callahan, C.A., Fu, L., Holcomb, T., Stinson, J., Gould, S.E., Coleman, B., et al. (2009). Treatment of medulloblastoma with hedgehog pathway inhibitor GDC-0449. N Engl J Med 361, 1173-1178.
Rutkowski, S., Bode, U., Deinlein, F., Ottensmeier, H., Warmuth-Metz, M., Soerensen, N., Graf, N., Emser, A., Pietsch, T., Wolff, J.E., et al. (2005). Treatment of early childhood medulloblastoma by postoperative chemotherapy alone. N Engl J Med 352, 978-986.
Saito, Y., Uchida, N., Tanaka, S., Suzuki, N., Tomizawa-Murasawa, M., Sone, A., Najima, Y., Takagi, S., Aoki, Y., Wake, A., et al. (2010). Induction of cell cycle entry eliminates human leukemia stem cells in a mouse model of AML. Nat Biotechnol 28, 275-280.
Sarkar, A., and Hochedlinger, K. (2013). The sox family of transcription factors: versatile regulators of stem and progenitor cell fate. Cell Stem Cell 12, 15-30.
Sasaki, H., Nishizaki, Y., Hui, C., Nakafuku, M., and Kondoh, H. (1999). Regulation of Gli2 and Gli3 activities by an amino-terminal repression domain: implication of Gli2 and Gli3 as primary mediators of Shh signaling. Development 126, 3915-3924.
Savitz, D.A., and Chen, J.H. (1990). Parental occupation and childhood cancer: review of epidemiologic studies. Environ Health Perspect 88, 325-337.
Schepers, A.G., Snippert, H.J., Stange, D.E., van den Born, M., van Es, J.H., van de Wetering, M., and Clevers, H. (2012). Lineage tracing reveals Lgr5+ stem cell activity in mouse intestinal adenomas. Science 337, 730-735.
Scholzen, T., and Gerdes, J. (2000). The Ki-67 protein: from the known and the unknown. Journal of cellular physiology 182, 311-322.
Schuller, U., Heine, V.M., Mao, J., Kho, A.T., Dillon, A.K., Han, Y.G., Huillard, E., Sun, T., Ligon, A.H., Qian, Y., et al. (2008). Acquisition of granule neuron precursor identity is a critical determinant of progenitor cell competence to form Shh-induced medulloblastoma. Cancer Cell 14, 123-134.
185
Schwalbe, E.C., Williamson, D., Lindsey, J.C., Hamilton, D., Ryan, S.L., Megahed, H., Garami, M., Hauser, P., Dembowska-Baginska, B., Perek, D., et al. (2013). DNA methylation profiling of medulloblastoma allows robust subclassification and improved outcome prediction using formalin-fixed biopsies. Acta Neuropathol 125, 359-371.
Searles Nielsen, S., Mueller, B.A., Preston-Martin, S., Holly, E.A., Little, J., Bracci, P.M., McCredie, M., Peris-Bonet, R., Cordier, S., Filippini, G., et al. (2008). Family cancer history and risk of brain tumors in children: results of the SEARCH international brain tumor study. Cancer Causes Control 19, 641-648.
Shapiro, J.R., Yung, W.K., and Shapiro, W.R. (1981). Isolation, karyotype, and clonal growth of heterogeneous subpopulations of human malignant gliomas. Cancer Res 41, 2349-2359.
Sharma, S.V., Lee, D.Y., Li, B., Quinlan, M.P., Takahashi, F., Maheswaran, S., McDermott, U., Azizian, N., Zou, L., Fischbach, M.A., et al. (2010). A chromatin-mediated reversible drug-tolerant state in cancer cell subpopulations. Cell 141, 69-80.
Shih, D.J., Northcott, P.A., Remke, M., Korshunov, A., Ramaswamy, V., Kool, M., Luu, B., Yao, Y., Wang, X., Dubuc, A.M., et al. (2014). Cytogenetic prognostication within medulloblastoma subgroups. J Clin Oncol 32, 886-896.
Silber, J.H., Radcliffe, J., Peckham, V., Perilongo, G., Kishnani, P., Fridman, M., Goldwein, J.W., and Meadows, A.T. (1992). Whole-brain irradiation and decline in intelligence: the influence of dose and age on IQ score. J Clin Oncol 10, 1390-1396.
Sinclair, A.H., Berta, P., Palmer, M.S., Hawkins, J.R., Griffiths, B.L., Smith, M.J., Foster, J.W., Frischauf, A.M., Lovell-Badge, R., and Goodfellow, P.N. (1990). A gene from the human sex-determining region encodes a protein with homology to a conserved DNA-binding motif. Nature 346, 240-244.
Singh, S.K., Hawkins, C., Clarke, I.D., Squire, J.A., Bayani, J., Hide, T., Henkelman, R.M., Cusimano, M.D., and Dirks, P.B. (2004). Identification of human brain tumour initiating cells. Nature 432, 396-401.
Smoll, N.R., and Drummond, K.J. (2012). The incidence of medulloblastomas and primitive neurectodermal tumours in adults and children. J Clin Neurosci 19, 1541-1544.
Son, M.J., Woolard, K., Nam, D.H., Lee, J., and Fine, H.A. (2009). SSEA-1 is an enrichment marker for tumor-initiating cells in human glioblastoma. Cell Stem Cell 4, 440-452.
Sousa-Nunes, R., Yee, L.L., and Gould, A.P. (2011). Fat cells reactivate quiescent neuroblasts via TOR and glial insulin relays in Drosophila. Nature 471, 508-512.
Sousa-Victor, P., Gutarra, S., Garcia-Prat, L., Rodriguez-Ubreva, J., Ortet, L., Ruiz-Bonilla, V., Jardi, M., Ballestar, E., Gonzalez, S., Serrano, A.L., et al. (2014). Geriatric muscle stem cells switch reversible quiescence into senescence. Nature 506, 316-321.
186
Southam, C.M.a.B., A. (1961). Quantitative studies on autotransplantation of human cancer. Cancer 14, 8.
Stevanovic, M., Zuffardi, O., Collignon, J., Lovell-Badge, R., and Goodfellow, P. (1994). The cDNA sequence and chromosomal location of the human SOX2 gene. Mamm Genome 5, 640-642.
Stone, D.M., Hynes, M., Armanini, M., Swanson, T.A., Gu, Q., Johnson, R.L., Scott, M.P., Pennica, D., Goddard, A., Phillips, H., et al. (1996). The tumour-suppressor gene patched encodes a candidate receptor for Sonic hedgehog. Nature 384, 129-134.
Subramanian, A., Tamayo, P., Mootha, V.K., Mukherjee, S., Ebert, B.L., Gillette, M.A., Paulovich, A., Pomeroy, S.L., Golub, T.R., Lander, E.S., et al. (2005). Gene set enrichment analysis: a knowledge-based approach for interpreting genome-wide expression profiles. Proc Natl Acad Sci U S A 102, 15545-15550.
Sutter, R., Shakhova, O., Bhagat, H., Behesti, H., Sutter, C., Penkar, S., Santuccione, A., Bernays, R., Heppner, F.L., Schuller, U., et al. (2010). Cerebellar stem cells act as medulloblastoma-initiating cells in a mouse model and a neural stem cell signature characterizes a subset of human medulloblastomas. Oncogene 29, 1845-1856.
Suva, M.L., Rheinbay, E., Gillespie, S.M., Patel, A.P., Wakimoto, H., Rabkin, S.D., Riggi, N., Chi, A.S., Cahill, D.P., Nahed, B.V., et al. (2014). Reconstructing and Reprogramming the Tumor-Propagating Potential of Glioblastoma Stem-like Cells. Cell 157, 580-594.
Taipale, J., Chen, J.K., Cooper, M.K., Wang, B., Mann, R.K., Milenkovic, L., Scott, M.P., and Beachy, P.A. (2000). Effects of oncogenic mutations in Smoothened and Patched can be reversed by cyclopamine. Nature 406, 1005-1009.
Taipale, J., Cooper, M.K., Maiti, T., and Beachy, P.A. (2002). Patched acts catalytically to suppress the activity of Smoothened. Nature 418, 892-897.
Takahashi, K., and Yamanaka, S. (2006). Induction of pluripotent stem cells from mouse embryonic and adult fibroblast cultures by defined factors. Cell 126, 663-676.
Takeishi, S., Matsumoto, A., Onoyama, I., Naka, K., Hirao, A., and Nakayama, K.I. (2013). Ablation of Fbxw7 eliminates leukemia-initiating cells by preventing quiescence. Cancer Cell 23, 347-361.
Takemoto, T., Uchikawa, M., Yoshida, M., Bell, D.M., Lovell-Badge, R., Papaioannou, V.E., and Kondoh, H. (2011). Tbx6-dependent Sox2 regulation determines neural or mesodermal fate in axial stem cells. Nature 470, 394-398.
Tanaka, S., Kamachi, Y., Tanouchi, A., Hamada, H., Jing, N., and Kondoh, H. (2004). Interplay of SOX and POU factors in regulation of the Nestin gene in neural primordial cells. Mol Cell Biol 24, 8834-8846.
187
Taranova, O.V., Magness, S.T., Fagan, B.M., Wu, Y., Surzenko, N., Hutton, S.R., and Pevny, L.H. (2006). SOX2 is a dose-dependent regulator of retinal neural progenitor competence. Genes & development 20, 1187-1202.
Taussig, D.C., Miraki-Moud, F., Anjos-Afonso, F., Pearce, D.J., Allen, K., Ridler, C., Lillington, D., Oakervee, H., Cavenagh, J., Agrawal, S.G., et al. (2008). Anti-CD38 antibody-mediated clearance of human repopulating cells masks the heterogeneity of leukemia-initiating cells. Blood 112, 568-575.
Taylor, M.D., Northcott, P.A., Korshunov, A., Remke, M., Cho, Y.J., Clifford, S.C., Eberhart, C.G., Parsons, D.W., Rutkowski, S., Gajjar, A., et al. (2012). Molecular subgroups of medulloblastoma: the current consensus. Acta Neuropathol 123, 465-472.
Thomas, K.R., and Capecchi, M.R. (1990). Targeted disruption of the murine int-1 proto-oncogene resulting in severe abnormalities in midbrain and cerebellar development. Nature 346, 847-850.
Tsuruzoe, S., Ishihara, K., Uchimura, Y., Watanabe, S., Sekita, Y., Aoto, T., Saitoh, H., Yuasa, Y., Niwa, H., Kawasuji, M., et al. (2006). Inhibition of DNA binding of Sox2 by the SUMO conjugation. Biochem Biophys Res Commun 351, 920-926.
Tumbar, T., Guasch, G., Greco, V., Blanpain, C., Lowry, W.E., Rendl, M., and Fuchs, E. (2004). Defining the epithelial stem cell niche in skin. Science 303, 359-363.
Uziel, T., Zindy, F., Sherr, C.J., and Roussel, M.F. (2006). The CDK inhibitor p18Ink4c is a tumor suppressor in medulloblastoma. Cell Cycle 5, 363-365.
Uziel, T., Zindy, F., Xie, S., Lee, Y., Forget, A., Magdaleno, S., Rehg, J.E., Calabrese, C., Solecki, D., Eberhart, C.G., et al. (2005). The tumor suppressors Ink4c and p53 collaborate independently with Patched to suppress medulloblastoma formation. Genes & development 19, 2656-2667.
van den Heuvel, M., and Ingham, P.W. (1996). smoothened encodes a receptor-like serpentine protein required for hedgehog signalling. Nature 382, 547-551.
Van Hoof, D., Munoz, J., Braam, S.R., Pinkse, M.W., Linding, R., Heck, A.J., Mummery, C.L., and Krijgsveld, J. (2009). Phosphorylation dynamics during early differentiation of human embryonic stem cells. Cell Stem Cell 5, 214-226.
Varjosalo, M., and Taipale, J. (2008). Hedgehog: functions and mechanisms. Genes & development 22, 2454-2472.
Vermeulen, L., De Sousa, E.M.F., van der Heijden, M., Cameron, K., de Jong, J.H., Borovski, T., Tuynman, J.B., Todaro, M., Merz, C., Rodermond, H., et al. (2010). Wnt activity defines colon cancer stem cells and is regulated by the microenvironment. Nat Cell Biol 12, 468-476.
188
von Bueren, A.O., von Hoff, K., Pietsch, T., Gerber, N.U., Warmuth-Metz, M., Deinlein, F., Zwiener, I., Faldum, A., Fleischhack, G., Benesch, M., et al. (2011). Treatment of young children with localized medulloblastoma by chemotherapy alone: results of the prospective, multicenter trial HIT 2000 confirming the prognostic impact of histology. Neuro Oncol 13, 669-679.
Wang, P., Liang, X., Yi, J., and Zhang, Q. (2008). Novel SOX2 mutation associated with ocular coloboma in a Chinese family. Arch Ophthalmol 126, 709-713.
Ward, R.J., Lee, L., Graham, K., Satkunendran, T., Yoshikawa, K., Ling, E., Harper, L., Austin, R., Nieuwenhuis, E., Clarke, I.D., et al. (2009). Multipotent CD15+ cancer stem cells in patched-1-deficient mouse medulloblastoma. Cancer Res 69, 4682-4690.
Wechsler-Reya, R.J., and Scott, M.P. (1999). Control of neuronal precursor proliferation in the cerebellum by sonic hedgehog. Neuron 22, 103-114.
Wefers, A.K., Warmuth-Metz, M., Poschl, J., von Bueren, A.O., Monoranu, C.M., Seelos, K., Peraud, A., Tonn, J.C., Koch, A., Pietsch, T., et al. (2014). Subgroup-specific localization of human medulloblastoma based on pre-operative MRI. Acta Neuropathol.
Weiner, H.L., Bakst, R., Hurlbert, M.S., Ruggiero, J., Ahn, E., Lee, W.S., Stephen, D., Zagzag, D., Joyner, A.L., and Turnbull, D.H. (2002). Induction of medulloblastomas in mice by sonic hedgehog, independent of Gli1. Cancer Res 62, 6385-6389.
Wetmore, C., Eberhart, D.E., and Curran, T. (2001). Loss of p53 but not ARF accelerates medulloblastoma in mice heterozygous for patched. Cancer Res 61, 513-516.
Williamson, K.A., Hever, A.M., Rainger, J., Rogers, R.C., Magee, A., Fiedler, Z., Keng, W.T., Sharkey, F.H., McGill, N., Hill, C.J., et al. (2006). Mutations in SOX2 cause anophthalmia-esophageal-genital (AEG) syndrome. Hum Mol Genet 15, 1413-1422.
Wingate, R.J., and Hatten, M.E. (1999). The role of the rhombic lip in avian cerebellum development. Development 126, 4395-4404.
Wu, C., Wei, Q., Utomo, V., Nadesan, P., Whetstone, H., Kandel, R., Wunder, J.S., and Alman, B.A. (2007). Side population cells isolated from mesenchymal neoplasms have tumor initiating potential. Cancer Res 67, 8216-8222.
Wu, X., Northcott, P.A., Dubuc, A., Dupuy, A.J., Shih, D.J., Witt, H., Croul, S., Bouffet, E., Fults, D.W., Eberhart, C.G., et al. (2012). Clonal selection drives genetic divergence of metastatic medulloblastoma. Nature 482, 529-533.
Xie, J., Murone, M., Luoh, S.M., Ryan, A., Gu, Q., Zhang, C., Bonifas, J.M., Lam, C.W., Hynes, M., Goddard, A., et al. (1998). Activating Smoothened mutations in sporadic basal-cell carcinoma. Nature 391, 90-92.
189
Yan, X., Ma, L., Yi, D., Yoon, J.G., Diercks, A., Foltz, G., Price, N.D., Hood, L.E., and Tian, Q. (2011). A CD133-related gene expression signature identifies an aggressive glioblastoma subtype with excessive mutations. Proc Natl Acad Sci U S A 108, 1591-1596.
Yang, Z.J., Ellis, T., Markant, S.L., Read, T.A., Kessler, J.D., Bourboulas, M., Schuller, U., Machold, R., Fishell, G., Rowitch, D.H., et al. (2008). Medulloblastoma can be initiated by deletion of Patched in lineage-restricted progenitors or stem cells. Cancer Cell 14, 135-145.
Yauch, R.L., Dijkgraaf, G.J., Alicke, B., Januario, T., Ahn, C.P., Holcomb, T., Pujara, K., Stinson, J., Callahan, C.A., Tang, T., et al. (2009). Smoothened mutation confers resistance to a Hedgehog pathway inhibitor in medulloblastoma. Science 326, 572-574.
Zeltzer, P.M., Boyett, J.M., Finlay, J.L., Albright, A.L., Rorke, L.B., Milstein, J.M., Allen, J.C., Stevens, K.R., Stanley, P., Li, H., et al. (1999). Metastasis stage, adjuvant treatment, and residual tumor are prognostic factors for medulloblastoma in children: conclusions from the Children's Cancer Group 921 randomized phase III study. J Clin Oncol 17, 832-845.
Zhao, H.Y., Zhang, Y.J., Dai, H., Zhang, Y., and Shen, Y.F. (2011). CARM1 mediates modulation of Sox2. PLoS One 6, e27026.
Zheng, Y., de la Cruz, C.C., Sayles, L.C., Alleyne-Chin, C., Vaka, D., Knaak, T.D., Bigos, M., Xu, Y., Hoang, C.D., Shrager, J.B., et al. (2013). A Rare Population of CD24(+)ITGB4(+)Notch(hi) Cells Drives Tumor Propagation in NSCLC and Requires Notch3 for Self-Renewal. Cancer Cell 24, 59-74.
Zhu, Z., Khan, M.A., Weiler, M., Blaes, J., Jestaedt, L., Geibert, M., Zou, P., Gronych, J., Bernhardt, O., Korshunov, A., et al. (2014). Targeting self-renewal in high-grade brain tumors leads to loss of brain tumor stem cells and prolonged survival. Cell Stem Cell 15, 185-198.
Zindy, F., Nilsson, L.M., Nguyen, L., Meunier, C., Smeyne, R.J., Rehg, J.E., Eberhart, C., Sherr, C.J., and Roussel, M.F. (2003). Hemangiosarcomas, medulloblastomas, and other tumors in Ink4c/p53-null mice. Cancer Res 63, 5420-5427.
Zou, P., Yoshihara, H., Hosokawa, K., Tai, I., Shinmyozu, K., Tsukahara, F., Maru, Y., Nakayama, K., Nakayama, K.I., and Suda, T. (2011). p57(Kip2) and p27(Kip1) cooperate to maintain hematopoietic stem cell quiescence through interactions with Hsc70. Cell Stem Cell 9, 247-261.


![Medulloblastoma: [Print] - eMedicine Neurology · emedicine.medscape.com eMedicine Specialties > Neurology > Pediatric Neurology Medulloblastoma George I Jallo, MD, Associate Professor](https://img.pdfslide.us/doc/110x75/5d472c3c88c993527c8b60e5/medulloblastoma-print-emedicine-neurology-emedicinemedscapecom-emedicine.jpg)

![Medulloblastoma: [Print] - eMedicine Neurology · accounts for approximately 7-8% of all intracranial tumors and 30% of ... Incidence of medulloblastoma is 1.5-2 cases per ... Medulloblastoma:](https://img.pdfslide.us/doc/110x75/5b7fc2317f8b9ae6088caa0e/medulloblastoma-print-emedicine-accounts-for-approximately-7-8-of-all.jpg)