Embed Size (px)
Citation preview

Defining the Broadband and Technology Future for Your State
Transitioning to Internet in Rural America
Michael J. Balhoff, CFAJuly 27, 2012

Slide 2
Michael J. Balhoff, CFA Headed sell-side equity telecom research group
(16 yrs) Six annual Wall Street Journal All-Star awards Focused coverage of rural telephony and
regulation Balhoff & Williams/Charlesmead Advisors Representative clients
Telecom: NCTA, Comcast, AT&T, Verizon, SBC, Embarq, CenturyLink, Frontier, FairPoint, Windstream
Energy: NorthWestern Energy, Anchorage ML&P Financial Community: Merrill Lynch, Silver Point
Capital Recent briefings for White House, FCC, Secretary of
Agriculture, Rural Utilities Service, NARUC, MACRUC
Background
ALEC, July 27, 2012

Slide 3
The rural problem Confused concepts—tax/subsidy v. investment Confused beneficiary—companies v. consumers Significant and ongoing investment Little factual/financial discipline in assessing
policy Federal reforms affect the states
Significant cuts in federally-supported funding States left to address problems with services
and rates Recommendations about state USF
The state’s choice is unavoidable More rigorous analysis of problem and policy Evaluate potential mechanisms to support
investment
Overview
ALEC, July 27, 2012

THE PROBLEM
ALEC, July 27, 2012

Slide 5
Critics use terminology that confuses/biases the dialogue “Subsidy” is a payout to an individual or industry “Taxes” are unpopular assessments Support “inefficient LECs” (real beneficiaries:
consumers) Conceptual USF history—wide customer base
supports ubiquitous network “investment” creating value for all
Easier concept when telecom was a monopoly USF is even more critical, but complicated, in
competitive world Need to target USF on regions where competitive
markets fail USF/implicit support were not and are not
subsidies/taxes USF and ICC support are investments Generate ROI in terms of social and economic
benefits Efficient investments supplement other investor
dollars
Confusion: Tax or Investment
ALEC, July 27, 2012

Slide 6
Policy Drivers of Higher Fund
ALEC, July 27, 2012
ILEC non-access funding from $2.16B (’03) to $1.37B (’11)
Total ILEC USF from $3.15B (’04) to $2.92B (’11) Growth in overall USF is due to new policy factors
Slide 7
Texas Study (2007) on 350,000 rural lines excluding USF . . . 77% WCs
-9.7% ROI 13% WCs
2.9% ROI 10%
generated 10%+ ROI
Rural Customer Networks
ALEC, July 27, 2012
Financial Performance of All Wire Centers without USF Payments

Slide 8
More striking is the finding that outside of rural towns, 52% of the lines generate negative returns (average -7% return on investment)
Total uneconomic lines are . . . All lines outside towns,
which were 52% of the total
Plus 18% of total lines (in towns generating a negative return)
Equals 70% of total lines uneconomic without USF
Outside of Rural Towns
ALEC, July 27, 2012
Source: Balhoff, Rowe & Williams, LLC 2007

Slide 9
June 2012 rural broadband usage data
Wireless today is not a real BB solution Net
neutrality questions (wireline v. wireless rules)
Rates of $30-$60 for wired services that are unlimited
Wireless LTE—$100/month for 10 GB; $10/GB overage
Wireless: 20GB/month~$200; 30GB~$300; 40GB~$400
Assumption about wireless fails the USF rate-test
Discipline in Evaluating Problem
ALEC, July 27, 2012

Slide 10
Core problem in many rural areas—economic market failure Critics say that “competition” will solve,
however . . . Verizon is getting out of rural business AT&T announced it has no rural broadband
solution Cable avoids economically irrational areas
No one will bid where there is a market failure The real problem is high cost to build/operate
consumer networks in certain regions Problem for large and small carriers Greenfield builds will be expensive and probably
risky Cable, wireless, urban carriers do not have same
problem
Focus on the Real Problem
ALEC, July 27, 2012

FEDERAL REFORMS AFFECT STATES
ALEC, July 27, 2012
Slide 12
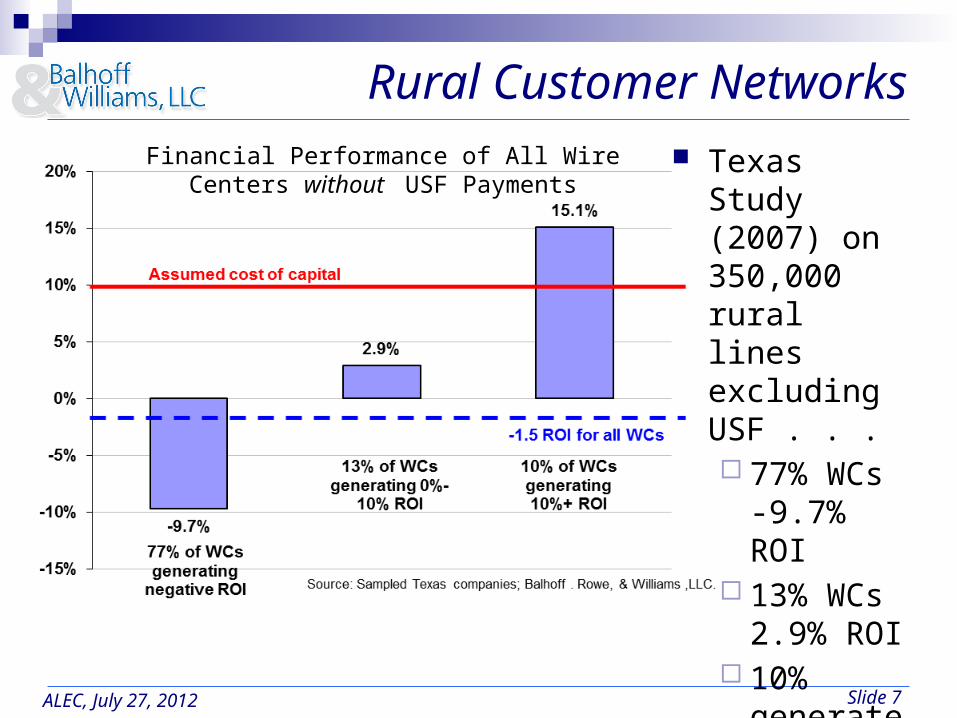
Approximate USF/ICC Reductions
ALEC, July 27, 2012
Federal reforms (2011) Rural USF/ICC rev. loss
Revenue reductions assume changes in HCLS, ICLS, Safety Net Additive, $250 per line per month cap, ICC reductions, and changes to ROR
The rural industry could have annual revenue reductions of nearly $1 billion in 2020 from reforms
Cumulative reductions could be $5.2 billion from 2012 to 2020 according to NECA
Estimates by National Exchange Carrier Association

Slide 13
USF/ICC as % of Total Revenues
ALEC, July 27, 2012
Source: Confidential company information; Balhoff & Williams, LLC
7500+ lines ILEC 1 ILEC 2 ILEC 3 ILEC 4 ILEC 5 ILEC 6 AverageUSF 0.0% 22.8% 13.9% 8.6% 36.8% 37.6% 20.0%
Network access 50.7% 59.5% 54.6% 51.9% 43.5% 55.5% 52.6% Total access/USF 50.7% 82.3% 68.5% 60.5% 80.3% 93.1% 72.6%
EBITDA margin 25.5% 49.2% 29.4% 34.0% 40.1% 49.1% 37.9%
Interest expense -0.7% -6.5% -3.9% -1.6% -5.3% -7.2% -4.2%
1,000-3,000 lines ILEC 1 ILEC 2 ILEC 3 ILEC 4 ILEC 5USF 0.0% 27.2% 13.4% 24.3% 31.9% 19.4%Network access 57.5% 39.7% 56.8% 70.3% 35.4% 52.0%
Total access/USF 57.5% 66.9% 70.2% 94.6% 67.3% 71.3%
EBITDA margin 26.2% 30.0% 30.5% 48.8% 45.6% 36.2%Interest expense -6.2% -4.5% -3.8% -9.2% -0.3% -4.8%
<1,000 lines ILEC 1 ILEC 2 ILEC 3 ILEC 4
USF 18.2% 3.0% 19.3% 19.1% 14.9%Network access 65.5% 72.6% 68.5% 55.8% 65.6%
Total access/USF 83.6% 75.6% 87.8% 74.9% 80.5%
EBITDA margin 36.4% 30.7% 18.0% 27.2% 28.1%Interest expense -3.2% 0.0% -1.3% -6.1% -2.6%

Slide 14
Illustrative EBITDA Outlook
ALEC, July 27, 2012
Simplifying assumptions EBITDA margin = 33% USF + access =
75% of revenues Cost benefits
of reforms = 0% USF reform and effect of ICC reduces EBITDA
margin in this illustrative analysis; the margin slips from 33% to 12.6% by 2020
Interest expense (4%-6% of today’s revenues) would eliminate much of residual cash flow by 2020, leaving ILEC with little cash for capex or principal repayment
Source: Estimates by Balhoff & Williams, LLC

RECOMMENDATIONS
ALEC, July 27, 2012

Slide 16
Understand the Outcomes
ALEC, July 27, 2012
Increased cost of capital Insufficient recovery, skepticism/avoidance of sector by debt and equity
investors Consolidation may occur (complicated by financial risks/potential
bankruptcies)
Operating
Reduced or eliminated near-term capital investment (likely no increase)
Proximate reductions in personnel and other operating costs
Financial
Customer service
Growing urban-rural divide in terms of investment/telecommunications services
Rates will rise for rural services less-than-comparable to those in urban areas Policy
COLR becomes more problematic due to underfunded or unfunded mandates
Services will no longer be “comparable” in urban and rural regions Private-public partnership fails; no one may bid at reverse auctions

Slide 17
Focus state policymakers on reforms Reforms’ effects on all state consumers State USF investments
Analyze and understand the policy issues Escalating rural customer demand for BB
services How economic welfare can be achieved most
effectively Understand the options in terms of state
mechanisms Dollars required for state supplemental funding How funding might be collected and distributed
Specific Recommendations
ALEC, July 27, 2012