Embed Size (px)
Citation preview
PRRES Conference 19-22 January 2014 Christchurch New Zealand
20th
ANNUAL PACIFIC RIM REAL ESTATE SOCIETY CONFERENCE
CHRISTCHURCH, NEW ZEALAND, 19-22 JANUARY 2014
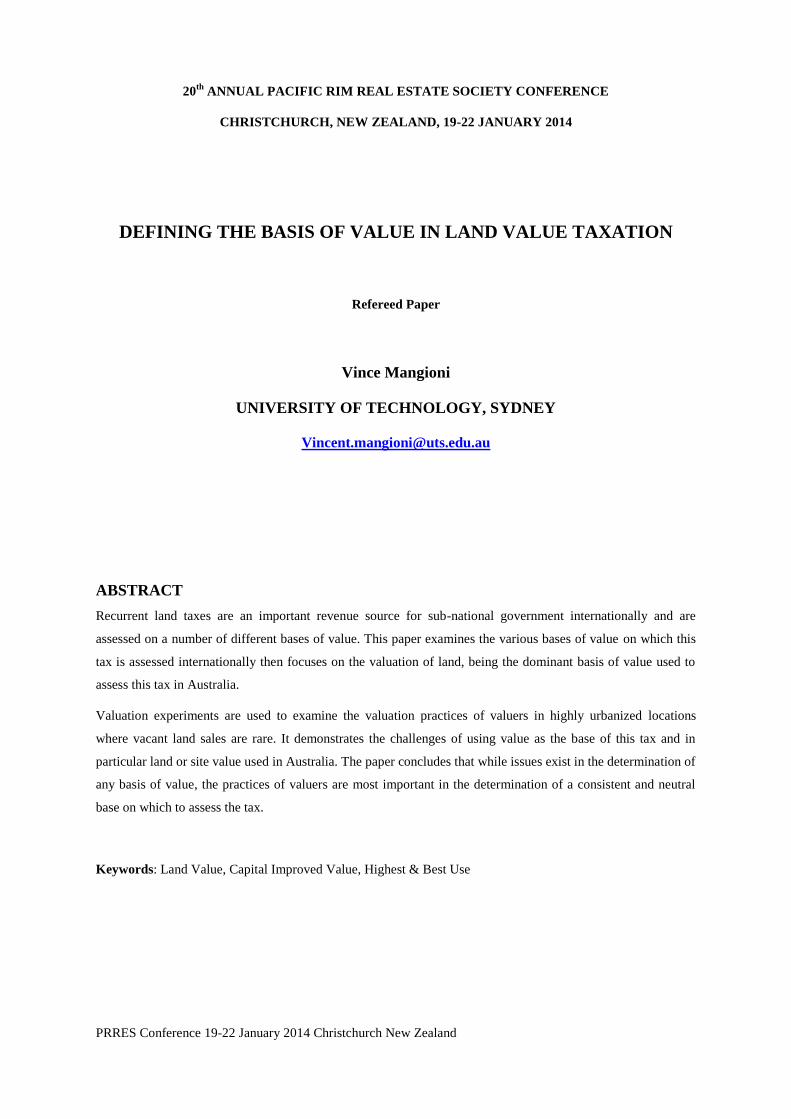
DEFINING THE BASIS OF VALUE IN LAND VALUE TAXATION
Refereed Paper
Vince Mangioni
UNIVERSITY OF TECHNOLOGY, SYDNEY
ABSTRACT
Recurrent land taxes are an important revenue source for sub-national government internationally and are
assessed on a number of different bases of value. This paper examines the various bases of value on which this
tax is assessed internationally then focuses on the valuation of land, being the dominant basis of value used to
assess this tax in Australia.
Valuation experiments are used to examine the valuation practices of valuers in highly urbanized locations
where vacant land sales are rare. It demonstrates the challenges of using value as the base of this tax and in
particular land or site value used in Australia. The paper concludes that while issues exist in the determination of
any basis of value, the practices of valuers are most important in the determination of a consistent and neutral
base on which to assess the tax.
Keywords: Land Value, Capital Improved Value, Highest & Best Use
2
PRRES Conference 19-22 January 2014 Christchurch New Zealand
INTRODUCTION
Recurrent land taxation commenced in South Australia in 1884. At the time of Federation in 1901, this tax was
imposed by all three levels of government in some States. New South Wales vacated taxing land in 1906,
strengthening local government’s opportunity to collect this tax in conjunction with the Commonwealth, now
known as council rates (Simpson and Figgis, 1998). In 1942 the Commonwealth removed the States powers to
collect income taxes and ceased imposing land tax in 1952, allowing the States to resume collection of this tax
in conjunction with local government, (Smith, 2005). A dual state and local government recurrent land tax
exists today across the six States of Australia. Northern Territory imposes council rates but does not impose a
Territory land tax.
In contrast to many OECD countries, where recurrent land taxation predominantly operates as a local
government tax, within Australia it operates at the local and state government level on a variety of different
bases of value. The dual imposition of this tax by state and local government in Australia has advantages over
its sole imposition by local government in other countries, where the evolving rationale has become a perceived
quid pro quo tax for services provided. While a taxpayer rationale exists for rates and services at the local level,
no such rationale exists for state land tax in Australia, which is more aptly viewed as a consolidated revenue tax.
BASES OF VALUE WITHIN AUSTRALIA
When land tax was introduced in Australia it was assessed on the unimproved capital value (UCV) of land,
meaning the value of land in its en-globo or original untouched state. Through the progression of time, as more
land became urbanized and was the subject of clearing, excavation, leveling and retention, UCV became less
relevant and by 1990, five States had moved to either Land Value (LV) or Site Value (SV) as the base of state
land tax. In 2010 Queensland was the last state to move from UCV to SV for the assessment of state land tax as
per Table 1.
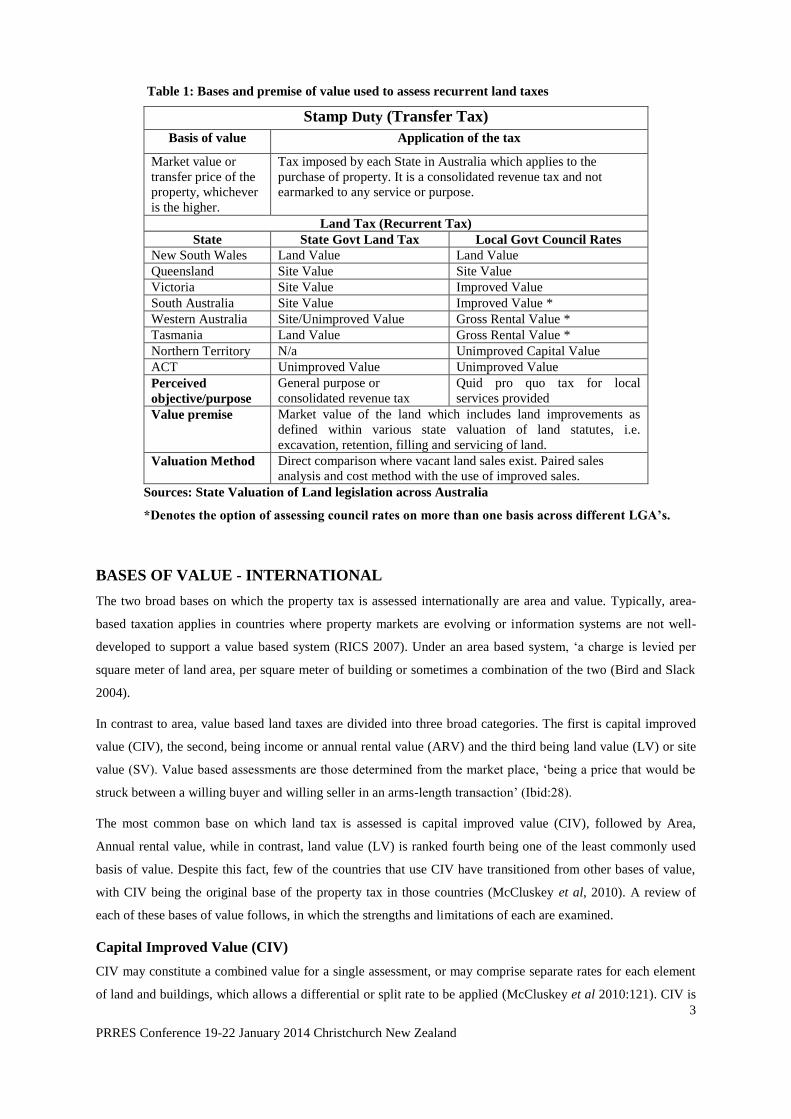
Recurrent land tax is assessed on a number of different bases across Australia of which local government in
some states have options to assess rates on more than one basis of value. In the States of South Australia and
Victoria rates are predominantly determined on Capital Improved Value. As set out in Table 1, the labels and
bases of value vary from state to state in the imposition of this tax. Despite some states having the same label of
value, i.e. site value is used in Victoria and Queensland, however different statutory definitions of value within
State Valuation of Land legislation exist in each of these States.
3
PRRES Conference 19-22 January 2014 Christchurch New Zealand
Table 1: Bases and premise of value used to assess recurrent land taxes
Stamp Duty (Transfer Tax)
Basis of value Application of the tax
Market value or
transfer price of the
property, whichever
is the higher.
Tax imposed by each State in Australia which applies to the
purchase of property. It is a consolidated revenue tax and not
earmarked to any service or purpose.
Land Tax (Recurrent Tax)
State State Govt Land Tax Local Govt Council Rates
New South Wales Land Value Land Value
Queensland Site Value Site Value
Victoria Site Value Improved Value
South Australia Site Value Improved Value *
Western Australia Site/Unimproved Value Gross Rental Value *
Tasmania Land Value Gross Rental Value *
Northern Territory N/a Unimproved Capital Value
ACT Unimproved Value Unimproved Value
Perceived
objective/purpose
General purpose or
consolidated revenue tax
Quid pro quo tax for local
services provided
Value premise Market value of the land which includes land improvements as
defined within various state valuation of land statutes, i.e.
excavation, retention, filling and servicing of land.
Valuation Method Direct comparison where vacant land sales exist. Paired sales
analysis and cost method with the use of improved sales.
Sources: State Valuation of Land legislation across Australia
*Denotes the option of assessing council rates on more than one basis across different LGA’s.
BASES OF VALUE - INTERNATIONAL
The two broad bases on which the property tax is assessed internationally are area and value. Typically, area-
based taxation applies in countries where property markets are evolving or information systems are not well-
developed to support a value based system (RICS 2007). Under an area based system, ‘a charge is levied per
square meter of land area, per square meter of building or sometimes a combination of the two (Bird and Slack
2004).
In contrast to area, value based land taxes are divided into three broad categories. The first is capital improved
value (CIV), the second, being income or annual rental value (ARV) and the third being land value (LV) or site
value (SV). Value based assessments are those determined from the market place, ‘being a price that would be
struck between a willing buyer and willing seller in an arms-length transaction’ (Ibid:28).
The most common base on which land tax is assessed is capital improved value (CIV), followed by Area,
Annual rental value, while in contrast, land value (LV) is ranked fourth being one of the least commonly used
basis of value. Despite this fact, few of the countries that use CIV have transitioned from other bases of value,
with CIV being the original base of the property tax in those countries (McCluskey et al, 2010). A review of
each of these bases of value follows, in which the strengths and limitations of each are examined.
Capital Improved Value (CIV)
CIV may constitute a combined value for a single assessment, or may comprise separate rates for each element
of land and buildings, which allows a differential or split rate to be applied (McCluskey et al 2010:121). CIV is
4
PRRES Conference 19-22 January 2014 Christchurch New Zealand
stated to get around a number of practical and conceptual problems that impact on alternate bases of value
including rental value and land value systems (Bahl, 2009:7). In some applications CIV rates poorly on the
principle of economic efficiency in jurisdictions where market value and hence highest and best use are not
always used.
In parts of the US, improved value is based on the initial purchase price of property, with a cap on the increase
of the rate revenue raised from the property. In California where improved value is used, Proposition 13 was
introduced in the 1970s to cap increases in the property tax at two per cent per annum, in which the initial
purchase price of property is indexed annually. In determining the impact of this on efficiency, owners who had
their property compulsorily acquired by the Metro Water District of Southern California, were compensated 28
times the improved value used to assess their property tax, (Gaffney, 1995).
In England, residential property is taxed on CIV, in which property is banded into groupings based on its
improved value. The value of property was initially determined in 1993, with no subsequent revaluation
undertaken since that date, in which the base of the tax no longer bears relevance to market value (Plimmer
1998). Further, there is no geographic distinction for changes in the relativity of value across locations in
England at present.
In Germany where property is taxed on CIV, the values used for the property tax were determined in 1964 in the
former Federal Western States and in 1935 in the former East Germany (Maximilian 2012). In France, where
CIV is also the base of the property tax, the values used to assess the tax are circa 1970. Like Germany, France
also uses historic values to assess the property tax in which increases in tax revenue are determined by
adjustment to the rate applied to the ‘map, also known as the cadastre value,’ (pers. comm. Bloechliger 2012).
In other cases, market value and highest and best use is the base on which CIV is determined. Sweden uses CIV
to assess the property tax in which property values are reassessed every three years. Sweden adopts a
‘Physically Defined Standard State’, (PDSS) for land and buildings by location, in which improvements are
defined to a specific standard state by location across the country, this standard state is the proxy for highest and
best use in which improvements are determined as being maximally productive and as new, (pers. comm. Lind,
2010).
In Canada CIV represents market value, unencumbered (Bird and Slack 2004:70). To this end, a robust and
definitive basis of value has evolved and is continuing to evolve as Canada leads the way in the assessment of
value under CIV. While property tax reforms in Ontario are ongoing, it has been successful in implementing a
uniform assessment system (Bird, Slack and Tassonyi, 2012:224), however it is not clear whether a Standard
Defined State is used to establish the highest and best use of CIV in Canada.
New Zealand has a well developed rating system in which local government has the option of adopting one of
three bases of value for the rating of property, (McCluskey et al 2006:381). Four of the main cities of New
Zealand (Auckland, Wellington, Christchurch and Hamilton) all utilize a capital or annual value rating system,
(Ibid:389). The property tax is applied at the local government level in New Zealand, to which the local
government determines a rate in the dollar which is applied to the CIV to assess the tax.
5
PRRES Conference 19-22 January 2014 Christchurch New Zealand
Denmark imposes a recurrent tax on property on a number of bases which includes CIV which was introduced
in 2000. CIV is the based used to tax owner-occupied dwellings and summerhouses and is assessed on market
value of which values are re-assessed bi-annually in line with market transactions. The transition to CIV for
residential property is currently evolving during 2013 in which a ‘Standard Defined State’ is being developed
for the basis on which CIV is to be determined, similar to Sweden, (pers. comm. Falk-Rasmussen, 2010 &
2012).
Annual Rental Value (ARV)
Annual Rental Value (ARV) is derived from the annual income of improved property and is generally
determined on the net annual rental after outgoings are deducted from the gross rent (McCluskey, Owiti and
Olima 2005:11). In contrast, examples of Gross Rental Value may be used comprising the total rent collected,
inclusive of property outgoings (McCluskey et al 2010). Its two advantages are stated to be its application to a
broader base, namely land and buildings, and its ease of assessment by reference to income from the property,
(McCluskey et al, 2005:11).
Similar to CIV, ARV is influenced by the condition, age and functionality of the improvements on the land, and
may impact on the efficiency of the tax where improvements are not maximally productive. The core factor of
location may be impacted on by improvements, particularly where they are not assessed on highest and best use
or maximally productive. The key differentiating factor between capital bases of taxation including improved
and land value compared with assessed annual value, is that capital value and the analysis of capital value
transactions will capture both the investor and owner-occupier market. This is in contrast to ARV assessments,
which are derived from the investment segment of the market only (Whipple 1986).
The rental approach may present its own valuation problems in cases of properties that are not in the rental
marketplace, such as owner-occupied property (Bahl 2009:6). The valuation problem also extends to the
valuation of vacant land, where a rental is not determinable due to the absence of improvements on the land
(Ibid:6). In cases where rental data is thin or non-existent, reference to average rents paid are assumed of which
these rents are roughly reflected in the rental roll (Ibid:7).
The above opens the debate as to whether the tax is assessed on the actual rental from the property and where
that differs from rent based on highest and best use, which should be used to assess the tax. The Uniform
Business Rate used to assess non-residential property in the UK does not articulate this detail. Where a property
is vacant, a hypothetical landlord and hypothetical tenant is assumed (Sanderson 2012), however what is not
known in these circumstances which may impact on the efficiency of the tax, is whether proxy for highest and
best use is applied where a property is rented but its rent is below market rent.
Different jurisdictions have adopted different approaches to address the matters discussed above. In the
Netherlands, a mix of capital value deduced from property transactions as well as rental values from rental
information is used in the assessment of the property tax. The rental component is better known as imputed rent
or rental value (Kathmann and Kuijper 2010). The imputed rental value is obtained from the market derived
from other comparable rented premises, while the capital improved value is derived from sales which
encompasses both owner-occupied and rented segments of the market.
6
PRRES Conference 19-22 January 2014 Christchurch New Zealand
In Australia ARV and specifically Gross Annual Value (GAV) is used to assess local government rating in the
States of Western Australia, (WA) and Tasmania (Tas). In contrast to England, Hong Kong and the Netherlands
where the annual rental value is determined on the net rent after deducting outgoings, in WA and Tas, local rates
are assessed on GAV.
Land / Site Value
Land and site value, is broadly defined in Valuation of Land legislation as excluding improvements on land.
Considerable confusion surrounds the measurement in practice of land value and in particular its determination
on highest and best use. In the early twentieth century, the use of land value as the basis of taxing property was
determined on the sufficiency of undeveloped (unimproved or vacant) land sales as the basis for assessing value
(McCluskey, et al 2010:122). This approach was underpinned by the fact that vacant land transacts reflected the
potential highest and best use of land. However, with the development of highly urbanized locations where
vacant land sales have become the exception, valuers could no longer rely on vacant land sales as a measure of
land values (Ombudsman 2005).
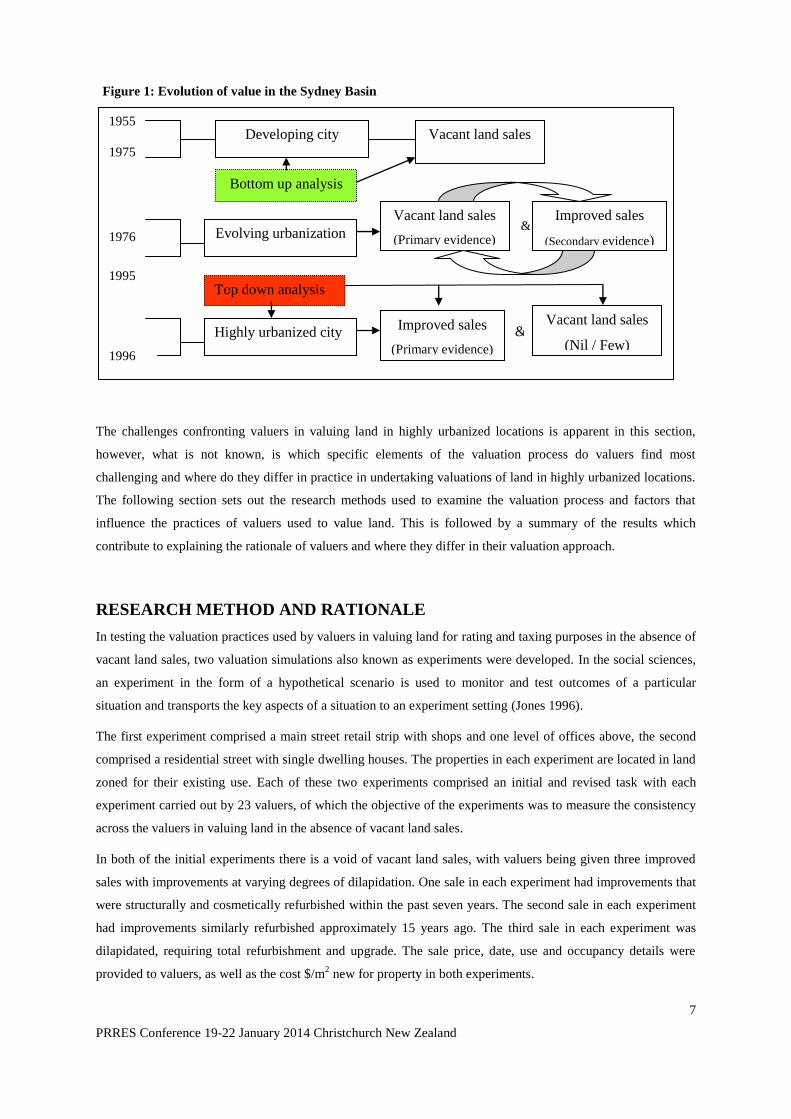
The evolution of land taxation in Sydney (Australia) provides an insight into the challenges confronting all cities
when imposing a land tax in increasingly urbanized locations. Figure 1 outlines how the increasing lack of
vacant land sales as the source of primary evidence for determining land value, has resulted in greater reliance
on improved property sales. This has resulted in an additional layer of complexity which requires accounting for
the added value of improvements in the valuation of land (Ombudsman 2005:7). With this has come a lack of
‘transparency’ and ‘simplicity’ and increasing pressure for the adoption of alternate bases of value for the
assessment of recurrent property taxation. The lack of land transactions on these two principles of ‘good tax
design’ are clearly defined as the rationale for the move to CIV in other international jurisdictions (Franzsen, 37
and 41, in Dye and England eds. 2009).
The lack of consistency in accounting for the added value of improvements and the inability for valuers to
articulate how land value has been determined from improved value has raised questions as to whether land
remains the most suitable base on which to assess the property tax in highly urbanized locations. What is clear
from the earlier review of the historical evolution of property taxation is that land tax is constantly under
challenge and constantly in terms of the base on which it is assessed.
One consequence of the lack of sufficient vacant land transactions in a particular location has resulted in the
practice of valuers being forced to use land transactions from adjoining locations (Bahl 2009:9). Another
practice has been for land value to be determined by deducting the added value of improvements from improved
property sales. (Ombudsman 2005). This emerging valuation process and in particular, the determination of the
added value of improvements on land value, has raised questions about its potential to compromise the
economic efficiency, simplicity and transparency of land tax (Arnott & Petrova 2002:3).
7
PRRES Conference 19-22 January 2014 Christchurch New Zealand
Figure 1: Evolution of value in the Sydney Basin
The challenges confronting valuers in valuing land in highly urbanized locations is apparent in this section,
however, what is not known, is which specific elements of the valuation process do valuers find most
challenging and where do they differ in practice in undertaking valuations of land in highly urbanized locations.
The following section sets out the research methods used to examine the valuation process and factors that
influence the practices of valuers used to value land. This is followed by a summary of the results which
contribute to explaining the rationale of valuers and where they differ in their valuation approach.
RESEARCH METHOD AND RATIONALE
In testing the valuation practices used by valuers in valuing land for rating and taxing purposes in the absence of
vacant land sales, two valuation simulations also known as experiments were developed. In the social sciences,
an experiment in the form of a hypothetical scenario is used to monitor and test outcomes of a particular
situation and transports the key aspects of a situation to an experiment setting (Jones 1996).
The first experiment comprised a main street retail strip with shops and one level of offices above, the second
comprised a residential street with single dwelling houses. The properties in each experiment are located in land
zoned for their existing use. Each of these two experiments comprised an initial and revised task with each
experiment carried out by 23 valuers, of which the objective of the experiments was to measure the consistency
across the valuers in valuing land in the absence of vacant land sales.
In both of the initial experiments there is a void of vacant land sales, with valuers being given three improved
sales with improvements at varying degrees of dilapidation. One sale in each experiment had improvements that
were structurally and cosmetically refurbished within the past seven years. The second sale in each experiment
had improvements similarly refurbished approximately 15 years ago. The third sale in each experiment was
dilapidated, requiring total refurbishment and upgrade. The sale price, date, use and occupancy details were
provided to valuers, as well as the cost $/m2 new for property in both experiments.
1955
1975
1976
1995
1996
Present
Vacant land sales
Vacant land sales
(Primary evidence)
Improved sales
(Secondary evidence)
Highly urbanized city
Developing city
Evolving urbanization &
Improved sales
(Primary evidence)
Vacant land sales
(Nil / Few) &
Bottom up analysis
Top down analysis
8
PRRES Conference 19-22 January 2014 Christchurch New Zealand
The primary tasks of the initial phase of the experiment are for valuers to:
1. Determine the land value of each of the three sales;
2. To observe the order of sale in each experiment valuers determined to be the most relevant to least
relevant in determining a basis of land value; and
3. To observe which sale did valuers determine as being in the most valuable location.
Once the initial experiment was complete, valuers then re-answered the first step above, however were provided
with an additional sale of a fully refurbished property (structurally and cosmetically) in each experiment which
had sold within 12 months of the date of valuation.
Table 2 sets out the responses for both the experiments and as noted, the completed experiments of 25 does not
correspond with the number of valuer participants for either the retail or residential experiment. In total 25
valuers participated in the experiment of which 23 of the valuers completed both the retail and residential
experiments. Two additional valuers completed the retail experiment only and an additional 2 valuers completed
only the residential experiment.
The specific questions to be examined, however, are: Where improved sales are used to determine land value for
rating and taxing purposes, which sales do valuers consider most relevant, which improved sales yielded the
most consistent results and does a codified process for selecting and analyzing improved sales result in a more
consistent value?
The analysis and tests used to measure the change between the results from the initial and revised experiments
are firstly by comparing change in the standard deviation for each sale in both experiments across the valuers.
This is followed by a non-parametric Levene test using SPSS software to measure the significance of the
variations of each sale across the groups of valuers. The Levene test ranks transformation as a bridge between
parametric and nonparametric statistics using three steps, “(i) pooling that data and replacing the original scores
by their ranks and then (ii) separating the data back into their groups and three applying the conventional mean
based Levene test to the ranks” (Nordstokke et al 2011:3). The summary of results for the experiments and
Levene tests are set out as the annexure to this paper.
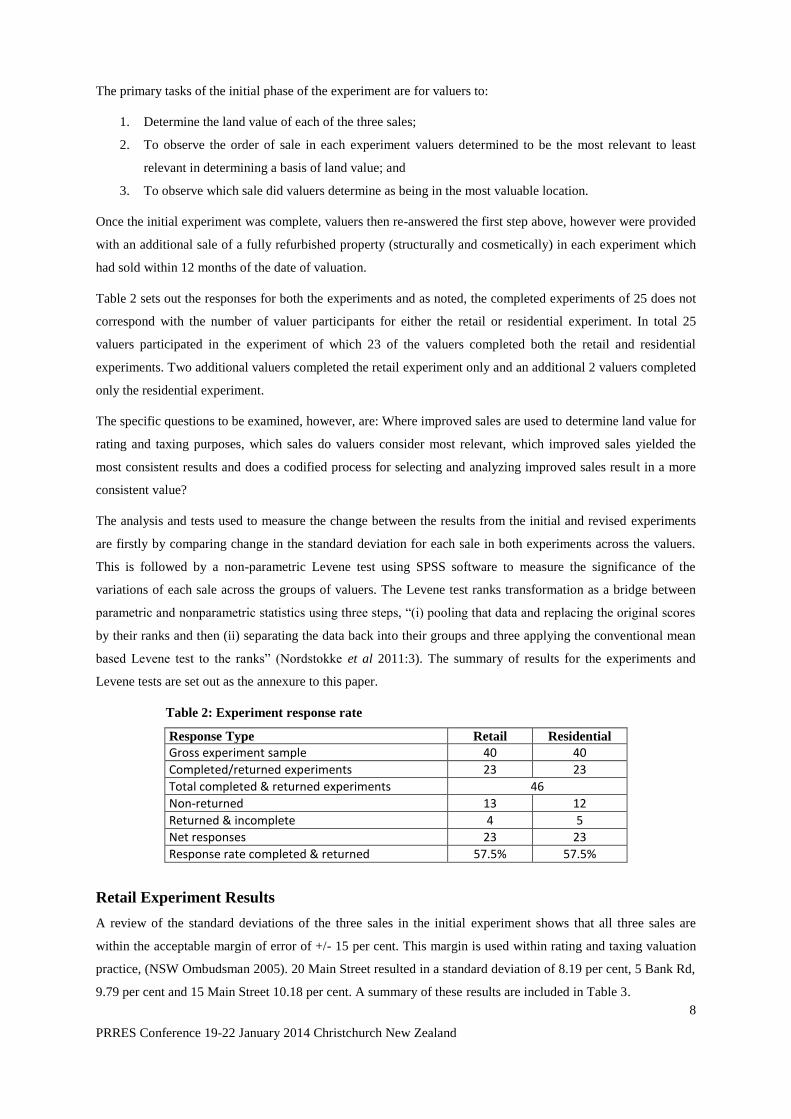
Table 2: Experiment response rate
Response Type Retail Residential
Gross experiment sample 40 40
Completed/returned experiments 23 23
Total completed & returned experiments 46
Non-returned 13 12
Returned & incomplete 4 5
Net responses 23 23
Response rate completed & returned 57.5% 57.5%
Retail Experiment Results
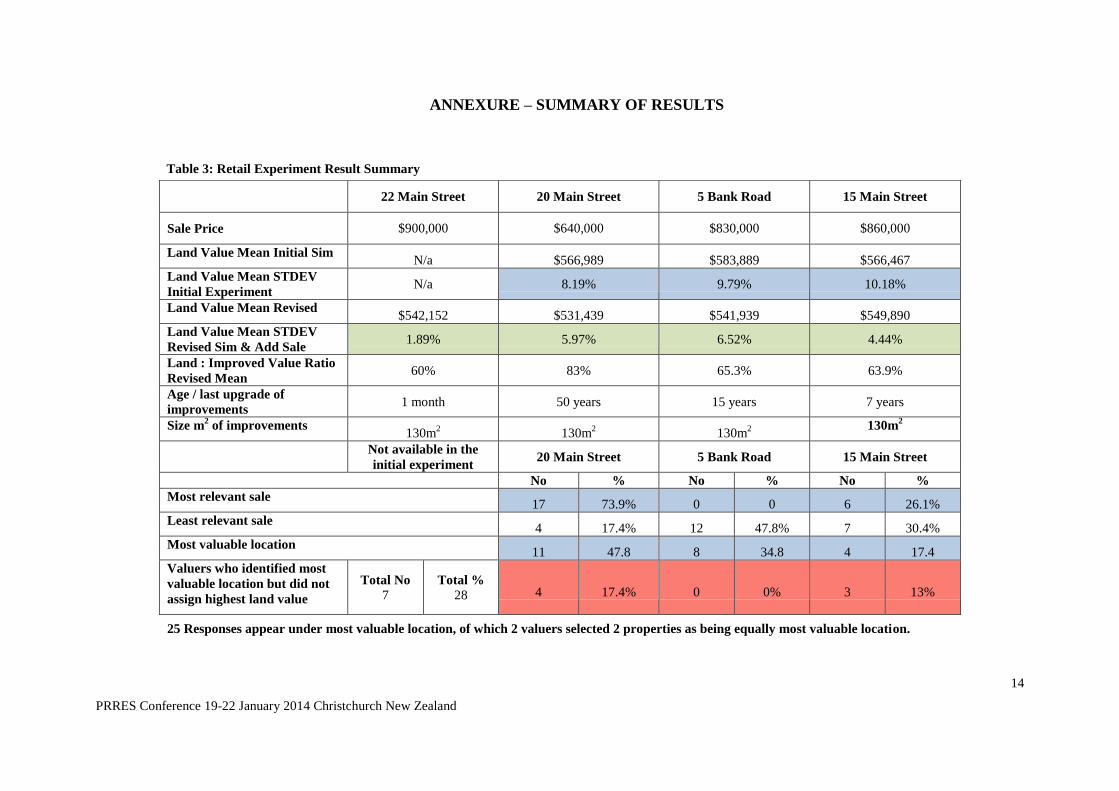
A review of the standard deviations of the three sales in the initial experiment shows that all three sales are
within the acceptable margin of error of +/- 15 per cent. This margin is used within rating and taxing valuation
practice, (NSW Ombudsman 2005). 20 Main Street resulted in a standard deviation of 8.19 per cent, 5 Bank Rd,
9.79 per cent and 15 Main Street 10.18 per cent. A summary of these results are included in Table 3.
9
PRRES Conference 19-22 January 2014 Christchurch New Zealand
In adopting a codified approach to the analysis in accounting for the added value of improvements a different
outcome resulted across all three sales in the revised experiment. 15 Main Street resulted the lowest standard
deviation of 4.44 per cent and the largest improvement of 56.4 per cent of the three sales in the revised
experiment. This was followed by 5 Bank Rd resulting in a standard deviation of 6.52 per cent, an improvement
of 33.5 per cent and finally 20 Main Street resulted in a reduction of the standard deviation to 5.97 per cent, an
improvement of 27.2 per cent.
A review of the results from the second task of the initial experiment qualifies the processes and judgment
adopted by the valuers in the sales selection process. As set out in Table 3, a review of the sale valuers ranked as
the most relevant in deducing the underlying value of land was 20 Main Street. 17 of 23 valuers representing
73.9 per cent selected 20 Main Street as the most relevant, followed by 6 valuers representing 26.1 per cent, who
selected 15 Main Street as the second relevant sale. 5 Bank Street was not selected by valuer as the most
relevant sale.
The third task valuers were instructed to undertake, was to rank the most valuable to least valuable location of
the three sales. It is reiterated that all of the parcels of land are the same size and shape and sold within the same
time period, close the date of valuation. Once the added value of improvements are accounted for and deducted
from the sale price, the deduced land value ultimately reflects the value of the location of the land. It is noted in
Table 3, that 7 valuers, representing 30.4 per cent, did not assign the highest land value to the property selected
as the most valuable location in the initial experiment.
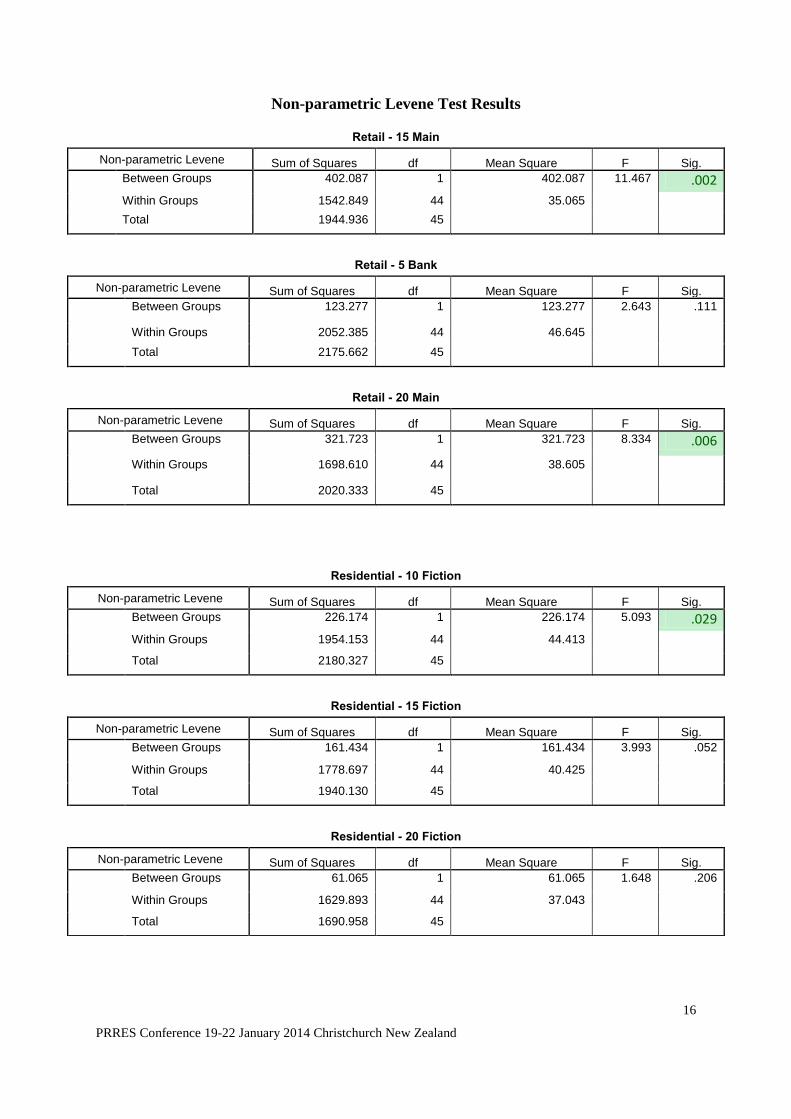
Results from the Levene test highlight significance of variance of both 15 and 20 Main Street, with the largest
variation of these two, being 15 Main at .002. As set out in the information provided to the participants of the
retail experiment, 15 Main Street had the newest improvements of the three sales. The provision of the
additional sale in the revised experiment, which was near new, has resulted in the greatest variation and
significance. The result confirms that sales with improvements that are highest and best use and require little
adjustment for depreciation of improvements produce the largest improvement and result in the lowest standard
deviation. The significance of 20 Main Street resulted from valuers being able to confirm that the added value of
improvements and cost new are the same hence graded the land value for 20 Main Street from the land value
deduced from the revised valuations of 15 Main Street and the additional sale at 22 Main Street.
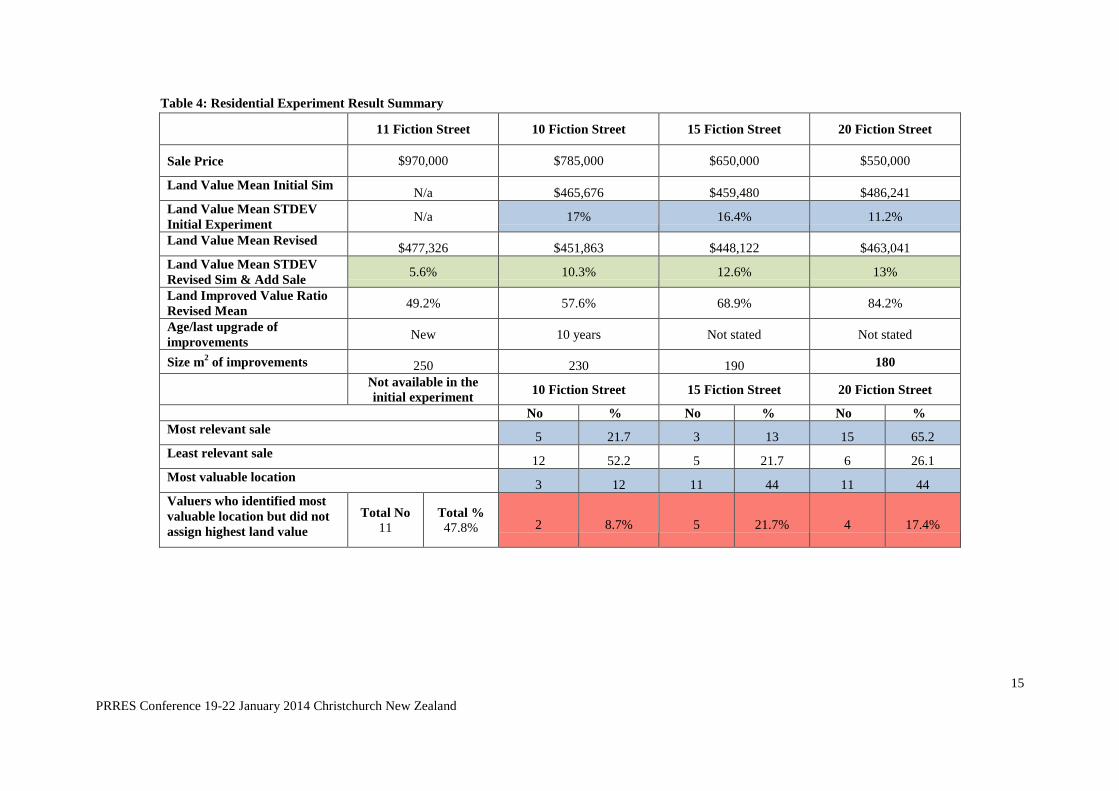
Residential Experiment Results
A review of the standard deviations of the three sales in the initial experiment shows that only one of the three
sales, 20 Fiction Street, resulted in a standard deviation of 11.2 per cent, being within the acceptable margin of
error of +/- 15 per cent. 10 & 15 Fiction Street resulted in standard deviations of 17 percent and 16.4 per cent
respectively. The summary of the results are included in Table 4.
In adopting a codified approach to the analysis in accounting for the added value of improvements a different
outcome resulted across all three sales. 10 Fiction Street produced the lowest standard deviation of 10.3 per cent
and the largest improvement of 39.4 per cent of the three sales in the revised experiment. This was followed by
15 Fiction Street resulting in a standard deviation of 12.6 per cent, an improvement of 23.2 per cent. In contrast,
10
PRRES Conference 19-22 January 2014 Christchurch New Zealand
20 Fiction Street resulted in a reduction in the standard deviation to 13 per cent, however, it was still within the
acceptable margin of error of +/-15 per cent.
A review of the results from the second task of the initial experiment qualifies the processes and judgment
adopted by the valuers in the sales selection process. As set out in Table 4, a review of the sale valuers ranked as
the most relevant in deducing the underlying value of land was 20 Fiction Street. 15 of 23 valuers representing
65.2 per cent selected 20 Fiction Street as the most relevant, followed by five valuers representing 21.7 per cent,
who selected 10 Fiction Street as the most relevant sale. 15 Fiction Street with three valuers or 13 per cent, was
selected this as the most relevant sale.
The third task valuers were instructed to undertake, was to rank the most valuable to least valuable location of
the three sales. It is reiterated that all of the parcels of land are the same size and shape and sold within the same
time period, close the the date of valuation. Once the added value of improvements are accounted for and
deducted from the sale price, the deduced land value ultimately reflects the value of the location of the land. It is
noted in Table 4, that 11 valuers, representing 47.8 per cent, did not assign the highest land value to the property
selected as the most valuable location in the initial experiment.
Results from the Levene test highlight significance of variance of 10 Fiction Street at .029. As set out in the
information provided to the participants of the retail experiment, 10 Fiction Street has both the newest and
largest improvements of the three sales. The provision of the additional sale in the revised experiment, which
was near new, has resulted in the greatest variation and significance being attributed to the sale with the newest
improvements. Similar to the retail experiment, the result confirms that sales with improvements that are highest
and best use and require little adjustment for depreciation of improvements produce the largest improvement
and result in the lowest standard deviation.
Results Summary
The results of the experiments highlight three important points as follow:
1. Valuers to some degree differed on which sale was considered the most relevant of the three sales in
each experiment. The majority of valuers gravitated towards the sale with the oldest improvements
with lowest added value to the land in each case. In the residential experiment 65 per cent of valuers
selected 20 Fiction Street as the most relevant sale and in the retail experiment 74 per cent of valuers
selected 20 Main Street as the most relevant sale. This demonstrated that valuers preferences were to
adjust back to land value, sales with improvements which added little value to the land.
2. In the second task of valuers determining the most valuable location of the three sales, valuers were
split (not equally) across the sales in each experiment, however a more even split is noted in the
residential experiment. It was suggested by some participating valuers that a rental survey would best
reflect the location value of land, particularly in the retail experiment. Of particular note in results on
this task, was that in the initial retail experiment, 7 of the 25 land values, or 28 per cent, selected as the
most valuable location were not assigned the highest land value of the three sales. In the initial
residential experiment, 11 or 23 land values, or 47.8 per cent selected as the most valuable location
were not assigned the highest land value of the three sales.
11
PRRES Conference 19-22 January 2014 Christchurch New Zealand
3. The most significant factor which emerged was the improvement in the standard deviation of values
between the initial and revised experiments in both the residential and retail results. This demonstrated
that a codified approach in which valuers agreed on the same sales as being most relevant and with a
standard approach to analyzing these sales, the improvement in the standard deviation of values ranged
from 23 to 56 percent. It was noted that one sale 20 Fiction Street had a decrease of 16 per cent in the
standard deviation of its value.
CONCLUSION
The definition of value is a well defined concept within the property profession. However, within taxation the
meaning of value is subsumed under the principles of ‘good tax design’ particularly in assessing land tax. In
summary, the value determined and used to assess recurrent property tax is an artificial construct resulting from
a manufactured process in the absence of vacant land sales.
While requiring some resemblance to market value as defined in Spencer v Commonwealth 1907, the standard
defined state of value and its manufacture is the key to an economically efficient recurrent land tax in Australia.
This brings to the fore, the importance that all bases of value are assessed on the same footing and more
specifically, all land or property in the case of capital improved value or assessed annual value are assessed on
the same footing, that is highest and best use and not existing use.
In the first instance, it has been observed that the success of taxing land on its highest and best use depends
largely on the valuation practices adopted (Gaffney, 1975, Hudson, 2008 & Oates & Schwab 1997). If land
value is to remain the basis of recurrent land taxation, it will be necessary to ensure that valuers firstly define the
land’s highest and best use before the added value of improvements can be determined in a simple and
transparent manner and improve the economic efficiency of the tax. A framework for determining the highest
and best use of land therefore has the potential to facilitate the application and harmonization of a recurrent tax
on land within and across jurisdictions of Australia.
The primary rationale argued for land over other bases of value, is that improvements are accounted for in the
sales analysis process when valuing land. This is in contrast to including improvements in the tax base and
hence attempting to communicate to the tax payer that CIV, is not what is on their land, but should be on their
land where improvements are not maximally productive.
The conclusion drawn is that a codified process of selecting, analyzing and determining value (aka the valuation
process) results in a more consistent result across a population of valuers, of which the process is clearly
communicable and simple to the explain the taxpayer. This process ultimately conforms to the principles of
‘good tax design’, results in a simpler and more transparent tax while maintaining its economic efficiency.
The additional complexity of valuing land in highly urbanized requires a standard in accounting for the added
value of improvements in the absence of vacant land sales. The selection of sales of which improvements are
maximally productive and highest and best use is the first important step in the valuation process. This paves the
way for the second step of the valuation process to be further explored, that is defining a standard added value of
improvements within a designated defined valuation location or catchment.
12
PRRES Conference 19-22 January 2014 Christchurch New Zealand
REFERENCES
Australia’s Future Tax System, 2010, Final Report To The Treasurer, Commonwealth of Australia, Barton,
ACT.
Arnott, R. and Petrova, R. The property tax as a tax on value: Deadweight loss National Bureau of Economic
Research, 2002).
Bahl, R. 2009, Property Tax Reform in Developing and Transition Countries. United States Agency for
International Development, Pennsylvania.
Bird, R.M. & Slack, E. (Ed), 2004 ‘International Handbook of Land and Property Taxation’, Edward and Elgar
Publishing Ltd, Massachusetts.
Bird, R.M., Slack, E. and Tassonyi, A. 2012, A Tale of Two Taxes: Property Tax Reform in Ontario, Lincoln
Institute of Land Policy, Cambridge, Mass
Bloechliger, H. Economist OECD Paris to V. Mangioni pers. comm. meeting 3 May 2012 and Delattres, K.
BNP Barabis Real Estate Paris to V. Mangioni pers. comm. meeting 2 May 2012.
Dye, R.F. and England, W.E. 2009 (eds), Land Value Taxation: Theory, evidence and practice, Lincoln Institute
of Land Policy, Cambridge, Massachusetts.
Falk-Rasmussen, J. 2011 Skat Ministry of Taxation Denmark, pers. Comm. Email communication dated, 25-11-
11 and Meetings Falk-Rasmussen & Muller (Anders) 8 & 10 Sept 2010 Skat Ministry of Taxation Copenhagen,
Denmark.
Franzsen, R.C.D. Ch 3, in Dye, R.F. and England, W.E. 2009 (eds), Land Value Taxation: Theory, evidence and
practice, Lincoln Institute of Land Policy, Cambridge, Massachusetts.
Gaffney, M. 1975 'The many faces of site value taxation' (Paper presented at the Twenty-seventh Annual
Conference of the Canadian Tax Foundation, Quebec City, 12 November 1975).
Gaffney, M. 'Proposition 13: What happens when a State radically slashes its property tax' (Paper presented at
the Jerome Levy Institute, Excerpts from a paper, "Big Plans to stir the blood and steer the course", 3 November
1995)
Hans Lind. Professor, KTH Royal Institute of Technology, Stockholm Sweden and Monica Haapaniemi.
Judge, Land Court, Nacka Tingsratt. Sweden, pers. comm. meeting KTH 13 September 2010.
Hudson, M. 'Henry George's Political Critics' (2008) 67(1) American Journal of Economics and Sociology.
Jones, R., Research Methods in the Social and Behavioral Sciences (1996) Sunderland Massachusetts.
Kathmann, R.M. and Kuijper, M. 2010 'Taxpayer checks data in the system of base registers' (Paper presented at
the Facing the Challenges - Building the Capacity, Sydney, Darling Harbour. 4-5. 2010
McCluskey, W.J. and Franzsen R.C.D. (eds), Land Value Taxation An Applied Analysis (2005). McCluskey,
W.J. Ch 5,
McCluskey, W.J., Bell, M.E. and Lim, L.J. (2010) 'Rental Value Versus Capital Value - Alternate Bases for the
Property Tax' in R. Bahl, J. Martinez-Vazquez and J.M. Youngman (eds), Challenging the Conventional
Wisdom of the Property Tax. Lincoln Institute of Land Policy, Cambridge Massachusetts.
McCluskey, W.J. Grimes, A. Aitkin, A. Kerr, S. & Timmins, J., 'Rating Systems in New Zealand: An Empirical
Investigation into Local Choice' (2006) 14(3) Journal of Real Estate Literature 381-397
Maximilian, K. 'The fiscal reform of land tax in Germany' (Paper presented at the FIG Working Week 2012,
Rome, Italy 6-10 May 2012.
Nordstokke, D.W., Zumbo, B.D., Cairns, S.L. and Saklofske, D.H. (2011), The opearting charcteristics of the
nonparametric Levene test for equal variances with assessment and evaluation data. Prctical Assessment
Research and Evaluation, Vol 16, No 5 Feb 2011.
NSW Ombudsman 2005, Improving the quality of land valuations issued by the Valuer-General Sydney, Oct
2005.
Oates, W.E. and Schwab, R.M. 'The Impact of Urban Land Taxation: The Pittsburgh Experience' (1997) 50(1)
National Tax Journal 1-21
13
PRRES Conference 19-22 January 2014 Christchurch New Zealand
Plimmer, F. 1998, Rating Law and Valuation, Pearson Education Ltd. Harlow, England.
Productivity Commission 2004, First Home Ownership Report No 28, Melbourne, Commonwealth of Australia.
RICS 2007, ‘The potential for the property tax in the 2004 accession countries of central and eastern Europe.’
RICS Research Issues Paper Vol 7, No 17.
Sanderson, P. 'CHOVA Commonwealth Heads of Valuation Agencies Conference' (18-21 March 2012). Beyond
the Horizon. Sydney, Australia.
Simpson, R., & Figgis, H. 1998, Land Tax in New South Wales. Briefing Paper No 6/98, NSW Parliamentary
Library, Sydney.
Smith, S. 2005, Land Tax: an Update. Briefing Paper No 5/05, NSW Parliamentary Library, Sydney.
Whipple, R.T.M. 1986, Commercial rent reviews: law and valuation practice Law Book Co, Sydney.
14
PRRES Conference 19-22 January 2014 Christchurch New Zealand
ANNEXURE – SUMMARY OF RESULTS
Table 3: Retail Experiment Result Summary
25 Responses appear under most valuable location, of which 2 valuers selected 2 properties as being equally most valuable location.
22 Main Street 20 Main Street 5 Bank Road 15 Main Street
Sale Price $900,000 $640,000 $830,000 $860,000
Land Value Mean Initial Sim N/a $566,989 $583,889 $566,467
Land Value Mean STDEV
Initial Experiment N/a 8.19% 9.79% 10.18%
Land Value Mean Revised $542,152 $531,439 $541,939 $549,890
Land Value Mean STDEV
Revised Sim & Add Sale 1.89% 5.97% 6.52% 4.44%
Land : Improved Value Ratio
Revised Mean 60% 83% 65.3% 63.9%
Age / last upgrade of
improvements 1 month 50 years 15 years 7 years
Size m2 of improvements
130m2 130m
2 130m
2
130m2
Not available in the
initial experiment 20 Main Street 5 Bank Road 15 Main Street
No % No % No %
Most relevant sale 17 73.9% 0 0 6 26.1%
Least relevant sale 4 17.4% 12 47.8% 7 30.4%
Most valuable location 11 47.8 8 34.8 4 17.4
Valuers who identified most
valuable location but did not
assign highest land value
Total No
7 Total %
28 4 17.4% 0 0% 3 13%
15
PRRES Conference 19-22 January 2014 Christchurch New Zealand
Table 4: Residential Experiment Result Summary
11 Fiction Street 10 Fiction Street 15 Fiction Street 20 Fiction Street
Sale Price $970,000 $785,000 $650,000 $550,000
Land Value Mean Initial Sim N/a $465,676 $459,480 $486,241
Land Value Mean STDEV
Initial Experiment N/a 17% 16.4% 11.2%
Land Value Mean Revised $477,326 $451,863 $448,122 $463,041
Land Value Mean STDEV
Revised Sim & Add Sale 5.6% 10.3% 12.6% 13%
Land Improved Value Ratio
Revised Mean 49.2% 57.6% 68.9% 84.2%
Age/last upgrade of
improvements New 10 years Not stated Not stated
Size m2 of improvements 250 230 190 180
Not available in the
initial experiment 10 Fiction Street 15 Fiction Street 20 Fiction Street
No % No % No %
Most relevant sale 5 21.7 3 13 15 65.2
Least relevant sale 12 52.2 5 21.7 6 26.1
Most valuable location 3 12 11 44 11 44
Valuers who identified most
valuable location but did not
assign highest land value
Total No
11 Total %
47.8% 2 8.7% 5 21.7% 4 17.4%
16
PRRES Conference 19-22 January 2014 Christchurch New Zealand
Non-parametric Levene Test Results
Retail - 15 Main
Non-parametric Levene Sum of Squares df Mean Square F Sig.
Between Groups 402.087 1 402.087 11.467 .002
Within Groups 1542.849 44 35.065
Total 1944.936 45
Retail - 5 Bank
Non-parametric Levene Sum of Squares df Mean Square F Sig.
Between Groups 123.277 1 123.277 2.643 .111
Within Groups 2052.385 44 46.645
Total 2175.662 45
Retail - 20 Main
Non-parametric Levene Sum of Squares df Mean Square F Sig.
Between Groups 321.723 1 321.723 8.334 .006
Within Groups 1698.610 44 38.605
Total 2020.333 45
Residential - 10 Fiction
Non-parametric Levene Sum of Squares df Mean Square F Sig.
Between Groups 226.174 1 226.174 5.093 .029
Within Groups 1954.153 44 44.413
Total 2180.327 45
Residential - 15 Fiction
Non-parametric Levene Sum of Squares df Mean Square F Sig.
Between Groups 161.434 1 161.434 3.993 .052
Within Groups 1778.697 44 40.425
Total 1940.130 45
Residential - 20 Fiction
Non-parametric Levene Sum of Squares df Mean Square F Sig.
Between Groups 61.065 1 61.065 1.648 .206
Within Groups 1629.893 44 37.043
Total 1690.958 45