Embed Size (px)
Citation preview

Defining and Measuring the U.S. Ocean Economy
Authors William Nicolls, primary author; Connor Franks, Teresa Gilmore, Rachel Goulder, Luke Mendelsohn, and Edward Morgan, Bureau of Economic Analysis
Jeffery Adkins, Monica Grasso, Kate Quigley, and Jennifer Zhuang, National Oceanic and Atmospheric Administration
Charles Colgan, Middlebury Institute of International Studies at Monterey
Contact [email protected]
Date June 2020
Abstract The Bureau of Economic Analysis (BEA), in partnership with the National Oceanic and Atmospheric Administration (NOAA), has developed prototype statistics to measure the ocean’s contribution to U.S. gross domestic product (GDP). Economic activity associated with the ocean exists within BEA’s national accounts but is not clearly visible within the standard national ac-counts structure. These new estimates were extracted from the national accounts supply-use framework and arranged to give a distinct view of U.S. ocean-related production. These pro-totype statistics provide an opportunity for outside groups to give feedback on the methodology used to develop these results, and they are the first step in building a comprehensive measure of the ocean’s role in the overall U.S. economy in the form of an Ocean Economy Satellite Account (OESA).
A satellite account is a framework that is harmonious with the national accounts, but in which portions of the detail that underlies the national accounts have been extracted and rearranged to present a view of a defined aspect of the economy. The ocean economy prototype statis-tics that BEA has developed do not include the real estimates, price measures, and other in-formation that a full BEA satellite account contains; however, they were constructed follow-ing the same techniques used to construct BEA’s other satellite accounts. First, a conceptual definition of the ocean economy was developed by NOAA and NOAA researchers identified spe-cific goods and services relevant to the ocean economy within BEA’s supply-use framework. Second, BEA identified and defined the activities associated with the ocean economy. Third, NOAA and BEA conducted research to estimate the ocean-related portion of production within each of these goods and services. Lastly, BEA identified the industries responsible for pro-ducing these goods and services and measured the output, value added, compensation, and em-ployment associated with that production.
These prototype statistics show that the ocean economy accounted for 1.8 percent ($372.8 billion) of national GDP in 2018. This paper will discuss the methodology used to arrive at this number as well as the challenges that remain in measuring the full scope of the ocean economy.
2
1. Introduction
The oceans provide a wealth of economic benefits to the everyday lives of Americans. Oil and gas are extract-
ed from the ocean floor, and resources are extracted from its waters for food, for use in the development of
medicines, and in support of a host of other scientific endeavors. Water freight transportation is the backbone
for international and domestic goods commerce, providing retailers, farmers, manufacturers, and others with
access to distant markets. Even leisure time is often spent vacationing along the ocean shores. The focus of
this paper is on prototype statistics that measure the economic contributions of the oceans, coasts, and Great
Lakes to U.S. gross domestic product (GDP).
The Bureau of Economic Analysis (BEA) and National Oceanic and Atmospheric Administration (NOAA)
have partnered to create these prototype statistics. While NOAA has already developed a wide range of statis-
tics related to the ocean economy, the partnership between BEA and NOAA allows development of economic
statistics consistent with the national accounting framework used by BEA in the measurement of GDP. This
framework is a comprehensive and consistent accounting of the entire national economy and underpins the
satellite account estimation methodology used in preparing these statistics.
Satellite accounts identify and present defined aspects of the U.S. economy that are not readily visible in the
standard presentation of the national accounts. Supply-use tables are one element of the national accounting
framework and form the foundation on which U.S. ocean and coastal production statistics were developed.
Ocean and coastal production is already included in the supply-use framework but is not explicitly identified
within the North American Industry Classification System (NAICS) code structure used in the national ac-
counts. Table 1 shows a small portion of BEA’s published 2018 GDP by industry statistics, which include em-
bedded ocean-related production. For example, the farm industry contains aquaculture, which is included as
an ocean economy activity that will be presented in the prototype statistics. Other ocean economy activities
included in Table 1 are commercial fishing, which is embedded in the forestry, fishing, and related activities
industry, and offshore oil drilling, which is found in the oil and gas extraction industry.
Table 1. Value Added by Industry[Billions of dollars]
Line 2018
1 Gross domestic product 20,580.2
2 Private industries 18,035.6
3 Agriculture, forestry, fishing, and hunting 166.5
4 Farms 129.6
5 Forestry, fishing, and related activities 36.9
6 Mining 346.6
7 Oil and gas extraction 236.8
8 Mining, except oil and gas 60.6
9 Support activities for mining 49.3
Bureau of Economic Analysis Release Date: October 29, 2019

3
The ocean economy prototype statistics presented in this document are a first step toward creating a full
ocean economy satellite account. Results are presented in current dollars and are available at approximately
the three-digit NAICS industry level of detail for gross output, value added, compensation, and employment.
Gross output and value added are also available by activity groupings that reflect an emerging international
consensus on how to characterize the composition of the ocean economy. Results do not include real esti-
mates (adjusted for the effects of inflation), price measures, and other information that a full BEA satellite
account would contain.
Gross output is a measure of economic activity associated with the domestic production of goods and ser-
vices, including goods and services sold both to final consumers (GDP) and to other industries (intermedi-
ate inputs). Gross output differs from value added, which is a measure of an industry’s contribution to GDP.
Value added by industry reflects the total value of domestic production less the value of inputs used up in the
production process and can also be measured as the sum of production-related compensation, profits, and
taxes. Compensation is defined as total wages and supplements by industry, and employment is defined as the
average annual number of full-time and part-time employees.
The next section of this report explains the methodology used to prepare these statistics; results are present-
ed in the subsequent section; and the report will conclude with a description of next steps in the project and
future areas of research.

4
2. Methodology
The ocean economy statistics were developed following the same underlying methodology used to estimate
many other BEA satellite accounts. First, the geographic scope of the account was determined. Second, with
the geographic scope as a guide, a conceptual definition of ocean-related production was developed. Third,
the conceptual definition was used by BEA and NOAA to identify the goods and services germane to mea-
suring the ocean economy statistics. Lastly, using the supply-use framework, BEA identified the industries
responsible for producing these goods and services and measured the output, value added, compensation,
and employment associated with their production.
2.1 Define the scope of the ocean economy
The starting point for developing the ocean economy statistics was to determine the geographical scope
of the account. This geographical aspect differentiates the ocean economy from the other BEA satellite
accounts, which are primarily activity driven. Included in the geographical scope are all U.S. oceans and
marginal seas. This comprises the Atlantic, Pacific, and Arctic Oceans within the Exclusive Economic Zone
(approximately 200 nautical miles off the U.S. coast) as well as marginal seas such as the Gulf of Mexico,
Chesapeake Bay, Puget Sound, Long Island Sound, San Francisco Bay, and others. Also included is the U.S.
shoreline directly along these bodies of water. Furthermore, the Great Lakes are included up to the interna-
tional boundary with Canada. Lastly, portions of inland waters are included where there is significant marine
activity. For example, Norfolk, VA, is a major inland port that serves ocean-bound vessels.
Inclusion of the Great Lakes is likely the geographic aspect of the ocean economy statistics that is the least
intuitive. The geographic scope for the prototype statistics stems from the Coastal Zone Management Act of
1972, which provided for NOAA management of coastal resources and included the Great Lakes. Economic
production of the Great Lakes tends to mimic economic production of the ocean, including international and
domestic water freight transportation, recreational fishing, beachgoing, and other coastal-based tourism.

5
Chart 1. Ocean Economy Defined Water Bodies and Coastline
Coastline
Water bodies
While the ocean economy is defined to include all U.S. oceans, marginal seas, and Great Lakes, there is also
ocean-related production that takes place away from this geographically defined area of the account. The full
scope of this account includes ocean-related production that falls into one of three categories, based on earli-
er research by NOAA (Colgan, 2013).
The first category relates to production from the waters that are geographically in-scope. Included in this
category is any production that takes place on the ocean or which receives essential inputs from the ocean.
This includes such activities as water freight transportation, offshore oil and gas extraction, and commercial
fishing.
The second category includes any production that, by necessity, takes place near the ocean. The ocean/coastal
relationship of these production activities are identified and measured by geographic location in a shore-adja-
cent zip code area. Within this category are such activities as coastal recreation and beach house rentals
The third category includes commodities purchased for use on the ocean, no matter where production takes
place. Some production that is captured in this category is for exclusive or predominate use on the ocean,
such as ship and boat building or marine navigation equipment. Other production in this category may be for
a variety of uses, such as foul-weather gear and diesel fuel, but only ocean-specific uses tied to the geographi-
cally relevant region are considered in scope for the ocean economy statistics.
6
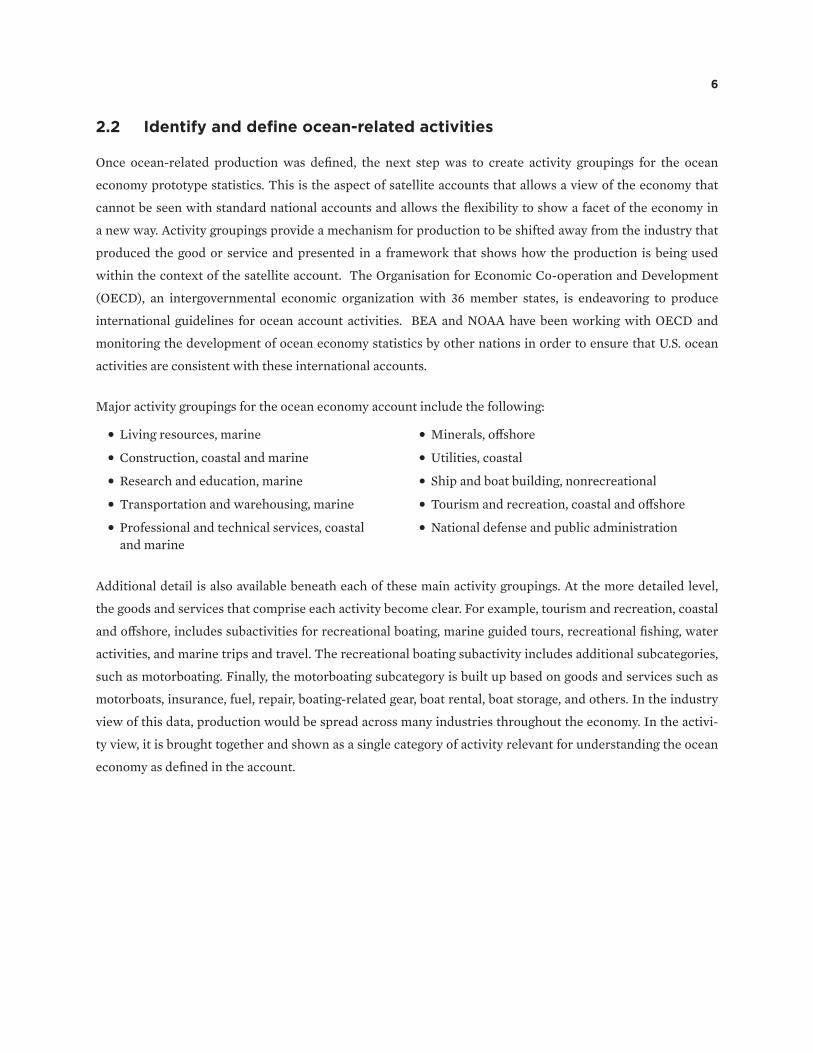
2.2 Identify and define ocean-related activities
Once ocean-related production was defined, the next step was to create activity groupings for the ocean
economy prototype statistics. This is the aspect of satellite accounts that allows a view of the economy that
cannot be seen with standard national accounts and allows the flexibility to show a facet of the economy in
a new way. Activity groupings provide a mechanism for production to be shifted away from the industry that
produced the good or service and presented in a framework that shows how the production is being used
within the context of the satellite account. The Organisation for Economic Co-operation and Development
(OECD), an intergovernmental economic organization with 36 member states, is endeavoring to produce
international guidelines for ocean account activities. BEA and NOAA have been working with OECD and
monitoring the development of ocean economy statistics by other nations in order to ensure that U.S. ocean
activities are consistent with these international accounts.
Major activity groupings for the ocean economy account include the following:
• • Living resources, marine
• • Construction, coastal and marine
• • Research and education, marine
• • Transportation and warehousing, marine
• • Professional and technical services, coastal and marine
• • Minerals, offshore
• • Utilities, coastal
• • Ship and boat building, nonrecreational
• • Tourism and recreation, coastal and offshore
• • National defense and public administration
Additional detail is also available beneath each of these main activity groupings. At the more detailed level,
the goods and services that comprise each activity become clear. For example, tourism and recreation, coastal
and offshore, includes subactivities for recreational boating, marine guided tours, recreational fishing, water
activities, and marine trips and travel. The recreational boating subactivity includes additional subcategories,
such as motorboating. Finally, the motorboating subcategory is built up based on goods and services such as
motorboats, insurance, fuel, repair, boating-related gear, boat rental, boat storage, and others. In the industry
view of this data, production would be spread across many industries throughout the economy. In the activi-
ty view, it is brought together and shown as a single category of activity relevant for understanding the ocean
economy as defined in the account.

7
2.3 Calculate ocean share of commodity output
BEA and NOAA researched the approximately 5,000 detailed commodities underlying the supply tables and
identified the specific goods and services that fell under the definition of the ocean economy. With the in-
scope commodities established, further work was done to ensure the inclusion of only the output that fell
under the geographic scope and three categories of ocean-related production outlined in section 1 of this
methodology. This share of in-scope commodity output to the ocean economy was estimated using various
government and nongovernment sources (see Appendix Table A) and applied to final demand categories or
intermediate inputs. Some commodities were fully in-scope to the account and could be directly identified in
the underlying detail of the BEA supply-use tables. In these cases, the entire value of commodity output was
fully allocated to the ocean economy statistics and additional outside information was not required. Deep-
sea water transportation is an example of this category of commodity. In other cases, only a portion of the
underlying commodity was relevant for the ocean economy, and additional data were required to identify the
marine component. Aquaculture is an example of this category of commodity. In this case, marine aquacul-
ture had to be separated from freshwater aquaculture, and data from NOAA’s Fisheries of the United States
was used to determine the correct percentage.
2.4 Identify ocean economy industries and prepare results
The supply-use tables were then used to determine which industries produced each of the relevant commod-
ities as either primary or secondary production. This allows for the calculation of ocean economy industry
gross output, which represents the total value of ocean-related domestic production in the U.S. economy.
Value added, compensation, and employment are derived from the relationship between the industry output
for the ocean and total industry output. This means the ratio of intermediate consumption relative to indus-
try output for the ocean is the same as the ratio of total industry intermediate consumption to total industry
output.

8
BEA Methodology for Estimating Supply-Use Tables
The supply-use tables are an integral and essential element of the U.S. economic accounts. First, they are
the building blocks for other economic accounts. Prominent among these are BEA’s National Income and
Product Accounts (NIPAs), which feature the estimates of expenditure-based GDP. Second, the supply-use
tables show how industries interact; specifically, they show how industries provide input to, and use output
from, each other to produce GDP. They are a complete, balanced set of economic statistics, and they present
a full accounting of industry and final-use transactions.
The core of the supply-use tables consists of two basic national-accounting tables—a “supply” table and a
“use” table. The supply table shows the commodities that are available for domestic consumption. The use
table reveals how the U.S. domestics supply is used, showing both the purchases of supply by industries as in-
termediate inputs to production and purchases of supply by consumers as final consumption or investment.
The use table also shows the value added produced by industry production. The use table is the most fre-
quently requested table because of its applications to the estimates of GDP.
BEA uses the North American Industry Classification System to classify industries. The United States,
Canada, and Mexico jointly developed this classification system with the aim of improving the comparabil-
ity of their economic statistics. NAICS classifies industries based on their production processes. The NAICS
codes comprise six digits, which reading from left to right, indicate the general sector down to a detailed
industry.
BEA prepares benchmark supply-use tables roughly every 5 years based on the highest quality source data,
most notably the U.S. Census Bureau’s Economic Censuses. Largely because of their detailed source data,
the benchmark supply-use tables are the most important statistical source of information for comprehen-
sive updates of the NIPAs and are widely used by other statistical agencies. BEA released the most recent
benchmark supply-use tables in November 2018. These accounts cover 2012 and use the 2012 NAICS for
classification
For information on the methodology for preparing the supply-use tables, see Jeffrey A. Young, Thomas F.
Howells III, Erich H. Strassner, and David B. Wasshausen, “Supply-Use Tables for the United States,” Survey
of Current Business 95 (September 2015).
9
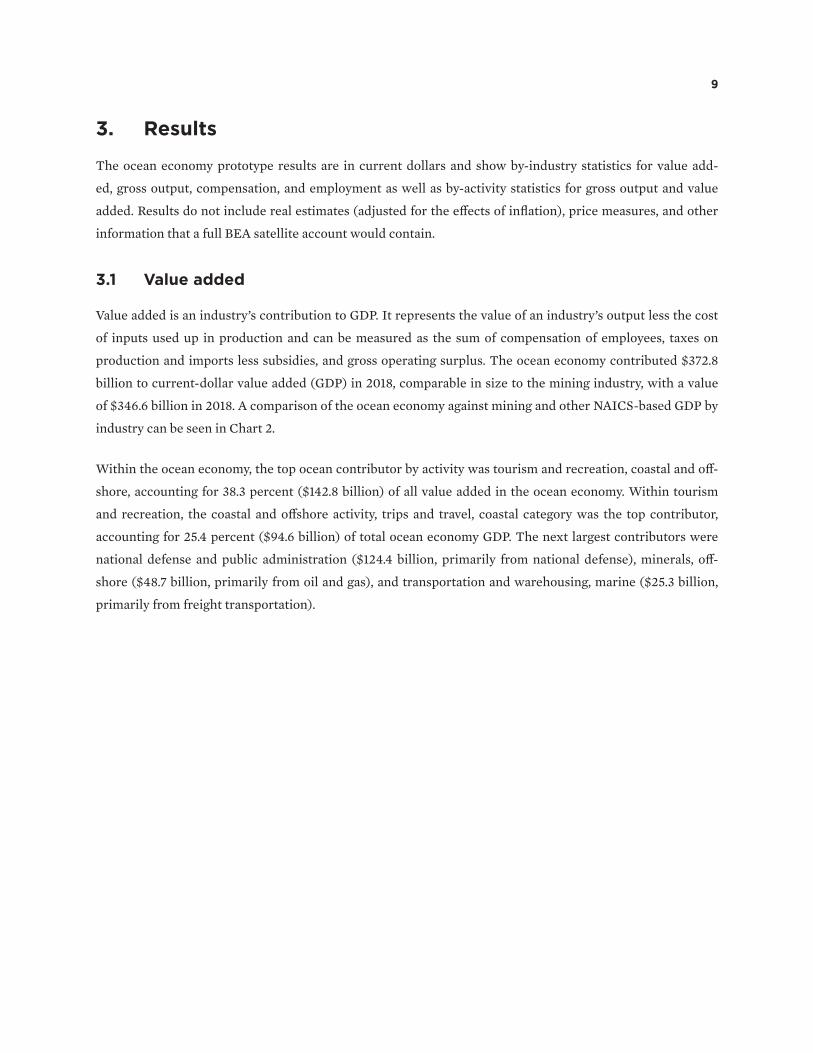
3. Results
The ocean economy prototype results are in current dollars and show by-industry statistics for value add-
ed, gross output, compensation, and employment as well as by-activity statistics for gross output and value
added. Results do not include real estimates (adjusted for the effects of inflation), price measures, and other
information that a full BEA satellite account would contain.
3.1 Value added
Value added is an industry’s contribution to GDP. It represents the value of an industry’s output less the cost
of inputs used up in production and can be measured as the sum of compensation of employees, taxes on
production and imports less subsidies, and gross operating surplus. The ocean economy contributed $372.8
billion to current-dollar value added (GDP) in 2018, comparable in size to the mining industry, with a value
of $346.6 billion in 2018. A comparison of the ocean economy against mining and other NAICS-based GDP by
industry can be seen in Chart 2.
Within the ocean economy, the top ocean contributor by activity was tourism and recreation, coastal and off-
shore, accounting for 38.3 percent ($142.8 billion) of all value added in the ocean economy. Within tourism
and recreation, the coastal and offshore activity, trips and travel, coastal category was the top contributor,
accounting for 25.4 percent ($94.6 billion) of total ocean economy GDP. The next largest contributors were
national defense and public administration ($124.4 billion, primarily from national defense), minerals, off-
shore ($48.7 billion, primarily from oil and gas), and transportation and warehousing, marine ($25.3 billion,
primarily from freight transportation).

10
0 2% 4% 6% 8% 10% 12% 14%
Agriculture, forestry, fishing, and hunting
Arts, entertainment, and recreation
Educational services
Utilities
Mining
Ocean economy
Management of companies and enterprises
Other services, except government
Accommodation and food services
Administrative and waste management services
Transportation and warehousing
Construction
Information
Retail trade
Wholesale trade
Health care and social assistance
Professional, scientific, and technical services
Finance and insurance
Manufacturing
Government
Real estate, rental, and leasing
Chart 2. Ocean Economy and Industry Share of Total Gross Domestic Product, 2018

11
Chart 3. Ocean Economy Value Added by Industry, 2018
Federal government
Mining
Transportationand warehousing
Manufacturing
Retail trade
Wholesale trade
Other
3.9%
5.3%
6.5%
9.4%
9.6%
11.0%14.5%
33.6%
6.2%
Finance, insurance, real estate, rental, and leasing
Arts, entertainment,recreation, accommodation,
and food services
3.2 Gross output
Gross output is the value of goods and services produced by the nation’s economy. It is principally a measure
of sales or receipts, including sales to final users (GDP) and sales to other industries (intermediate inputs).
Total gross output for the ocean economy was $617.2 billion in 2018. Notable contributors to ocean economy
gross output included national defense and public administration (consists primarily of U.S. Navy) at $178.1
billion; trips and travel, coastal at $132.5 billion; oil and gas extraction at $76.9 billion; and freight transporta-
tion at $31.8 billion.
Data Availability
The entire time series of ocean economy estimates (2014–2018) are available on the “Ocean Economy”
page on BEA’s website. Data include current-dollar data for value added, gross output, compensation, and
employment by industry. Data also include current-dollar data for value added and gross output by activity.

12
3.3 Employment and compensation
In 2018, the ocean economy supported 2.3 million jobs, which accounted for 1.5 percent of total U.S. em-
ployment. This was comparable to the real estate industry, which also supported 2.3 million jobs in 2018
(Chart 4). Of the 2.3 million workers in the ocean economy, 70 percent were employed in the private sec-
tor, with 83 percent of these private sector workers in the services sector. Within the private sector of the
ocean economy, food services and drinking places was the largest employer, with 269,000 full and part-time
equivalent workers. Other retail trade was also a major employer, with 202,000 workers. Accommodations
(194,000) and amusements, gambling, and recreation industries (191,000) were also among the top employers
in the ocean economy.
Compensation, which comprises total wages and benefits paid to employees, for the ocean economy was
$161.9 billion in 2018. National defense accounted for 42.7 percent ($69.2 billion) of all compensation. Other
notable industries were other transportation and support activities ($9.9 billion), other transportation equip-
ment ($6.9 billion), and food services and drinking places ($6.9 billion). Employees working in the ocean
economy earned $70,970 in average annual compensation, comparable to the $71,450 in average annual com-
pensation earned per worker for the total U.S. economy.

13
Chart 4. Ocean Economy and Industry Share of Total Employment, 2018
0 2% 4% 6% 8% 10% 12% 14% 16% 18%
Utilities
Mining
Agriculture, forestry, fishing, and hunting
Ocean economy
Real estate, rental, and leasing
Management of companies and enterprises
Arts, entertainment, and recreation
Information
Educational services
Transportation and warehousing
Wholesale trade
Finance and insurance
Other services, except government
Construction
Administrative and waste management services
Professional, scientific, and technical services
Manufacturing
Accommodation and food services
Retail trade
Health care and social assistance
Government

14
3.4 Areas for future study
The ocean economy prototype statistics provide an important first look at the impact of the ocean economy
on the overall U.S. economy. In addition, the publication of these prototype results provides an opportuni-
ty for stakeholders to review and provide feedback on the methodology that underlies the statistics and the
presentation of the results. This feedback will be considered during future efforts to improve and refine the
estimates.
Possible future enhancements currently under consideration include the addition of real (inflation-adjusted)
estimates, price measures, measures of direct and indirect effects on the economy, and regional estimates that
could include state-level statistics.
One area that BEA has already begun developing is the measurement of “blue technology” estimates. Blue
technology is broadly defined by NOAA as any item that is engaged in providing technology and services de-
signed for use in the ocean environment (Goodhue and Ertis 2018), including, but not limited to, electronic
and mechanical technologies and software used in marine navigation, oceanographic data collection and sci-
entific endeavors, and ship and boat building. This view of the ocean economy would show blue technology
separately from nonblue technology and would highlight some of the innovations being developed for ma-
rine environments and their contributions to the overall ocean economy. BEA will work closely with NOAA
to better define blue technology in the ocean economy as well as to refine the results of blue technology by
ocean activities. One challenge is that many blue technology products are intermediate inputs into other
ocean activities, such as new ship and boat building materials or new software for navigational equipment
onboard ships. Work is ongoing to develop a methodology that will allow the role of these blue technology
inputs to be accurately measured without double-counting their value as embedded inputs in other ocean
economy outputs. A promising avenue of research currently under investigation is the use of input-output
modelling that allows better identification of the portions of the ocean economy supply chain that are blue
technology in order to separate them out from other activities in the supply chain.
15
4. Request for Feedback
BEA would like input from users to refine these estimates and further the effort to develop a comprehensive
Ocean Economy Satellite Account. Please email all comments to [email protected]. BEA is requesting
feedback on the following questions:
1. Does the definition used by BEA accurately represent the ocean, coastal, and Great Lakes economy?
2. What goods and services not captured in the current definition of the ocean economy should BEA
consider in scope for the Ocean Economy Satellite Account? Are there goods and services currently
included in the definition that should not be included?
3. What datasets could BEA use to estimate shares of goods and services that are only partially in
scope?
4. Who would use these new statistics and what would they use them for (please provide specific
examples)?
5. Beyond statistics on value added, output, employment, and compensation, what other types of ocean
economy statistics would be useful?
6. Why are these new statistics needed? What benefits would flow to users from BEA-produced
statistics in this area that they couldn’t get elsewhere?

16
5. Tables
Table A. External Data Sources
External Data Sources
U.S. Army Corps of Engineers Analysis of Dredging Costs, Study of Developed Shoreline Master Database
NOAA Habitat Restoration Expenditures
NOAA Chesapeake Bay Program Expenditures
U.S. Army Corps of Engineers Everglades Restoration Budget
Coastal Wetlands Planning, Protection and Restoration Act Expenditures
Energy Information Administration, Annual Electric Generation by Facility
Department of Defense Budget
Federal Ocean and Coastal Activities Report (FOCAR)
NOAA Commercial Fisheries Landing Statistics, Fisheries of the United States
Department of Agriculture, Census of Aquaculture
Seattle Genetics 2016 Annual Report
Jazz Pharmaceuticals 2016 Annual Report
Baker Hughes North America Rig Count, Average Day Rates for Offshore vs Onshore Drilling
Bureau of Labor Statistics, Quarterly Census of Employment and Wages
National Marine Manufacturing Association, Recreational Boating Statistical Abstract
U.S. Coast Guard Boat Registration by State
Department of Transportation, Freight Analysis Framework
Bureau of Economic Analysis, Outdoor Recreational Satellite Account
DK Shifflet and Associates Demand for Travel Commodities by Type of Visitor
International Trade Administration, Survey of International Air Travelers
Census Bureau Service Annual Survey
Census Bureau ZIP Codes Business Patterns
National Association of Realtors

17
Table B. Items Used by Activity
Items Used by Activity
Construction, coastal and marine
Conservation and development facilities maintenance and repair construction – federal
Conservation and development facilities maintenance and repair construction – state and local
Federal nonresidential maintenance and repair construction
Highways and streets – private
New amusement and recreational structures – federal
New amusement and recreational structures – private
New amusement and recreational structures – state and local
New conservation and development structures – federal
New conservation and development structures – state and local
New other educational structures, including museums and libraries – private
New other educational structures, including museums and libraries – state and local
Private nonresidential maintenance and repair construction
State and local nonresidential maintenance and repair construction
National defense and public administration
Complete passenger vehicles, knockdown or assembled, passenger car chassis, etc.
Federal defense government services
Federal nondefense government services
State and local agriculture and natural resources
State and local other general government services
State and local parks and recreation
State and local police government services
State and local sanitation government services
Trucks, truck tractors, and bus chassis 14k lb. or less, including vans, minivans, SUVs
U.S. Coast Guard, Navy, and Marine auxiliary controls and accessories
Living resources, marine
Animal and marine feed and fertilizer byproducts, nsk
Beef cattle complete feed, supplements, concentrates, and premixes
Cancer therapy products, including anti-neoplastic agents and radioactive isotopes.
Canned and cured fish and other seafoods, including soup (except frozen seafoods)
Chicken and turkey and other poultry feed, supplements, concentrates, and premixes
Commercial fishing
Custom mixed animal feeds
Fresh and frozen seafood processing, nsk, total
Animal food manufacturing
Internal analgesics and antipyretics, both narcotic and non-narcotic
Other animal food manufacturing inventory change
Other animal food manufacturing other miscellaneous receipts
Other animal food manufacturing value of resales
Other livestock complete feed, feed supplements, concentrates, and premixes
Other pharmaceutical preparations affecting neoplasms, the endocrine system, and metabolic, for human use
Other poultry and livestock feed, nsk
Other prepared animal feeds, including feeding materials and adjuncts, nsk
Own account scientific research and development (taxable) pharmaceuticals and manufacturing
table continues on next page

18
Items Used by Activity
Pharmaceutical preparations, affecting neoplasms, the endocrine system, and metabolic diseases, for human use, nsk
Prepared feeds, nec, nsk, total
Prepared fresh fish and other fresh seafood
Prepared frozen fish, shellfish, and other prepared frozen seafoods, nec
Seafood product preparation and packaging inventory change
Seafood product preparation and packaging other miscellaneous receipts
Specialty bird and fish feed, other specialty pet, except dog and cat, food and other specialty feed
Swine complete feed, supplements, concentrates, and premixes
Minerals, offshore
All other oil and gas field services – construction
Construction sand and gravel
Construction sand and gravel mining inventory change
Construction sand and gravel mining other miscellaneous receipts
Crude petroleum and natural gas extraction inventory change
Crude petroleum and natural gas extraction other miscellaneous receipts
Crude petroleum and natural gas, nsk
Crude petroleum, including lease condens. (vols. corrected to 60 deg. F) shipped
Drilling, spudding, or tailing oil, gas, dry, or service wells – construction
Industrial sand mining inventory change
Industrial sand, nsk, total
Mining and oil and gas field machinery manufacturing inventory change
Natural gas
Oil and gas field exploration services
Oil and gas field machinery and equipment manufacturing, nsk, total
Oil and gas field production machinery and equipment (except pumps) (except parts)
Oil and gas field production machinery and equipment (except pumps), nsk
Oil and gas field derricks/substructures/accessories
Oil-well and oil-field pumps, except boiler feed (including the value of the driver if shipped as a complete unit)
Other industrial sand
Other oil and gas field drilling machinery and equipment, except parts
Portable drilling rigs used on the surface (above ground)
Rotary oil and gas field drilling machinery and equipment, nsk
Support activities for oil and gas operations inventory change
Professional and technical services, marine
General interest periodicals – subscriptions and sales
General reference books, all media except on-line publishing
Internet publishing and broadcasting – subscriptions and sales
Other periodicals – subscriptions and sales
Research and education, marine
All other laboratory receipts
All other miscellaneous schools and instruction (taxable)
Apprenticeship training schools (taxable)
Educational support services (taxable)
Expenses of apprenticeship training schools (tax exempt)
table continues on next page

19
Items Used by Activity
Expenses of educational support services (tax exempt)
Expenses of miscellaneous schools and instruction (tax exempt)
Expenses of other technical and trade schools (tax exempt)
Expenses of professional and management development schools (tax exempt)
Licensing of rights to use intellectual property of all other miscellaneous schools and instruction (taxable)
Licensing of rights to use intellectual property of educational support services (taxable)
Licensing of rights to use intellectual property of professional and management development schools (taxable)
Other technical and trade schools (taxable)
Outright sale of original works of intellectual property all other miscellaneous schools and instruction (taxable)
Outright sale of original works of intellectual property educational support services (taxable)
Outright sale of original works of intellectual property professional and management development schools (taxable)
Own account academic scientific research and development (tax exempt) state and local government
Own account scientific research and development (tax exempt) Federal government defense
Own account scientific research and development (tax exempt) Federal government non-defense
Professional and management development schools (taxable)
Tax exempt receipts from sales of apprenticeship training schools (tax exempt)
Tax exempt receipts from sales of educational support services (tax exempt)
Tax exempt receipts from sales of miscellaneous schools and instruction (tax exempt)
Tax exempt receipts from sales of other technical and trade schools (tax exempt)
Tax exempt receipts from sales of professional and management development schools (tax exempt)
Testing laboratories
Ship and boat building and repair, nonrecreational
Boat building inventory change
Boat building other miscellaneous receipts
Boat building, nsk, total
Hovercraft
Inboard cabin cruisers, including commercial and military (except sailboats and lifeboats)
Inboard motorboats, including commercial and military (except sailboats and lifeboats), nsk
Military self-propelled ships (including combat ships, troop transport vessels, fleet auxiliaries, and service craft), new construction
Nonmilitary self-propelled ferryboats, new construction
Nonpropelled ships, new construction
Other inboard motorboats (including houseboats)
Other nonmilitary ships (including container and trailer ships, dry bulk carriers, and tankers)
Outboard motorboats, including commercial and military (except sailboats and lifeboats)
Sailboats, all sizes (excluding military and commercial)
Self-propelled nonmilitary commercial fishing trawlers and vessels, tugboats, and support vessels for offshore drilling and mining
Self-propelled ships, nonmilitary, new construction, nsk
Ship building and repairing inventory change
Ship building and repairing other miscellaneous receipts
Tourism and recreation, coastal and offshore
Air transportation, passenger transportation – domestic
Air transportation, passenger transportation – international
Alarm clocks, household clocks, household timing mechanisms
table continues on next page
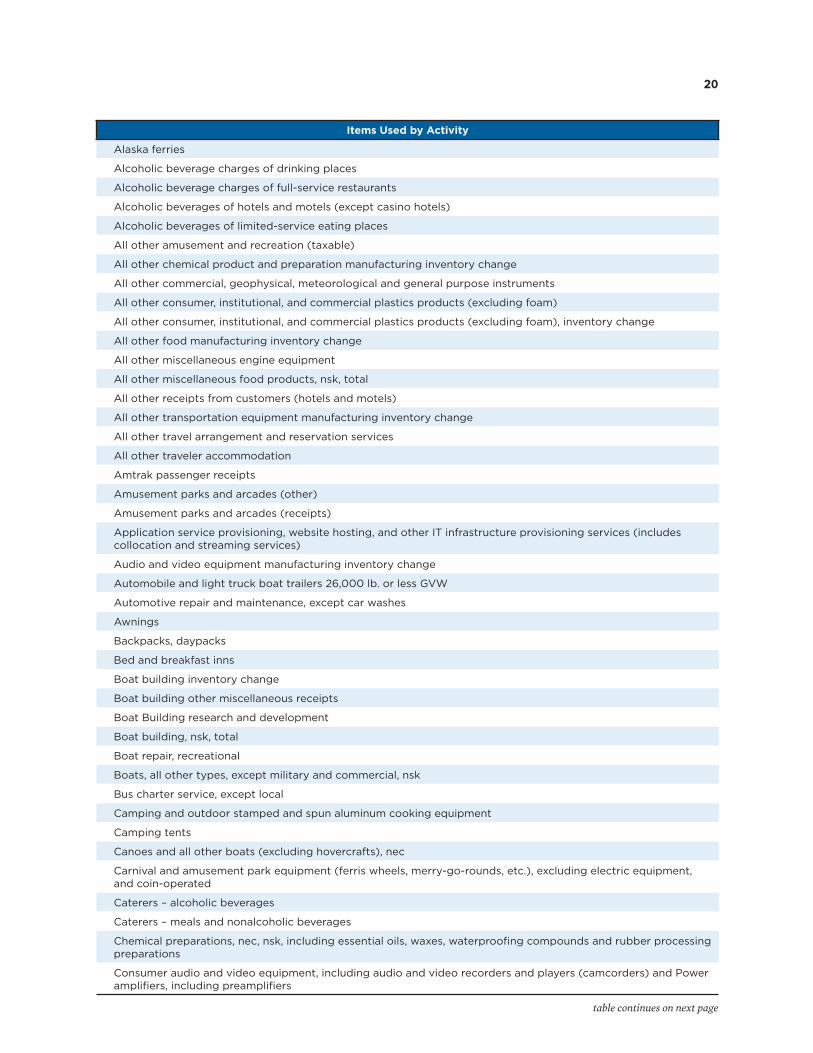
20
Items Used by Activity
Alaska ferries
Alcoholic beverage charges of drinking places
Alcoholic beverage charges of full-service restaurants
Alcoholic beverages of hotels and motels (except casino hotels)
Alcoholic beverages of limited-service eating places
All other amusement and recreation (taxable)
All other chemical product and preparation manufacturing inventory change
All other commercial, geophysical, meteorological and general purpose instruments
All other consumer, institutional, and commercial plastics products (excluding foam)
All other consumer, institutional, and commercial plastics products (excluding foam), inventory change
All other food manufacturing inventory change
All other miscellaneous engine equipment
All other miscellaneous food products, nsk, total
All other receipts from customers (hotels and motels)
All other transportation equipment manufacturing inventory change
All other travel arrangement and reservation services
All other traveler accommodation
Amtrak passenger receipts
Amusement parks and arcades (other)
Amusement parks and arcades (receipts)
Application service provisioning, website hosting, and other IT infrastructure provisioning services (includes collocation and streaming services)
Audio and video equipment manufacturing inventory change
Automobile and light truck boat trailers 26,000 lb. or less GVW
Automotive repair and maintenance, except car washes
Awnings
Backpacks, daypacks
Bed and breakfast inns
Boat building inventory change
Boat building other miscellaneous receipts
Boat Building research and development
Boat building, nsk, total
Boat repair, recreational
Boats, all other types, except military and commercial, nsk
Bus charter service, except local
Camping and outdoor stamped and spun aluminum cooking equipment
Camping tents
Canoes and all other boats (excluding hovercrafts), nec
Carnival and amusement park equipment (ferris wheels, merry-go-rounds, etc.), excluding electric equipment, and coin-operated
Caterers – alcoholic beverages
Caterers – meals and nonalcoholic beverages
Chemical preparations, nec, nsk, including essential oils, waxes, waterproofing compounds and rubber processing preparations
Consumer audio and video equipment, including audio and video recorders and players (camcorders) and Power amplifiers, including preamplifiers
table continues on next page

21
Items Used by Activity
Convention and visitor bureaus
Creams, lotions, and oils, excluding shaving, hair, and deodorant
Cultural institutions – expenses
Cultural institutions – tax exempt receipts
Cultural institutions (taxable)
Cutlery, kitchen utensil, pot and pan manufacturing inventory change
Diesel, semidiesel, and dual-fuel engines (except automobile, highway truck, bus, and tank)
Digital cameras
Digital cameras, inventory change
Dried and dehydrated fruits (including freeze-dried)
Dried and dehydrated fruits, vegetables, and soups, nsk
Dried and dehydrated vegetables (including freeze-dried)
Expenses of sports and recreation instruction schools (tax exempt)
Eye and face protection equipment, inventory change
Eye and face protection equipment, including face shields, masks, and welding helmets
Fabricated sleeping bags
First aid, snake bite, and burn kits, including household and industrial kits
Fishing line and fish netting, commercial and recreational, manmade fiber
Fishing tackle and equipment
Food contractors – alcoholic beverages
Food services and drinking places (residual)
Fruit and vegetable canning, pickling, and drying inventory change
Guestroom or unit rentals of hotels and motels
Hand and edge tool manufacturing, nsk, total
Hand tool and saw blade manufacturing inventory change
Hand-operated hacksaws
Hosiery and sock mills inventory change
Household and institutional pesticides and chemicals
Household and institutional pesticides and chemicals, inventory change
Household cooking appliance manufacturing inventory change
Inboard cabin cruisers, including commercial and military (except sailboats and lifeboats)
Inboard motorboats, including commercial and military (except sailboats and lifeboats), nsk
Inboard runabouts
Inboard-outdrive boats, including commercial and military (except sailboat and lifeboat), nsk
Inboard-outdrive houseboats
Inboard-outdrive runabouts, fish boats, and other inboard-outdrive boats, etc.
Incandescent hand portable lighting equipment
Inland marine insurance (property and casualty)
Interurban and rural bus transportation
Kerosene, except jet fuel
Lighting fixture manufacturing inventory change
Limousine services
Loan origination fees and other fees on all other consumer loans of depository credit intermediation
Local charter bus service
Marine hardware (including shackles, rope sockets, tackle blocks, wire rope clips, clamps, and joiner hardware)
table continues on next page

22
Items Used by Activity
Marine paints, ship yacht and pleasure craft, new construction, refinish, and maintenance and off- shore facilities and shelf goods for both new construction and marine refinish and maintenance, excludes spar varnish
Meal and nonalcoholic beverage charges of full-service restaurants
Meals and non-alcoholic beverages at hotels/motels
Meals and nonalcoholic beverages of drinking places
Meals and nonalcoholic beverages of limited-service eating places
Men’s and women’s socks and hosiery
Men’s and boys’ cut and sew apparel manufacturing inventory change
Men’s and boys’ garments, >=50% plastic or rubber, including raincoats and rubber pants (except wet suits)
Mobile food services – food
Motor gasoline, including finished base stocks and blending agents
Municipal parking facilities
Nonelectric lighting fixtures and equipment, including lamps and lanterns using kerosene, gasoline, propane, butane, etc.
Nonfarm rents paid - residential owner occupied permanent site
Nonfarm residential rents paid – tenant occupied permanent site
Nonfarm residential rents paid – tenant occupied permanent site – rental of durables
Non-margin retail trade, gift, novelty, and souvenir stores
Nonmilitary self-propelled yachts, 65 feet or more in length (requires a professional crew as specified by the Coast Guard)
Nonupholstered wood household furniture manufacturing inventory change
Other footwear manufacturing
Other hand tools, (excluding edge tools) and screw jacks
Other hosiery and socks, nsk, inventory change
Other hosiery and socks, nsk, total
Other household nonupholstered furniture inventory change
Other inboard motorboats (including houseboats)
Other men’s and boys’ cut and sew outerwear
Other miscellaneous transportation equipment manufacturing, nsk, total
Other nonelectric toys, including parts
Other personal safety equipment, including life preservers (buoys, jackets, and vests) (except cork life preservers)
Other polyurethane foam products, including medical, clothing, fillers, diapers
Other purchased products packaged with dried and dehydrated ingredients
Other revenue of real estate agents and managers
Other stamped and spun stainless steel cooking and kitchen utensils, including commercial, hospital, and outdoor cooking
Other tents, including air supported structures and tension structures
Other transit and ground passenger transportation services
Other water sports equipment, inventory change
Other water sports equipment, excluding cameras, watches, shoes, and apparel
Other women’s and girls’ cut and sew outerwear
Outboard motorboats, including commercial and military (except sailboats and lifeboats)
Outdoor lighting equipment (including parts and accessories)
Parking lots and garages
Participant sports (taxable)
Participant sports expenses (tax-exempt)
table continues on next page

23
Items Used by Activity
Participant sports tax-exempt receipts
Parts and accessories other cooking equipment (sold separately)
Parts for automobile and light truck trailers and other transportation equipment
Passenger car rental (including vans and SUVs)
Petroleum refineries inventory change
Photographic and photocopying equipment manufacturing inventory change
Photographic and photocopying equipment manufacturing, nsk, total
Piston-type natural gas engines, including LPG (liquefied petroleum gas) engines (excluding gas turbines)
Porch, lawn, beach, and similar wood outdoor furniture
Porch, lawn, outdoor, and casual furniture, metal
Private passenger auto insurance (property and casualty)
Property management
Railroad transportation, passenger
Railroads, dining car receipts
Railroads, tips
Receipts of food contractors for meals and nonalcoholic beverages
Recreational and vacation camps
Recreational goods and equipment rental
Recreational vehicle parks and campgrounds
Rental and leasing of equipment at participant sports centers (taxable)
Rental of public rooms (e.g., conference/convention meeting rooms) of hotels and motels for short-term business use
Rental of public rooms (e.g., conference/convention meeting rooms) of hotels and motels for short-term social use
Retail trade margin, gift, novelty, and souvenir stores
Rope, cordage, and twine, nsk, total
Rope, cordage, twine, tire cord, and tire fabric mills inventory change
Rubber and plastics footwear
Sailboats, all sizes (excluding military and commercial)
Sails
Scenic and sightseeing transportation, land
Scenic and sightseeing transportation, other
Scenic and sightseeing transportation, water
Search, detection, navigation, and guidance systems
Search, detection, navigation, guidance, aeronautical, and nautical system and instrument manufacturing inventory change
Ship repair, nonmilitary
Sports and recreation instruction (taxable)
State and local government highway toll revenues
State and local government passenger transit
Still cameras (hand-type cameras, process cameras for photoengraving and photolithography, and other still cameras)
Tarpaulins and other covers
Tarpaulins and other covers, inventory change
Tax exempt receipts from sales of sports and recreation instruction schools (tax exempt)
Taxicab Services which include taxi dispatchers
Tinware (including household, commercial, hospital, and outdoor cooking equipment)
table continues on next page

24
Items Used by Activity
Tips for meal and nonalcoholic beverage charges of drinking places
Tips for meal and nonalcoholic beverage charges of hotels and motels (except casino hotels)
Tips for meal and nonalcoholic beverage charges of limited-service eating places
Tips for meal and nonalcoholic beverage service of full-service restaurant
Tips on alcoholic beverage service of drinking places
Tips on alcoholic beverages of full-service restaurants
Tips on alcoholic beverages of hotels and motels
Tips on alcoholic beverages of limited-services eating places
Toilet preparation manufacturing inventory change
Tour operators
Towels and washcloths
Transportation equipment, nec, including all-terrain vehicles, nsk
Travel agencies
Travelers’ insurance (property and casualty)
Truck rental
Urban transit systems
Urethane and other foam product (except polystyrene) manufacturing inventory change
Used pleasure boats
Used sporting goods
Utility trailer and RV rental
Vacuum and insulated bottles, jugs, and chests (except those made principally of foam plastics) and other sheet metal
Vacuum and insulated bottles, jugs, and chests (except those made principally of foam plastics) and other sheet metal, inventory change
Watch, clock, and parts manufacturing inventory change
Watchcases, movements and modules (including watch parts)
Watches
Water sports equipment
Women’s and girls’ cut and sew apparel manufacturing inventory change
Women’s and girls’ garments, >=50% plastic or rubber, including raincoats and rubber pants (except wet suits)
Transportation and warehousing, marine
Farm product warehousing and storage
Freight forwarding
General warehousing and storage
International freight, water
Marine cargo handling
Navigational services to shipping
Other support activities for water transportation
Port and harbor operations
Refrigerated warehousing and storage
Water freight, margin
Water passenger transportation, Coastal and Great Lakes
Water passenger transportation, deep sea
Utilities, coastal
Electric power generation

25
References
Goodhue, Charles, and Dan Ertis. 2018. “Defining and Measuring the Blue Technology Sector in the Ocean
Economy Satellite Account.” Eastern Research Group, August.
Colgan, Charles S. 2013. “The Ocean Economy of the United States: Measurement, Distribution, & Trends.”
Ocean & Coastal Management 71: 334–343.
Horowitz , Karen J., and Mark A. Planting. 2009. Concepts and Methods of the U.S. Input-Output Accounts.
Washington, DC: Bureau of Economic Analysis.
Organisation for Economic Co-operation and Development. 2016. The Ocean Economy in 2030.
Paris, France: OECD Publishing; 46–47, 164–165.
Acknowledgments
From the Bureau of Economic Analysis: Erich H. Strassner, Associate Director for National Economic
Accounts, Thomas F. Howells III, Chief of the Industry Economics Division (IED), and Edward T. Morgan,
Deputy Chief of IED, supervised the preparation of the estimates. Matthew E. Calby, Section Chief for Macro
Analysis Branch, and Andrew J. Pinard and Phillip J. Sporrer of the Input-Output Statistics Branch managed
the economic information systems used to produce and review the statistics. Taylor M. Grant and Lonna R.
Morrow provided analysis.
From the National Oceanic and Atmospheric Administration: Monica Grasso and Kate Quigley provided
senior technical oversight of NOAA staff and external researchers who developed inputs for use in the
OESA; Jennifer Zhuang and Jeffery Adkins, who conducted extensive research and analysis; and Doug
Lipton, Rita Curtis, and Michael Rubino helped with the development of fisheries statistics.
Charles Colgan (Center for the Blue Economy) and Charles Goodhue (Easter Research Group) provided
contract support on information gathering and consultation.