Embed Size (px)
Citation preview
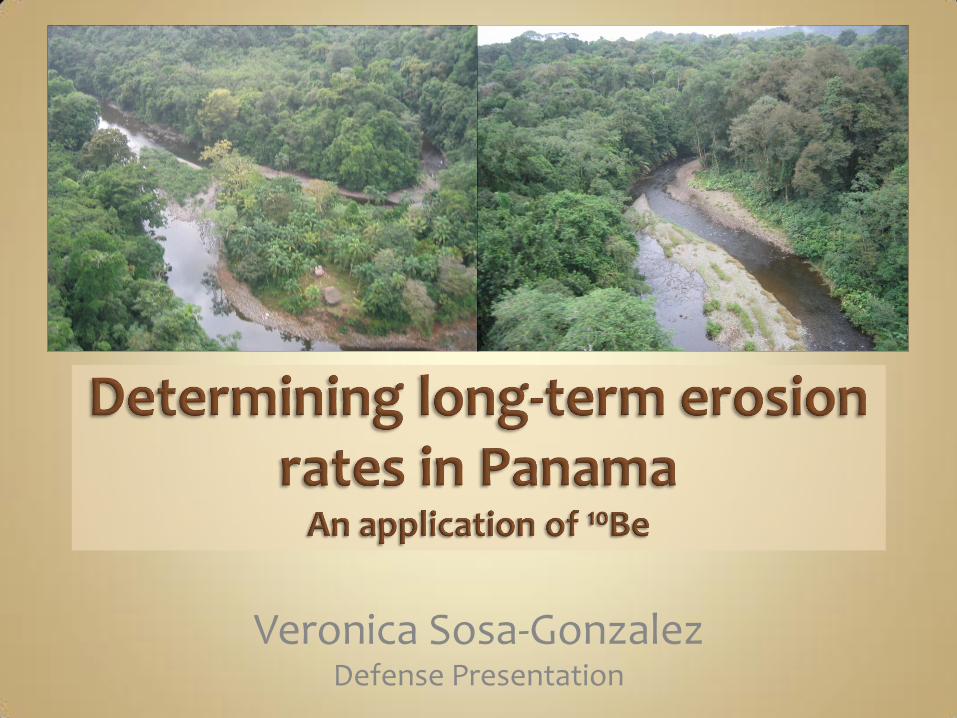
Veronica Sosa-Gonzalez Defense Presentation
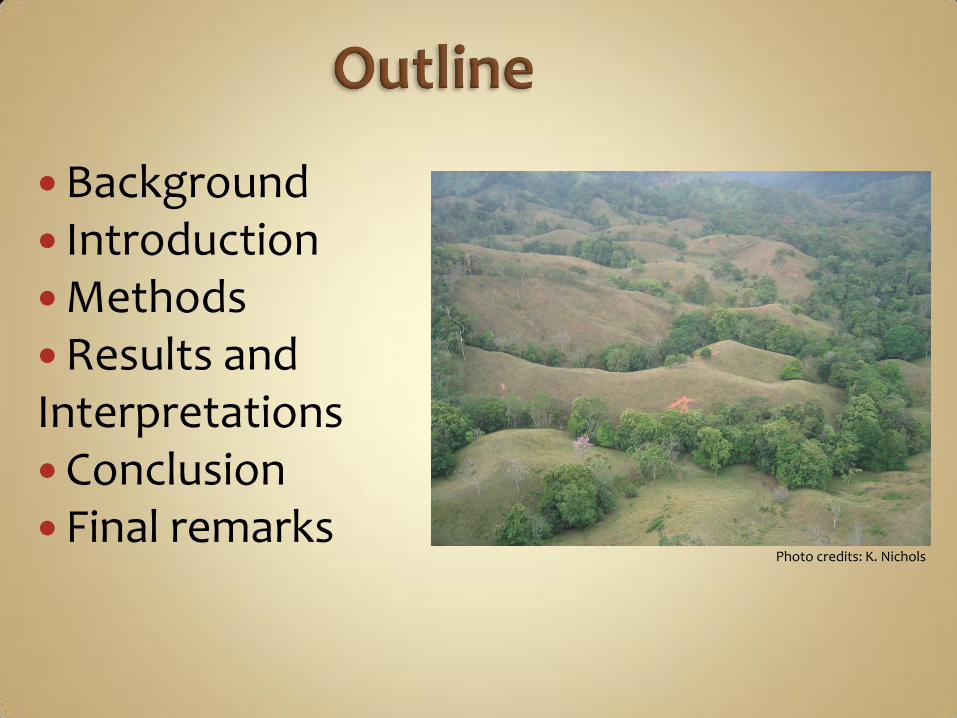
Background Introduction Methods Results and Interpretations Conclusion Final remarks
Photo credits: K. Nichols
Determine long-term erosion rates in Panama, using 10Be measured in river sediments
Effect of physiographic controls on erosion
Assess sediment delivery to rivers by landslide events, by way of grain-size analysis
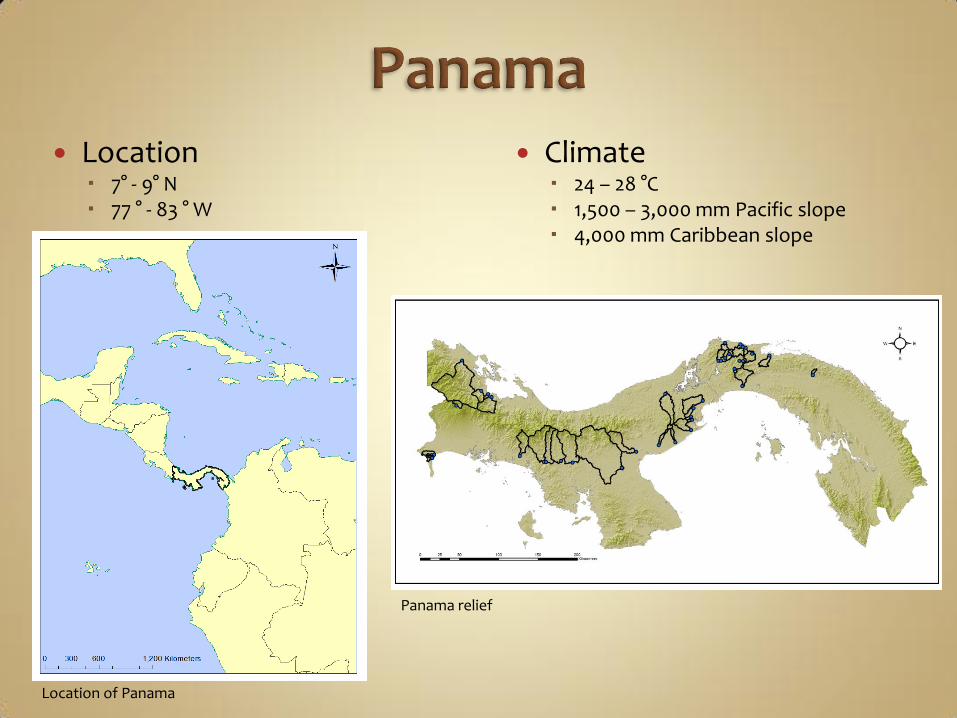
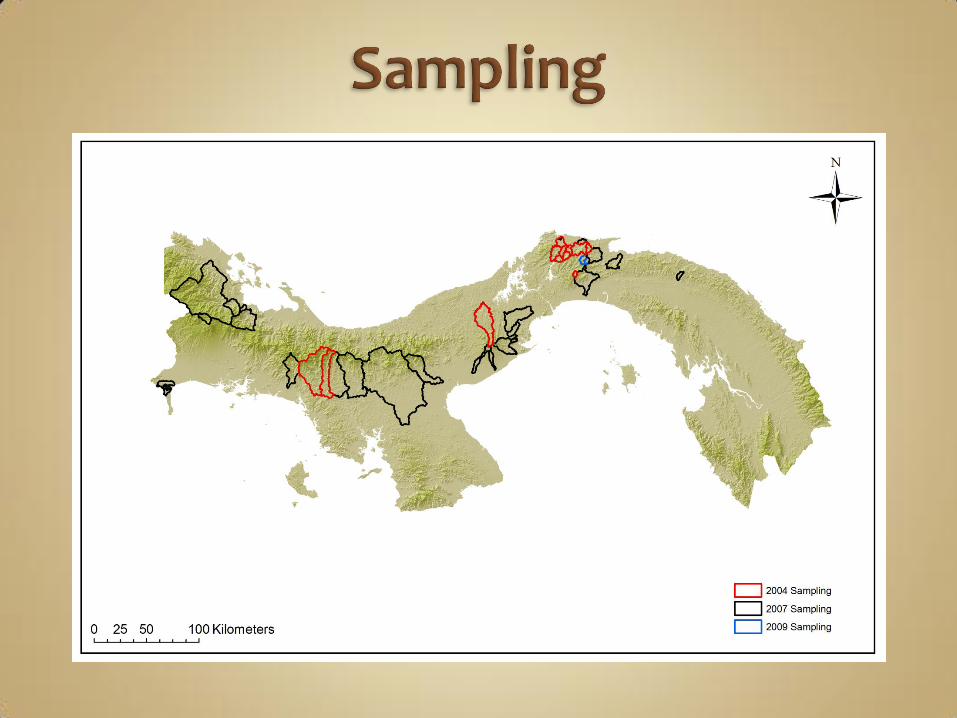
Location 7° - 9° N 77 ° - 83 ° W
Climate 24 – 28 °C 1,500 – 3,000 mm Pacific slope 4,000 mm Caribbean slope
Panama relief
Location of Panama
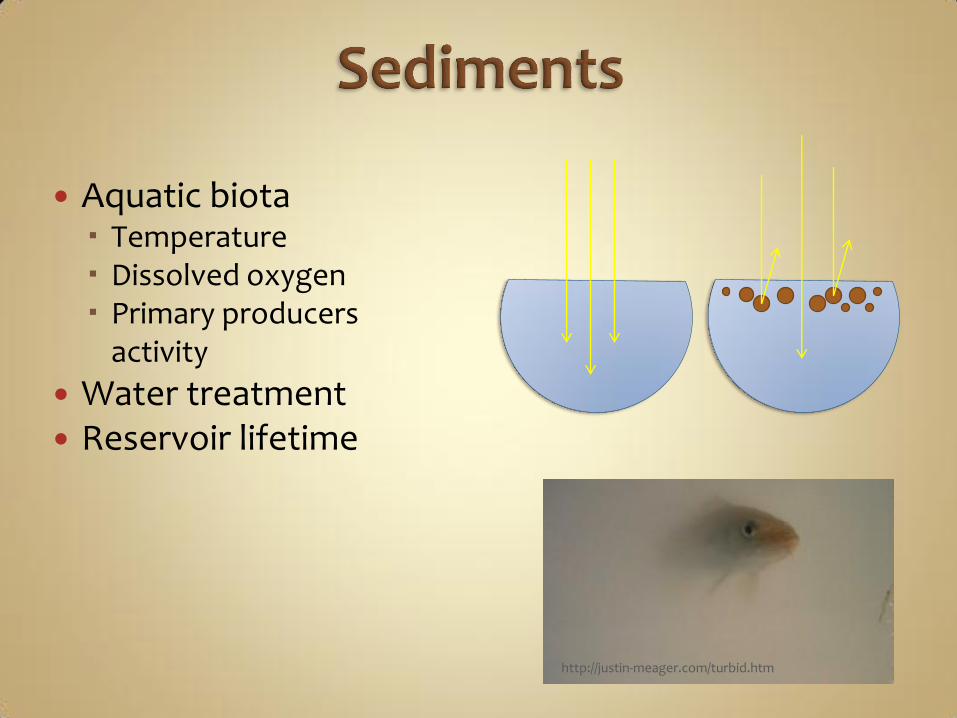
Aquatic biota Temperature Dissolved oxygen Primary producers
activity
Water treatment Reservoir lifetime
http://justin-meager.com/turbid.htm
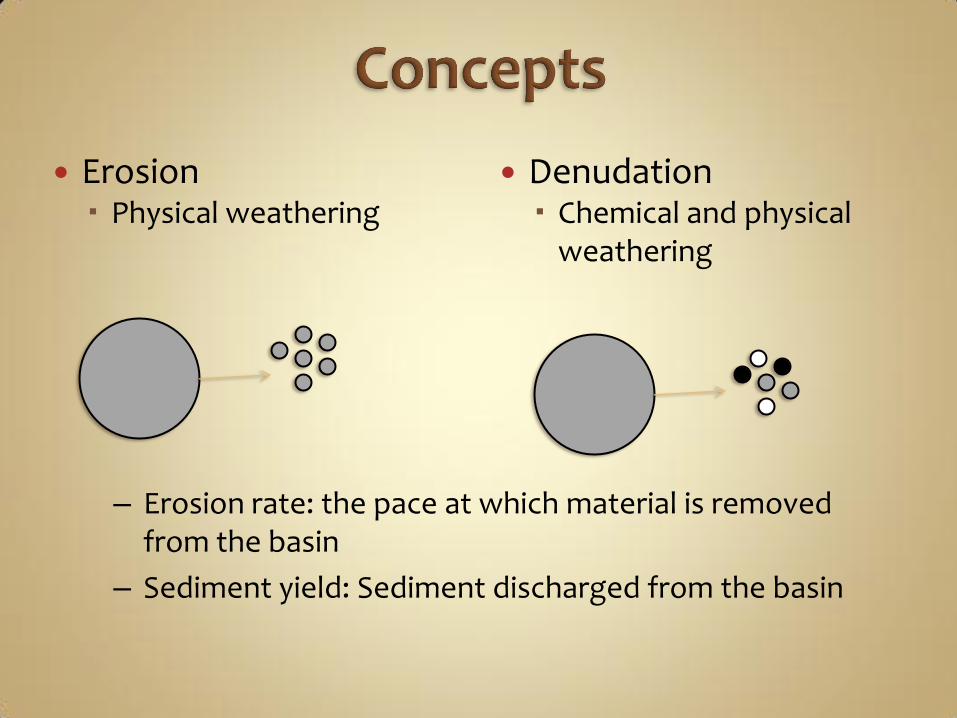
Denudation Chemical and physical
weathering
Erosion Physical weathering
– Erosion rate: the pace at which material is removed from the basin
– Sediment yield: Sediment discharged from the basin
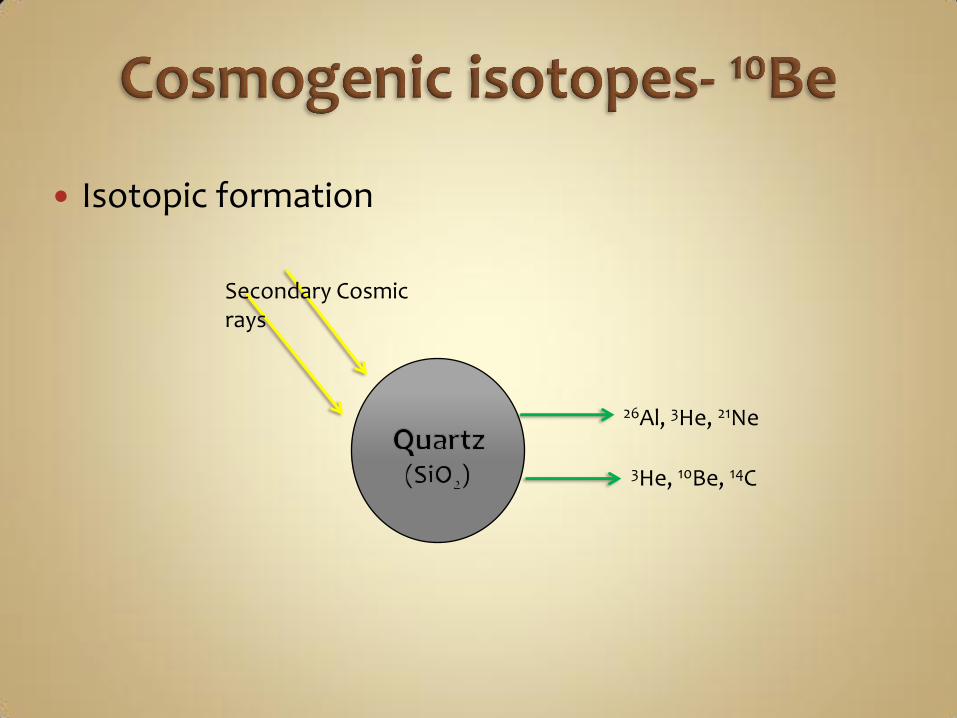
Isotopic formation
3He, 10Be, 14C
26Al, 3He, 21Ne
Secondary Cosmic rays
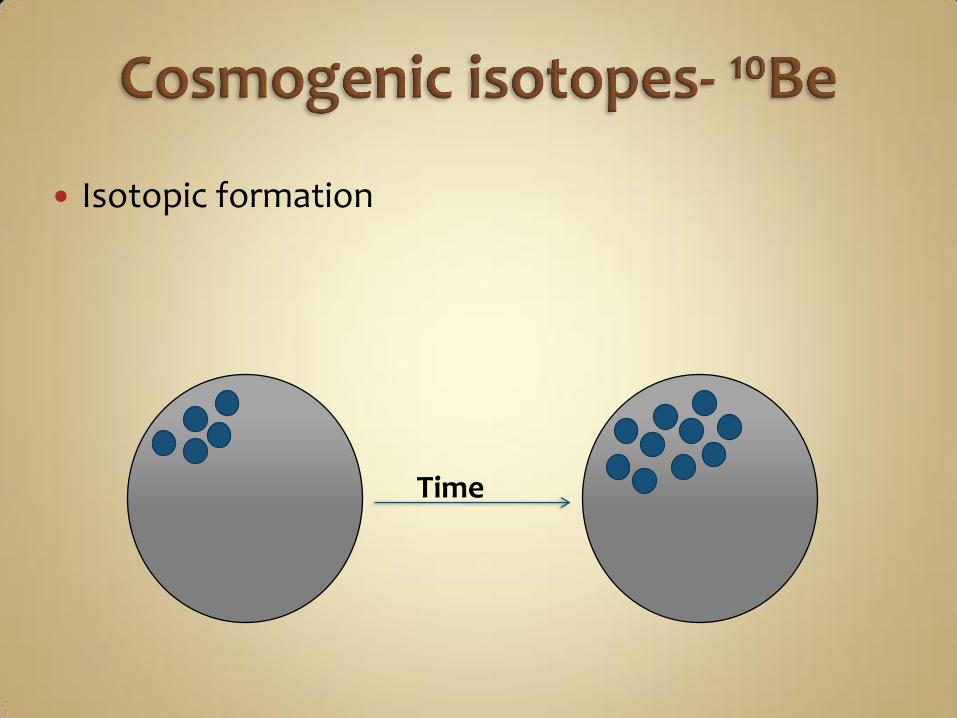
Isotopic formation
Time
Benefits of the method Integrate enough time to even out extremes Serves as benchmarks
Assumes steady state Depends on quartz distribution in the watershed’s bedrock

Grinding Quartz
Isolation
10Be extraction
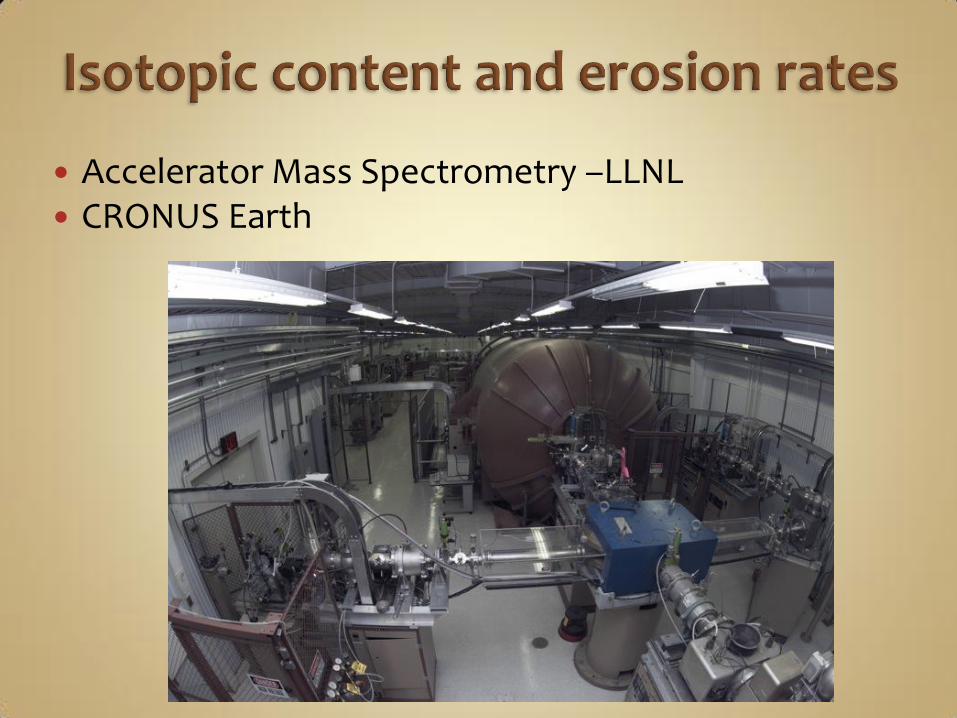
Accelerator Mass Spectrometry –LLNL CRONUS Earth
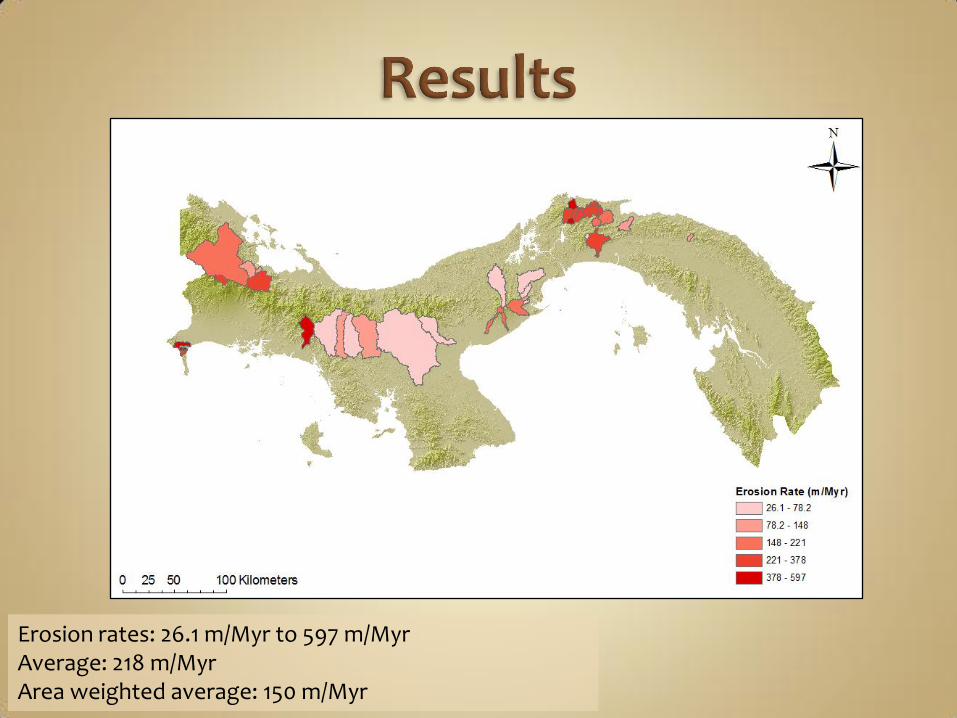
Erosion rates: 26.1 m/Myr to 597 m/Myr Average: 218 m/Myr Area weighted average: 150 m/Myr
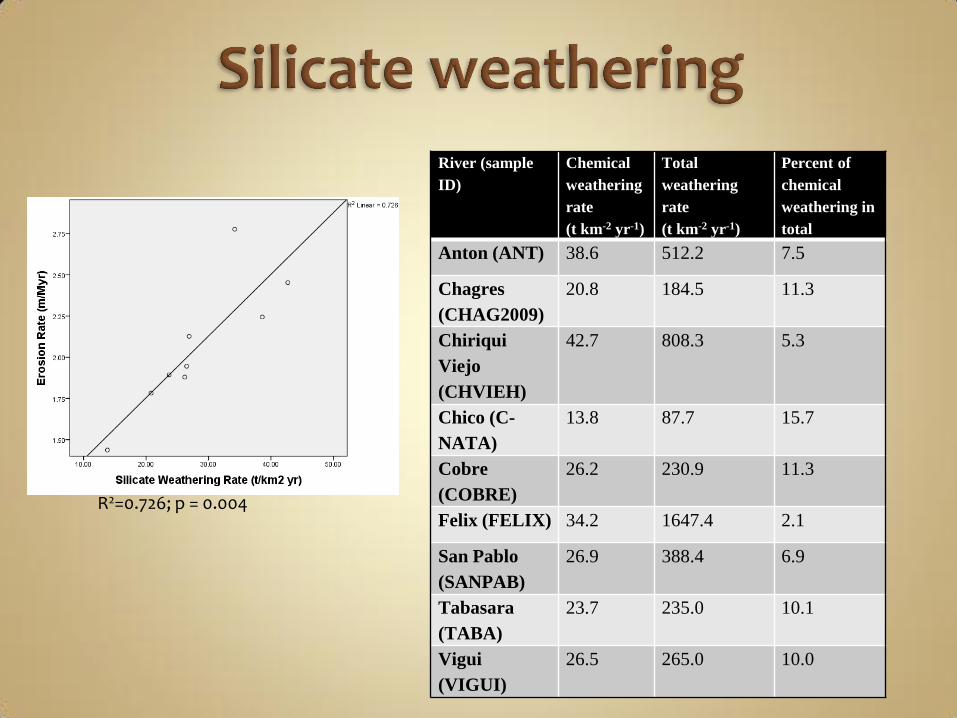
R2=0.726; p = 0.004
River (sample
ID)
Chemical
weathering
rate
(t km-2 yr-1)
Total
weathering
rate
(t km-2 yr-1)
Percent of
chemical
weathering in
total
Anton (ANT) 38.6 512.2 7.5
Chagres
(CHAG2009)
20.8 184.5 11.3
Chiriqui
Viejo
(CHVIEH)
42.7 808.3 5.3
Chico (C-
NATA)
13.8 87.7 15.7
Cobre
(COBRE)
26.2 230.9 11.3
Felix (FELIX) 34.2 1647.4 2.1
San Pablo
(SANPAB)
26.9 388.4 6.9
Tabasara
(TABA)
23.7 235.0 10.1
Vigui
(VIGUI)
26.5 265.0 10.0
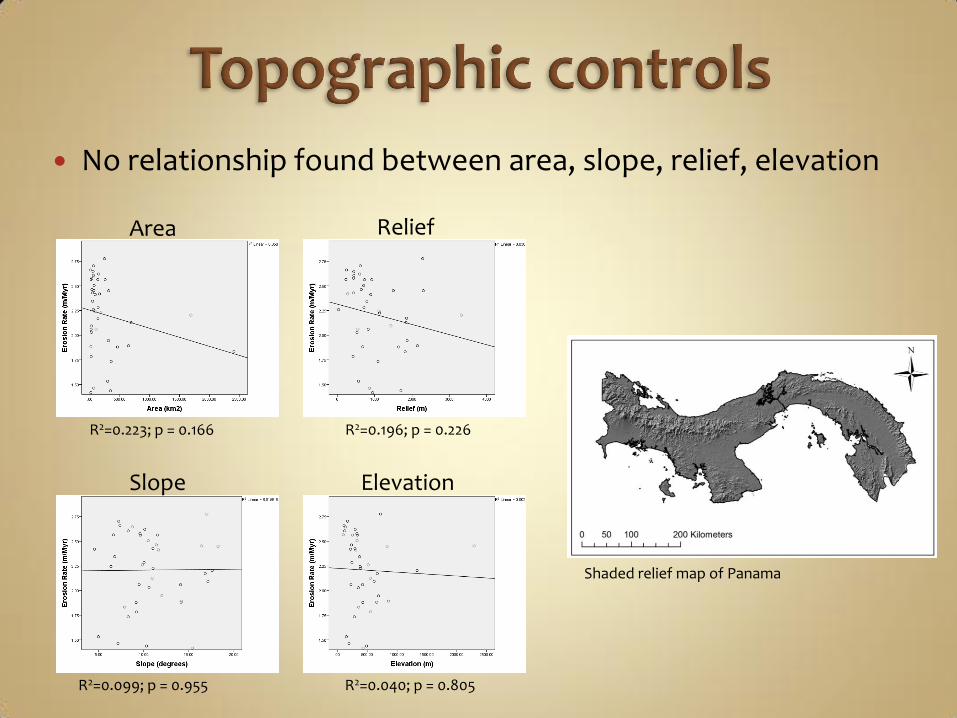
No relationship found between area, slope, relief, elevation
Shaded relief map of Panama
R2=0.040; p = 0.805
Elevation
R2=0.196; p = 0.226
Relief
R2=0.099; p = 0.955
Slope
R2=0.223; p = 0.166
Area
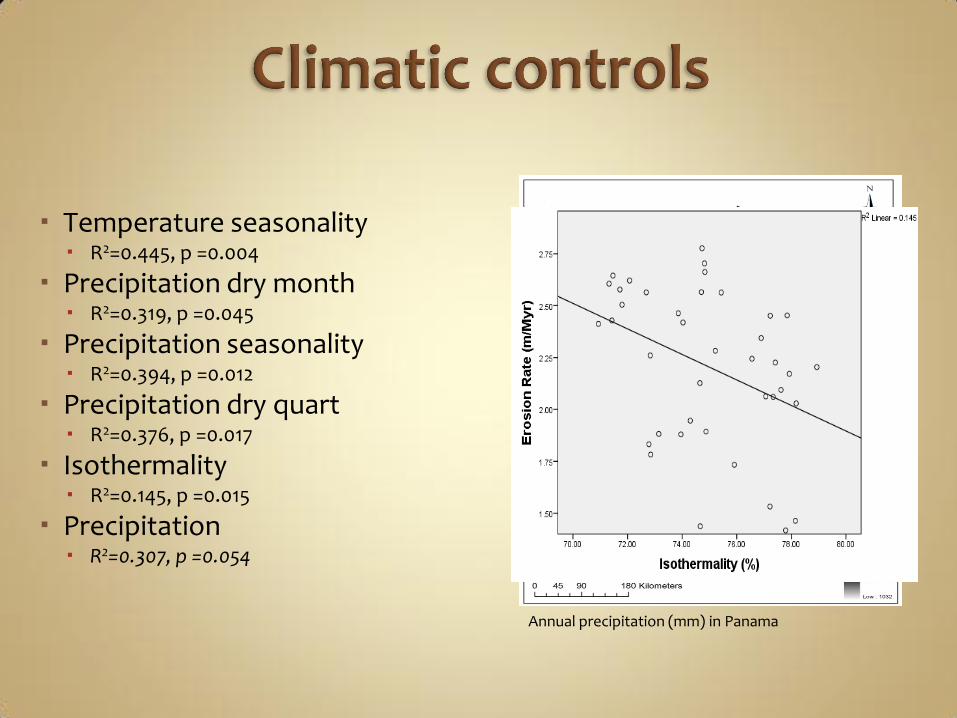
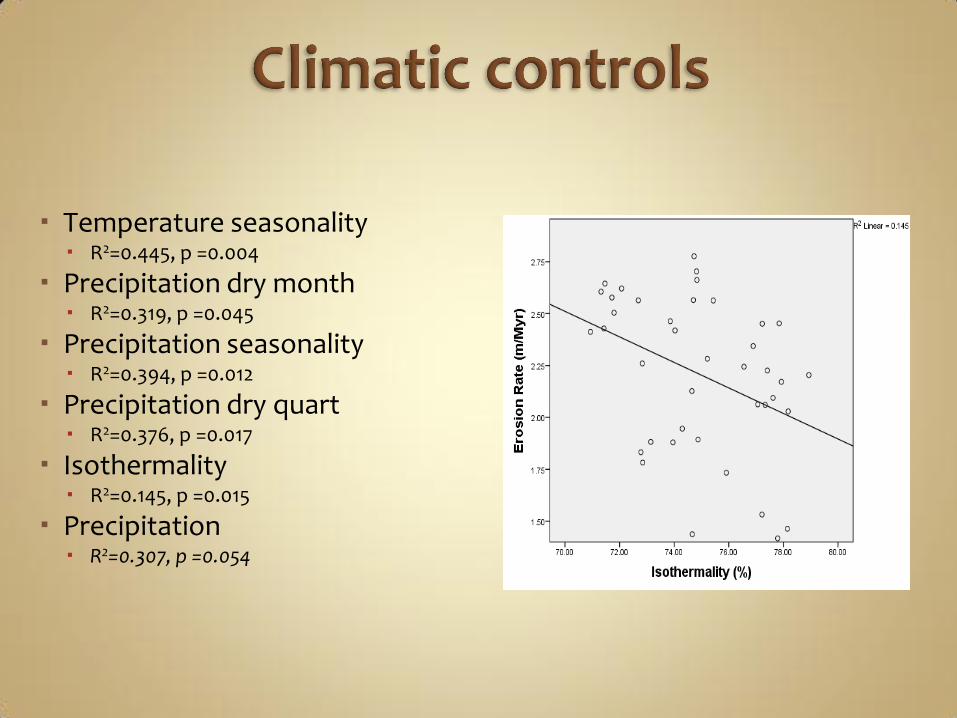
Temperature seasonality R2=0.445, p =0.004
Precipitation dry month R2=0.319, p =0.045
Precipitation seasonality R2=0.394, p =0.012
Precipitation dry quart R2=0.376, p =0.017
Isothermality R2=0.145, p =0.015
Precipitation R2=0.307, p =0.054
Mean Annual temperature (°C) in Panama
Annual precipitation (mm) in Panama
Temperature seasonality R2=0.445, p =0.004
Precipitation dry month R2=0.319, p =0.045
Precipitation seasonality R2=0.394, p =0.012
Precipitation dry quart R2=0.376, p =0.017
Isothermality R2=0.145, p =0.015
Precipitation R2=0.307, p =0.054
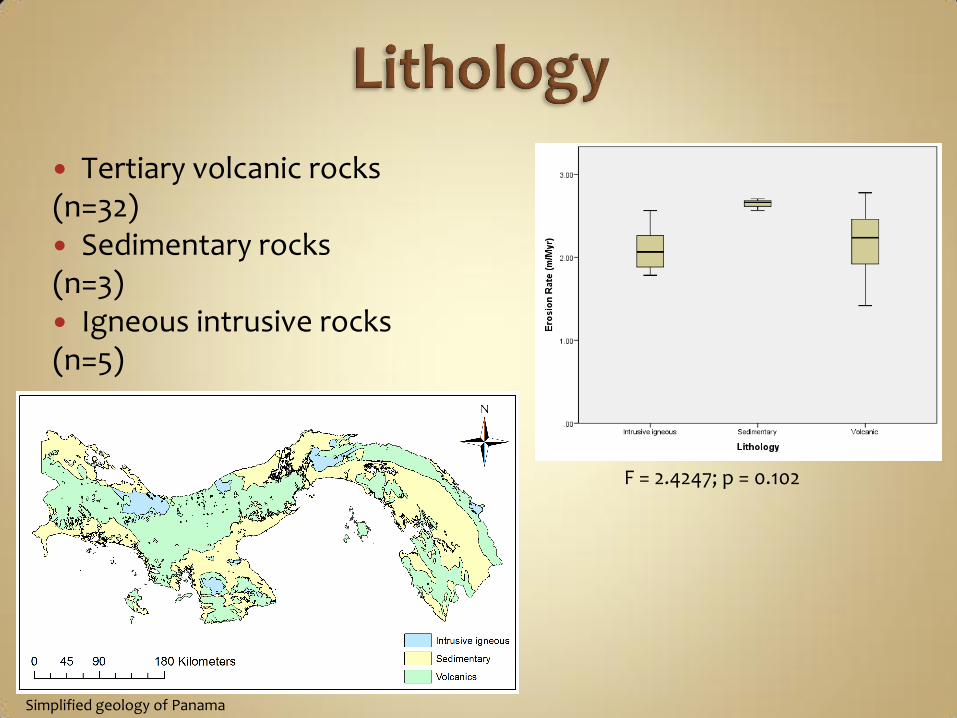
Tertiary volcanic rocks (n=32) Sedimentary rocks (n=3) Igneous intrusive rocks (n=5)
F = 2.4247; p = 0.102
Simplified geology of Panama
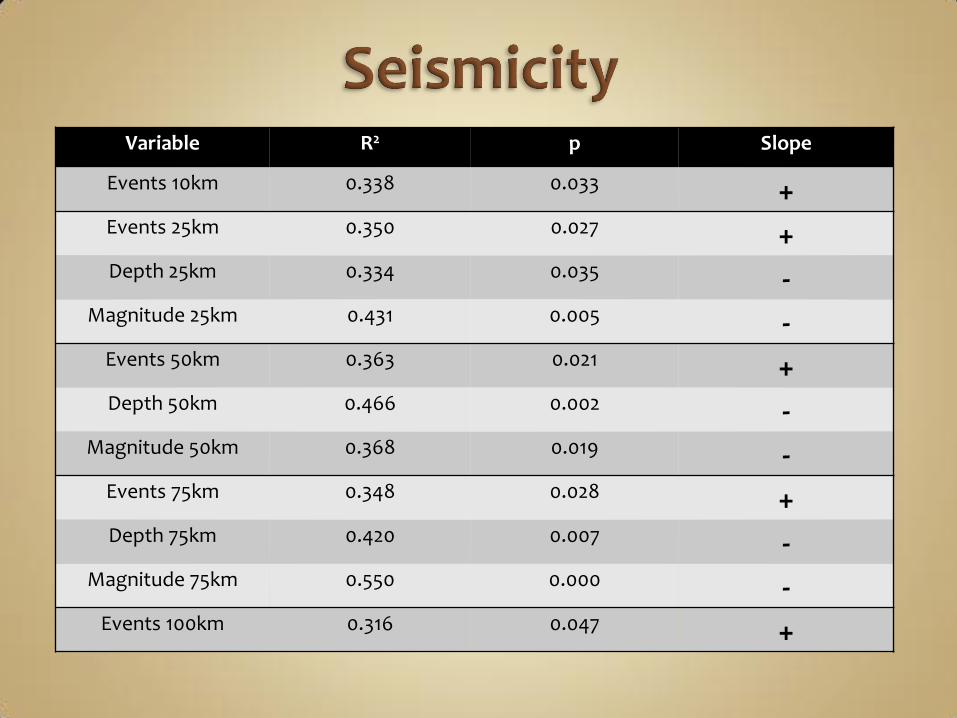
Variable R2 p Slope
Events 10km 0.338 0.033 + Events 25km 0.350 0.027 + Depth 25km 0.334 0.035 -
Magnitude 25km 0.431 0.005 - Events 50km 0.363 0.021 + Depth 50km 0.466 0.002 -
Magnitude 50km 0.368 0.019 - Events 75km 0.348 0.028 + Depth 75km 0.420 0.007 -
Magnitude 75km 0.550 0.000 - Events 100km 0.316 0.047 +
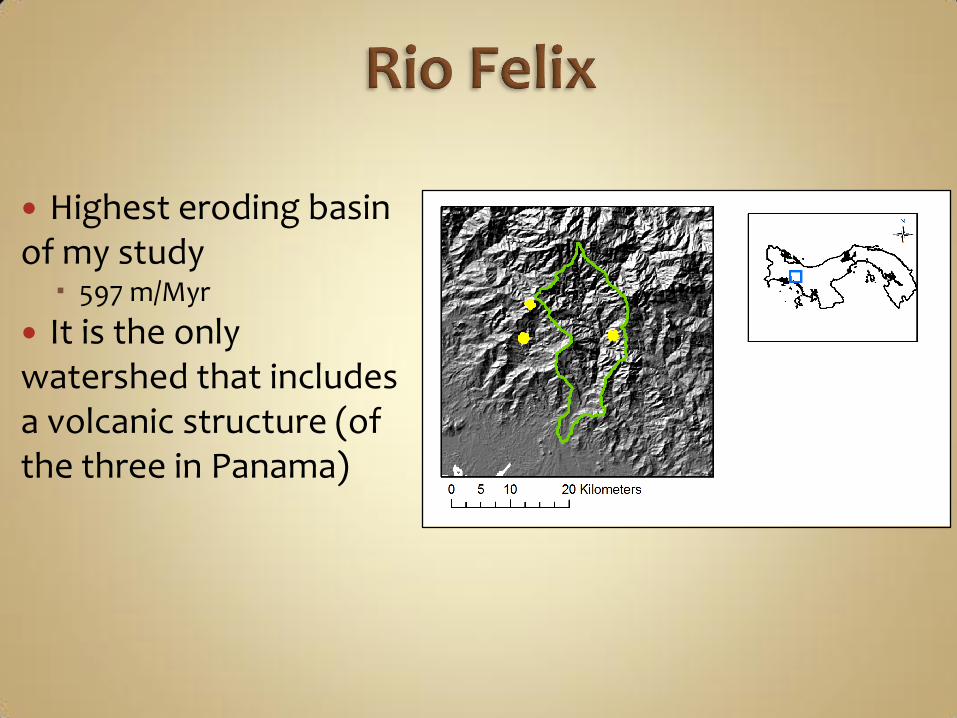
Highest eroding basin of my study 597 m/Myr
It is the only watershed that includes a volcanic structure (of the three in Panama)
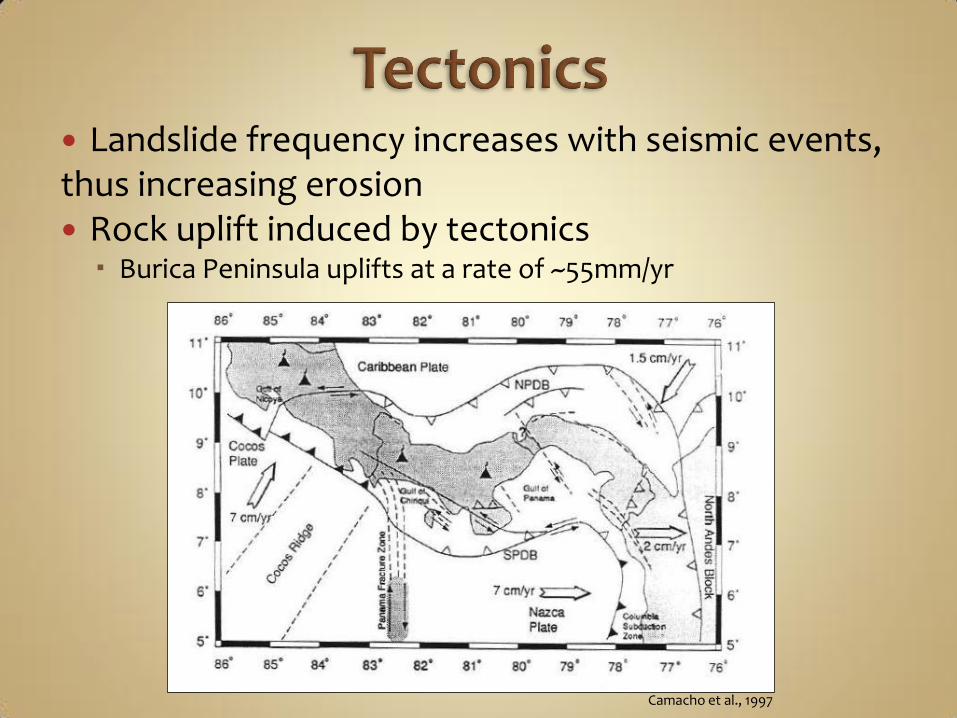
Landslide frequency increases with seismic events, thus increasing erosion Rock uplift induced by tectonics Burica Peninsula uplifts at a rate of ~55mm/yr
Camacho et al., 1997
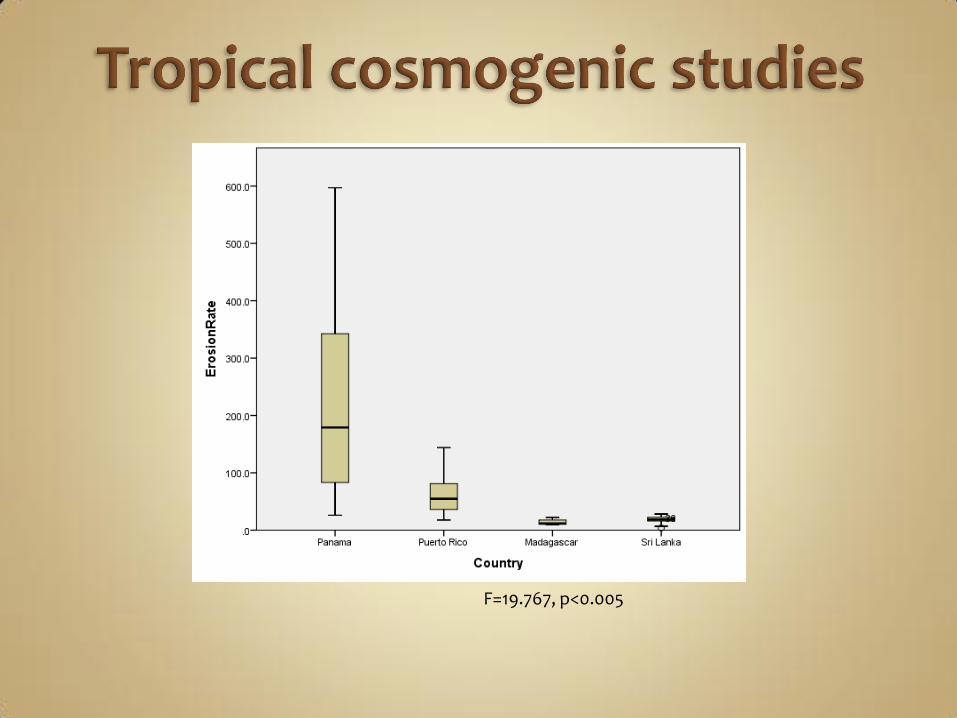
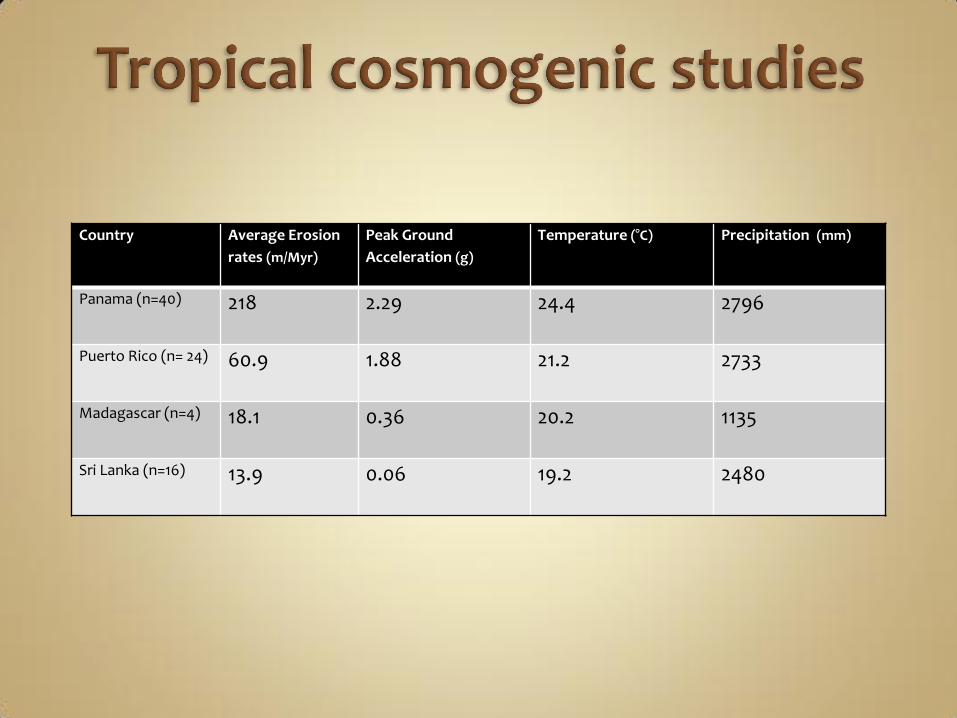
F=19.767, p<0.005
Country Average Erosion
rates (m/Myr)
Peak Ground
Acceleration (g)
Temperature (°C) Precipitation (mm)
Panama (n=40) 218 2.29 24.4 2796
Puerto Rico (n= 24) 60.9 1.88 21.2 2733
Madagascar (n=4) 18.1 0.36 20.2 1135
Sri Lanka (n=16) 13.9 0.06 19.2 2480
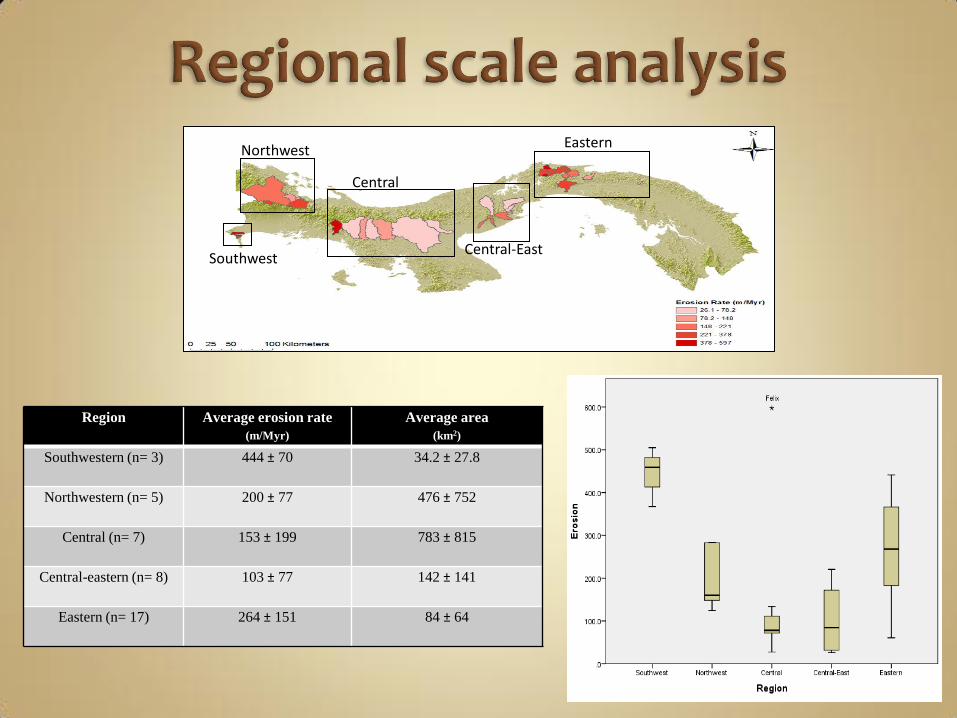
Region Average erosion rate
(m/Myr)
Average area (km2)
Southwestern (n= 3) 444 ± 70 34.2 ± 27.8
Northwestern (n= 5) 200 ± 77 476 ± 752
Central (n= 7) 153 ± 199 783 ± 815
Central-eastern (n= 8) 103 ± 77 142 ± 141
Eastern (n= 17) 264 ± 151 84 ± 64
Southwest
Northwest
Central
Central-East
Eastern
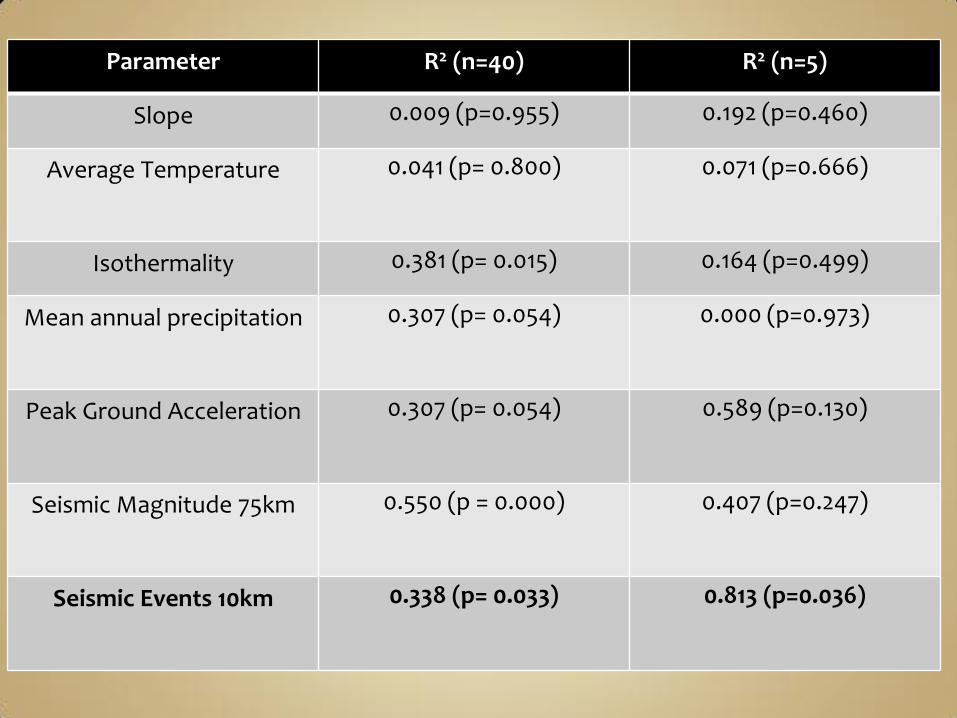
Parameter R2 (n=40) R2 (n=5)
Slope 0.009 (p=0.955) 0.192 (p=0.460)
Average Temperature 0.041 (p= 0.800) 0.071 (p=0.666)
Isothermality 0.381 (p= 0.015) 0.164 (p=0.499)
Mean annual precipitation 0.307 (p= 0.054) 0.000 (p=0.973)
Peak Ground Acceleration 0.307 (p= 0.054) 0.589 (p=0.130)
Seismic Magnitude 75km 0.550 (p = 0.000) 0.407 (p=0.247)
Seismic Events 10km 0.338 (p= 0.033) 0.813 (p=0.036)
0
10
20
30
40
50
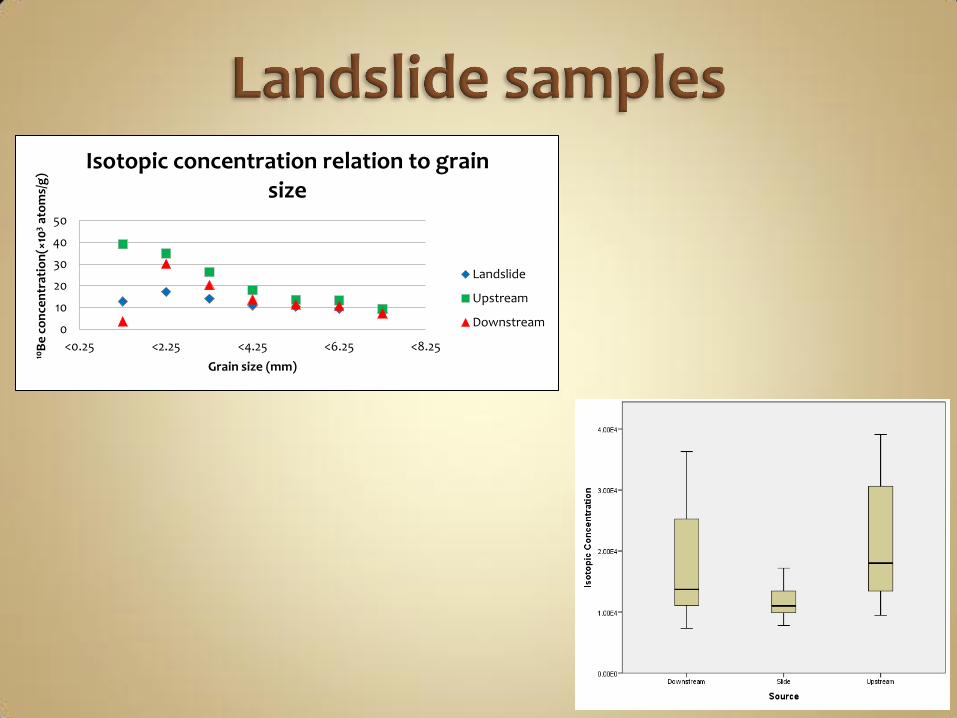
<0.25 <2.25 <4.25 <6.25 <8.25
10B
e c
on
cen
trat
ion
(×10
3 at
om
s/g
)
Grain size (mm)
Isotopic concentration relation to grain size
Landslide
Upstream
Downstream
Grain size fraction
Upstream10Be (x103 atoms/g)
Landslide 10Be (x103 atoms/g)
Downstream10Be (x103 atoms/g)
% landslide material
downstream
<0.25mm 39.1 12.8 36.3 10.65
0.25mm -1 mm
34.9 17.2 30.2 26.55
1mm – 2mm
26.3 14.1 20.3 49.18
2mm – 4mm
18 11 13.7 61.42
4mm – 9mm
13.6 10.4 11.4 68.75
9mm – 12mm
13.3 9.35 10.8 63.29
>12mm 9.46 7.79 7.33 127.54
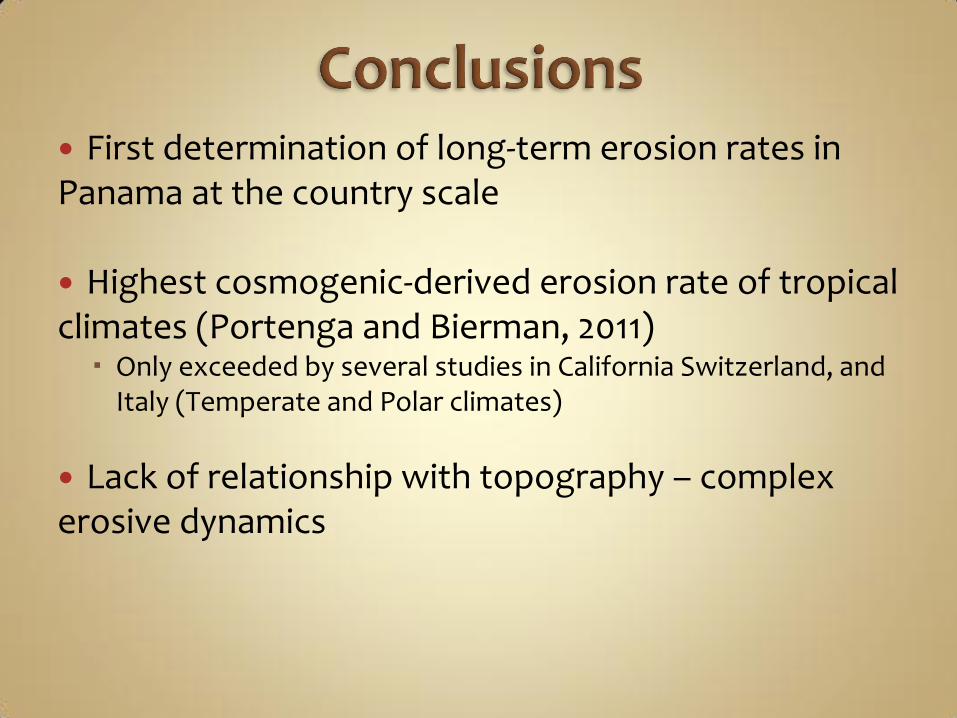
First determination of long-term erosion rates in Panama at the country scale
Highest cosmogenic-derived erosion rate of tropical climates (Portenga and Bierman, 2011) Only exceeded by several studies in California Switzerland, and
Italy (Temperate and Polar climates)
Lack of relationship with topography – complex erosive dynamics
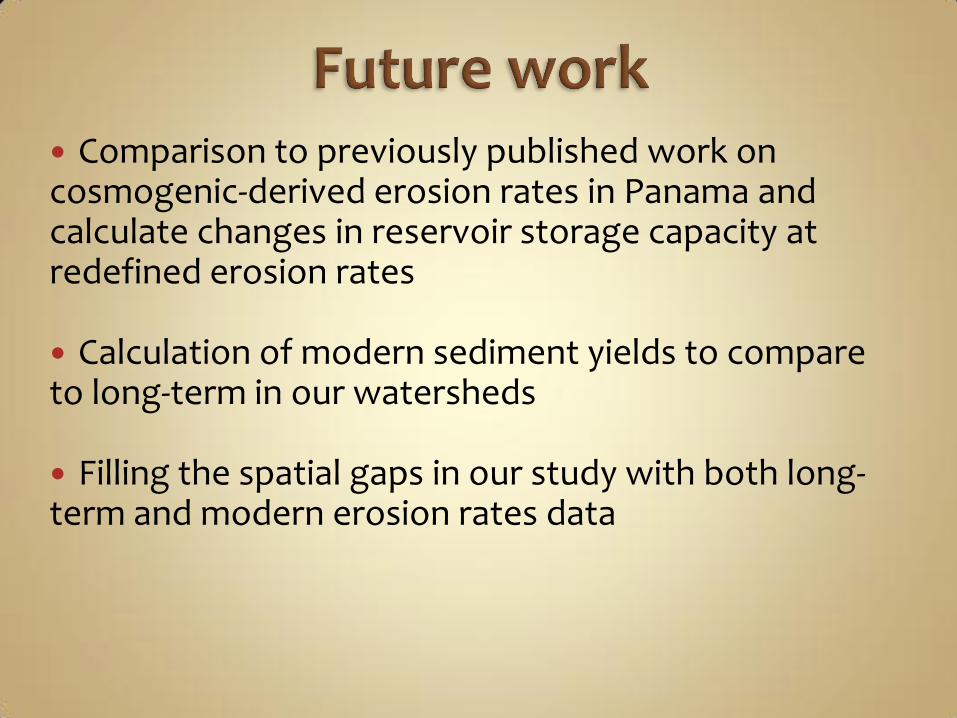
Comparison to previously published work on cosmogenic-derived erosion rates in Panama and calculate changes in reservoir storage capacity at redefined erosion rates
Calculation of modern sediment yields to compare to long-term in our watersheds Filling the spatial gaps in our study with both long-term and modern erosion rates data

Committee Dr. Paul Bierman Dr. Mary Watzin Dr. Jim Vigoreaux
Special Thanks Dr. Kyle K. Nichols Eric Portenga Lucas Reusser
Academic departments and personnel
RSENR Geology
Family and Friends Funding
ARO Funding UVM Graduate College RSENR


![SLIDE : In Defense of Smart Algorithms over Hardware ...02... · [1]Beidi Chen, TharunMedini, AnshumaliShrivastava “SLIDE : In Defense of Smart Algorithms over Hardware Acceleration](https://img.pdfslide.us/doc/110x75/5f0eaf5d7e708231d4406ed0/slide-in-defense-of-smart-algorithms-over-hardware-02-1beidi-chen.jpg)