Embed Size (px)
Citation preview

1
mfbbotrfoaaacflbevfwmbmee
wa
pNN
J
Downlo
Yongyong Hee-mail: [email protected]
Xinming Zhang
State Key Laboratory of Tribology,Tsinghua University,
Beijing 100084, P.R.China
Michael I. FriswellSchool of Engineering,
Swansea University,Swansea SA2 8PP, UK
Defect Diagnosis for RollingElement Bearings Using AcousticEmissionRolling element bearings are very common components in rotating machinery. Hence,condition monitoring and the detection of defects are very important for the normal andsafe running of these machines. Vibration based techniques are well established for thecondition monitoring of rolling element bearings, although they are not so effective indetecting incipient defects in the bearing. Acoustic emission (AE) is receiving increasingattention as a complementary method for condition monitoring of bearings as AE is verysensitive to incipient defects. This paper presents an experimental study to investigate theAE characteristics of bearing defect and validates the relationship between various AEparameters and the operational condition of rolling element bearings. To analyze thecharacteristic vibration frequency of the bearing using the AE signal, short-time rms andautocorrelation functions are integrated to extract the actual characteristic frequency.The AE signal is then analyzed using standard parameters of the signals to explore thesource characteristics and sensitivity of typical rolling element bearing faults. The resultsdemonstrate that the proposed method is very effective to extract the actual characteristicfrequency of the bearing by AE signal. Furthermore the AE parameters are alwayssensitive to the running and fault conditions, which have a strong influence on the strainand deformation within the bearing material. �DOI: 10.1115/1.4000480�
Keywords: acoustic emission, rolling element bearing, condition monitoring, autocorre-lation function, parameter analysis
IntroductionRotating machinery is widely used and is key equipment inany industries. The importance of condition monitoring and
ault diagnosis of such equipment has been extensively recognizedy both industry and the research community �1�. Rolling elementearings are often used components in rotating machinery becausef their low cost and high reliability. However the correct condi-ion of the bearings is required to guarantee the normal and safeunning of the machines. Any failures in the bearings �such asatigue cracks, pitting, spalling, etc.�, must be detected quickly,therwise they may cause malfunctions or even a catastrophicccident. As a consequence, condition monitoring and defect di-gnosis of rolling element bearings are required to provide anssurance for the reliable running of rotating machines and effi-ient production. Many different techniques have been developedor monitoring and diagnosis of rolling element bearings in theast several decades �2,3�. Most of the developed methods areased on vibration signals, and these vibration based methods areffective when the defect in the bearings has already become se-ere. But the vibration signal is not sensitive to the incipient de-ect. Furthermore, the vibration signal caused by bearing defectsill always be contaminated and distorted by other faults andechanical noise. Hence, it is difficult for the vibration signal
ased methods to detect bearing defects at an early stage, and aore sensitive detection and diagnosis technique to provide an
arly and unambiguous indication of bearing defects would bextremely valuable.
Acoustic emission �AE� is a transient elastic wave generatedhen strain energy is suddenly released due to the relative motion
mong the particles or material at a small scale �4�. The small
Contributed by the Technical Committee on Vibration and Sound of ASME forublication in the JOURNAL OF VIBRATION AND ACOUSTICS. Manuscript receivedovember 18, 2008; final manuscript received August 29, 2009; published online
ovember 20, 2009. Assoc. Editor: Kon-Well Wang.ournal of Vibration and Acoustics Copyright © 20
aded 20 Nov 2009 to 137.222.10.58. Redistribution subject to ASME
scale of the AE generation mechanisms mean that the frequenciesgenerated are usually very high, although the source mechanismsare usually smaller than for vibration. Examples include the ma-terial fracture in crack propagation or the interaction of asperitiesin sliding surfaces. AE has been considered for many years as aprime candidate for the nondestructive examination, testing, ormonitoring �NDT� of material faults or structural failure and hasfound broad applications in these fields �5–7�. When a rollingelement bearing with defects operates, the defect �surface defect,cracking, spalling, etc.� will generate elastic impulses and strainon the contact surface between the roller and the race of the bear-ing. This will lead to a release of transient stress wave energy, thatis, AE. This AE contains direct and abundant information aboutthe bearing defect and thus could be used to effectively detect anddiagnose such defects. In contrast to the vibration signal, AE gen-erally covers a frequency range over 20 kHz and does not exhibita significant spectral overlap with mechanical vibration signalsfrom rotating machinery. This means that AE is not influenced ordisturbed by other mechanical noise, and faults in rotating ma-chinery, such as imbalance and misalignment, which cannot beeliminated easily and completely �8�. Thus AE based methods aresuperior in some areas to vibration based methods for defect de-tection, especially for incipient defect detection in rolling elementbearings.
Balerston �9� was one of the first to introduce AE techniques forthe defect diagnosis of rolling element bearings and proposed theAE source mechanism. Since then, and especially in recent years,more and more researchers have investigated the application ofAE technique in the defect monitoring and diagnosis of rollingelement bearings. Hawman and Galinaitis �10�, Tandon andChoudhury �3�, and Mba et al. �11� explored the causes, influencefactors, styles, and the generating mechanisms of AE in rollingelement bearings. Price et al. �12� used a four-ball lubricant testmachine to simulate pitting fatigue and scuffing wear in bearingsand utilized continuous AE signals to detect these two kinds of
defect. This work also verified that AE signals are very effectiveDECEMBER 2009, Vol. 131 / 061012-109 by ASME
license or copyright; see http://www.asme.org/terms/Terms_Use.cfm

fMoArimbcwtdatispbadeittstprtraov
Altsctetta
2
murpd
0
Downlo
or monitoring and detecting defects in bearings. Catlin �13� andorhain and Mba �14� discussed the propagation characteristics
f AE in rolling element bearings. Their work helps to make theE technique more applicable and feasible for defect diagnosis in
olling element bearings. Although the waveform analysis methods becoming attractive for AE analysis, the parameter analysis
ethod has always been used to analyze AE signals arising fromearing defects. The most commonly used parameters for AE areounts, amplitude, rms, energy, and duration time. Significantork has been performed to establish the relationship between
hese parameters and AE activities, and to develop correspondingefect diagnosis methods by using these parameters. Nishimotond Kameno �15� analyzed the relation between the contact fa-igue and AE event counts. Tan �16� found that AE event countsncreased exponentially with increasing defect size and rotatingpeed. Tandon and Nakra �17� used AE ring-down counts andeak amplitudes to diagnose defects in SKF6002 rolling elementearings under varying radial load, rotating speed, and defect sizend concluded that the peak amplitude was better for small defectiagnosis. Morhain and Mba �14� adopted rms, peak amplitude,nergy, and AE counts to diagnose defects in rolling element bear-ngs under high environmental noise. In their work, AE counthreshold setting was first proposed. Al-Ghamdi et al. �18� inves-igated the relationship between AE duration time and the defectize and concluded that AE duration time can be used to identifyhe size of defects in rolling element bearings. In addition, com-arison between AE and vibration signals was performed usingms and peak amplitude to demonstrate that AE is more sensitiveo bearing defects. Al-Ghamd and Mba �19� conducted furtheresearch to compare the sensitivity of the kurtosis values of AEnd vibration signals to defects, to validate that the kurtosis valuef AE is more sensitive to the onset and growth of defects thanibration measurements.
In this paper, an experimental study is presented to investigateE characteristics of bearing defects and further validate the re-
ationship between various AE parameters and the running condi-ion of rolling element bearings, for example, radial load, rotatingpeed, and defect size. First, short-time rms �STRMS� and auto-orrelation functions are used to analyze the variation in charac-eristic frequency of the bearing with the defect. Then, AE param-ters, such as counts, amplitude, energy, and Kurtosis, are utilizedo analyze the AE signals from the bearing. The sensitivities ofhese AE parameters to the running condition of the bearing arelso investigated.
Experimental Test RigFigure 1 shows a schematic of the test rig, which consists of aotor, a rotor-bearing unit, and a loading unit. The rotor-bearing
nit is supported by one cylindrical roller bearing and two conicaloller bearings. A deep ditch ball-bearing, of type 6220, is em-loyed as the test bearing. The bearing has a roller diameter of
Fig. 1 The sketch of the experimental test rig
=22.8 mm, an effective diameter D=141 mm, and the number
61012-2 / Vol. 131, DECEMBER 2009
aded 20 Nov 2009 to 137.222.10.58. Redistribution subject to ASME
of rollers is Z=11. The radial load is applied to the test bearing bya lever system with a ratio of 1:200. The real experimental test rigis shown in Fig. 2.
The AE data acquisition system consisted of piezoelectric-typeAE transducers, amplifiers, an A/D card, and the computer, whichis illustrated in Fig. 3. SR15 broadband AE transducers were em-ployed, with an operating frequency range of 20 Hz–300 kHz. APCI-9812 A/D card was used, which is based on the 32 bit PCIbus with 12 bit accuracy and a 20 MHz maximum sampling ratefor one channel.
The AE transducers are mounted on the outside surface of theouter race and on the bearing housing �see Fig. 4�. The samplingrate is set to 500 kHz, and the sample time is 0.5 s. Electric sparkerosion is used to seed a simulated corrosive pitting defect ontothe races of the bearing artificially, and defect sizes of diameter 3mm and 5 mm were prepared �denoted D1 and D2, respectively,and D0 denotes the undamaged bearing�. Three load cases areconsidered, namely, 0 kN, 3 kN, and 7 kN �denoted L0, L1, andL2, respectively�, and two rotating speeds of the test rig are cho-sen as 222 rpm and 444 rpm �denoted S1 and S2, respectively�.
3 Experimental Study and Results
3.1 Characteristic Frequency Analysis of Bearings WithDefects. The theoretical characteristic frequencies of the bearingwith a defect on the inner race and the outer race can be calculatedas
f I =Z
2�1 +
d
Dcos �� f �1�
Fig. 2 The experimental test rig
Fig. 3 AE data acquisition system
Fig. 4 Test bearing and location of AE sensors
Transactions of the ASME
license or copyright; see http://www.asme.org/terms/Terms_Use.cfm

rtiocd3bdi
l
J
Downlo
fO =Z
2�1 −
d
Dcos �� f �2�
espectively, where f is the rotating frequency of the bearing, Z ishe number of rolling elements, d is the diameter of the rollers, Ds the effective diameter of the bearing, and � is the contact anglef the bearing. For the test bearing, these expressions give theharacteristic frequencies of the bearing with inner and outer raceefects as 23.6 Hz and 17.0 Hz �at 222 rpm�, and 47.7 Hz and4.4 Hz �at 444 rpm�. Thus, the defect location can be identifiedy comparing the measured characteristic frequency with the pre-icted frequency. Note that the characteristic frequency gives nonformation concerning the character of the defect.
Initially a defect was seeded on the outer race, just under the
Fig. 5 AE signals with defect on the outer race from senscondition „L2, S1, D1…, „d… condition „L0, S2, D1…, „e… conditi
ocation where the AE sensor was mounted. Therefore, the defect
ournal of Vibration and Acoustics
aded 20 Nov 2009 to 137.222.10.58. Redistribution subject to ASME
was located at a position of significant load. Figure 5 shows thewaveforms of the AE signals from sensor 1 under various condi-tions. Clearly AE is released whenever the rollers roll over thedefect point, and thus the AE signal has a periodic impact char-acteristic. The intensity of AE increases with increasing load andspeed. Figure 6 shows the spectrum of the AE signal shown inFig. 5�b� �condition �L1, S1, D1��, which is typical of other cases.From Fig. 6, it can be seen that the AE signal contains abundanthigh frequency components, the energy of which is mainly dis-tributed in the range from 45 kHz to 200 kHz. It is difficult todistinguish the actual characteristic frequency directly in thisspectrum because the characteristic frequency modulates the AEsignal �thus not an additive component, but a multiplicative com-
1: „a… condition „L0, S1, D1…, „b… condition „L1, S1, D1…, „c…„L1, S2, D1…, and „f… condition „L2, S2, D1…
oron
ponent in the AE signal� and hence is always a low frequency
DECEMBER 2009, Vol. 131 / 061012-3
license or copyright; see http://www.asme.org/terms/Terms_Use.cfm

ccaaaast
V
ItA
IiwtStqdtt7
FD
Ffa
0
Downlo
ompared with the AE frequency. However, the impact periodicityan be observed clearly in the corresponding AE waveform. It islso difficult and computationally demanding to estimate the char-cteristic frequency from the AE signal waveform directly usingutocorrelation because the quantity of data in an AE signal islways very large and at a very high frequency. In this paper,hort-time rms and autocorrelation functions are used to extracthe actual characteristic frequency from real AE signals.
The mean-square value and the rms value of a voltage signal,�t�, are defined as
VMS�t� =1
�T�t
t+�T
V2���d� �3�
Vrms�t� = �VMS�t� �4�
f V�t� is an AE signal, then VMS reflects the energy distribution ofhe AE signal. The total energy within the time period �t1 , t2� of anE signal is then
E ��t1
t2
�Vrms�2dt =�t1
t2
VMSdt �5�
f an AE signal is divided into many small segments �say, N pointsn each segment, equivalent to using a rectangular window ofidth N on the AE signal�, and the rms value of each segment,
hat is, the short-time rms �STRMS� is calculated, then theTRMS reflects the energy characteristic of each segment. Thus,
he new time series given by the STRMS preserves the low fre-uency energy distribution characteristic of the AE signal, and theata size is reduced significantly. The autocorrelation function ishen utilized to extract the periodicity of the STRMS series andhe characteristic frequency is then measured. As an example, Fig.
shows the STRMS time series and corresponding autocorrela-
ig. 6 The spectrum of the AE signal under condition „L1, S1,1…
ig. 7 STRMS and autocorrelation analysis of the AE signalor condition „L1, S1, D1… from sensor 1: „a… STRMS and „b…
utocorrelation function61012-4 / Vol. 131, DECEMBER 2009
aded 20 Nov 2009 to 137.222.10.58. Redistribution subject to ASME
tion function of the AE signal shown in Fig. 5�b� �condition �L1,S1, D1��. The periodic bursts can be observed clearly in theSTRMS time series and the autocorrelation function highlightsthis periodicity very clearly, which can be identified as 0.06 s.Thus, the actual characteristic frequency is 1 /0.06=16.7 Hz. Thismeasured value is very close to the prediction of 17.0 Hz for thebearing with a defect on the outer race. By this method, all of thecharacteristic frequencies from AE signals in Fig. 5 may be mea-sured and are shown in Table 1. Clearly all of the measured char-acteristic frequencies are very close to the correspondingpredictions.
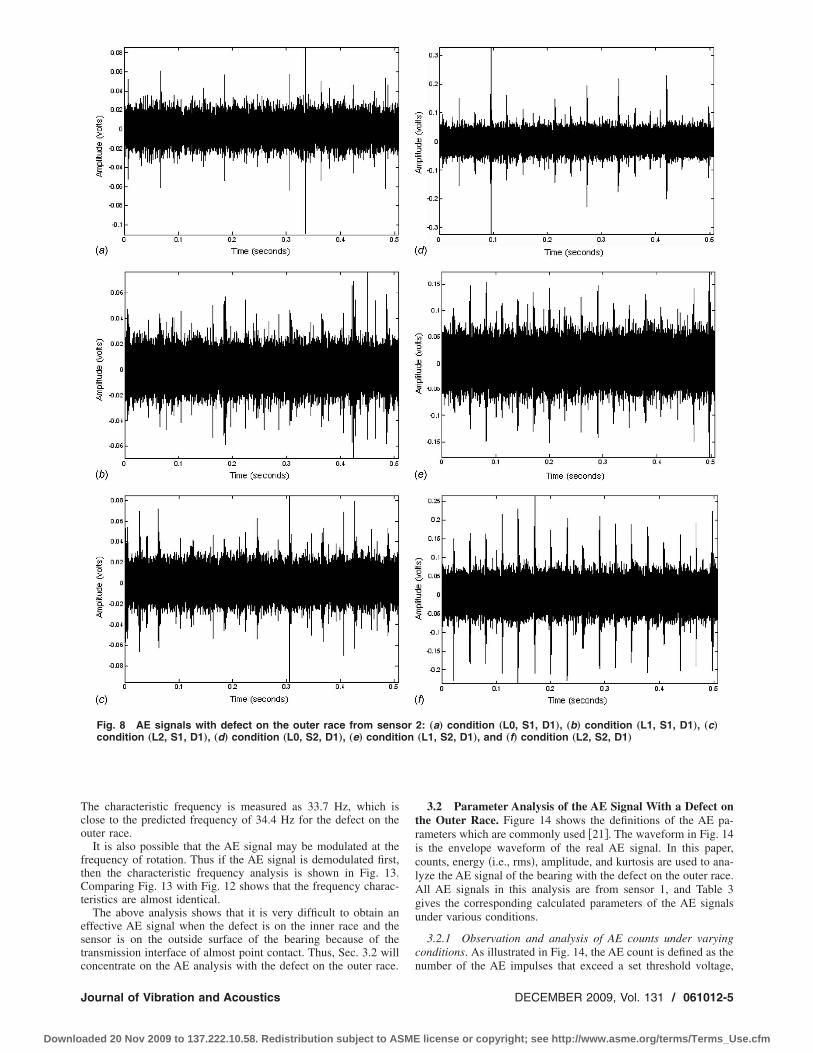
To investigate the propagation characteristics of AE in the bear-ing, Fig. 8 shows the AE signals from sensor 2 under variousconditions. Comparing Fig. 8 with Fig. 5, it can be seen that theAE signal is attenuated severely. The impact periodicity of the AEsignal almost disappears under some conditions �see Fig. 9, forexample�. Although sensor 1 is very close to sensor 2, there existsome interfaces between two sensors. Thus, this attenuation iscaused mainly by the poor transmission through these interfacesand verifies that AE is very sensitive to interface transmission �8�.With increasing rotating speed and load, the AE signal graduallyreveals the periodic impact characteristic. Figure 10 shows theresults of the STRMS analysis and autocorrelation function of theAE signal under condition �L2, S1, D1�, and clearly demonstratesthat the autocorrelation analysis can extract the periodicity of AEsignals, although the periodicity of the STRMS series is not ob-vious. The measured characteristic frequencies can be estimatedand are shown in Table 2. The measured characteristic frequenciesare close to the predictions except for two conditions. These re-sults demonstrate that the proposed method to measure the char-acteristic frequency is very effective.
Now consider the situation with the defect on the inner race ofthe bearing. Figure 11 shows the AE signals from sensor 1 undervarious conditions. Comparing Fig. 11 with Fig. 5, shows that theAE signals have already become very weak, and the periodic im-pact characteristic almost disappears. This attenuation arises be-cause the AE signal caused by the inner race defect reaches sensor1 through the interface transmissions between the rollers and theinner race, and the roller and outer race. Theoretically speaking,the contact between the roller and the race is a line contact, and itis very difficult for AE to propagate through such a contact.Therefore, the AE signal is attenuated significantly before itreaches sensor 1.
It is well known that the vibration signal of a bearing with asingle defect on the inner race has some obvious characteristics�20�. For example, in the spectrum of the envelope of the vibra-tion signal, there are spectrum lines at the harmonics of the faultcharacteristic frequency with decreasing amplitude and modulat-ing spectrum lines at two sidebands with the interval given by therotating frequency. Some characteristics should also be found inthe AE signal because the AE is also generated by the impactwhen the rollers roll over the defect on the inner race. But suchcharacteristics cannot be found in the AE signals in our experi-ments. Instead, the AE signal with the defect on the inner race hassimilar characteristics to the AE signal with the defect on the outer
Table 1 Characteristic frequencies analysis for bearing withsmall defect on the outer race from sensor 1
ConditionActual frequency
�Hz�Theoretical frequency
�Hz�
L0, S1, D1 16.9 17.0L1, S1, D1 16.7 17.0L2, S1, D1 16.4 17.0L0, S2, D1 33.3 34.4L1, S2, D1 33.3 34.4L2, S2, D1 33.3 34.4
race. Figure 12 shows a typical characteristic frequency analysis.
Transactions of the ASME
license or copyright; see http://www.asme.org/terms/Terms_Use.cfm
Tco
ftCt
estc
on
J
Downlo
he characteristic frequency is measured as 33.7 Hz, which islose to the predicted frequency of 34.4 Hz for the defect on theuter race.
It is also possible that the AE signal may be modulated at therequency of rotation. Thus if the AE signal is demodulated first,hen the characteristic frequency analysis is shown in Fig. 13.omparing Fig. 13 with Fig. 12 shows that the frequency charac-
eristics are almost identical.The above analysis shows that it is very difficult to obtain an
ffective AE signal when the defect is on the inner race and theensor is on the outside surface of the bearing because of theransmission interface of almost point contact. Thus, Sec. 3.2 will
Fig. 8 AE signals with defect on the outer race from senscondition „L2, S1, D1…, „d… condition „L0, S2, D1…, „e… conditi
oncentrate on the AE analysis with the defect on the outer race.
ournal of Vibration and Acoustics
aded 20 Nov 2009 to 137.222.10.58. Redistribution subject to ASME
3.2 Parameter Analysis of the AE Signal With a Defect onthe Outer Race. Figure 14 shows the definitions of the AE pa-rameters which are commonly used �21�. The waveform in Fig. 14is the envelope waveform of the real AE signal. In this paper,counts, energy �i.e., rms�, amplitude, and kurtosis are used to ana-lyze the AE signal of the bearing with the defect on the outer race.All AE signals in this analysis are from sensor 1, and Table 3gives the corresponding calculated parameters of the AE signalsunder various conditions.
3.2.1 Observation and analysis of AE counts under varyingconditions. As illustrated in Fig. 14, the AE count is defined as the
2: „a… condition „L0, S1, D1…, „b… condition „L1, S1, D1…, „c…„L1, S2, D1…, and „f… condition „L2, S2, D1…
or
number of the AE impulses that exceed a set threshold voltage,
DECEMBER 2009, Vol. 131 / 061012-5
license or copyright; see http://www.asme.org/terms/Terms_Use.cfm

a�flttacc
Ffa
Fft
Ts
C
LLLLLL
0
Downlo
nd thus AE counts reflect the activity level of the AE signaloscillating frequency, for example�. But AE counts is easily in-uenced by the test conditions, such as the geometrical shape of
he specimen, the characteristics and mounting condition of theransducer, the set threshold voltage, and the performance of themplifier and the filter. Figure 15 shows the comparison of AEounts under various conditions, and hence the sensitivity of AEounts to various conditions can be investigated.
�a� The influence of varying loads on AE counts. In Fig. 15,AE counts generally increase with increasing load; al-though such a trend is not obvious except under the con-dition �S2, D2�. In contrast, AE counts sometimes de-crease with increasing load under some conditions, forexample, from condition �L0, S1, D1� to condition �L1,
ig. 9 STRMS and autocorrelation analysis of the AE signalor condition „L0, S1, D1… from sensor 2: „a… STRMS and „b…utocorrelation function
ig. 10 STRMS and autocorrelation analysis of the AE signalor condition „L2, S1, D1… from sensor 2„a… STRMS and „b… au-ocorrelation function
able 2 Characteristic frequencies analysis for bearing withmall defect on the outer race from sensor 2
ondition Actual frequencyTheoretical frequency
�Hz�
0, S1, D1 No 17.01, S1, D1 No 17.02, S1, D1 16.4 Hz 17.00, S2, D1 34.5 Hz 34.41, S2, D1 34.5 Hz 34.42, S2, D1 33.3 Hz 34.4
61012-6 / Vol. 131, DECEMBER 2009
aded 20 Nov 2009 to 137.222.10.58. Redistribution subject to ASME
S1, D1� and from condition �L1, S2, D0� to condition�L2, S2, D0�. This means that AE counts are not sensitiveto the load.
�b� The influence of varying rotating speeds on AE counts. InFig. 15, AE counts increase significantly under all condi-tions when the rotating speed increases from 222 rpm to444 rpm. This means that AE counts are very sensitive tothe rotating speed.
�c� The influence of defect size on AE counts. In Fig. 15, thechange in the number of AE counts is not obvious fromD0 to D1; even AE counts for D1 become smaller thanthat for D0 for a higher rotating speed of 444 rpm �forexample, from condition �L2, S2, D0� to condition �L2,S2, D1�. But when the defect size changes from D1 toD2, AE counts increase greatly. Therefore, AE counts arenot very effective in identifying small or incipient de-fects, but it is very good for detecting larger defects.
From above observations and analysis, it can be summarizedthat AE counts are not sensitive to varying load applied to thebearing but is sensitive to the rotating speed, and especially to thedefect size. Larger defects and increasing rotating speed will makeAE counts increase significantly. A physical explanation for theseobservations may be postulated by noting that AE counts reflectthe activity level of the AE source, and the activity of AE sourceis determined mainly by the material attributes, the defect condi-tion, and the excitation manner. The load does not influence thesefactors and hence does not significantly affect the activity of AEsource, especially at lower rotating speeds and for smaller defects.In contrast, increasing the rotating speed will increase the excita-tion frequency and the impact strength between the rollers and thedefect and, hence, will significantly increase the AE counts. Simi-larly, defect size �and defect condition� does influence the activitylevel of AE source since a larger defect produces a higher excita-tion levels and produces a larger amplitude AE signal. Thus moresignals will be above the count threshold. In addition, AE countsare easily influenced by the test conditions �such as the perfor-mance of the amplifier, as mentioned above�. Thus, for a lowerrotating speed and a smaller defect, the accuracy of AE countswill be influenced more seriously by the test conditions becauseAE counts are much smaller. Hence AE counts are more suitableto detect larger defects at higher rotating speeds.
3.2.2 Observation and analysis of AE amplitude under vary-ing conditions. According to the definition, AE amplitude is thepeak amplitude of AE envelope signal �see Fig. 14�. AE amplitudeis relative to the deformation mechanism of AE source in thematerial and reflects the characteristics of the AE source and AEstrength generated in the material �22�. But AE amplitude is alsoinfluenced by test conditions, such as the response frequency anddamping characteristics of the transducer, and the damping char-acteristic of the material. From Fig. 16, the sensitivity of AE am-plitude to various conditions can be investigated.
�a� The influence of varying loads on AE amplitude. Figure16 shows that AE amplitude is not sensitive to varyingload, and no obvious trends can be observed with varyingload under various conditions except for condition �S2,D1�. Thus, there is no reason to regard that the increase inAE amplitude under condition �S2, D1� is caused just byincreasing load alone.
�b� The influence of varying rotating speeds on AE ampli-tude. In Fig. 16 it can be seen that AE amplitude is verysensitive to varying rotating speeds and increases greatlywith increasing rotating speed when a defect exists in thebearing �i.e., under conditions D1 and D2�. But the rotat-ing speed has almost no influence on AE amplitude if nodefect exists in the bearing.
�c� The influence of defect size on AE amplitude. In Fig. 16
it can be seen that AE amplitude clearly increases whenTransactions of the ASME
license or copyright; see http://www.asme.org/terms/Terms_Use.cfm

iebtsp
on
J
Downlo
the condition changes from D0 to D1. But no trend of theAE amplitude can be clearly observed with varying de-fect size. These results mean that AE amplitude will in-crease obviously when the defect emerges in the bearing.But once the defect already exists, the AE amplitude isnot sensitive to the defect size. Thus, AE amplitude can-not be used to identify the size and extent of the defect.
These observations and analysis are now summarized. If theres no defect in the bearing, then the AE amplitude is not influ-nced at all by varying conditions. When the defect initiates in theearing, the AE amplitude will increase. Once a defect exists inhe bearing, the AE amplitude is influenced only by the rotatingpeed, regardless of the defect size and the load. According to the
Fig. 11 AE signals with defect on the inner race from senscondition „L2, S1, D1…, „d… condition „L0, S2, D1…, „e… conditi
hysical meaning of AE amplitude illustrated above, when vary-
ournal of Vibration and Acoustics
aded 20 Nov 2009 to 137.222.10.58. Redistribution subject to ASME
ing running conditions change, the deformation mechanism of thematerial then can influence the AE amplitude. Therefore, a pos-sible physical explanation would imply that defect generationchanges the deformation mechanism of the defect area, and suchdeformation mechanism of the defect area is not influenced by thedefect size obviously. The constant load has no obvious influenceon the deformation mechanism of the material. In contrast, therotating speed has a strong influence on the deformation mecha-nism by changing the impact frequency and strength on the areaaround the defect in the bearing.
3.2.3 Observation and analysis of AE energy under varyingconditions. As illustrated in Fig. 14, AE energy is defined as therms of the AE signal, which is proportional to the area under the
1: „a… condition „L0, S1, D1…, „b… condition „L1, S1, D1…, „c…„L1, S2, D1…, and „f… condition „L2, S2, D1…
or
envelope waveform of the AE in Fig. 14. AE energy is directly
DECEMBER 2009, Vol. 131 / 061012-7
license or copyright; see http://www.asme.org/terms/Terms_Use.cfm

rmTu
FSa
FSf
0
Downlo
elated to the mechanical energy, strain ratio, and deformationechanism when strain energy is released in the material �22�.herefore, AE energy is a suitable parameter to evaluate the fail-re and damage extent of the material and is an important param-
ig. 12 Characteristic frequency analysis for condition „L2,2, D1… from sensor 1: „a… STRMS, „b… autocorrelation function,nd „c… spectrum of autocorrelation function
ig. 13 Characteristic frequency analysis for condition „L2,2, D1… after demodulation: „a… STRMS, „b… autocorrelation
unction, and „c… spectrum of autocorrelation function
Fig. 14 Definition of AE parameters
61012-8 / Vol. 131, DECEMBER 2009
aded 20 Nov 2009 to 137.222.10.58. Redistribution subject to ASME
eter to be used in nondestructive examination by AE. rms voltageof AE �i.e., AE energy� is not sensitive to the electronic systemgain and the coupling of the transducer to the machine and notinfluenced by the set threshold voltage. Therefore, the calculatedAE energy from the AE signal will be more accurate and objec-tive. The AE rms is calculated using Eqs. �3� and �4�. From Fig.17, the sensitivity of AE amplitude to various conditions can beinvestigated.
�a� The influence of varying loads on AE energy. In Fig. 17,no obvious trend of AE energy can be observed withvarying conditions except condition �S2, D1� and condi-tion �S2, D2�. Under condition �S2, D1� and condition�S2, D2�, AE energy increases with increasing load.
Table 3 Calculated parameters of the AE signal under variousconditions from sensor 1
Condition Counts Amplitude rms Kurtosis
L0, S1, D0 2308 0.31 10.77 14.58L1, S1, D0 2643 0.21 10.38 6.53L2, S1, D0 3155 0.21 11.21 5.92L0, S1, D1 3069 0.35 10.88 23.18L1, S1, D1 2927 0.50 12.89 54.12L2, S1, D1 4241 0.60 14.78 93.42L0, S1, D2 8397 0.71 17.83 186.75L1, S1, D2 7569 0.44 15.69 24.87L2, S1, D2 9182 0.34 16.83 10.50L0, S2, D0 8816 0.30 14.56 4.08L1, S2, D0 11,596 0.28 16.82 3.80L2, S2, D0 10,347 0.30 16.18 4.10L0, S2, D1 9003 1.55 30.16 151.01L1, S2, D1 10,355 1.70 31.97 65.08L2, S2, D1 10,390 2.05 40.60 62.53L0, S2, D2 12,402 1.38 32.40 32.73L1, S2, D2 13,781 1.42 38.23 27.67L2, S2, D2 14,695 1.34 43.74 16.79
Fig. 15 Comparison of AE counts for various conditions
Fig. 16 Comparison of amplitude for various conditions
Transactions of the ASME
license or copyright; see http://www.asme.org/terms/Terms_Use.cfm
ctipiseleigaseettmnir
pctatd
J
Downlo
Thus, we can say that AE energy is not sensitive to vary-ing load under conditions of lower rotating speed andsmaller defects.
�b� The influence of varying rotating speeds on AE energy. InFig. 17, varying rotating speed has a strong influence onAE energy. AE energy increases greatly with increasingrotating speed under various conditions even under con-dition �D0� �no defect exists�. Thus AE energy is verysensitive to varying rotating speed.
�c� The influence of defect size on AE energy. In Fig. 17, AEenergy increases when the defect initiates and becomeslarger, although this increase is not large. Thus AE energyis not very sensitive to the defect size.
From the above observations and analysis, in contrast to AEounts and AE amplitude, AE energy is much more sensitive tohe varying conditions. Therefore, AE energy is regarded as a verymportant parameter in AE for defect detection and analysis. Com-ared with the rotating speed and the defect size, the load has lessnfluence on the AE energy. For a lower rotating speed andmaller defects, the varying load has no obvious influence on AEnergy, i.e., AE energy is also not sensitive to varying loads, justike AE amplitude. According to the physical explanation of AEnergy, this verifies again that the constant load has very littlenfluence on the deformation mechanism of the material and AEeneration and, thus, has little influence on AE energy. Howevern increase in the rotating speed will cause impact frequency andtrength to increase at the defect point and, thus, cause the AEnergy to increase greatly. From the physical explanation of AEnergy, this result also demonstrates that the excitation manner ofhe material will influence the strain characteristics and deforma-ion mechanism of the material remarkably. The defect itself has
uch less influence on the AE source and its generating mecha-ism, and thus when the defect becomes larger, AE energy willncrease but only slowly. This result coincides with the analysisesult about the defect size in Sec. 3.2.2.
3.2.4 Analysis of AE kurtosis under varying conditions. Thearameter kurtosis is a fourth-order statistic, which measures therest shape of the probability density function of the sample. Forhe detection of defects in the bearing, kurtosis indicates the prob-bility of the generation of periodic impulses with large ampli-udes and is very sensitive to these periodic impulses. Kurtosis isefined as
Fig. 17 Comparison of rms for various conditions
Table 4 Summary of paramete
Condition Counts Amplitude
Load ↑ ↑ �not obviously� -Speed ↑ ↑ �greatly� ↑ �greatly�Defect size ↑ ↑ �greatly� ↑ �when defect em
ournal of Vibration and Acoustics
aded 20 Nov 2009 to 137.222.10.58. Redistribution subject to ASME
k =E�V�t� − ��4
�4 =1
Ni−1
N �Vi − �
��4
�6�
where � is the mean, and � is the variance of the signal V�t�.Kurtosis of the vibration signal has been used to evaluate the
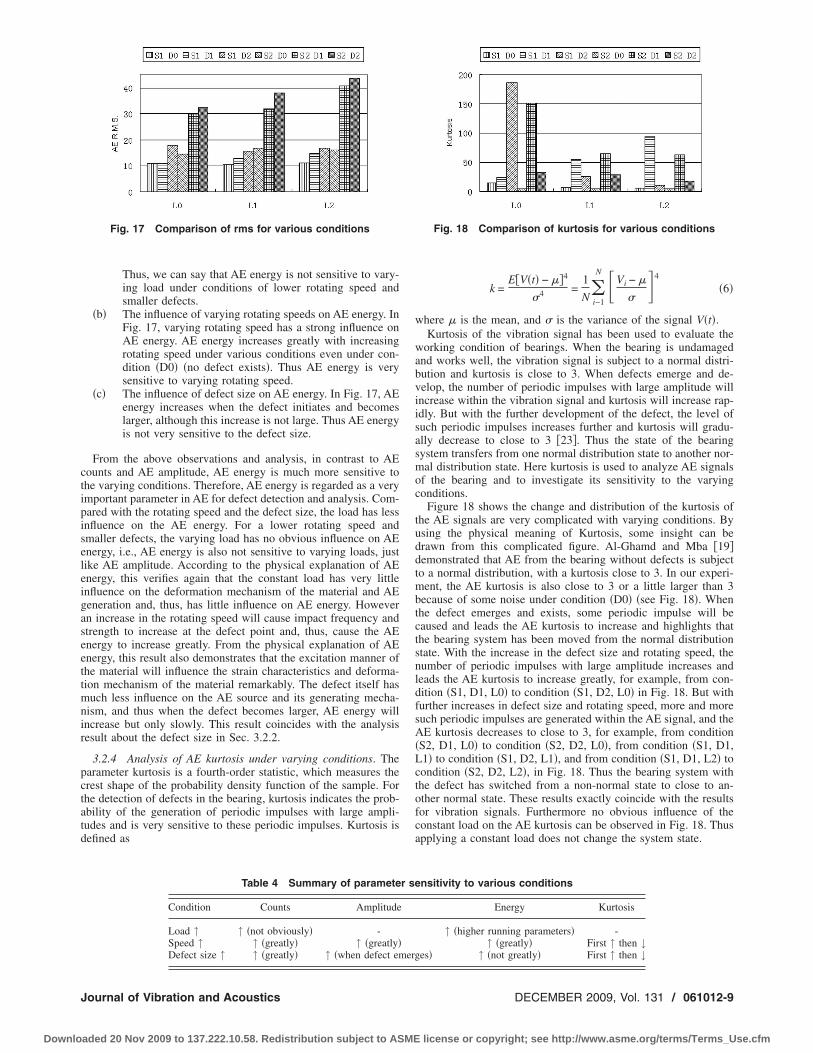
working condition of bearings. When the bearing is undamagedand works well, the vibration signal is subject to a normal distri-bution and kurtosis is close to 3. When defects emerge and de-velop, the number of periodic impulses with large amplitude willincrease within the vibration signal and kurtosis will increase rap-idly. But with the further development of the defect, the level ofsuch periodic impulses increases further and kurtosis will gradu-ally decrease to close to 3 �23�. Thus the state of the bearingsystem transfers from one normal distribution state to another nor-mal distribution state. Here kurtosis is used to analyze AE signalsof the bearing and to investigate its sensitivity to the varyingconditions.
Figure 18 shows the change and distribution of the kurtosis ofthe AE signals are very complicated with varying conditions. Byusing the physical meaning of Kurtosis, some insight can bedrawn from this complicated figure. Al-Ghamd and Mba �19�demonstrated that AE from the bearing without defects is subjectto a normal distribution, with a kurtosis close to 3. In our experi-ment, the AE kurtosis is also close to 3 or a little larger than 3because of some noise under condition �D0� �see Fig. 18�. Whenthe defect emerges and exists, some periodic impulse will becaused and leads the AE kurtosis to increase and highlights thatthe bearing system has been moved from the normal distributionstate. With the increase in the defect size and rotating speed, thenumber of periodic impulses with large amplitude increases andleads the AE kurtosis to increase greatly, for example, from con-dition �S1, D1, L0� to condition �S1, D2, L0� in Fig. 18. But withfurther increases in defect size and rotating speed, more and moresuch periodic impulses are generated within the AE signal, and theAE kurtosis decreases to close to 3, for example, from condition�S2, D1, L0� to condition �S2, D2, L0�, from condition �S1, D1,L1� to condition �S1, D2, L1�, and from condition �S1, D1, L2� tocondition �S2, D2, L2�, in Fig. 18. Thus the bearing system withthe defect has switched from a non-normal state to close to an-other normal state. These results exactly coincide with the resultsfor vibration signals. Furthermore no obvious influence of theconstant load on the AE kurtosis can be observed in Fig. 18. Thusapplying a constant load does not change the system state.
Fig. 18 Comparison of kurtosis for various conditions
nsitivity to various conditions
Energy Kurtosis
↑ �higher running parameters� -↑ �greatly� First ↑ then ↓
es� ↑ �not greatly� First ↑ then ↓
r se
erg
DECEMBER 2009, Vol. 131 / 061012-9
license or copyright; see http://www.asme.org/terms/Terms_Use.cfm

r�aesa
4
tqpfetmedateTieociuaggmt
A
d
R
0
Downlo
For the parameter analysis, Table 4 gives a summary of theelation and sensitivity of the parameters to the various conditionsload, rotating speed, and defect size�. For condition monitoringnd defect detection in bearings, increasing the rotating speed willxcite strong AE signals and make AE parameters more obvious,o that the defect can be monitored and detected more accuracynd easily.
ConclusionIn this experimental study, short-time root-mean-square and au-
ocorrelation functions are used to measure the characteristic fre-uency of a bearing using AE signals. The results show that theroposed method is very effective in estimating the characteristicrequency from the AE signal. The paper then considers a param-ter analysis of the AE signals to explore the relation and sensi-ivity of various AE parameters to the running conditions of the
achine. AE counts, amplitude, energy, and kurtosis are consid-red for running conditions of radial load, rotating speed, andefect size. The results of AE parameter analysis demonstrate thatconstant load applied to the bearing has no obvious influence on
he AE parameters. However, the rotating speed has strong influ-nce on the AE parameters for almost every running condition.he defect size has some influence on the AE parameters, but this
s not so great. Thus, from the physical meaning of AE param-ters, we conclude that the rotating speed has a strong influencen the strain mechanism and deformation mechanism throughhanging the impact frequency and strength. Thus, varying rotat-ng speed always leads to a great change in the AE parametersnder most running conditions of the bearing. The defect itselflso has some influence on the generation of AE, but this is not soreat. The constant radial load has little obvious influence on theeneration of AE. Therefore, in order to excite strong AE foronitoring and detecting defect of the bearing, increasing the ro-
ating speed should be considered first.
cknowledgmentThis work is partially supported by the Natural Science Foun-
ation of China �Grant No. 50975150�.
eferences�1� He, Y., Lu, W., and Chu, F., 2005, “Internet/Intranet Based Remote Condition
Monitoring and Fault Diagnosis Scheme and System for Steam Turboset,” KeyEng. Mater., 293–294, pp. 365–372.
�2� Tandon, N., and Nakra, B. C., 1992, “Vibration and Acoustic Monitoring Tech-nique for the Detection of Defects in Rolling Element Bearings—A Review,”Shock Vib. Dig., 24, pp. 3–11.
�3� Tandon, N., and Choudhury, A., 1999, “A Review of Vibration and Acoustic
61012-10 / Vol. 131, DECEMBER 2009
aded 20 Nov 2009 to 137.222.10.58. Redistribution subject to ASME
and Acoustic Measurement Methods for the Detection of Defects in RollingElement Bearing,” Tribol. Int., 32, pp. 469–80.
�4� Scott, I. G., 1991, Basic Acoustic Emission, Gordon and Breach, New York.�5� Dornfeld, D., 1999, “Application of Acoustic Emission Techniques in Manu-
facturing,” NDT Int., 25, pp. 259–269.�6� Chen, C., Kovacevic, R., and Jandgric, D., 2003, “Wavelet Transform Analysis
of Acoustic Emission in Monitoring Friction Stir Welding of 6061 Aluminum,”Int. J. Mach. Tools Manuf., 43, pp. 1383–1390.
�7� Qi, G., 2000, “Wavelet-Based AE Characterization of Composite Materials,”NDT Int., 33, pp. 133–144.
�8� He, Y., Ying, X., and Chu, F., 2008, “Modal Analysis of Rubbing AcousticEmission for Rotor-Bearing System Based on Reassigned Wavelet Scalo-gram,” ASME J. Vibr. Acoust., 130, p. 061009.
�9� Balerston, H. L., 1969, “The Detection of Incipient Failure in Bearings,”Mater. Eval., 27, pp. 121–128.
�10� Hawman, M. W., and Galinaitis, W. S., 1988, “Acoustic Emission Monitoringof Rolling Element Bearings,” Ultrasonics Symposium Proceedings, Oct. 2–5,Chicago, IL, pp. 885–889.
�11� Mba, D., Raj, B. K., and Rao, N., 2006, “Development of Acoustic EmissionTechnology for Condition Monitoring and Diagnosis of Rotating Machines:Bearings, Pumps, Gearboxes, Engines, and Rotating Structures,” Shock Vib.Dig., 38, pp. 3–16.
�12� Price, E. D., Lees, A. W., and Friswell, M. I., 2005, “Detection of SevereSliding and Pitting Fatigue Wear Regimes Through the Use of BroadbandAcoustic Emission,” Proc. Inst. Mech. Eng., Part J: J. Eng. Tribol., 219, pp.85–98.
�13� Catlin, J. B., 1983, “The Use of Ultrasonic Diagnostic Technique to DetectRolling Element Bearing Defects,” Proceedings of the Machinery and Vibra-tion Monitoring and Analysis Meeting, Vibration Institute, IL, pp. 123–130.
�14� Morhain, A., and Mba, D., 2003, “Bearing Defect Diagnosis and AcousticEmission,” Proc. Inst. Mech. Eng., Part J: J. Eng. Tribol., 217, pp. 257–272.
�15� Nishimoto, S., and Kameno, R., 1989, “Estimate of the Fatigue Condition onRolling Bearing by AE,” Proceedings of the 8th International AE Symposium,Tokyo, Japan, Oct. 21–14, Vol. 14, pp. 446–453.
�16� Tan, C. C., 1990, “Application of Acoustic Emission to the Detection of Bear-ing Failures,” International Tribology Conference, Dec. 2–5, Brisbane, Austra-lia, pp. 110–114.
�17� Tandon, N., and Nakra, B. C., 1990, “Defect Detection of Rolling ElementBearings by Acoustic Emission Method,” J. Acoust. Emiss., 1, pp. 25–28.
�18� Al-Ghamdi, A. M., Zhechkov, D., and Mba, D., 2004, “The Use of AcousticEmission for Bearing Defect Identification and Estimation of Defect Size,”The 26th European Conference on Acoustic Emission Testing, EWGAE, Sep.15–17, pp. 467–478.
�19� Al-Ghamd, A. M., and Mba, D., 2006, “A Comparative Experimental Study onthe Use of Acoustic Emission and Vibration Analysis for Bearing Defect Iden-tification and Estimation of Defect Size,” Mech. Syst. Signal Process., 20, pp.1537–1571.
�20� Mei, H., 1995, Vibration Monitoring and Diagnosis for Rolling Element Bear-ings, Mechanical Industry, Beijing, China.
�21� Miller, R. K., and McIntire, P., 1987, “Acoustic Emission Testing,” Nonde-structive Testing Handbook, Vol. 5, 2nd ed., American Society for Nondestruc-tive Testing, Columbus, OH.
�22� Shen, G. T., Geng, R. S., and Liu, S. F., 2002, “Parameter Analysis of AcousticEmission Signal,” Chinese Journal of Nondestructive Testing, 24, pp. 72–77.
�23� Zhang, L. Q., Zhu, L. M., and Zhong, B. L., 2001, “Study on the Features ofSome Specific Parameters Utilized for Machine Condition Monitoring,” Chi-nese Journal of Vibration and Shock, 20, pp. 20–25.
Transactions of the ASME
license or copyright; see http://www.asme.org/terms/Terms_Use.cfm