Embed Size (px)
Citation preview
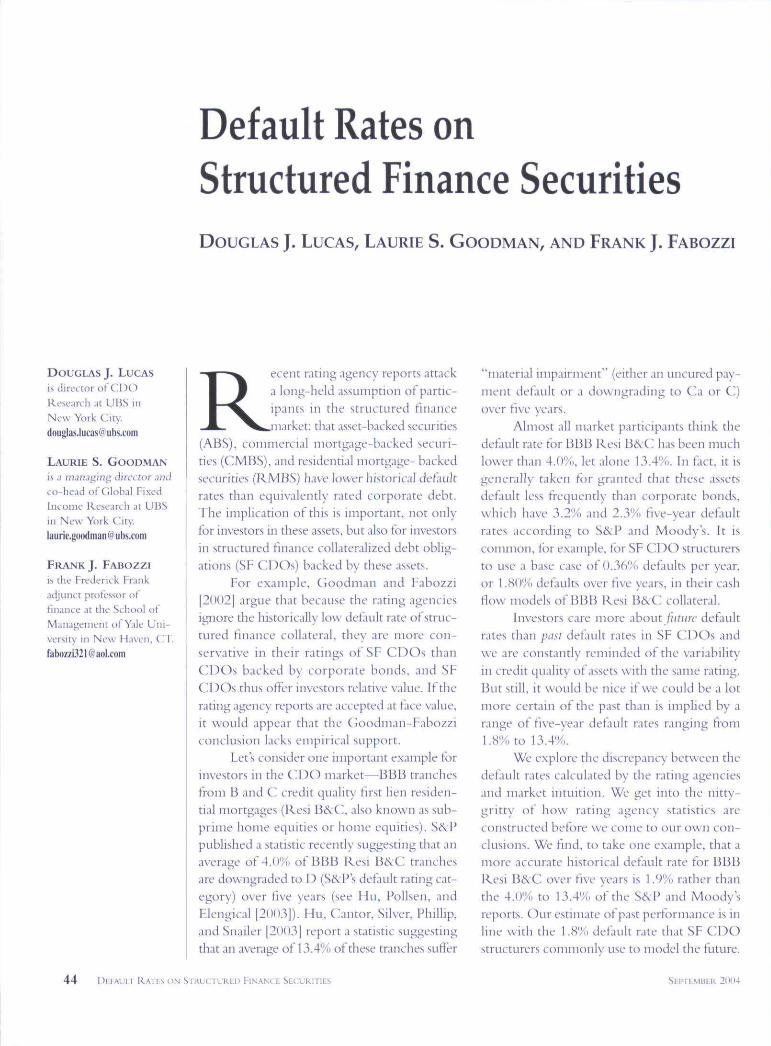
Default Rates onStructured Finance SecuritiesDOUGLAS J. LUCAS, LAURIE S. GOODMAN, AND FRANK J. FABOZZI
DOUGLAS J. LUCAS
is dirL'ctor <it t^DOResearch at UBS mNew York Cit\-,d«[email protected]
LAURIE S . G O O D M A N
IS a managing diRTtor andco-head of Global FixedIntoinc Research at UBSill Ncu- York City.laurie.go([email protected]'oni
F R A N K J. F A B O Z Z I
is the Frederick Fniiikadjunct professor offinance at the School ofManagement of Yale Uni-versity' in New Haven, C~T.fab«zzi32l@a()l.Ci)m
Receiu rating agency reports attack:\ iong-held assumption ot partic-ipants in the structured financemarket: that asset-backed securities
(ABS), connnercial mortgage-backed securi-ties (CMBS), .md residential mortgage- backedsecurities (RMBS) have lower historical defaultrates than equivalently rated corporate debt.The implication ot this is important, not onlyfor investors in these assets, but also tor investorsin structured finance collateralized debt oblig-ations (SF CDOs) backed by these assets.
For example, Cloodm.m and F.ibozzi[2002] argue that because the rating agenciesignore the historically low default rate ot struc-tured finance collateral, they are more con-servative in their ratings of SF CDOs thanCDOs backed by corporate bonds, and SFCDOs thus otl er investors relative value. It therating agency reports are accepted at tace value,it would appear that the Goodinan-Fabozziconclusion lacks empirical support.
Let s consider one important example torinvestors in the CT^O market—BBB tranchesfrom B and C credit qtiality first lien residen-tial mortgages (Resi B&C, also known as sub-prime home equities or home equities). SikPpublished a statistic recently suggesting that anaverage of 4.0% of BBB Resi B&C tranchesare downgraded to D {S&l's default rating cat-egory) over five years (see Hu, Pollsen, andElengical |2OO3]). Hu, Cantor, Silver, Phillip,and Snailer [2()03| report a statistic suggestingthat an average of 13.4% of these tranches suffer
"material impairment" (either an uncured pay-ment detanit or a dtjwngrading to C'a or C")over tive years.
Almost all market participants think tiiedefault rate tor BBB Resi B^"(~ has been muchlower than 4.0%, let alone 13.4%. In fact, it isgenerally taken for granted that these assetsdefault less frequendy than corporate bonds,which have 3.2% and 2.3% five-year defaultrates according to SikP and Moody's. It iscommon, tor example, for SF CDO structurersto use a base case of 0.36% defaults per year,or 1.80% defaults over five years, in their cashflow models of BBIi Resi B&C collateral.
Investors care more about/iifKfc defaultrates than pdst def'ault rates in SF CDOs andwe are constantly reminded of the variabilityin credit quality of assets with the same rating.But still. It would be nice if we could be a lotmore certain of the past than is implied by arange of five-year detault rates ranging from1.8% to 13.4%i.
We explore the discrepancy between thedefault rates calculated by the rating agenciesand market intuition. We get into the nitty-gritty of bow rating agency statistics areconstructed betore we come to our own con-clusions. We find, to take one example, that amore accurate historical default rate for BBBResi B^C over tive years is ].9% rather thanthe 4.0% to 13.4%. of the SixP and Moody'sreports. Our estimate ot past pertormance is mline with the 1.8%, detault rate that SF C D Ostructurers commonly use to model the future.
44 111 1 Mil 1 RAirs UN SiRtjrTURi":n FINANCE SECURITIES 2(1114
We discuss six rating agency reports. We first focuson three S&F reports from January and February 2003tliat show the rate at which different types ot structuredhnance tranches have been downgraded to D {tive-yearrating transitions). In discussing S&P's results, we explainthe advantages of an alternative matrix multiplying approachwhere we extrapolate five-year downgrade rates fromshort-term average rating changes. We then apply thismatrix mtiltiplying technique to two other rating transi-tion studies—a July 2003 S&P rating transition study, anda January 2003 Moody's rating transition study—and weexamine the Moody's study that presents material impair-ment rates tor structured fmance tranches.
I. PRELIMINARY CAUTIONS
How appropriate are historical results in predictingfuture credit performance? While rating transition anddetault studies are necessarily pictures taken of a rear-viewmirror, the nature ot structured finance makes it hard toget an accurate picture of even the past. In a corporatebond rating transition or default study, the unit of studyis the corporate entity. But for structured fmance, theobject of study is the specific tranche issued by a specit'icspecial-purpose entity.
The sheer number of these tranches, each with itsown unique credit characteristics, makes the creation ofdatabases difficult. The fact of a default is often ambiguous;a missed coupon may occur unseen, and the lapse may berectified later. It may also be certain /fi'ir, judging from thestate of the special-purpose entity's collateral portfolio,that a tranche will eventually default later m its lite.
The corporate entity moreover continues on as debtis issued and retired. Each structured finance tranche,however, has a limiteci life, and in a database of structiu^dfuiance defaults, withdrawn ratings abound. We shall secthat the treatment of withdrawn ratings is an importantconsideration in assessing structured finance default studies.
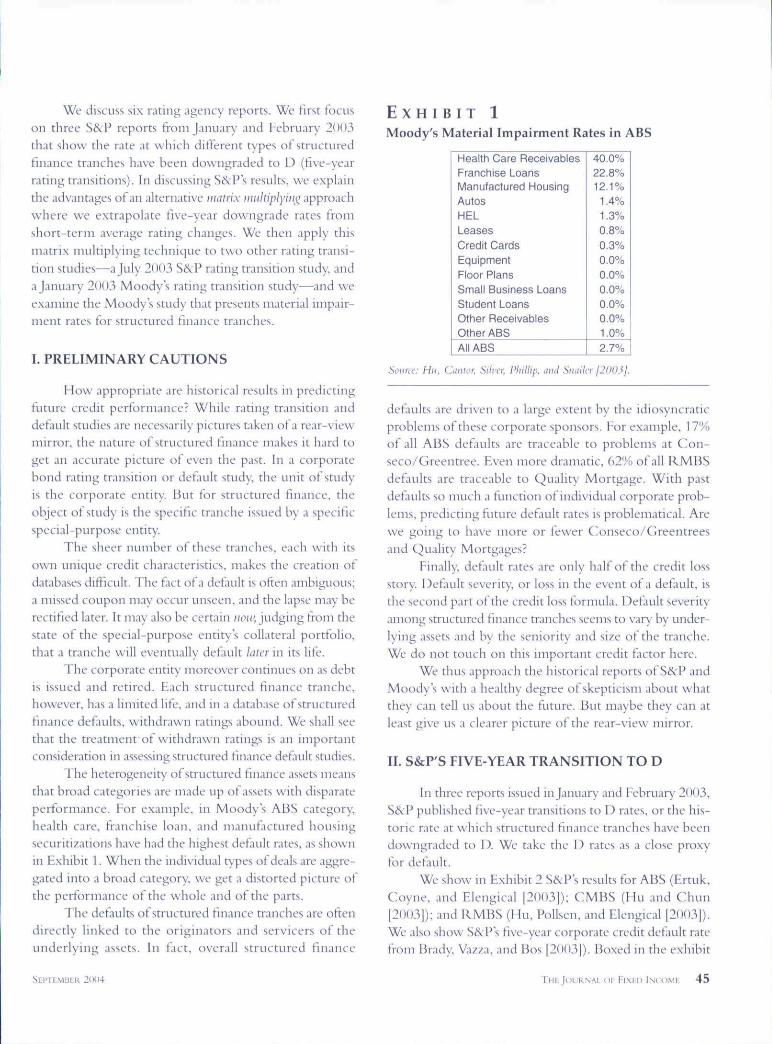
The heterogeneity of structured finance assets meansthat broad categories are made up of assets with disparateperformance. For example, in Moody's ABS category,health care, tranchise loan, and manufactured housingsecuritizations have had the highest default rates, as shownui Exhibit 1. When the individual types of deals are aggre-gated into a broad category we get a distorted picture ofthe performance of the whole and of the parts.
The defaults ot structured finance tranches are oftendirectly linked to the originators and servicers of theunderlying assets. In fact, overall structured finance
E X H I B I T 1
Moody's Material Impairment Rates in ABS
Health Care ReceivablesFranchise LoansManufactured HousingAutosHELLeasesCredif CardsEquipmentFioor PiansSmaii Business LoansStudent LoansOther ReceivablesOther ABSAll ABS
40.0%22.8%12-1%
1.4%1.3%0.8%0.3%0.0%0.0%0.0%0,0%0.0%1.0%2.7%
Soma". Hii. Ciiiior, Silver. Pliillip. dml SiuiUcr j2()0Jj.
defaults are driven to a large extent by the idiosyncraticproblems of these corporate sponsors. For example, 17%of all ABS def^aults are traceable to problems at Con-seco/Greentree. Even more dramatic, 62% ot all RMBSdefaults are traceable to Quality Mortgage. With pastdefatilts so much a tlinction of individtial corporate prob-lems, predicting future default rates is problematical. Arewe going to have more or fewer CA)nseco/()reentreesand Quality Mortgages?
Finally, dcfatilt rates are only half of the credit lossstory. Default severity, or loss in the event of a default, isthe second part of the credit loss formula. l!)efauk severityamong structured finance tranches seems to vary by under-lying assets and by the seniority and size ot the tranche.We do not touch on this important credit factor here.
We thus approach the historical reports of S&P andMoody's with a healthy degree of skepticism about whatthey can tell us about the future. But maybe they can atleast give us a clearer picture of the rear-view mirror.
II. S&P'S FIVE-YEAR TRANSITION TO D
In three reports issued in January and February 2003,SikV published five-year transitions to D rates, or the his-toric rate at which structured finance tranches have beendowngraded to P. We take the 1) rates as a close proxyfor default.
We show in Exhibit 2 S&P's results for ABS (Ertuk,Coyne, and Elengical |2()03|): CMBS (Hu and C:hun|2OO3|); and RMBS (Hu, Pollsen, and Elengical 12003]).We also show S&:P's five-year corporate credit default ratefrom Brady, Vazza, and Bos |2OO3j). Boxed in the exhibit
SEI'TLMBLK 21)04 THIIJOUKNAI oi Fixci) INCOMT, 45
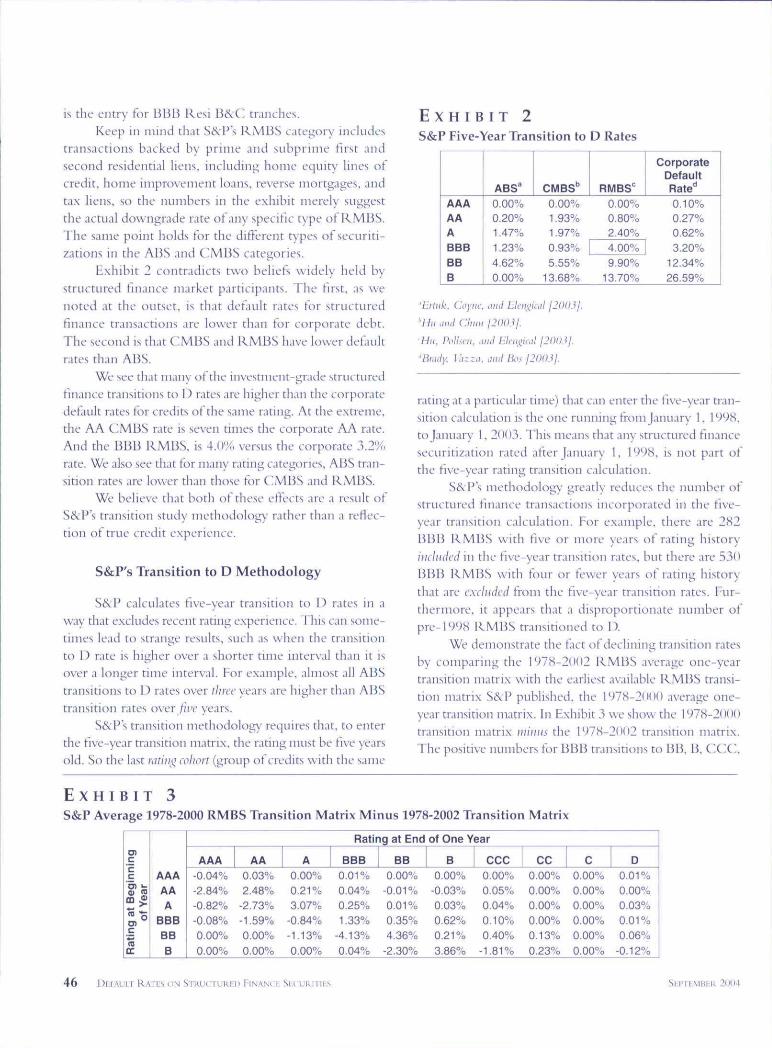
is the L'litry tor lUJB Resi B^C tranches.Keep in mind tliat Si^P's RMBS category iiicltides
transactions backed by prime and subprime first andsecond residential liens, including home equity lines otcredit, home improvement loans, reverse mortgages, andtax liens, so the nimibers in the exhibit merely suggestthe actual downgrade rate of any specitic type of RMBS.The same point holds tor the ditterent types of securiti-zations in the ABS and CMBS categories.
Exhibit 2 contradicts two beliefs widely held bystructured finance market participants. The first, as wenoted at the outset, is that detault rates tor structin"edhnance tiMns.tctions are lower than for corporate debt.The second is that CMBS and RMBS have lower defaultr.ites than ABS.
We see that many of the investment-grade structuredfinance transitions to I) rates .ire higher than the corporatedefault rates for credits of the same rating. At the extreme,the AA CMBS rate is seven times the corporate AA rate.And the BBB RMBS, is 4.0% versus the corporate 3.2%rate. We also see that tor many rating categories, ABS tran-sition rates ,ire lower than those for C^MBS and RMBS.
We believe that both of these ettects are a result otSi 'P's transition study niethodt>logy rather than a reflec-tion ot true credit experience.
S&P's Transition to D Methodology
S&P calculates tive-year transition to 1) rates in away that excludes recent rating experience. This can some-times lead to strange results, such as when the transitionto 1) rate is higher over a shorter time interval th.m it isover a longer time interval. For example, alnu)st all ABStransitions to 1. rates over ilircc years are higher than ABStransition rates over /Jre years.
S&Ps transition methodology requires that, to enterthe five-year transition matrix, the rating must be tive yearsold. So the l.ist rdtiiii^ coliort {group of credits with the same
E X H I B I T 2S&P Five-Year Transition to D Rates
AAAAAABBBBBB
ABS^0.00%0.20%1.47%1.23%4.62%0.00%
CMBS"0.00%1.93%1.97%0.93%5.55%
13.68%
RMBS''0.00%0.80%2.40%4.00%9.90%
13.70%
CorporateDefaultRate''0.10%0.27%0.62%3.20%
12.34%26.59%
'lliluk. Coyne, ami l-lci!i;iui! I2
'•Ilumii! CJuiu 1200}f.
Ihi. l\'ll<n,. ,ui,! liU-Hiiical 120031.
'Bnuly, [;;;;.!, ami Bo^ 1200}j.
rating at a particular time) that cm enter the tive-year tran-sition calculation is the one running from January I. I9'J8,to January 1, 2(>()3. This means that any structured tinancesecuritization rated after January 1, 1998, is not part otthe five-year rating transition calculation.
S&P's methodology greatly reduces the number otstructured tmance transactions incorporated in the tive-year transition calculation. For example, there are 282BBB RMBS with five or more years of rating historyincluded in the tive-year transition rates, but there are 530BBB RMBS with tour or tewer years of rating historythat are cxdiidcd from the five-year transition rates. Fur-thermore, it appears that a disproportionate number otpre-1998 RMBS transitioned to D.
We demonstrate the tact of declining transition ratesby comparing the 1978-2002 RMBS average one-yeartransititm matrix with the earliest available RMBS transi-tion matrix SikV published, the 1978-2000 average one-year transition matrix. In Exhibit 3 we show the 1978-2000transition matrix iiii)iiis the 1978-2002 transition matrix.The positive numbers tor BBB transitions to BB, B, CCC!!,
E X H I B I T 3S&P Average 1978-2000 RMBS Transition Matrix Minus 1978-2002 Transition Matrix
ing
cen !=01 (0
tin
EC
AAAAAA
BBBBBB
AAA-0.04%-2.84%-0.82%-0.08%0.00%
0.00%
AA0.03%2.48%
-2.73%-1.59%0.00%
0.00%
A0.00%0.21 %3.07%
-0.84%-1.13%0.00%
Rating at End
BBB0.01 %0.04%0.25%1.33%
-4.13%0.04%
BB0.00%
-0.01%0.01%0.35%4.36%
-2.30%
of One Year
B0.00%
-0.03%0.03%0.62%0.21%3.86%
ccc0.00%0.05%0.04%0.10%0.40%
-1.81%
cc0.00%0.00%0.00%0.00%0.13%0.23%
c0.00%0.00%0.00%0.00%0.00%0.00%
D0.01%0.00%0.03%0.01%0.06%
-0.12%
46 RATES ON STULHIURI'D TiNANcr 211114
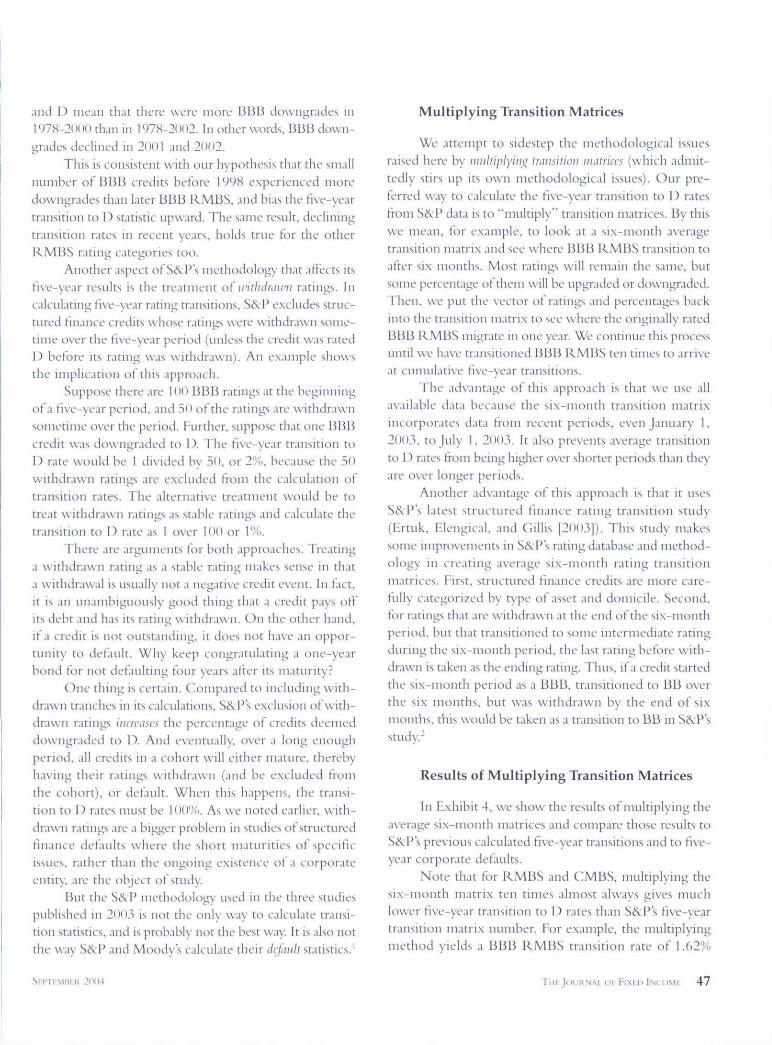
and I) mean that there were more BBB downgrades in1978-20(11) tlian in 197S-2OO2. In other words, BBB down-grades declined in 2(H)1 and 2002.
This is consistent with our hypothesis that the smallnumber of BBB credits before 1998 experienced moredowngrades than later BBB RMBS, and bias the five-yeartransition to D statistic upward. The same result, decliningtransition rates in recent ye.irs, holds true for the otherRMBS rating categories too.
Another aspect ofS&l^'s methodology that affects itsfive-year results is the treatment of ii'ithdnni'ii ratings. Incalculating five-year rating transitions, S&;I* excludes struc-tured finance credits whose ratings were withdrawn some-time over the five-year period (unless the credit was ratedI) before its rating was withdrawn). An example showsthe implication of this approach.
SLippose there are HH) BBB ratings at the beginningof a five-year period, and ISO of the ratings are withdrau'iisometime over the period. Further, suppose that one BBBcredit was downgraded to O, The five-year transiti(.)n toD rate would be 1 divided by 50, or 2%, because the 50withdrawn ratings are excluded from the calculation oftransition rates. The alternative treatment would be totre.it withdrawn ratings as stable ratings and calculate thetransition to I) rate as 1 over 100 or 1%.
I'liere are arguments for both approaches. Treatinga withdrawn rating as a stable rating makes sense in that.1 withdrawal is usually not a negative credit event. In fact,it is an unamhiguoLisly good thing that a credit pays offits debt and has its rating witlidr.nvn. On the other hand,if a credit is not outstanding, it does not have an oppor-tunity to default. Why keep congratulating a one-yearbond for not defiUilting four years after its maturity?
One thing is certain. Compared to including with-drawn tranches in its calculations, SikVs exclusion of with-drawn ratings iiicrciiscs the percentage of credits deemeddowngraded to D. And eventually, over a long enoughperiod, all credits in a cohort will either mature, therebyhaving then- ratings withdrawn (and be excltided fromthe cohort), or defatilt. When this happens, the transi-tion to 1) rates must be 100%. As we noted earlier, with-drawn ratings are a bigger problem in studies of structuredfmance defaults where the short maturities of specificissues, rather than the ongoing existence of a corporateentity, are the object of study.
But the SikV methodology used in the three studiespublished in 2003 is not tbe only way to calculate transi-tion statistics, and is probably not the best way. It is also notthe way S&'P and Moody's calculate their default statistics.'
Multiplying Transition Matrices
We attempt to sidestep the methodological issuesraised here by multiplyiini trcimitioti iiiatria's (which admit-tedly stirs up its own methodological issues). Our pre-ferred way tt) calculate the five-year transition to D ratesfrom S&P data is to "multiply" transition matrices. By thiswe tiieati, for example, to look at a six-month averagetransition matrix and see where BBB RMBS transition toafter six months. Most ratings will remain the same, butsome percentage of them will be upgraded or downgraded.Then, we put the vector of ratings and percentages backinto the transition matrix to see where the originally ratedBBB RMBS migrate in one year. We continue this processuntil we have transitioned BBB RMBS ten times to arriveat cumulative five-year transitions.
The advantage of this approach is that we use allavailable data because the six-month transition matrixincorporates data from recent periods, even January 1,2003. tojuly 1, 2003. It also prevents average transitionto I) rates from being higher over shorter periods than the\'are over longer periods.
Another advantage of this approach is that it usesS&P"s latest structured finance rating transition study(Ertuk, Elengical, and Gillis |2003]). This study makessome improvements in S&Ps rating database and method-ology in creating average six-month rating transitionmatrices. Eirst, structured finance credits are more care-fully categorized by type of asset and domicile. Second,for ratings that are withdrawn at the end of the six-monthperie)d, but that transitioned to some intermediate ratingduring the six-month period, the last rating before with-drawn is taken as tbe ending rating. Thus, if a credit startedtlie six-month period as a BBB, transitioned to BB overthe six months, but was witbdrawn by the end of sixnuMiths. this wxitild be taken as a transition to BB in S&P'sstiidy.-
Results of Multiplying Transition Matrices
In Exhibit 4, wv shtjw tlie results of multiplying theaverage six-month matrices and compare those results toS&P's previous calculated five-year transitions and to ftve-year corporate defaults.
Note that for RMBS and (^MBS. multiplying thesix-month matrix ten times almost always gives muchlower five-year transition to I) rates than S&P's five-yeartransition matrix number. F-or example, the multiplyingmethod vields a BBB RMBS transition rate of 1.62%
Si I ' l l MHI.K 2i)U4 7'Hr JouRNAi or FIXKD INCOMH 47
E X H I B I T 4
SȤcP Five-Year Transition to D Rates
AAAAAABBBBBB
ABSMultiply 5-Year
0.01% 0.00%1.16% 0.20%2.09% 1.47%
13.80% 1.23%42.56% 4.62%82.53% 0.00%
CMBSMultiply
0.00%0.00%0.08%
0.65%4.36%
12.28%
5-Year0.00%1.93%1.97%
0.93%5.55%
13.68%
RMBSMultiply
0.00%0.02%0.47%
1.62%4.50%
14.14%
5-Year0.00%0.80%2.40%
4.00%9.90%
13.70%
CorporateDefault
Rate0.10%0.27%0.62%
3.20%12.34%26.59%
E X H I B I T 5S&P ABS Defaults
AutoCredit CardFranchise LoanManufactured HousingOtherTotal
19981.----1
1999-
--99
2000-----0
2001-291-
12
200212
2232
158
Total24
31331080
Soiinv: Brink, j20()Jj.
while SikP\ five-year matrix shows 4.00%. Tbis, inci-dentally, is consistent with the SF CDO structurer assump-tions of a 1.8% default rate over five years for BBB ResiB&C. We also see that CMBS gain what we thmk is theirrightful place at the top of structured finance credit qualitywith the lowest transition rates.
Yet for ABS, the effect is the opposite, as transitionrates calculated by the multiplying method are higher thanthe five-year rate. This is because ABS credit performancesince 199S has been much poorer than prior to I99H.Tbis recent poorer credit performance is captured only bythe multiplying method. As we mentioned before, thepoor performance of ABS in recent years has mainly comefrom new and untested asset classes.
Exhibit 5 shows S&Ps classification of recent ABSdefiuilts.
Five-Year Transitions of InternationalStructured Finance and CDOs
S&P has also carefully calculated six-month transi-tion rates tor CDOs and structured finance transactionsbacked by assets originated outside the United States.Exhibit 6 shows transition to D rates tor the geographiesand structured fmance categories that could be calculated.
European ABS and emerging market structured
finance transitioTi rates are similar, but usually a little lowerthan for the U.S. ABS. It would seem that S&P facedmore surprises from strange U.S. ABS asset categoriesthan from international ABS asset categories. On average,U.S. C O O transitions are worse than U.S. CMI5S andRMBS. but not as bad as U.S. ABS. European C D O tran-sitions win the booby prize, being worse than U.S. ABS.
Also interesting are the international categories wecould not calculate transition to D rates for: EuropeanC'MBS, European RMBS. Asian structured finance, andAustralia/New Zealand strnctured finance. These cate-gories have never had a transition to D. Of course, thereare not as many tranches making up their statistics, par-ticularly low-rated tranches, as in the U.S. structuredfinance categories.
S&P Study Conclusion
We think our method ot multiplying six-monthtransition matrices from S&P's report by Ertuk, Eleng-ical, and Gillis |2(K)3| is better at assessing tlie long-termcredit quality of structured finance tranches than the five-year transition matrices in S&P's three studies publishedin January and February 2003. The multiplication methodincludes data h-om all years in arriving at long-term resultsand eliminates the problem that short-term transition rates
48 R A I L S t'N SiRUciiURtn FINANC [. Stc SF.I'TEMlirR 2004
may be higher than loiig-rerm tiMiisition rates. It alsomakes use of S&.P's improved d.itab.ise and methods.
S&P's five-year RMBS transition rates are bigbbecause S&P did not rate very many RMBS below AAuntil the last five years, and older RMBS have performedmore poorly than more rccc-ntly issued RMBS. The mul-tiplication methodolog\' leads to lower transition resultsfor RMBS and CMBS that are in hne with our under-standing of these products. It also calculates higher ABStransition rates by weighing in the recent poor perfor-mance of those tranches.
III. MOODY'S RATING TRANSITION STUDY
Moody's structured finance transition study calcu-lates average one-year transition matrices by modified ratingcategories, adding the 1 s. 2s, and 3s to the letter rating des-ignation (see Hu and Cantor [2(103]). Moody's does notcalculate rating transitions over multiple years.
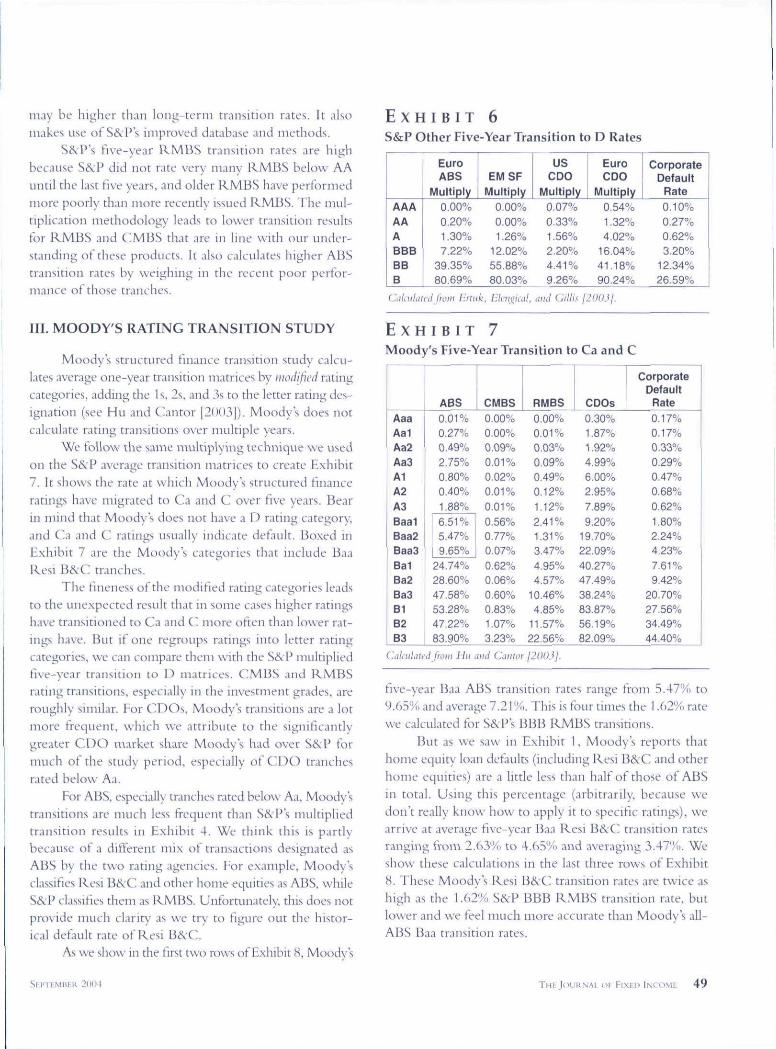
We follow the same multiplying technique we usedon the S&P average transition matrices to create Exhibit7. It shows the rate at which Moody's structured financeratings have migrated to Ca and C over five years. Bearin mind that Moody s does not have a I) rating category,and Ca and C rating,s usually indicate default. Boxed inExhibit 7 are the Moody's categories that include BaaResi BikC tranches.
The tmcness of the modified rating categories leadsto the unexpected result that in some cases higher ratingshave transitioned to Ca and C more often than lower rat-ings have. But it one regroups ratings into letter ratingcategories, we can compare them with the S&'P multipliedfivc-ycar traii'^ition to D matrices, CMBS and RMBSrating transitions, espc-cially in the mvt'Stment grades, areroughly similar. For CDOs, Moody's transitions are a lotmore frequent, which we attribute to the significantlyL^reater C D O market share Moody's had over S&P formuch of the study period, especially of C D O tranchesrated below Aa.
For ABS, especially tranches rated helow Aa, Moody'stransitions are much less frequent than S&P's multipliedtransition results in Exhibit 4. We think this is partlybecause of a different mix of transactions designated asABS by tiie two rating agencies. For example, Moody'sclassifies Resi B&C and other home equities as ABS, whileS&P classihes them as RMBS. Unfortunately, this does notprovide much clarity as we try to figure out the histor-ical default rate of Resi B&C.
As we show in the first two rows of Exhibit 8, Moody's
E X H I B I T 6
S&P Other Five-Year Transition to D Rates
AAAAAABBBBBB
EuroABS
Multiply0,00%0,20%1,30%7,22%
39.35%80.69%
EMSFMultiply
0.00%0.00%1.26%
12.02%55.88%80.03%
USCDO
Multiply0,07%0,33%1,56%2,20%4,41 %9.26%
EuroCDO
Multiply0,54%1,32%4,02%
16,04%41,18%90.24%
CorporateDefault
Rate0,10%0,27%0,62%3,20%
12,34%26.59%
i from l-r G"i7fo IJ
E X H I B I T 7Moody's Five-Year Transition to Ca and C
AaaAalAa2Aa3AlA2A3Baa1
Baa2
Baa3
Ba1Ba2Ba3B1B2B3
ABS0.01%0,27%0,49%2,75%0,80%0.40%1.88%
6.51%5.47%9.65%
24,74%28,60%47,58%53,28%47.22%83.90%
CMBS0,00%0,00%0,09%0,01%0,02%0,01%0,01%0,56%0,77%0,07%0,62%0.06%0,60%0,83%1,07%3,23%
RMBS0,00%0,01%0,03%0.09%0,49%0,12%1,12%2,41%1,31%3,47%4,95%4.57%
10.46%4,85%
11,57%22,56%
CDOs0,30%1,87%1,92%4.99%6.00%2,95%7,89%9,20%
19,70%22,09%40,27%47.49%38.24%83,87%56,19%82,09%
CorporateDefault
Rate0,17%0,17%0,33%0.29%0,47%0,68%0,62%1,80%2,24%4.23%7.61%9.42%
20,70%27,56%34,49%44,40%
Ciihihued tro)ii Hu and Cantor 1200^1.
hve-year Baa ABS transition rates range from .S,47% to9.65% and average 7.21%. This is four times the 1.62% ratewe calculated for S&P's BBB RMBS transitions.
But as we saw in Exhibit 1, Moody's reports thathome equity loan defaults (including Resi B&'C and otherhome equities) are a little less than half of those of A_BSin total. Using this percentage (arbitrarily, because wedon't really know how to apply it to specific ratings), wearrive at average five-year Baa Resi B&C transition ratesranging from 2.63% to 4.65% and averaging 3.47%. Weshow these calculations in the last three rows of Exhibit8. These Moody s Resi B&C] transition rates are twice ashigh as the 1.62% S&P BBB RMBS transition rate, butlower and we teel much more accurate than Moody's all-ABS Baa transition rates.
Sl 'TTMEtFR 2004 OF FlXFll INPOML 49
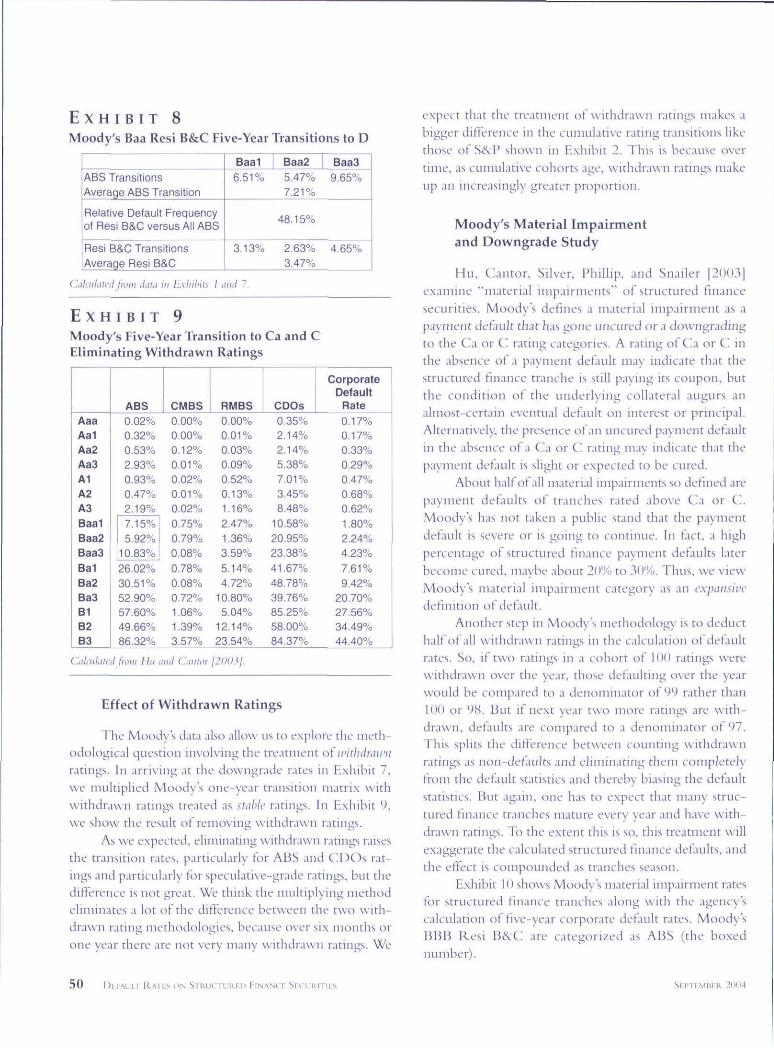
E X H I B I T 8Moody's Baa Resi B&C Five-Year Transitions to D
ABS TransitionsAveraqe ABS Transition
Relative Default Frequencyof Resi B&C versus All ABS
Resi B&C TransitionsAverage Resi B&C
Baa1 Baa2 Baa36,51% 5,47% 9.65%
7,21%
48,15%
3.13% 2.63% 4,65%3.47%
cd fivin daiii in l:xhihiti t iiiitl 7.
E X H I B I T 9Moody's Five-Year Transition to Ca and CEliminating Withdrawn Ratings
AaaAa1Aa2Aa3AlA2A3BaaiBaa2Baa3Ba1Ba2Ba3B1B2B3
ABS0,02%0,32%0,53%2,93%0,93%0,47%2,19%7.15%5.92%
10.83%26.02%30,51%52,90%57,60%49,66%86,32%
1
CMBS0.00%0.00%0,12%0,01%0,02%0,01%0,02%0,75%0,79%0,08%0.78%0.08%0.72%1,06%1,39%3,57%
RMBS0,00%0,01%0,03%0,09%0,52%0,13%1,16%2.47%1.36%3.59%5,14%4,72%
10,80%5,04%
12,14%23,54%
CDOs0,35%2,14%2,14%5.38%7.01%3,45%8,48%
10,58%20,95%23,38%41,67%48,78%39.76%85.25%58,00%84,37%
CorporateDefault
Rate
0,17%0,17%0,33%0,29%0,47%0,68%0.62%
1.80%2,24%4,23%7,61%9,42%
20,70%27,56%34,49%44,40%UO OU,Oil /o 0.01 lO jCJ,iJt
Calailalcd from Hii iiiid (.'.iiiilor j200.ij.
Effect of Withdrawn Ratings
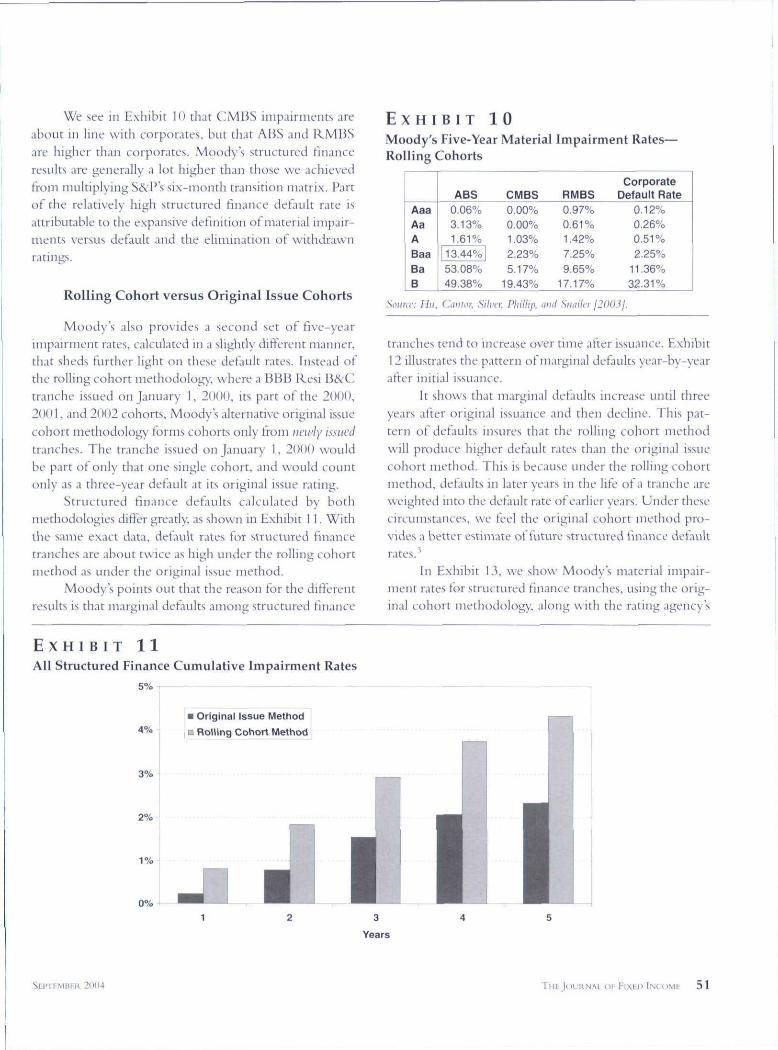
The Moodys data also allow us to explore the meth-odological question mvolving the treatment o{ with drawnratings. In arriving M the downgrade rates m Exhibit 7.we multiplied Moody's one-year transition matrix withwithdrawn ratings treated as stable ratings. In Exhibit 9,we sliow the result ot rcnuiving withdrawn ratings.
As we expected, eliminating \\ ithdrawn ratings raisesthe transition rates, particularly tor ABS and C^DOs rat-ings and particularly for speculative-grade ratings, but thedifference is not great. We think the multiplying methodeliminates a lot of the difference between the two with-drawn rating methodologies, because over six months orone year there are not very many withdrawn ratings. We
expect that the treatment of withdrawn ratings makes abigger diflerence in the cumulative rating transitions liketln>se ot S&P sliown in Exhibit 2. This is because overtime, as cumulative cohorts age, withdrawn ratings makeup an increasingly greater proportion.
Moody's Material Impairmentand Downgrade Study
Hu, Cantor, Silver. Phillip, and Snailer [2003]examine "material impairments" of structured financesecurities. Moody's defhies a material impairment as apayment default that has gone uncured or a ciowngradingto the Ca or C rating categories. A rating of Ca or C inthe absence of a payment det ault may indicate that thestructured finance tranche is still paying its coupon, butthe condition of the underlyiiitf collateral augurs analmost-certain eventual default on interest or principal.Alternatively, the presence of an uncured payment defaultin the absence of a Ca or C' rating may indicate that thepayment default is slight or expected to be cured.
About half of all material impairments so defined arepayment defaults of tranches rated above Ca or C".Moody's has not taken a public stand that the paymentdefault IS severe or is going to continue. In fact, a highpercentage of structured finance payment defaults laterbecome cured, maybe about 20% to 3O'X). Thus, we viewMoody's material impairment category as an expansivedefinition of default.
Another step in Moody's methodology" is to deducthalt of all withdrawn ratings in the calculation of defaultrates. So, if two ratings in a cohort ot 100 ratings werewithdrawn over the year, those defaulting over the yearwould be compared to a denominator of 99 rather than100 or 98, But if next year two more ratings are with-drawn, defaults are compared to a denominator of 97,This splits the difference between counting withdrawnratings as non-defaults and eliminatinu; them completelyfrom the defluilt statistics and tliereby biasing the defaultstatistics. But again, one has to e.xpect that many struc-tured finance tranches mature every year and have with-drawn ratings. To the extent this is so. this treatment willexaggerate the calculated structured finance def'aults. andthe efTect is componnded as tranches season.
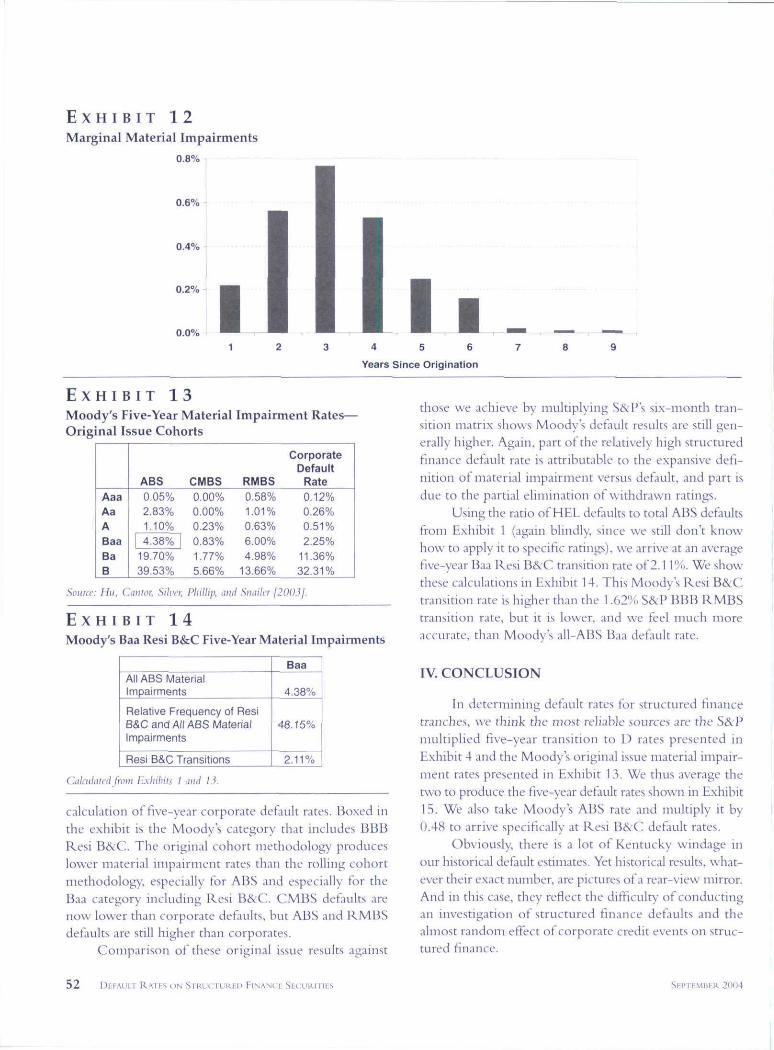
Exhibit 10 shows Moody's material impairment ratesfor structured finance tranches along with the agency'scalculation of five-year corporate defiiult rates. Moody'sBBB Resi B&C are categorized as ABS (the hoxednumber).
50 DiTAUI.T RAIKS ON STRUrTURRI) FiNANCF. SFCURITIFS 2 ( H 1 4
We see in Exhibit 10 tli.it CMliS inip.urnieiits areabout ill line witii corporates. but that ABS and l^MHSarc liigher than corporates. Moody's structured financeresults are generally a lot higher than those we achievedfrom multiplying S&Fs six-month transitit^i matrix. P:irtof the relatively high structured fuiance default rate isattributable to the expansive definition ot tnaterial impair-ments versus default and the elimination of withdrawnratings.
Rolling Cohort versus Original Issue Cohorts
Moody"s also provides a second set of five-yearimpairment rates, calctilated in a slightly different manner,that sheds further light on these default rates. Instead ofthe rolling cohort methodology, where a BBB Resi B&C-tranche issued on |aiiLiary 1. 2000, its part of tiie 2000,2001, and 2002 cohorts, Moodys alternative original issuecohort methodology forms cohorts only from imi'ly Issuedtranches. The tranche issued on January 1, 2000 wouldbe part of only that one single cohort, and would coLintonly as a three-year default at its original issue rating.
Structured finance defaults calculated by bothriK'thodologies differ greatly, as shown in Exhibit I I. Withthe same exact data, detank rates for structured financetranches are about twice as high under tbe rolling cohortniL'tbod as under tbe original issue metbod.
Moody's points out that the reason for the differentrestilts is that marginal defaults among structured finance
E X H I B I T 1 0
Moody's Five-Year Material Impairment Rates—Rolling Cohorts
AaaAaABaaBaB
ABS0.06%3.13%1.61 %
13.44% I53.08%49.38%
CMBS0.00%0.00%1.03%2.23%5.17%
19.43%
RMBS0.97%0.61 %1.42%7.25%9,65%
17.17%
CorporateDefault Rate
0.12%0.26%0,51%2.25%
11.36%32.31%
Soiinr: Hu, Cuiiior, Sihvr, Phillip, and Siiaiter 120031.
tranches tend to increase over time after issuance. Exhibit12 illustrates tbe pattern of marginal defaults yc-ar-by-yearafter initial issuance.
It shows that marginal detanks increase until threeyears after original issuance and then decline. This pat-tern of defaults insures that the rolling cohort methodwill produce higher default rates than the original issuecohort method. This is because under the rolling coliortmethod, defaults in later years in tbe life of a tranche areweighted into the default rate of earlier years. Under thesecircumstances, we feel the original cohort method pro-vides a better estimate of future structured finance defaultrates.'
In Exhibit 13. we show Moodys material impair-ment rates tor structured hnance tranches, using the orig-inal cohort methodology, along with the rating agency's
E X H I B I T 1 1
All Structured Finance Cumulative Impairment Rates
5%
• Original Issue Method
B Rolling Cohort Method
Years
2(1114 TuiiJOURNA! Oh FlXFH KcdMh 5 1
E X H I B I T 1 2
Marginal Material Impairments
0.8%
0.6%
0.4%
0.2%
0.0%
Years Since Origination
E X H I B I T 1 3Moody's Five-Year Material Impairment Rates-Original Issue Cohorts
AaaAaABaaBaB
ABS0.05%2.83%1,10%
1 4,38%19,70%39,53%
CMBS0,00%0,00%0,23%0,83%1,77%5,66%
RMBS0,58%1,01%0,63%6,00%4,98%
13,66%
CorporateDefault
Rate0,12%0.26%0.51 %2,25%
11,36%32,31%
Soitra-: Hii. Cmnor, Silver, Phillip, tiiid Siiailcr [2
E X H I B I T 1 4Moody's Baa Resi B&C Five-Year Material Impairments
All ABS MaterialImpairments
Relative Frequency of ResiB&C and All ABS MaterialImpairments
Resi B&C Transitions
Baa
4,38%
48.15%
2.11%
Bxhihits I tvid
calculation of five-year corporate default rates. Boxed inthe exhibit is the Moody's category that includes BBBResi B&C. The origin:il cohort methodology produceslower material impairment rates than the rolling cohortmethodology; especially for ABS and especially for theBaa category including Resi B&C. CMBS defaults arenow lower than corporate defaults, hut ABS and RMBSdefaults are still higher than corporates.
Comparison of these original issue results against
those we achieve by multiplying S&Ps six-month tran-sition matri.x shows Moody's defiult results are still gen-erally higher. Again, part ot the relatively high structuredfmance deflmlt rate is attributable to the expansive defi-nition ot material impairment versus default, and part isdue to the partial elimination of withdrawn ratings.
Using the ratio of HEL defaults to total ABS defaultsfrom Exhibit 1 {again blindly, since we still don't knowhow to apply it to specific ratings), we arrive at an averagefive-year Baa Resi B&:C. transition rate of 2.11%. We showthese calculations in Exhibit 14. This Moody's Resi B&Ctransition rate is higher than the 1.62% S&P BBB RMBStransition rate, but it is lower, and we feel much moreaccurate, than Moody's all-ABS Baa default rate.
IV. CONCLUSION
In determining default rates for structured financetranches, we think the most reliable sources are the S&Pmultiplied five-year transition to ][) rates presented inExhibit 4 and the Moody s original issue material impair-ment rates presented in Exhibit 13. We thus average thetwo to produce the five-year default rates shown in Exhibit15, We also take Moody's ABS rate and multiply it by0.4K to arrive specifically at Resi B&C default rates.
Obviously, there is a lot ot Kentucky windage inour historical default estimates. Yet historical results, what-ever their exact number, are pictures of a rear-view mirror.And in this case, they reflect the difficulty of conductingan investigation of structured finance det'aults and thealmost random etYect of corporate credit events on struc-tured finance.
52 DEFAUIT RAT :s ON STRUCTURFD FIIMANCL SECUKITIRS SET'TEMHER 2004
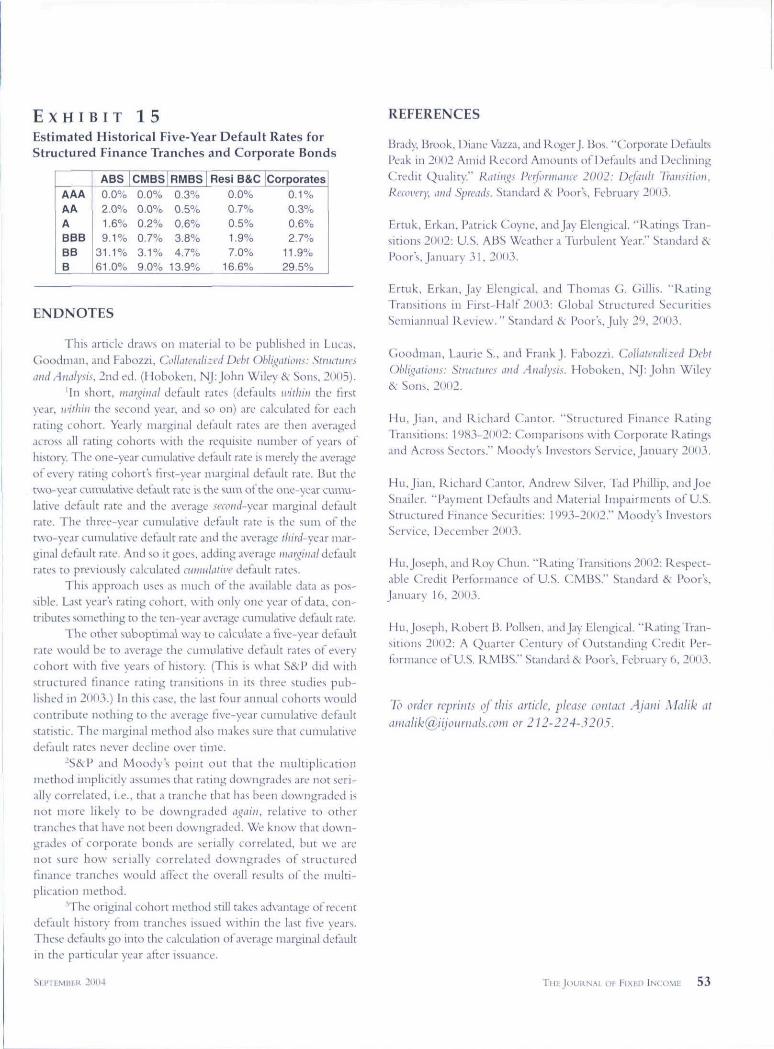
E X H I B I T 1 5
Estimated Historical Five-Year Default Rates forStructured Finance Tranches and Corporate Bonds
AAAAAABBBBBB
AB50.0%2.0%1.6%9.1%
31.1%61.0%
CMBS0.0%0,0%0.2%0.7%3.1%9.0%
RMBS0.3%0.5%0.6%3.8%4.7%
13.9%
Rest B&C0.0%0.7%0.5%1.9%7.0%
16.6%
Corporates0.1%0,3%0.6%2.7%
11.9%29.5%
ENDNOTES
This article draws on material to be published in Lucas.Goodman, and Fabozzi, CoUatcraHzcd Debt C)bl{i;iitioiis: Swicfurcsand Analysis, 2nd ed. (Hobokcii. NJ:John Wiley & Sons. 2005).
'In short, marginal default rates (defaults within the tlrstyear, within the second year, and so on) are calculated tor eachrating cohort. Yearly marginal default rates are then averagedacross all rating cohorts with the requisite iiunihcr of years oihistory. The one-year cuniularivc default rate is merely the averageof every rating cohort's tlrst-year marginal default rate. Buc thetwo-year cumulative default rate is the sum of the one-year cumu-lative default rate and the average sccoiul-ycar marginal detaultrate. The three-year cumulative dehiult rate is the sum of dietwo-year cumulative detault rate and the aveniiie f/dnV-year mar-ginal delault rate. And so it goes, adding average iiuiri;iiial defaultrates to previously calculated ttiiiiuLilii'c default rates.
This approach uses as much ot the availahle data as pos-sible. Last year's rating cohort, with only one year of data, con-tributes something to the ten-year average cumulative default rate.
The other suboptimal way to calculate a five-year defaultrate would be to average the cumulative default rates of everyct)hort with five years of history. (This is what S&:V did withstructured finance rating transitions in its three studies pub-lished in 2(103.) In this case, the last four annual cohorts wouldcontribute nothing to the average five-year cumulative detaultstatistic. The marginal method also makes sure that cumulativedefault rates never decline over time.
-S&.P and Moody's point out that the multiplicationmethod implicitly assumes that rating downgrades are not seri-ally correlated, i.e., that a tranche that has been downgraded isnot more likely to be downgraded tigaiii. relative to othertranches that have not been downgraded. We know tbat down-gracies ot corporate bonds are serially correlated, but we arenot sure bow serially correlated downgrades of structuredfinance trancbes would atTect the overall results of tbe multi-plication metbod.
^The original cohort method stilJ takes advantage of recentdetauit history troni tranches issued within the last tive years.These detaults go into the calculation of average marginal def.uilrin the particular year after issuance.
REFERENCES
Brady, Brook, Diane Vazza, and Roger J. Bos. "Corporate DetanksPeak in 20(12 Amid Record Amounts of Detaults and DecliniTigCredit Quality." l^atiiii><: Perforiiuvicc 2002: DeJauU Transition.Recovery, and Spreads. Standard ik Poor's. February 2003.
Ertuk, Erkan, Patrick Coyne, and Jay Elengical. "Ratings Tran-sitions 2002: U.S. ABS Weather a Turbulent Year." Standard &Poor's, January 31,2003.
Ertuk, Erkan, Jay Elengical, and Thomas G. Gillis. "RatingTransitions in Eirst-Half 2003: Global Structured SecuritiesSemiannual Review. " Standard Ik Poor's. July 29, 2003.
Goodman, Laurie S,. and Frank J. Eabozzi. CoUaterahrrcd DebtObli_^alions: Stniaiircs and Analysis. Hoboken, NJ: John Wiley& Sons, 2002,
Hii, Jian, and Richard Cantor. "Structured Einance RatingTransitions: 19S3-2OO2: CoinparisoTis with Corporate l^atingsand Across Sectors." Moody's Investors Service, January 2003.
Hu, Jian, Richard Cantor. Andrew Silver. Tad Phillip, and JoeSnailer, "Payment Defaults and Material Impairments of U.S.Structured Einance Securities: 1993-2002," Moody's InvestorsService. December 2003.
I hi, losepb, and Roy Cbun. "Rating Transitions 2002: Respect-able Credit Performance of U,S. CMBS." Standard & Poors,January 16, 2003.
Hu,Joseph, Robert B, Pollsen, and Jay Elengical. "RatingTran-sitions 2002: A Quarter Century of Outstanding Credit Per-torniance of U.S. RMBS." Standard & Poor's, February 6, 2003.
To order reprints oj this artidc, plduc Lontiict Ajcuii MaHk at
[email protected] or 212-224-3205.
Si.l'U.Mltt-R 2(11)4 THE JOURNAL OI- FIXED 53