Embed Size (px)
Citation preview
About Corporate Default Rates
In the new Basel II framework, and for managing credit risk in general, perhaps the most
important element to specify and analyze is the probability of default (Pd) of a credit-
counterparty. Whether debt instruments are considered on a stand-alone basis, or within a
portfolio context, default probabilities, and adjustments for recoveries (next chapter), play a
critical role in risk assessment and valuation. Indeed, the two main requirements for a financial
institution’s acceptance as a Basel II “Advanced Bank” is its implementation of an “internal-rate-
based (IRB) approach,” involving a specification of Pd and RR (recovery rate) for each
counterparty in all asset classes in order to specify the expected and unexpected loss-given-
default (LGD).
The most comprehensive and almost universally referred to corporate default statistics
available today are stratified by company or facility bond ratings and by some aging period from
a base point in time. These data are updated annually by the leading ratings agencies and the
latest data through 2006 can be found in Fitch (2007), Moody’s (2007) and Standard & Poor’s
(2007). In addition, Altman (e.g., 2007) reports updated defaults measured both in a
“traditional” and “cumulative-mortality” format. We will present and discuss each of these
statistical methodologies and results carefully as it is very important for the user to understand
the subtleties, as well as the magnitudes, of these risk measures when applying them to their own
portfolios as well as when determining risk-capital requirements under Basel II. In addition, the
Pd of a corporate counterparty is fundamental to the pricing and evaluation of a credit default
swap (CDS) or a CDO on a bundle of CDSs.
In this chapter we focus on corporate bonds and corporate loans in the United States, with
some reference to other areas and asset classes. In particular, we concentrate on corporate high-
1
yield (or “junk” bonds) and their loan counterpart, “leveraged-loans.” The reason is that these
asset classes are almost always the risk class designation of a corporate credit asset just prior to a
default.
High-Yield Bond Default Rates
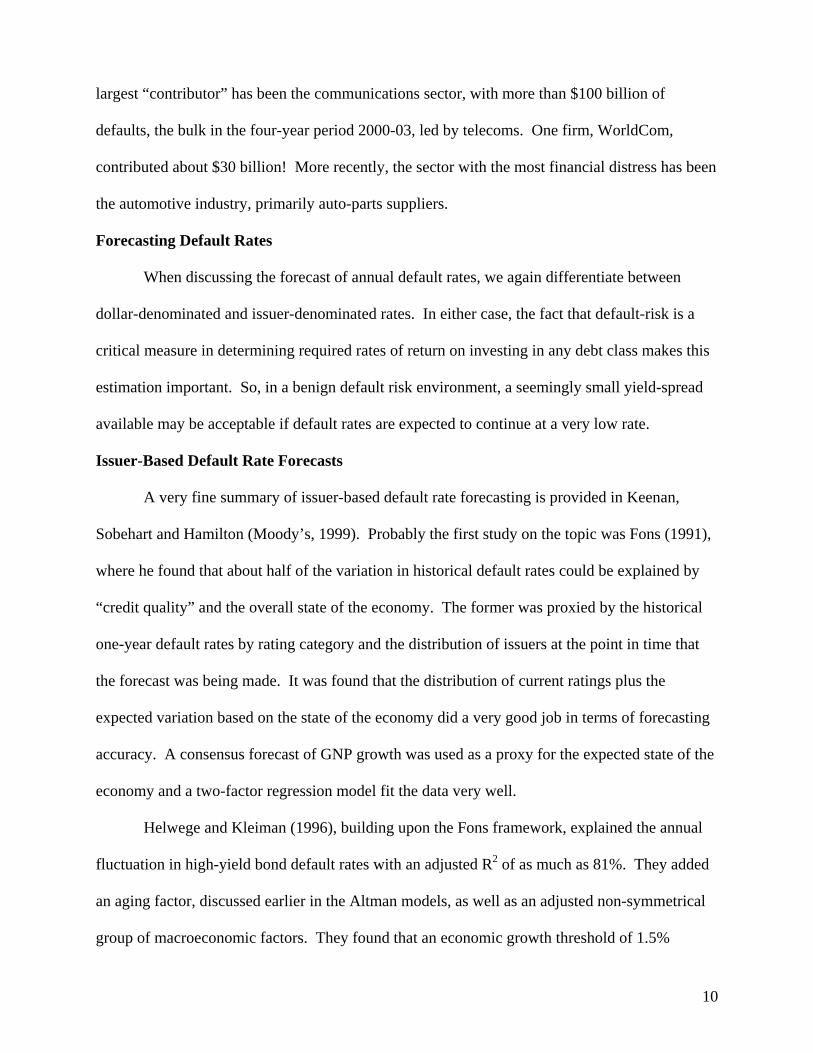
As noted above, a relevant metric for assessing default risk in the corporate sector is the
high-yield, or “junk” bond, market default rate over various periods of time. This market has
grown from a basically all “fallen-angel” market (investment grade, usually when first-issued,
but like many of us, we get “uglier” as we age and the issue is eventually downgraded to non-
investment grade or “junk” status) in 1998 of about $7 billion to about $1 trillion in 2006 (see
Figure 15.1). In a sense, these high-yield, high risk bonds are the “raw material” for possible
defaults.
Defaults are defined as bond issues that have missed a payment of interest and this
delinquency is not cured within the “grace-period” (usually 30 days), or the firm has filed for
bankruptcy under reorganization (Chapter 11) or liquidation (Chapter 7), or there is an
announcement of a distressed-restructuring. The latter typically involves a tender for an equity
for debt swap, where the creditors accept a lower-priority security in-lieu of the bond (usually
common equity), or a lower coupon rate payment or an extension to repay the bond is proposed.
Default rates can either be calculated in dollar-denominations (e.g., by Altman and
FITCH Ratings) or issuer-denominated rates (e.g., by Moody’s and S&P). Moody’s also now
reports default rates denominated in dollars. The dollar-denominated rate vs. issuer-denominated
rate has a very high correlation over time but can be quite different at a particular point in time.
For example, Moody’s speculative grade issuer-denominated rate in 2006 was 1.57% and its
dollar-denominated rate was 1.07%. In 2002, when default rates were very high, the dollar rate
was significantly greater than the issuer rate. In general, dollar-denominated rates are more
2
volatile than issuer-denominated rates. As to which rates are more relevant to investors, the
correct answer is that both are relevant, depending on the investment strategy followed. For
example, most institutional investors in high-yield bonds or leverage-loans do not invest an equal
dollar amount in each issue. So, for them a dollar-weighted rate would seem to be most relevant.
For “equal-weighted” investors, like CDOs (collateralized debt obligations), the issuer-rate
makes more sense since the collateral in the “pool” is usually equally-weighted as to the amount
purchased.
Table 15.1, from Altman and Ramayanam (2007), shows the high-yield, dollar-
denominated rate for corporate bonds in the U.S. and Canada, from 1971-2006. Since relatively
few managers invest in the total spectrum of bond rating classes (from AAA to CCC), the high-
yield, speculative-grade rate of default is relevant for analysts and investors in this asset class.
We will see, however, that default rates can be broken down by the full spectrum of ratings and
are also reported by Altman, the rating agencies and some investment banks. The weighted-
average (by dollar amount outstanding) annual default rate for the 36-year period 1971-2006 is
4.24% per year and the arithmetic-average is 3.17% per year, with a standard deviation of 3.07%.
We can observe that the annual default rate has varied from as low as 0.158% in 1981 to as high
as 12.80% in 2002. The median rate is 1.80% per year and the difference between the averages
and median rate can be explained by the truncated distribution of zero (0) as the minimum but, in
some years, like 1990, 1991, and 2002, the rate can exceed 10.0%. Indeed, we can observe that
the rate has been about 10% or more (including 2001’s 9.8%) in four out of the 36 years (11%)
that we have calculated this rate. Since 10% or greater is about two-standard-deviations above
the mean, four observations with this amount is more than what one might expect in a 36-year
time period if we assumed a normal distribution (i.e., 2 ½% of the 36 years, or about one
observation).
3

In 2006, the default rate was a miniscule 0.76%, the lowest rate in 25 years (since 1981
when the high-yield bond market was only $17 billion). The Moody’s issuer-denominated rate
was somewhat higher at about 1.57%, but it too was at a very low rate compared to its historical
average of close to 5% per year. Both of these rates are consistent with an extremely benign
credit environment. Indeed, from Figure 15.2, we can observe a very low quarterly and annual
default rate from 2003-2006, with the exception of an upward blip in late 2005 when several
very large defaults took place (e.g., Delta and Northwest Airlines, Delphi Corp., Calpine Corp.).
Much has been written and discussed, of late (e.g., see Altman, 2006), about the unusually low
default rate period and whether conditions will revert back to the average rate or whether the
extreme, massive liquidity picture will remain with us for a long time to come. We do observe
another benign period from 1993 to 1998, so while it is possible that the current period will
persist, we are of the opinion that there will be a reversion to the mean and, indeed, this is
perhaps overdue.
Mortality and Cumulative Default Rates
While the traditional approach to measuring default rates is appropriate for gauging
average annual rates for a broad cross-section of high-yield bonds, or any asset class that is
relevant to the investor/analyst, it is not adequate for a number of reference benchmarks. For one
thing, it does not reference specific bond ratings within the high-yield space (e.g., BB, B, or
CCC) and, indeed, it does not address, at all, the investment grade classes. In addition, it does
not address the timing of the default from some reference date. In order to be more precise about
expected default rates for a given credit rating, Altman (1989), Moody’s (1990) and S&P (1991-
92), all identified the relevant cohort group for measurement as the bond rating at some point in
time. As will be shown, however, Altman’s mortality measure examines bonds with a certain
original rating for a period of up to ten years after issuance. Moody’s and Standard & Poor’s
4

assess default rates of all bonds of a given bond rating, regardless of their age. Moody’s was of
the view that macroeconomic phenomena are more important than vintage effects. It should also
be noted that Moody’s uses the issuer as the basic unit of account. And, a recent paper (Cantor
and Hamilton, 2006), discussed Moody’s more refined measure that now does specifically
incorporate an aging factor in their cumulative default rate calculations as well as the pros and
cons of calculating default rates that are adjusted for rating withdrawals. Their method does not,
however, analyze default rates from the date of original issuance (see discussion below).
Altman (1989) retains the notion that default rates for individual periods - - yearly, for
example - - are measured on the basis of defaults in the period relative to some base population
in that same period. The calculation, however, becomes more complex when we begin with a
specific cohort group, such as a bond-rating category, and track that group’s performance for
multiple time periods. Because the original population can change over time as a result of a
number of different events, Altman considers mortalities in relation to a survival population and
then inputs the defaults to calculate mortality rates. Bonds can exit from the original population
because of at least five different kinds of events: defaults, calls, sinking funds, merger-takeouts
and maturities.
The individual mortality rate of bonds in a specific rating class for each year (marginal
mortality rate, or MMR) is calculated using the equation:
MMRtotal valueof defaulting debt in the year t
total valueof the populationof bondsat the start of the year tt( )
( )( )
=
The cumulative mortality rate (CMR) is measured over a specific time period (1, 2, . . ., T years)
by subtracting the product of the surviving population of each of the previous years from one
(1.0); that is,
5
CMR SRT tt
T
( ) ( )= −=∏1
1
Where CMR(T) = cumulative mortality rate in (T), SR(t) = survival rate in (t); 1 – MMR(t).
The individual years’ marginal mortality rates for each bond rating are based on a
compilation of that year’s mortality measured from issuance over the entire sample period, e.g.,
1971-2006. For example, all of the one-year mortalities (36 weighted compilations) are
combined for the sample period to arrive at the one-year rate; all (35) of the second-year
mortalities are combined to compute the two-year rate, and so on.
The mortality rate is a value-weighted rate for the particular year after issuance rather
than an unweighted average. If we were simply to average each of the year-one rates, year-two
rates, and so on, our results would be susceptible to significant specific-year bias. If, for
example, few new bonds were issued in a given year and the defaults emanating from that year
were high in relation to the amount issued, the unweighted average could be improperly affected.
Altman’s (1989) weighted-average technique correctly biases the results towards the larger-
issuance years, especially the more recent years.
Using data going back to 1971, Altman has measured and updated corporate bond default
rates from each of the major S&P rating categories (similar results could be expected if Moody’s
ratings were used). The most recent estimate of marginal and cumulative mortality rates for up
to ten years after issuance are for the period 1971-2006 and are shown in Table 15.2. The
expected hierarchy of cumulative default rates can be observed, i.e., higher rates for comparable
years after issuance for lower credit rating cohorts, except for two anomalies. One is the higher
AA cumulative rates than the single-A. The other is the second-year marginal rates for BBB
bonds compared to BB bonds or compared to year three BBBs. The former is caused by the
large Texaco Corporation’s Chapter 11 bankruptcy filing in 1987, which involved over $3.0
6
billion of originally AA rated bonds. The latter was due to an even larger amount of WorldCom
bonds that were originally rated BBB and issued in 2000 and defaulted two years later in 2002.
These anomalies would not manifest if the issuer denominated rates were observed.
The loss rates for AA bonds show the expected hierarchy, however, as Texaco’s bonds
recovered over 80% of their face value just after default - - far above the average recovery of
about 40% for all bonds. Table 15.3 shows the mortality-loss rates for the same period 1971-
2006. Note that the loss rates are based on the mortality default rates found in Table 15.2,
adjusted for recoveries at default. For an in-depth discussion of recovery rates, see Chapter 16.
There are several noteworthy aspects to the mortality rate table. First, we can observe
that the marginal rates for high-yield bonds in the first three or four years of a bond’s life rise
each year and then tend to level off for several years thereafter. Hence, we do note an aging
effect, which can be observed only by tracking default rates from original issuance. The aging
effect is intuitively sound, since most companies have a great deal of cash just after they issue a
bond. Even if their operating cash flow is negative, they are usually able to meet several periods
of interest payments.
It should be noted that the lower-rated categories, such as single-B, have default rates that
appear to be very high. Cumulative defaults are nearly 28 percent by the fifth year and 37
percent by the tenth year. But these rates are not so high when viewed in relation to promised
yield spreads, which averaged nearly 5 percent per year over the sample period. Factoring in
average recovery rates of at least 40 percent (and higher of late), a 28 percent five-year default
rate results in an 18 percent cumulative loss rate, or a loss of about 2.5 percent per year. Indeed,
the high-yield bonds, of which single-B’s have been the dominant category, returned 2.56
percent per year above the risk-free rate in the 1978-2006 period (Altman and Ramayanam,
2006). The investor should also factor in the volatility of returns as well as the average spread.
7
Comparing Cumulative Default Rates
We have mentioned the major differences between the rating agencies’ reported default
rates and Altman’s. These different methodologies, which are summarized in Table 15.4,
include (1) face value dollar amount (Altman) versus issuer basis, (2) actual ratings (Altman)
versus implied senior-unsecured rating, (3) domestic straight debt only (Altman) versus domestic
(including convertibles) and foreign, (4) original issuance (Altman) versus cohort grouping,
regardless of age, (5) mortality rates (Altman) versus default rates, and (6) different sample
periods. Of particular relevance is point # 4. In contrast to Altman’s original issue rating
approach, Moody’s and the other rating agencies “cohort method” is based on pools of issuers
holding a given rating on the cohort date regardless of original rating or time since issuance.
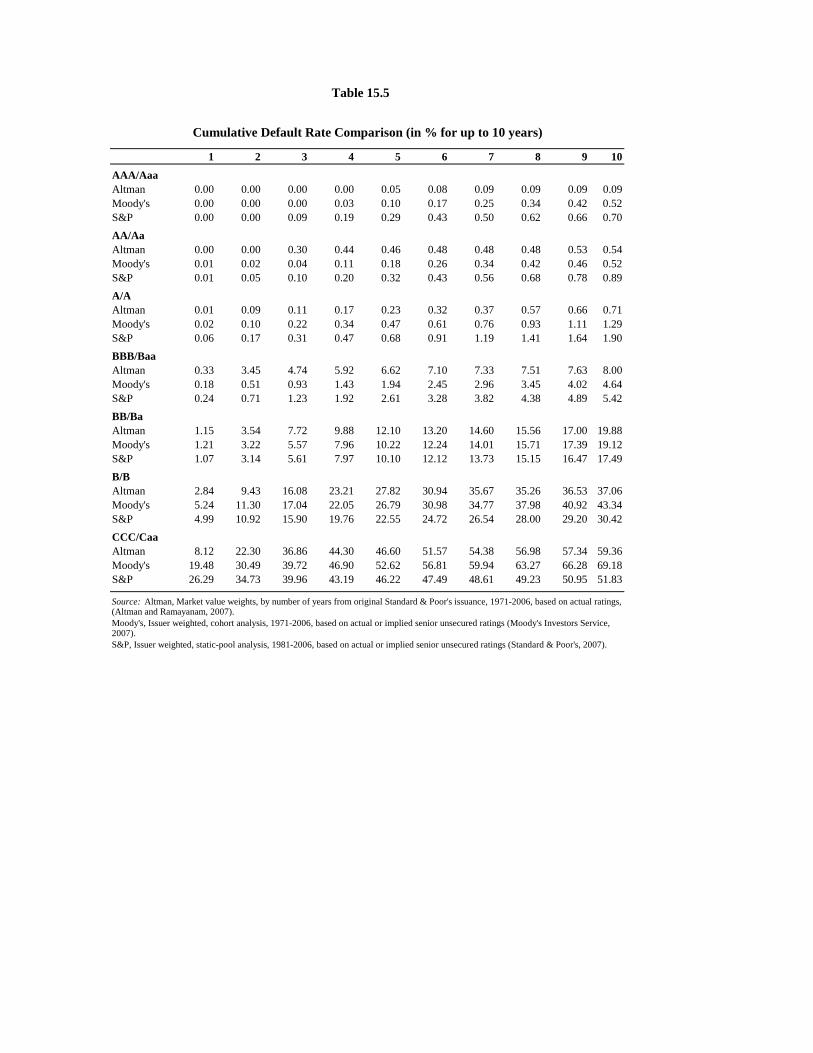
Table 15.5 shows the one- to ten-year cumulative rates from the three primary sources of
data. The primary empirical difference between the mortality/original issuance approach, the
static pool method used by Standard & Poor’s, and the dynamic cohort method used by
Moody’s, is the observed default rates in the first several years - - particularly in the lower-grade
classes. For example, Altman’s first-year rate for single-B bonds is 2.84%, while Moody’s and
Standard & Poor’s are 5.24% and 4.99%, respectively. These relative differences persist until
the third year, after which the results are quite similar. For example, the fifth-year Moody’s rate
is 26.79% versus 27.82% for Altman. Standard & Poor’s rate is actually lower (22.55%) than
Altman’s in the fifth year due to lower marginal rates in some years. This difference is difficult
to explain. As noted earlier, the main reason for these differentials is the aging effect.
Which method is best to use probably depends upon the age distribution of the relevant
portfolio of individual bonds. For new issuance analysis, which is often the perspective for
investors in corporate bonds, the mortality rate approach would seem to be more relevant. For
8
portfolios of seasoned bonds, the rating agency approach would perhaps be more relevant. All of
the methods include sample periods that cover many business cycles.
Altman’s marginal rates could also be used, but only for assessing the one-year marginal
default rates for bonds which have survived up to that point. A portfolio manager’s strategy
regarding the weighting of bonds could also influence the choice of approach. Altman weights
the larger issues more than smaller ones, while the rating agencies weight each issuer equally.
Age of Defaults
Table 15.6 shows the age distribution of defaults for the period 1989-2006. Note that the
traditional pattern of low defaults in the first year after issuance followed by increased levels for
years two and three are found in 2006 as well as for the entire sample period. All of these years,
however, had lower proportions in 2006 compared to historical averages. Also, the distribution
is rather flat in 2006 in the periods two to nine years after issuance, with a slight spike in the
sixth year (by number of issues). However, 2006 follows a trend seen over the last several years
in which defaults are occurring later (years 6-9), than are observed from the historical averages.
Fallen Angel Defaults
One factor that can impact the aging of defaults is whether the defaulting issues were at
any point in time investment grade and then downgraded (fallen-angels). Table 15.7 shows a
time series of the proportion of defaulting issues that were fallen-angels. Table 15.8 shows that
comparison between the fallen-angel default rate (measured as a percent of issuers) and original
issue high-yield bonds. Although fallen-angels have a lower average annual rate, the difference
(about 1.0%) is not statistically significant.
Industry Defaults
Tables 15.9 and 15.10 show the number of defaults from the large industrial sectors over
the period 1970-2006 and by dollar amount per year from 1990-2006. We can observe that the
9
largest “contributor” has been the communications sector, with more than $100 billion of
defaults, the bulk in the four-year period 2000-03, led by telecoms. One firm, WorldCom,
contributed about $30 billion! More recently, the sector with the most financial distress has been
the automotive industry, primarily auto-parts suppliers.
Forecasting Default Rates
When discussing the forecast of annual default rates, we again differentiate between
dollar-denominated and issuer-denominated rates. In either case, the fact that default-risk is a
critical measure in determining required rates of return on investing in any debt class makes this
estimation important. So, in a benign default risk environment, a seemingly small yield-spread
available may be acceptable if default rates are expected to continue at a very low rate.
Issuer-Based Default Rate Forecasts
A very fine summary of issuer-based default rate forecasting is provided in Keenan,
Sobehart and Hamilton (Moody’s, 1999). Probably the first study on the topic was Fons (1991),
where he found that about half of the variation in historical default rates could be explained by
“credit quality” and the overall state of the economy. The former was proxied by the historical
one-year default rates by rating category and the distribution of issuers at the point in time that
the forecast was being made. It was found that the distribution of current ratings plus the
expected variation based on the state of the economy did a very good job in terms of forecasting
accuracy. A consensus forecast of GNP growth was used as a proxy for the expected state of the
economy and a two-factor regression model fit the data very well.
Helwege and Kleiman (1996), building upon the Fons framework, explained the annual
fluctuation in high-yield bond default rates with an adjusted R2 of as much as 81%. They added
an aging factor, discussed earlier in the Altman models, as well as an adjusted non-symmetrical
group of macroeconomic factors. They found that an economic growth threshold of 1.5%
10
(dummy variable) was important in determining if default rates were going to spike up for the
bottom-tier of speculative grade credits (e.g., B3 or lower), while higher-tier speculative grade
credits would not be as vulnerable. An arbitrarily determined GDP growth threshold was also
used by Altman, et al (2005) in explaining default recovery rates (see next Chapter), but with
very little added explanatory power to their supply/demand based model.
Jonsson and Fridson (1996) and Jonsson, Fridson and Zhong (1998), using a different set
of issuer-based default rate macroeconomic indicators, were able to explain 86.5% of the
variation in historical speculative-grade default rates. Their models also included a variable that
measured the aging-factor of existing issuers and the existing credit profile of issuers. The latter
was based on the proportion of existing issuers with a B3 or lower rating - - again the
concentration on the “bad-cohort.” The macroeconomic factors included corporate profits as a
percentage of GNP, the size of current liabilities of business failures, the NASDAQ and S&P
500 Index P/E ratios and the gross proceeds of IPOs. These measures were used to assess the
degree of optimism/pessimism of the economy, as well as the cost of equity capital and access to
equity capital for firms in the economy. The expected inverse correlation between
macroeconomic performance and optimism with default rates were shown to be evident.
Finally, with respect to a global, speculative grade issuer-based default rate forecasting
model, Keenan, et al (1999) provided an approach that to this day (2007), is still being used by
Moody’s Investors Service. They used a revised measure of possible defaulting issuers which
subtracted out those issuers which had their rating “withdrawn” over the past twelve months. So,
a forecast of market size reflecting the expected withdrawal rate was necessary. The authors
argued that the withdrawals were fairly stable over time averaging about 4% for speculative
grade issuers and 2% for all-corporate categories. A simple autoregressive model was used to
extrapolate this withdrawal rate. Withdrawals play an important role in Moody’s published
11

cumulative default rates - - discussed earlier - - and also in Altman’s mortality rate estimates
(discussed above, and also to come in his default rate forecasting model).
The Moody’s model then proceeds to forecast the next 12-month default rate based on a
poisson-regression model postulated to be appropriate when the variable to be estimated is a non-
negative integer-value which is a function of a set of explanatory variables. They argue that the
poisson-based model was appropriate for the Duffie and Singleton (1997) aggregated default
activity model as well as CSFB’s CreditRisk+ portfolio model (1997). An important assumption
of this modeling process is the assumption that the defaults within each monthly observation can
be assumed to be uncorrelated. The authors state that they find little evidence of clustering,
whether across industries or within an industry, even in high default months.
Moody’s predictors of default included (1) changes in credit quality, (2) the aging effect
of existing issuers, and (3) a number of variables that reflect macroeconomic conditions in the
economy. The latter include the index of total industrial production in the US, adjusted by the
producer price index, and the ten-year US Treasury bond yield. The authors found that they
could explain up to 85% of the variation in the all-corporate global-trailing 12-month default rate
and about 80% of the variation in the 12-month trailing speculative-grade default rate.
The Mortality Dollar-Based Rate Approach
Using the mortality rate approach to calculating default rates, discussed earlier in this
chapter, Altman has for a number of years, e.g., Altman and Ramayanam (2007), been
forecasting future one-year default rates. This dollar-denominated rate yields both a dollar
estimate as well as a percentage of the high-yield market that can be expected to default. The
approach is extremely simple and does not utilize any forecasts of macroeconomic factors to
arrive at its forecast. He simply observes the past ten years’ new issuance of bonds of all ratings,
from AAA to CCC, and applies the latest, updated mortality rate matrix, see Table 15.2, to
12

estimate the marginal mortality rates and dollars expected to default in the next calendar year.
So, for example, the single-B new issuance in 2006 multiplied by the one year’s marginal
mortality rate 2.84%, will give us the B-rated first year’s contribution to 2007’s defaulted bonds’
dollar amount; the 2nd year’s marginal rate (6.78%) multiplied by 2005’s new issuance of single-
B bonds will give us that year’s contribution, and so on. One can then simply aggregate each
year’s contribution by rating class for all rating classes to determine the total amount of defaults
one year ahead. Since Altman’s default rate method (see Table 15-1), uses the mid-year
convention for determining the denominator in its calculation, the total forecasted default rate
calculation requires an estimate of the size of the high-yield bond population as of mid-year of
the year the forecast is for.
A Final Note on Forecasted Default Rates
Both of the forecasting methods, described above, were forecasting at the start of the
year, approximately a 2.5% high-yield bond default rate for 2007. While these techniques were
quite accurate in their forecasts in the past, they all over-estimated the 2006 rate by a
considerable margin. The extreme low rate in 2006 was consistent with the recent benign credit
markets and if these conditions continue in 2007 (the time of the writing of this chapter), then we
can expect that forecasting techniques that rely on estimates based on a long history of
observations (e.g., over 35 years in the case of the Moody’s and Altman’s methods) will again
over-estimate the default rate. At some point, however, we expect a reversion to the mean
default rate and a more accurate set of forecasts.
Leverage Loan Default Rates
The loan analog to the high-yield bond market is known as the leverage loan market.
These are mostly term-loans provided to non-investment grade companies or loans which yield
at least 150bp over LIBOR. Most of these loans are held by non-bank, institutional investors and
13
are typically 3-7 year maturities with similar covenants to their public bond “cousins.” This
market has grown tremendously of late and was estimated to be about $1.4 trillion in 2006
(Figure 15.3), about 40% larger than the high-yield bond market in the US. Indeed, in 2006, the
new issuance was a record $480 billion compared to a near record $140 billion of newly issued
high-yield bonds. These loans are the main provider of debt financing in the recent binge of
highly-leveraged-transactions (HLTs), primarily leverage buyouts (LBOs).
Similar to the unusually low default rates in the high-yield bond market in 2006, we can
observe a very low default rate in the leverage loan market (see Figure 15.4). Indeed, the last 12-
month dollar-denominated default rate (from S&P/LSTA) fell from about 3.0% in 2005 to 1.1%
in 2006 and fell even further to 0.24% in February 2007. The comparable issue-denominated
rate was about 0.8% of the pool of 2006, down from 2.0% one year earlier and also fell to a
miniscule 0.46% in February. These statistics are consistent with our observation that the risky
debt markets were enjoying an unusually high liquidity, low default risk environment in 2006
and the remarkable thing was that lenders were requiring an almost all-time low yield spread
over risk-free Treasuries. Some observers (e.g., Altman, 2006) felt that the risk fundamentals of
the market were far greater than the yield-spreads, default rates and credit default swap
premiums were implying and that a reversion-to-the-mean was likely to manifest in the next few
years. Still, others were arguing that a type of new-paradigm had taken place and that the 2006
scenario of credit risk management was likely to continue for the foreseeable future. We guess
the old adage, “time will tell” is relevant here!
14

References
Altman, Edward (1989), “Measuring Corporate Bond Mortality and Performance,” Journal of Finance, (September): 909-922.
Altman, Edward (2006), “Are Historically Based Default and Recovery Models in the High
Yield and Distressed Debt Markets Still Relevant for Investment Funds in Today’s Credit Environment,” NYU Salomon Center, Special Report, November.
Altman, Edward and Suresh Ramayanam (2007), “Defaults and Returns in the High-Yield Bond
Market: 2006 in Review and Outlook, NYU Salomon Center, Special Report, February. Credit Suisse Financial Products (1997), “CreditRisk+: A Credit Risk Management
Framework,” London, Credit Suisse Financial Products. Duffie, Darrell and Kenneth Singleton (1997), “Modeling Term Structures of Defaultable
Bonds,” Stanford University Working Paper, Review of Financial Studies, 1999. Fitch Ratings (2007), “The Shrinking Default Rate and the Credit Cycle – New Twists, New
Risks,” Credit Market Research, Fitch Ratings, New York, February 20. Fons, Jerome S. (1991), “An Approach to Forecasting Default Rates,” A Moody’s Special
Report, August. Hamilton, David and Richard Cantor (2006), “Measuring Corporate Default Rates,” Special
Comment, Moody’s Investors Service, November. Helwege, Jean and Paul Kleinman (1996), “Understanding Aggregate Default Rates of High
Yield Bonds,” The Journal of Fixed Income, June 1997. Jonsson, Jon G. and Martin S. Fridson (1996), “Forecasting Default Rates on High Yield
Bonds,” The Journal of Fixed Income, June. Jonsson, Jon G., Martin S. Fridson and Hong Zhong (1998), “Advances in Default Rate
Forecasting,” Merrill Lynch’s Global Securities Research & Economics Group, May/June 1996.
Keenan, Sean C., Igor Shtogrin and Jorge Sobehart (1999), “Historical Default Rates of
Corporate Bond Issuers, 1920-1999,” A Moody’s Special Report, January. Moody’s Investors Service (1990), “Corporate Bond Default and Default Rates,” Moody’s
Special Reports, February. Moody’s Investors Service (1999), “Predicting Default Rates: A Forecasting Model for Moody’s
Issuer-Based Default Rates,” Moody’s Global Credit Research, New York, August.
Moody’s Investors Service (2007), “Corporate Default and Recovery Rates: 1920-2006,”
15

Moody’s Special Report, New York, February. Standard & Poor’s (1991), “Corporate Bond Defaults Study, Parts 1-3, Credit Week, 15, 16
September and 21 December. Standard & Poor’s (2007), “Ratings Performance 2006: Stability and Transition,” New York,
S&P, February.
16
Figure 15-1
Size of the US High-Yield Bond Market
1978 – 2006 (Mid-year US$ billions)
$1,040
$-
$200
$400
$600
$800
$1,000
$1,200
1978
1979
1980
1981
1982
1983
1984
1985
1986
1987
1988
1989
1990
1991
1992
1993
1994
1995
1996
1997
1998
1999
2000
2001
2002
2003
2004
2005
2006
$ B
illio
ns
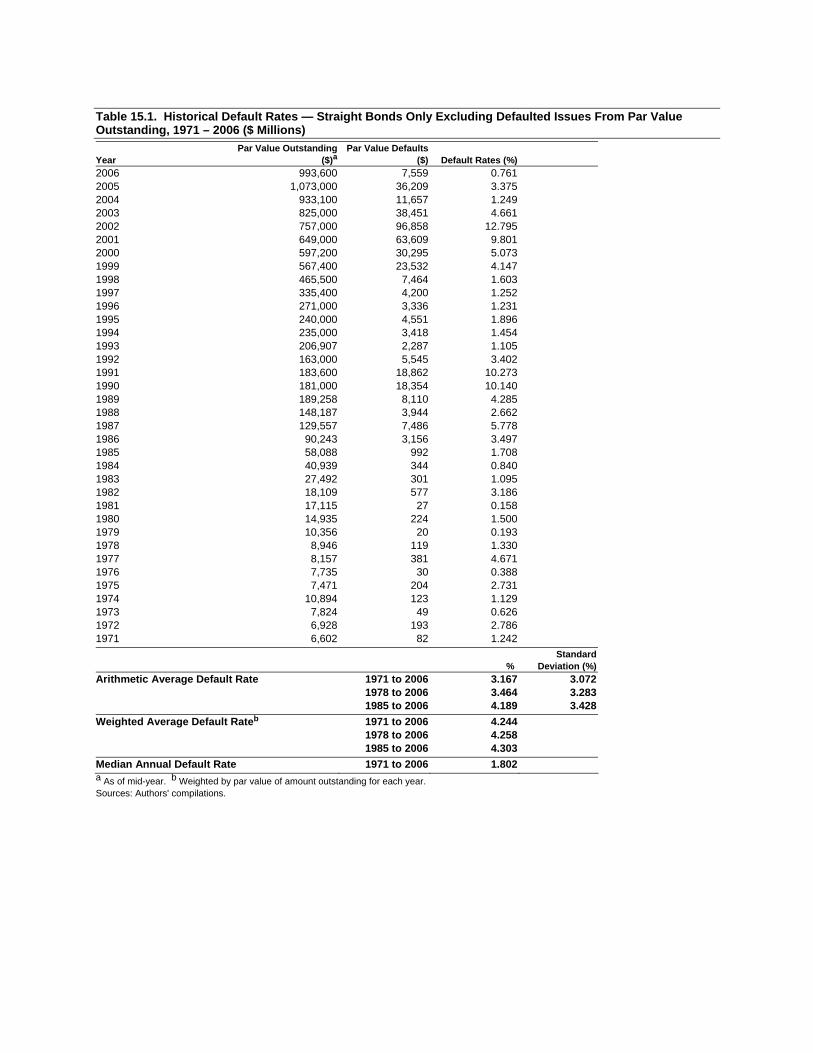
Table 15.1. Historical Default Rates — Straight Bonds Only Excluding Defaulted Issues From Par Value Outstanding, 1971 – 2006 ($ Millions)
Year Par Value Outstanding
($)a Par Value Defaults
($) Default Rates (%) 2006 993,600 7,559 0.761 2005 1,073,000 36,209 3.375 2004 933,100 11,657 1.249 2003 825,000 38,451 4.661 2002 757,000 96,858 12.795 2001 649,000 63,609 9.801 2000 597,200 30,295 5.073 1999 567,400 23,532 4.147 1998 465,500 7,464 1.603 1997 335,400 4,200 1.252 1996 271,000 3,336 1.231 1995 240,000 4,551 1.896 1994 235,000 3,418 1.454 1993 206,907 2,287 1.105 1992 163,000 5,545 3.402 1991 183,600 18,862 10.273 1990 181,000 18,354 10.140 1989 189,258 8,110 4.285 1988 148,187 3,944 2.662 1987 129,557 7,486 5.778 1986 90,243 3,156 3.497 1985 58,088 992 1.708 1984 40,939 344 0.840 1983 27,492 301 1.095 1982 18,109 577 3.186 1981 17,115 27 0.158 1980 14,935 224 1.500 1979 10,356 20 0.193 1978 8,946 119 1.330 1977 8,157 381 4.671 1976 7,735 30 0.388 1975 7,471 204 2.731 1974 10,894 123 1.129 1973 7,824 49 0.626 1972 6,928 193 2.786 1971 6,602 82 1.242
% Standard
Deviation (%) Arithmetic Average Default Rate 1971 to 2006 3.167 3.072
1978 to 2006 3.464 3.283 1985 to 2006 4.189 3.428
Weighted Average Default Rateb 1971 to 2006 4.244 1978 to 2006 4.258 1985 to 2006 4.303
Median Annual Default Rate 1971 to 2006 1.802 a As of mid-year. b Weighted by par value of amount outstanding for each year. Sources: Authors' compilations.
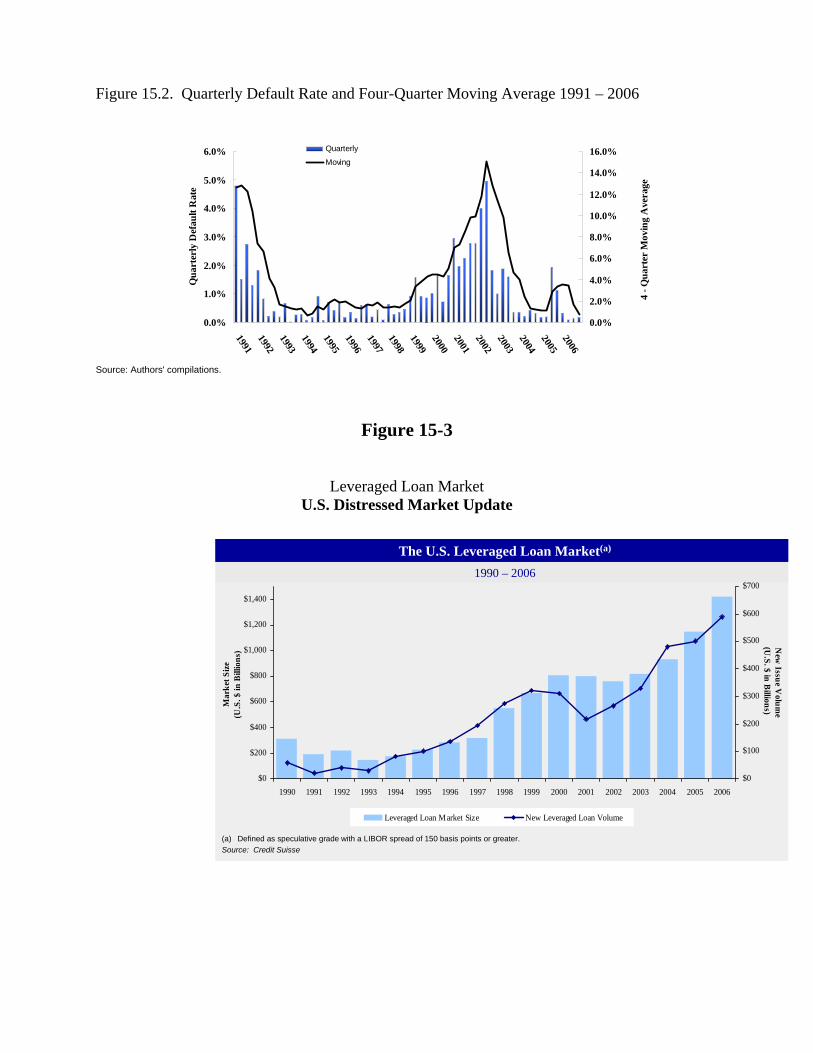
Figure 15.2. Quarterly Default Rate and Four-Quarter Moving Average 1991 – 2006
0.0%
1.0%
2.0%
3.0%
4.0%
5.0%
6.0%
1991199219931994199519961997199819992000200120022003200420052006
Qua
rter
ly D
efau
lt R
ate
0.0%
2.0%
4.0%
6.0%
8.0%
10.0%
12.0%
14.0%
16.0%
4 - Q
uart
er M
ovin
g A
vera
ge
Quarterly
Moving
Source: Authors' compilations.
Figure 15-3
Leveraged Loan Market
U.S. Distressed Market Update
1990 – 2006
The U.S. Leveraged Loan Market(a)
(a) Defined as speculative grade with a LIBOR spread of 150 basis points or greater.Source: Credit Suisse
1990 – 2006
The U.S. Leveraged Loan Market(a)
(a) Defined as speculative grade with a LIBOR spread of 150 basis points or greater.Source: Credit Suisse
$0
$200
$400
$600
$800
$1,000
$1,200
$1,400
1990 1991 1992 1993 1994 1995 1996 1997 1998 1999 2000 2001 2002 2003 2004 2005 2006
Mar
ket S
ize
(U.S
. $ in
Bill
ions
)
$0
$100
$200
$300
$400
$500
$600
$700
New
Issue Volum
e (U
.S. $ in Billions)
Leveraged Loan Market Size New Leveraged Loan Volume
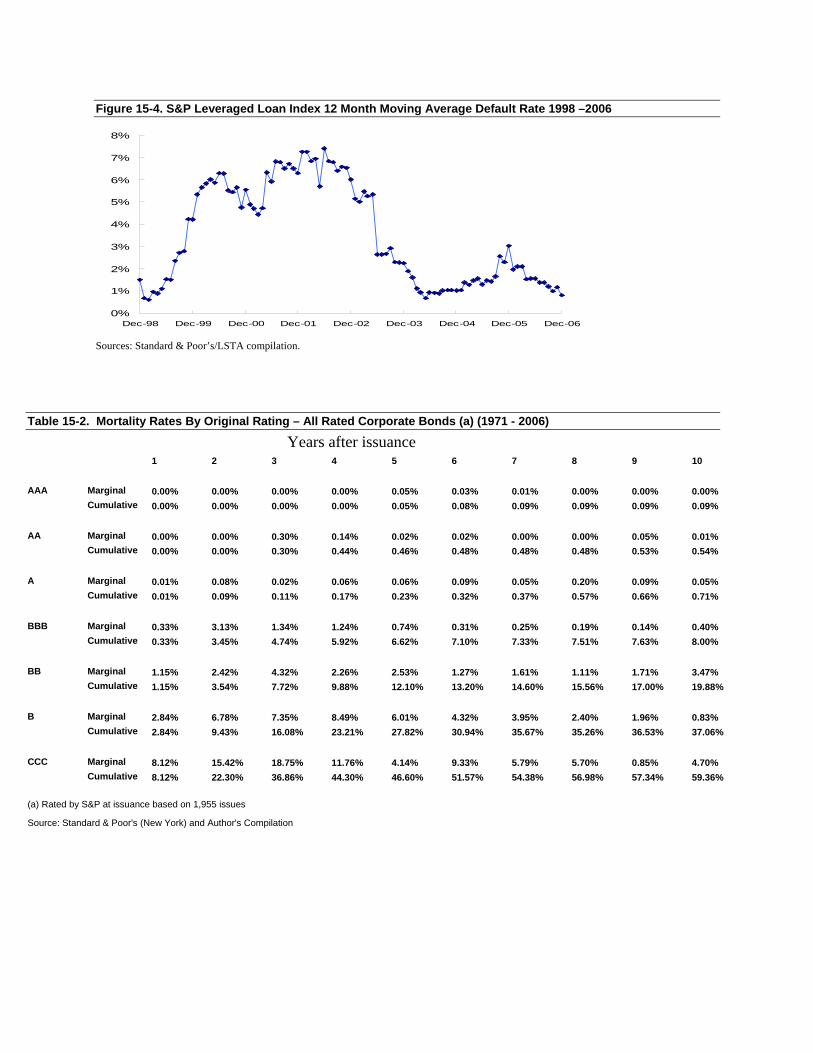
Figure 15-4. S&P Leveraged Loan Index 12 Month Moving Average Default Rate 1998 –2006
0%
1%
2%
3%
4%
5%
6%
7%
8%
Dec-98 Dec-99 Dec-00 Dec-01 Dec-02 Dec-03 Dec-04 Dec-05 Dec-06
Sources: Standard & Poor’s/LSTA compilation.
Table 15-2. Mortality Rates By Original Rating – All Rated Corporate Bonds (a) (1971 - 2006)
Years after issuance 1 2 3 4 5 6 7 8 9 10 AAA Marginal 0.00% 0.00% 0.00% 0.00% 0.05% 0.03% 0.01% 0.00% 0.00% 0.00% Cumulative 0.00% 0.00% 0.00% 0.00% 0.05% 0.08% 0.09% 0.09% 0.09% 0.09% AA Marginal 0.00% 0.00% 0.30% 0.14% 0.02% 0.02% 0.00% 0.00% 0.05% 0.01% Cumulative 0.00% 0.00% 0.30% 0.44% 0.46% 0.48% 0.48% 0.48% 0.53% 0.54% A Marginal 0.01% 0.08% 0.02% 0.06% 0.06% 0.09% 0.05% 0.20% 0.09% 0.05% Cumulative 0.01% 0.09% 0.11% 0.17% 0.23% 0.32% 0.37% 0.57% 0.66% 0.71% BBB Marginal 0.33% 3.13% 1.34% 1.24% 0.74% 0.31% 0.25% 0.19% 0.14% 0.40% Cumulative 0.33% 3.45% 4.74% 5.92% 6.62% 7.10% 7.33% 7.51% 7.63% 8.00% BB Marginal 1.15% 2.42% 4.32% 2.26% 2.53% 1.27% 1.61% 1.11% 1.71% 3.47% Cumulative 1.15% 3.54% 7.72% 9.88% 12.10% 13.20% 14.60% 15.56% 17.00% 19.88% B Marginal 2.84% 6.78% 7.35% 8.49% 6.01% 4.32% 3.95% 2.40% 1.96% 0.83% Cumulative 2.84% 9.43% 16.08% 23.21% 27.82% 30.94% 35.67% 35.26% 36.53% 37.06% CCC Marginal 8.12% 15.42% 18.75% 11.76% 4.14% 9.33% 5.79% 5.70% 0.85% 4.70% Cumulative 8.12% 22.30% 36.86% 44.30% 46.60% 51.57% 54.38% 56.98% 57.34% 59.36%
(a) Rated by S&P at issuance based on 1,955 issues
Source: Standard & Poor's (New York) and Author's Compilation
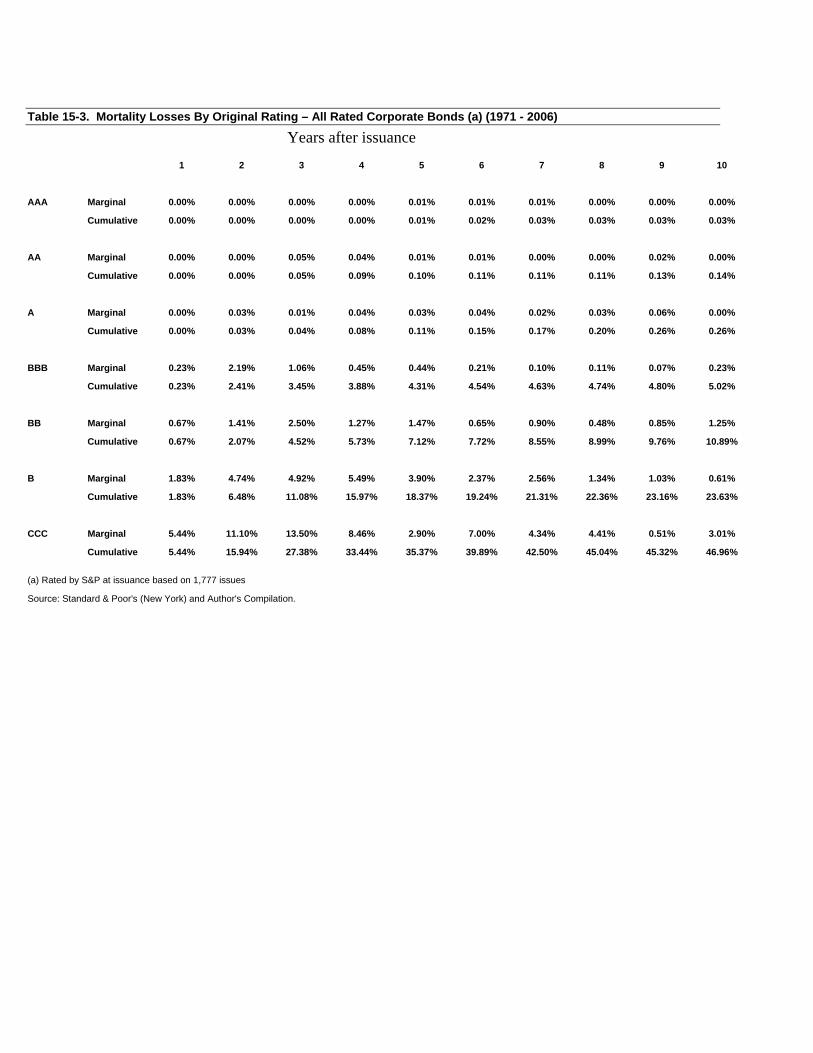
Table 15-3. Mortality Losses By Original Rating – All Rated Corporate Bonds (a) (1971 - 2006)
Years after issuance 1 2 3 4 5 6 7 8 9 10
AAA Marginal 0.00% 0.00% 0.00% 0.00% 0.01% 0.01% 0.01% 0.00% 0.00% 0.00%
Cumulative 0.00% 0.00% 0.00% 0.00% 0.01% 0.02% 0.03% 0.03% 0.03% 0.03%
AA Marginal 0.00% 0.00% 0.05% 0.04% 0.01% 0.01% 0.00% 0.00% 0.02% 0.00%
Cumulative 0.00% 0.00% 0.05% 0.09% 0.10% 0.11% 0.11% 0.11% 0.13% 0.14%
A Marginal 0.00% 0.03% 0.01% 0.04% 0.03% 0.04% 0.02% 0.03% 0.06% 0.00%
Cumulative 0.00% 0.03% 0.04% 0.08% 0.11% 0.15% 0.17% 0.20% 0.26% 0.26%
BBB Marginal 0.23% 2.19% 1.06% 0.45% 0.44% 0.21% 0.10% 0.11% 0.07% 0.23%
Cumulative 0.23% 2.41% 3.45% 3.88% 4.31% 4.54% 4.63% 4.74% 4.80% 5.02%
BB Marginal 0.67% 1.41% 2.50% 1.27% 1.47% 0.65% 0.90% 0.48% 0.85% 1.25%
Cumulative 0.67% 2.07% 4.52% 5.73% 7.12% 7.72% 8.55% 8.99% 9.76% 10.89%
B Marginal 1.83% 4.74% 4.92% 5.49% 3.90% 2.37% 2.56% 1.34% 1.03% 0.61%
Cumulative 1.83% 6.48% 11.08% 15.97% 18.37% 19.24% 21.31% 22.36% 23.16% 23.63%
CCC Marginal 5.44% 11.10% 13.50% 8.46% 2.90% 7.00% 4.34% 4.41% 0.51% 3.01%
Cumulative 5.44% 15.94% 27.38% 33.44% 35.37% 39.89% 42.50% 45.04% 45.32% 46.96%
(a) Rated by S&P at issuance based on 1,777 issues
Source: Standard & Poor's (New York) and Author's Compilation.
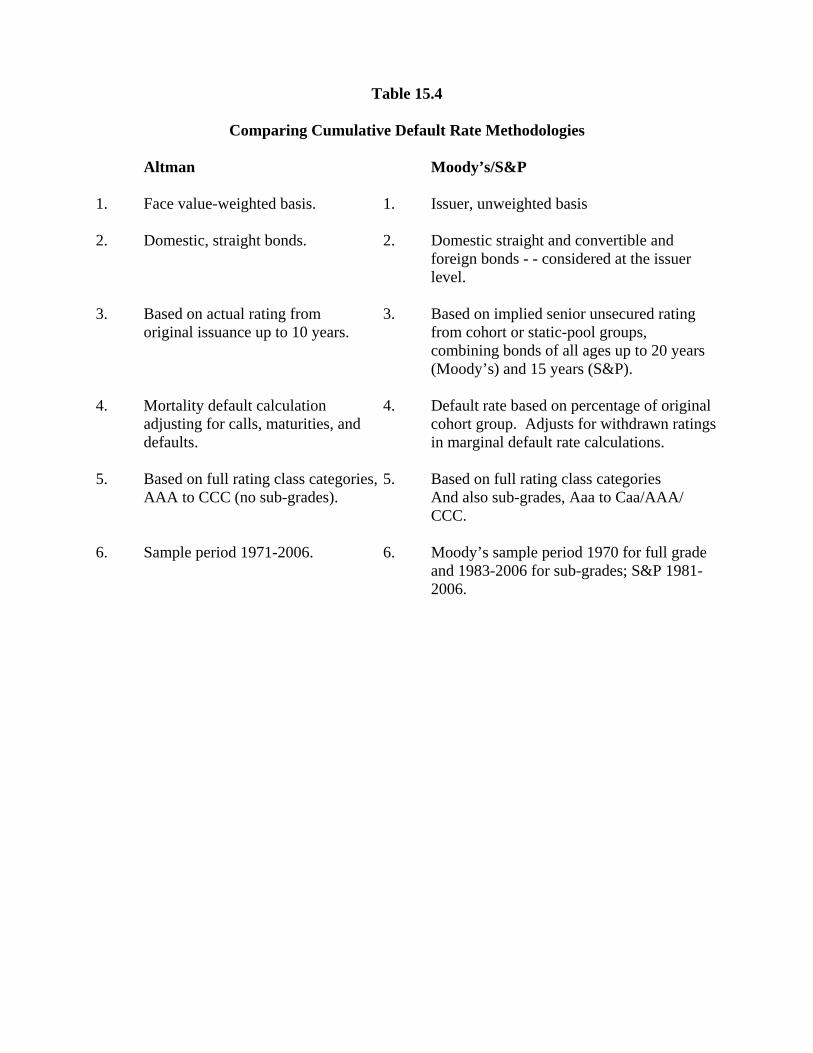
Table 15.4
Comparing Cumulative Default Rate Methodologies
Altman Moody’s/S&P
1. Face value-weighted basis. 1. Issuer, unweighted basis
2. Domestic, straight bonds. 2. Domestic straight and convertible and foreign bonds - - considered at the issuer level.
3. Based on actual rating from 3. Based on implied senior unsecured rating original issuance up to 10 years. from cohort or static-pool groups,
combining bonds of all ages up to 20 years (Moody’s) and 15 years (S&P).
4. Mortality default calculation 4. Default rate based on percentage of original adjusting for calls, maturities, and cohort group. Adjusts for withdrawn ratings defaults. in marginal default rate calculations. 5. Based on full rating class categories, 5. Based on full rating class categories AAA to CCC (no sub-grades). And also sub-grades, Aaa to Caa/AAA/
CCC. 6. Sample period 1971-2006. 6. Moody’s sample period 1970 for full grade and 1983-2006 for sub-grades; S&P 1981- 2006.
1 2 3 4 5 6 7 8 9 10
AAA/AaaAltman 0.00 0.00 0.00 0.00 0.05 0.08 0.09 0.09 0.09 0.09Moody's 0.00 0.00 0.00 0.03 0.10 0.17 0.25 0.34 0.42 0.52S&P 0.00 0.00 0.09 0.19 0.29 0.43 0.50 0.62 0.66 0.70AA/AaAltman 0.00 0.00 0.30 0.44 0.46 0.48 0.48 0.48 0.53 0.54Moody's 0.01 0.02 0.04 0.11 0.18 0.26 0.34 0.42 0.46 0.52S&P 0.01 0.05 0.10 0.20 0.32 0.43 0.56 0.68 0.78 0.89A/AAltman 0.01 0.09 0.11 0.17 0.23 0.32 0.37 0.57 0.66 0.71Moody's 0.02 0.10 0.22 0.34 0.47 0.61 0.76 0.93 1.11 1.29S&P 0.06 0.17 0.31 0.47 0.68 0.91 1.19 1.41 1.64 1.90BBB/BaaAltman 0.33 3.45 4.74 5.92 6.62 7.10 7.33 7.51 7.63 8.00Moody's 0.18 0.51 0.93 1.43 1.94 2.45 2.96 3.45 4.02 4.64S&P 0.24 0.71 1.23 1.92 2.61 3.28 3.82 4.38 4.89 5.42BB/BaAltman 1.15 3.54 7.72 9.88 12.10 13.20 14.60 15.56 17.00 19.88Moody's 1.21 3.22 5.57 7.96 10.22 12.24 14.01 15.71 17.39 19.12S&P 1.07 3.14 5.61 7.97 10.10 12.12 13.73 15.15 16.47 17.49B/BAltman 2.84 9.43 16.08 23.21 27.82 30.94 35.67 35.26 36.53 37.06Moody's 5.24 11.30 17.04 22.05 26.79 30.98 34.77 37.98 40.92 43.34S&P 4.99 10.92 15.90 19.76 22.55 24.72 26.54 28.00 29.20 30.42CCC/CaaAltman 8.12 22.30 36.86 44.30 46.60 51.57 54.38 56.98 57.34 59.36Moody's 19.48 30.49 39.72 46.90 52.62 56.81 59.94 63.27 66.28 69.18S&P 26.29 34.73 39.96 43.19 46.22 47.49 48.61 49.23 50.95 51.83
Source: Altman, Market value weights, by number of years from original Standard & Poor's issuance, 1971-2006, based on actual ratings,(Altman and Ramayanam, 2007).Moody's, Issuer weighted, cohort analysis, 1971-2006, based on actual or implied senior unsecured ratings (Moody's Investors Service,2007).S&P, Issuer weighted, static-pool analysis, 1981-2006, based on actual or implied senior unsecured ratings (Standard & Poor's, 2007).
Table 15.5
Cumulative Default Rate Comparison (in % for up to 10 years)
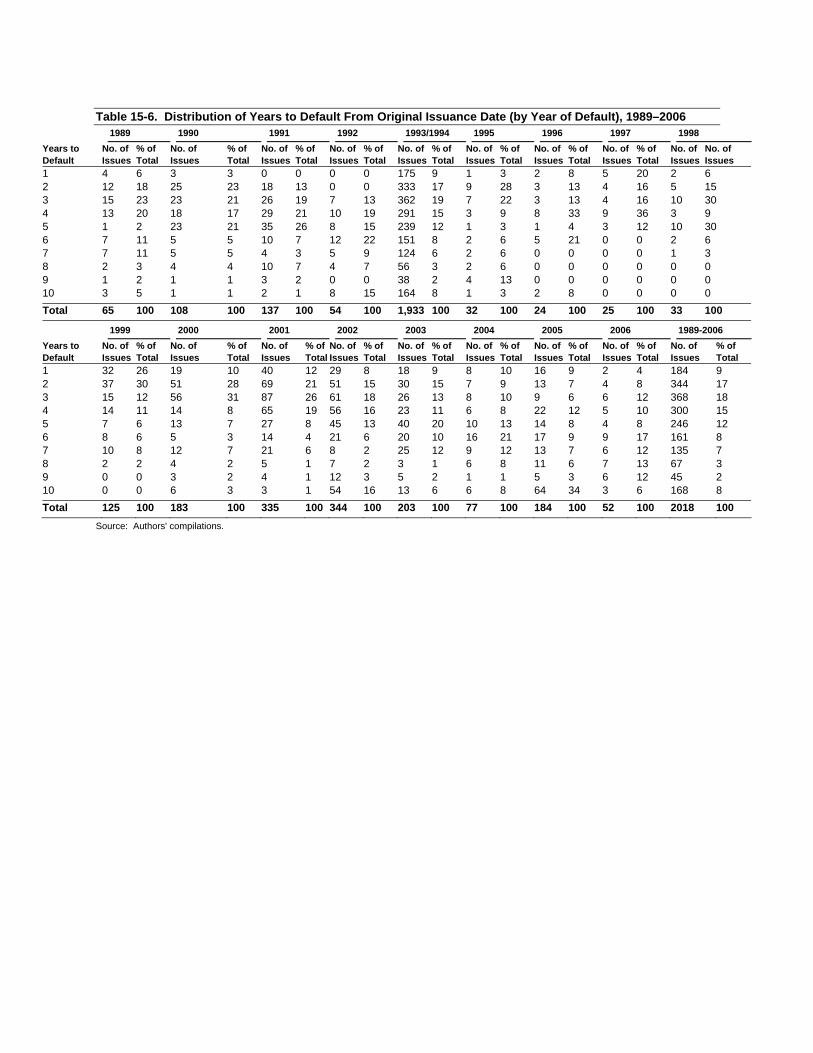
Table 15-6. Distribution of Years to Default From Original Issuance Date (by Year of Default), 1989–2006 1989 1990 1991 1992 1993/1994 1995 1996 1997 1998 Years to Default
No. of Issues
% of Total
No. of Issues
% of Total
No. of Issues
% of Total
No. of Issues
% of Total
No. of Issues
% of Total
No. of Issues
% of Total
No. of Issues
% of Total
No. of Issues
% of Total
No. of Issues
No. of Issues
1 4 6 3 3 0 0 0 0 175 9 1 3 2 8 5 20 2 6 2 12 18 25 23 18 13 0 0 333 17 9 28 3 13 4 16 5 15 3 15 23 23 21 26 19 7 13 362 19 7 22 3 13 4 16 10 30 4 13 20 18 17 29 21 10 19 291 15 3 9 8 33 9 36 3 9 5 1 2 23 21 35 26 8 15 239 12 1 3 1 4 3 12 10 30 6 7 11 5 5 10 7 12 22 151 8 2 6 5 21 0 0 2 6 7 7 11 5 5 4 3 5 9 124 6 2 6 0 0 0 0 1 3 8 2 3 4 4 10 7 4 7 56 3 2 6 0 0 0 0 0 0 9 1 2 1 1 3 2 0 0 38 2 4 13 0 0 0 0 0 0 10 3 5 1 1 2 1 8 15 164 8 1 3 2 8 0 0 0 0 Total 65 100 108 100 137 100 54 100 1,933 100 32 100 24 100 25 100 33 100 1999 2000 2001 2002 2003 2004 2005 2006 1989-2006 Years to Default
No. of Issues
% of Total
No. of Issues
% of Total
No. of Issues
% of Total
No. of Issues
% of Total
No. of Issues
% of Total
No. of Issues
% of Total
No. of Issues
% of Total
No. of Issues
% of Total
No. of Issues
% of Total
1 32 26 19 10 40 12 29 8 18 9 8 10 16 9 2 4 184 9 2 37 30 51 28 69 21 51 15 30 15 7 9 13 7 4 8 344 17 3 15 12 56 31 87 26 61 18 26 13 8 10 9 6 6 12 368 18 4 14 11 14 8 65 19 56 16 23 11 6 8 22 12 5 10 300 15 5 7 6 13 7 27 8 45 13 40 20 10 13 14 8 4 8 246 12 6 8 6 5 3 14 4 21 6 20 10 16 21 17 9 9 17 161 8 7 10 8 12 7 21 6 8 2 25 12 9 12 13 7 6 12 135 7 8 2 2 4 2 5 1 7 2 3 1 6 8 11 6 7 13 67 3 9 0 0 3 2 4 1 12 3 5 2 1 1 5 3 6 12 45 2 10 0 0 6 3 3 1 54 16 13 6 6 8 64 34 3 6 168 8 Total 125 100 183 100 335 100 344 100 203 100 77 100 184 100 52 100 2018 100
Source: Authors' compilations.
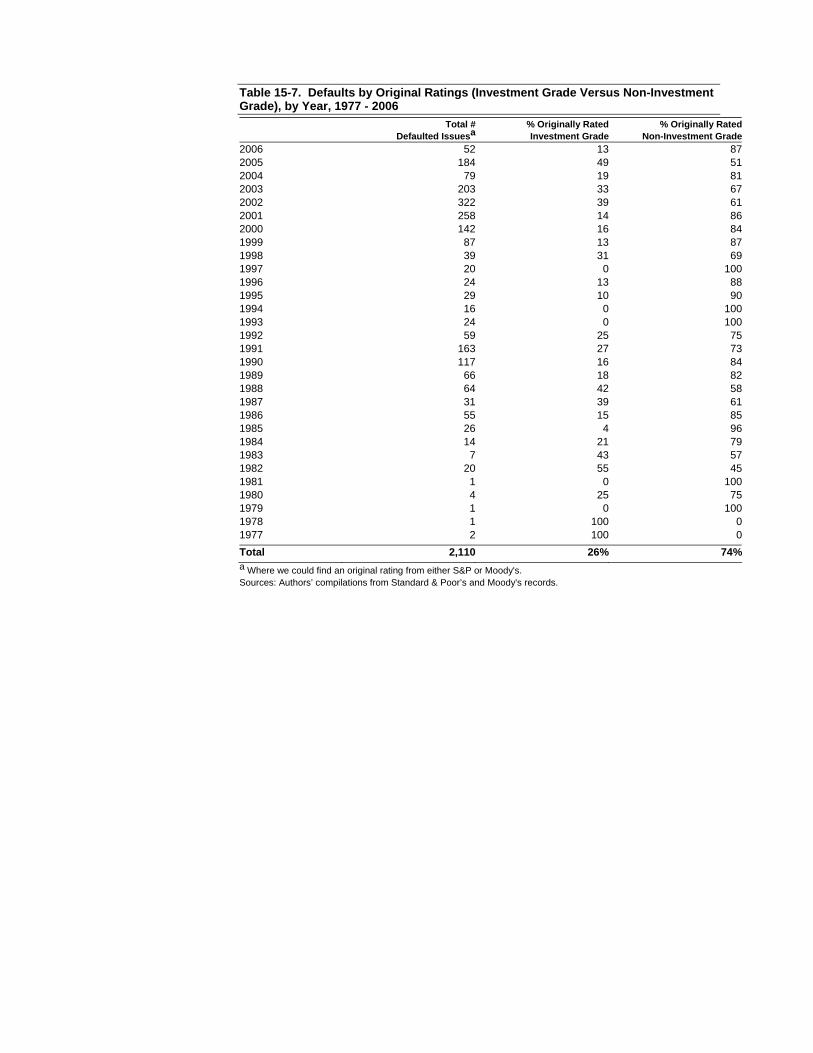
Table 15-7. Defaults by Original Ratings (Investment Grade Versus Non-Investment Grade), by Year, 1977 - 2006
Total # Defaulted Issuesa
% Originally Rated Investment Grade
% Originally Rated Non-Investment Grade
2006 52 13 872005 184 49 512004 79 19 812003 203 33 672002 322 39 612001 258 14 862000 142 16 841999 87 13 871998 39 31 691997 20 0 1001996 24 13 881995 29 10 901994 16 0 1001993 24 0 1001992 59 25 751991 163 27 731990 117 16 841989 66 18 821988 64 42 581987 31 39 611986 55 15 851985 26 4 961984 14 21 791983 7 43 571982 20 55 451981 1 0 1001980 4 25 751979 1 0 1001978 1 100 01977 2 100 0Total 2,110 26% 74%a Where we could find an original rating from either S&P or Moody's. Sources: Authors’ compilations from Standard & Poor’s and Moody's records.
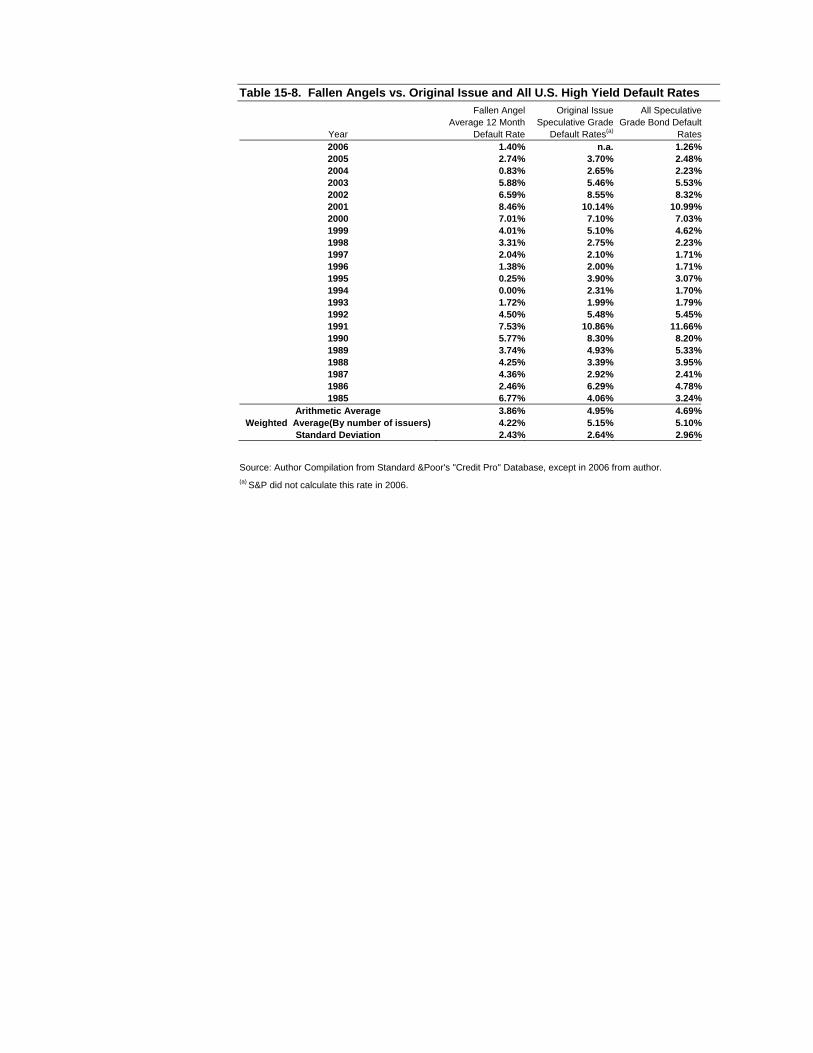
Table 15-8. Fallen Angels vs. Original Issue and All U.S. High Yield Default Rates
Year
Fallen Angel Average 12 Month
Default Rate
Original Issue Speculative Grade
Default Rates(a)
All SpeculativeGrade Bond Default
Rates2006 1.40% n.a. 1.26%2005 2.74% 3.70% 2.48%2004 0.83% 2.65% 2.23%2003 5.88% 5.46% 5.53%2002 6.59% 8.55% 8.32%2001 8.46% 10.14% 10.99%2000 7.01% 7.10% 7.03%1999 4.01% 5.10% 4.62%1998 3.31% 2.75% 2.23%1997 2.04% 2.10% 1.71%1996 1.38% 2.00% 1.71%1995 0.25% 3.90% 3.07%1994 0.00% 2.31% 1.70%1993 1.72% 1.99% 1.79%1992 4.50% 5.48% 5.45%1991 7.53% 10.86% 11.66%1990 5.77% 8.30% 8.20%1989 3.74% 4.93% 5.33%1988 4.25% 3.39% 3.95%1987 4.36% 2.92% 2.41%1986 2.46% 6.29% 4.78%1985 6.77% 4.06% 3.24%
Arithmetic Average 3.86% 4.95% 4.69%Weighted Average(By number of issuers) 4.22% 5.15% 5.10%
Standard Deviation 2.43% 2.64% 2.96%
Source: Author Compilation from Standard &Poor's "Credit Pro" Database, except in 2006 from author. (a) S&P did not calculate this rate in 2006.
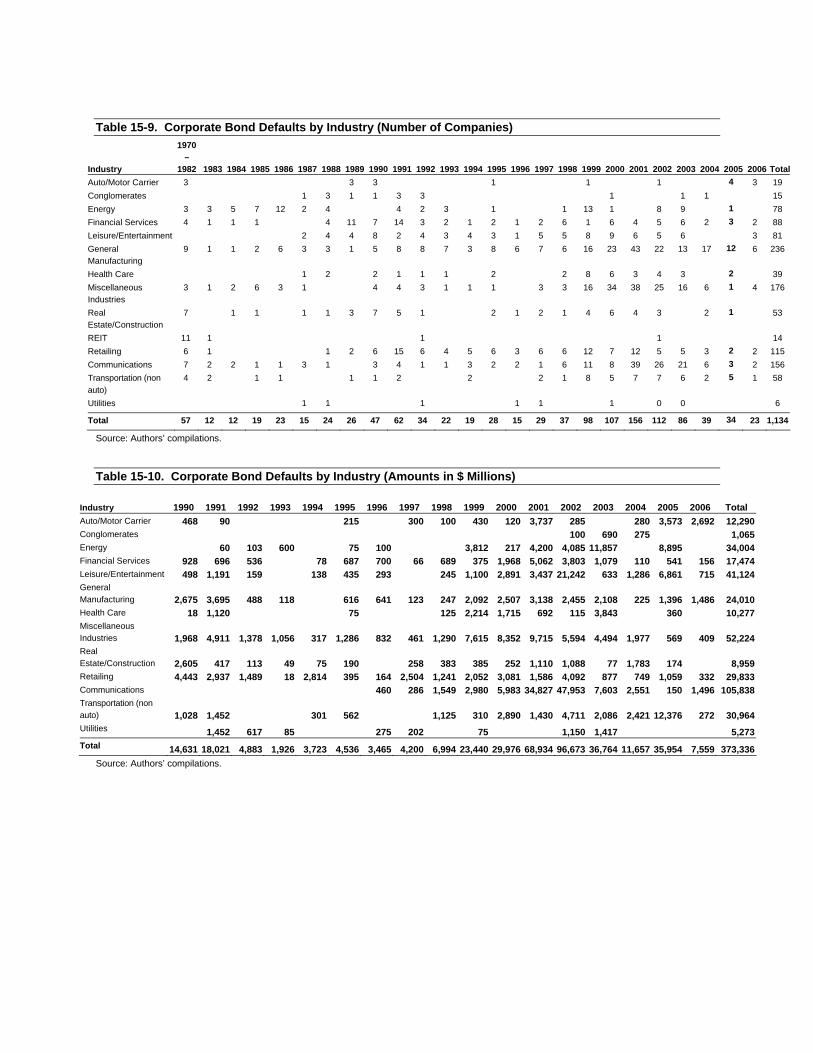
Table 15-9. Corporate Bond Defaults by Industry (Number of Companies)
Industry
1970–
1982 1983 1984 1985 1986 1987 1988 1989 1990 1991 1992 1993 1994 1995 1996 1997 1998 1999 2000 2001 2002 2003 2004 2005 2006 TotalAuto/Motor Carrier 3 3 3 1 1 1 4 3 19 Conglomerates 1 3 1 1 3 3 1 1 1 15 Energy 3 3 5 7 12 2 4 4 2 3 1 1 13 1 8 9 1 78 Financial Services 4 1 1 1 4 11 7 14 3 2 1 2 1 2 6 1 6 4 5 6 2 3 2 88 Leisure/Entertainment 2 4 4 8 2 4 3 4 3 1 5 5 8 9 6 5 6 3 81 General Manufacturing
9 1 1 2 6 3 3 1 5 8 8 7 3 8 6 7 6 16 23 43 22 13 17 12 6 236
Health Care 1 2 2 1 1 1 2 2 8 6 3 4 3 2 39 Miscellaneous Industries
3 1 2 6 3 1 4 4 3 1 1 1 3 3 16 34 38 25 16 6 1 4 176
Real Estate/Construction
7 1 1 1 1 3 7 5 1 2 1 2 1 4 6 4 3 2 1 53
REIT 11 1 1 1 14 Retailing 6 1 1 2 6 15 6 4 5 6 3 6 6 12 7 12 5 5 3 2 2 115 Communications 7 2 2 1 1 3 1 3 4 1 1 3 2 2 1 6 11 8 39 26 21 6 3 2 156 Transportation (non auto)
4 2 1 1 1 1 2 2 2 1 8 5 7 7 6 2 5 1 58
Utilities 1 1 1 1 1 1 0 0 6
Total 57 12 12 19 23 15 24 26 47 62 34 22 19 28 15 29 37 98 107 156 112 86 39 34 23 1,134
Source: Authors’ compilations.
Table 15-10. Corporate Bond Defaults by Industry (Amounts in $ Millions)
Industry 1990 1991 1992 1993 1994 1995 1996 1997 1998 1999 2000 2001 2002 2003 2004 2005 2006 Total Auto/Motor Carrier 468 90 215 300 100 430 120 3,737 285 280 3,573 2,692 12,290 Conglomerates 100 690 275 1,065 Energy 60 103 600 75 100 3,812 217 4,200 4,085 11,857 8,895 34,004 Financial Services 928 696 536 78 687 700 66 689 375 1,968 5,062 3,803 1,079 110 541 156 17,474 Leisure/Entertainment 498 1,191 159 138 435 293 245 1,100 2,891 3,437 21,242 633 1,286 6,861 715 41,124 General Manufacturing 2,675 3,695 488 118 616 641 123 247 2,092 2,507 3,138 2,455 2,108 225 1,396 1,486 24,010 Health Care 18 1,120 75 125 2,214 1,715 692 115 3,843 360 10,277 Miscellaneous Industries 1,968 4,911 1,378 1,056 317 1,286 832 461 1,290 7,615 8,352 9,715 5,594 4,494 1,977 569 409 52,224 Real Estate/Construction 2,605 417 113 49 75 190 258 383 385 252 1,110 1,088 77 1,783 174 8,959 Retailing 4,443 2,937 1,489 18 2,814 395 164 2,504 1,241 2,052 3,081 1,586 4,092 877 749 1,059 332 29,833 Communications 460 286 1,549 2,980 5,983 34,827 47,953 7,603 2,551 150 1,496 105,838 Transportation (non auto) 1,028 1,452 301 562 1,125 310 2,890 1,430 4,711 2,086 2,421 12,376 272 30,964 Utilities 1,452 617 85 275 202 75 1,150 1,417 5,273 Total 14,631 18,021 4,883 1,926 3,723 4,536 3,465 4,200 6,994 23,440 29,976 68,934 96,673 36,764 11,657 35,954 7,559 373,336
Source: Authors’ compilations.