Embed Size (px)
Citation preview
© 2010 Chevron
Andrew RawickiTechnology ManagerDeepwater Exploration & Projects Business Unit
September 16, 2010
Deepwater Development –A Chevron Project Case Study
Benefits from Real Time Reservoir Management (RTRM) i-field Deployments
© 2010 Chevron
Operational Excellence Moment
Operational Excellence requires constant attention to countless details and human factors. Chevron's OE safety culture is based on 10 Tenets of Operation, a code of conduct that employees and contractors use and that supervisors and managers reinforce. The tenets are based on two key principles: Do it safely or not at all. There is always time to do it right.
Tenets of Operation Always operate within design and
environmental limits. Always operate in a safe and controlled
condition. Always ensure safety devices are in place
and functioning. Always follow safe work practices and
procedures. Always meet or exceed customers’
requirements.
Always maintain integrity of dedicated systems.
Always comply with all applicable rules and regulations.
Always address abnormal conditions. Always follow written procedures for
high-risk or unusual situations. Always involve the right people in
decisions that affect procedures and equipment.
© 2010 Chevron
Session Overview
Introduction− Project Vision
− Tools and Workflows
Defining the value of Real Time Reservoir Management/Integrated Asset Management (RTRM/IAM) i-field− Review the project results to date
• How value is created
• Rapid Analysis Examples
• Results obtained
− Business Value
© 2010 Chevron
Real Time Reservoir Management i-fieldProject Vision
• Provide integrated data and modeling views from the reservoir to the separator on a “Real Time” basis
• Automate key engineering workflows with a goal of improving the efficiency of reservoir surveillance activities and the quality of RM decisions
• Deliver data and modeling results in a highly visible and easily accessible platform to improve collaboration across functions and distance
• Leverage learnings to other applicable locations
© 2010 Chevron
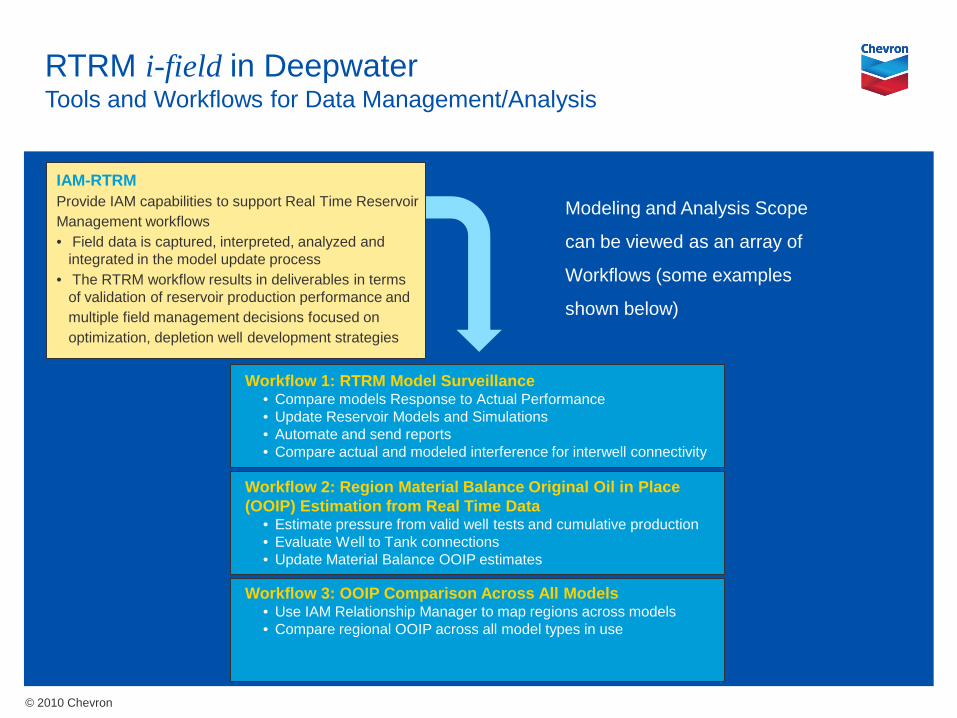
Workflow 1: RTRM Model Surveillance• Compare models Response to Actual Performance • Update Reservoir Models and Simulations• Automate and send reports• Compare actual and modeled interference for interwell connectivity
Workflow 2: Region Material Balance Original Oil in Place (OOIP) Estimation from Real Time Data
• Estimate pressure from valid well tests and cumulative production• Evaluate Well to Tank connections • Update Material Balance OOIP estimates
Workflow 3: OOIP Comparison Across All Models• Use IAM Relationship Manager to map regions across models• Compare regional OOIP across all model types in use
Modeling and Analysis Scope
can be viewed as an array of
Workflows (some examples
shown below)
RTRM i-field in DeepwaterTools and Workflows for Data Management/Analysis
IAM-RTRMProvide IAM capabilities to support Real Time ReservoirManagement workflows• Field data is captured, interpreted, analyzed and
integrated in the model update process• The RTRM workflow results in deliverables in terms
of validation of reservoir production performance andmultiple field management decisions focused onoptimization, depletion well development strategies
© 2010 Chevron
RTRM/IAM i-fieldHow We Create Value
Higher confidence in understanding reservoir uncertainty by tracking multiple models at the same time
Reduction of Uncertainty by eliminating models that cannot match field data (Compartmentalization, Connected Pore Volume)
Shorter cycle time using real time data in reservoir simulation modeling workflows− Data is available and automatically formatted to feed into model evaluation
(IAM) workflows, enabling quicker and more productive asset performance analysis
− Enhanced full field model analysis using database queries to RTRM real time data
− Data visualization and team collaboration has been significantly enhanced by using Spotfire
© 2010 Chevron
RTRM/IAM i-fieldHow We Create Value (continued)
Improved asset decision quality. Integration of RTRM with Integrated Asset Management (IAM) tools to:− Accelerate analysis of reservoir surveillance data leading to:
• Optimized water injection plans
• Improve timing and placement of additional producers
− Enhance collaboration between impacted teams
Enabling earlier assessment of proved reserves bookings
Continued enhanced organizational capability− Time savings with data preparation for analysis
• Engineering time focused on value generation opportunities
− Integration of RTRM-IAM results in Field Reviews for asset using Asset Decision Environment (ADE) rooms and integration software to improve collaboration
© 2010 Chevron
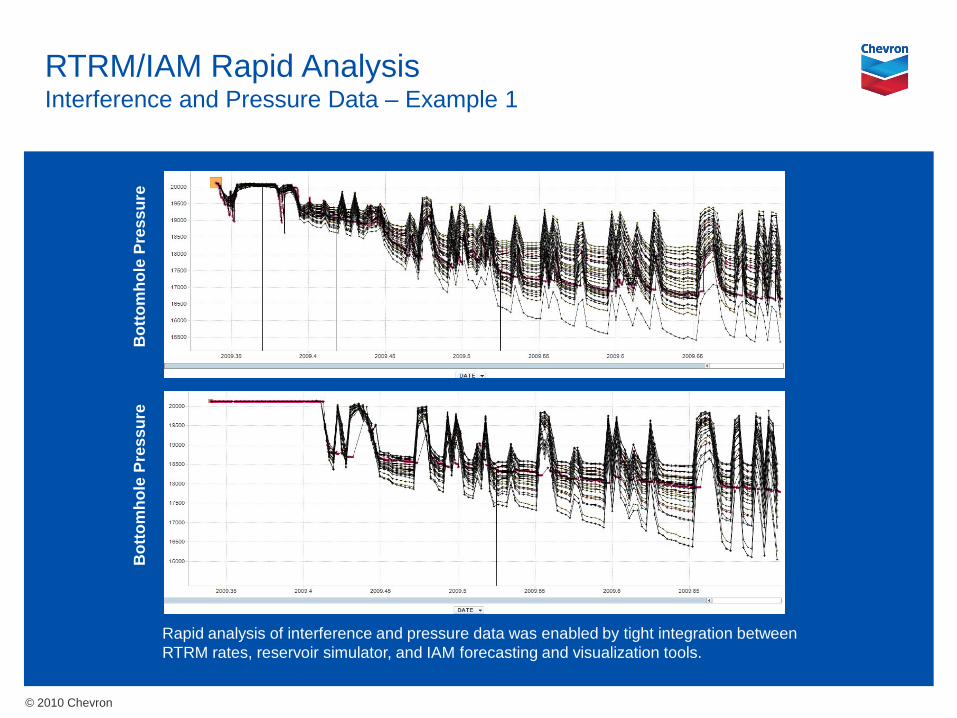
RTRM/IAM Rapid AnalysisInterference and Pressure Data – Example 1
Rapid analysis of interference and pressure data was enabled by tight integration between RTRM rates, reservoir simulator, and IAM forecasting and visualization tools.
Bot
tom
hole
Pres
sure
Bot
tom
hole
Pres
sure
© 2010 Chevron
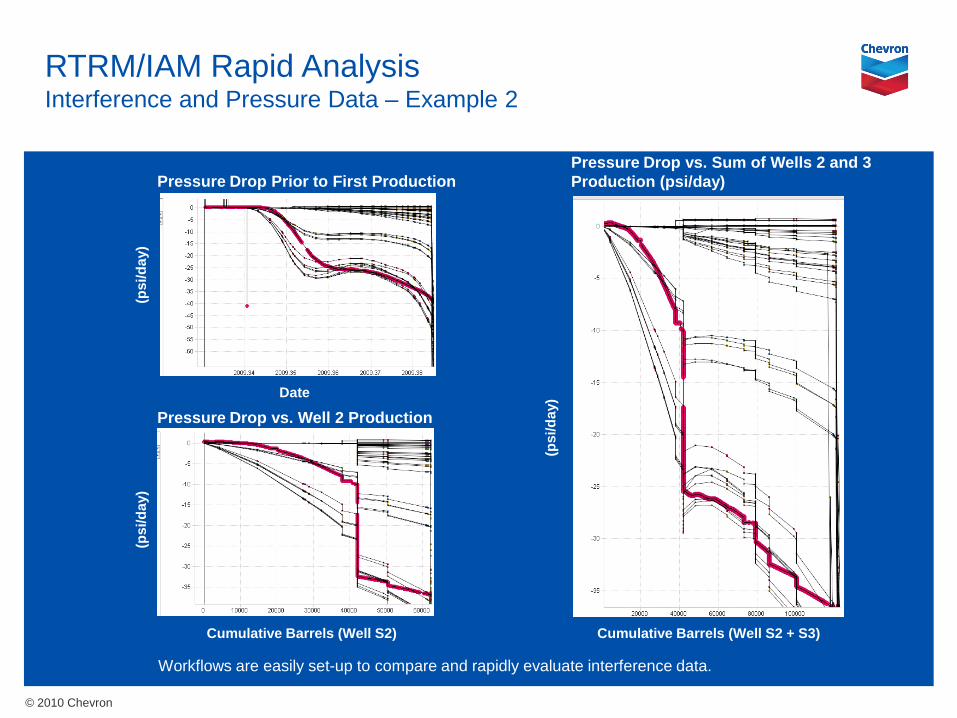
Pressure Drop vs. Sum of Wells 2 and 3 Production (psi/day)
RTRM/IAM Rapid Analysis Interference and Pressure Data – Example 2
Workflows are easily set-up to compare and rapidly evaluate interference data.
Pressure Drop Prior to First Production
Date
Cumulative Barrels (Well S2)
(psi
/day
)
Pressure Drop vs. Well 2 Production
Cumulative Barrels (Well S2 + S3)
(psi
/day
)
(psi
/day
)
© 2010 Chevron
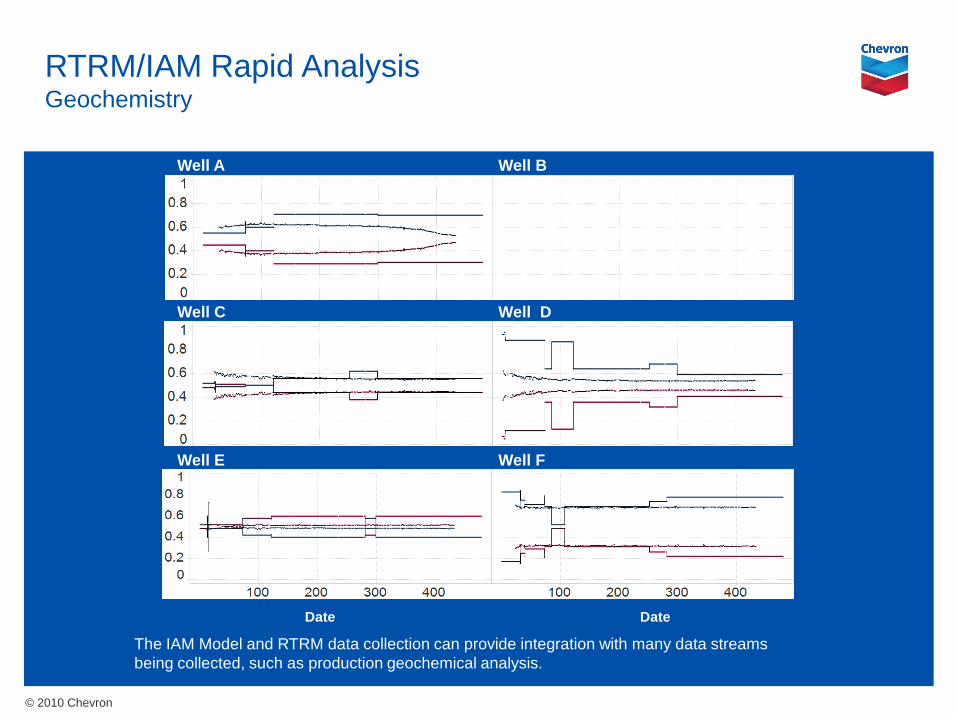
RTRM/IAM Rapid Analysis Geochemistry
The IAM Model and RTRM data collection can provide integration with many data streams being collected, such as production geochemical analysis.
Well E Well F
Well C Well D
Well A Well B
Date Date
© 2010 Chevron
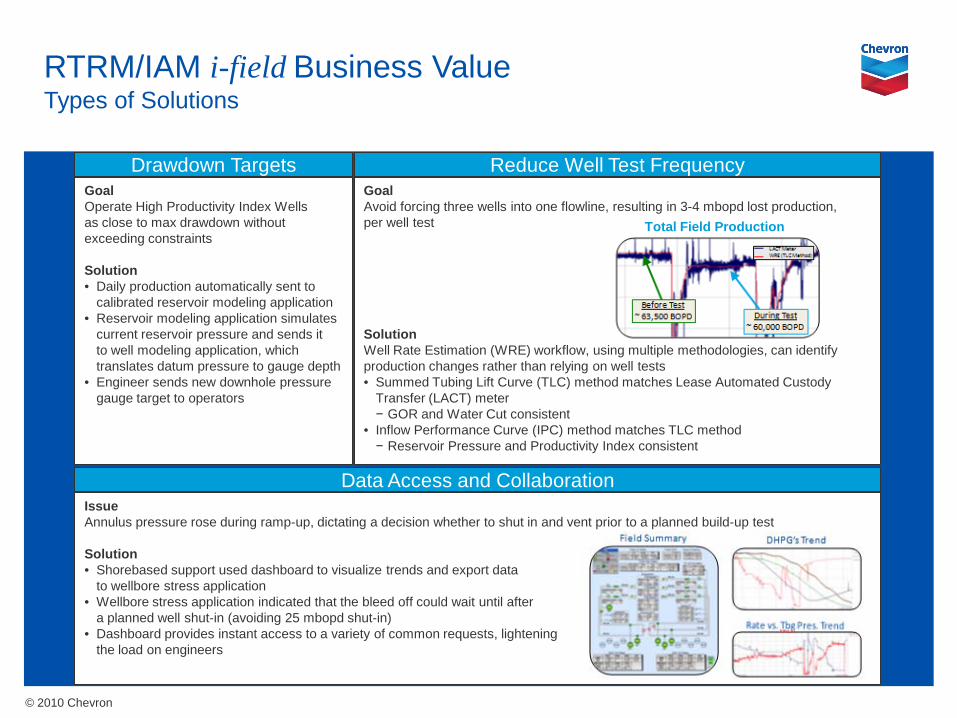
RTRM/IAM i-field Business ValueTypes of Solutions
Drawdown TargetsGoal Operate High Productivity Index Wells as close to max drawdown without exceeding constraints
Solution• Daily production automatically sent to
calibrated reservoir modeling application• Reservoir modeling application simulates
current reservoir pressure and sends it to well modeling application, which translates datum pressure to gauge depth
• Engineer sends new downhole pressure gauge target to operators
Reduce Well Test FrequencyGoalAvoid forcing three wells into one flowline, resulting in 3-4 mbopd lost production, per well test
SolutionWell Rate Estimation (WRE) workflow, using multiple methodologies, can identify production changes rather than relying on well tests• Summed Tubing Lift Curve (TLC) method matches Lease Automated Custody
Transfer (LACT) meter− GOR and Water Cut consistent
• Inflow Performance Curve (IPC) method matches TLC method− Reservoir Pressure and Productivity Index consistent
Data Access and CollaborationIssueAnnulus pressure rose during ramp-up, dictating a decision whether to shut in and vent prior to a planned build-up test
Solution• Shorebased support used dashboard to visualize trends and export data
to wellbore stress application• Wellbore stress application indicated that the bleed off could wait until after
a planned well shut-in (avoiding 25 mbopd shut-in)• Dashboard provides instant access to a variety of common requests, lightening
the load on engineers
Total Field Production
© 2010 Chevron
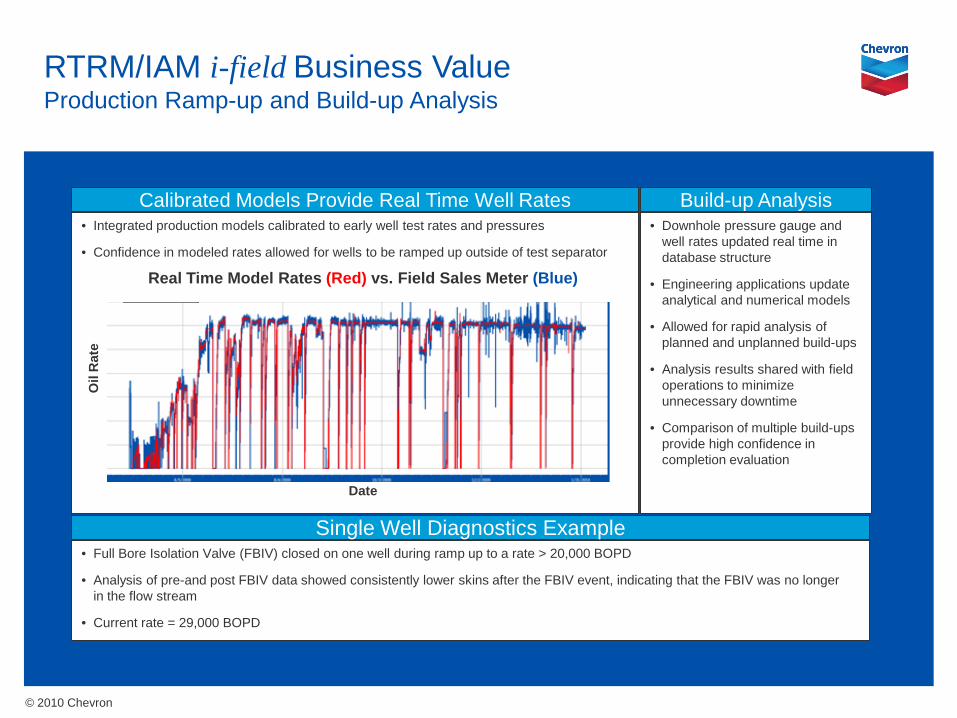
RTRM/IAM i-field Business ValueProduction Ramp-up and Build-up Analysis
Build-up Analysis• Downhole pressure gauge and
well rates updated real time indatabase structure
• Engineering applications update analytical and numerical models
• Allowed for rapid analysis of planned and unplanned build-ups
• Analysis results shared with field operations to minimize unnecessary downtime
• Comparison of multiple build-ups provide high confidence in completion evaluation
Calibrated Models Provide Real Time Well Rates• Integrated production models calibrated to early well test rates and pressures
• Confidence in modeled rates allowed for wells to be ramped up outside of test separator
Single Well Diagnostics Example• Full Bore Isolation Valve (FBIV) closed on one well during ramp up to a rate > 20,000 BOPD
• Analysis of pre-and post FBIV data showed consistently lower skins after the FBIV event, indicating that the FBIV was no longerin the flow stream
• Current rate = 29,000 BOPD
Real Time Model Rates (Red) vs. Field Sales Meter (Blue)
Date
Oil
Rat
e
© 2010 Chevron
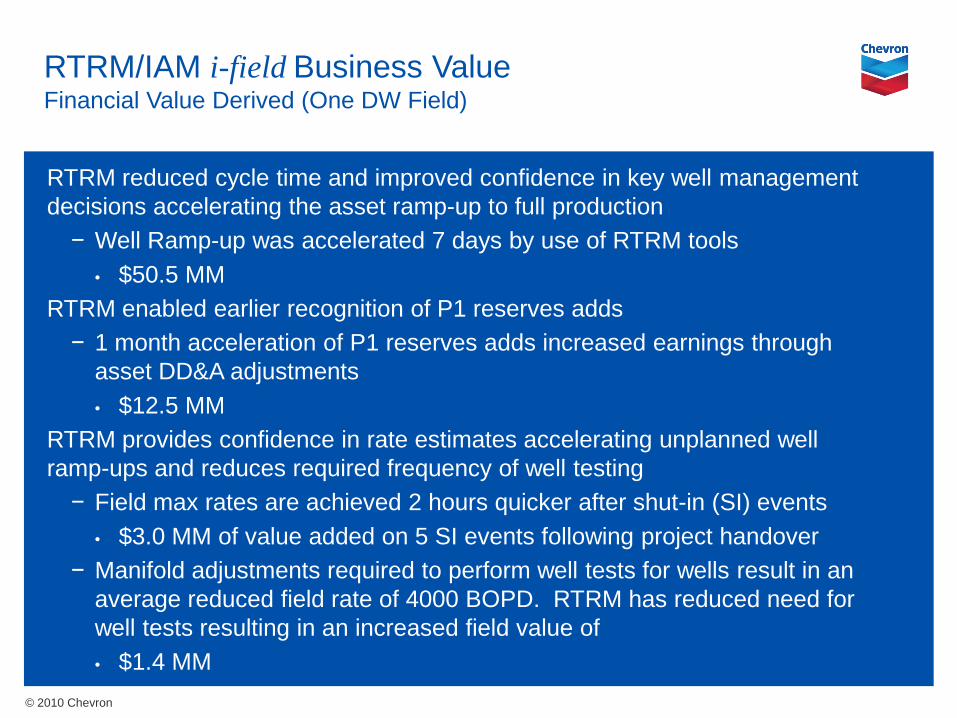
RTRM/IAM i-field Business ValueFinancial Value Derived (One DW Field)
RTRM reduced cycle time and improved confidence in key well management decisions accelerating the asset ramp-up to full production− Well Ramp-up was accelerated 7 days by use of RTRM tools
• $50.5 MMRTRM enabled earlier recognition of P1 reserves adds− 1 month acceleration of P1 reserves adds increased earnings through
asset DD&A adjustments • $12.5 MM
RTRM provides confidence in rate estimates accelerating unplanned well ramp-ups and reduces required frequency of well testing− Field max rates are achieved 2 hours quicker after shut-in (SI) events
• $3.0 MM of value added on 5 SI events following project handover− Manifold adjustments required to perform well tests for wells result in an
average reduced field rate of 4000 BOPD. RTRM has reduced need for well tests resulting in an increased field value of • $1.4 MM
© 2010 Chevron
Conclusions/Next Steps
RTRM i-field has captured significant value on the assets in which its been deployed
RTRM i-field application is expanding rapidly – interest and enthusiasm growing among Major Capital Projects, field expansions and base businesses
Additional functionality and connectivity are being developed to add to the full value of the tools and workflows