Embed Size (px)
Citation preview
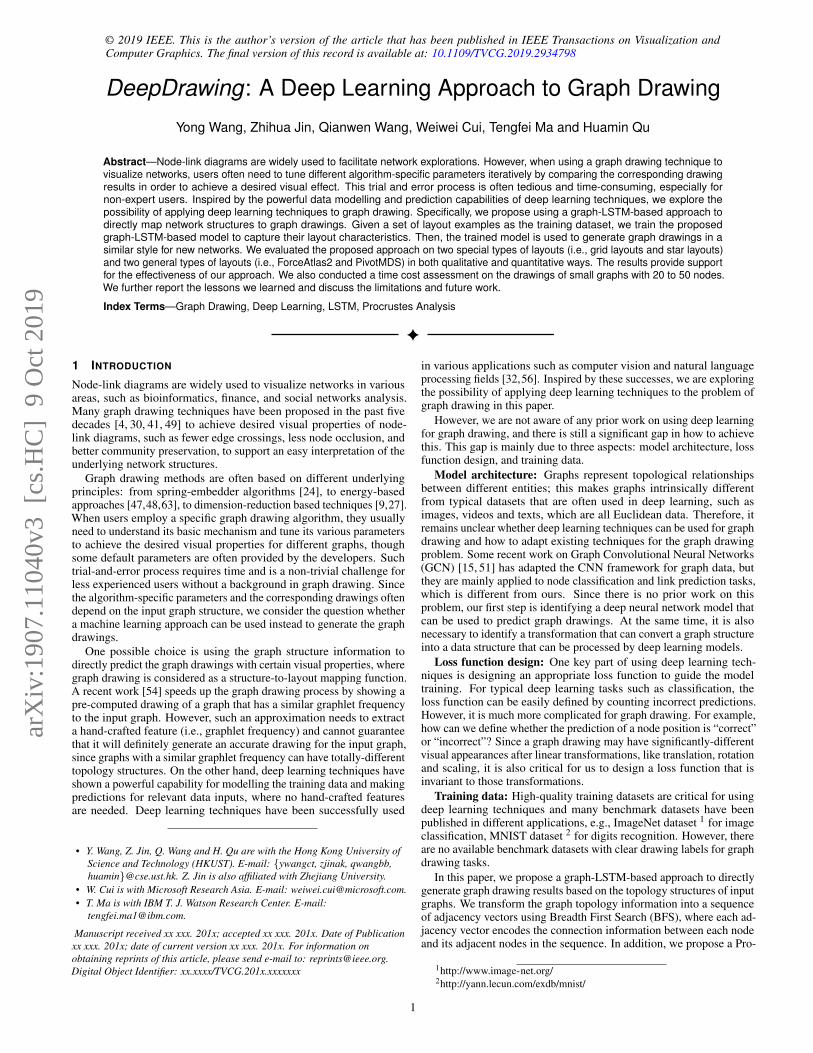
© 2019 IEEE. This is the author’s version of the article that has been published in IEEE Transactions on Visualization andComputer Graphics. The final version of this record is available at: 10.1109/TVCG.2019.2934798
DeepDrawing: A Deep Learning Approach to Graph Drawing
Yong Wang, Zhihua Jin, Qianwen Wang, Weiwei Cui, Tengfei Ma and Huamin Qu
Abstract—Node-link diagrams are widely used to facilitate network explorations. However, when using a graph drawing technique tovisualize networks, users often need to tune different algorithm-specific parameters iteratively by comparing the corresponding drawingresults in order to achieve a desired visual effect. This trial and error process is often tedious and time-consuming, especially fornon-expert users. Inspired by the powerful data modelling and prediction capabilities of deep learning techniques, we explore thepossibility of applying deep learning techniques to graph drawing. Specifically, we propose using a graph-LSTM-based approach todirectly map network structures to graph drawings. Given a set of layout examples as the training dataset, we train the proposedgraph-LSTM-based model to capture their layout characteristics. Then, the trained model is used to generate graph drawings in asimilar style for new networks. We evaluated the proposed approach on two special types of layouts (i.e., grid layouts and star layouts)and two general types of layouts (i.e., ForceAtlas2 and PivotMDS) in both qualitative and quantitative ways. The results provide supportfor the effectiveness of our approach. We also conducted a time cost assessment on the drawings of small graphs with 20 to 50 nodes.We further report the lessons we learned and discuss the limitations and future work.
Index Terms—Graph Drawing, Deep Learning, LSTM, Procrustes Analysis
1 INTRODUCTION
Node-link diagrams are widely used to visualize networks in variousareas, such as bioinformatics, finance, and social networks analysis.Many graph drawing techniques have been proposed in the past fivedecades [4, 30, 41, 49] to achieve desired visual properties of node-link diagrams, such as fewer edge crossings, less node occlusion, andbetter community preservation, to support an easy interpretation of theunderlying network structures.
Graph drawing methods are often based on different underlyingprinciples: from spring-embedder algorithms [24], to energy-basedapproaches [47,48,63], to dimension-reduction based techniques [9,27].When users employ a specific graph drawing algorithm, they usuallyneed to understand its basic mechanism and tune its various parametersto achieve the desired visual properties for different graphs, thoughsome default parameters are often provided by the developers. Suchtrial-and-error process requires time and is a non-trivial challenge forless experienced users without a background in graph drawing. Sincethe algorithm-specific parameters and the corresponding drawings oftendepend on the input graph structure, we consider the question whethera machine learning approach can be used instead to generate the graphdrawings.
One possible choice is using the graph structure information todirectly predict the graph drawings with certain visual properties, wheregraph drawing is considered as a structure-to-layout mapping function.A recent work [54] speeds up the graph drawing process by showing apre-computed drawing of a graph that has a similar graphlet frequencyto the input graph. However, such an approximation needs to extracta hand-crafted feature (i.e., graphlet frequency) and cannot guaranteethat it will definitely generate an accurate drawing for the input graph,since graphs with a similar graphlet frequency can have totally-differenttopology structures. On the other hand, deep learning techniques haveshown a powerful capability for modelling the training data and makingpredictions for relevant data inputs, where no hand-crafted featuresare needed. Deep learning techniques have been successfully used
• Y. Wang, Z. Jin, Q. Wang and H. Qu are with the Hong Kong University ofScience and Technology (HKUST). E-mail: {ywangct, zjinak, qwangbb,huamin}@cse.ust.hk. Z. Jin is also affiliated with Zhejiang University.
• W. Cui is with Microsoft Research Asia. E-mail: [email protected].• T. Ma is with IBM T. J. Watson Research Center. E-mail:
Manuscript received xx xxx. 201x; accepted xx xxx. 201x. Date of Publicationxx xxx. 201x; date of current version xx xxx. 201x. For information onobtaining reprints of this article, please send e-mail to: [email protected] Object Identifier: xx.xxxx/TVCG.201x.xxxxxxx
in various applications such as computer vision and natural languageprocessing fields [32,56]. Inspired by these successes, we are exploringthe possibility of applying deep learning techniques to the problem ofgraph drawing in this paper.
However, we are not aware of any prior work on using deep learningfor graph drawing, and there is still a significant gap in how to achievethis. This gap is mainly due to three aspects: model architecture, lossfunction design, and training data.
Model architecture: Graphs represent topological relationshipsbetween different entities; this makes graphs intrinsically differentfrom typical datasets that are often used in deep learning, such asimages, videos and texts, which are all Euclidean data. Therefore, itremains unclear whether deep learning techniques can be used for graphdrawing and how to adapt existing techniques for the graph drawingproblem. Some recent work on Graph Convolutional Neural Networks(GCN) [15, 51] has adapted the CNN framework for graph data, butthey are mainly applied to node classification and link prediction tasks,which is different from ours. Since there is no prior work on thisproblem, our first step is identifying a deep neural network model thatcan be used to predict graph drawings. At the same time, it is alsonecessary to identify a transformation that can convert a graph structureinto a data structure that can be processed by deep learning models.
Loss function design: One key part of using deep learning tech-niques is designing an appropriate loss function to guide the modeltraining. For typical deep learning tasks such as classification, theloss function can be easily defined by counting incorrect predictions.However, it is much more complicated for graph drawing. For example,how can we define whether the prediction of a node position is “correct”or “incorrect”? Since a graph drawing may have significantly-differentvisual appearances after linear transformations, like translation, rotationand scaling, it is also critical for us to design a loss function that isinvariant to those transformations.
Training data: High-quality training datasets are critical for usingdeep learning techniques and many benchmark datasets have beenpublished in different applications, e.g., ImageNet dataset 1 for imageclassification, MNIST dataset 2 for digits recognition. However, thereare no available benchmark datasets with clear drawing labels for graphdrawing tasks.
In this paper, we propose a graph-LSTM-based approach to directlygenerate graph drawing results based on the topology structures of inputgraphs. We transform the graph topology information into a sequenceof adjacency vectors using Breadth First Search (BFS), where each ad-jacency vector encodes the connection information between each nodeand its adjacent nodes in the sequence. In addition, we propose a Pro-
1http://www.image-net.org/2http://yann.lecun.com/exdb/mnist/
1
arX
iv:1
907.
1104
0v3
[cs
.HC
] 9
Oct
201
9
crustes Statistics based loss function, which is essentially invariant totranslation, rotation and scaling of graph drawing, to assess the learningquality and guide the model training. Furthermore, we generate threegraph datasets (including grid graphs, star graphs and general graphswith clear communities), which are further drawn by both two regulardrawings (i.e., grid layout and star layout) and two general drawings(i.e., a force-directed graph drawing [47] and a dimension-reduction-based drawing [9]). We carefully choose the parameters of drawingalgorithms to generate drawing results with certain desired visual prop-erties for these graphs (e.g., better preservation of community structureand less node occlusion). As a proof of concept, these drawings aretreated as the ground-truth labels. The graphs and the correspondingdrawings are used to train and test the proposed approach.
We investigated the effectiveness of the proposed deep learningapproach through both qualitative comparisons and quantitative metricevaluations, where the drawings of our approach are compared with theground truth drawings (drawn by ForceAtlas2 [47] and PivotMDS [9])and the drawings by a 4-layer bidirectional LSTM model. In summary,the primary contributions of this work include:
• A novel graph-LSTM-based approach for graph drawing, which,to the best of our knowledge, is the first time that deep learninghas been applied to graph drawing.
• Qualitative and quantitative evaluations on three synthetic graphdatasets (i.e., grid graphs, star graphs and clustered graphs with20–50 nodes) and four types of drawings (i.e., grid layout, starlayout, ForceAtlas2 and PivotMDS), which provides support forthe effectiveness and efficiency of our approach in generatinggraph drawings similar to the training data.
• A detailed summary of the lessons we learned in the developmentof the proposed approach, which, we hope, will assist in futureresearch on using deep learning for graph visualization.
2 RELATED WORK
This section summarizes the related work of this paper, which mainlyconsists of three parts: graph drawing, graph neural networks, andmachine learning approaches to graph drawing.
2.1 Graph DrawingOne of the central problems in graph visualization is the design ofthe algorithms for graph layout. Since Tutte [72, 73] proposed hisbarycenter method for graph drawing more than fifty years ago, theinformation visualization community has proposed many graph drawingtechniques. These algorithms can be found in various books [4, 49, 71]and surveys [16, 30, 41, 74, 79].
Typically, graph drawing algorithms generate only one drawingfor a graph, though some work [6] also proposes producing multipledrawings for the same graph. According to the survey by Gibson etal. [30], the existing graph drawing algorithms can be categorized intothree types: force-directed layouts, dimension reduction based layouts,and computational improvements like multi-level techniques. Force-directed graph layout approaches regard a graph as a physical system,where nodes are attracted and repelled in order to achieve desirablegraph drawing aesthetics. Eades [22] proposed a spring-electrical-basedgraph drawing approach, where nodes and edges are modeled as steelrings and springs, respectively. The final graph drawing result is thestable state when the forces on each node reach an equilibrium. Thiskind of modelling is the start of all force-directed techniques and hasinspired many follow-up algorithms, like the spring-embedder algo-rithm by Fruchterman and Reingold [25], the graph-embedder (GEM)algorithm [24], and the energy-based approaches [47, 48, 63, 78]. Di-mension reduction based methods focus on retaining the informationof high-dimensional space in the projected 2D plane, especially thegraph-theoretic distance between a pair of nodes. Various dimensionreduction techniques have been used for graph drawing, including mul-tidimensional scaling (MDS) [9, 27], linear dimension reduction [38],self-organising maps (SOM) [7, 8] and t-SNE [53]. The last categoryof algorithms mainly aims to improve the efficiency of force-directedalgorithms for drawing very large graphs. These approaches often fol-low a multi-level paradigm: optimizing the graph drawing in a coarser
graph representation and further propagate the layout result back to theoriginal graph [26, 34, 37, 44].
Different from prior studies, this paper explores the possibility ofusing deep neural networks for graph drawing.
2.2 Graph Neural Networks
Existing deep neural networks mainly focus on regular Euclideandata (e.g., images and text), which cannot be directly applied to non-Euclidean data, like graphs. To address this issue, a number of graphneural networks (GNN) have been proposed by extending existingdeep neural networks, e.g., convolutional neural networks (CNNs) andrecurrent neural networks (RNNs), to the graph domain [82].
The GNNs that are derived from CNNs can be categorized into spec-tral approaches and non-spectral approaches [82]. Spectral approachesapply convolution to the spectral representation of graphs [9, 12, 15, 40,51]. For example, Bruna et al. [12] conducted convolution in the Fourierdomain using eigen decomposition of the graph Laplacian. Defferrardet al. [15] approximated the spectral convolution using Chebyshev poly-nomials and reduced the computational cost. Since spectral convolutiondepends on the input graph, spectral approaches are usually appliedin the learning problem within a single graph. Instead of definingconvolution operations in the spectral field, non-spectral approachesoperate convolution directly on the graph [36, 60, 62]. The key chal-lenge of non-spectral approaches is how to define the neighborhood ofa node as the receptive field and various methods have been proposed,including adaptive weight matrices [21], uniformly sampling [36], andtransition matrices [1]. A closely related research direction exploresusing RNNs for graph-structured data [57, 65, 70, 82]. For example,Li et al. [57] modified the Gate Recurrent Units (GRU) and proposeda gated GNN to learn node representations. Tai et al. [70] proposedtwo types of tree-LSTM, generalizing the basic LSTM to tree-structuretypologies, to predict the semantic relatedness of sentences. Peng et al.[65] extended tree-LSTM by distinguishing different edge types in thegraph and applied the model to the relation extraction problem in theNatural Language Processing (NLP) field. You et al. [80] developed anRNN-based method for modeling complex distributions over multiplegraphs and further generating graphs.
However, the idea of applying GNNs to graph drawing has beenrarely explored, even though it is a fundamental research direction inthe visualization community.
2.3 Machine Learning Approaches to Graph Drawing
According to the survey by Santos Vieira et al. [17], there have beenonly a few studies about applying machine learning techniques to graphdrawing. These techniques can be roughly classified into two categories:the approaches that learn from human interaction and those withoutusing human interaction. The first group of techniques assume that thechoices of aesthetic criteria and their importance depend on the users’subjective preferences. Therefore, these approaches keep humans inthe loop and use evolutionary algorithms (e.g., genetic algorithms) tolearn user preferences [2, 3, 58, 68, 69]. However, these approaches areinherently dependant on user interactions. The second category focuseson using traditional neural-network-based algorithms to optimize theaesthetic criteria of a graph layout [13, 76] or to draw graphs in both2D and 3D space [59]. However, these early studies are essentiallycategorized as traditional graph drawing methods, where algorithm-specific parameters are still needed.
Recently, Kwon et al. [54] proposed a machine learning approachthat provides users with a quick preview of the graph drawing and it usesgraphlet frequency to compute the similarities among different graphstructures. However, as Kwon et al. pointed out in their paper, similargraphlet frequencies do not necessarily lead to similar drawings. Deeplearning techniques have recently been applied to multidimensionalprojections [23]. However, the networks cannot be directly used forgraph drawing, since the designs of the model input and training lossfunction for graph drawing are significantly different from those ofmultidimensional projection. Also, neural-network-based approacheshave been proposed to evaluate graph drawing results [35, 52].
2
© 2019 IEEE. This is the author’s version of the article that has been published in IEEE Transactions on Visualization andComputer Graphics. The final version of this record is available at: 10.1109/TVCG.2019.2934798
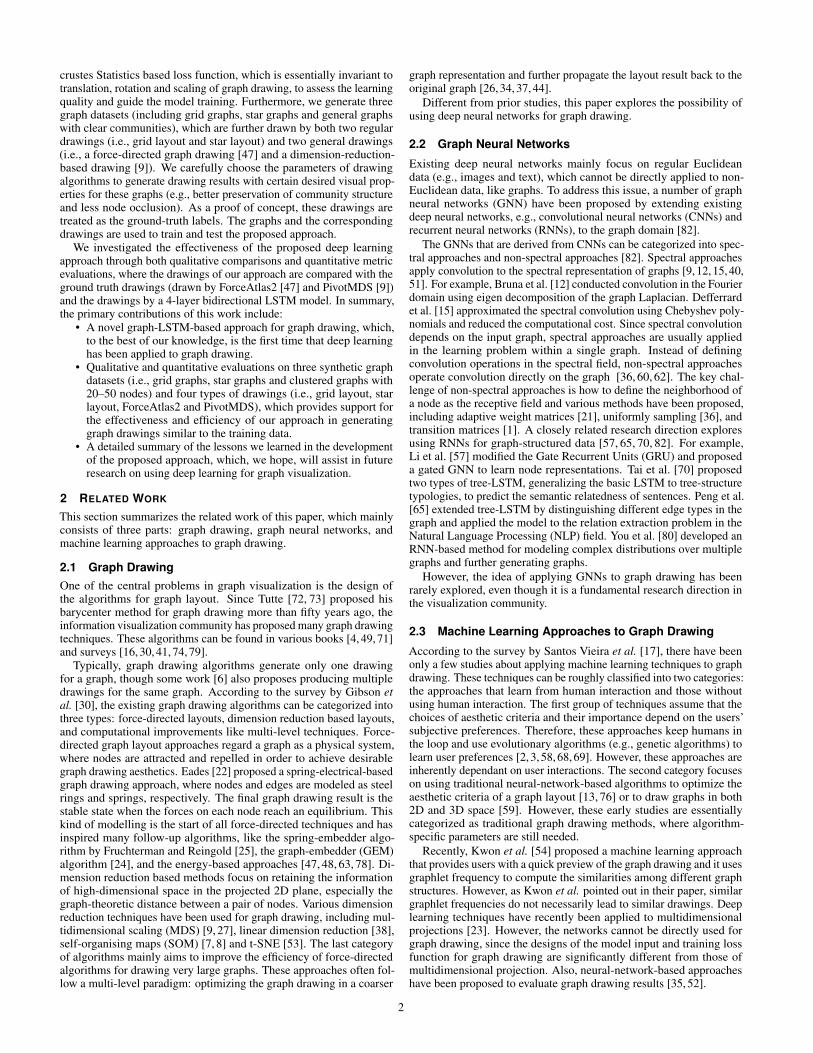
Fig. 1. The workflow of graph drawing algorithms: (a) traditional graphdrawing algorithms, (b) the proposed deep learning based approach.
This paper expands on these earlier findings and makes new contri-butions to the field by focusing on applying deep learning techniques todirect graph drawing instead of using a similar preview, and the trainedmodel can be reusable for new graphs.
3 PROBLEM STATEMENT
A graph G = (V,E) consists of a set of n nodes V = {v1,v2, ...,vn} andan edge set E ⊆V ×V . The graphs can be classified into directed andun-directed graphs, depending on whether the edges are directed or not.For graph drawing, the edge directions are often ignored, since they caneasily be visualized by adding an arrow to each link. In this paper, wefocus on the visualization of unweighted and undirected graphs. Thegraph drawing problem is finding a set of coordinates C = {cv|v ∈V}for the given graph G = {V,E} [44]. In this paper, we only consider2D drawings, which means pv ∈ R2. Also, we assume that the edges inthe graph drawings are straight-lines, instead of arcs or curves.
As discussed in Section 2.1, there have been many graph drawingalgorithms that are proposed for optimizing aesthetic criteria like mini-mizing edge crossings, avoiding node occlusions, and preserving thenode community structures. These criteria are formulated as objectivefunctions and integrated into the design of traditional graph drawingalgorithms (Fig. 1(a)). When using a drawing algorithm to visualize aspecific graph, users also need to tune the algorithm parameters throughtrial and error to achieve a suitable graph drawing result.
In this paper, we formalize graph drawing as a learning problemand propose a novel and generalizable deep-learning-based approach tograph drawing (Fig. 1(b)). Given a set of graph drawing examples withdesirable aesthetic properties and their structures, the deep learningmodel is trained to learn the mapping and corresponding algorithm-specific parameters for determining the desirable graph drawings (Train-ing Stage in Fig. 1(b)). Once the deep learning model is successfullytrained, when given a new graph, it can automatically analyze the graphstructure and directly generate a layout that carries the common visualproperties of the drawing examples (Testing Stage in Fig. 1(b)). We usethe term “graph drawing style” to refer to the common visual prop-erties (e.g., the characteristics regarding edge crossings, communitypreservation and node occlusion) that are shared by the training graphdrawings. The deep learning model learns one specific drawing stylefrom a certain training dataset. In real applications, the deep learningmodel can be pre-trained by experts. Then, the well-trained model canbe directly used by different users to visualize graphs, especially graphdrawing novices.
4 BACKGROUND: LONG SHORT-TERM MEMORY NETWORKS
As will be introduced in Section 5, we propose a graph-LSTM-basedapproach for graph drawing, where the foundation of our model is thetypical LSTM architecture. This section introduces the basic conceptsand other related background of LSTM.
LSTM architecture is a popular variant of Recurrent Neural Net-works (RNNs). It can learn long-distance dependencies of the inputsequence and can avoid the gradient exploding and vanishing problemsof traditional RNN models [28, 42]. The main reason for this is thatLSTM models introduce a memory cell, which can preserve the stateover a long time range. An LSTM memory cell consists of an inputgate, output gate, and forget gate. It takes sequential data {x0, ...,xT }as inputs and maintains a time-variant cell state vector ct and hiddenstate vector ht , where xt ∈ Rm, ct ∈ Rn and ht ∈ Rn.
The transitions functions of LSTM are as follows:
it = σ
(W (i)xt +U (i)ht−1 +b(i)
)(1)
ot = σ
(W (o)xt +U (o)ht−1 +b(o)
)(2)
ct = tanh(
W (c)xt +U (c)ht−1 +b(c))
(3)
ft = σ
(W ( f )xt +U ( f )ht−1 +b( f )
)(4)
ct = it � ct + ft � ct−1 (5)ht = ot � tanh(ct) (6)
where xt , ht and ct represent the input feature vector, hidden state,and cell state of the current time step t, respectively. W ’s and U’s arethe weighted matrices for the input and hidden state, and b’s are the biasvectors. σ , tanh and � are the sigmoid function, the hyperbolic tangentfunction, and the pointwise multiplication operation, respectively. Basi-cally, the input gate it controls how much the information is updatedat each time step; the output gate ot controls how much of the internalstate information flows out of the cell. The forget gate ft is a key designof LSTM; it enables LSTM models to forget the previous cell state thathas become irrelevant to a certain degree. Due to the design of thesegates, LSTM models can learn and represent long-distance correlationswithin sequential input data [42].
5 DeepDrawingWe propose a deep learning based approach, called DeepDrawing, forgraph drawing. Our model is built on the widely-used LSTM frame-work [42]. This section introduces DeepDrawing from the perspectivesof model architecture, input design, and loss function.
5.1 Graph-LSTM-based ArchitectureWhen applying deep learning techniques to graph drawing, a fundamen-tal requirement is to learn a certain graph drawing style from multiplegraphs of various sizes. As discussed in Section 2.2, many graph neu-ral networks, like spectral approaches [9, 12, 15, 40], mainly focus onlearning from a single graph or fixed-size graphs. Thus, these modelsdo not easily generalize graphs with different sizes and structures [10].On the other hand, RNN-based graph neural networks are intrinsicallyapplicable to graphs with variable sizes, since RNN cells can be recur-rently used. Also, a recent study [80] has shown that RNNs are capableof modelling the structure information of multiple graphs. Inspired bythese models, we focus on RNN-based approaches for graph drawingin this paper.
Among the RNN-based approaches, vanilla RNNs have proved tobe difficult to train, as they suffer from gradient vanishing or explo-sion [5, 64] problems. On the contrary, as introduced in Section 4,LSTM models introduce a series of gates to avoid amplifying or sup-pressing the gradients, making them better at capturing long-distancedependencies.
In this paper, we propose a graph-LSTM-based approach for graphdrawing. The commonly-used LSTM architectures are often linearlychained, as described in Section 4. One of their major limitations isthat they can only explicitly model sequential data. However, for graphdrawing, the input is essentially the graph/network structure, which isusually not linearly-chained. The layout position of a node in the graphdrawing depends on all the other nodes that are directly or indirectlyconnected to it. When using a general LSTM model, such kind ofdependency information can still be weakened or lost, especially forthe LSTM cells that are far from each other. Inspired by the recent
3
work in natural language processing field [65, 70], we propose addingdirect connections between different LSTM cells to explicitly modelthe topological structure of input networks. Such direct connectionsare termed “skip connections” in the deep learning field [32]. Then wecan use the linear chain between adjacent LSTM cells to propagate theoverall state of prior graph nodes to the subsequent nodes along thechain.
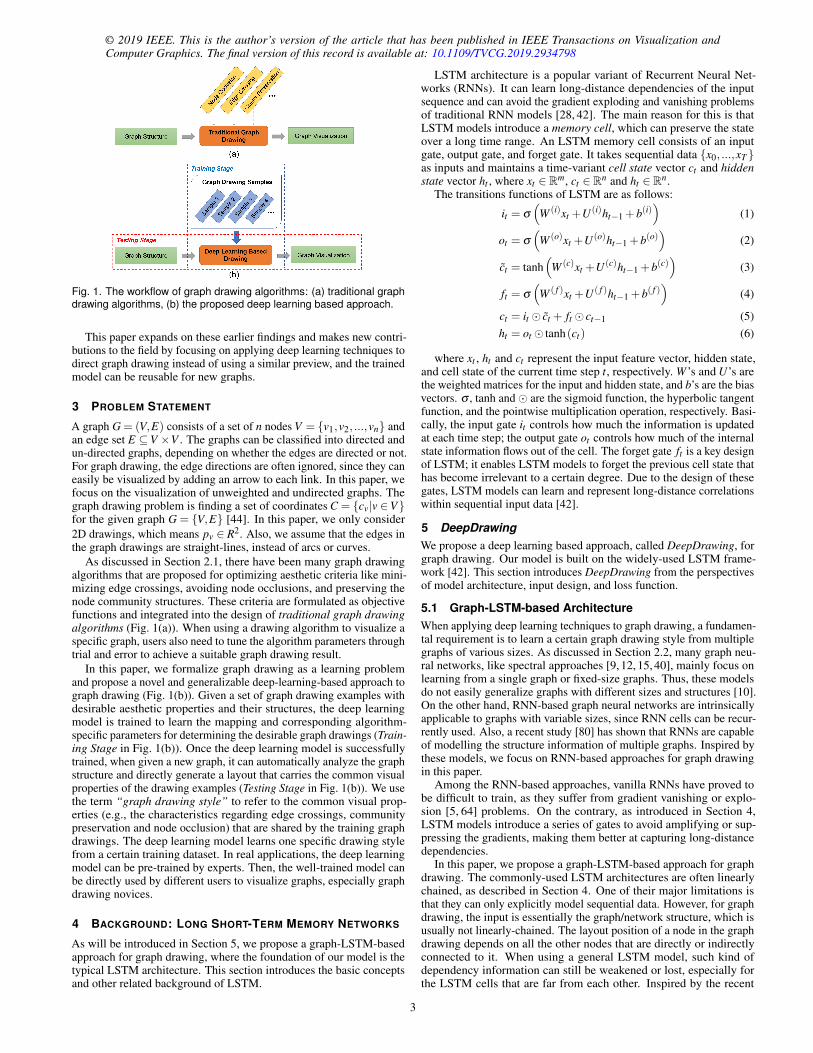
Although our model architecture is similar to prior studies [65, 70],it targets at different problems. Unlike natural language processing(NLP) problems, where the input text is already sequential data and theinput feature vector can be directly gained through word embedding, itis necessary to carefully design the architecture and input feature vectorto model the graph topology information when using deep learning forgraph drawing. To the best of our knowledge, our model is the first deeplearning architecture proposed for graph drawing tasks. Fig. 2 providesan overview of the proposed model architecture. The input graph istransformed into a sequence of nodes. Each LSTM cell takes the featurevector of one node as input and generates the output status of each node.The green arrows between LSTM cells represent the real edges in thegraph structure, while the dotted yellow arrows are the “fake” edgesbetween adjacent nodes in the BFS-ordered node sequence to propagatethe summary state of previous nodes to subsequent unprocessed nodes.The detailed transition equations of our model are as follows:
it = σ
(W (i)xt +U (i)ht−1 + ∑
k∈P(t)U (i)hk +b(i)
)(7)
ot = σ
(W (o)xt +U (o)ht−1 + ∑
k∈P(t)U (o)hk +b(o)
)(8)
ct = tanh
(W (c)xt +U (c)ht−1 + ∑
k∈P(t)U (c)hk +b(c)
)(9)
ft,t−1 = σ
(W ( f )xt +U ( f )ht−1 +b( f )
)(10)
ftk = σ
(W ( f )xt +U ( f )hk +b( f )
),k ∈ P(t) (11)
ct = it � ct + ft,t−1� ct−1 + ∑k∈P(t)
ftk� ck (12)
ht = ot � tanh(ct) (13)
where P(t) denotes the prior nodes that have real edges linked toNode t. Like the standard LSTM model (Equations 1-6), the proposedmodel also considers the hidden state of the immediate predecessornode (t − 1) in the recurrent terms (i.e., U (i), U (o), U (c) and U ( f )),which correspond to the fake edges discussed above. However, whencomparing the transition functions of both models (Equations 1–6 andEquations 7–13), it is easy to find the main difference: our modelfurther considers the real edges in the architecture and integrates thestates of the remotely-connected predecessors (i.e., U (i), U (o), U (c) andU ( f )) into the current node. Thus, it can directly reflect the actual graphstructure and well model the influence of former nodes on subsequentnodes along the node sequence in the graph drawing.
On the other hand, graphs are not sequential data. When attemptingto draw a graph using this approach, all nodes (both those before andthose after in the linear layout) should be taken into consideration, i.e.,the latter nodes in the sequence can also influence the positions ofthe former nodes during the actual graph drawing. To better modelthis mutual influence, we further introduce a backward propagation tothe proposed graph-LSTM-based model by simply reversing the linkdirection in the forward propagation (Fig. 2(b)). Then, we combine theoutputs of each LSTM cell in both forward and backward propagationsinto a concatenated feature vector, which is further input into a fully-connected layer to generate the final 2D coordinate of each node.
5.2 Model InputWhen applying the LSTM model to graph drawing, it is crucial to finda suitable way to input the graph structure information into the LSTM
Fig. 2. An illustration of the proposed graph-LSTM-based model archi-tecture: (a) an example graph input, (b) the proposed model to processthe input graph. The graph nodes are sorted using BFS, with each noderepresented by an adjacency vector encoding its connections with pre-decessor nodes. The dotted yellow arrows (“fake” edges) propagate theprior nodes’ overall influence on the drawing of subsequent nodes, andthe curved green arrows (real edges of graphs) explicitly reflect the actualgraph structure, enhancing the graph drawing details. The information ofboth forward and backward rounds is considered for generating the final2D node layouts.
model. More specifically, we need to determine the feature vector foreach node, where the graph structure information of each node shouldbe properly encoded. This feature vector will be further input into theLSTM model. Also, it is necessary to transform the original graphto a sequence of nodes (i.e., node ordering) that can be processed bythe LSTM model, which is another key point for applying LSTM intograph drawing.
Node Feature Vector: When LSTM models are applied to NLPtasks, word embedding techniques are often used to transform wordsinto fixed-length feature vectors; these vectors can be further inputinto LSTM models. Considering that many node embedding tech-niques have been proposed, like node2vec [33], DeepWalk [66] andSDNE [75], it is natural to use node embedding techniques to encodegraph structure information and further input it into the proposed model.However, these node embedding techniques are mainly used for a singlegraph and have been proved incapable to be generalized to multiplegraphs [39]. Our initial experiments during the design of the proposedmethod also confirmed this observation.
Taking into account that adjacency information between nodes isthe essential information in a graph, we propose using a fixed-lengthadjacency vector as the feature vector of each node directly; it will befurther input into the proposed model. The adjacency vector of eachnode encodes the connectivity between the current node and its prior knodes, where k is empirically set as a fixed number.
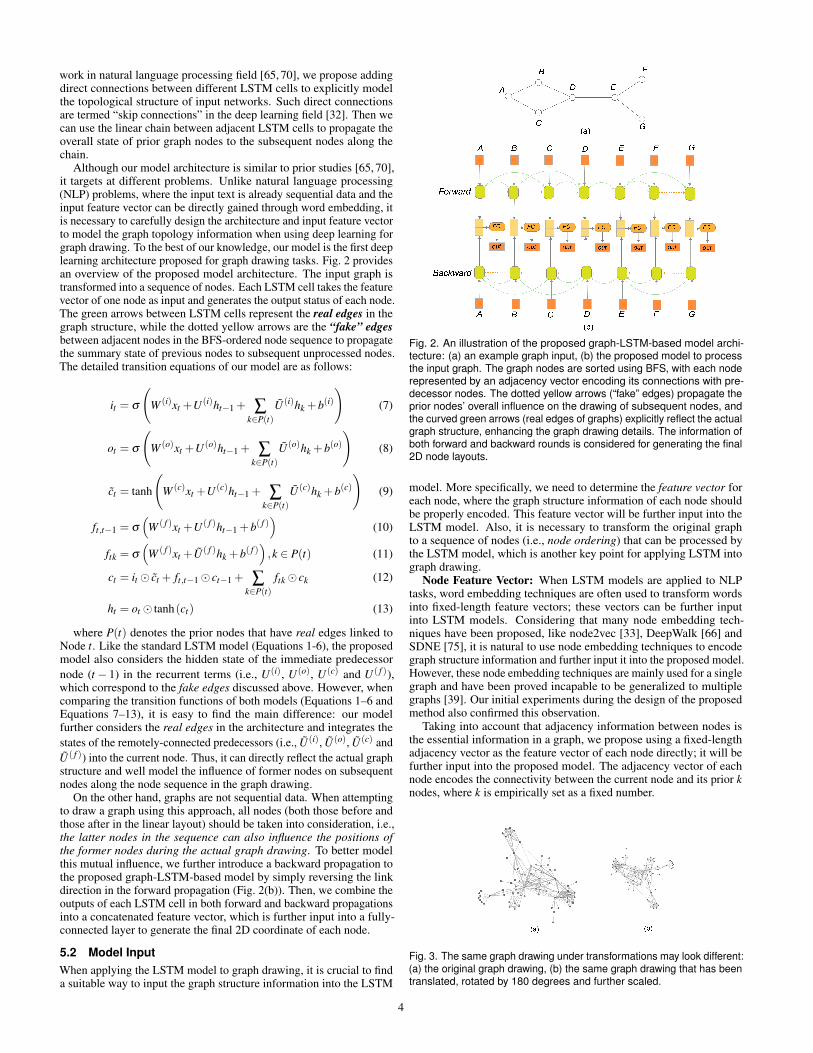
Fig. 3. The same graph drawing under transformations may look different:(a) the original graph drawing, (b) the same graph drawing that has beentranslated, rotated by 180 degrees and further scaled.
4
© 2019 IEEE. This is the author’s version of the article that has been published in IEEE Transactions on Visualization andComputer Graphics. The final version of this record is available at: 10.1109/TVCG.2019.2934798
Node Ordering: Graphs can be represented by adjacency matricesand are permutation-invariant in terms of node ordering. Therefore, onenaive way to model a graph as a sequence of nodes is to use randomorder. However, for a specific graph, the total number of such kind ofrandom node orderings is O(n!), where n is the total number of nodes.
Inspired by the recent study [80], we propose using breadth-first-search (BFS) to generate node ordering for a specific graph. Themajor advantage of BFS ordering is that we need to train the proposedmodel on only all the possible BFS orderings, instead of exhaustivelygoing through all possible node permutations, which can reduce themodel searching space and benefit the model training. In addition,for a specific node in a node sequence sorted by BFS, there is anupper bound for the possible connections between this node and thenodes before it along the BFS sequence [80]. More specifically, let(v1,v2, ...,vi−1,vi,vi+1, ...,vn) be a BFS ordering of nodes, the furthestnode before vi that is possible to link to vi is vi−M and all the nodesbefore vi−M are impossible to link to vi, where M is the maximumnumber of nodes of each level in a BFS sorting. Due to the existence ofthis upper bound, we can set the length of the node feature vector to afixed length smaller than the node number without losing much graphstructure information.
To further reduce the model’s searching space, we also use nodedegree to sort the nodes at the same depth level of a BFS sorting. Duringthe training stage of the model, we randomly choose the starting node ofthe BFS sequence, which can augment the training dataset and improvemodel generalizability.
5.3 Loss FunctionThe design of loss function is another crucial part of applying deeplearning techniques to graph drawing, since the loss function will guidethe neural network to learn what a desirable graph drawing shouldbe based on the training dataset. Specifically, the graph drawings inthe training dataset are regarded as the ground-truth drawings, andthe purpose of the loss function is to guide the proposed model togenerate graph layouts as “similar” to the corresponding training dataas possible.
However, it is challenging to propose an appropriate loss functionfor comparing the similarity between two drawings of the same graph.For example, a specific graph drawing may look very different aftera series of operations from the set of translation, rotation and scaling,as shown in Fig. 3. Therefore, the loss function should be invariantto such kind of transformations. Motivated by these requirements, wepropose conducting Procrustes Analysis [14,18] to assess the similaritybetween two drawings of the same graph. Procrustes Analysis is awidely-used technique in statistics and shape comparison [31] and ithas also been used in graph drawing [45]. For two graph drawings of thesame graph with n nodes, Procrustes Analysis will explicitly translate,scale and rotate the drawings to align them. Suppose the correspondingcoordinates of all the n nodes in the two drawings are C = [c1, ...,cn]
T
and C = [c1, ..., cn]T , where ci = (xi,yi) and ci = (xi, yi), the Procrustes
Statistic will be calculated to indicate the shape difference betweenthem as follows:
R2 = 1− (tr(CT CCTC)1/2)2
tr(CTC)tr(CT C)(14)
where 0 ≤ R2 ≤ 1. It is essentially the squared sum of the distancesbetween C and C after a series of best possible transformations. R2 =0 denotes both graph drawings are exactly the same, while R2 = 1indicates that the two graph drawings are totally different and cannotbe matched by any transformations.
6 EVALUATION
We thoroughly assess DeepDrawing through both qualitative and quan-titative evaluations. This section introduces the detailed experimentsettings and evaluation results.
6.1 Experiment SetupThe experiment settings include graph generation, drawing datasetgeneration, baseline method selection and other implementation details.
6.1.1 Graph GenerationSince there are no public graph drawing datasets, where the layoutposition of each node is labeled, we need to generate graphs and furtherproperly draw the graphs to gain drawing datasets for training andevaluating DeepDrawing. For graph generation, we adopt the classi-cal method of synthetic graph generation proposed by Lancichinettiet al. [55], since it can generate realistic benchmark graphs with var-ious community structures, which is helpful for verifying whethercommunity-related visual properties are learned by DeepDrawing. Theimplementation by the authors3 is used. We can specify various pa-rameters, including node number, average node degree, communitynumber and community overlap coefficient, to control the structures ofgenerated graphs. In this paper, we mainly generated graphs with thenode number evenly ranging from 20 to 50, as prior studies [29, 46]have shown that node-link diagrams are more suitable for graphs withdozens of nodes in terms of visual perception. We randomly split thewhole dataset into training, validation and testing datasets. Table 1shows the detailed statistics of the generated graphs used in this paper.
Apart from general graphs, we also generate grid and star graphs,which have simple and regular topological structures, to extensivelyevaluate the effectiveness of DeepDrawing.
To avoid contaminating the training data, we carefully checked andguaranteed that no validation and testing graphs have exactly the sametopology structure with any training graphs by using pynauty 4, a publiclibrary for checking graph isomorphism.
6.1.2 Drawing Dataset GenerationWe used different types of graph drawing methods to draw the graphs.As discussed in Section 2.1, there are mainly three types of graph draw-ing methods. There are many force-directed and dimension-reduction-based graph layout approaches. We chose ForceAtlas2 [47] and Pivot-MDS [9] respectively, since both algorithms are typical and widely-usedalgorithms for each type. Also, ForceAtlas2 can preserve the communi-ties and PivotMDS is deterministic and fast. The multi-level drawingtechniques are not used, as they mainly target at the acceleration oflarge graph visualization (Section 2.1), which is not the focus of thispaper.
All the graphs are drawn on a canvas with a size of 800× 800,which is big enough for rendering the graphs used in this paper. Whendrawing the graphs using the above two methods, we manually tunethe algorithm-specific parameters according to the node number, com-munity structure and edge density of the input graphs, in order toachieve desirable visual properties such as better clustering, fewer edgecrossings and less node occlusion. Also, due to the random point initial-ization of ForceAtlas2, its layout results are not deterministic. Given agraph with the same algorithm-specific parameters, the graph drawingresult may be different, which can confuse the deep learning model.Therefore, considering that PivotMDS is deterministic, we follow themethod by Kruiger et al. [53] and initialize the node positions withPivotMDS instead of using default randomized initial 2D positions,guaranteeing that the same input graph is mapped to the same layout.By drawing the generated graphs using ForceAtlas2 and PivotMDS, wegained two drawing datasets with different layout styles.
For the grid and star graphs, apart from using ForceAtlas2 andPivotMDS, we also visualized grid graphs as perfect grid layout andstar graphs as perfect star layout, gaining three drawing datasets forgrid and star graphs.
6.1.3 Baseline Method SelectionTo better evaluate the effectiveness of our approach, it is necessary tocompare it with other general models that have a similar architecture.Initially, we compared unidirectional LSTM and bidirectional LSTMmodels, and also tested them with 1∼ 4 layers. Among all these generalLSTM models, our initial results show that a 4-layer bidirectionalLSTM (Bi-LSTM) model has the best graph drawing performance interms of the Procrustes Statistic based similarity with the ground truth
3https://github.com/eXascaleInfolab/LFR-Benchmark UndirWeightOvp4https://web.cs.dal.ca/∼peter/software/pynauty/html
5
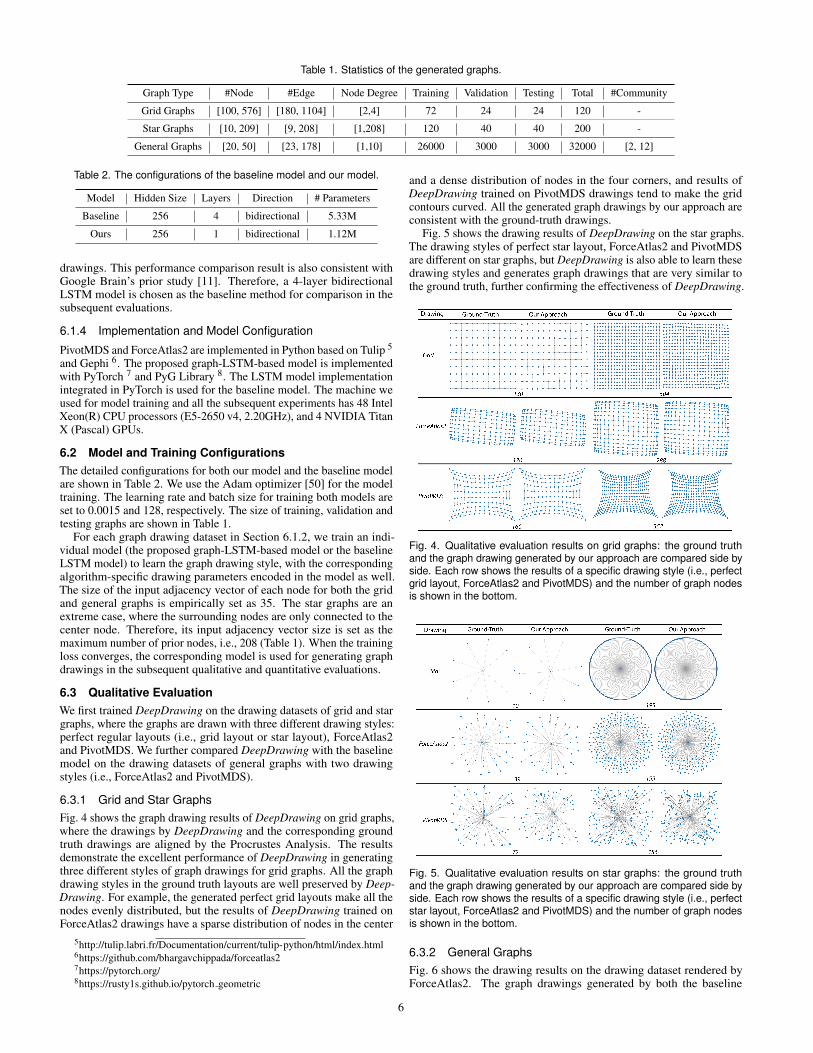
Table 1. Statistics of the generated graphs.
Graph Type #Node #Edge Node Degree Training Validation Testing Total #Community
Grid Graphs [100, 576] [180, 1104] [2,4] 72 24 24 120 -
Star Graphs [10, 209] [9, 208] [1,208] 120 40 40 200 -
General Graphs [20, 50] [23, 178] [1,10] 26000 3000 3000 32000 [2, 12]
Table 2. The configurations of the baseline model and our model.
Model Hidden Size Layers Direction # Parameters
Baseline 256 4 bidirectional 5.33M
Ours 256 1 bidirectional 1.12M
drawings. This performance comparison result is also consistent withGoogle Brain’s prior study [11]. Therefore, a 4-layer bidirectionalLSTM model is chosen as the baseline method for comparison in thesubsequent evaluations.
6.1.4 Implementation and Model Configuration
PivotMDS and ForceAtlas2 are implemented in Python based on Tulip 5
and Gephi 6. The proposed graph-LSTM-based model is implementedwith PyTorch 7 and PyG Library 8. The LSTM model implementationintegrated in PyTorch is used for the baseline model. The machine weused for model training and all the subsequent experiments has 48 IntelXeon(R) CPU processors (E5-2650 v4, 2.20GHz), and 4 NVIDIA TitanX (Pascal) GPUs.
6.2 Model and Training ConfigurationsThe detailed configurations for both our model and the baseline modelare shown in Table 2. We use the Adam optimizer [50] for the modeltraining. The learning rate and batch size for training both models areset to 0.0015 and 128, respectively. The size of training, validation andtesting graphs are shown in Table 1.
For each graph drawing dataset in Section 6.1.2, we train an indi-vidual model (the proposed graph-LSTM-based model or the baselineLSTM model) to learn the graph drawing style, with the correspondingalgorithm-specific drawing parameters encoded in the model as well.The size of the input adjacency vector of each node for both the gridand general graphs is empirically set as 35. The star graphs are anextreme case, where the surrounding nodes are only connected to thecenter node. Therefore, its input adjacency vector size is set as themaximum number of prior nodes, i.e., 208 (Table 1). When the trainingloss converges, the corresponding model is used for generating graphdrawings in the subsequent qualitative and quantitative evaluations.
6.3 Qualitative EvaluationWe first trained DeepDrawing on the drawing datasets of grid and stargraphs, where the graphs are drawn with three different drawing styles:perfect regular layouts (i.e., grid layout or star layout), ForceAtlas2and PivotMDS. We further compared DeepDrawing with the baselinemodel on the drawing datasets of general graphs with two drawingstyles (i.e., ForceAtlas2 and PivotMDS).
6.3.1 Grid and Star GraphsFig. 4 shows the graph drawing results of DeepDrawing on grid graphs,where the drawings by DeepDrawing and the corresponding groundtruth drawings are aligned by the Procrustes Analysis. The resultsdemonstrate the excellent performance of DeepDrawing in generatingthree different styles of graph drawings for grid graphs. All the graphdrawing styles in the ground truth layouts are well preserved by Deep-Drawing. For example, the generated perfect grid layouts make all thenodes evenly distributed, but the results of DeepDrawing trained onForceAtlas2 drawings have a sparse distribution of nodes in the center
5http://tulip.labri.fr/Documentation/current/tulip-python/html/index.html6https://github.com/bhargavchippada/forceatlas27https://pytorch.org/8https://rusty1s.github.io/pytorch geometric
and a dense distribution of nodes in the four corners, and results ofDeepDrawing trained on PivotMDS drawings tend to make the gridcontours curved. All the generated graph drawings by our approach areconsistent with the ground-truth drawings.
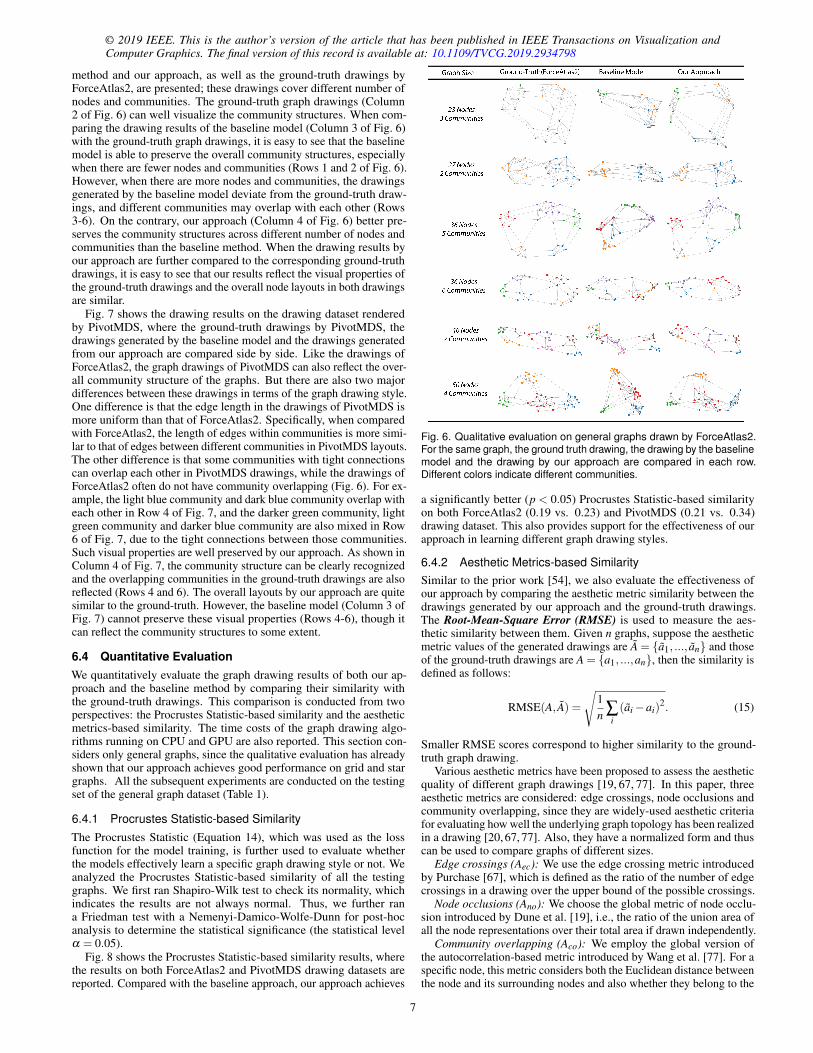
Fig. 5 shows the drawing results of DeepDrawing on the star graphs.The drawing styles of perfect star layout, ForceAtlas2 and PivotMDSare different on star graphs, but DeepDrawing is also able to learn thesedrawing styles and generates graph drawings that are very similar tothe ground truth, further confirming the effectiveness of DeepDrawing.
Fig. 4. Qualitative evaluation results on grid graphs: the ground truthand the graph drawing generated by our approach are compared side byside. Each row shows the results of a specific drawing style (i.e., perfectgrid layout, ForceAtlas2 and PivotMDS) and the number of graph nodesis shown in the bottom.
Fig. 5. Qualitative evaluation results on star graphs: the ground truthand the graph drawing generated by our approach are compared side byside. Each row shows the results of a specific drawing style (i.e., perfectstar layout, ForceAtlas2 and PivotMDS) and the number of graph nodesis shown in the bottom.
6.3.2 General GraphsFig. 6 shows the drawing results on the drawing dataset rendered byForceAtlas2. The graph drawings generated by both the baseline
6
© 2019 IEEE. This is the author’s version of the article that has been published in IEEE Transactions on Visualization andComputer Graphics. The final version of this record is available at: 10.1109/TVCG.2019.2934798
method and our approach, as well as the ground-truth drawings byForceAtlas2, are presented; these drawings cover different number ofnodes and communities. The ground-truth graph drawings (Column2 of Fig. 6) can well visualize the community structures. When com-paring the drawing results of the baseline model (Column 3 of Fig. 6)with the ground-truth graph drawings, it is easy to see that the baselinemodel is able to preserve the overall community structures, especiallywhen there are fewer nodes and communities (Rows 1 and 2 of Fig. 6).However, when there are more nodes and communities, the drawingsgenerated by the baseline model deviate from the ground-truth draw-ings, and different communities may overlap with each other (Rows3-6). On the contrary, our approach (Column 4 of Fig. 6) better pre-serves the community structures across different number of nodes andcommunities than the baseline method. When the drawing results byour approach are further compared to the corresponding ground-truthdrawings, it is easy to see that our results reflect the visual properties ofthe ground-truth drawings and the overall node layouts in both drawingsare similar.
Fig. 7 shows the drawing results on the drawing dataset renderedby PivotMDS, where the ground-truth drawings by PivotMDS, thedrawings generated by the baseline model and the drawings generatedfrom our approach are compared side by side. Like the drawings ofForceAtlas2, the graph drawings of PivotMDS can also reflect the over-all community structure of the graphs. But there are also two majordifferences between these drawings in terms of the graph drawing style.One difference is that the edge length in the drawings of PivotMDS ismore uniform than that of ForceAtlas2. Specifically, when comparedwith ForceAtlas2, the length of edges within communities is more simi-lar to that of edges between different communities in PivotMDS layouts.The other difference is that some communities with tight connectionscan overlap each other in PivotMDS drawings, while the drawings ofForceAtlas2 often do not have community overlapping (Fig. 6). For ex-ample, the light blue community and dark blue community overlap witheach other in Row 4 of Fig. 7, and the darker green community, lightgreen community and darker blue community are also mixed in Row6 of Fig. 7, due to the tight connections between those communities.Such visual properties are well preserved by our approach. As shown inColumn 4 of Fig. 7, the community structure can be clearly recognizedand the overlapping communities in the ground-truth drawings are alsoreflected (Rows 4 and 6). The overall layouts by our approach are quitesimilar to the ground-truth. However, the baseline model (Column 3 ofFig. 7) cannot preserve these visual properties (Rows 4-6), though itcan reflect the community structures to some extent.
6.4 Quantitative EvaluationWe quantitatively evaluate the graph drawing results of both our ap-proach and the baseline method by comparing their similarity withthe ground-truth drawings. This comparison is conducted from twoperspectives: the Procrustes Statistic-based similarity and the aestheticmetrics-based similarity. The time costs of the graph drawing algo-rithms running on CPU and GPU are also reported. This section con-siders only general graphs, since the qualitative evaluation has alreadyshown that our approach achieves good performance on grid and stargraphs. All the subsequent experiments are conducted on the testingset of the general graph dataset (Table 1).
6.4.1 Procrustes Statistic-based SimilarityThe Procrustes Statistic (Equation 14), which was used as the lossfunction for the model training, is further used to evaluate whetherthe models effectively learn a specific graph drawing style or not. Weanalyzed the Procrustes Statistic-based similarity of all the testinggraphs. We first ran Shapiro-Wilk test to check its normality, whichindicates the results are not always normal. Thus, we further rana Friedman test with a Nemenyi-Damico-Wolfe-Dunn for post-hocanalysis to determine the statistical significance (the statistical levelα = 0.05).
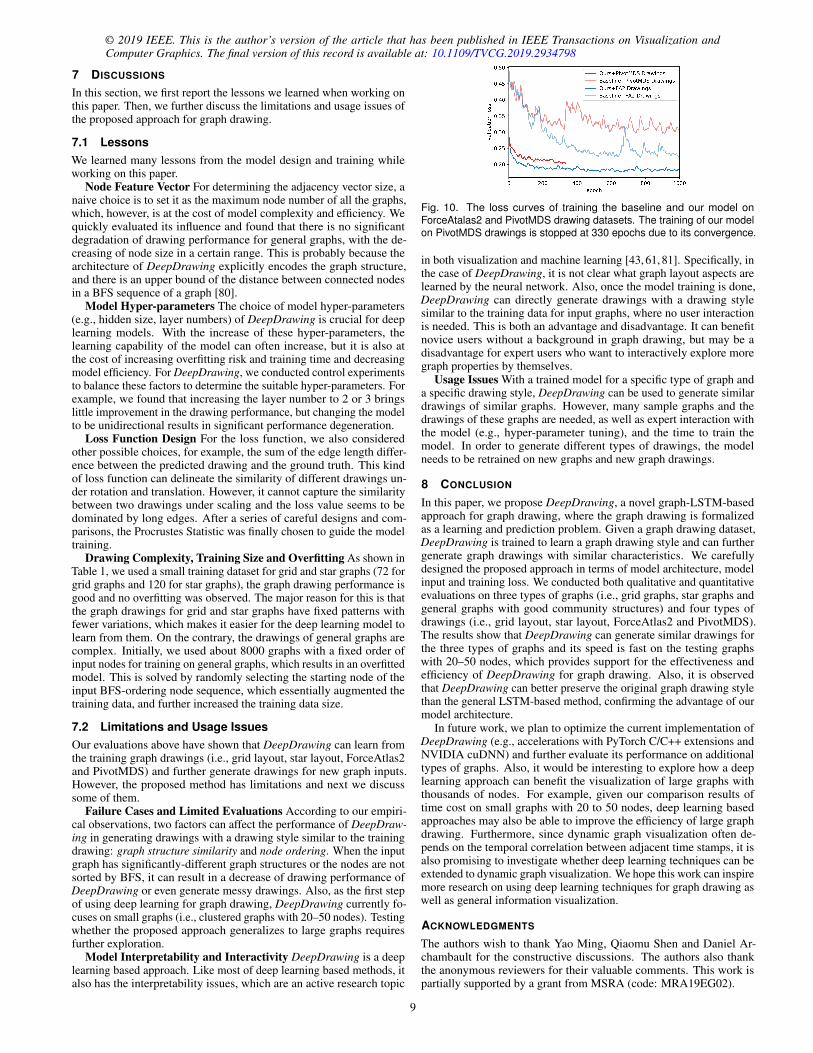
Fig. 8 shows the Procrustes Statistic-based similarity results, wherethe results on both ForceAtlas2 and PivotMDS drawing datasets arereported. Compared with the baseline approach, our approach achieves
Fig. 6. Qualitative evaluation on general graphs drawn by ForceAtlas2.For the same graph, the ground truth drawing, the drawing by the baselinemodel and the drawing by our approach are compared in each row.Different colors indicate different communities.
a significantly better (p < 0.05) Procrustes Statistic-based similarityon both ForceAtlas2 (0.19 vs. 0.23) and PivotMDS (0.21 vs. 0.34)drawing dataset. This also provides support for the effectiveness of ourapproach in learning different graph drawing styles.
6.4.2 Aesthetic Metrics-based SimilaritySimilar to the prior work [54], we also evaluate the effectiveness ofour approach by comparing the aesthetic metric similarity between thedrawings generated by our approach and the ground-truth drawings.The Root-Mean-Square Error (RMSE) is used to measure the aes-thetic similarity between them. Given n graphs, suppose the aestheticmetric values of the generated drawings are A = {a1, ..., an} and thoseof the ground-truth drawings are A = {a1, ...,an}, then the similarity isdefined as follows:
RMSE(A, A) =
√1n ∑
i(ai−ai)
2. (15)
Smaller RMSE scores correspond to higher similarity to the ground-truth graph drawing.
Various aesthetic metrics have been proposed to assess the aestheticquality of different graph drawings [19, 67, 77]. In this paper, threeaesthetic metrics are considered: edge crossings, node occlusions andcommunity overlapping, since they are widely-used aesthetic criteriafor evaluating how well the underlying graph topology has been realizedin a drawing [20, 67, 77]. Also, they have a normalized form and thuscan be used to compare graphs of different sizes.
Edge crossings (Aec): We use the edge crossing metric introducedby Purchase [67], which is defined as the ratio of the number of edgecrossings in a drawing over the upper bound of the possible crossings.
Node occlusions (Ano): We choose the global metric of node occlu-sion introduced by Dune et al. [19], i.e., the ratio of the union area ofall the node representations over their total area if drawn independently.
Community overlapping (Aco): We employ the global version ofthe autocorrelation-based metric introduced by Wang et al. [77]. For aspecific node, this metric considers both the Euclidean distance betweenthe node and its surrounding nodes and also whether they belong to the
7
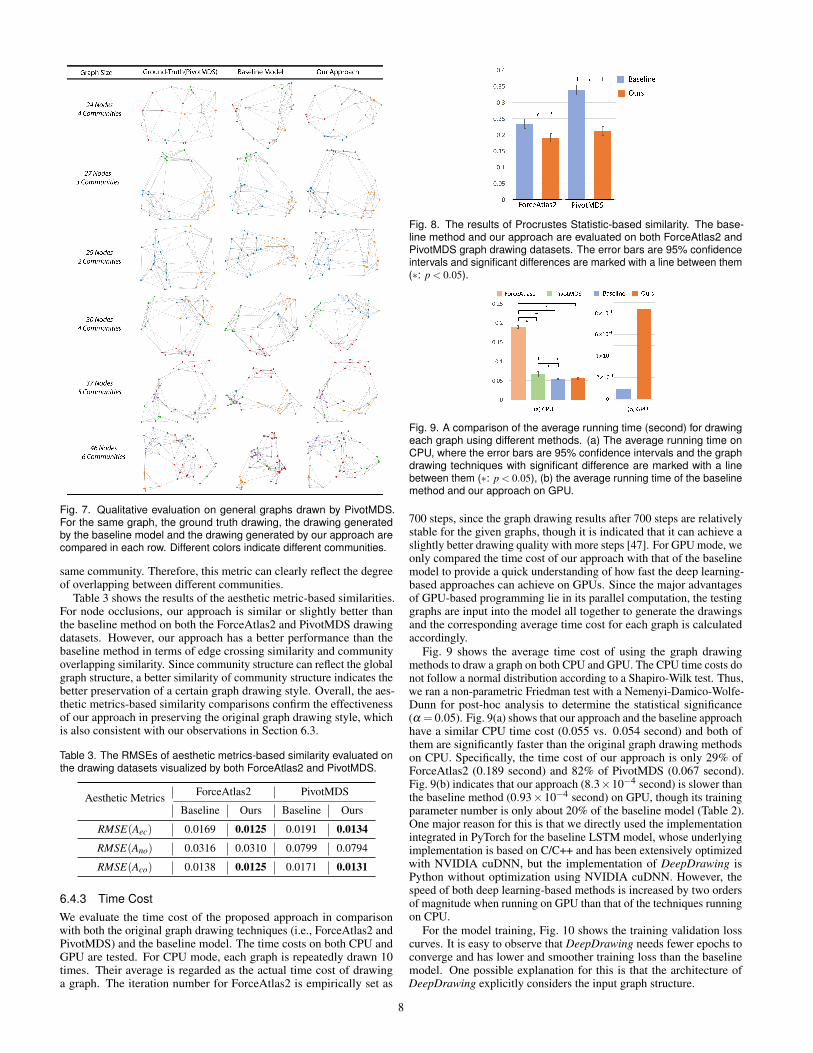
Fig. 7. Qualitative evaluation on general graphs drawn by PivotMDS.For the same graph, the ground truth drawing, the drawing generatedby the baseline model and the drawing generated by our approach arecompared in each row. Different colors indicate different communities.
same community. Therefore, this metric can clearly reflect the degreeof overlapping between different communities.
Table 3 shows the results of the aesthetic metric-based similarities.For node occlusions, our approach is similar or slightly better thanthe baseline method on both the ForceAtlas2 and PivotMDS drawingdatasets. However, our approach has a better performance than thebaseline method in terms of edge crossing similarity and communityoverlapping similarity. Since community structure can reflect the globalgraph structure, a better similarity of community structure indicates thebetter preservation of a certain graph drawing style. Overall, the aes-thetic metrics-based similarity comparisons confirm the effectivenessof our approach in preserving the original graph drawing style, whichis also consistent with our observations in Section 6.3.
Table 3. The RMSEs of aesthetic metrics-based similarity evaluated onthe drawing datasets visualized by both ForceAtlas2 and PivotMDS.
Aesthetic Metrics ForceAtlas2 PivotMDS
Baseline Ours Baseline Ours
RMSE(Aec) 0.0169 0.0125 0.0191 0.0134
RMSE(Ano) 0.0316 0.0310 0.0799 0.0794
RMSE(Aco) 0.0138 0.0125 0.0171 0.0131
6.4.3 Time CostWe evaluate the time cost of the proposed approach in comparisonwith both the original graph drawing techniques (i.e., ForceAtlas2 andPivotMDS) and the baseline model. The time costs on both CPU andGPU are tested. For CPU mode, each graph is repeatedly drawn 10times. Their average is regarded as the actual time cost of drawinga graph. The iteration number for ForceAtlas2 is empirically set as
Fig. 8. The results of Procrustes Statistic-based similarity. The base-line method and our approach are evaluated on both ForceAtlas2 andPivotMDS graph drawing datasets. The error bars are 95% confidenceintervals and significant differences are marked with a line between them(∗: p < 0.05).
Fig. 9. A comparison of the average running time (second) for drawingeach graph using different methods. (a) The average running time onCPU, where the error bars are 95% confidence intervals and the graphdrawing techniques with significant difference are marked with a linebetween them (∗: p < 0.05), (b) the average running time of the baselinemethod and our approach on GPU.
700 steps, since the graph drawing results after 700 steps are relativelystable for the given graphs, though it is indicated that it can achieve aslightly better drawing quality with more steps [47]. For GPU mode, weonly compared the time cost of our approach with that of the baselinemodel to provide a quick understanding of how fast the deep learning-based approaches can achieve on GPUs. Since the major advantagesof GPU-based programming lie in its parallel computation, the testinggraphs are input into the model all together to generate the drawingsand the corresponding average time cost for each graph is calculatedaccordingly.
Fig. 9 shows the average time cost of using the graph drawingmethods to draw a graph on both CPU and GPU. The CPU time costs donot follow a normal distribution according to a Shapiro-Wilk test. Thus,we ran a non-parametric Friedman test with a Nemenyi-Damico-Wolfe-Dunn for post-hoc analysis to determine the statistical significance(α = 0.05). Fig. 9(a) shows that our approach and the baseline approachhave a similar CPU time cost (0.055 vs. 0.054 second) and both ofthem are significantly faster than the original graph drawing methodson CPU. Specifically, the time cost of our approach is only 29% ofForceAtlas2 (0.189 second) and 82% of PivotMDS (0.067 second).Fig. 9(b) indicates that our approach (8.3×10⁻⁴ second) is slower thanthe baseline method (0.93×10⁻⁴ second) on GPU, though its trainingparameter number is only about 20% of the baseline model (Table 2).One major reason for this is that we directly used the implementationintegrated in PyTorch for the baseline LSTM model, whose underlyingimplementation is based on C/C++ and has been extensively optimizedwith NVIDIA cuDNN, but the implementation of DeepDrawing isPython without optimization using NVIDIA cuDNN. However, thespeed of both deep learning-based methods is increased by two ordersof magnitude when running on GPU than that of the techniques runningon CPU.
For the model training, Fig. 10 shows the training validation losscurves. It is easy to observe that DeepDrawing needs fewer epochs toconverge and has lower and smoother training loss than the baselinemodel. One possible explanation for this is that the architecture ofDeepDrawing explicitly considers the input graph structure.
8
© 2019 IEEE. This is the author’s version of the article that has been published in IEEE Transactions on Visualization andComputer Graphics. The final version of this record is available at: 10.1109/TVCG.2019.2934798
7 DISCUSSIONS
In this section, we first report the lessons we learned when working onthis paper. Then, we further discuss the limitations and usage issues ofthe proposed approach for graph drawing.
7.1 LessonsWe learned many lessons from the model design and training whileworking on this paper.
Node Feature Vector For determining the adjacency vector size, anaive choice is to set it as the maximum node number of all the graphs,which, however, is at the cost of model complexity and efficiency. Wequickly evaluated its influence and found that there is no significantdegradation of drawing performance for general graphs, with the de-creasing of node size in a certain range. This is probably because thearchitecture of DeepDrawing explicitly encodes the graph structure,and there is an upper bound of the distance between connected nodesin a BFS sequence of a graph [80].
Model Hyper-parameters The choice of model hyper-parameters(e.g., hidden size, layer numbers) of DeepDrawing is crucial for deeplearning models. With the increase of these hyper-parameters, thelearning capability of the model can often increase, but it is also atthe cost of increasing overfitting risk and training time and decreasingmodel efficiency. For DeepDrawing, we conducted control experimentsto balance these factors to determine the suitable hyper-parameters. Forexample, we found that increasing the layer number to 2 or 3 bringslittle improvement in the drawing performance, but changing the modelto be unidirectional results in significant performance degeneration.
Loss Function Design For the loss function, we also consideredother possible choices, for example, the sum of the edge length differ-ence between the predicted drawing and the ground truth. This kindof loss function can delineate the similarity of different drawings un-der rotation and translation. However, it cannot capture the similaritybetween two drawings under scaling and the loss value seems to bedominated by long edges. After a series of careful designs and com-parisons, the Procrustes Statistic was finally chosen to guide the modeltraining.
Drawing Complexity, Training Size and Overfitting As shown inTable 1, we used a small training dataset for grid and star graphs (72 forgrid graphs and 120 for star graphs), the graph drawing performance isgood and no overfitting was observed. The major reason for this is thatthe graph drawings for grid and star graphs have fixed patterns withfewer variations, which makes it easier for the deep learning model tolearn from them. On the contrary, the drawings of general graphs arecomplex. Initially, we used about 8000 graphs with a fixed order ofinput nodes for training on general graphs, which results in an overfittedmodel. This is solved by randomly selecting the starting node of theinput BFS-ordering node sequence, which essentially augmented thetraining data, and further increased the training data size.
7.2 Limitations and Usage IssuesOur evaluations above have shown that DeepDrawing can learn fromthe training graph drawings (i.e., grid layout, star layout, ForceAtlas2and PivotMDS) and further generate drawings for new graph inputs.However, the proposed method has limitations and next we discusssome of them.
Failure Cases and Limited Evaluations According to our empiri-cal observations, two factors can affect the performance of DeepDraw-ing in generating drawings with a drawing style similar to the trainingdrawing: graph structure similarity and node ordering. When the inputgraph has significantly-different graph structures or the nodes are notsorted by BFS, it can result in a decrease of drawing performance ofDeepDrawing or even generate messy drawings. Also, as the first stepof using deep learning for graph drawing, DeepDrawing currently fo-cuses on small graphs (i.e., clustered graphs with 20–50 nodes). Testingwhether the proposed approach generalizes to large graphs requiresfurther exploration.
Model Interpretability and Interactivity DeepDrawing is a deeplearning based approach. Like most of deep learning based methods, italso has the interpretability issues, which are an active research topic
Fig. 10. The loss curves of training the baseline and our model onForceAtalas2 and PivotMDS drawing datasets. The training of our modelon PivotMDS drawings is stopped at 330 epochs due to its convergence.
in both visualization and machine learning [43, 61, 81]. Specifically, inthe case of DeepDrawing, it is not clear what graph layout aspects arelearned by the neural network. Also, once the model training is done,DeepDrawing can directly generate drawings with a drawing stylesimilar to the training data for input graphs, where no user interactionis needed. This is both an advantage and disadvantage. It can benefitnovice users without a background in graph drawing, but may be adisadvantage for expert users who want to interactively explore moregraph properties by themselves.
Usage Issues With a trained model for a specific type of graph anda specific drawing style, DeepDrawing can be used to generate similardrawings of similar graphs. However, many sample graphs and thedrawings of these graphs are needed, as well as expert interaction withthe model (e.g., hyper-parameter tuning), and the time to train themodel. In order to generate different types of drawings, the modelneeds to be retrained on new graphs and new graph drawings.
8 CONCLUSION
In this paper, we propose DeepDrawing, a novel graph-LSTM-basedapproach for graph drawing, where the graph drawing is formalizedas a learning and prediction problem. Given a graph drawing dataset,DeepDrawing is trained to learn a graph drawing style and can furthergenerate graph drawings with similar characteristics. We carefullydesigned the proposed approach in terms of model architecture, modelinput and training loss. We conducted both qualitative and quantitativeevaluations on three types of graphs (i.e., grid graphs, star graphs andgeneral graphs with good community structures) and four types ofdrawings (i.e., grid layout, star layout, ForceAtlas2 and PivotMDS).The results show that DeepDrawing can generate similar drawings forthe three types of graphs and its speed is fast on the testing graphswith 20–50 nodes, which provides support for the effectiveness andefficiency of DeepDrawing for graph drawing. Also, it is observedthat DeepDrawing can better preserve the original graph drawing stylethan the general LSTM-based method, confirming the advantage of ourmodel architecture.
In future work, we plan to optimize the current implementation ofDeepDrawing (e.g., accelerations with PyTorch C/C++ extensions andNVIDIA cuDNN) and further evaluate its performance on additionaltypes of graphs. Also, it would be interesting to explore how a deeplearning approach can benefit the visualization of large graphs withthousands of nodes. For example, given our comparison results oftime cost on small graphs with 20 to 50 nodes, deep learning basedapproaches may also be able to improve the efficiency of large graphdrawing. Furthermore, since dynamic graph visualization often de-pends on the temporal correlation between adjacent time stamps, it isalso promising to investigate whether deep learning techniques can beextended to dynamic graph visualization. We hope this work can inspiremore research on using deep learning techniques for graph drawing aswell as general information visualization.
ACKNOWLEDGMENTS
The authors wish to thank Yao Ming, Qiaomu Shen and Daniel Ar-chambault for the constructive discussions. The authors also thankthe anonymous reviewers for their valuable comments. This work ispartially supported by a grant from MSRA (code: MRA19EG02).
9
REFERENCES
[1] J. Atwood and D. Towsley. Diffusion-convolutional neural networks. InProceedings of Advances in Neural Information Processing Systems, pp.1993–2001, 2016.
[2] B. Bach, A. Spritzer, E. Lutton, and J.-D. Fekete. Interactive random graphgeneration with evolutionary algorithms. In International Symposium onGraph Drawing, pp. 541–552. Springer, 2012.
[3] H. J. Barbosa and A. Barreto. An interactive genetic algorithm with co-evolution of weights for multiobjective problems. In Proceedings of the3rd Annual Conference on Genetic and Evolutionary Computation, pp.203–210. Morgan Kaufmann Publishers Inc., 2001.
[4] G. D. Battista, P. Eades, R. Tamassia, and I. G. Tollis. Graph drawing:algorithms for the visualization of graphs. Prentice Hall PTR, 1998.
[5] Y. Bengio, P. Simard, P. Frasconi, et al. Learning long-term dependencieswith gradient descent is difficult. IEEE Transactions on Neural Networks,5(2):157–166, 1994.
[6] T. Biedl, J. Marks, K. Ryall, and S. Whitesides. Graph multidrawing:Finding nice drawings without defining nice. In International Symposiumon Graph Drawing, pp. 347–355. Springer, 1998.
[7] E. Bonabeau. Graph multidimensional scaling with self-organizing maps.Information Sciences, 143(1-4):159–180, 2002.
[8] E. Bonabeau and F. Henaux. Self-organizing maps for drawing largegraphs. Information Processing Letters, 67(4):177–184, 1998.
[9] U. Brandes and C. Pich. Eigensolver methods for progressive multidi-mensional scaling of large data. In International Symposium on GraphDrawing, pp. 42–53. Springer, 2006.
[10] X. Bresson and T. Laurent. An experimental study of neural networks forvariable graphs. 2018.
[11] D. Britz, A. Goldie, M.-T. Luong, and Q. Le. Massive exploration of neuralmachine translation architectures. arXiv preprint arXiv:1703.03906, 2017.
[12] J. Bruna, W. Zaremba, A. Szlam, and Y. Lecun. Spectral networks andlocally connected networks on graphs. In Proceedings of InternationalConference on Learning Representations, 2014.
[13] A. Cimikowski and P. Shope. A neural-network algorithm for a graphlayout problem. IEEE Transactions on Neural Networks, 7(2):341–345,1996.
[14] T. F. Cox and M. A. Cox. Multidimensional scaling. Chapman andhall/CRC, 2000.
[15] M. Defferrard, X. Bresson, and P. Vandergheynst. Convolutional neuralnetworks on graphs with fast localized spectral filtering. In Proceedingsof Advances in Neural Information Processing Systems, pp. 3844–3852,2016.
[16] G. Di Battista, P. Eades, R. Tamassia, and I. G. Tollis. Algorithms fordrawing graphs: an annotated bibliography. Computational Geometry-Theory and Application, 4(5):235–282, 1994.
[17] R. dos Santos Vieira, H. A. D. do Nascimento, and W. B. da Silva. Theapplication of machine learning to problems in graph drawing a litera-ture review. In Proceedings of International Conference on Information,Process, and Knowledge Management, pp. 112–118, 2015.
[18] I. L. Dryden. Shape analysis. Wiley StatsRef: Statistics Reference Online,2014.
[19] C. Dunne, S. I. Ross, B. Shneiderman, and M. Martino. Readability metricfeedback for aiding node-link visualization designers. IBM Journal ofResearch and Development, 59(2/3):14–1, 2015.
[20] C. Dunne and B. Shneiderman. Improving graph drawing readability byincorporating readability metrics: A software tool for network analysts.University of Maryland, HCIL Tech Report HCIL-2009-13, 2009.
[21] D. K. Duvenaud, D. Maclaurin, J. Iparraguirre, R. Bombarell, T. Hirzel,A. Aspuru-Guzik, and R. P. Adams. Convolutional networks on graphsfor learning molecular fingerprints. In Proceedings of Advances in NeuralInformation Processing Systems, pp. 2224–2232, 2015.
[22] P. Eades. A heuristic for graph drawing. Congressus Numerantium,42:149–160, 1984.
[23] M. Espadoto, N. S. Hirata, and A. C. Telea. Deep learning multidimen-sional projections. arXiv preprint arXiv:1902.07958, 2019.
[24] A. Frick, A. Ludwig, and H. Mehldau. A fast adaptive layout algorithmfor undirected graphs (extended abstract and system demonstration). InInternational Symposium on Graph Drawing, pp. 388–403. Springer, 1994.
[25] T. M. Fruchterman and E. M. Reingold. Graph drawing by force-directedplacement. Software: Practice and experience, 21(11):1129–1164, 1991.
[26] P. Gajer, M. T. Goodrich, and S. G. Kobourov. A multi-dimensionalapproach to force-directed layouts of large graphs. In International Sym-posium on Graph Drawing, pp. 211–221. Springer, 2000.
[27] E. R. Gansner, Y. Koren, and S. North. Graph drawing by stress ma-jorization. In International Symposium on Graph Drawing, pp. 239–250.Springer, 2004.
[28] F. A. Gers, J. Schmidhuber, and F. A. Cummins. Learning to forget:Continual prediction with lstm. Neural Computation, 12:2451–2471,2000.
[29] M. Ghoniem, J.-D. Fekete, and P. Castagliola. A comparison of thereadability of graphs using node-link and matrix-based representations. InIEEE Symposium on Information Visualization, pp. 17–24, 2004.
[30] H. Gibson, J. Faith, and P. Vickers. A survey of two-dimensional graphlayout techniques for information visualisation. Information Visualization,12(3-4):324–357, 2013.
[31] C. Goodall. Procrustes methods in the statistical analysis of shape. Journalof the Royal Statistical Society: Series B (Methodological), 53(2):285–321,1991.
[32] I. Goodfellow, Y. Bengio, A. Courville, and Y. Bengio. Deep learning,vol. 1. MIT Press Cambridge, 2016.
[33] A. Grover and J. Leskovec. node2vec: Scalable feature learning fornetworks. In Proceedings of the 22nd ACM SIGKDD International Con-ference on Knowledge Discovery and Data Mining, pp. 855–864. ACM,2016.
[34] S. Hachul and M. Junger. Drawing large graphs with a potential-field-basedmultilevel algorithm. In International Symposium on Graph Drawing, pp.285–295. Springer, 2004.
[35] H. Haleem, Y. Wang, A. Puri, S. Wadhwa, and H. Qu. Evaluating thereadability of force directed graph layouts: A deep learning approach.arXiv preprint arXiv:1808.00703, 2018.
[36] W. Hamilton, Z. Ying, and J. Leskovec. Inductive representation learningon large graphs. In Proceedings of Advances in Neural InformationProcessing Systems, pp. 1024–1034, 2017.
[37] D. Harel and Y. Koren. A fast multi-scale method for drawing large graphs.In International Symposium on Graph Drawing, pp. 183–196. Springer,2000.
[38] D. Harel and Y. Koren. Graph drawing by high-dimensional embedding.In International Symposium on Graph Drawing, pp. 207–219. Springer,2002.
[39] M. Heimann and D. Koutra. On generalizing neural node embeddingmethods to multi-network problems. In KDD MLG Workshop, 2017.
[40] M. Henaff, J. Bruna, and Y. LeCun. Deep convolutional networks ongraph-structured data. arXiv preprint arXiv:1506.05163, 2015.
[41] I. Herman, G. Melancon, and M. S. Marshall. Graph visualization andnavigation in information visualization: A survey. IEEE Transactions onVisualization and Computer Graphics, 6(1):24–43, 2000.
[42] S. Hochreiter and J. Schmidhuber. Long short-term memory. NeuralComputation, 9(8):1735–1780, 1997.
[43] F. M. Hohman, M. Kahng, R. Pienta, and D. H. Chau. Visual analyticsin deep learning: An interrogative survey for the next frontiers. IEEETransactions on Visualization and Computer Graphics, 2018.
[44] Y. Hu. Efficient, high-quality force-directed graph drawing. MathematicaJournal, 10(1):37–71, 2005.
[45] Y. Hu, S. G. Kobourov, and S. Veeramoni. Embedding, clustering andcoloring for dynamic maps. In 2012 IEEE Pacific Visualization Symposium,pp. 33–40. IEEE, 2012.
[46] W. Huang, P. Eades, and S.-H. Hong. Measuring effectiveness of graphvisualizations: A cognitive load perspective. Information Visualization,8(3):139–152, 2009.
[47] M. Jacomy, T. Venturini, S. Heymann, and M. Bastian. Forceatlas2,a continuous graph layout algorithm for handy network visualizationdesigned for the gephi software. PloS one, 9(6):e98679, 2014.
[48] T. Kamada, S. Kawai, et al. An algorithm for drawing general undirectedgraphs. Information Processing Letters, 31(1):7–15, 1989.
[49] M. Kaufmann and D. Wagner. Drawing graphs: methods and models, vol.2025. Springer, 2003.
[50] D. P. Kingma and J. Ba. Adam: A method for stochastic optimization.arXiv preprint arXiv:1412.6980, 2014.
[51] T. N. Kipf and M. Welling. Semi-supervised classification with graphconvolutional networks. arXiv preprint arXiv:1609.02907, 2016.
[52] M. Klammler, T. Mchedlidze, and A. Pak. Aesthetic discrimination ofgraph layouts. In International Symposium on Graph Drawing and Net-work Visualization, pp. 169–184. Springer, 2018.
[53] J. F. Kruiger, P. E. Rauber, R. M. Martins, A. Kerren, S. Kobourov, andA. C. Telea. Graph layouts by t-sne. In Computer Graphics Forum, vol. 36,pp. 283–294. Wiley Online Library, 2017.
10
© 2019 IEEE. This is the author’s version of the article that has been published in IEEE Transactions on Visualization andComputer Graphics. The final version of this record is available at: 10.1109/TVCG.2019.2934798
[54] O.-H. Kwon, T. Crnovrsanin, and K.-L. Ma. What would a graph look likein this layout? a machine learning approach to large graph visualization.IEEE Transactions on Visualization and Computer Graphics, 24(1):478–488, 2018.
[55] A. Lancichinetti, S. Fortunato, and F. Radicchi. Benchmark graphs fortesting community detection algorithms. Physical Review. E, Statistical,Nonlinear, and Soft Matter Physics, 78:046110, 11 2008.
[56] Y. LeCun, Y. Bengio, and G. Hinton. Deep learning. Nature,521(7553):436, 2015.
[57] Y. Li, D. Tarlow, M. Brockschmidt, and R. Zemel. Gated graph sequenceneural networks. arXiv preprint arXiv:1511.05493, 2015.
[58] T. Masui. Evolutionary learning of graph layout constraints from examples.In Proceedings of the 7th annual ACM Symposium on User InterfaceSoftware and Technology, pp. 103–108. ACM, 1994.
[59] B. Meyer. Self-organizing graphsa neural network perspective of graphlayout. In International Symposium on Graph Drawing, pp. 246–262.Springer, 1998.
[60] F. Monti, D. Boscaini, J. Masci, E. Rodola, J. Svoboda, and M. M. Bron-stein. Geometric deep learning on graphs and manifolds using mixturemodel cnns. In IEEE Conference on Computer Vision and Pattern Recog-nition, pp. 5425–5434. IEEE, 2017.
[61] W. J. Murdoch, C. Singh, K. Kumbier, R. Abbasi-Asl, and B. Yu. Inter-pretable machine learning: definitions, methods, and applications. arXivpreprint arXiv:1901.04592, 2019.
[62] M. Niepert, M. Ahmed, and K. Kutzkov. Learning convolutional neuralnetworks for graphs. In Proceedings of International Conference onMachine Learning, pp. 2014–2023, 2016.
[63] A. Noack. Energy models for graph clustering. J. Graph Algorithms Appl.,11(2):453–480, 2007.
[64] R. Pascanu, T. Mikolov, and Y. Bengio. On the difficulty of trainingrecurrent neural networks. In Proceedings of International Conference onMachine Learning, pp. 1310–1318, 2013.
[65] N. Peng, H. Poon, C. Quirk, K. Toutanova, and W.-t. Yih. Cross-sentence n-ary relation extraction with graph lstms. arXiv preprint arXiv:1708.03743,2017.
[66] B. Perozzi, R. Al-Rfou, and S. Skiena. Deepwalk: Online learning of socialrepresentations. In Proceedings of the 20th ACM SIGKDD InternationalConference on Knowledge Discovery and Data Mining, pp. 701–710.ACM, 2014.
[67] H. C. Purchase. Metrics for graph drawing aesthetics. Journal of VisualLanguages & Computing, 13(5):501–516, 2002.
[68] A. Rosete-Suarez, M. Sebag, and A. Ochoa-Rodriguez. A study of evolu-tionary graph drawing. 1999.
[69] M. Sponemann, B. Duderstadt, and R. von Hanxleden. Evolutionary meta
layout of graphs. In International Conference on Theory and Applicationof Diagrams, pp. 16–30. Springer, 2014.
[70] K. S. Tai, R. Socher, and C. D. Manning. Improved semantic represen-tations from tree-structured long short-term memory networks. In Pro-ceedings of the 7th International Joint Conference on Natural LanguageProcessing, vol. 1, pp. 1556–1566, 2015.
[71] R. Tamassia. Handbook of graph drawing and visualization. Chapmanand Hall/CRC, 2013.
[72] W. T. Tutte. Convex representations of graphs. In Proceedings of theLondon Mathematical Society, vol. 3, pp. 304–320. Wiley Online Library,1960.
[73] W. T. Tutte. How to draw a graph. Proceedings of the London Mathemati-cal Society, 3(1):743–767, 1963.
[74] T. Von Landesberger, A. Kuijper, T. Schreck, J. Kohlhammer, J. J. vanWijk, J.-D. Fekete, and D. W. Fellner. Visual analysis of large graphs:state-of-the-art and future research challenges. Computer Graphics Forum,30(6):1719–1749, 2011.
[75] D. Wang, P. Cui, and W. Zhu. Structural deep network embedding. InProceedings of the 22nd ACM SIGKDD International Conference onKnowledge Discovery and Data Mining, pp. 1225–1234. ACM, 2016.
[76] R.-L. Wang and Okazaki. Artificial neural network for minimum crossingnumber problem. In Proceedings of 2005 International Conference onMachine Learning and Cybernetics., vol. 7, pp. 4201–4204. IEEE, 2005.
[77] Y. Wang, Q. Shen, D. Archambault, Z. Zhou, M. Zhu, S. Yang, andH. Qu. Ambiguityvis: Visualization of ambiguity in graph layouts. IEEETransactions on Visualization and Computer Graphics, 22(1):359–368,2016.
[78] Y. Wang, Y. Wang, Y. Sun, L. Zhu, K. Lu, C.-W. Fu, M. Sedlmair,O. Deussen, and B. Chen. Revisiting stress majorization as a unifiedframework for interactive constrained graph visualization. IEEE transac-tions on visualization and computer graphics, 24(1):489–499, 2017.
[79] V. Yoghourdjian, D. Archambault, S. Diehl, T. Dwyer, K. Klein, H. C.Purchase, and H.-Y. Wu. Exploring the limits of complexity: A survey ofempirical studies on graph visualisation. Visual Informatics, 2(4):264–282,2018.
[80] J. You, R. Ying, X. Ren, W. L. Hamilton, and J. Leskovec. Graphrnn: adeep generative model for graphs. In Proceedings of the 35th InternationalConference on Machine Learning, 2018.
[81] Q. Zhang and S. Zhu. Visual interpretability for deep learning: a survey.Frontiers of Information Technology & Electronic Engineering, 19(1):27–39, 2018.
[82] J. Zhou, G. Cui, Z. Zhang, C. Yang, Z. Liu, and M. Sun. Graph neu-ral networks: A review of methods and applications. arXiv preprintarXiv:1812.08434, 2018.
11