Embed Size (px)
Citation preview
2 201114 information technologiesand control
Key Words: Graph drawing; software evolution visualization; graph layout;measures.
Abstract. As a widespread approach for representing data, graphdrawings are used for displaying both software systems and theirevolution. Every version in the process of software evolution is rep-resented by a different graph representation. Consequently, a properlayout algorithm is needed in order to retain the connection betweendifferent drawings and ease their parallel observation. The selectedalgorithm should be able to provide drawing of graph sequenceswhich is stable and mental map preserving. This paper introducesvisual and numerical approaches for assessment, observation andanalysis of software systems evolution. Certain set of measures isselected and used for this task. For visual and numerical assessmentof software system graph layouts a software tool is developed andused for experimental observation and evaluation of the measures bytheir application to the graph drawings of certain software projectsrevisions.
1. Introduction
The quality appraisal of graph drawing is a key problem,concerning the understandability of the represented model. Mostof the graph representations are used to display the sequenceof model states. Therefore, the mental connection between thesestates should be as clear as possible. To assess the under-standability, clearness and mental map preservation of thissequence of graph drawings, an appropriate set of measures,concerning these qualities, should be defined and used.
This paper focuses on observation of the graph drawings,which represent software evolution. Measures, used to form thedrawing assessment, are also introduced. Several definitions ofsoftware evolution are suggested in [18], but in the context of thepaper the most appropriate is Lehman and Ramil’s definition:“All programming activity that is intended to generate a newsoftware version from an earlier operational version”. Accordingto the source code versions, the corresponding graph is fre-quently changed. In this context the quality and stability of thelayout is vital for the system state perception.
Some of the graph representations have various limita-tions, concerning the layout quality and stability over a numerousversions of the drawing. The appropriate representation of thesoftware evolution is another general problem.
During the research for existing problems in the graphdrawing algorithms the following software tools, having this kindof problems could be presented.
In order to represent the Kiviat graph of module couplingdependencies clearly, RelVis [16] attempts to prevent layoutproblems by using standard graph drawing algorithms, such as
hierarchical or spring layout. Unfortunately, the graph layout getscomplex when visualizing large number of source code entitiesand needs post processing steps or pre-filtering of relations. Thequality of the layout varies in the different graph drawings de-pending on various subjective factors. This fact indicates theneed of a formal assessment of the quality - exact measurevalues for each pair of drawings.
The Building Block Communications System [17] intro-duces other types of graphs, representing the Distributed FeatureComposition model in an understandable way according to strictlydefined rules. The layout of the graphs aims at symmetry, mentalmap preservation and effectiveness of the drawing. This effectis achieved by using various types of virtual physical modelalgorithms for graph drawing. Nevertheless, a formal assess-ment of the graph drawing quality is not provided.
The Evolution Storyboard [1] uses an energy-based layoutalgorithm to provide dynamical views of the software’s evolutionstructure. In order to help the user to understand the systemstructure better, an animation shows the movement of nodesbetween consecutive time stamps. This feature assumes thatevery state of the represented graph uses a mental map preserv-ing layout. Such layout could be easily chosen according to thevalues of properly selected measure.
GraphAEL[5] creates, represents and animates differentstates of several graph types. It uses a force-directed graphdrawing algorithm to achieve mental map preserving and aes-thetically pleasing layouts for series of graph drawings. Theauthors discuss several improvements of existing force-directedgraph drawing algorithm, but the progress of the improvementprocess is not appraised adequately by a certain graph drawingmeasure values.
The observation of the software evolution requires appro-priate representation of the data. Gonzalez, Theron, Telea andGarcia [8] propose a multilevel timeline view, supporting a setof tasks, useful for the project managers. In order to inspect thechanges made along the revisions, the authors represent a setof source code metrics in charts.
The representation of the software system and its evolu-tion is often made to provide additional information about systemartifacts as well as a source code metrics, added or modifiedelements and the relations between them. In this context, thepaper considers graph as the most appropriate representationof a software system. Each graph drawing algorithm is aimedat providing an easy to use, good and mental map preservinglayout of the displayed data. To clearly define such aesthetic andlogical criteria, formal approaches for the graph layout assess-ment are put in practice.
The purpose of the paper is to evaluate software evolution
Quality Assessment of Graph DrawingSequences Representing Software SystemsEvolution
D. Ivanov, H. Haralambiev, M. Lazarova, S. Boychev
2 2011 15information technologiesand control
graph representations. To appraise the quality of a given graphlayout, a certain set of measures is defined and used for soft-ware graph layout assessment. The selected measures areapplicable for a pair of graph drawings. Experimental evaluationof the measures is made by their application to the graphlayouts, which represent the software evolution of given softwareprojects.
2. Graph Drawing Quality Measures
A set of graph layout measures is introduced in[3,13 and 2]. Four of these measures are selected for thepurposes of numerical assessment of graph drawing sequencesof software versions. The selection criterion for three of themeasures is based on the empirical research, made in [2]. Theexpectance is only the ε-clustering which is considered appro-priate measure for software graph drawings, despite the conclu-sions, given in [2]. All the measures selected are focused onmeasuring the quality and the stability of a given graph layout.
A graph G refers to a collection of vertices (or ‘nodes’) anda collection of edges that connect pairs of vertices. Following theterminology in [3], let define D and D' two drawings of the samegraph G. Each object of G can be associated with two sets ofcoordinates, one describing the position in D and the other theposition in D'. P denotes the set of pairs (pi, pi') where pi andpi' represent the location of the i-th in D and D', respectively.Let d(p, q) be the Euclidean distance between points p and qin D as well as in D'.
2.1. Composite Distance to Neighbor
The composite distance to a neighbor measure calculates
the overall impact of the weighted version of the nearest neigh-bor within measure for all the nodes of the graph.
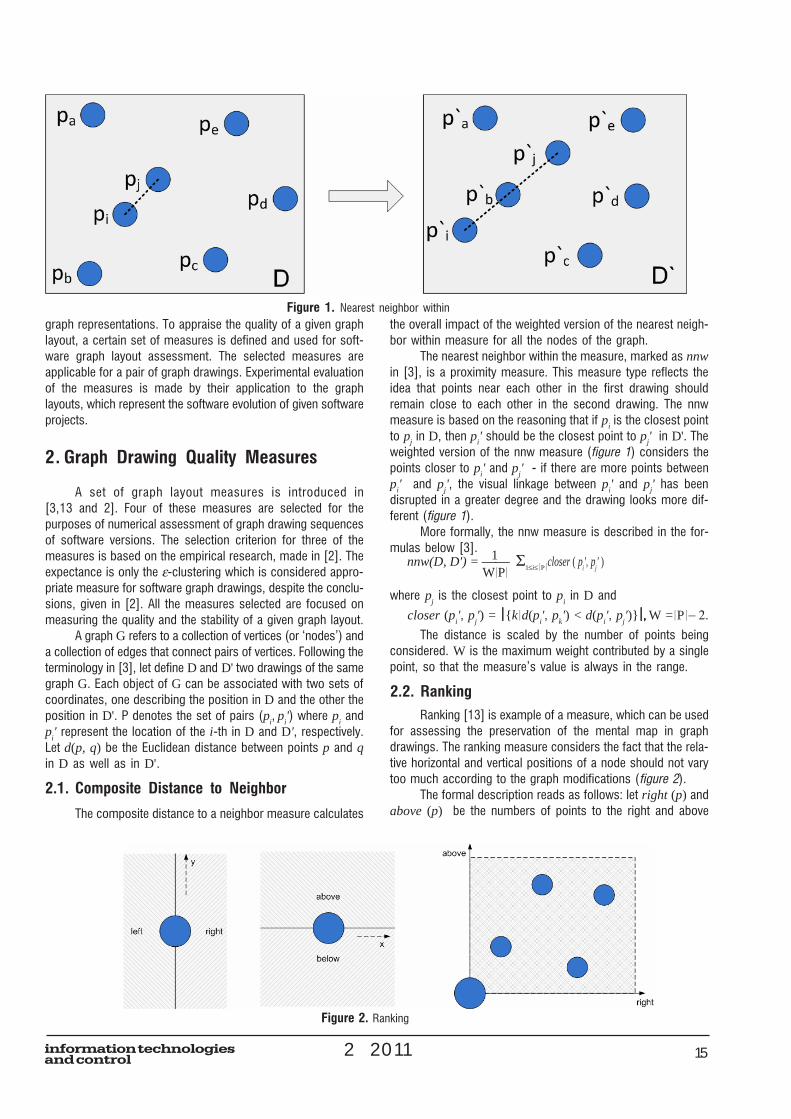
The nearest neighbor within the measure, marked as nnwin [3], is a proximity measure. This measure type reflects theidea that points near each other in the first drawing shouldremain close to each other in the second drawing. The nnwmeasure is based on the reasoning that if pi is the closest pointto pj in D, then pi' should be the closest point to pj' in D'. Theweighted version of the nnw measure (figure 1) considers thepoints closer to pi' and pj' - if there are more points betweenpi' and pj', the visual linkage between pi' and pj' has beendisrupted in a greater degree and the drawing looks more dif-ferent (figure 1).
More formally, the nnw measure is described in the for-mulas below [3].
where pj is the closest point to pi in D and
closer (pi', pj') = ⏐⏐⏐⏐⏐{k⏐d(pi', pk') < d(pi', pj')}⏐, ⏐, ⏐, ⏐, ⏐, W =⏐P⏐− 2.
The distance is scaled by the number of points beingconsidered. W is the maximum weight contributed by a singlepoint, so that the measure’s value is always in the range.
2.2. Ranking
Ranking [13] is example of a measure, which can be usedfor assessing the preservation of the mental map in graphdrawings. The ranking measure considers the fact that the rela-tive horizontal and vertical positions of a node should not varytoo much according to the graph modifications (figure 2).
The formal description reads as follows: let right (p) andabove (p) be the numbers of points to the right and above
Figure 1. Nearest neighbor within
Figure 2. Ranking
nnw(D, D') = ⎯⎯ Σ1≤i≤⏐P⏐closer ( pi', pj' )1
W⏐P⏐
2 201116 information technologiesand control
of p, respectively (figure 2). λ is the normalizing factor. Then
where λ = 1.5 (⏐P⏐ − 1). The constant 1.5 is based on theexperiments, reported in [3].
The value of the measure is inversely proportional to thepreservation of the mental map, e.g. the lesser the ranking is -the more the mental map is preserved.
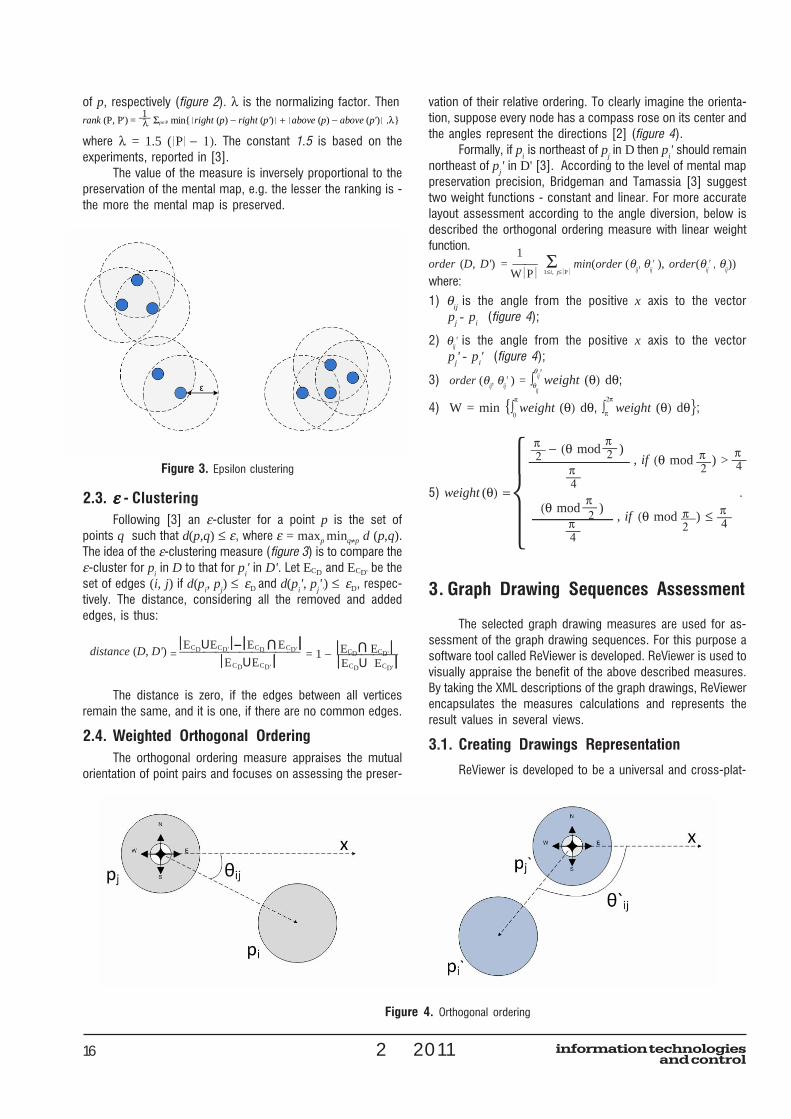
2.3. εεεεε - ClusteringFollowing [3] an ε-cluster for a point p is the set of
points q such that d(p,q) ≤ ε, where ε = maxp minq≠p d (p,q).The idea of the ε-clustering measure (figure 3) is to compare theε-cluster for pi in D to that for pi' in D'. Let ECD and ECD' be theset of edges (i, j) if d(pi, pj) ≤ εD and d(pi', pj'') ≤ εD, respec-tively. The distance, considering all the removed and addededges, is thus:
The distance is zero, if the edges between all verticesremain the same, and it is one, if there are no common edges.
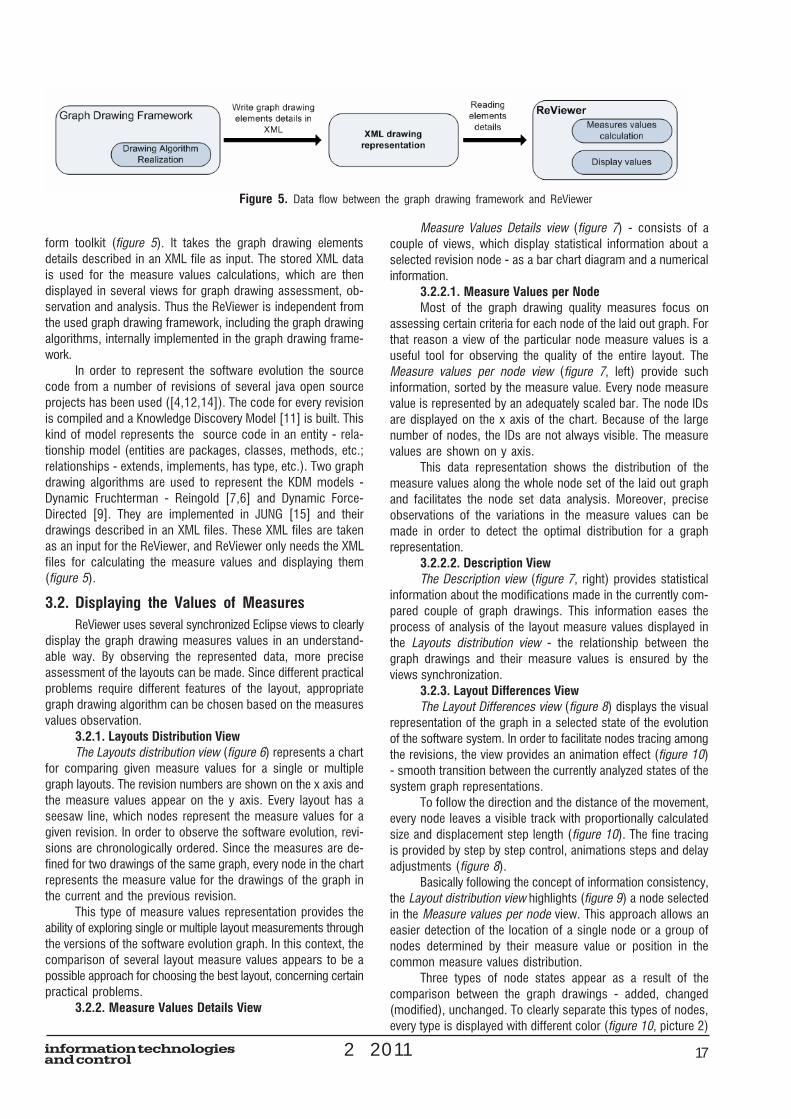
2.4. Weighted Orthogonal OrderingThe orthogonal ordering measure appraises the mutual
orientation of point pairs and focuses on assessing the preser-
vation of their relative ordering. To clearly imagine the orienta-tion, suppose every node has a compass rose on its center andthe angles represent the directions [2] (figure 4).
Formally, if pi is northeast of pj in D then pi' should remainnortheast of pj' in D' [3]. According to the level of mental mappreservation precision, Bridgeman and Tamassia [3] suggesttwo weight functions - constant and linear. For more accuratelayout assessment according to the angle diversion, below isdescribed the orthogonal ordering measure with linear weightfunction.
where:
1) θij is the angle from the positive x axis to the vector pj - pi (figure 4);
2) θij' is the angle from the positive x axis to the vector pj' - pi' (figure 4);
3) order (θij, θij' ) = ∫ weight (θ) dθ;
4) W = min {∫ weight (θ) dθ, ∫ weight (θ) dθ};
5) weight (θ) = .
3. Graph Drawing Sequences Assessment
The selected graph drawing measures are used for as-sessment of the graph drawing sequences. For this purpose asoftware tool called ReViewer is developed. ReViewer is used tovisually appraise the benefit of the above described measures.By taking the XML descriptions of the graph drawings, ReViewerencapsulates the measures calculations and represents theresult values in several views.
3.1. Creating Drawings Representation
ReViewer is developed to be a universal and cross-plat-
Figure 3. Epsilon clustering
Figure 4. Orthogonal ordering
rank (P, P') = Σp∈P min{⏐right (p) − right (p')⏐ + ⏐above (p) − above (p')⏐ ,λ}
distance (D, D') = ⎯⎯⎯⎯⎯⎯⎯⎯⎯⎯ = 1 − ⎯⎯⎯⎯⎯⏐⏐⏐⏐⏐ECDUECD'⏐⏐⏐⏐⏐−−−−−⏐⏐⏐⏐⏐ECD ECD'⏐⏐⏐⏐⏐
UU
⏐⏐⏐⏐⏐ECDUECD'⏐⏐⏐⏐⏐ ⏐⏐⏐⏐⏐ECDU ECD'⏐⏐⏐⏐⏐⏐⏐⏐⏐⏐ECD ECD'⏐⏐⏐⏐⏐
1λ⎯
order (D, D') = ⎯⎯ Σ min(order (θij, θij' ), order(θij' , θij))1
W⏐P⏐ 1≤i, j≤⏐P⏐
θij
θij'
0
π
π
2π
− (θ mod )π⎯2π⎯2 , if⎯⎯⎯⎯⎯⎯⎯⎯⎯⎯⎯⎯⎯⎯⎯⎯⎯⎯⎯⎯⎯⎯⎯⎯⎯⎯⎯⎯⎯⎯⎯⎯⎯⎯⎯⎯⎯⎯⎯⎯⎯⎯⎯⎯⎯⎯⎯⎯⎯⎯
π⎯4
(θ mod ) >π⎯2π⎯4
(θ mod )π⎯2 , if⎯⎯⎯⎯⎯⎯⎯⎯⎯⎯⎯⎯⎯⎯⎯⎯⎯⎯⎯⎯⎯⎯⎯⎯⎯⎯⎯⎯⎯⎯⎯⎯⎯⎯⎯⎯⎯⎯⎯⎯ (θ mod ) ≤π⎯
2π⎯4
π⎯4
⎧⎨⎩
2 2011 17information technologiesand control
form toolkit (figure 5). It takes the graph drawing elementsdetails described in an XML file as input. The stored XML datais used for the measure values calculations, which are thendisplayed in several views for graph drawing assessment, ob-servation and analysis. Thus the ReViewer is independent fromthe used graph drawing framework, including the graph drawingalgorithms, internally implemented in the graph drawing frame-work.
In order to represent the software evolution the sourcecode from a number of revisions of several java open sourceprojects has been used ([4,12,14]). The code for every revisionis compiled and a Knowledge Discovery Model [11] is built. Thiskind of model represents the source code in an entity - rela-tionship model (entities are packages, classes, methods, etc.;relationships - extends, implements, has type, etc.). Two graphdrawing algorithms are used to represent the KDM models -Dynamic Fruchterman - Reingold [7,6] and Dynamic Force-Directed [9]. They are implemented in JUNG [15] and theirdrawings described in an XML files. These XML files are takenas an input for the ReViewer, and ReViewer only needs the XMLfiles for calculating the measure values and displaying them(figure 5).
3.2. Displaying the Values of MeasuresReViewer uses several synchronized Eclipse views to clearly
display the graph drawing measures values in an understand-able way. By observing the represented data, more preciseassessment of the layouts can be made. Since different practicalproblems require different features of the layout, appropriategraph drawing algorithm can be chosen based on the measuresvalues observation.
3.2.1. Layouts Distribution ViewThe Layouts distribution view (figure 6) represents a chart
for comparing given measure values for a single or multiplegraph layouts. The revision numbers are shown on the x axis andthe measure values appear on the y axis. Every layout has aseesaw line, which nodes represent the measure values for agiven revision. In order to observe the software evolution, revi-sions are chronologically ordered. Since the measures are de-fined for two drawings of the same graph, every node in the chartrepresents the measure value for the drawings of the graph inthe current and the previous revision.
This type of measure values representation provides theability of exploring single or multiple layout measurements throughthe versions of the software evolution graph. In this context, thecomparison of several layout measure values appears to be apossible approach for choosing the best layout, concerning certainpractical problems.
3.2.2. Measure Values Details View
Measure Values Details view (figure 7) - consists of acouple of views, which display statistical information about aselected revision node - as a bar chart diagram and a numericalinformation.
3.2.2.1. Measure Values per NodeMost of the graph drawing quality measures focus on
assessing certain criteria for each node of the laid out graph. Forthat reason a view of the particular node measure values is auseful tool for observing the quality of the entire layout. TheMeasure values per node view (figure 7, left) provide suchinformation, sorted by the measure value. Every node measurevalue is represented by an adequately scaled bar. The node IDsare displayed on the x axis of the chart. Because of the largenumber of nodes, the IDs are not always visible. The measurevalues are shown on y axis.
This data representation shows the distribution of themeasure values along the whole node set of the laid out graphand facilitates the node set data analysis. Moreover, preciseobservations of the variations in the measure values can bemade in order to detect the optimal distribution for a graphrepresentation.
3.2.2.2. Description ViewThe Description view (figure 7, right) provides statistical
information about the modifications made in the currently com-pared couple of graph drawings. This information eases theprocess of analysis of the layout measure values displayed inthe Layouts distribution view - the relationship between thegraph drawings and their measure values is ensured by theviews synchronization.
3.2.3. Layout Differences ViewThe Layout Differences view (figure 8) displays the visual
representation of the graph in a selected state of the evolutionof the software system. In order to facilitate nodes tracing amongthe revisions, the view provides an animation effect (figure 10)- smooth transition between the currently analyzed states of thesystem graph representations.
To follow the direction and the distance of the movement,every node leaves a visible track with proportionally calculatedsize and displacement step length (figure 10). The fine tracingis provided by step by step control, animations steps and delayadjustments (figure 8).
Basically following the concept of information consistency,the Layout distribution view highlights (figure 9) a node selectedin the Measure values per node view. This approach allows aneasier detection of the location of a single node or a group ofnodes determined by their measure value or position in thecommon measure values distribution.
Three types of node states appear as a result of thecomparison between the graph drawings - added, changed(modified), unchanged. To clearly separate this types of nodes,every type is displayed with different color (figure 10, picture 2)
Figure 5. Data flow between the graph drawing framework and ReViewer

2 201118 information technologiesand control
Figure 6. Layouts distribution view
Figure 7. Measure values per node view
Figure 8. Layout Differences view

2 2011 19information technologiesand control
Figure 9. Selection of node in a Layout Differences view
Figure 11. Composite Distance to Neighbor measure values in 54 revisions of JMemorize
Figure 10. (1) Animation effect on a complete layout; (2) detailed view of the animation effect

2 201120 information technologiesand control
Figure 12. JMemorize, revisions [1106, 1107], Dynamic Force Directed Layout
added nodes are red , changed (modified) nodes are blueand the unchanged nodes are shown in cyan color.
4. Analysis of the Graph DrawingMeasures
To unify the evaluation analysis of the introduced measures, all the examples in the paper use two dynamic graphdrawing algorithms Dynamic Fruchterman Reingold [7,6]and Dynamic ForceDirected [9].
To facilitate the analysis explanations the following termis defined:
• Translation segment the segment between the centerof the node in the first drawing and its center in the seconddrawing (figure 12, figure 14, figure 16, figure 18 , figure 20,figure 22, figure 24).
The source code of open source projects ([4,12,14]) isused to analyze and prove the correctness of the complicatedmeasure definitions and also for observation of the measurevalues in software evolution graphs. Some of the revisions arenot compilable and therefore has no graph representation. Theexample illustrations display the translation between two drawings of the same graph in a pair of revisions, which are referredas [start_revision_number, end_revision_number]. Such pairof drawings is represented by an end_revision_number in thelayout distribution chart.
4.1. Composite Distance to Neighbor AnalysisThe measurements of the Composite Distance to Neigh-
bor measure are given in figure 11 for 54 revisions of the opensource learning tool jMemorize [4].
In order to prove the correctness of the measure definition, the revisions with the highest difference in the measurevalues are examined (figure 11, revisions [1106, 1107], difference = 28,495). The measure indicates in what degree pointspositioned near each other in the first drawing remain close toeach other in the second drawing. Therefore the most appropriate and comprehensible way to assess the measure definition correctness is to draw all the representation of the trans
lation segments of the graph nodes and analyze their relativepositions (figure 12, figure 14).
Almost all of the translation segments in figure 12 arecollinear and have similar lengths, which indicates the relativenode position preservation. The lack of translation segmentsintersection shows that there are also no additional points inbetween. Therefore the measure values are valid, according tothe measure definition. The Measure values per node view forthe dynamic force directed layout (figure 13) shows a bordercase distribution, only several nodes with moderate measurevalues.
The drawing in figure 14 is completely different mostof the translation segments intersect and their lengths highlyvary. The measure values per node for the dynamic Fruchterman Reingold layout (figure 13) are uniformly distributed with extremely high values (compared with the values of the force directed layout), which is a precondition for loss of the relativenode position and mental map destruction.
The results from the analysis of JMemorize made in theReViewer show that the dynamic forcedirected layout preservesthe relative node position better than the dynamic Fruchterman Reingold algorithm. This makes it appropriate for JMemorizegraph visualizations requiring mental map preservation.
4.2. Ranking AnalysisThe measurements presented in figure 15 show the rank
ing measure values for 45 revisions of the open source VisualDiff and Merge Tool JMeld [12]. To clearly point the drawingcriteria differences, which the measure values address, therevision node with the highest alteration (93,867) is taken (revisions [534, 535]). The used approach for proving the measure definition is visualization of the translation segments.
Observing the dynamic Fruchterman Reingold graphdrawing (figure 16) transition between 534 and 535 revisionsthe following conclusions are made most of the nodes aremoved in variety of distances in all possible directions. Thisfact reflects the number of the nodes, situated right and above the most significant aesthetic criteria, measured by the Ranking measure.

2 2011 21information technologiesand control
Figure 14. JMemorize, revisions [1106, 1107], Dynamic Fruchterman Reingold Layout
Figure 13. Measure values per node between revision [1106, 1107] revisions of JMemorize
Figure 15. Ranking measure values in 45 revisions of JMeld

2 201122 information technologiesand control
Figure 16. JMeld, revisions [534, 535], Dynamic Fruchterman Reingold layout
Figure 17. Ranking measure values per node between [534, 535] revisions of JMeld
Figure 18. JMeld, revisions [534, 535], Dynamic Force Directed layout

2 2011 23information technologiesand control
Figure 19. Epsilon clustering measure values in 45 revisions of JavaGit
Figure 20. JavaGit, revisions [702, 703], Dynamic Fruchterman Reingold layout
Figure 21. Epsilon clustering measure values per node between [702, 703] revisions of JavaGit

2 201124 information technologiesand control
Figure 22. JavaGit, revisions [702, 703], Dynamic Force Directed layout
Figure 23. Weighted orthogonal ordering measure values in 45 revisions of JMeld
Figure 24. Measurements of orthogonal ordering direction angles, JMeld, revisions [534, 535], Dynamic Fruchterman Reingold layout

2 2011 25information technologiesand control
In the dynamic force directed layout between revisions534 and 535 (figure 18) there are significantly less nodes,translated to large distance. Respectively, they hold their rightand above situation towards their neighbors, which is reflectedby the values of the measure.
Another aspect for graph layouts quality comparison arethe values, represented in the Measure values per node view(figure 17). The measure values determine several equally distributed intervals, but the general value range is significantlydifferent up to 70 for the dynamic force directed layout andup to 1200 for the dynamic Fruchterman Reingold layout.These values indicate the destruction of the mental map in thedrawing, generated by the dynamic Fruchterman Reingolddrawing algorithm.
By examining the measure values in the Layouts distribu-tion view (figure 15) there is a considerable difference in the values of the ranking measure for the two drawing algorithms. Moreover, the values for the dynamic Fruchterman Reingold algorithm increase in the process of software evolution, while thedynamic forcedirected values vary close to smaller constant value.
Based on the above observations it is clear that the dynamic forcedirected graph drawing algorithm is a better choicefor the JMeld project if its graph drawing representation requiresa mental map preserving layout.
4.3. εεεεε -Clustering AnalysisThe εclustering measure values for the java access API
for Git repositories JavaGit [14] are represented in figure 19. Inorder to facilitate the εclusters identification, their borders andcenters in the example illustrations are visualized with dashedgreen circle (representing the clusters for the first graph drawing) and a magenta solid circle (representing the clusters for thesecond graph drawing). The translation segments represent nodemovements between the graph drawings.
The revision node for revisions [702, 703] is taken for thedemonstration of the εclustering definition as a representativeof the revision nodes with the highest value alteration (0.543).
The higher epsilon value (0.549) in revision node [702,703] is due to the clusters disintegration between the drawings,generated with the dynamic Fruchterman Reingold graph drawing algorithm. The node with the highest measure value (0.946)is easily identified by the Measure values per node view and itsclusters are drawn in figure 20. The illustration shows that moreof the most nodes, contained in the green clusters, are notcontained in the magenta clusters and also new nodes areadded in the magenta cluster. These facts are respectively reflected in the metric measure. By observing the picture (figure20) and the measure values per node (figure 21) for the dynamic Fruchterman Reingold layout the conclusions above canbe made for most of the nodes and their clusters.
The dynamic force directed layout of the graph in revisions [702, 703] (figure 22) shows a significantly differentsituation only several slightly modified nodes, reflected in thelow drawing measure value (0,006). The clusters of the nodewith the highest measure value (0.224) are drawn showing themutual position of the node and its neighbors. It can be seen thatthe number of the points in the clusters is decreased whichdirectly influences the metric measure. As the nodes keep their
positions between the revisions the measure values per node forthe dynamic force directed drawing algorithm are lower, compared to the values of the dynamic Fruchterman Reingoldlayout (figure 21).
As examining the eclustering measure values in the charton figure 19 a quality assessment of the graph drawing algorithms can be produced the force directed graph drawingalgorithm turns out better layout quality in the context of therelative nodes position preservation when visualizing JavaGit.
4.4. Weighted Orthogonal Ordering Analysis
The values of the orthogonal ordering measure are shownfor 45 revisions of JMeld[12] on figure 23. The examples belowuse the drawings of the graph between revisions [534, 535],which are also used in the ranking measure analysis.
Since the orthogonal ordering measure calculations arestrongly affected by the angles between the different states of thenodes, an additional displayed data visualizes them the direction angle, representing the angle between the graph nodes inthe first graph drawing is given in green sectors; the directionangle, representing the angle between the graph nodes in thesecond graph drawing in magenta sector with dashed border(figure 24). The angles are drawn in a positive direction, as usedin the measure calculation. Black arrows indicate x axis. Thetranslation segments are also drawn to indicate the positions ofthe nodes in the first and second drawing. Since the weightedorthogonal ordering measure concerns the entire drawing, themeasurements per element are not calculated.
The measure value (0.259) in revisions [534, 535] for thedynamic Fruchterman Reingold layout is one of the highest inthe software evolution interval, displayed on figure 23. The illustration on figure 24 shows several direction angles between thenodes positions in the two revisions. The difference in the anglesmeasurements in these consecutive drawings is also displayedby the measure values.
By examining figure 18, representing the translation segments for the dynamic forcedirected layout it appears that thedirection angles remains unchanged since the translation segments are collinear. This fact explains the low value of themeasurement between revision 534 and 535 only 0.004.
According to the measure values on figure 23 it appearsthat the dynamic forcedirected layout is a better choice forpreserving the relative point pairs ordering in the JMeld projectsoftware evolution graph representation.
5. Contribution
The quality of data analysis is dependent to a large extenton the appropriate target data set representation as well as theease and quick orientation within. Since graph drawing is awidely used approach for representing graphs, the quality of thedrawing algorithm used is a general problem. By introducing andverifying different methods for layout quality data representationand analysis, the current paper clearly expresses the need of atool for assessment, observation and analysis of graph drawingsequences. ReViewer is proposed as a possible solution of thedefined need. Based on the specific graph drawing appraisal

2 201126 information technologiesand control
Manuscript received on 7.06.2011
Dimitar Ivanov was born in 1987 in Vidin, Bulgaria. He has graduatedfrom Sofia University, Faculty of Mathematic and Informatics, specialtyInformatics. He is working as a software engineer and researcher atMusala Soft. His research interests are in the field of software visualiza-tion and graph drawing metrics.
Contacts:Applied Research and Development Center at Musala Soft
36 Dragan Tsankov blvd1057 Sofia, Bulgaria
Phone: +359 2 969 58 00e-mail: [email protected]
Haralambi Haralambiev was born in 1985 in Burgas, Bulgaria. He hasgraduated from Sofia University, Faculty of Mathematics and Informatics,specialty Computer Science. He is working at the Applied Research andDevelopment Center at Musala Soft. His research interests are in the fieldof software visualization, information visualization, software moderniza-tion.
Contacts:Applied Research and Development Center at Musala Soft
36 Dragan Tsankov blvd1057 Sofia, Bulgaria
Phone: +359 2 969 58 00e-mail: [email protected]
measures, the ReViewer uses different types of views to represent example data in an intuitive manner from a various synchronized points of view.
6. ConclusionVisual and numerical approaches for assessment, obser
vation and analysis of graph drawing sequences based on several selected measures are presented in the paper. A softwaretool ReViewer is developed and used for experimental evaluationof a number of graph layouts by a set of defined measures. Theexperimental analysis over several revisions of sample softwareprojects shows that the selected measures and the suggestedvisualization provides a suitable basis for software evolutionunderstanding as well as a stable and mental map preservingdrawing of graph sequences.
Future work will include realization of several more layoutmeasures as well as aggregation of measures according todifferent graph drawing aesthetic criteria. The comparison between arbitrary (not only sequential) graph drawings, representing a concrete source code revisions, should be also provided.Detection of software erosion based on the software evolutionsystem graph also could be done as a part of the graph drawinganalysis.
7. AcknowledgmentThis work was partially supported by the Bulgarian Na
tional Science Research Fund through contract ååå 02/18 2009 “Fast Orientation in Complex Information Systems”.
References1. Beyer, D., A. Hassan. Evolution Storyboards: Visualization of SoftwareStructure Dynamics. Proc. of the 14th IEEE International Conference onProgram Comprehension, ICPC ’06, IEEE Computer Society Washington,DC, USA, 2006, 248251.2. Bridgeman, S., R. Tamassia. A User Study in Similarity Measures forGraph Drawing. Proc. of the 8th International Symposium on GraphDrawing Springer Verlag London, UK, 2001, 1930.3. Bridgeman, S., R. Tamassia. Difference Metrics for Interactive Orthogonal Graph Drawing Algorithms. Proc. of the 6th InternationalSymposium on Graph Drawing Springer Verlag London, UK, 1998,5771.4. Djemili, R. www.jmemorize.org5. Erten, C., P. Harding, S. Kobourov, K. Wampler, G. Yee. GraphAEL:Graph Animations with Evolving Layouts. Proc. of the 11th Symposiumon Graph Drawing, Perugia, Italy, 2003, 98110.6. Frishman, Y., A. Tal. Online Dynamic Graph Drawing. Proc.Eurographics/IEEE VGTC Symp. Visualization (EuroVis ’07), 2007,7582.7. Fruchterman, T., E. Reingold. Graph Drawing by ForceDirectedPlacement. Software Practice and Experience, John Wiley & Sons, Inc.New York, NY, USA, 21, 1991, 11291164.8. Gonzalez, A., R. Theron, A. Telea, F. Garcia. Combined Visualizationof Structural and Metric Information for Software Evolution Analysis.Proc. of IWPSEEvol ’09: Joint ACM Int. and Annual ERCIM Workshopson Principles of Software Evolution (IWPSE) and Software Evolution(Evol) Workshops, New York, NY, USA, 2009, 2530.9. Iliev, I., H. Haralambiev, M. Lazarova, S. Boychev. Dynamic ForceDirected Graph Layout for Software Visualization. To be published, ICEST2011.
10. Kaufmann, M., D. Wagner (Eds.). Springer, 2001, Drawing Graphs Methods and Models (Lecture Notes in Computer Science; 2025).11. KDM, http://www.omg.org/spec/KDM/1.0/12. Kuip, K. http://keeskuip.home.xs4all.nl/jmeld/index.htm13. Lee, Y., C. Lin, H. Yen. Mental Map Preserving Graph Drawing UsingSimulated Annealing. Proc. of the 2006 AsiaPacific Symposium onInformation Visualisation Volume 60, Australian Computer Society, Inc.Darlinghurst, Australia, Australia, 2006, 179188.14. Linder, J., G. Dhindsa, N. Singh, C. Bosley, R. Snyder, M. Artemenko,A. Jadhav. http://javagit.sourceforge.net/15. O’Madadhain, J., D. Fisher, T. Nelson. Java Universal Network/GraphFramework http://jung.sourceforge.net/16. Pinzger, M., H. Gall, M. Fischer, M. Lanza. Visualizing MultipleEvolution Metrics. Proc. of the ACM Symposium on Software Visualization (ACM SoftVis’05), New York, NY, USA, 2005, 6775. 17. R. Gansner, E., J. Mocenigo, S. North. Visualizing Software forTelecommunication Services. Proc. of the 2003 ACM Symposium onSoftware Visualization, New York, NY, USA, 2003, 151159.18. Torchiano, M., F. Ricca, A. De Lucia. Empirical Studies in SoftwareMaintenance and Evolution. IEEE Int. Conf. on Software Maintenance(ICSM’2007), 2007, 491494.

2 2011 27information technologiesand control
Stanimir Boychev was born in 1973 in Stara Zagora, Bulgaria. He hasgraduated from Sofia University, Faculty of Mathematics and Informatics,specialty Mathematics. He is working at Musala Soft Ltd. His researchinterests are in the field of analysis and transformation of softwaresystems.
Contacts:Applied Research and Development Center at Musala Soft
36 Dragan Tsankov blvd1057 Sofia, Bulgaria
Phone: +359 2 969 58 00e-mail: [email protected]
Assoc. Prof. Milena Lazarova, Ph.D, M.Sc. Eng., has graduated fromthe Technical University of Sofia, Faculty Computer Systems and Control,specialty Computer Technologies. She is working in the Department“Computer Systems” at the Technical University of Sofia. Her researchinterests are in the field of computer graphics, image processing, patternrecognition, geographic information systems, parallel information pro-cessing, parallel algorithms, parallel programming.
Contacts:Systems Department at Technical University of Sofia
8 Kliment Ohridski blvd1756 Sofia, Bulgaria
e-mail: [email protected]
Full-time 3-year renewable position for Assistant/Associate Professor in Computer Science
The American University in Bulgaria (AUBG) seeks a new faculty member in the field of Computer Science eager tojoin the premier American-style liberal arts university in Southeast Europe. The ideal candidate will be a professionaleducator with Ph.D. degree in Computer Science, experience of teaching in American liberal arts-style universities,capable of teaching a variety of introductory and specialized courses in the Computer Science program, and eager tojoin the Department of Computer Science in the Fall 2012. The successful candidate is expected also to have goodresearch record and be ready to accept long-term commitment at AUBG.
AUBG is a selective, residential institution with a diverse student body consisting of 1100 students from 34 countries.The average SAT score is 1181. Instruction is in English. AUBG is accredited in both the USA and in Bulgaria. AUBGis located in Blagoevgrad in southwestern Bulgaria close to the Greek border. Visit us at www.aubg.bg.
Candidates should send a letter of application, a CV and the names of three referees with contact information (includinge-mail) to: [email protected].
Electronic submissions are encouraged, but candidates may mail application materials to: Office of the Dean, AmericanUniversity in Bulgaria, Blagoevgrad 2700, Bulgaria.
Application review will begin immediately and continue until the position is filled.
The American University in Bulgaria is committed to a policy of non-discrimination and equal opportunity.


![Multidimensional cyclic graph approach: Representing a ... · Efficient cube approaches, such as the multidimensional direct acyclic graph (MDAG) approach [20], the Dwarf approach](https://img.pdfslide.us/doc/110x75/5fbc402eed62fa0b8806d8da/multidimensional-cyclic-graph-approach-representing-a-eficient-cube-approaches.jpg)