Embed Size (px)
Citation preview
Deep GLIMPSE: Exploring the Far Side of the Galaxy
Spitzer Space Telescope General Observer Proposal #80074.
Principal Investigator: Barbara A. Whitney
Institution: University of Wisconsin, Madison
Electronic mail: [email protected]
Technical Contact: Brian L. Babler, University of Wisconsin, Madison
Co−Investigators: Robert Benjamin, University of Wisconsin−Whitewater
Ed Churchwell, University of Wisconsin−Madison
Marilyn Meade, University of Wisconsin−Madison
Brian Babler, University of Wisconsin−Madison
Lori Allen, NOAO
Loren Anderson, Laboratoire d’Astrophysique de Marseille
Dana Balser, NRAO
Thomas Bania, Boston University
Leo Blitz, UC−Berkeley
Martha Boyer, STScI
Chris Brunt, University of Exeter
Sukanya Chakrabarti, Florida Atlantic University
Ed Chambers, Northwestern University
Dan Clemens, Boston University
Martin Cohen, UC−Berkeley
Angela Cotera, SETI
Claudia Cyganowski, Harvard−Smithsonian Center forAstrophysics
Chris Davis, Joint Astronomy Center, Hawaii
Bruce Elmegreen, IBM Research
Peter Frinchaboy, Texas Christian University
Dirk Froebrich, University of Kent
Joseph Hora, Harvard−Smithsonian Center for Astrophysics
Remy Indebetouw, University of Virginia
Georgios Ioannidis, University of Kent
Abstract:We propose to re−observe and enhance the original GLIMPSE survey region by following theGalactic warp at a Galactocentric distance of 13 kpc to survey the far outer Galaxy. The
Thomas Jarrett, IPAC−Caltech
Charles Kerton, Iowa State University
Henry Kolbulnicky, University of Wyoming
Kathleen Kraemer, Air Force Research Laboratory
Nanda Kumar, University of Porto
Sheng−Yuan Liu, ASIAA, Taiwan
Philip Lucas, University of Hertfordshire
Steve Majewski, University of Virginia
Jon Mauerhan, IPAC−Caltech
Massimo Marengo, Iowa State University
Tom Megeath, University of Toledo
Dante Minniti, Universidad Catolica de Chile
Joseph Mottram, University of Exeter
Matthew Povich, Penn State University
Thomas Robitaille, Harvard−Smithsonian Center for Astrophysics
Robert Rood, University of Virginia
Marta Sewilo, Johns Hopkins University
Howard Smith, Harvard−Smithsonian Center for Astrophysics
Michael Smith, University of Kent
Thomas Stanke, ESO
John Stauffer, IPAC, Caltech
Schuyler Van Dyk, IPAC−Caltech
Jacco van Loon, Keele University
Kevin Volk, STScI
Christer Watson, Manchester College
Grace Wolf−Chase, Adler Planetarium
Gail Zasowski, University of Virginia
Science Category:Galactic: galactic structure
Observing Modes: IRAC Post−Cryo Mapping
Hours Requested:1,350.0
Proprietary Period(days): 0
new survey will cover longitudes of 15 < l < 65, −15 > l > −95, with a latitude widthof 2.5 degrees; 55% of the survey will overlap with GLIMPSE, and 45% will cover newterritory. The survey strategy of 3 HDR visits on each sky position will increase thedynamic range over GLIMPSE by a factor of 13 on the faint end and 3 on the bright end. Thesurvey will be enhanced by several complementary surveys at near−IR, mid−IR, far−IR, submm,and radio wavelengths. Deep GLIMPSE will allow us to map stellar Galactic structure out to the edge of the stellardisk; map star formation and H II regions in the far outer Galaxy; improve our estimate ofthe star formation rate (SFR) of the Galaxy and study the SFR as a function ofGalactocentric distance; study low−mass as well as high−mass star formation in the Galacticplane and determine stellar mass functions and evolutionary timescales of YSOs as afunction of stellar mass and environment; continue to catalog PAH bubbles, IRDCs, YSOoutflows, stellar clusters, external galaxies, brown dwarfs, and more; and search for dwarfgalaxies hidden by the Galactic midplane.
OMG: One More GLIMPSE, B. Whitney et al. 1
1 Science Plan
By any measure, GLIMPSE (Galactic Legacy Infrared Midplane Survey Extraordinaire) hasbeen one of the more successful of the Spitzer Space Telescope programs (Benjamin et al2003; Churchwell et al 2009). Using IRAC to map the Galactic plane over several cyclesof observations, the combination of the GLIMPSE I, II, 3D, Vela-Carina, Cygnus X, andSMOG surveys has yielded sensitive, high angular resolution, four band mid-infrared (3.6µm through 8.0 µm) coverage along a ∼ 180◦ long strip of the Galactic plane. Point sourcecatalogues (highly reliable) and archives (less reliable, but more complete) totaling over 115million sources each, and background-matched four-band mosaics at different resolutions,have been provided on a timely basis to the Spitzer Science Center and IRSA. The GLIMPSEand Vela-Carina data have been used in over 265 papers, 28% by team members and 72% byothers, and have been used in numerous (and unforeseen) ways ranging from identificationof counterparts to γ-ray sources to the analysis of Planck data. GLIMPSE has also inspiredseveral successor surveys, notably MIPSGAL and the Herschel Hi-Gal survey.
GLIMPSE has also led to several major education and outreach efforts. Sections of theGLIMPSE and MIPSGAL surveys exist in a zoomable version (www.alienearths.org/glimpse),a large format 180 foot-long poster that is on permanent display at the Adler Planetariumin Chicago (a version of which was displayed at two AAS meetings), and the front and backcovers of the Astro2010 Decadal Report. Most recently, these surveys have also providedthe first infrared dataset to the Zooniverse: www.milkywayproject.org. Since going on-linein Dec 2010, over 12,000 volunteers from around the world have measured the propertiesof 139,000 PAH bubble candidates (this includes repeat measurements) and tens of thou-sands of other objects (Simpson et al 2011). Many of the newly found bubbles appear tobe genuine, and we estimate this effort will produce an order-of-magnitude increase over theoriginal GLIMPSE bubble catalog of Churchwell et al (2006, 2007).
With the imminent completion of the Spitzer Warm Mission GLIMPSE360 program,which continues 3.6 µm and 4.5 µm coverage to complete a full 360◦ swath of width ∼ 2−3◦
along the entire Galactic plane, one might ask what is left to do? As we show in this proposal,stopping now would leave the Galaxy only half-mapped for two reasons. First, beyond thedistance of the Galactic center, the Galactic midplane, in both stars and gas, warps outof the |b| < 1◦ strip that was mapped in the original GLIMPSE survey. By adjusting thelatitude coverage to follow this warp, we will be able to map and catalogue star formationregions on the far side of the Milky Way Galaxy that would not be detectable in any othersurvey. Second, red clump giants, an invaluable class of standard candles useful for mappingGalactic stellar structure, were only reliably detected down to a magnitude of m = 13.3(d < 9.2 kpc) using the original 2x 1.2 second exposure time observations in the GLIMPSEsurvey. By increasing the integration time to match that used in the GLIMPSE360 survey(3x 10.4 sec exposure time observations), we will be able to detect red clump giants down tom = 15.5 (d < 25.6 kpc), encompassing the midplane of the entire stellar disk, and allowingus to partially map the stellar warp and flare on the far side of the Galaxy.
As in the original GLIMPSE project, the primary motivation of this effort is three-fold: (1) extending the survey of high-mass star formation throughout the Milky Way, (2)increasing the number of red giants, which trace the stellar mass of the Galaxy, and (3)searching for new objects that cannot be seen through the high extinction in the Galacticplane at other wavelengths. This final category includes a possible dwarf galaxy, whosemass, distance and location have been predicted based on the observed disturbance of outer
OMG: One More GLIMPSE, B. Whitney et al. 2
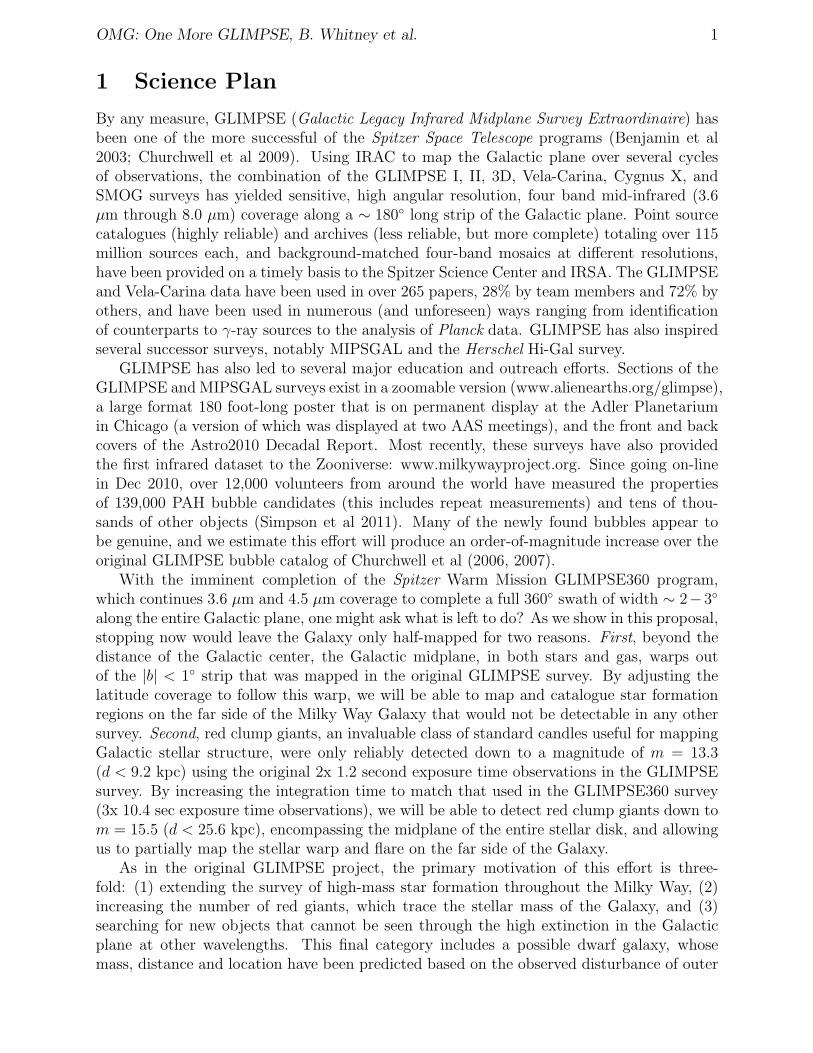
Figure 1: MSX 8 micron image of the inner Galaxy (Price et al. 2001). Proposed survey limits,using a combination of 0.4 and 10.4 sec exposure times, are shown with solid red lines and followthe midplane of the HI warp at a Galactocentric radius RG =13 kpc (Binney & Merrifield 1998;Levine et al 2006). GLIMPSE/Vela-Carina coverage area, using 1.2 sec observations, is shown inwhite. Black lines show the location of the midplane at a galactocentric distance of RG = 13 (solid),14 (dashed), and 15 kpc (dotted). Yellow rectangular boxes show areas mapped with IRAC with12 s exposure times or longer (the exact orientation of these regions is not shown). A five-degreesegment of the survey area(−90◦ to − 95◦) is not displayed.
Galaxy HI.
1.1 Deep GLIMPSE overview and complementary surveys
The Deep GLIMPSE survey (Figure 1) will overlap the original GLIMPSE and Vela-Carinasurveys in longitude coverage (15◦ < l < 65◦ and −15◦ > l > −95◦) but will follow theposition of the HI warp on the far side of the Galaxy using the same integration times asGLIMPSE360: 3x 10.4 sec plus 3x 0.4 sec. Just over 45% of the area we propose to coveris completely new territory, which will be a rich hunting ground for new star formationregions (among other objects). When compared to GLIMPSE, the factor of 13 increasein sensitivity will also allow us to identify many new YSOs and stellar outflows as well asprobe star formation down to much lower mass limits than was possible with GLIMPSE (seeFigure 2). It will also allow us to detect red clump giants, a standard candle, out to d < 25.6kpc (vs d < 9.2 kpc) in unconfused regions. The short exposures will allow us to obtainaccurate photometry on many sources that were saturated in the original GLIMPSE survey;this includes bright YSOs, AGB stars, and red supergiants. The scientific importance of thisgreatly increased dynamic range is discussed below.
Due to its high spatial resolution and greater depth, Deep GLIMPSE will be a powerfulcomplementary dataset to several on-going surveys. Just as GLIMPSE was matched inphotometric depth to 2MASS (Skrutskie et al. 2006), GLIMPSE360/Deep GLIMPSE arewell-matched to the ongoing deeper near-infrared surveys of the Galactic disk: UKIDSS-
OMG: One More GLIMPSE, B. Whitney et al. 3
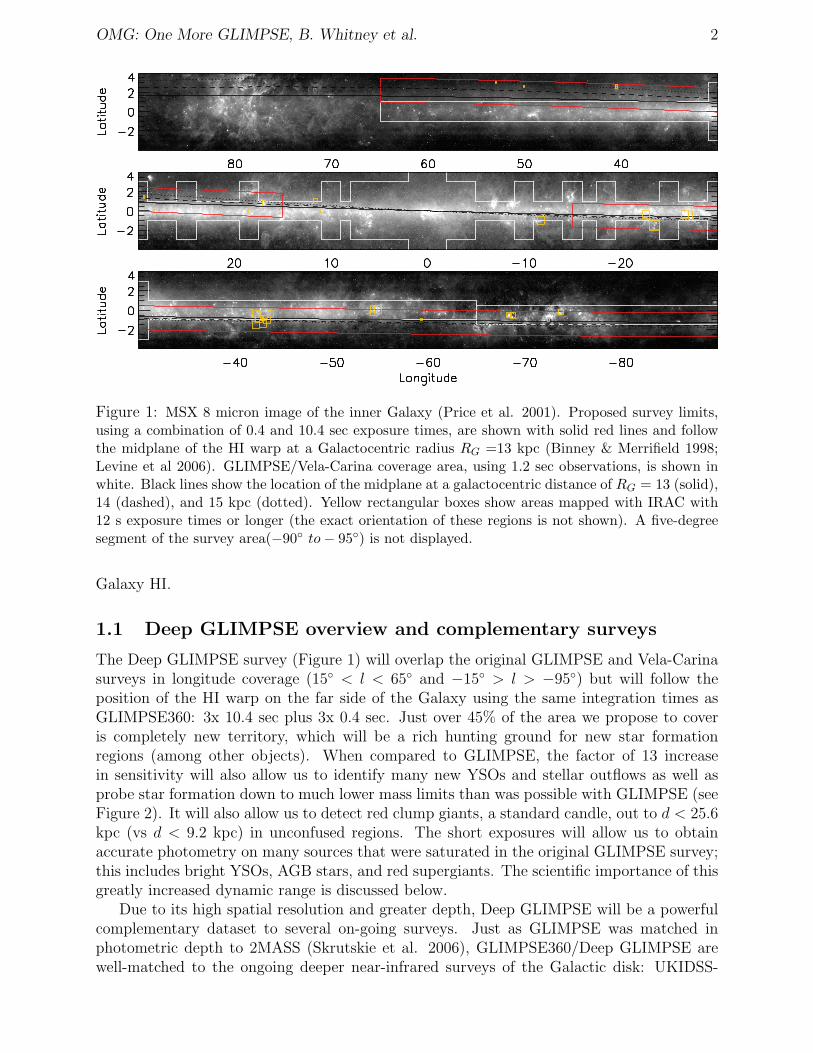
GLIMPSE PID 30154
Figure 2: A portion of NGC6334, as imaged by GLIMPSE (left) and program ID 30154 (PI: L.Allen) which used the same integration time as proposed here. The circled object is a magnitude16.5 star in the [4.5] band detected in this program which was undetected in GLIMPSE. Thiscomparison demonstrates the potential of Deep GLIMPSE to resolve and identify stars of muchlower mass in stellar clusters.
Galactic Plane Survey (Lucas et al. 2008), VVV (Vista Variables in the Via Lactea, Minniti2010), and UWISH2 (UKIRT Widefield Infrared Survey for H2, Froebrich et al 2010). Thecombination of these data sets allows for accurate extinction correction and color-selection ofred giants, YSOs, and stellar outflow sources. The PIs of UKIDSS-GPS, VVV, and UWISH2are all part of this team and will have early access to Deep GLIMPSE data.
All-sky mid-infrared coverage is currently being obtained by WISE, Wide-field InfraredSurvey Explorer, from 3.4 µm to 22 µm, and the initial data release planned for April2011 will contain the entire area we are proposing to observe. In the Galactic plane, thelower angular resolution of WISE (6′′ as compared to 2′′) does not allow one to adequatelycharacterize the stellar content of star formation regions nor to map the stellar disk usingred clump giants. However, we will be able to use the longer wavelength bands of WISEat 12 and 22 µm (with angular resolution 6′′ and 12′′ respectively), along with MIPSGAL(Carey et al 2009) where available, to constrain stochastic dust emission in the vicinity ofstar formation regions. Additional surveys which complement this data include Herschel/Hi-GAL (Herschel Infrared Galactic Plane Survey, Molinari et al. 2010), the AKARI infraredsurvey (Ishihara et al. 2010), 12CO surveys of the Galactic disk (Dame et al 2001), the 13CO
Galactic Ring Survey (Jackson et al 2006), the SCUBA-2 all-sky sub-millimeter survey, andthe GASKAP survey in HI and OH at 20′′ resolution. These data will all be exploited toprovide a multi-wavelength view of the star formation uncovered by Deep GLIMPSE.
1.2 Galactic Star Formation: Near and Very Far
We discuss in this section the worthwhile star formation science that can be accomplishedboth in the “distant” regions sampled in the new data (approximately 45% of the survey),and in the relatively “nearby” regions that will be re-observed with more dynamic range(going brighter by a factor of 3, and fainter by a factor of 13).
OMG: One More GLIMPSE, B. Whitney et al. 4
0 2 4 6 8 10 12 14Distance from Galactic Center (kpc)
-10
-5
0
5D
ista
nce
fro
m G
ala
ctic C
en
ter
(kpc)
0 2 4 6 8 10 12 14
0.00
0.20
0.40
0.60
0.80
Nu
mb
er
of H
II R
eg
ion
s p
er
Pix
el
0 2 4 6 8 10 12 14Galactocentric Radius (kpc)
-200
-100
0
100
200
Dis
tan
ce
Ab
ove
Ga
lactic P
lan
e (
pc)
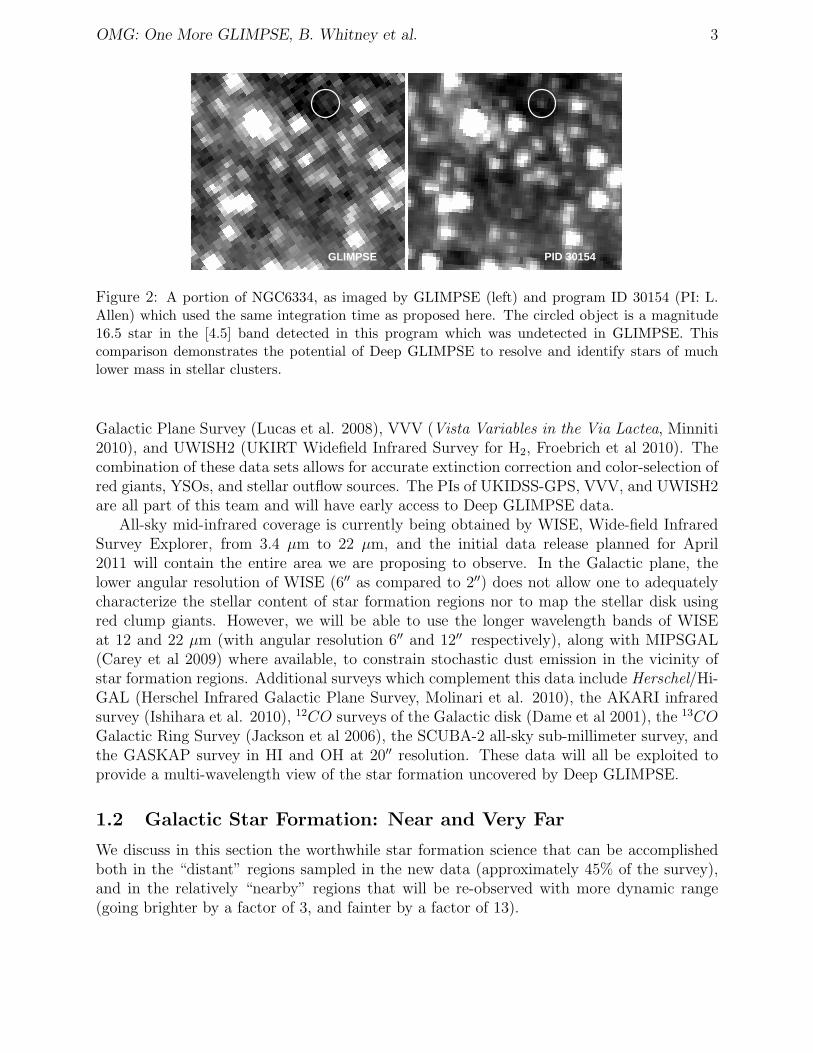
Figure 3: Left: Kinematic distances and directions are shown for previously known HII regions(black) and mid-infrared selected HII regions confirmed with radio recombination line detections(red) (Anderson & Bania 2009;Anderson et al 2011). The mid-infrared selected HII regions added34 nebulae located beyond the Solar orbit (dotted line half-circle) at distances >12 kpc from theSun. Center: The smoothed HII region distribution (750 pc FWHM) shows evidence of Galacticstructure; HII regions lie within ∼1 kpc of RG=4.3 or 6.0 kpc. Right: Distance vs. height showingupward curvature of HII regions with distance. The upper limit of 250 pc on the HII region heightis due to the |b| < 1◦ limit for GLIMPSE/MIPSGAL.
1.2.1 “Distant” star formation (d>10 kpc)
The HI warp of the Galaxy has been well-characterized in neutral hydrogen 21 cm observa-tions (Levine, Blitz, & Heiles 2006). In the first quadrant (l = 0 − 90◦) beyond a galacto-centric distance of RG ∼ 10 kpc, the Galactic midplane begins to warp upward steeply: theGalactic midplane at RG = 13 kpc crosses above b = 1◦ for l > 35◦ (Figure 1). GLIMPSEdid not follow this warp and therefore does not completely sample the star formation on thefar side of the Galaxy. For this reason the Deep GLIMPSE will follow the warp on the far
side of the Galaxy (just as GLIMPSE360 followed the warp on the near side) to discover andcharacterize “distant star formation” beyond the solar circle.
Mid-infrared surveys have been efficient at finding new star forming regions throughoutthe Milky Way, both because of the greatly lowered extinction (A[4.5] = 0.43AK ∼ 1
20AV )
and because mid-IR bands contain PAH emission in [3.6] and Brα emission in the [4.5] band.GLIMPSE is filled with thousands of tiny angular-scale star formation regions, and a recentGreen Bank Telescope (GBT) recombination-line survey of the Galactic plane (Figure 3)that targeted bright diffuse mid-IR sources had a 95% success rate, detecting 663 new HIIregions (Bania et al. 2010). This single effort doubled the number of known HII regions inthis section of the Galaxy, with much more to come. It also detected star formation beyondRG
>∼
9 kpc, where HII regions do not suffer the near-far distance degeneracy (“kinematicdistance ambiguity”) that plagues kinematic mapping in the inner Galaxy, increasing thesample from one to 34! But the current list of distant Galaxy HII region candidates isincomplete for a simple reason: on the far side of the Galaxy, the midplane curves out ofthe original |b| < 1◦ survey area due to the warp! Figure 3 shows the most distant HIIregions are all above b = 0◦ , consistent with the known HI warp. Extended latitude coverage,
together with the angular resolution of Spitzer, is thus needed to explore the star formation
of a completely unmapped section of our Galaxy.
OMG: One More GLIMPSE, B. Whitney et al. 5
2000 4000 6000
5’
0 5 10 15 20 25 30 35
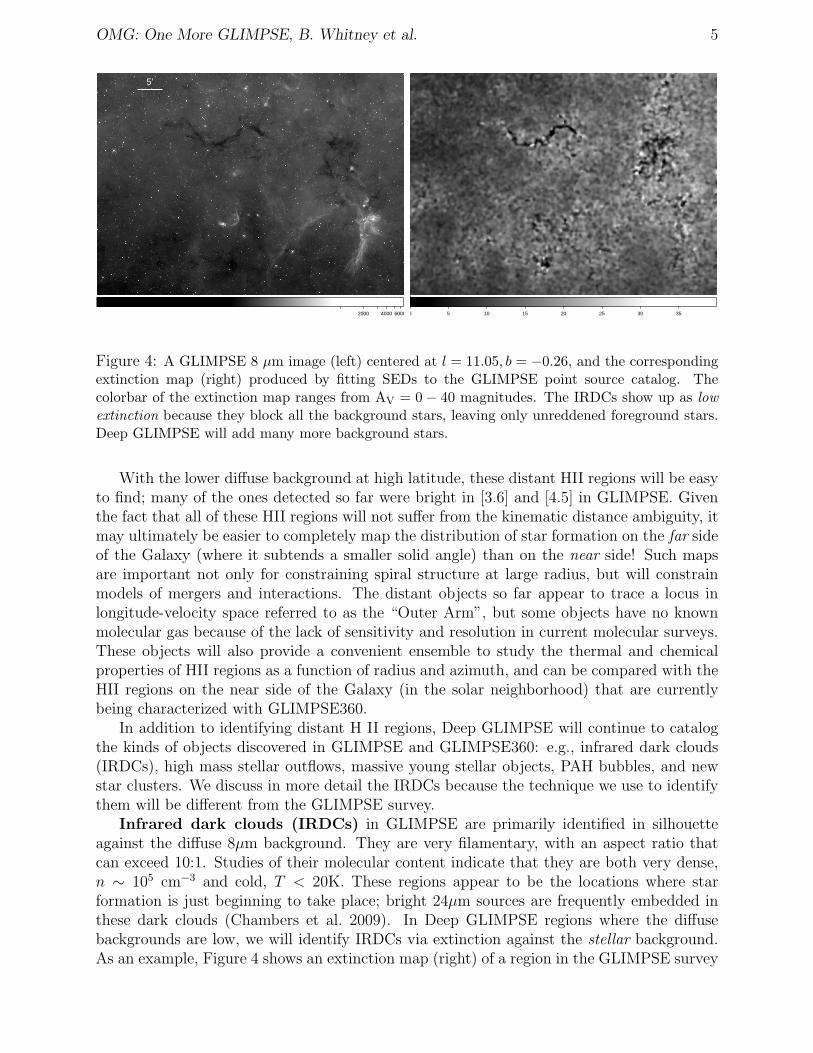
Figure 4: A GLIMPSE 8 µm image (left) centered at l = 11.05, b = −0.26, and the correspondingextinction map (right) produced by fitting SEDs to the GLIMPSE point source catalog. Thecolorbar of the extinction map ranges from AV = 0 − 40 magnitudes. The IRDCs show up as low
extinction because they block all the background stars, leaving only unreddened foreground stars.Deep GLIMPSE will add many more background stars.
With the lower diffuse background at high latitude, these distant HII regions will be easyto find; many of the ones detected so far were bright in [3.6] and [4.5] in GLIMPSE. Giventhe fact that all of these HII regions will not suffer from the kinematic distance ambiguity, itmay ultimately be easier to completely map the distribution of star formation on the far sideof the Galaxy (where it subtends a smaller solid angle) than on the near side! Such mapsare important not only for constraining spiral structure at large radius, but will constrainmodels of mergers and interactions. The distant objects so far appear to trace a locus inlongitude-velocity space referred to as the “Outer Arm”, but some objects have no knownmolecular gas because of the lack of sensitivity and resolution in current molecular surveys.These objects will also provide a convenient ensemble to study the thermal and chemicalproperties of HII regions as a function of radius and azimuth, and can be compared with theHII regions on the near side of the Galaxy (in the solar neighborhood) that are currentlybeing characterized with GLIMPSE360.
In addition to identifying distant H II regions, Deep GLIMPSE will continue to catalogthe kinds of objects discovered in GLIMPSE and GLIMPSE360: e.g., infrared dark clouds(IRDCs), high mass stellar outflows, massive young stellar objects, PAH bubbles, and newstar clusters. We discuss in more detail the IRDCs because the technique we use to identifythem will be different from the GLIMPSE survey.
Infrared dark clouds (IRDCs) in GLIMPSE are primarily identified in silhouetteagainst the diffuse 8µm background. They are very filamentary, with an aspect ratio thatcan exceed 10:1. Studies of their molecular content indicate that they are both very dense,n ∼ 105 cm−3 and cold, T < 20K. These regions appear to be the locations where starformation is just beginning to take place; bright 24µm sources are frequently embedded inthese dark clouds (Chambers et al. 2009). In Deep GLIMPSE regions where the diffusebackgrounds are low, we will identify IRDCs via extinction against the stellar background.As an example, Figure 4 shows an extinction map (right) of a region in the GLIMPSE survey
OMG: One More GLIMPSE, B. Whitney et al. 6
produced by fitting stellar atmosphere Spectral Energy Distributions (SEDs) to GLIMPSEcatalog stars in this region. We included only the 2MASS (JHKs) and IRAC [3.6] and [4.5]bands in the SED fit, and used the extinction law of Indebetouw et al. (2005). The extinctionmap in Figure 4 picks out several of the IRDCs evident in silhouette in the 8 µm image atleft. We may also be able to estimate their distances with this technique based on an analysisof the distances of the foreground stars.
1.2.2 “Nearby” star formation (2-10 kpc)
Well over 100 papers have been written on star formation in the GLIMPSE survey. Theseinclude catalogs of: PAH bubbles (produced by recently formed massive stars; Churchwellet al. 2006, 2007) outflows from massive YSOs (Cyganowski et al. 2008), infrared darkclouds (Peretto & Fuller 2009), and YSOs (Robitaille et al. 2008); and studies of specificstar formation regions (Whitney et al. 2004, Indebetouw et al. 2007, Shepherd et al. 2007,Fazal et al. 2008, Smith et al. 2009, Kang et al. 2009, Povich et al. 2007, 2009, 2011, Povich& Whitney 2010). What more could be done in these same regions with the higher dynamicrange of Deep GLIMPSE? By probing further down the YSO mass function, Deep GLIMPSEwill allow us to (1) investigate the lifetimes of disks and envelopes as a function of stellarmass and environment, (2) compare YSO mass functions in different regions, (3) identifythe driving sources of outflows from a deep molecular hydrogen survey, and (4) improveestimates of the total star formation rate of the Galaxy and its variation with Galactocentricradius. Deep GLIMPSE will allow us to study YSOs down to mass limits of 0.1 M⊙ (at 3kpc) to 2 M⊙ (at 8 kpc). In GLIMPSE, the mass limits were 3 and 8 M⊙, respectively.
Evolutionary Timescales and YSO Mass Functions: The combination of UKIDDS/VVV, Deep GLIMPSE, MIPSGAL, WISE, and HI-GAL will provide complete spectral en-ergy distributions (SEDs) for YSOs over a much larger range of mass than was providedby 2MASS, GLIMPSE, & MIPSGAL alone. SED fitting of these YSOs provide estimatesfor both evolutionary stage (Robitaille et al. 2007) and stellar mass (Shepherd et al. 2007,Indebetouw et al. 2007, Povich et al. 2009, Povich & Whitney 2010). By studying largesamples of sources in different evolutionary stages, we can estimate the relative lifetimes ofthese stages as a function of stellar mass. Examining a variety of these regions tells us howevolution proceeds in different environments.
We have begun such investigations in the well-known M17, W51, and Carina regions.In W51 (d = 5.4 ± 0.2 kpc), Kang et al. (2009) found evidence of mass segregation, withthe most massive objects concentrated towards the center of the H II regions. In the veryyoung M17 SWex complex (d = 2.1 kpc) and the more evolved Great Nebula in Carina(d = 2.3 kpc), the YSO mass function exhibits a dramatically steeper power law than theSalpeter–Kroupa IMF. This suggests that intermediate-mass YSOs may lose their disks veryquickly compared to low-mass YSOs (Povich & Whitney 2010, Povich et al. 2011). In bothcases, the mass functions were complete only down to 3-5 M⊙ and would benefit from deeperobservations.
In M17 SWex, O stars are conspicuously absent, despite a star formation rate as high asthat in the bright central M17 molecular cloud region, and the presence of an estimated 200YSOs that will become main-sequence B stars (Povich & Whitney 2010). This suggests thatmassive stars begin forming at later times than low-mass stars and the best places to study
the initial conditions of O star formation appear to be IRDCs where intermediate-mass star
formation has already begun.
OMG: One More GLIMPSE, B. Whitney et al. 7
The Driving Sources of YSO Outflows: Co-I Froebrich and collaborators are con-ducting an unbiased H2 survey of the GLIMPSE North field (10 < l < 65◦) using WFCAMat UKIRT (Froebrich et al 2010). This survey, called UWISH2, has 0.7′′ resolution, a depthof K ∼ 18, and will be completed in summer 2011. UWISH2 has discovered a large numberof outflows from YSOs. Unfortunately, the low and intermediate mass YSOs responsible forthe outflows are generally not detected in the GLIMPSE survey. The Deep GLIMPSE sur-vey will provide valuable complementary data to this and related surveys by identifying thedriving sources of these outflows and producing complete SEDs to better study the natureof these sources.
Star Formation Rates: Robitaille & Whitney (2010) estimated the star formation rate(SFR) of the Galaxy by calculating a YSO population synthesis model with the SFR as themain parameter. The model produces a simulated GLIMPSE YSO catalog that is comparedto the observed one (Robitaille et al. 2008). Based on several Monte Carlo simulations andan analysis of the input errors, the Galactic SFR was estimated to be 0.68 − 1.45 M⊙ yr−1.Our method samples a 10-100 times larger portion of the IMF than previous estimates,which are based on indirect tracers of O and B stars (Smith et al. 1978, Diehl et al. 2006,Misiriotis et al. 2006, Murray & Rahman 2009). Our SFR estimate will improve as newsurveys (such as GLIMPSE360, Deep GLIMPSE, UKIDSS-GPS, HI-GAL, and SCUBA-2)expand the SED coverage, the survey area, and sensitivity to lower masses. In addition toimproving the global SFR, we plan to estimate SFR as a function of galactocentric radius(and therefore metallicity).
We have already begun studying SFRs as a function of position in the Galaxy. Povichet al. (2009) and Povich & Whitney (2010) estimated the present-day star formation rateacross the M17 complex to be ∼0.01 M⊙yr−1. In the Great Nebula in Carina (NGC 3372),Povich et al. (2011) estimated a star formation rate > 0.008 M⊙yr−1. This suggests thatthe star formation activity of the entire Milky Way is equivalent to a few hundred Carina orM17 complexes. Analysis of the local star formation samples in the Spitzer c2D and GouldBelt surveys has probed how well the Kennicutt-Schmidt relation between surface densityand star formation applies in nearby star forming regions (Heiderman et al. 2010). We willextend this type of analysis to a much larger section of the Galaxy.
1.3 Galactic structure
By taking advantage of the low extinction in the mid-infrared and the high angular resolutionand sensitivity of Spitzer, the uniform survey of the inner Galaxy by Spitzer/IRAC hasproduced unique information on the bar(s) of the Galaxy, the nuclear region, the stellardisk, and spiral arms (Figure 5). Star counts in the mid-infrared are much less affected byextinction than in the near-infrared, and the addition of near- and mid-infrared data breaksthe degeneracy between the reddening and temperature changes in near infrared studies alone(Figs 4-6 in Benjamin et al. 2007). Majewski et al (2011) have developed a de-extinctiontechnique, the Rayleigh-Jeans Color Excess (RJCE) method, that takes advantage of mid-infrared data to produce star-by-star measurements of extinction. With these deeper mid-infrared observations, we will be able to simultaneously map both the stellar and interstellarstructure of the Galaxy with much higher angular resolution than ever before.
One of the most important sources for mapping Galactic stellar structure are “red clump”giants: the helium-core burning phase of low mass stars. Because they are common - ∼ 200have parallax measurements - their absolute magnitude is well established: MK = −1.54 ±
OMG: One More GLIMPSE, B. Whitney et al. 8
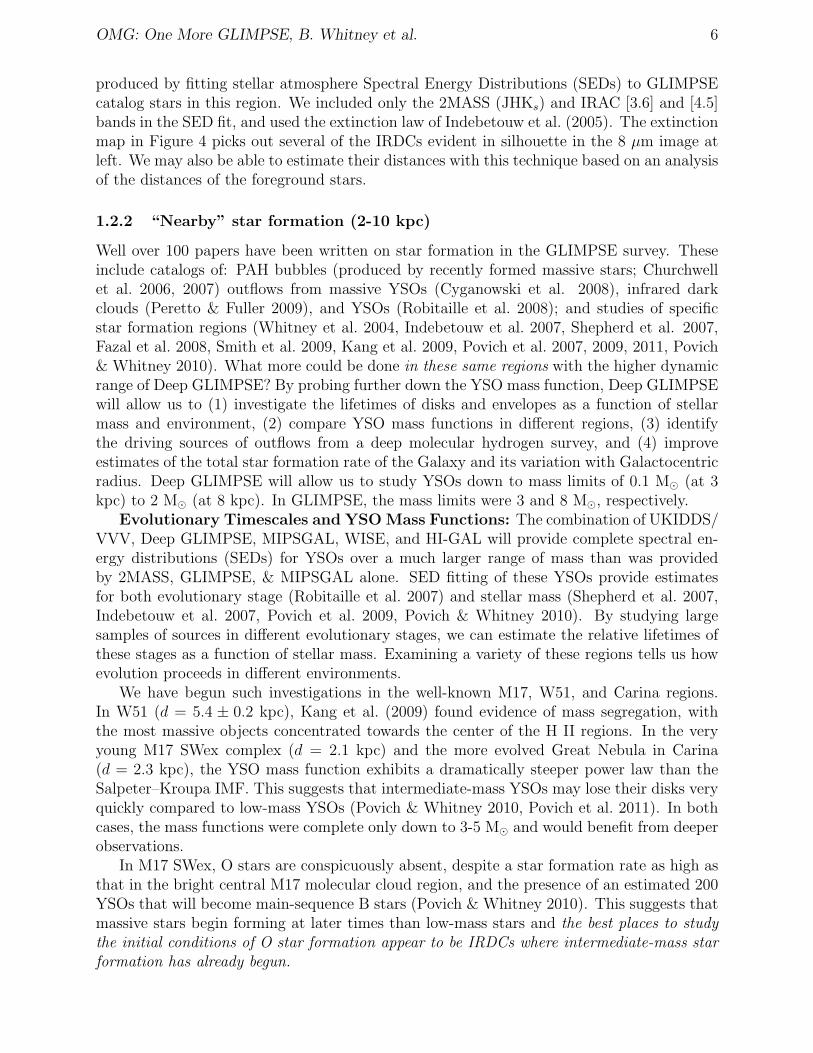
Figure 5: Deep GLIMPSE coverage of the Galactic plane is shown as two black wedges on aschematic of the Milky Way. The inner radius of each wedge is the GLIMPSE detection distancefor red clump giants (used to map the structure of the stellar disk); the outer radius is the DeepGLIMPSE detection distance. Different Spitzer surveys are labeled in green, and aspects of Galacticstructures in red: the triaxial bulge/bar, the “Long” bar, the spiral arms, and the stellar “trunca-tion” distance (Robin et al 1992; Benjamin et al 2011). One of the goals of Deep GLIMPSE is tomap this stellar “truncation” to the far side of the Galaxy.
0.04 (Groenewegen 2008). GLIMPSE detected these sources out to a distance of d < 9 kpc inthe dusty midplane regions inaccessible to 2MASS. Deep GLIMPSE will detect these sourcesto d < 25.6 kpc, allowing us to map the distribution of stars on the far side of the Galacticdisk. Our Galactic structure goals for Deep GLIMPSE are listed below.
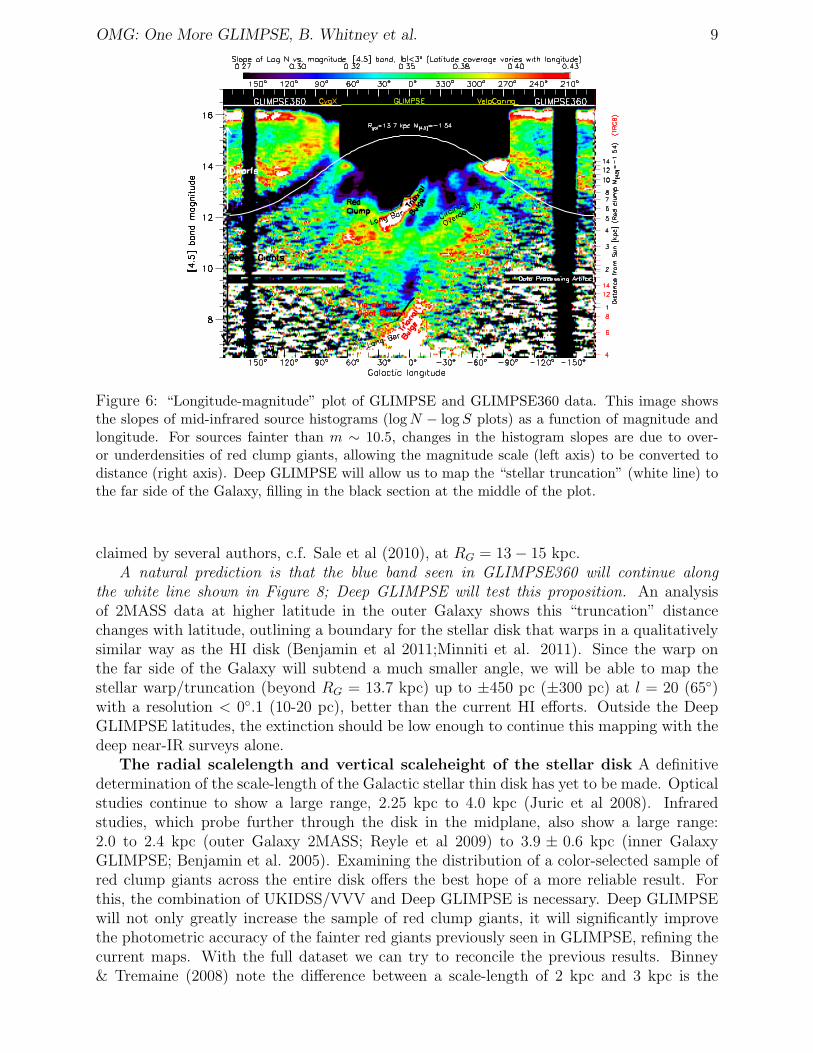
Mapping the truncation/warp/flare of the stellar disk of the Galaxy: Figure 6displays a “longitude-magnitude plot” that encapsulates both one of the early (re)discoveriesof the GLIMPSE survey (the “Long Bar”; Hammersley et al 2008; Benjamin et al. 2005)as well as a soon to be published GLIMPSE360 discovery (marked with the curved whiteline). What is plotted (as a function of both longitude and magnitude) are the slopes of mid-infrared source histograms. This is a convenient way of summarizing the results of thousandsof source histograms. There are inflections (slope changes) in the histograms, caused byspatial over- or under-densities of red clump giants, whose positions change smoothly withlongitude and magnitude. For example, the range l = 30 − 15◦ and m[4.5] ∼ 12 shows an“uphill” (in red-white) and a “downhill” (violet-black) with a peak that shifts to fainterapparent magnitude with decreasing longitude. Since red clump giants are standard candles(see Girardi & Salaris 2001 for caveats), one can map the distance to any over-density of redclump giants, in this case the red clump giants tracing the “Long Bar”. GLIMPSE360 has
added a new feature to this diagram: a “big blue band” visible from l = 65 − 265◦. The blueindicates that the histograms flatten out for a bit at a characteristic magnitude that changeswith Galactic longitude. Models show that this flattening is because of a truncation in thenumber of (red clump) giants along the line of sight. The white line shows the longitude-magnitude track for a circle of radius RG = 13.7 kpc around the Galactic center, assumingan absolute magnitude of M[4.5] = −1.54. One possible explanation for this feature is theexistence of a “truncation” in the number of red clump giants. Such a truncation has been
OMG: One More GLIMPSE, B. Whitney et al. 9
Figure 6: “Longitude-magnitude” plot of GLIMPSE and GLIMPSE360 data. This image showsthe slopes of mid-infrared source histograms (log N − log S plots) as a function of magnitude andlongitude. For sources fainter than m ∼ 10.5, changes in the histogram slopes are due to over-or underdensities of red clump giants, allowing the magnitude scale (left axis) to be converted todistance (right axis). Deep GLIMPSE will allow us to map the “stellar truncation” (white line) tothe far side of the Galaxy, filling in the black section at the middle of the plot.
claimed by several authors, c.f. Sale et al (2010), at RG = 13 − 15 kpc.A natural prediction is that the blue band seen in GLIMPSE360 will continue along
the white line shown in Figure 8; Deep GLIMPSE will test this proposition. An analysisof 2MASS data at higher latitude in the outer Galaxy shows this “truncation” distancechanges with latitude, outlining a boundary for the stellar disk that warps in a qualitativelysimilar way as the HI disk (Benjamin et al 2011;Minniti et al. 2011). Since the warp onthe far side of the Galaxy will subtend a much smaller angle, we will be able to map thestellar warp/truncation (beyond RG = 13.7 kpc) up to ±450 pc (±300 pc) at l = 20 (65◦)with a resolution < 0◦.1 (10-20 pc), better than the current HI efforts. Outside the DeepGLIMPSE latitudes, the extinction should be low enough to continue this mapping with thedeep near-IR surveys alone.
The radial scalelength and vertical scaleheight of the stellar disk A definitivedetermination of the scale-length of the Galactic stellar thin disk has yet to be made. Opticalstudies continue to show a large range, 2.25 kpc to 4.0 kpc (Juric et al 2008). Infraredstudies, which probe further through the disk in the midplane, also show a large range:2.0 to 2.4 kpc (outer Galaxy 2MASS; Reyle et al 2009) to 3.9 ± 0.6 kpc (inner GalaxyGLIMPSE; Benjamin et al. 2005). Examining the distribution of a color-selected sample ofred clump giants across the entire disk offers the best hope of a more reliable result. Forthis, the combination of UKIDSS/VVV and Deep GLIMPSE is necessary. Deep GLIMPSEwill not only greatly increase the sample of red clump giants, it will significantly improvethe photometric accuracy of the fainter red giants previously seen in GLIMPSE, refining thecurrent maps. With the full dataset we can try to reconcile the previous results. Binney& Tremaine (2008) note the difference between a scale-length of 2 kpc and 3 kpc is the

OMG: One More GLIMPSE, B. Whitney et al. 10
difference between a stellar mass and dark matter dominated gravitational potential.High angular resolution three-dimensional extinction maps: Given the rel-
atively smooth distribution of red giant stars across the disk, these sources can serve astracers of the dust distribution, c.f. Robin (2009). Marshall et al (2006) used the stellardistribution of the Besancon model (Robin et al 2003) and then adjusted extinction versusdistance to match the observed 2MASS color-magnitude diagrams, obtaining an angularresolution of 15 arcminutes and ∼ 100 pc in distance. Other authors have used red clumpgiants alone (Lopez-Corredoira et al 2002; Stead et al 2010). Because of the greater numberof stars detected, the combination of the deep near-infrared UKIDSS-GPS/VVV survey withDeep GLIMPSE data will allow star-by-star estimates of extinction (Majewski et al 2011),allowing 3D extinction maps to attain much higher angular and distance resolution, as wellas probing variations in dust grain properties across the Galaxy (Zasowski et al 2009).
1.4 Searching Through the Dust
In addition to the large-scale goals of characterizing the star-formation and stellar structureof the Milky Way, Deep GLIMPSE will uncover new objects, e.g. brown dwarfs in the plane,new stellar clusters, and other galaxies that are undetectable in any other way. One measureof the usefulness of our proposed survey is that a few selected areas of the GLIMPSE surveyhave already been observed with a depth similar to what we propose. This includes severaltargeted star formation areas (L. Allen: PID 70157) and a mini-survey to search for thegalaxies of the ”Great Attractor” (Jarrett: PID 40802). Other potential objects include:
New Companion(s) for the Milky Way? Thanks to 2MASS and the Sloan DigitalSky Survey, we now know of many more stellar streams around the Galaxy. Several of thesestructures lie near the Galactic plane, for example, the Monoceros Stream (Newberg et al.2002) and the Triangulum-Andromeda star cloud (Majewski et al. 2004). Theoretically,it appears that the Galactic midplane may be the most interesting place to look for theongoing process of disk building and subhalo accretion. Our search for new Local Groupmembers and stellar streams is particularly motived by a specific prediction (Chakrabarti &Blitz 2009, 2011a). Models of the disturbed morphology in the outer HI disk of the MilkyWay indicate the existence of a perturber that passed through the Milky Way at RG ∼ 5kpc about 0.6 Gyr ago. These models predict that the mass ratio of the dwarf satelliteis between 1:300 to 1:100 (relative to the total mass of the Milky Way), and that it is ata distance of 80 ± 10 kpc, in the longitude range 310◦ < l < 350◦, with an angular sizeof 0◦.5- 1◦. When these models are applied to other spiral galaxies, they correctly predictthe location and mass of known dwarf galaxy perturbers (Chakrabarti et al. 2011b) addingcredibility to this prediction. At the predicted distance, the tip of the red giant branch wouldbe at m = 12.4− 12.9, sufficiently faint that this object would be undetected in the shallowGLIMPSE survey. Since the latitude predictions span the Galactic plane, the mid-infraredsearch for this system in Deep GLIMPSE will need to be supplemented with deep near-IRcoverage in the off-plane regions, but mid-infrared coverage of the dusty disk is needed to fully
cover the sky in the search for this and other similar objects.
Galaxies in the Zone of Avoidance: The Milky Way blocks up to ∼ 10−30% ofthe extragalactic sky at optical and near-infrared wavelengths, respectively. The discoveryof several massive galaxies towards Centaurus in the shallow GLIMPSE survey (Jarrett etal. 2007) prompted a deeper mini-survey in a ∼4 deg2 area partially overlapping with theGLIMPSE survey region; this survey indicates that these galaxies will be detectable in the
OMG: One More GLIMPSE, B. Whitney et al. 11
3.6 µm and 4.5 µm bands. Deep GLIMPSE will allow searches to assess how this regionconnects up to known galaxy clusters above and below the Galactic plane and will conductan unbiased search for extragalactic systems along the Zone of Avoidance.
A search for stellar variability is one of the major goals of the ongoing deep near infraredsurveys, UKIDSS-GPS and VVV. This includes Mira variables, AGB stars, Cepheids, RRLyrae stars, and YSOs. The comparison of Deep GLIMPSE catalogs to original GLIMPSEwill identify additional sources showing mid-infrared variability. As an example, Robitailleet al (2007) compared GLIMPSE/MIPSGAL data with MSX observations to identify 552large amplitude variables.
Finally, previous GLIMPSE surveys demonstrated the value of surveys in producing newareas of research from serendipitous discoveries, for example, of PAH bubbles, massiveYSO outflows, new star clusters, clusters of ultra massive red supergiants, planetary nebulae,and brown dwarfs. The depth of coverage in GLIMPSE360 is producing surprising resultscompared even to GLIMPSE; Deep GLIMPSE, we hope, will surprise us yet again.
1.5 Technical Plan
The survey area (15◦ < l < 65◦ and −15◦ > l > −95◦, Figure 1) will follow the midplaneof the HI warp at RG = 13 kpc (Binney & Merrifield 1998; Levine et al. 2006). Theinner longitude limits were chosen based on analysis of confusion discussed below; the outerlimits connect this survey to GLIMPSE360. The latitude width of the survey is 2.5◦, whichwill allow GLIMPSE and Deep GLIMPSE to cover a contiguous area, i.e. no latitude gapsbetween the surveys. Nearly 55% of the survey will overlap in area with previous surveys,and 45% will map new area. Each position of the survey region will be observed three timesin HDR mode with 0.4 & 10.4 sec integration times. The exposure times are 3 times shorter,and 13 times longer, respectively, than the original GLIMPSE survey.
The Deep GLIMPSE AORs are designed in a manner similar to previous GLIMPSE-stylesurveys. Scheduled observations are ∼4.0◦ (longitude) by ∼2.5◦ (latitude). Each AOR istypically 3 frames wide by 40 frames long, with nearly full-frame steps in the short directionand nearly 1/3-frame steps in the long direction. Every spot in the survey area is coveredthree times in quick succession. In order to cover the wide range in latitude and longitude,one to two areas are scheduled over ∼1 week. If longitude ranges are observed as quickly asthey become visible, the survey can be completed in less than 6 months. As was true for theprevious GLIMPSE surveys, the entire set of AORs can be reproduced for any scheduled dateon short notice. Co-I Babler has produced AORs for a representative portion (l = 30− 62◦)of the survey and estimated a total observing time of 1300 hours for the whole survey. Basedon our experience with previous large surveys, small gaps in survey coverage can occur sowe request an 50 additional hours for contingency (∼3.7% of the total time).
1.5.1 Sensitivity and Confusion Limits
The sensitivity and saturation limits of Deep GLIMPSE (equivalent to GLIMPSE360) arecompared to WISE and GLIMPSE in Table 1. Our survey is well matched to the UKIDSS-GPS and VVV survey depths (K=17.8, H=18.6, J=19.5) which overlap most of our proposedsurvey. The brighter saturation limits will allow the recovery of saturated sources in theoriginal GLIMPSE survey.
The confusion limit of Deep GLIMPSE is significantly better than WISE. Based on theCondon criterion of 30 beams per source (Condon 1974; Hogg 2001), the confusion limit is
OMG: One More GLIMPSE, B. Whitney et al. 12
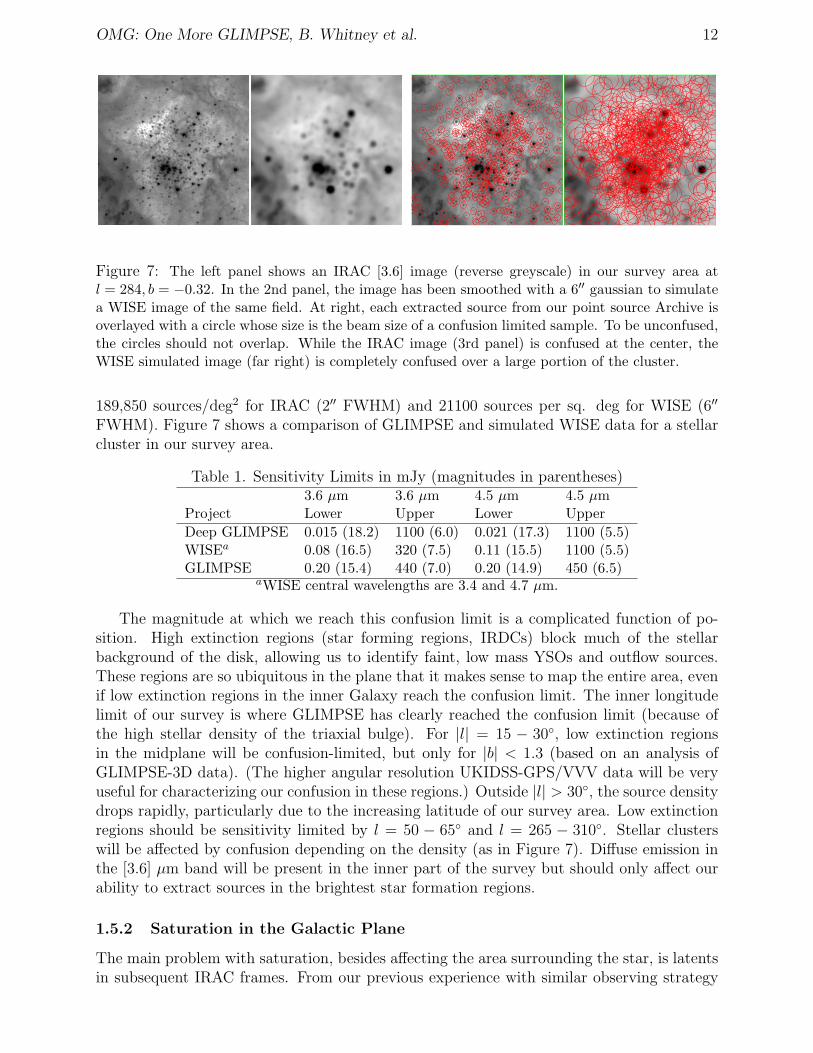
Figure 7: The left panel shows an IRAC [3.6] image (reverse greyscale) in our survey area atl = 284, b = −0.32. In the 2nd panel, the image has been smoothed with a 6′′ gaussian to simulatea WISE image of the same field. At right, each extracted source from our point source Archive isoverlayed with a circle whose size is the beam size of a confusion limited sample. To be unconfused,the circles should not overlap. While the IRAC image (3rd panel) is confused at the center, theWISE simulated image (far right) is completely confused over a large portion of the cluster.
189,850 sources/deg2 for IRAC (2′′ FWHM) and 21100 sources per sq. deg for WISE (6′′
FWHM). Figure 7 shows a comparison of GLIMPSE and simulated WISE data for a stellarcluster in our survey area.
Table 1. Sensitivity Limits in mJy (magnitudes in parentheses)3.6 µm 3.6 µm 4.5 µm 4.5 µm
Project Lower Upper Lower Upper
Deep GLIMPSE 0.015 (18.2) 1100 (6.0) 0.021 (17.3) 1100 (5.5)WISEa 0.08 (16.5) 320 (7.5) 0.11 (15.5) 1100 (5.5)GLIMPSE 0.20 (15.4) 440 (7.0) 0.20 (14.9) 450 (6.5)
aWISE central wavelengths are 3.4 and 4.7 µm.
The magnitude at which we reach this confusion limit is a complicated function of po-sition. High extinction regions (star forming regions, IRDCs) block much of the stellarbackground of the disk, allowing us to identify faint, low mass YSOs and outflow sources.These regions are so ubiquitous in the plane that it makes sense to map the entire area, evenif low extinction regions in the inner Galaxy reach the confusion limit. The inner longitudelimit of our survey is where GLIMPSE has clearly reached the confusion limit (because ofthe high stellar density of the triaxial bulge). For |l| = 15 − 30◦, low extinction regionsin the midplane will be confusion-limited, but only for |b| < 1.3 (based on an analysis ofGLIMPSE-3D data). (The higher angular resolution UKIDSS-GPS/VVV data will be veryuseful for characterizing our confusion in these regions.) Outside |l| > 30◦, the source densitydrops rapidly, particularly due to the increasing latitude of our survey area. Low extinctionregions should be sensitivity limited by l = 50 − 65◦ and l = 265 − 310◦. Stellar clusterswill be affected by confusion depending on the density (as in Figure 7). Diffuse emission inthe [3.6] µm band will be present in the inner part of the survey but should only affect ourability to extract sources in the brightest star formation regions.
1.5.2 Saturation in the Galactic Plane
The main problem with saturation, besides affecting the area surrounding the star, is latentsin subsequent IRAC frames. From our previous experience with similar observing strategy
OMG: One More GLIMPSE, B. Whitney et al. 13
(SAGE, GLIMPSE360), we have found that sources with mK < 4 are bright enough tocause detectable latents in the IRAC data (which are masked out manually); sources withmK < 2 produce the most serious, repeatable latents. The density of sources with mK < 4(< 2) is 3.5 (0.18) sources/deg2 in the l = 20 − 60◦ region of the GLIMPSE midplane.Scaling to the Deep GLIMPSE area gives a total of 1150 stars causing single latents, and 60causing repeatable ones. This is a worst case estimate for Deep GLIMPSE since over halfthe observations will be off the midplane by a degree or more. Several other surveys in theGalactic plane used 12s HDR frames (Galactic First Look Survey, W-5, Cygnus-X, SMOG,and others), so there are precedents.
1.5.3 “Contamination” by Asteroids and Unresolved Galaxies
Main Belt Asteroids were identified in the GLIMPSE survey and removed from our catalogsbecause the asteroid moves between the time of the 3.6 and 4.5 µm observations. We willdetect these asteroids in a similar manner with Deep GLIMPSE. The more distant TransNeptunian Objects will mostly be below our detection limits.
The number density of unresolved galaxies is about 200 sources/deg2 for sources brighterthan 0.1 mJy (Cluver 2008). This is a very small fraction relative to stars. Harvey etal. (2007) describe a method for separating background galaxies from YSOs. Distant starformation regions should be identifiable by their diffuse emission. Evolved stars will ingeneral be substantially brighter than galaxies.
1.5.4 Data Processing
The data will be processed at the University of Wisconsin by the same group (Meade,Babler, Whitney, Indebetouw) that produced the GLIMPSE, GLIMPSE II, GLIMPSE3D,Vela Carina, GLIMPSE360, SAGE, and SAGE-SMC legacy datasets, as well as several GOprograms. The details of the data processing can be found in our online documentation1.We will produce high-quality point source catalogs and cleaned, mosaic images of the survey,
and make them publicly available as in our previous Legacy projects. The 3-visit strategy(compared to the GLIMPSE 2-visit) will produce a high quality dataset.
To verify our photometry calibration, we will compare our results in the regions thatoverlap with the GLIMPSE survey (55% of our survey). In addition, we have >120 stellarcalibrators calculated for the GLIMPSE survey that were constructed by Co-I Cohen. Almostall these calibrators are K0-M0III or A0-5V stars, built with the same codes used to trackthe Spitzer IRAC calibration (Cohen et al. 2003). We have successfully used this techniquefor previous GLIMPSE and SAGE (LMC & SMC) programs.
1.5.5 The Deep GLIMPSE Team
The science interests of the team members are listed below:
• Galactic Structure: Bania, Benjamin, Blitz, Cohen, Elmegreen, Frinchaboy, Indebe-touw, Majewski, Minniti, van Loon, Zasowski
• Star Formation: Allen, Anderson, Balser, Bania, Chambers, Churchwell, Clemens,Cyganowski, Davis, Elmegreen, Froebrich, Hora, Indebetouw, Ioannidis, Kerton, Kob-ulnicky, Kraemer, Kumar, Liu, Lucas, Megeath, Mottram, Povich, Robitaille, Rood,Sewilo, H. Smith, M. Smith, Stanke, Stauffer, Watson, Whitney, Wolf-Chase
1http://www.astro.wisc.edu/glimpse/docs.html
OMG: One More GLIMPSE, B. Whitney et al. 14
• Evolved Stars: Boyer, Cohen, Cotera, Hora, Kraemer, van Loon, Marengo, Mauerhan,Van Dyk, Volk
• Interstellar Medium: Bania, Benjamin, Brunt, Churchwell, Elmegreen, Indebetouw,Majewski, Zasowski
• Extragalactic: Blitz, Chakrabarti, Jarrett
Team members will have early access to the enhanced data products and will work on projectsof their choice.
References
Anderson, L.D. & Bania, T. 2009, ApJ, 690, 706 Jarrett, T. et al. 2007, AJ, 133, 979Anderson, L.D. et al. 2011, BAAS, 43, 217, 132.02 Juric, M. et al 2008, ApJ, 673, 864Bania, T. M., et al. 2010, ApJL, 718, L106 Kang, M. et al. 2009, ApJ, 706, 83Benjamin, R. A., et al., 2003, PASP, 115, 953 Levine, E., et al. 2006, ApJ, 643, 881Benjamin, R. A., et al., 2005, ApJ, 630, L149 Lopez-Corredoria, M. et al. 2002, A&A, 394, 883Benjamin, R. et al. 2007, AIPC, 943, 101 Lucas, P. W., 2008, MNRAS, 391, 136Benjamin, R, et al. 2011, BAAS, 43, 217, 241.14 Majewski, S., et al. 2004, ApJ, 615, 738Binney, J. & Merrifield, M. 1998, Majewski, S. et al 2011, ApJ, in press
Galactic astronomy (Princeton) Marshall, D. J., et al. 2006, A&A, 453, 635Binney, J. & Tremaine, S. 2008, Minniti, D., et al, 2010, New Astronomy, 15, 433
Galactic Dynamics (Princeton) Minniti, D. et al. 2011, ApJL, submittedCarey, S. J., et al, 2009, PASP, 121, 76 Misiriotis, A., et al. 2006, A&A, 459, 113Chakrabarti, S. & Blitz, L. 2009, MNRAS, 399, L118 Molinari, S., et al, 2010, PASP, 122, 314Chakrabarti, S. & Blitz, L. 2011, ApJ, in press Murray, N. & Rahman, M. 2010, ApJ, 709, 424Chakrabarti, S. et al. 2011, ApJ, submitted Newberg, H., et al. 2002, ApJ, 569, 245Chambers, E., et al. 2009, ApJS, 181, 360 Peretto, N. & Fuller, G. A. 2009, A&A, 505, 405Churchwell, E., et al, 2009, PASP, 121, 213 Povich, M. S., et al., 2007, Ap J, 660, 346Churchwell, E., et al, 2006, ApJ, 649, 759 Povich, M. S., et al., 2009, ApJ, 696, 1278Churchwell, E., et al, 2007, ApJ, 670, 428. Povich, M., & Whitney, B. 2010, ApJ, 714, 285Cluver, M., 2008, PhD Thesis, U. of Cape Town Povich, M., et al. 2011, ApJS, in pressCohen, M. et al. 2003, AJ, 126, 1090 Price, S. D., et al, 2001, AJ, 121, 2819Condon, J. 1974, ApJ, 188, 279 Reyle, C. et al. 2009, A&A, 495, 819Cyganowski, C. J., et al, 2008, AJ, 136, 2391 Robin, A. C. et al. 1992, ApJ, 400, L25Dame, T. M. et al. 2001, ApJ, 547, 792 Robin, A. C. 2009, A&A, 500, 165Diehl, R., et al., 2006, Nature, 439, 45 Robin, A. C., et al. 2003, A&A, 409, 523Fazal, F. M. et al. 2008, ApJ, 688, 41 Robitaille, T. P. et al. 2007, ApJS, 169,328.Froebrich, D. et al. 2011, MNRAS, in press Robitaille, T. P., et al., 2008, AJ, 136, 2413Giradi, L. & Salaris, M. 2001, MNRAS, 323, 109 Robitaille, T. & Whitney, B. 2010, ApJL, 710, L11Groenewegen, M. A. T. 2008, A&A, 488, 935 Sale, S.E. et al. 2010, MNRAS, 402, 713Hammersley, P. L. et al. 2000, MNRAS, 317, L45 Shepherd, D. et al., 2007, ApJ, 669, 464Harvey, P. et al. 2007, ApJ, 663, 1149 Skrutskie, M. et al. 2006, AJ, 131, 1163Heiderman, A. et al 2010, ApJ, 723, 1019 Simpson, R. et al. 2011, BAAS, 43, 217, 251.15Hogg, D. W. 2001, AJ, 121, 1207 Smith, L. F., et al. 1978, A&A, 66, 65Indebetouw, R., et al, 2005, ApJ, 619, 931 Smith, N. et al., 2009, MNRAS, 406, 952Indebetouw, R., et al. 2007, ApJ, 666, 321 Stead, J. J. & Hoare, M. G. 2010, arXiv, 1005, 1223Ishihara, D., et al, 2010, A&A, 514, 1 Whitney, B. A., et al., 2004, ApJ, 617, 1177Jackson, J., et al. 2006, ApJS, 163, 145 Zasowski, G. et al. 2009, ApJ, 707, 510
OMG: One More GLIMPSE, B. Whitney et al. 15
2 Scheduling Profile of the Proposed Program
We are proposing to observe regions spread over the inner Galactic plane (15◦ < l < 65◦ and−15◦ > l > −95◦ and latitude width 2.5◦). Regions are available at all times of the year.Any one region is visible for at least a month. We have planned the survey regions to beobserved as they become visible. As with previous GLIMPSE-style surveys, we have placedtiming and follow-on constraints on the AORs such that once an area is first observed, all theobservations for that area must be completed without excessive delay (<23 hours betweenconsecutive AORs). As was true for the previous GLIMPSE surveys, the entire set of AORscan be reproduced for any scheduled date on short notice.
OMG: One More GLIMPSE, B. Whitney et al. 16
3 Brief Team Resume
PI: B. Whitney is PI of the GLIMPSE360 project and co-I on the GLIMPSE, SAGE,and YSOVAR teams. She is one of the main developers of the GLIMPSE data processingpipeline and also a 3-D radiation transfer code used to model YSOs observed by Spitzer.L. Allen is an astronomer at the NOAO, is a member of the IRAC instrument team, is PIof the Gould Belt Legacy team and works in the area of star formation.T. Bania studies the Milky Way ISM primarily using the techniques of radio spectroscopy.He led the GBT H II region Discovery Survey effort and was a GLIMPSE team member.R. Benjamin is an original GLIMPSE team member and has been focusing on using thisdata to determine the stellar structure of the Galaxy.M. L. Boyer works at STScI as part of SAGE and HERITAGE teams. She has extensiveexperience with IRAC data and studies dusty evolved stars at low metallicity.E. Churchwell, a professor at the University of Wisconsin, was PI of the GLIMPSE I andGLIMPSE II legacy projects, and is an expert in massive star formation.D. Clemens was Co-I of the GLIMPSE project and is PI of the Galactic Plane InfraredPolarization Survey, which is mapping the magnetic field in the northern Milky Way disk.M. Cohen is a member of the GLIMPSE and SAGE legacy teams, and of the WISE andAKARI science teams. His absolute stellar calibrators are widely used in astronomy.C. J. Cyganowski is a NSF Postdoctoral Fellow at the CfA. She studies massive star for-mation using NIR to cm wavelengths, and cataloged outflow sources in the GLIMPSE survey.C. J. Davis is a Physical Scientist at NASA Headquarters. He is co-PI on the UWISH2survey, and a co-I on several other Legacy Surveys (UKIDSS, VVV, Hi-GAL, JCMT-JLS).B. G. Elmegreen works in the area of ISM, star formation and galactic structure. He willcontribute to the theoretical understanding, analysis and implications of the observations.D. Froebrich is a Lecturer at University of Kent. He is PI of the UWISH2 survey and doesresearch on young (proto)stars, outflows, molecular clouds and galactic stellar clusters.J. Hora is the IRAC instrument team Program Scientist. He is PI of the Cygnus-X Legacysurvey and a Co-I on several Spitzer programs.R. Indebetouw is a member of the GLIMPSE, SAGE, MIPSGAL legacy teams, and nu-merous GO programs. He was one of the key developers of the GLIMPSE data pipeline.K. E. Kraemer, an astrophysicist at AFRL, is a member of the Cyg-X and MIPSGAL datateams, and does research on the IR properties of evolved stars and star forming regions.M. S. N. Kumar is a Co-I of UWISH2, ESO-VISTA VHS survey and has extensive experi-ence with Spitzer data, which he uses to study young massive stars and embedded clusters.P. Lucas, a Senior Lecturer at the University of Hertfordshire, is the head of the UKIDSSGalactic Plane Survey and co-PI of VISTA Variables in the Via Lactea.J. Th. van Loon is a reader at Keele University. He has 100 refereed papers in the past13 years, mainly on mass loss, star formation, and galactic structure.T. Megeath is an associate professor at the University of Toledo, was a member of theIRAC instrument team, leads a key project with Herschel and works on star formation.S. R. Majewski is a professor at the University of Virginia, was PI of the Spitzer Vela-Carinaand Argo/Anticenter Surveys and developed the NIR-MIR RJCE dereddening method.M. Marengo is faculty at Iowa State University, was part of the SAO IRAC GTO team andleads projects on evolved stars, low-mass stars, young planetary systems and debris disks.J. Mauerhan specializes in the infrared color selection of Wolf-Rayet stars from GLIMPSEdata which he will use for the proposed survey and perform spectroscopic follow-up studies.
OMG: One More GLIMPSE, B. Whitney et al. 17
D. Minniti is a Professor at Universidad Catolica, and Adjunct Scholar at the Vatican Ob-servatory, and PI of the VVV Survey, working on Stellar Populations, and Galactic Structure.M. S. Povich is an NSF Postdoctoral Fellow at Penn State. He has extensive experiencestudying YSOs and massive stars with GLIMPSE.T. Robitaille is a Spitzer Fellow at the CfA. He produced a large grid of YSO models anda SED fitter, which is extensively used in analysing Spitzer data.H. A. Smith is a Senior Astrophysicist at the CfA, and a member of the CfA IRAC team.He is on numerous survey programs including GLIMPSE360 and several Herschel teams.J. Stauffer is System Scientist at the SSC, is a member of the IRAC instrument team atCfA and is lead for the YSOVAR project. He works on low mass, PMS, and spotted stars.S. D. Van Dyk is the Spitzer Science User Support deputy lead. He leads a team usingGLIMPSE+2MASS to locate ”hidden” Galactic Wolf-Rayet and other evolved stars.K. Volk is an astronomer at the Space Telescope Science Institute, publishes widely in thearea of late-type stars, planetary nebulae, and studies the dust shells of evolved stars.G. Zasowski is a graduate student working with Prof. S. Majewski on GLIMPSE-I/II/3Ddata in the study of the Galactic extinction law and stellar/reddening structures.
Relevant Publications2011 X. P. Koenig L. E. Allen “Disk Evolution in W5: Intermediate-mass Stars at 2-5Myr,” ApJ, 726, 182011 D. Froebrich, C. J. Davis, G. Ioannidis et al. “UWISH2 – The UKIRT WidefieldInfrared Survey for H2,” MNRAS, in press2010 T. M. Bania, L. D. Anderson, S. D. Balser, R. T. Rood, “The Green Bank Tele-scope Galactic HII Region Discovery Survey,” ApJ, 718, 1062010 T. Robitaille & B. Whitney, “The Present-Day Star Formation Rate of the MilkyWay Determined from Spitzer-Detected Young Stellar Objects,” ApJ, 710, L112010 B. G. Elmegreen, D. A. Hunter, “On the Disruption of Star Clusters in a HierarchicalInterstellar Medium,” ApJ, 712, 6042010 K. E. Kraemer, J. L. Hora et al. “Circumstellar Structure Around Evolved Starsin the Cygnus-X Star Formation Region,” AJ, 139, 23192010 D. Minniti et al. “VISTA Variables in the Via Lactea (VVV): The public ESOnear-IR variability survey of the Milky Way,” New Astronomy, 25, 4332010 M. S. Povich & B. A. Whitney, “Evidence for Delayed Massive Star Formation inthe M17 Proto-OB Association,” ApJ, 714, 285L2009 E. Churchwell, B. L. Babler, M. R. Meade, B. A. Whitney et al “TheSpitzer/GLIMPSE Surveys: A New View of the Milky Way,” PASP, 121, 2132009 M. J. Alexander, H. A. Kobulnicky, D. P. Clemens et al. “The Discovery of aMassive Cluster of Red Supergiants with GLIMPSE,” AJ, 137, 48242009 J. M. C. Grave, M. S. N. Kumar, “Spitzer-IRAC GLIMPSE of high-mass protostellarobjects. II. SED modelling of a bina fide sample,” A&A, 498, 1472009 G. Zasowski, S. R. Majewski et al. “Lifting the Dusty Veil with Infrared Photom-etry. II. A Large-Scale Study of the Galactic Infrared Extinction Law,” ApJ, 707, 5102008 C. J. Cyganowski et al. “A Catalog of Extended Green Objects in GLIMPSE: ANew Sample of Massive Young Stellar Object Outflow Candidates,” AJ, 136, 23912008 P. W. Lucas et al. “The UKIDSS Galactic Plane Survey,” MNRAS, 391, 1362008 T. P. Robitaille, M. R. Meade, B. L. Babler, B. A. Whitney et al. “Intrinsi-cally Red Sources observed by Spitzer in the Galactic Mid-Plane,” AJ, 136, 241
OMG: One More GLIMPSE, B. Whitney et al. 18
4 Summary of Existing Programs
PI B. Whitney is also PI of the Exploration Science GLIMPSE360 proposal. The data are85% taken, and about 90% of that has been processed to produce point source catalogs. Weare working on the cleaned mosaics now. Two papers are currently in preparation. Whitneyis also PI of Cycle-3 and Cycle-4 Theory proposals (PID 30467 & 40794) to make a large YSOgrid & fitter publicly available and to modify the codes and produce the next generation gridof models. The tasks for the first proposal are finished, we have published several papers,and have begun running a new grid of models.Co-I R. Benjamin is PI of Cycle 3 Legacy program GLIMPSE-3D (30570). All GLIMPSE3D point source lists and mosaics have been delivered to SSC, six papers have been publishedusing this data so far, with two more planned for this year.Co-I E. Churchwell is PI of 4 Spitzer programs. The GLIMPSE I & II programs are com-pleted, with final data products released to the community. 74 papers have been publishedby the GLIMPSE team, with another 191 by the community. For 40002 and 50130, datahave been reduced, and publications are in preparation.Co-I M. Cohen is PI of DDT proposals 464 and 472 supporting the calibration of NASA’sWISE. All the data are analyzed and will appear in a paper to be submitted to AJ earlyin 2011. Cohen is also PI of Archival proposal 40210. This produced an IAU SymposiumPoster and a detailed paper is in preparation.Co-I J. Hora is PI for the Spitzer Cygnus-X Legacy program (PID 40184), and an associatedGTO program on IRS observations of massive stars in Cygnus-X (PID 50045, 2 paperspublished). Hora is the TC of 5 other cryo mission GTO and GO programs.Co-I K. Kraemer is the PI or Technical contact for 3 Spitzer programs, 3121, 3277, and50044. The data have been observed, the analysis is 50% complete, and 4 papers have beenpublished with these data.Co-I S. R. Majewski is the PI of GO program 40791, the Spitzer/IRAC Vela-Carinasurvey. The data for the program have been completely reduced and used in at least fourpublished/submitted refereed articles, with more to follow.Co-I M. Marengo is PI or technical contact of 8 Spitzer programs, 85% observed, 60%analysis completed, 8 refereed papers published, 11 presentations at conferences.Co-I T. Megeath was primary technical contact for three GTO programs, PI for four GTOcryo-mission programs, and key Co-I for four GTO cryo-mission programs. These programsproduced a total of 42 refereed papers receiving 1763 citations to date, with two more papersrecently submitted and five more in preparation. In addition, he is PI on a Cycle 6 warmmission proposal and a Cycle 7 program.Co-I T. Stanke is PI of the GO-2 program 20620; data processed, analysis ongoingCo-I. J. Stauffer is PI for eight Spitzer programs. About 95% of the approved observationshave been obtained; about 90% of those data have been analysed. Eight papers have beenpublished.Co-I J. van Loon is PI of programs 20648 and 50458. All data have been processed.Program 20648 has resulted in 2 highly cited papers. Program 50458’s publication is nearsubmission.

OMG: One More GLIMPSE, B. Whitney et al. 19
5 Observation Summary Table
Target Position AOT Int./ AOR # ofField (range of long.) (range of b) Pixel Duration AORS
(secs) (secs)
Segment 1 30-34 0.03 - 2.53 Mapping 32.4 6111 23Segment 2 34-38 0.18 - 2.68 Mapping 32.4 6098 23Segment 3 38-42 0.33 - 2.83 Mapping 32.4 6091 23Segment 4 42-46 0.47 - 2.97 Mapping 32.4 6094 23Segment 5 46-50 0.60 - 3.10 Mapping 32.4 6088 23Segment 6 50-54 0.71 - 3.21 Mapping 32.4 6075 23Segment 7 54-58 0.81 - 3.31 Mapping 32.4 6098 23Segment 8 58-62 0.89 - 3.39 Mapping 32.4 6082 23
Note: This is a representative table; the full project will entail roughly 33 segments. Weexpect to detect sources from the saturation limit (1100 mJy) to the sensitivity limit (0.015mJy) in every segment. Consequently, we omitted the source flux column. There are 1300hrs total requested for this observing program plus a 50 hour contingency for possible gapsin survey coverage. Each segment requires approximately 40 observation hours.
6 Modification of the Proprietary Period
We request no modification of the zero-day proprietary period.
7 Summary of Duplicate Observations
Although 55% of the proposed area was covered by the original GLIMPSE and Vela-Carinasurveys, the significantly deeper coverage here enables much different science, as describedin the proposal. There are sixty-two unique programs (with 235 AORs) that involved IRACexposures longer than 6 seconds in the area we propose to observe. Most of these weresingle frame observations of interesting objects. Sixteen programs involved making small∼ degree-size maps: PID 139,174 (N. Evans), 201,218,219 (G. Fazio), 3121 (K.Kraemer),20302 (P. Andre), 20452 (N. Smith), 20506,20726 (J. Hester), 40285 (R. Waters), 40321(S. Wolk), 40802 (T. Jarrett), 41024 (L. Townsley), 60060 (T. Megeath), and 70157 (L.Allen). The total area mapped by these programs was 11.2 square degrees. Most of theseprograms were deeper observations of selected massive star forming regions, infrared darkclouds, or Herbig-Haro objects. A program to search for “Great Attractor” galaxies throughthe Galactic mid-plane mapped the single largest contiguous area of 3 square degrees. Allof these areas will be re-observed by Deep GLIMPSE, because avoiding them would makethe survey very inefficient. The multiple epochs of data can be used to search for sourcevariability and the combined deeper integrations will allow an even better characterizationof the stellar content in these regions.
OMG: One More GLIMPSE, B. Whitney et al. 20
8 Summary of Scheduling Constraints/ToOs
We have organized the survey, and the constraints, into areas ∼4◦ in longitude by ∼2.5◦ inlatitude. The first AOR in each area has a timing constraint of ∼2 days. Every other AORin the area has a follow-on constraint of ∼23 hours with the immediately adjacent AOR.Thus, once the first AOR of an area is observed, all the AORs must be observed in orderand without excessive delay. These constraints are primarily to avoid a significant changein roll-angle between adjacent AORs, resulting in a gap between adjacent AORs. The DeepGLIMPSE team can easily reschedule any areas on short notice to satisfy any schedulingconstraints, as previous GLIMPSE-style surveys have done.