Embed Size (px)
Citation preview


DEEM TM
Dietary Exposure Evaluation Model
Users Manual
byJudith L. Kidwell
James R. Tomerlin, Ph.D.Barbara J. Petersen, Ph.D.
May 2000
Novigen Sciences, Inc.1730 Rhode Island Ave., N.W. Suite 1100 Washington, D.C. 20036
(202) 293-5374 (202) 293-5377 (fax)[email protected]
DEEM Users Manual©2000 Novigen Sciences, Inc.
COPYRIGHT
Software copyright, 2000 by Stephen R. Petersen; manual copyright, 2000 by Novigen Sciences,Inc. All rights reserved worldwide. The publication has been provided pursuant to an agreementcontaining restrictions on its use. The publication is also protected by U.S. federal copyright law.No part of this publication may be reproduced, transmitted, transcribed, stored in a retrievalsystem, or translated into any human or computer language in any form or by any means,electronic, mechanical, magnetic, optical, manual or otherwise without the express writtenpermission of Novigen Sciences, Inc.
DISCLAIMER OF WARRANTY
Novigen Sciences, Inc., makes no representations or warranties, either express or implied, withrespect to this manual and accompanying software and specifically disclaims any impliedwarranties of merchantability or fitness for any particular purpose. This manual andaccompanying software are sold “as is,” with all faults. Novigen Sciences, Inc., will not be liablefor direct, indirect, incidental, or consequential damages resulting form any defect, error, orfailure to perform.
Portions of this program use Microsoft Corporation’s Visual Basic, QuickBasic®, Windows®and MS-DOS®.
If you have any comments or suggestions about this documentation or software it describes,please contact:
Novigen Sciences, Inc.1730 Rhode Island Ave., N.W.Suite 1100Washington, DC 20036(202) 293-5374 (phone)(202) 293-5377 (fax)[email protected] (e-mail)
DEEM Users Manual©2000 Novigen Sciences, Inc.
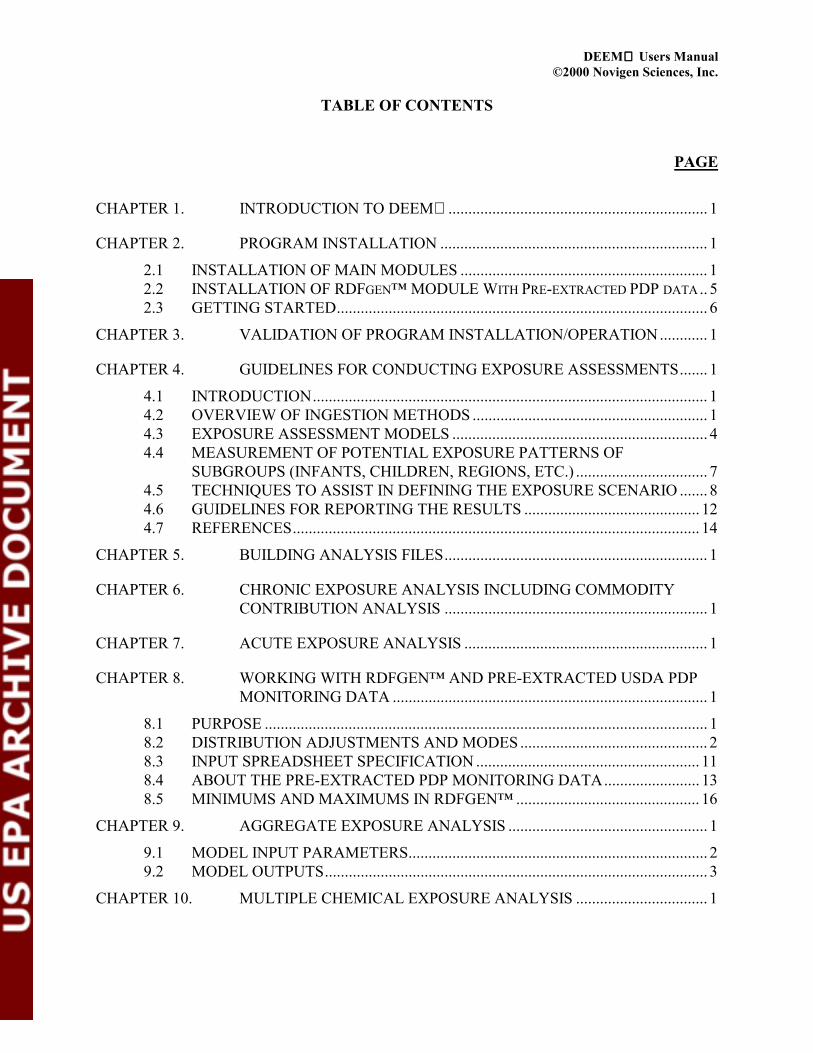
TABLE OF CONTENTS
PAGE
CHAPTER 1. INTRODUCTION TO DEEM ................................................................. 1
CHAPTER 2. PROGRAM INSTALLATION ................................................................... 1
2.1 INSTALLATION OF MAIN MODULES .............................................................. 12.2 INSTALLATION OF RDFGEN™ MODULE WITH PRE-EXTRACTED PDP DATA.. 52.3 GETTING STARTED............................................................................................. 6
CHAPTER 3. VALIDATION OF PROGRAM INSTALLATION/OPERATION............ 1
CHAPTER 4. GUIDELINES FOR CONDUCTING EXPOSURE ASSESSMENTS....... 1
4.1 INTRODUCTION................................................................................................... 14.2 OVERVIEW OF INGESTION METHODS ........................................................... 14.3 EXPOSURE ASSESSMENT MODELS ................................................................ 44.4 MEASUREMENT OF POTENTIAL EXPOSURE PATTERNS OF
SUBGROUPS (INFANTS, CHILDREN, REGIONS, ETC.) ................................. 74.5 TECHNIQUES TO ASSIST IN DEFINING THE EXPOSURE SCENARIO ....... 84.6 GUIDELINES FOR REPORTING THE RESULTS ............................................ 124.7 REFERENCES...................................................................................................... 14
CHAPTER 5. BUILDING ANALYSIS FILES.................................................................. 1
CHAPTER 6. CHRONIC EXPOSURE ANALYSIS INCLUDING COMMODITYCONTRIBUTION ANALYSIS .................................................................. 1
CHAPTER 7. ACUTE EXPOSURE ANALYSIS ............................................................. 1
CHAPTER 8. WORKING WITH RDFGEN™ AND PRE-EXTRACTED USDA PDPMONITORING DATA ............................................................................... 1
8.1 PURPOSE ............................................................................................................... 18.2 DISTRIBUTION ADJUSTMENTS AND MODES ............................................... 28.3 INPUT SPREADSHEET SPECIFICATION ........................................................ 118.4 ABOUT THE PRE-EXTRACTED PDP MONITORING DATA........................ 138.5 MINIMUMS AND MAXIMUMS IN RDFGEN™ .............................................. 16
CHAPTER 9. AGGREGATE EXPOSURE ANALYSIS .................................................. 1
9.1 MODEL INPUT PARAMETERS........................................................................... 29.2 MODEL OUTPUTS................................................................................................ 3
CHAPTER 10. MULTIPLE CHEMICAL EXPOSURE ANALYSIS ................................. 1

DEEM Users Manual©2000 Novigen Sciences, Inc.
LIST OF APPENDICES
PAGE
APPENDIX A. LISTING OF FOODS, FOOD FORMS, AND CROP GROUPS ...........A-1
APPENDIX B. BACKGROUND INFORMATION ON THE CONSUMPTION DATAUSED IN DEEM ................................................................................. B-1
APPENDIX C. FOOD LIST IN RAC CODE ORDER.................................................... C-1
APPENDIX D. FOOD LIST IN ALPHABETICAL ORDER ..........................................D-1
APPENDIX E. MONTE CARLO ANALYSES AND DATA ENTRYSIMPLIFICATION.................................................................................. E-1
APPENDIX F. FOOD DEFINITIONS .............................................................................F-1

DEEM Users Manual©2000 Novigen Sciences, Inc.
1 - 1
CHAPTER 1. INTRODUCTION TO DEEM
DEEM is a dietary exposure analysis system that may be used to estimate exposure toconstituents in foods comprising the diets of the US population, including population subgroups.The software was developed by Novigen Sciences, Inc. (Novigen) and contains foodconsumption data from the USDA Continuing Surveys of Food Intake by Individuals (CSFII)conducted in 1989 through 1992 and in 1994 through 1996. The food consumption data aretranslated into ingredients using Novigen’s proprietary ingredient translation database. Novigenwill continue to update the program as additional consumption data become available.
DEEM™ consists of four software modules: The main DEEM™ module, the Acute analysismodule, the Chronic analysis module, and the RDFgen™ residue distribution module. The mainDEEM™ module is used to create and edit residue files for specific chemical or cumulativeapplications, and to launch the DEEM™ Acute, Chronic, and RDFgen™ modules. TheRDFgen™ module automates single analyte and cumulative residue distribution adjustments andthe creation of summary statistics and Residue Distribution Files based up on USDA PesticideData Program (PDP) monitoring data or user-provided residue data. The Acute analysis andChronic analysis modules provide dietary exposure assessment models based on USDAconsumption data. The DEEM™ software itself is also integrated with CALENDEX™, anaggregate exposure assessment software application focusing on combined dietary and residential(non-dietary) exposures.
DEEM is a user-oriented, menu-driven system that runs on IBM personal computers andcompatible microcomputers. It operates under Windows 95®, Windows 98®, and Windows NT4®. To maximize application of the program and assure proper and complete use of data, werecommend that you read Chapter 4, Guidelines for Conducting Dietary Exposure Assessments.Chapter 3, Validation of Program Installation/Operation, provides the user with the tools toensure that the programs have been installed correctly.
Appendix A contains the Listing of Foods, Food Forms and identifies the crop groups that areincluded in the programs. Appendix B contains some helpful suggestions and answers tofrequently asked questions concerning the DEEM software and the USDA consumption data.Appendix C also contains helpful suggestions and information on simplifying data entry andconducting Monte Carlo analyses.
By using appropriate toxicological parameters associated with a chemical or constituent, theanalyses generated by DEEM express risk as a function of dose through dietary exposure. Toconduct either chronic or acute risk analyses using DEEM software the user must provide threetypes of information:
(1) concentrations of the constituent in the foods and/or food-forms. These can be atheoretical level such as the tolerance or MRL (maximum residue limit) or a levelanticipated to be present in the food of interest. The acute program utilizes either apoint estimate, a distribution of residues, or a combination of both.

DEEM Users Manual©2000 Novigen Sciences, Inc.
1 - 2
(2) toxicological data on the constituent that are directly relevant to the evaluation of thesignificance of estimates of exposure by the oral route. These should include atoxicology endpoint based on chronic (long-term) exposure such as the cancerpotency factor (Q1*), Acceptable Daily Intake (ADI), chronic Population AdjustedDose (cPAD) or other chronic Reference Dose (RfD). If acute exposures are to beevaluated, an acute toxicological endpoint such as the No Observed Effect Level(NOEL), acute Population Adjusted Dose (aPAD) or acute Reference Dose (aRfD)from a study in which animals were dosed for short periods of time will be required.The DEEM software will prompt the user for these values.
(3) adjustment factors directly relevant to potential constituent levels in the diet to moreaccurately reflect likely exposures. These adjustment factors can include percent ofthe crop treated, percent imported, impact of processing, etc.
DEEM expresses the potential risk relative to either the chronic or acute PAD, RfD (ADI) orNOEL (acute or chronic) selected by the user. It also is capable of expressing the exposure inrelation to the results of cancer studies. The slope of the dose-response in cancer studies (calledthe Q1*) is used to calculate a dose level relevant to a chosen probability value from a cancerstudy. Specifying the Q1* will permit a determination of the probability for increased risk ofcancer. In this case, the results will be an estimate of the relationship between the population’sexposure and the probability of increased incidence of cancer.
As a crop item is processed into foods, the constituents may preferentially segregate into onefraction rather than be distributed equally into the various subparts of the item. For example, oil-soluble surface residues may remain in the peel. Thus, the residue level in peeled fruit may belower than in the whole, unpeeled fruit. Similarly, the resulting concentration in peanut oil maybe higher than the concentration in the whole peanut. To address this situation, DEEMmultiplies each food consumption estimate by up to two “adjustment factors” designed to allowbetter matching of the residue data with food consumption data. For example, raisinconsumption is expressed in terms of consumption of actual raisins. If chemical residuemeasurements were made on fresh grapes, an adjustment factor should be applied to account forthe chemical concentration resulting from water loss. This adjustment factor will moreaccurately estimate potential exposure from residues in raisins. DEEM contains defaultadjustment factors to equate processed food consumption to equivalent fresh quantities. Asecond use of adjustment factors is to modify exposure estimates to reflect the percentage of acrop that is expected to contain residues (often called “percent crop treated”). A discussion ofthe default adjustment factors is provided in Chapter 5.
NOTE: In the manual, words in <X Y Z> indicate that a specific key should be pressed.For example, <Enter> indicates that the “Enter” key should be pressed; <Tab> indicatesthat the “Tab” key should be pressed.

DEEM Users Manual©2000 Novigen Sciences, Inc.
2 - 1
CHAPTER 2. PROGRAM INSTALLATION
The DEEM computer programs and supporting data are supplied with this manual on one CD-ROM and one diskette. If licensed, the RDFgen™ module and Pre-extracted PDP data aresupplied on three additional CD-ROMs. The DEEM program can be used on any computersystem equipped with a Windows 95®, Windows 98®, or Windows NT 4® operating system, aCD-ROM drive, and a hard drive. Additionally, in order to use the RDFgen™ module,Microsoft Excel 97® must be properly installed on the computer system. Any compatible printercan be used to print DEEM analysis reports.
The display requirements for running the programs are:
Desktop area 800 x 600 pixels, screen area also at 800 x 600 pixels (if separate setting isavailable), and small system fonts. To change setting, open “Control Panel” from theWindows 95 environment, then open “Display,” then select the “Settings” tab, thenmove Screen area (if available) and Desktop area to show “800 x 600.” On the samescreen, make sure that “Small Fonts” are selected under “Font size.” Colors should be setto 256 or higher.
A Pentium , Pentium II , or Pentium III processor is not required, but will significantlyincrease the speed of DEEM Acute analyses, which must read through and process daily foodconsumption records for many thousands of participants. A faster processor is especially usefulif you are conducting Monte Carlo analyses with the DEEM Acute analysis module. Also, thelarger the amount of memory available to DEEM (total system RAM, less memory utilized byother running applications), the faster the analyses will run.
2.1 INSTALLATION OF MAIN MODULES
The files on the DEEM CD-ROM(s) and diskette may be copied for archive purposes;however, this program is licensed for the designated site only. It is a violation of the UScopyright law to copy the DEEM programs or any supporting files or to duplicate them on anymedia for resale or distribution to any user outside the limits of the contractual arrangements.Store the CD-ROM and diskette in a safe place.
To install DEEM (including the Residue File Editor and the Acute and Chronic analysismodules):
1) Insert the CD-ROM labeled “DEEM ” into the CD-ROM drive. At the Windowsstart menu, click on the “Run” option. Type
E:\setup

DEEM Users Manual©2000 Novigen Sciences, Inc.
2 - 2
where E is the drive letter of your CD-ROM drive (typically D or E). (Setup may request thatyou restart your computer and then manually initiate Setup for a second time. This is normal,and allows necessary system files to be updated.) At this point, the “DEEM Setup” windowshould appear. After reading the reminder to close open applications, click “OK”. Click thelarge button in the “DEEM Setup” window to continue the installation (in doing so you areaccepting the default installation path of C:\Deem). The installation program will finish; click“OK” in the confirmation dialog box.
2) Using Windows® Explorer or the DOS copy utility, copy all files from
E:\DEEM Supporting Files
(where E is the drive letter of your CD-ROM drive) into the C:\Deem directory. Overwrite anyexisting files if prompted. Do not copy the “DEEM Supporting Files” folder itself; copy onlyits contents.
3) Using Windows® Explorer or the DOS copy utility, copy your company’s license file(Deem.cst) as well as the setup file (Setup96.fil) into the C:\Deem directory. These twofiles can be found on the floppy diskette labeled “DEEM™ License Activation Files,” orin the program directory of a previous installation of DEEM™.
4) The final step is to create the food consumption directory. Using Windows®Explorer, copy the entire
E:\NSIFood
directory (where E is the drive letter of your CD-ROM drive), including the “NSIFood” folderitself, into C:\. This will create a folder called
C:\NSIfood
containing the 36 files listed in Table 2.2. The path to this food consumption directory must bespecified in the Setup module of DEEM (discussed in the following section) before you runany analyses.
For reference, Table 2.1 identifies the DEEM program and supporting files required in theC:\DEEM directory for a complete installation:

DEEM Users Manual©2000 Novigen Sciences, Inc.
2 - 3
TABLE 2.1
DEEM PROGRAM AND SUPPORTING FILES
Deem.cstSetup96.filAcute7.exeAcuten.exeCATNAM16.FILCATNAM96.NCGChronic7.exeConvert96.exeCROPGRP.RANdeem.exeFFORM92N.RANFFORMN.RANFFORMS96.RANFOODS92N.RANFOODS96.RANFOODSN.RANFOODST96.RANINDEX96.RACMapallc.txtMEAN96.RANMN8992N.RANMNFF396.RANMNFF92N.RANNFBW.RANRdfdoc.exe

DEEM Users Manual©2000 Novigen Sciences, Inc.
2 - 4
TABLE 2.2
FOOD CONSUMPTION FILES
ACUTE89N.1ACUTE89N.2ACUTE89N.3ACUTE90N.1ACUTE90N.2ACUTE90N.3ACUTE91N.1ACUTE91N.2ACUTE91N.3ACUTE94.1ACUTE94.2ACUTE94.3ACUTE95.1ACUTE95.2ACUTE95.3ACUTE96.1ACUTE96.2ACUTE96.3ACUTLN89.1ACUTLN89.2ACUTLN89.3ACUTLN90.1ACUTLN90.2ACUTLN90.3ACUTLN91.1ACUTLN91.2ACUTLN91.3ACUTLN94.1ACUTLN94.2ACUTLN94.3ACUTLN95.1ACUTLN95.2ACUTLN95.3ACUTLN96.1ACUTLN96.2ACUTLN96.3

DEEM Users Manual©2000 Novigen Sciences, Inc.
2 - 5
2.2 INSTALLATION OF RDFGEN™ MODULE WITH PRE-EXTRACTED PDP DATA
To install the RDFgen module:
Insert the CD-ROM labeled “RDFgen ” into the CD-ROM drive. At the Windows start menu,click on the “Run” option. Type
E:\setup
where E is the drive letter of your CD-ROM drive (typically D or E). (Setup may request thatyou restart your computer and then manually initiate Setup for a second time. This is normal,and allows necessary system files to be updated.) At this point, the “RDFgen Setup” windowshould appear. After reading the reminder to close open applications, click “OK”. Click the largebutton in the “RDFgen Setup” window to continue the installation (in doing so you are acceptingthe default installation path of C:\Program Files\Novigen\RDFgen\). The installation programwill finish; click “OK” in the confirmation dialog box.
The RDFgen™ Input Generator Excel Add-in allows for automatic creation of RDFgen™cumulative and individual analyte mode input spreadsheets from the “All Fields” formatted Pre-Extracted PDP data based on criteria applied to any of the available data fields using theMicrosoft Excel® AutoFilter function. To install the RDFgen™ Input Generator Excel Add-in,launch Excel® from the Start menu. From the Excel™ menu, select Tools!Add-Ins. In theresulting Add-ins window, click the Browse button. Browse to E:\ Input Generator Excel Add-in(where E is the drive letter of your CD-ROM). Double-click on “RDFgen Input Generator.xla”.Click Yes when prompted, “Copy ‘RDFgen Input Generator.xla’ to Microsoft Excel Add-inLibrary?” Click OK in the Add-ins window, and OK again when confirmation message verifyingadd-in installation appears. A “Create RDFgen Input Spreadsheet…” command will now bepresent in the Tools menu of Excel®.
If desired, you may use Windows Explorer to create a shortcut to C:\ProgramFiles\Novigen\RDFgen\RDFgen.exe on your desktop. The RDFgen™ module can also belaunched using the menu command in the DEEM™ main screen.
The “All Fields”, “Individual Analyte Mode”, and “Cumulative Mode” formats of the Pre-Extracted PDP data may be used directly from the CD-ROM, from a network share (see yournetwork administrator if this interests you), or they may be copied to the directories of yourchoice on your hard drive using Windows Explorer. It is recommended that you have at least 1gigabyte (GB) of free disk space on your hard drive if you select the latter option. If you do copythe Pre-extracted PDP data sets to your hard drive, you may wish to create a directory structuresimilar to this: “C:\PDP DATA\”, which contains “C:\PDP DATA\94-7 All Fields\”, “C:\PDPDATA\94-7 Ind Analyte Mode Inputs\”, and “C:\PDP DATA\94-7 Cumulative Mode Inputs\”.Note that RDFgen™ always “remembers” the directory from which you last opened an inputspreadsheet, reducing the need to repeatedly browse to the pertinent directory.

DEEM Users Manual©2000 Novigen Sciences, Inc.
2 - 6
2.3 GETTING STARTED
DEEM.EXE is the main program module for the DEEM programs. There are several ways tolaunch DEEM.EXE. You may click on the DEEM icon in your Program menu, or runC:\DEEM\deem.exe (where C:\DEEM is the directory you specified during DEEM Setup) fromyour “Run” window. A shortcut to DEEM.EXE may also be created on the Windows® desktop.This allows DEEM to be launched by double-clicking its desktop icon. (You can even startDEEM from the DOS prompt in the \deem directory by typing “DEEM” and pressing the<enter> key. Of course, you must still have Windows installed on your computer for this towork, since DEEM™ is Windows -driven).
Once the initial screen has appeared, the DEEM program logo and licensing information willbe displayed. The following functions are accessed from the menu bar across the top of thescreen:
FileAnalysisRDFgen (note that this is an optional module)RDFdocHelp
Click on “File” then “Set Up” to establish the default directory locations for the residue analysisfiles that you will be building and saving, and the location of the food consumption files (usuallylocated in a separate file directory) required to run the DEEM Acute Analysis program module.Screen 2.1 will appear.

DEEM Users Manual©2000 Novigen Sciences, Inc.
2 - 7
Screen 2.1: Setup Variables Screen
Enter the name of the directory where you would like the residue files that you will be creating tobe saved; next, enter the name of the directory where the food consumption files are located.Also, indicate the number of lines per page that will accommodate your printer. You have theoption of including page breaks in reports that are generated by DEEM . The Setup VariablesScreen also requires identification of a printer port. You have the option of including the sourcedocumentation in your residue file. The comment documentation is an optional feature whencreating the residue file. It permits a limited amount of documentation for identifying residuedata sources. This feature will be discussed in detail in Chapter 5, Building Analysis Files. Theuser has the option to display the acute exposure percentiles in ascending or descending order.Finally, the path for RDFgen™ may be specified. Once information has been entered click onthe “OK” button. The Main menu then will be displayed.
Note that, if a menu bar item is grayed out, it is an indication that the menu bar item is notavailable at that time. In most instances where an “OK” or a dialog box is displayed with “Yes,”“No,” and/or “Cancel,” you must respond appropriately to the requested input before you cancontinue with other functions.

DEEM Users Manual©2000 Novigen Sciences, Inc.
2 - 8
Other options available from the File button include:
Residue File Editor to create, edit, save, or print a residue analysis file. A residueanalysis file is required when running either the Chronic or the Acute Analysis modulesof the DEEM program. The procedures for creating the residue files for use in thechronic and acute risk assessments are discussed in Chapter 5, Building Analysis Files.
Exit returns you to your operating system.
The menu bar also contains an analysis button and a help button. The analysis button gives theuser the option of running a chronic or acute dietary exposure analysis.
Help explains each item on the menu bar and provides a discussion concerning basic backgroundinformation on the program.
Two additional programs may be accessed from the menu bar, RDFgen™ and RDFdoc.
The RDFgen™ module of DEEM™ automates residue distribution adjustments and the creationof summary statistics and residue distribution files using the RDFgen™ Pre-extracted PDP datasets or user-supplied data. Using the Residue File Editor, the mean value of an adjusted residuedistribution calculated by RDFgen™ can be entered for a chronic risk assessment, or an RDF filegenerated by RDFgen™ can be referenced for an acute risk assessment. RDFgen™ can alsoperform adjustments to the residue levels in order to generate cumulative RDF files. RDFgen™will allow the user to do these analyses automatically using the PDP data for samples that havebeen tested for multiple analytes or manually using user-supplied data. RDFgen™ is an optionalmodule.
RDFdoc provides a convenient way to display residue distribution files (RDFs) used in theMonte Carlo acute analyses.
Any menu bar item may be accessed by simultaneously pressing <Alt> and the underlinedcharacter.

DEEM Users Manual©2000 Novigen Sciences, Inc.
3 - 1
CHAPTER 3. VALIDATION OF PROGRAM INSTALLATION/OPERATION
Novigen has provided you with four residue files (labeled TOLERANCE7.RS7,CHRONIC7.RS7, ACUTE7.RS7 and ACUTEMC7.RS7) and a number of residue distributionfiles (RDFs). Also provided are results from chronic and acute analyses (with and withoutMonte Carlo simulations) using these residue files. These examples will be used throughout thismanual to demonstrate the program applications and subsequent interpretation of the analyses.
These files also will be used to confirm that the installation of the program has been successfuland that the results obtained using your program are the same as those produced by the masterprogram.
The residue files and corresponding results are located in the “DEEM QA Files” directory on theCD-ROM labeled “DEEM ”.

DEEM Users Manual©2000 Novigen Sciences, Inc.
4 - 1
CHAPTER 4. GUIDELINES FOR CONDUCTING EXPOSURE ASSESSMENTS
4.1 INTRODUCTION
The DEEM™ Software can be used to estimate dietary intake of toxicants, nutrients, pesticides,food additives, and natural constituents -- in short for any component of food or water. Theseagents can include inorganic and organic chemicals as well as microorganisms or toxinsproduced by microorganisms, whether naturally or synthetically created.
The mere presence of a substance in the food supply does not imply any adverse healthconsequence. In fact some substances of interest are essential nutrients; however, virtually allagents are toxic at some dose. Even essential nutrients may be toxic, albeit it at levels that arehigher than the levels that are essential. Exposure levels should guide the understanding of thesignificance of the presence of any agent in the diet. Although the interpretation of the resultsmay be different, the methodologies for estimating exposure are similar for toxins, nutrients andmicroorganisms.
Agents can be found in food and water either as a result of absorption from the household air,surface transfer, or from other activities in the home. Food and water also can come in contactwith agents outside the home. In addition, agents can be ingested from transfer from theenvironment to the hands and then to the mouth. Thus, it is possible, and in fact likely, that therewill be multiple sources of the agent.
Ingestion will contribute varying amounts to exposure since foods will contain different amountsof each agent on different days. And finally, the diets of individuals vary--both betweenindividuals and in the same individual from day to day.
The goal of the exposure assessment should be to characterize the exposure of the population ofconcern and to identify the variability in that exposure. This chapter will guide the assessorthrough the components of a dietary exposure assessment.
4.2 OVERVIEW OF INGESTION METHODS
Typically, the primary objectives are to estimate the level of ingestion of the agent and to identifythe sources of both variability and uncertainty in the estimate. In addition, the intake estimatemay be useful in aggregate exposure assessments to identify the potential importance of dietrelative to other pathways of exposure and to indicate where consumption of a particular foodcommodity or other dietary characteristic (i.e., age, regional and ethnic preferences) wouldindicate the potential for unique exposure patterns.
DEEM Users Manual©2000 Novigen Sciences, Inc.
4 - 2
In order to assess the ingestion pathway to total exposure, three types of data are required:
(1) potential constituent levels in food and water, (2) frequency of occurrence of theagent in food, water or on the hands, and (3) amounts of foods that are consumed bythe population being evaluated.
The selection of the most appropriate methodology will depend upon (1) the intended applicationfor the exposure assessment, (2) the biological properties of the constituent, (3) the physical andchemical properties of the agent, (4) the route of entry into food and water, and (5) relativecontribution of ingestion to overall exposure. Some of the important considerations for each ofthe five areas are discussed below:
1. Intended application of the exposure assessment
The purpose of the assessment will play a critical role in determining the mostdesirable methodology. Different methods will be desirable if the assessment isdesigned to be conservative (as is often the case for regulatory decision-makingapplications) rather than if it is designed to be as realistic as possible. Someapproaches, such as those that assume the food supply contains tolerance-levelresidues are designed as “screening” methods. The assumption that foods containresidues at the maximum legal limit produces a worst-case intake estimate (oftencalled the theoretical maximum daily intake (TMDI)), that dramaticallyoverestimates exposure. Although it can be very useful for preliminaryassessments, it is not reliable as an estimate of actual intake for use in establishingpriorities or for designing sampling programs. Screening methods and model dietmethods for assessing exposure sacrifice accuracy for speed, simplicity, and areknown to be over-estimations of exposure. In the case of the evaluation of toxiceffects, results that predict that intakes will be less than an acceptable daily intakelevel (ADI) are assumed to mean that exposures will be acceptable. Thus, it canbe assumed that there is no need to expend resources to collect better data or toapply more sophisticated techniques in search of greater accuracy. More realisticestimates usually will be needed before final regulatory decisions are made.Research projects designed to evaluate the cause-effect relationship of an agentand a disease require more accurate exposure assessments.
2. Biological properties of the agent
The length of dosing that is required to elicit a specified biological effect shoulddefine the key exposure assessment parameters. That is, the biological effects thatare the result of a single or, at most, few doses should be compared to dietaryexposure on a single day. Correspondingly, toxic effects that arise as a result oflong term exposure will be compared to average dietary exposures (usually over ayear).

DEEM Users Manual©2000 Novigen Sciences, Inc.
4 - 3
Other considerations include: (1) whether any breakdown products oftoxicological significance are produced and (2) metabolic pathways in plant andanimal systems. Potential biological effects must be carefully considered inplanning an exposure assessment. Factors of interest include dose-responserelationships, the length of exposure required to produce an adverse effect,potentially sensitive populations, and variability and uncertainty factors.
3. Physical and chemical properties of the agent
Often when estimating intake of a substance in food, it is necessary to define orcharacterize the substance in terms of attributes such as structure, volatility, andsolubility since complete data typically aren’t available. Questions of concern thatare related to the agent’s properties once in the food or water include: Does thesubstance break down during storage? During processing? During cooking?
Physical properties of the agent that may be evaluated include 1) particle size,2) presence in household air, 3) surface to hand transfer , and 4) rates ofdeposition in food or water.
Because our diets are highly processed, it will be critical for most assessments toinclude estimates of the residues in the products as they are consumed (Chin, 1991and Elkins, 1991). The DEEM software is designed to allow this information tobe added as an adjustment factor.
4. Route of entry of the agent into food and water
The origin of an agent in food is important to consider when selecting the foods tobe included in the analysis and to identify the most appropriate information aboutlikely concentrations. For example, is the agent naturally occurring? Is the agententering the food prior to the food entering the home? Or does it enter the food asa result of activities within the home?
Concentrations of a substance may vary due to differences in the cultivation,season, or region of growth, but the substances generally would be expected tooccur at some level in all raw plants or uncooked meat of the same type (anexception would be nutrients or other natural toxins bred into plants by geneticengineering). The extent to which the compound will be present in processedforms of the relevant foods depends on volatility and breakdown characteristics ofthe chemical and its metabolites.

DEEM Users Manual©2000 Novigen Sciences, Inc.
4 - 4
Often it is possible to determine the foods that may contain the agent byevaluating source and transport information for the agent. If it is possible to groupfoods into categories it may be possible to extrapolate data for one food to otherfoods for which data are not available. For example, if the constituent level inoranges is expected to be similar to that in grapefruit, it would then be possible toconduct the exposure analysis for “citrus.” These food categories can then beused to select the most appropriate food consumption data for the assessment.
5. Contribution of diet to aggregate exposure
Typically when dietary intake is to be integrated into exposure from other routes, screeningmethods will be too crude and will need to be replaced with more accurate estimates of intake.In those instances even preliminary (range-finding) assessments may require more refinedestimates of the concentrations in those foods that appear to be contributing most to thetheoretical exposure estimates. It may also be desirable to include information about the effectsof processing or cooking.
4.3 EXPOSURE ASSESSMENT MODELS
There are four general exposure assessment models: point estimate, simple distribution, MonteCarlo-type probabilistic, and multiple chemical exposure.
A. Point Estimate
A point estimate of exposure to a specific chemical by a particular population is a broadestimate generated using one number to represent concentration of the chemical in eachfood and one number to represent intake of these foods by that population. In estimatingchronic exposure, the arithmetic mean of residue concentrations is most commonly used;however, if the distribution of pesticide concentrations is known to be skewed, use of themedian (or 50th percentile) concentration is more appropriate (Mosteller and Tukey,1977). Exposure to acutely toxic chemicals frequently is assessed using the 95thpercentile residue concentration in order to produce a "worst-case" estimate.
Typically, the most basic models combine data on average intake and averageconcentration levels of the agent to estimate average exposure. Average chronicexposure usually is estimated on a per-capita consumption basis and is compared to themeasure of biological/toxicological results from life-time animal feeding studies or otherappropriate test results.

DEEM Users Manual©2000 Novigen Sciences, Inc.
4 - 5
B. Simple Distribution
Single day or "acute" exposures may be computed using similar methods but using foodintake data for a single meal or for a single day. Acute exposures are usually compared toresults of tests in which subjects were dosed for a single day. A simple distribution ofexposure can be calculated by either of two procedures: (1) a single number chosen torepresent concentration of the substance in each of the foods of interest may be applied toa distribution of intake levels for each food, or (2) a single number chosen to representfood intakes can be applied to a distribution of toxin concentration values.
Current US EPA policy is to utilize a tiered approach in assessing acute dietary exposure.The Tier 1 analysis utilizes the entire consumption distribution and a single upper-boundresidue value (usually the tolerance or highest average field trial (HAFT) residue) for allfoods included in the analysis. In the Tier 2 analysis, a single upper-bound residue valueis used for those commodities considered to be single-serving foods (e.g., a raw apple oran orange); mean field trial residues (or 95th percentile residues from pesticide monitoringdata) are used for processed or blended commodities (e.g., grains, oils). (Tiers 3 and 4are discussed below.)
To illustrate models that use a distribution, the tomato consumption distribution from the1989 through 1991 CSFII is presented in Table 4.1. This analysis includes all tomatoproducts that were reported as consumed. Combining this with a single residue valuewould produce a simple distribution of exposure.
-----------------------------------------------------------------------------------------------------
Table 4.1 Distribution of reported tomato consumption by the US population in the1989-91 USDA Continuing Survey of Food Intake for Individuals (including wholetomatoes, catsup, puree and sauces)
GRAMS CONSUMPTION/KGBW/DAY
Mean/user 1.4
Percentiles:90 3.395 4.599 7.6
99.9 13.4
C. Monte Carlo-type probabilistic assessment utilizing both the anticipateddistributions of residue levels and the distribution of food intakes
Joint distribution analysis (usually referred to as Monte Carlo Analysis) relies onsophisticated calculations to allow combination of representative data using a distribution

DEEM Users Manual©2000 Novigen Sciences, Inc.
4 - 6
of toxin concentrations and a distribution of food intakes. In joint distribution analyses,best-case and worst-case scenarios of intake are shown on the same table or graph to bereviewed simultaneously.Monte Carlo analyses characterize a population’s exposure based on data on a randomsample from that population. In calculating the joint distribution, the Monte Carloapproach assumes that both the residue and consumption distributions belong to aparametric family (e.g., normal or lognormal).
Calculations are performed as follows:
1. Random samples (size depending on the number of iterations) are generatedfrom the residue distributions.
2. Each value from the sample of consumption values is multiplied by each valuefrom the sample of residue values.
Steps (1) and (2) are repeated thousands of times, and the resulting distributions aremerged together to produce an estimate of the exposure distribution.
In creating a joint distribution to estimate exposure, the distribution of food consumptionis combined with the distribution of agent concentration levels. Joint distributionprobabilistic analyses allow the most realistic estimates of exposure.
EPA’s Tier 3 acute analysis approach incorporates the entire consumption distributionAND the entire field trial residue distribution for single serving foods; mean field trial (or95th percentile monitoring) residues are used for processed/blended commodities. TheTier 3 analysis also may incorporate percentages of the crop that may be treated with thechemical of interest. EPA’s Tier 4 analysis utilizes the entire consumption distributionand residue distributions from statistically designed market basket surveys.
D. Exposure to Multiple Chemicals
Estimates of combined exposure involve considerations not required for exposure to onechemical. Residues of chemicals cannot be simply summed for use in exposureassessment; the chemicals may have different toxic effects and/or different potencies.One approach is to standardize the residue data by applying a toxicity equivalency factoror TEF to convert to a common activity level. The chemicals may also have differentprocessing factors, requiring a Processing Coefficient to be applied separately to residuevalues for each chemical to achieve normalization. The RDFgen™ Cumulative Modeincludes automation of the application of these factors/coefficients, as well as the abilityto perform multiple chemical Percent Crop Treated Adjustment accounting forprobability of concurrent treatments, and multiple chemical decompositing. Output fromRDFgen™ Cumulative Mode includes a cumulative Residue Distribution File for thecommodity of interest, suitable for immediate use in the DEEM™ Acute Module.

DEEM Users Manual©2000 Novigen Sciences, Inc.
4 - 7
4.4 MEASUREMENT OF POTENTIAL EXPOSURE PATTERNS OF SUBGROUPS(INFANTS, CHILDREN, REGIONS, ETC.)
For most purposes, it will be desirable to assess both the overall population's intake andthe intake for selected population subgroups. For example, infants diets, on average,contain a higher proportion of ingredients that are often used in commercially-preparedinfant formulas. These ingredients include soy protein isolate and oil, coconut oil, lactose(milk sugar) and water. Infants also have a much higher intake of water/per unit bodyweight than do others in the population. In contrast, they eat no broccoli. Their rawapple consumption is minimal; however, they do eat substantial amounts of processedapples and apple juice. For young infants, an important source of exposure to fat-solubleand other environmental agents is human breast milk, which is not included in the USDACSFII consumption database.
Children from 1 to 6 years of age also have a higher intake of many fruits and vegetables(on a gram per kg/bw basis) than do older members of the population. They also eatsignificant quantities of peanut butter. Both infants and young children consume largequantities of milk. (Note that in the DEEM program, milk is broken into 4 categories:nonfat solids, fat solids, milk sugar (lactose) and milk-based water. This was done toavoid double counting when a component of milk is consumed alone. Examples includemilk-fat solids in butter, milk sugar in infant formula, non-fat solids in yogurt, etc.) Allpopulations have increased their consumption of corn sugar in the past 10 years—mostlikely due to changes in the sugar content of many commercially prepared foods.
Other subgroups of the population also report differences in the foods they eat. Forexample, based on data from the 1989 through 1991 CSFII, the Hispanic subgroupsconsume more corn and less wheat than other ethnic groups. Fortunately, the US nationalsurveys identify key demographic information so that subgroup analysis is feasible.
The method of assessing exposure may depend on whether the population in question isconsidered to be particularly vulnerable to the agent. Concern over children’s exposure totoxins, especially to pesticides, prompted the US Congress to request the NationalAcademy of Sciences, National Research Council (NAS-NRC), to conduct a thoroughreview of scientific and policy issues concerning pesticides in the diets of infants andchildren. The NAS-NRC committee recommended that methods be developed forevaluating distribution of exposure in vulnerable populations, for assessing exposurefrom all foods combined rather than from individual commodities, and for assessingcombined exposure from pesticides with similar toxic effects (NRC, 1993). A number ofsophisticated new methods for assessing exposure have been developed in response tothese recommendations.

DEEM Users Manual©2000 Novigen Sciences, Inc.
4 - 8
4.5 TECHNIQUES TO ASSIST IN DEFINING THE EXPOSURE SCENARIO
In addition to magnitude and frequency, sources of exposure must be defined. It isdesirable to know how the agent entered the food supply and the time frames that areinvolved. It is important also to know whether the dietary exposure is correlated withother routes of residential exposure or whether it arises due to a separate source.
The following will help to define the most appropriate exposure scenario:
• Identify the regulatory standards that apply to the agent. For example,permitted uses of a pesticide on food crops.
• Determine the characteristics of intended or accidental additions of the agentto the food supply. Determine the impact of processing/cooking and storageof foodstuffs on the final levels of the agent.
• Identify and evaluate existing data for both the levels of the agent and for theappropriate food consumption estimates.
• Create draft exposure assessment algorithms that define the parameters to becomputed and the models to be used to estimate exposure. If appropriate,develop a tiered methodology that allows a sequence of analyses from “rangefinding” to detailed probabilistic exposure assessments.
• Conduct appropriate preliminary exposure assessments including “sensitivityanalyses” to assist in defining the parameters that need the best available dataand/or additional data generation.
A. Sources of the Substance
The substance of interest may be present in or on food accidentally due to environmentalfactors such as air pollution, water pollution, accidental contamination, or microbialcontamination. The presence of agents from such sources would be expected to varysignificantly depending on geographic location or other factors. Biological agents, onceentering the food supply may increase or decrease depending upon growth characteristics.
Agents present in food may be there incidentally, added indirectly to foods as a result ofmigration from packaging or a processing step. In general, agents incorporatedincidentally are more likely to be present in processed foods than in raw agriculturalcommodities.
Agents may be present in or on food because they were added deliberately during somephase of production or processing of food.

DEEM Users Manual©2000 Novigen Sciences, Inc.
4 - 9
B. Quantifying the Concentration of the Substances
The analyst's goal is to characterize the concentration of the agent in each food. Priorityshould be placed on foods that contribute most to exposure. To assess exposure to asubstance, it is important to consider not only the average concentrations in foods, butalso the variability of the constituent level.
Existing data may be used to estimate exposure and to guide the collection of future data.A substantial amount of information that is relevant to exposure assessment, and hencerisk assessment (Graham et. al., 1992 and Sexton et. al., 1992), is available for somecompounds. Such information can be obtained from existing databases on food anddrinking water consumption and contaminant residues normally maintained for otherpurposes (nutritional intake or regulatory surveillance). The US FDA Total Diet Study(Pennington and Gunderson, 1987), USDA Nationwide Food Consumption Survey(NFCS), NCHS National Health and Nutrition Examination Surveys (NHANES), as wellas federal and state regulatory monitoring programs, for example, provide informationuseful for dietary exposure modeling and assessments.
1. Useful information for defining those foods having the highest potentialconcentration of the agent includes:
a. Chemical characteristics
i. Solubilityii. Heat stabilityiii. pH stabilityiv. Other chemical properties
b. Metabolites/degradates of potential concern - evaluation of structure ofparent
c. Levels in raw versus cooked food
d. Levels in home-prepared versus commercially-processed foods
e. Time frames for presence of agent in the food supply or in categoriesof the food supply—continuously, periodic intervals
f. Impact of processing/home preparation on potential residues
2. Market basket and surveillance sampling
The US and other countries conduct various types of monitoring orsurveillance for agents in commodities or in foods. Monitoring and

DEEM Users Manual©2000 Novigen Sciences, Inc.
4 - 10
surveillance studies are conducted to assess compliance with state,national or international regulations.At the US federal level, USDA monitors residue levels in domestic andimported meat and poultry products, and FDA monitors residue levels inall other foods. California, Florida, and a number of other states havemonitoring programs; a national database, FOODCONTAM, incorporatesdata from monitoring programs in ten states (Minyard and Roberts, 1991).These programs monitor for pesticides, veterinary products, heavy metalsand nutrients. Not all programs monitor for all classes of compounds.There is little surveillance for microbiological agents except when there isreported illness. The various monitoring programs are described in greaterdetail in the following sections.
Depending on the specific US monitoring program, foods or commoditiesmay be sampled at the point of entry to the country, at the farm gate, at thefood processing plant, or at the retail level. Since it is logistically andeconomically impossible to analyze each and every shipment of every foodand commodity, studies are often conducted on target samples suspected tobe out of compliance. While the resulting data are not statisticallyrepresentative, they may be useful for "range finding" studies.
Market basket surveys are conducted in the US and other countries toobtain food chemical concentration data that may be used in exposureassessment. A core group of foods representative of national dietarypatterns is obtained and analyzed to determine the concentrations of thesubstances of interest. Generally, samples of food are purchased at retailoutlets in different regions of the country and prepared as for consumption.
The US FDA Total Diet Study
Since 1961, the US FDA has conducted a yearly market basket survey, theTotal Diet Study (TDS). Although not statistically based, the TDS doesyield data useful in exposure assessment. Samples of 265 foods chosen torepresent the US food supply are collected four times each year, from threecities in each of four US regions. Samples of individual foods from thesethree cities are composited for analysis. Because the TDS uses only a fewhundred foods to represent thousands of foods, results must be interpretedcautiously. The multi-residue methods of analysis are capable of detectingover 200 pesticides and industrial chemicals, radionuclides, and essentialand toxic elements, including arsenic, lead, cadmium and mercury.Estimates are made of the intakes of various age/sex groups based onconsumption data from USDA's Nationwide Food Consumption Survey(NFCS, USDA, 1981) and NCHS' National Health and NutritionExamination Surveys (NHANES, NCHS 1982). The TDS diets are
DEEM Users Manual©2000 Novigen Sciences, Inc.
4 - 11
aggregated so that the food items collected are representative of all foodconsumed in the US. For example, apple pie represents not only all thevarious types of apple pies (homemade, bakery, fast-food, frozen, deepdish, apple with raisin, apple with cheese, and so forth) but all fruit pies,strudels, crisps, turnovers, and pastry with fruit (Pennington, 1983). TDScould provide the framework for a national dietary exposure monitoringprogram with enhancements to the sampling design and the addition ofmore foods and contaminant analysis (FASEB, 1993). Concentration dataon the foods sampled can be used as reference points in designing roughexposure assessments—especially for guiding subsequent studies.
Consumption Data: NFCS and NHANESAlthough both surveys contain a dietary intake component, they are quitedissimilar in purpose and in elements other than dietary intake. Thepurpose of the NFCS is to "measure the food and nutrient content of thediet and the money value of food used by US households and the food andnutrient intakes at home and away from home of individuals" (NRC,1989). The purpose of the NHANES is to "develop information on thetotal prevalence of a disease condition or a physical state; to providedescriptive or normative information; and to provide information on theInter-relationships of health and nutrition variables within the populationgroups" (NRC, 1989).
For a variety of reasons the USDA National surveys provide data that arequite appropriate and useful for assessment of exposure to food toxins:
• Foods coded are numerous and very specific. More than 6000different foods have been reported as consumed in at least one year ofthe surveys between 1987 and 1994.
• Foods are coded in a hierarchical structure, allowing easy aggregationand disaggregation of data in estimating exposure.
• Data on multiple days of intake allow estimation of acute or chronicexposure. (Calculation of usual exposure from data collected onconsecutive days is complicated by the non-independence of intakesover these days. This limitation has been corrected in the 1994 andlater years of the CSFII. For these survey years, data were collected ontwo non-consecutive days.)
• Distributions of intake may be calculated.
• Data on age, sex, race, region, season, pregnancy and nursing statusallow exposure estimation for a wide variety of subpopulations.

DEEM Users Manual©2000 Novigen Sciences, Inc.
4 - 12
• Body-weight data allow exposure estimations per unit body weight.
C. Validity, Reliability, and Sources of Error
The national consumption surveys and food monitoring programs are powerful tools forassessing dietary exposure and evaluating status and trends. One must realize these dataare not intended to represent the true diets of all people at all places and that applyingthese data too broadly may result in false conclusions or poor estimates in dietaryexposure for specific populations. The factors affecting the exposure of an individual orsmall subset of the population to a specific pollutant are not evaluated by using a nationalaverage diet and nationwide residue monitoring data (Lioy, 1990). Market-basket surveysreveal little about unique, individual dietary practices that vary from the US norm, such asthose of small children living in lead-laden homes. Care must be taken in the applicationof these data for specific situations, such as when evaluating residential exposures.
The process of preparation, storage and consumption of foods in the residence or othereating places can affect an individual's exposure. Such factors are normally not includedin risk assessment because they are not well understood or documented. Contamination offood occurs beyond the production and retail distribution system. Additional exposuremay come from non-retail food sources such as home-grown food or fish/game. Pesticideuse in the residence can be an important source of food contamination; bug bombs orfoggers can contaminate both foods and the surfaces they contact (Sheldon et. al., 1994).Soiled cooking utensils and dinnerware, food hygiene practices, and food contact withdusty surfaces contribute to excess dietary exposures. A better understanding of theinteractions of foods with other contaminated media, such as the addition of contaminatedwater and contacts with contaminants in air and on surfaces during preparation, is neededso that the importance of other contaminated residential media on dietary exposure can bebetter assessed. It is important to have an overall understanding of the exposure scenariosthat lend most to contamination of foods and beverages and hence, excess dietaryexposures. In general, market basket surveys do not measure levels of contamination infoods "as consumed." In many scenarios, personal dietary measurements are neededwhen market-level monitoring cannot discern exposures for specific microenvironments,such as a residence, or when comparisons to directly measured exposures from otherpathways are required.
4.6 GUIDELINES FOR REPORTING THE RESULTS
A. Clearly identify and reference the data and software used in the analysis.
B. Fully describe the methods and assumptions that were used for samples withresidues below the LOD.

DEEM Users Manual©2000 Novigen Sciences, Inc.
4 - 13
C. Explain the uncertainty of the results. Regardless of the exposure analysis modelused, the uncertainty associated with exposure estimates should be evaluated andpresented. Uncertainty can be characterized qualitatively, i.e., the thoughtprocesses used to select or reject specific data, or quantitatively, i.e., ranges ofexposure (EPA, 1992). Uncertainty may result from missing or incomplete data;measurement or sampling error, or use of surrogate data, gaps in scientific theoryused to make predictions, and how well the theory or model represent the situationbeing assessed. Analysis of uncertainty provides decision makers withinformation concerning potential variability in exposure estimates and the effectof data gaps on exposure estimates.
D. Clearly note related assumptions.

DEEM Users Manual©2000 Novigen Sciences, Inc.
4 - 14
4.7 REFERENCES
Chin, H.B. (1991). The effect of processing on residues in foods: The food processing industry'sresidue database. In Pesticide Residues and Food Safety: A Harvest of Viewpoints. B.G.Tweedy, H.J. Dishburger, L.G. Ballantine, and J. McCarthy, eds. Washington, DC:American Chemical Society, Washington, DC, 175.
Elkins, E.R. (1989). Effect of commercial processing on pesticide residues in selected fruits andvegetables. J. Assoc. Off. Anal. Chem. 72: 533.
Federation of American Societies of Experimental Biology (FASEB), Life Sciences ResearchOffice (1988). Estimation of Exposure to Substances in the Food Supply. Bethesda, MD:FASEB.
Federation of American Societies of Experimental Biology (FASEB), Life Sciences ResearchOffice (1993). National Human Exposure Assessment Survey (NHEXAS) DietaryMonitoring Options. Bethesda, MD: FASEB.
Graham, J., K. Walker, M. Berry, E. Bryan, M. Callahan, A. Fan, B. Finley, J. Lynch, T.McKone, H. Ozkaynak, and K. Sexton (1992). The role of exposure data bases in riskassessment. Archives of Environmental Health 47(6): 408-420.
Minyard, J.P., Jr., and W.E. Roberts (1991). FOODCONTAM: A state data resource on toxicchemicals in foods. In Pesticide Residues and Food Safety: A Harvest of Viewpoints,B.G. Tweedy, H.J. Dishburger, L.G. Ballantine, and J. McCarthy, J., eds. Washington,DC: American Chemical Society, 151.
Mosteller, F., and J.W. Tukey (1977). Data Analysis and Regression. Reading, MA: Addison-Wesley Publishing Co.
National Research Council (NRC), Committee on Pesticides in the Diets of Infants and Children,Board on Agriculture and Board on Environmental Studies and Toxicology, Commissionon Life Science (1993). Pesticides in the Diets of Infants and Children. Washington,DC: National Academy Press.
Pennington, J.A.T. (1983). Revision of the Total Diet Study Food List and Diets. J. Am. Diet.Assoc. 82: 166-73.
Pennington, J.A.T., and E.T. Gunderson (1987). History of the Food and Drug Administration'sTotal Diet Study - 1961 to 1987. J. Assoc. Off. Anal. Chem. 70: 772-782.
Pennington, J.A.T. (1992). The 1990 revision of the Total Diet Study. J. Nutr. Educ. 244: 173.
Saunders, D.S., and B.J. Petersen (1986). Introduction to the Tolerance Assessment System.Washington, DC: U.S. Environmental Protection Agency.

DEEM Users Manual©2000 Novigen Sciences, Inc.
4 - 15
Sexton, K., S.G. Selevan, D.C. Wagner, and J.A. Lybarger (1992). Estimating human exposuresto environmental pollutants: availability and utility of existing databases. Archives ofEnvironmental Health 47(6): 398-407.
Sheldon, L., M. Mason, and M.R. Berry (1994). Multimedia measures of chlorpyrifos in thehome: the effect of area foggers on environmental contaminants and potential exposure.Presented at the International Society for Environmental Epidemiology/InternationalSociety for Exposure Analysis (ISEE/ISEA) Joint Conference 1994, Research TrianglePark, NC.
U.S. Department of Agriculture, Human Nutrition Information Service (1992). 1987-88Nationwide Food Consumption Survey Data Tape. Washington, DC: U.S. Departmentof Agriculture.
U.S. Food and Drug Administration (FDA) Pesticide Program (1991). Residues in Foods 1990.Washington, DC: U.S. Food and Drug Administration, Washington, DC.

DEEM Users Manual©2000 Novigen Sciences, Inc.
5 - 1
CHAPTER 5. BUILDING ANALYSIS FILES
Program Options
Table 5.1 summarizes the actions available from the DEEM Residue File Editor menu bar.
TABLE 5.1 RESIDUE ANALYSIS FILE ACTIONS
" File (create, open, save, print, close files and exit to main menu)" Add/Edit Header Information" Add/Edit Foods/Foodforms" Crop Group Actions" Help
Crop Groups
The EPA may register pesticide uses for single crop items (apples, corn, oranges) or for wholecategories of botanically similar items (e.g., pome fruits, grains, citrus). These categories arecalled Crop Groups. Table 5.2 lists the crop groups defined by EPA and used in DEEMtogether with their program codes. As previously mentioned, Appendix A identifies the foodsand associated food forms that are assigned to each crop group.
TABLE 5.2 EPA CROP GROUPS
CROP GROUP DESCRIPTION1 Root and Tuber Vegetables2 Leaves of Root and Tuber Vegetables3 Bulb Vegetables4 Leafy Vegetables (except Brassica)5 Brassica (Cole) Leafy Vegetables6 Legume Vegetables (Succulent or Dried)8 Fruiting Vegetables9 Cucurbit Vegetables10 Citrus Fruits11 Pome Fruits12 Stone Fruits13 Berries14 Tree nuts15 Cereal Grains19 Herbs and Spices
Note: The DEEM software also includes the EPA subgroupings for these crop groups, as well.Crop groups 7, 16, 17, and 18 are livestock feed items and, thus, are not included in theconsumption database.

DEEM Users Manual©2000 Novigen Sciences, Inc.
5 - 2
The DEEM program permits the user to enter data for an entire crop group or for individualfoods within a crop group. In addition, it is possible to enter residue data for subsets of thefoods, called “foodforms.”
FoodForms
Foodforms (FF) are used to further categorize a specific food into various forms of the food. Forexample, for the 1994/96 consumption database, the commodity apples is broken down into theFF uncooked, cooked (NFS1), baked, boiled, fried, dried, canned (NFS), canned: cooked,canned:baked, canned:boiled, and frozen: cooked. Use of FF allows the user to enter specificdata, if available, for a particular form of the food. For example, residue levels may besubstantially reduced in a heated form of a particular food.
Table 5.3 lists the FF used in the DEEM 1989/92 and 1994/96 databases. (Note that becausedifferent consumption data are reported in the surveys, not all FF are used in both databases.)
TABLE 5.3 FOODFORMS
11 "Uncooked" 51 "Cured: NFS (incl. smoked/pickled/salted)"12 "Cooked: NFS" 52 "Cured: Cooked (incl. smoked/pickled/salted)"13 "Baked" 59 "Cured: Cried (incl. smoked/pickled/salted)"14 "Boiled" 60 "Canned: Cured"15 "Fried" 98 "Refined"16 "Pasteurized" 99 "Alcohol/Fermented/Distilled"18 "Dried"20 "Microwaved"21 "Barbecued"31 "Canned: NFS"32 "Canned: Cooked"33 "Canned: Baked"34 "Canned: Boiled"35 "Canned: Fried"36 "Canned: Microwaved"37 "Canned: Barbecued"39 "Canned: Dried"41 "Frozen: NFS"42 "Frozen: Cooked"43 "Frozen: Baked"44 "Frozen: Boiled"45 "Frozen: Fried"46 "Frozen: Microwaved"47 "Frozen: Barbecued"48 "Frozen: Dried"
1 NFS = Not further specified.

DEEM Users Manual©2000 Novigen Sciences, Inc.
5 - 3
An Example – NOVICHEM
We will use DEEMTM to analyze a hypothetical chemical called “NOVICHEM” in order toprovide examples of the program applications and subsequent interpretation of analysis reports.A number of important features of DEEM will be illustrated with this example, including:
(1) translating the residue into equivalent DEEM foods and foodforms (Chapter 5)(2) building new residue files and modifying existing files at three program levels, i.e., at
the food, foodform, and crop group levels (Chapter 5)(3) changing adjustment factors (Chapter 5)(4) changing residue levels (Chapter 5)(5) conducting exposure assessments for the US population and for population subgroups
(Chapters 6 and 7)(6) Commodity Contribution Analyses (Chapter 5)
(a) complete commodity listings(b) critical commodity listings
(7) Critical Exposure Commodity Analysis (Chapter 7)
After each DEEM procedure is described, we will apply the procedure to NOVICHEM.
NOVICHEM Tolerances
NOVICHEM is a pesticide registered for use on apples, cotton, peaches, nectarines, grapes,tomatoes, celery, lettuce, and strawberries. The manufacturer of the chemical has conducted abattery of chemistry, field residue, and processing studies. As a result of the studies, each ofthese crops has established tolerances. Secondary residues of NOVICHEM and its metabolitesare found in meats (cattle, goats, swine, sheep, horse) and milk as a result of residues incottonseed, cottonseed meal, and cotton gin trash. Table 5.4 lists the established tolerances forNOVICHEM.
DEEM Users Manual©2000 Novigen Sciences, Inc.
5 - 4
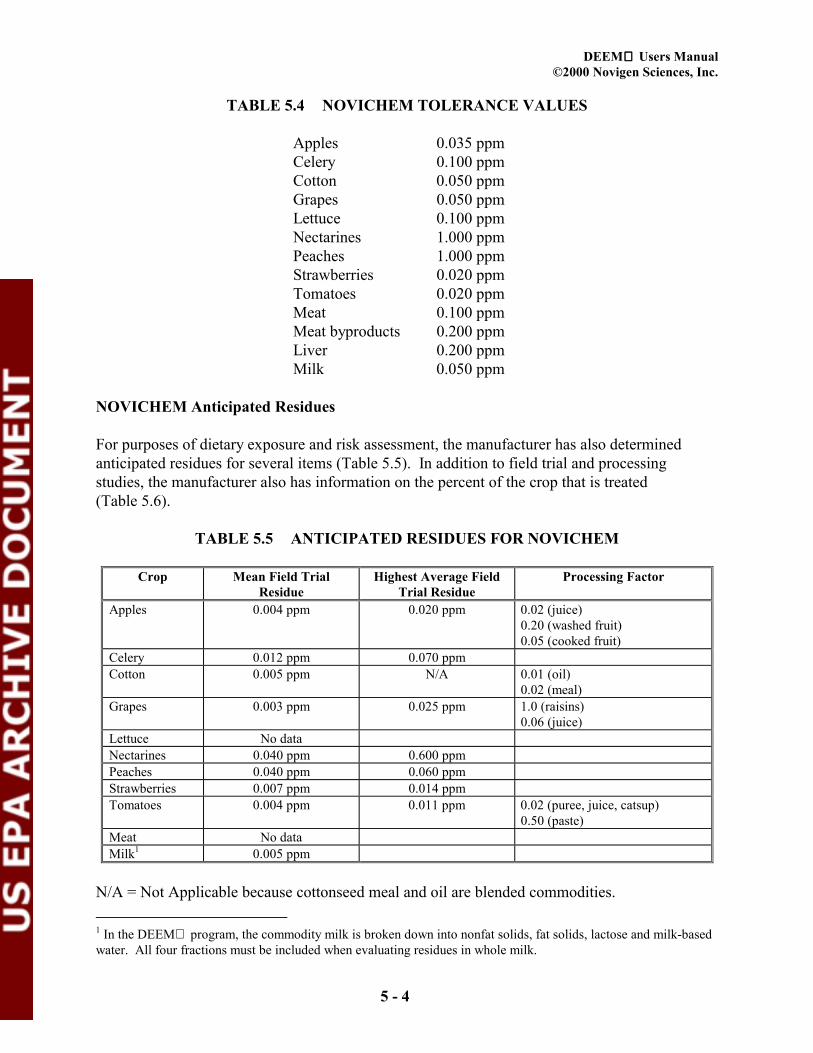
TABLE 5.4 NOVICHEM TOLERANCE VALUES
Apples 0.035 ppmCelery 0.100 ppmCotton 0.050 ppmGrapes 0.050 ppmLettuce 0.100 ppmNectarines 1.000 ppmPeaches 1.000 ppmStrawberries 0.020 ppmTomatoes 0.020 ppmMeat 0.100 ppmMeat byproducts 0.200 ppmLiver 0.200 ppmMilk 0.050 ppm
NOVICHEM Anticipated Residues
For purposes of dietary exposure and risk assessment, the manufacturer has also determinedanticipated residues for several items (Table 5.5). In addition to field trial and processingstudies, the manufacturer also has information on the percent of the crop that is treated(Table 5.6).
TABLE 5.5 ANTICIPATED RESIDUES FOR NOVICHEM
Crop Mean Field TrialResidue
Highest Average FieldTrial Residue
Processing Factor
Apples 0.004 ppm 0.020 ppm 0.02 (juice)0.20 (washed fruit)0.05 (cooked fruit)
Celery 0.012 ppm 0.070 ppmCotton 0.005 ppm N/A 0.01 (oil)
0.02 (meal)Grapes 0.003 ppm 0.025 ppm 1.0 (raisins)
0.06 (juice)Lettuce No dataNectarines 0.040 ppm 0.600 ppmPeaches 0.040 ppm 0.060 ppmStrawberries 0.007 ppm 0.014 ppmTomatoes 0.004 ppm 0.011 ppm 0.02 (puree, juice, catsup)
0.50 (paste)Meat No dataMilk1 0.005 ppm
N/A = Not Applicable because cottonseed meal and oil are blended commodities. 1 In the DEEM program, the commodity milk is broken down into nonfat solids, fat solids, lactose and milk-basedwater. All four fractions must be included when evaluating residues in whole milk.
DEEM Users Manual©2000 Novigen Sciences, Inc.
5 - 5
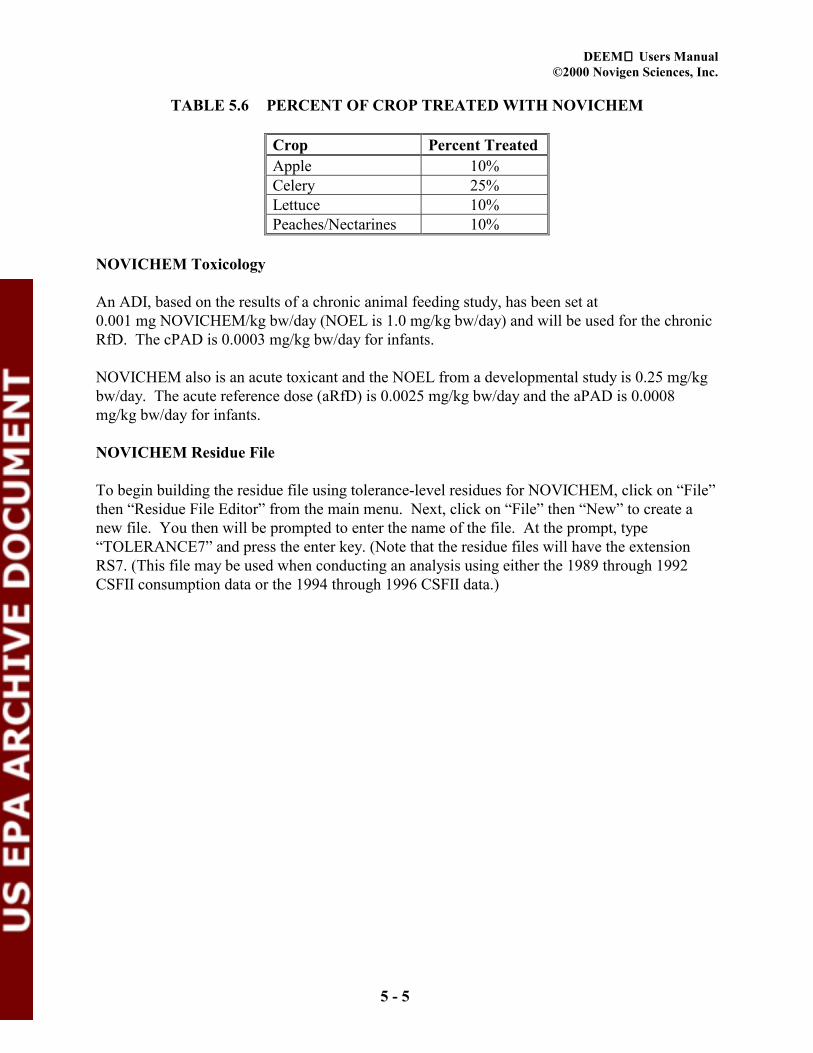
TABLE 5.6 PERCENT OF CROP TREATED WITH NOVICHEM
Crop Percent TreatedApple 10%Celery 25%Lettuce 10%Peaches/Nectarines 10%
NOVICHEM Toxicology
An ADI, based on the results of a chronic animal feeding study, has been set at0.001 mg NOVICHEM/kg bw/day (NOEL is 1.0 mg/kg bw/day) and will be used for the chronicRfD. The cPAD is 0.0003 mg/kg bw/day for infants.
NOVICHEM also is an acute toxicant and the NOEL from a developmental study is 0.25 mg/kgbw/day. The acute reference dose (aRfD) is 0.0025 mg/kg bw/day and the aPAD is 0.0008mg/kg bw/day for infants.
NOVICHEM Residue File
To begin building the residue file using tolerance-level residues for NOVICHEM, click on “File”then “Residue File Editor” from the main menu. Next, click on “File” then “New” to create anew file. You then will be prompted to enter the name of the file. At the prompt, type“TOLERANCE7” and press the enter key. (Note that the residue files will have the extensionRS7. (This file may be used when conducting an analysis using either the 1989 through 1992CSFII consumption data or the 1994 through 1996 CSFII data.)

DEEM Users Manual©2000 Novigen Sciences, Inc.
5 - 6
Next click on “Add/Edit Header” then “Open Header.” Screen 5.1 will appear.
Screen 5.1 Header Information
Clicking on a field highlights the entire field. Entering data in the highlighted field willcompletely replace any information currently contained in the field. If you want to change aportion of the field, double click on the field and move the cursor to the appropriate location andperform the desired field edits. You may move from field to field with either the <Tab> key orthe mouse. Hitting the <Enter> key will not advance the cursor to the next field. Note that youmay enter a comment using the header option. This comment will appear in all the analyses thatuse this residue file. (Later you will have an opportunity to enter a second comment for thatanalysis only.) Enter the appropriate header information for NOVICHEM. Once you havecompleted entering the data, click on “Finished” to close the screen.
Add/Edit Foods
Next, click on the “Add/Edit Foods/foodforms” option from the menu bar. For existing files, youwill be given a choice of viewing all the foods or only those included in your file. When creatinga new residue file, you must select “All” foods. You may sort foods by foodcode or inalphabetical order. Screen 5.2 provides an example of a residue file sorted in alphabetical order.

DEEM Users Manual©2000 Novigen Sciences, Inc.
5 - 7
Screen 5.2 Add/Edit Foods/foodforms
Note that information in the first four columns can not be modified by the user. The activecolumns in the food/foodform data entry grid are: residue value, first adjustment factor, secondadjustment factor, RDL pointer #, RDL ratio #, and source comment. The RDL pointer # andratio fields are used for Monte Carlo analyses only; the remaining fields are used for both chronicand acute analyses. (Entering data in the RDL pointer # and ratio fields is described inChapter 7.)
Entering Data
The data entry procedure is similar to that used for spreadsheets such as Excel® or Lotus 123®.However, <Enter> will not move the cursor to a new cell. The cursor action depends on whetheror not a value has already been entered in the residue field. To open the field for data entry orediting, move the cursor to the field and press <Enter>.
Double-clicking will also open the field.
Once the field is open, enter the residue value in ppm. DEEM permits entry of values less than1000 ppm and greater than 0.000001 ppm. Note that data entry is restricted to 6 decimals.
DEEM Users Manual©2000 Novigen Sciences, Inc.
5 - 8
If <Enter> is pressed after the residue value is entered into the field, the field is highlighted andsubsequent values will overwrite the original data. To advance the cursor to another field, usethe <arrow> keys. You may also advance the cursor to another cell by clicking on the cell.
You can enter the same residue value in a number of contiguous residue cells by clicking on thefirst cell with the left mouse button, and then, while holding the left mouse button down,dragging the highlighted area down to the last cell that you want to replace. You will get aconfirmation note asking if you want to replace all of the values in the highlighted cells. If youanswer affirmatively, the value in the first cell of the highlighted area will be enteredautomatically into the remaining cells. Note that you cannot highlight cells in more than onecolumn at a time. You can highlight a contiguous area that includes only foods or only FF, butyou cannot highlight a contiguous area that includes both foods and FF.
To copy a residue value into another cell, double click on the field to be copied, then move thecursor to the desired entry field and double click again. The value will be displayed in the newfield.
The two buttons, “Quick Code Find” and “Quick Food Find,” on the Add/Edit Foods/foodformsscreen may be used to move to a specific RAC code or food. Simply enter the RAC code or foodname, as appropriate, and press enter. The cursor automatically will move to that code/food.
Using Foodforms
Foodforms (at least 1 and as many as 31) are available for all foods that were reported consumedat least once in the CSFII. In screen 5.2, the number of FF for each food is shown in the columnlabeled “NFF.” Foods with available foodforms will have a number greater than zero in the“NFF” column. A residue value can be entered for any food, whether or not it has FF. With theexception of nonfood-based water, foods with no FF (i.e., NFF = 0) indicate that there was noconsumption reported in the survey; therefore, these foods will not have any impact on theanalysis.
The food, nonfood-based water, is the amount of tap water consumed as a discrete food (i.e., notas a part of food or in food preparation). (Definitions of the foods and FF in the DEEMsoftware are discussed in Appendix B.) The foods without FF are included in the list of foods tomake it clear that such foods are not included under some other food name.
To include FF in your residue file, enter a residue value (in ppm) greater than zero. Then rightclick anywhere on the row where the food is listed. A confirmation message will be displayed;you must respond positively if you want the FF for this food to be shown. Initially the residuevalue for each of the FF is the same as the residue value entered for the food. You can changethe values manually by clicking on the residue value and then adding a replacement value. Note:when you add FF to a file containing many foods with residue values, it may take several secondsfor the display grid to be redrawn to the screen.

DEEM Users Manual©2000 Novigen Sciences, Inc.
5 - 9
To delete FF, place the cursor on the food level; then right click on the row where the food islisted. A confirmation message will be shown. You must respond positively if you want todelete the FF for this food. Otherwise, the residue value for the first FF with a positive value willbe entered into the food residue cell.
(If all FF for a given food have the same residue value and processing factor, there is no reason todivide the food into its FF. The resulting analysis will be the same whether or not you use theFF. If a new residue value is assigned to all foods and FF in a file, the FF are not automaticallyremoved. You must remove them manually.)
Note that when you are displaying the residue file data entry grid in the “selected only” mode(that is, only foods with non-zero residues are shown) you may change a food with FF showingto a residue value of 0. Right click on the appropriate NFF box to remove the food forms. Thegrid will be redrawn immediately. This may be confusing temporarily because the food on whichyou just operated disappears. (However, for foods without expanded FF, setting the residuevalue to 0 for a food does not make the food disappear in the “selected only” mode until youfinish and redisplay the screen in the “selected only” mode.)
NOTE: If a FF for a food is activated (i.e., at least one FF has a non-zero residue value assignedto it) then the residue value shown for the food itself is not actually used in the DEEM Chronicor Acute analyses. But the residue values for the food cannot be zero if FF are used. If theresidue value of a food is zero, the residue values for all non-zero foodforms also will be zeroand the FF for that food will be dropped when the file is displayed the next time or as it is saved.
Adjustment Factors
Typically, the first adjustment factor in the DEEM software is used for processingreduction/concentration and the second for usage estimates, both expressed as proportions. Theprogram multiplies the residue value by each of the adjustment factors. The user has the optionto exclude adjustment factor #2 from the calculations. Adjustment factors can be copied intocontiguous cells using the highlighting method described for residue values.
The default values for the first adjustment factor for each food are retrieved from the DEEMdatabase when a new file is created. These default values are provided in Appendix A.
The default value for each FF is the same as for the food itself. The default values for adjustmentfactor one represent yield losses. Sources for these adjustment factors are USDA Handbook 102(USDA, 1975) and USDA Commodity Maps (USDA, 1982).
Both of these sources provide information on the quantity of processed foods from a unit amountof whole commodity. The USDA Commodity Maps document specifically lists conversionfactors (measures of the physical transformation of a commodity from farm-gate toprocessing/consumption) for many foods. The conversion factor is the ratio of the weight of thecommodity in one form to its weight in another form. The factors reflect gains or losses in acommodity. For example, the conversion factor reported for apple juice is 0.774 pounds per

DEEM Users Manual©2000 Novigen Sciences, Inc.
5 - 10
pound of fresh apples, indicating that one pound of apples converts to 0.774 pounds of applejuice. If residue data are available only for the whole apple, this conversion factor may be usedto determine the potential impact on the pesticide residues if treated whole apples are processedto juice. That is, since 1.3 pounds of apples are needed to produce one pound of apple juice, it isassumed that the pesticide level in the RAC apples would concentrate 1.3X in the processed juice(1 ÷ 0.774).
The default adjustment factors in DEEM may be considered worst-case because they almostalways assume concentration of residues in the processed commodity. The only exception to thisis the food soybean sprouts for which the default factor is 0.33, suggesting a weight gain (i.e.,reduction in pesticide levels) in the processed commodity.
Conversion information may change over time as a result of the adoption of new technology inboth production and processing as well as variation in the physical properties of commoditiesfrom one crop year to another. In addition, as new products become available in the market, newconversion factors may be warranted.
One of the major changes in default factors occurred with the release of the 1987/88 NationwideFood Consumption Survey (NFCS) data. This change was not a result of revisions to conversionfactors. Instead, it had to do with the methodology used to translate consumption of milk-containing foods as reported in the survey to those used in the software.
In the 1977/78 NFCS, consumption data for milk products were translated to the foods nonfatsolids, fat solids, milk sugar and milk-based water. Consumption of the milk-based waterportion was grouped with other food-based waters (water added to food duringcooking/preparation). To account for the loss of the fluid component of milk, default factors of7.87 were assigned to milk fat solids and nonfat solids.
In the development of revised translation factors for the 1987/88 NFCS, milk-based water waskept as a separate ingredient (i.e., not added to other types of water) in the software. Because allmilk fractions can be accounted for, the default adjustment factors for milk fat solids and nonfatsolids are not necessary. When evaluating residues in whole milk, all four fractions must beincluded in the analysis. Depending on the chemical properties of a specific compound, thefractions to be included may be limited to one or a few (e.g., lipophilic compounds wherethe chemical is found only in the milk fat).
Comments
The comment (documentation) code can be any combination of alphanumeric characters, withmaximum length defined by the size of the data entry field (up to 50 characters). Commentcodes can be copied into contiguous cells using the highlighting method described for residuevalues.

DEEM Users Manual©2000 Novigen Sciences, Inc.
5 - 11
A comment code is not required and is not used in the analyses. This field is valuable indocumenting the source of data, or other pertinent information. The comment documentationmay be omitted from the residue file report by responding NO in the set up option (Screen 2.1,Chapter 2) of the main menu.
Using the techniques discussed above, add the NOVICHEM tolerance values for apples, celery,cottonseed (meal and oil), grapes, lettuce, peaches/nectarines, strawberries, and tomatoes.Although processing data are available for cooked apples, for this example, the tolerance-valuefor apples will apply to all apples.
To save the residue file as you are entering the day, you may click on the “Quick Save” boxlocated at the top of the residue file grid. (You will be prompted to save the file after all the dataare entered and you exit the Residue Editor Menu.) After the tolerances have been entered forthe appropriate foods, click on “Finished.” You will return to the “Residue Editor Menu.”
Adding Crop Groups
To finish adding the foods and corresponding tolerances for NOVICHEM, click on “Crop GroupActions, then “Add Crop Group.” Screen 5.3 will appear.
Screen 5.3 Add Crop Group Screen

DEEM Users Manual©2000 Novigen Sciences, Inc.
5 - 12
If you add all foods for a specified food group using the “add crop group” menu, you mustspecify a default (non-zero) residue value. If some of the foods and FF in the specified cropgroup have non-zero residue values (i.e., you already have entered residue values for individualfoods), you will be given the option to replace those existing values with the new value or assignthe new value to only those foods and FF having a zero value. The residue replacement value isassigned to all foods in the existing crop group and to FF for foods that already have FF specifiedin the file.
To continue entering NOVICHEM tolerances, click on Crop Group M, Meat. Enter the residuevalue (0.100 ppm). (Note that the tolerance value for meat liver and byproducts is 0.200 ppm.)You can then change the residue value from 0.100 ppm to 0.200 ppm for liver using the “AddEdit Foods/Foodforms” option.
Since no residues are anticipated in rabbit meat, you can remove rabbit by placing a residue valueof 0 ppm in the residue column.
Next, select Crop Group D: Dairy products. Enter the tolerance value for milk (0.05 ppm). Notethat all four milk fractions (i.e., nonfat solids, fat solids, lactose, and milk-based water) must beincluded.
To view the foods in the residue file, click on the option “File” then “Print File with includedfoods only.” You will have the option of printing your file to the screen, a text file, or to paper.Note that, saving your file to a text file simply provides a disk file for reports; this file cannot beused to run the exposure analyses.
To save your file for use in the chronic or acute analysis, click “File,” then, “Save.”
Your residue file, TOLERANCE7.RS7, should match that presented in Table 5.7

DEEM Users Manual©2000 Novigen Sciences, Inc.
5 - 13
TABLE 5.7
TOLERANCE7 RESIDUE FILE FOR NOVICHEM
Novigen Sciences, Incorporated Ver. 7.06DEEM Chronic analysis for NOVICHEM 1994-96 dataResidue file: H:\DEEM7 training\tolerance7.RS7 Adjust. #2 usedAnalysis Date 02-02-2000 Residue file dated: 02-02-2000/13:33:29/1Reference dose (RfD) = 0.001 (NOEL) = 1 mg/kg bw/dayComment:Tolerance-level residues--------------------------------------------------------------------------------Food Crop RESIDUE Adj.Factors CommentCode Grp Food Name (ppm) #1 #2---- ---- ------------------------------- ---------- ------ ------ ------- 13 O Grapes 0.050000 1.000 1.000 14 O Grapes-raisins 0.050000 4.300 1.000 15 O Grapes-juice 0.050000 1.200 1.000 17 O Strawberries 0.020000 1.000 1.000 52 11 Apples 0.035000 1.000 1.000 53 11 Apples-dried 0.035000 8.000 1.000 54 11 Apples-juice/cider 0.035000 1.300 1.000 64 12 Nectarines 1.000000 1.000 1.000 65 12 Peaches 1.000000 1.000 1.000 66 12 Peaches-dried 1.000000 7.000 1.000 159 8 Tomatoes-whole 0.020000 1.000 1.000 160 8 Tomatoes-juice 0.020000 1.500 1.000 161 8 Tomatoes-puree 0.020000 3.300 1.000 162 8 Tomatoes-paste 0.020000 5.400 1.000 163 8 Tomatoes-catsup 0.020000 2.500 1.000 166 4B Celery 0.100000 1.000 1.000 176 4A Lettuce-leafy varieties 0.100000 1.000 1.000 182 4A Lettuce-unspecified 0.100000 1.000 1.000 192 4A Lettuce-head varieties 0.100000 1.000 1.000 195 O Grapes-leaves 0.050000 1.000 1.000 290 O Cottonseed-oil 0.050000 1.000 1.000 291 O Cottonseed-meal 0.050000 1.000 1.000 315 O Grapes-wine and sherry 0.050000 1.000 1.000 318 D Milk-nonfat solids 0.050000 1.000 1.000 319 D Milk-fat solids 0.050000 1.000 1.000 320 D Milk sugar (lactose) 0.050000 1.000 1.000 321 M Beef-meat byproducts 0.200000 1.000 1.000 322 M Beef-other organ meats 0.100000 1.000 1.000 323 M Beef-dried 0.100000 1.920 1.000 324 M Beef-fat w/o bones 0.100000 1.000 1.000 325 M Beef-kidney 0.100000 1.000 1.000 326 M Beef-liver 0.200000 1.000 1.000 327 M Beef-lean (fat/free) w/o bones 0.100000 1.000 1.000 328 M Goat-meat byproducts 0.200000 1.000 1.000 329 M Goat-other organ meats 0.100000 1.000 1.000 330 M Goat-fat w/o bone 0.100000 1.000 1.000 331 M Goat-kidney 0.100000 1.000 1.000 332 M Goat-liver 0.200000 1.000 1.000 333 M Goat-lean (fat/free) w/o bone 0.100000 1.000 1.000 334 M Horsemeat 0.200000 1.000 1.000 336 M Sheep-meat byproducts 0.200000 1.000 1.000 337 M Sheep-other organ meats 0.100000 1.000 1.000 338 M Sheep-fat w/o bone 0.100000 1.000 1.000 339 M Sheep-kidney 0.100000 1.000 1.000 340 M Sheep-liver 0.200000 1.000 1.000 341 M Sheep-lean (fat free) w/o bone 0.100000 1.000 1.000
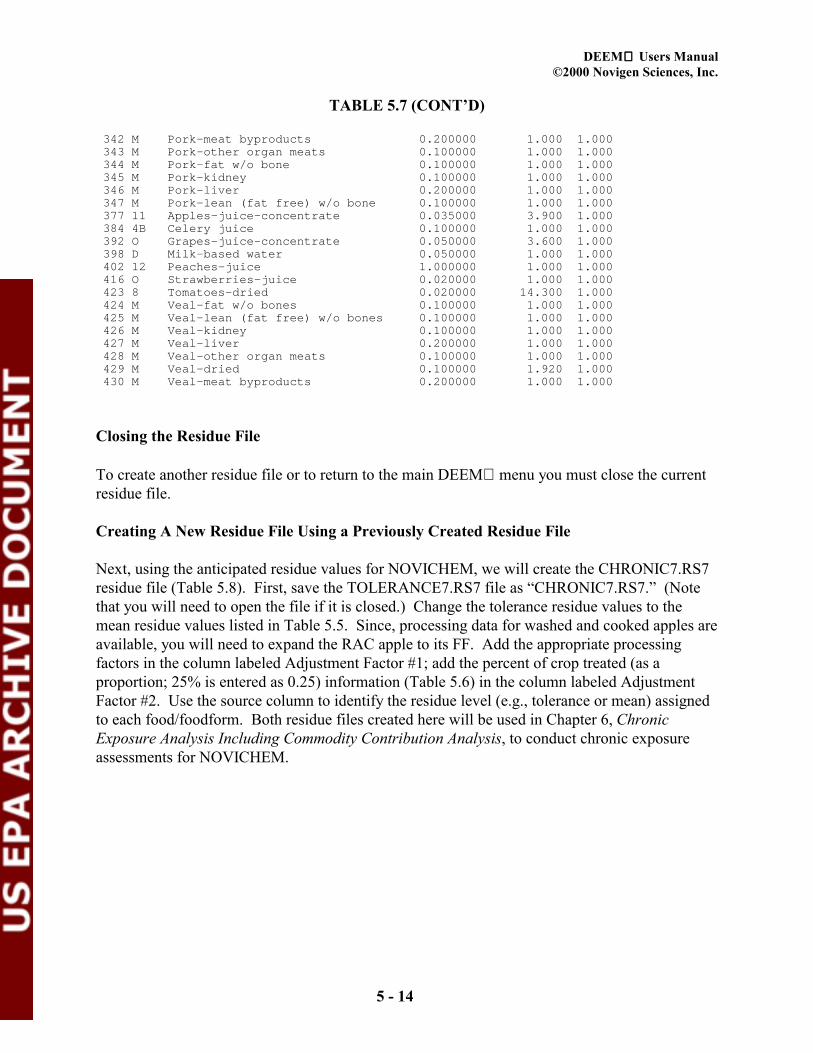
DEEM Users Manual©2000 Novigen Sciences, Inc.
5 - 14
TABLE 5.7 (CONT’D)
342 M Pork-meat byproducts 0.200000 1.000 1.000 343 M Pork-other organ meats 0.100000 1.000 1.000 344 M Pork-fat w/o bone 0.100000 1.000 1.000 345 M Pork-kidney 0.100000 1.000 1.000 346 M Pork-liver 0.200000 1.000 1.000 347 M Pork-lean (fat free) w/o bone 0.100000 1.000 1.000 377 11 Apples-juice-concentrate 0.035000 3.900 1.000 384 4B Celery juice 0.100000 1.000 1.000 392 O Grapes-juice-concentrate 0.050000 3.600 1.000 398 D Milk-based water 0.050000 1.000 1.000 402 12 Peaches-juice 1.000000 1.000 1.000 416 O Strawberries-juice 0.020000 1.000 1.000 423 8 Tomatoes-dried 0.020000 14.300 1.000 424 M Veal-fat w/o bones 0.100000 1.000 1.000 425 M Veal-lean (fat free) w/o bones 0.100000 1.000 1.000 426 M Veal-kidney 0.100000 1.000 1.000 427 M Veal-liver 0.200000 1.000 1.000 428 M Veal-other organ meats 0.100000 1.000 1.000 429 M Veal-dried 0.100000 1.920 1.000 430 M Veal-meat byproducts 0.200000 1.000 1.000
Closing the Residue File
To create another residue file or to return to the main DEEM menu you must close the currentresidue file.
Creating A New Residue File Using a Previously Created Residue File
Next, using the anticipated residue values for NOVICHEM, we will create the CHRONIC7.RS7residue file (Table 5.8). First, save the TOLERANCE7.RS7 file as “CHRONIC7.RS7.” (Notethat you will need to open the file if it is closed.) Change the tolerance residue values to themean residue values listed in Table 5.5. Since, processing data for washed and cooked apples areavailable, you will need to expand the RAC apple to its FF. Add the appropriate processingfactors in the column labeled Adjustment Factor #1; add the percent of crop treated (as aproportion; 25% is entered as 0.25) information (Table 5.6) in the column labeled AdjustmentFactor #2. Use the source column to identify the residue level (e.g., tolerance or mean) assignedto each food/foodform. Both residue files created here will be used in Chapter 6, ChronicExposure Analysis Including Commodity Contribution Analysis, to conduct chronic exposureassessments for NOVICHEM.

DEEM Users Manual©2000 Novigen Sciences, Inc.
5 - 15
TABLE 5.8
CHRONIC7 RESIDUE FILE FOR NOVICHEM
Novigen Sciences, Incorporated Ver. 7.02DEEM Chronic analysis for NOVICHEM 1994-96 dataResidue file: C:\DEEM manual\chronic7.RS7 Adjust. #2 NOT usedAnalysis Date 02-06-2000 Residue file dated: 02-03-2000/15:35:04/1Reference dose (RfD) = 0.001 (NOEL) = 1 mg/kg bw/dayComment:Anticipated residues--------------------------------------------------------------------------------Food Crop RESIDUE Adj.FactorsCode Grp Food Name (ppm) #1 #2---- ---- ------------------------------- ---------- ------ ------ 13 O Grapes 0.003000 1.000 1.000 14 O Grapes-raisins 0.003000 1.000 1.000 15 O Grapes-juice 0.003000 0.060 1.000 17 O Strawberries 0.007000 1.000 1.000 52 11 Apples 11-Uncooked 0.004000 0.200 0.100 12-Cooked: NFS 0.004000 0.050 0.100 13-Baked 0.004000 0.050 0.100 14-Boiled 0.004000 0.050 0.100 15-Fried 0.004000 0.050 0.100 18-Dried 0.004000 0.200 0.100 31-Canned: NFS 0.004000 0.050 0.100 32-Canned: Cooked 0.004000 0.050 0.100 33-Canned: Baked 0.004000 0.050 0.100 34-Canned: Boiled 0.004000 0.050 0.100 42-Frozen: Cooked 0.004000 0.050 0.100 53 11 Apples-dried 0.004000 8.000 0.100 54 11 Apples-juice/cider 0.004000 0.020 0.100 64 12 Nectarines 0.040000 1.000 0.100 65 12 Peaches 0.040000 1.000 0.100 66 12 Peaches-dried 0.040000 7.000 0.100 159 8 Tomatoes-whole 0.004000 1.000 1.000 160 8 Tomatoes-juice 0.004000 0.020 1.000 161 8 Tomatoes-puree 0.004000 0.020 1.000 162 8 Tomatoes-paste 0.004000 0.500 1.000 163 8 Tomatoes-catsup 0.004000 0.020 1.000 166 4B Celery 0.012000 1.000 0.250 176 4A Lettuce-leafy varieties 0.100000 1.000 0.100 182 4A Lettuce-unspecified 0.100000 1.000 0.100 192 4A Lettuce-head varieties 0.100000 1.000 0.100 195 O Grapes-leaves 0.003000 1.000 1.000 290 O Cottonseed-oil 0.005000 0.010 1.000 291 O Cottonseed-meal 0.005000 0.020 1.000 315 O Grapes-wine and sherry 0.003000 1.000 1.000 318 D Milk-nonfat solids 0.005000 1.000 1.000 319 D Milk-fat solids 0.005000 1.000 1.000 320 D Milk sugar (lactose) 0.005000 1.000 1.000 321 M Beef-meat byproducts 0.200000 1.000 1.000 322 M Beef-other organ meats 0.100000 1.000 1.000 323 M Beef-dried 0.100000 1.920 1.000 324 M Beef-fat w/o bones 0.100000 1.000 1.000 325 M Beef-kidney 0.100000 1.000 1.000 326 M Beef-liver 0.200000 1.000 1.000 327 M Beef-lean (fat/free) w/o bones 0.100000 1.000 1.000 328 M Goat-meat byproducts 0.200000 1.000 1.000 329 M Goat-other organ meats 0.100000 1.000 1.000 330 M Goat-fat w/o bone 0.100000 1.000 1.000 331 M Goat-kidney 0.100000 1.000 1.000 332 M Goat-liver 0.200000 1.000 1.000 333 M Goat-lean (fat/free) w/o bone 0.100000 1.000 1.000

DEEM Users Manual©2000 Novigen Sciences, Inc.
5 - 16
TABLE 5.8 (CONT’D)
334 M Horsemeat 0.100000 1.000 1.000 336 M Sheep-meat byproducts 0.200000 1.000 1.000 337 M Sheep-other organ meats 0.100000 1.000 1.000 338 M Sheep-fat w/o bone 0.100000 1.000 1.000 339 M Sheep-kidney 0.100000 1.000 1.000 340 M Sheep-liver 0.200000 1.000 1.000 341 M Sheep-lean (fat free) w/o bone 0.100000 1.000 1.000 342 M Pork-meat byproducts 0.200000 1.000 1.000 343 M Pork-other organ meats 0.100000 1.000 1.000 344 M Pork-fat w/o bone 0.100000 1.000 1.000 345 M Pork-kidney 0.100000 1.000 1.000 346 M Pork-liver 0.200000 1.000 1.000 347 M Pork-lean (fat free) w/o bone 0.100000 1.000 1.000 377 11 Apples-juice-concentrate 0.004000 0.060 0.100 384 4B Celery juice 0.012000 1.000 0.250 392 O Grapes-juice-concentrate 0.003000 0.180 1.000 398 D Milk-based water 0.005000 1.000 1.000 402 12 Peaches-juice 0.040000 1.000 0.100 416 O Strawberries-juice 0.007000 1.000 1.000 423 8 Tomatoes-dried 0.004000 14.300 1.000 424 M Veal-fat w/o bones 0.100000 1.000 1.000 425 M Veal-lean (fat free) w/o bones 0.100000 1.000 1.000 426 M Veal-kidney 0.100000 1.000 1.000 427 M Veal-liver 0.200000 1.000 1.000 428 M Veal-other organ meats 0.100000 1.000 1.000 429 M Veal-dried 0.100000 1.920 1.000 430 M Veal-meat byproducts 0.200000 1.000 1.000
Building Residue Files for the Acute Analysis
To create the ACUTE NOVICHEM residue file (Table 5.9), save the TOLERANCE7 file underthe name ACUTE7.RS7. Enter the mean residue value (Table 5.5) for the following blendedfoods1:
• cottonseed meal/oil• milk
Convert the tolerance values to the highest average field trial value (HAFT) (Table 5.5) for thefollowing foods:
• apples• grapes• celery• peaches/nectarines• strawberries• tomatoes
Include the appropriate processing factors in the column labeled “Adjustment Factor #1.” Sinceresidue data are not available for meat and lettuce, use the tolerance values.
1 EPA definitions for not blended, partially blended, and blended commodities currently are under review. See EPA SOP 99.6.Classification of Food Forms with Respect to Levels of Blending. August 20, 1999.

DEEM Users Manual©2000 Novigen Sciences, Inc.
5 - 17
TABLE 5.9
ACUTE7 RESIDUE FILE FOR NOVICHEM
Novigen Sciences, Incorporated Ver. 7.06DEEM Acute analysis for NOVICHEMResidue file name: H:\DEEM7 training\acute7.RS7Analysis Date 02-02-2000 Residue file dated: 02-02-2000/13:35:32/1Reference dose: aRfD = 0.0025 mg/kg bw/day NOEL = 0.25 mg/kg bw/dayComment: Anticipated residues--------------------------------------------------------------------------------Food Crop Def Res Adj.Factors CommentCode Grp Food Name (ppm) #1 #2---- ---- ------------------------------- ---------- ------ ------ ------- 13 O Grapes 0.025000 1.000 1.000 14 O Grapes-raisins 0.025000 1.000 1.000 15 O Grapes-juice 0.025000 0.060 1.000 17 O Strawberries 0.014000 1.000 1.000 52 11 Apples 11-Uncooked 0.020000 0.200 1.000 12-Cooked: NFS 0.020000 0.050 1.000 13-Baked 0.020000 0.050 1.000 14-Boiled 0.020000 0.050 1.000 15-Fried 0.020000 0.050 1.000 18-Dried 0.020000 0.200 1.000 31-Canned: NFS 0.020000 0.050 1.000 32-Canned: Cooked 0.020000 0.050 1.000 33-Canned: Baked 0.020000 0.050 1.000 34-Canned: Boiled 0.020000 0.050 1.000 42-Frozen: Cooked 0.020000 0.050 1.000 53 11 Apples-dried 0.020000 8.000 1.000 54 11 Apples-juice/cider 0.020000 0.020 1.000 64 12 Nectarines 0.600000 1.000 1.000 65 12 Peaches 0.600000 1.000 1.000 66 12 Peaches-dried 0.600000 7.000 1.000 159 8 Tomatoes-whole 0.011000 1.000 1.000 160 8 Tomatoes-juice 0.011000 0.020 1.000 161 8 Tomatoes-puree 0.011000 0.020 1.000 162 8 Tomatoes-paste 0.011000 0.500 1.000 163 8 Tomatoes-catsup 0.011000 0.020 1.000 166 4B Celery 0.070000 1.000 1.000 176 4A Lettuce-leafy varieties 0.100000 1.000 1.000 182 4A Lettuce-unspecified 0.100000 1.000 1.000 192 4A Lettuce-head varieties 0.100000 1.000 1.000 195 O Grapes-leaves 0.025000 1.000 1.000 290 O Cottonseed-oil 0.005000 0.010 1.000 291 O Cottonseed-meal 0.005000 0.020 1.000 315 O Grapes-wine and sherry 0.025000 1.000 1.000 318 D Milk-nonfat solids 0.005000 1.000 1.000 319 D Milk-fat solids 0.005000 1.000 1.000 320 D Milk sugar (lactose) 0.005000 1.000 1.000 321 M Beef-meat byproducts 0.200000 1.000 1.000 322 M Beef-other organ meats 0.100000 1.000 1.000 323 M Beef-dried 0.100000 1.920 1.000 324 M Beef-fat w/o bones 0.100000 1.000 1.000 325 M Beef-kidney 0.100000 1.000 1.000 326 M Beef-liver 0.200000 1.000 1.000 327 M Beef-lean (fat/free) w/o bones 0.100000 1.000 1.000 328 M Goat-meat byproducts 0.200000 1.000 1.000 329 M Goat-other organ meats 0.100000 1.000 1.000 330 M Goat-fat w/o bone 0.100000 1.000 1.000 331 M Goat-kidney 0.100000 1.000 1.000 332 M Goat-liver 0.200000 1.000 1.000 333 M Goat-lean (fat/free) w/o bone 0.100000 1.000 1.000 334 M Horsemeat 0.200000 1.000 1.000

DEEM Users Manual©2000 Novigen Sciences, Inc.
5 - 18
TABLE 5.9 (CONT’D)
336 M Sheep-meat byproducts 0.200000 1.000 1.000 337 M Sheep-other organ meats 0.100000 1.000 1.000 338 M Sheep-fat w/o bone 0.100000 1.000 1.000 339 M Sheep-kidney 0.100000 1.000 1.000 340 M Sheep-liver 0.200000 1.000 1.000 341 M Sheep-lean (fat free) w/o bone 0.100000 1.000 1.000 342 M Pork-meat byproducts 0.200000 1.000 1.000 343 M Pork-other organ meats 0.100000 1.000 1.000 344 M Pork-fat w/o bone 0.100000 1.000 1.000 345 M Pork-kidney 0.100000 1.000 1.000 346 M Pork-liver 0.200000 1.000 1.000 347 M Pork-lean (fat free) w/o bone 0.100000 1.000 1.000 377 11 Apples-juice-concentrate 0.020000 0.060 1.000 384 4B Celery juice 0.070000 1.000 1.000 392 O Grapes-juice-concentrate 0.025000 0.180 1.000 398 D Milk-based water 0.005000 1.000 1.000 402 12 Peaches-juice 0.600000 1.000 1.000 416 O Strawberries-juice 0.014000 1.000 1.000 423 8 Tomatoes-dried 0.011000 14.300 1.000 424 M Veal-fat w/o bones 0.100000 1.000 1.000 425 M Veal-lean (fat free) w/o bones 0.100000 1.000 1.000 426 M Veal-kidney 0.100000 1.000 1.000 427 M Veal-liver 0.200000 1.000 1.000 428 M Veal-other organ meats 0.100000 1.000 1.000 429 M Veal-dried 0.100000 1.920 1.000 430 M Veal-meat byproducts 0.200000 1.000 1.000
The ACUTE7.RS7 file will be used in the acute analyses for NOVICHEM (Chapter 7, AcuteExposure Analysis).
Once the files have been created (and saved), close the current file and exit to the main menu.
Other Residue File Formats: The Acute and Chronic Modules and Residue File Editor includethe ability to read *.R96 residue files created DEEM program versions prior to version 7. Theprogram Convert96.exe, included in the DEEM program directory, converts DEEM residuefiles that have the following extensions to R96 files:
*.R89 (for DEEM89T files based on TAS recipes and the 1989 through 1992 CSFIIconsumption data),*.R91 (for DEEM89N files based on Novigen translation factors and the 1989 through1992 CSFII consumption data), and*.R95 (for DEEM96 files based on Novigen translation factors for the 1994 through1996CSFII BEFORE the survey data were completed)

DEEM Users Manual©2000 Novigen Sciences, Inc.
5 - 19
The process of converting these older residue files using the Convert96 utility includes: (1)updating the internal validation code to the code needed for R96 files; (2) omitting FF indices atthe beginning of each line of FF data (these had been unique for each survey year; they are nolonger needed); and (3) for those RACs with foodforms listed, converting each foodform code inthe old file that no longer exists in the new file format using a “map” file specific to theconversion year (1989, 1991, 1995).
The analyst must be aware that the FF conversion may raise some problems. Specifically, if twoFF in an earlier version of the residue file each have a different residue and/or RDF2 file pointer,and are converted to the same new FF, then some information will be lost. The conversion ruleused in this case is that the FF with the highest residue value is carried over to the new FF, alongwith its RDF file pointer. When multiple FF with different residue amounts or RDF pointers arecollapsed, an advisory report is generated (“*.txt”). The advisory report identifies the RAC/FFcombinations that have been dropped or changed. This file is assigned the default name of theresidue file to be converted and is saved to the same directory as the R96 file. The user has theoption to change the path and or name of the advisory file.
An R96 file generated by the Convert96 program will be slightly different than an R96 filegenerated or edited by the DEEM residue file editor. For example, the converted file lists onlythose FF that have nonzero residues and/or RDF file pointers. The file saved by the DEEMresidue file editor will list all foodforms for a given RAC, regardless of the residue value or RDFpointer. You must load and SAVE the converted residue file (R96) into the DEEM file editorto review the file to confirm that the data have been faithfully converted to the new format.Failing to save the converted file may result in program errors when the file is used in ananalysis.
The following screen will be displayed once the convert program has been accessed.
Screen 5.4: Convert Utility
2 RDF = Residue Distribution File used in acute Monte Carlo Analysis (Chapter 7).
DEEM Users Manual©2000 Novigen Sciences, Inc.
5 - 20
Running the utility requires the following steps.
(1) Specify the type of file to be converted (R89, R91, or R95).(2) Specify the path of the existing residue file.(3) Either specify the name of the existing residue file or click on the “Show Old Files”
button. If you use the latter method, a dialog box will appear showing the availablefiles in the designated path. You can change directories if you wish; if you do so, thepath for the old file will be updated when you select the file to be converted. If youuse the dialog box method of selecting a file to be converted, the filename of the newfile will be automatically entered in the appropriate box. You can edit this new filename if you want to save it under a different name.
(4) Specify the path for saving the new file.(5) If the filename of the new file is not already in the last data field (see step 3) then you
must enter the filename here. If you do not include the filename extension it will beentered automatically. If you do enter a filename extension, it must be “R96.”
(6) Enter the name of the advisory file. The program automatically assigns the residuefile name (with a TXT extension); you may change the name of the file.
(7) Click on the “Convert” button to generate the new file. You will get a confirmationmessage that the file conversion is complete.
(8) Click on exit to close this utility.
The advisory file lists all RAC/foodform conversions that were changed or deleted from theconverted file. Some of the previous RACs have been changed because of changes in theNovigen translation factors. Some conversions have asterisks at the right side of the RAC name;these should be examined carefully before you accept the conversion results.
Changes in the translation factors that have been used by Novigen to convert the foods reported“as eaten” to their constituent ingredients (i.e., RACs) have occurred over time. In addition,previous DEEM residue files were specific to a single CSFII. Thus, there is not a one-to-onecorrespondence between all of the available RAC/FF combinations in previous residue files andR96 residue files.
RAC/FF combinations that have a non-zero residue value and/or a non-zero RDF pointer in theprevious file and that are available in the R96 RAC/FF database are directly converted from theold file to the new (along with the corresponding residue value, RDF pointer, adjustment values,and documentation, if any). These parameters always take precedence in the conversion processover parameters for food forms that must be converted to another food form code. RAC/FFcombinations in the previous file that do not have an available counterpart in the R96 RAC/FFdatabase are converted using a “map” file provided with the Convert96 program.

DEEM Users Manual©2000 Novigen Sciences, Inc.
5 - 21
For example, RAC 5 has six food forms in the R96 database: 11, 13, 14, 31, 34, and 41. In aprevious residue file there were residue data for FF 13, 14, and 15. RAC5/FF15 is to beconverted to RAC5/FF14 (based on the map file). The program would convert RAC5/FF15 toRAC5/FF14; however, its residue value would be dropped, since the residue value and RDFpointer, etc., for RAC5/FF14 are taken directly from this RAC/FF combination in the previousfile. RAC5/FF15 would be reported in the advisory file as having been changed to RAC5/FF14.
If one or more RAC/FF combinations in a previous residue file are translated to a commonRAC/FF combination in the R96 file (based on translation data in the map file), and there is noRAC/FF combination in the older file that matches this common RAC/FF combination, then thehighest residue value for any such RAC/FF combination brought over is used with the newRAC/FF combination, along with its RDF pointer, adjustment factors, and documentation.Extending the example above for RAC 5, if FF32 and FF33 are to be converted to FF31 andFF31 was not included in the older file, then FF31 would be included in the new file along withthe residue value (and the RDF pointer, etc.) from either FF32 or FF33, whichever residue valueis higher (not on which RDF pointer value is higher). All of these converted RAC/FFcombinations will be reported in the advisory file.
Note: the map file may specify that some RAC/FF combinations that do not have a directcounterpart in the R96 file could not be converted. RAC/FF combinations that are not convertedalso will be reported in the advisory file.
Converting residue file formats to RS7 files: It is possible to edit a R96 file directly in theresidue file editor of DEEM 7. Once edited, the file will be saved in the RS7 format. To utilizeR89, R91 or R95 files in DEEM 7.0, you must first convert them to a R96 file. (Note that R96files may be used directly in DEEM 7.0 analyses, without saving as a RS7 file).

DEEM Users Manual©2000 Novigen Sciences, Inc.
6 - 1
CHAPTER 6. CHRONIC EXPOSURE ANALYSIS INCLUDING COMMODITYCONTRIBUTION ANALYSIS
The Chronic Analysis Option of DEEM can be used to estimate total exposure for the USpopulation and 25 (1994/96 CSFII) or 26 (1989/92 CSFII) subgroups of the population.Subgroups are divided by regions of the country or seasons of the year, age, gender, or ethnicity.(See Appendix B for a breakdown of the geographical regions and seasons.)
The Commodity Contribution Analysis, explained in more detail below, can be used to identifythe contribution of individual foods (and foodforms) to the overall estimate of dietary exposure.
Each DEEM analysis requires two data sets (1) mean food consumption files and (2) residueanalysis files. The food consumption files are already included in DEEM and are a fixed dataset that cannot be altered. The user must create a residue file for the chemical of interest.Residue analysis files are created by procedures described in Chapter 5 and by following the on-screen instructions.
NOTE: A residue analysis file must be created and saved prior to conducting an exposureanalysis.
At the DEEM Main Menu Screen, click on “Analysis” then “Run Chronic.” You will then beprompted for your password. After the password has been entered correctly, Screen 6.1 willappear:

DEEM Users Manual©2000 Novigen Sciences, Inc.
6 - 2
Screen 6.1: Chronic Analysis Window
Select the file to be analyzed by clicking on “File” then “Open Residue File.”
You then will be given a listing of the available files. Note that you may select files fromdirectories other than the default established through the SETUP option (Chapter 2).
Highlight the file to be used in the current analysis and click “Open.” The file characteristics(e.g., date created, directory location, etc.) will be displayed under the heading ‘Residue File’ inthe Chronic Analysis Window.
You will have the option of using the 1989/92 CSFII or 1994/96 CSFII data for the analysis. Inaddition, you will have the option of including the second adjustment factor in the calculations.
You also will be given the option of comparing the exposure results (expressed as mgchemical/kg bw/day) to the chronic RfD, chronic NOEL, both, or to the Q1*. Exposureestimates will be expressed as a percent of the RfD; selecting the NOEL will produce Margins ofExposure. Chronic exposure estimates compared to a Q* value will be expressed as a lifetime
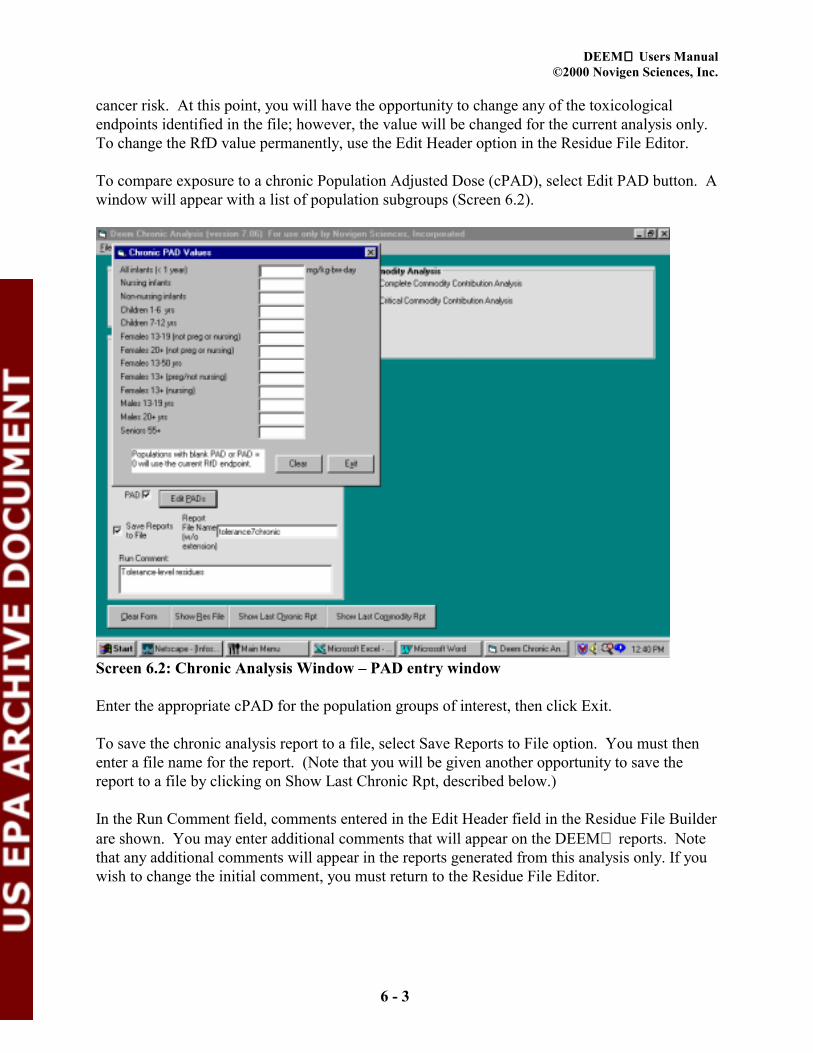
DEEM Users Manual©2000 Novigen Sciences, Inc.
6 - 3
cancer risk. At this point, you will have the opportunity to change any of the toxicologicalendpoints identified in the file; however, the value will be changed for the current analysis only.To change the RfD value permanently, use the Edit Header option in the Residue File Editor.
To compare exposure to a chronic Population Adjusted Dose (cPAD), select Edit PAD button. Awindow will appear with a list of population subgroups (Screen 6.2).
Screen 6.2: Chronic Analysis Window – PAD entry window
Enter the appropriate cPAD for the population groups of interest, then click Exit.
To save the chronic analysis report to a file, select Save Reports to File option. You must thenenter a file name for the report. (Note that you will be given another opportunity to save thereport to a file by clicking on Show Last Chronic Rpt, described below.)
In the Run Comment field, comments entered in the Edit Header field in the Residue File Builderare shown. You may enter additional comments that will appear on the DEEM reports. Notethat any additional comments will appear in the reports generated from this analysis only. If youwish to change the initial comment, you must return to the Residue File Editor.
DEEM Users Manual©2000 Novigen Sciences, Inc.
6 - 4
You may view or obtain a hard copy of the residue data used in your analysis by checking the“Show Res File” button. You will then be prompted to display the report to screen, save to disk,send directly to printer or cancel the action.
DEEM saves the chronic analysis as a temporary file. Each time the program is accessed,results from the last analysis will be available for viewing. Once an analysis is run, thispreviously conducted analysis will be replaced with the current one. The “Show Last ChronicRpt” button permits the user to display, save, or print the analysis report. If you wish to send thefile to the printer, make sure that your printer is on line.
If you select to save a report to disk, you will be prompted to enter a file name.
We will use the TOLERANCE7.RS7 residue file created in Chapter 5 to conduct a chronicexposure analysis. Using consumption data from the 1994/1996 CSFII, Table 6.1 presents theresulting exposure analysis. Repeat the same procedures using the CHRONIC7.RS7 file createdin Chapter 5 to obtain an exposure analysis for NOVICHEM using anticipated residues (again,with the 1994/1996 CSFII data). The results of the second analysis are shown in Table 6.2

DEEM Users Manual©2000 Novigen Sciences, Inc.
6 - 5
TABLE 6.1
CHRONIC DIETARY EXPOSURE ESTIMATES FOR NOVICHEMUSING TOLERANCES
Novigen Sciences, Incorporated Ver. 7.06DEEM Chronic analysis for NOVICHEM (1994-96 data)Residue file name: H:\DEEM7 training\tolerance7.RS7 Adjustment factor #2 used.Analysis Date 02-02-2000/14:07:54 Residue file dated: 02-02-2000/13:33:29/1Reference dose (RfD, Chronic) = .001 mg/kg bw/dayNOEL (Chronic) = 1 mg/kg bw/dayCOMMENT 1: Tolerance-level residues=============================================================================== Total exposure by population subgroup-------------------------------------------------------------------------------
Total Exposure ----------------------------------- Population mg/kg Margin of Percent Subgroup body wt/day Exposure 1/ of PAD-------------------------------------- ------------- ---------- ---------U.S. Population (total) 0.000754 1,325 75.4%
U.S. Population (spring season) 0.000735 1,361 73.5%U.S. Population (summer season) 0.000836 1,197 83.6%U.S. Population (autumn season) 0.000733 1,365 73.3%U.S. Population (winter season) 0.000713 1,403 71.3%
Northeast region 0.000770 1,299 77.0%Midwest region 0.000786 1,272 78.6%Southern region 0.000691 1,447 69.1%Western region 0.000808 1,238 80.8%
Hispanics 0.000874 1,144 87.4%Non-hispanic whites 0.000741 1,350 74.1%Non-hispanic blacks 0.000718 1,392 71.8%Non-hisp/non-white/non-black 0.000795 1,257 79.5%
All infants (< 1 year) (.0003*) 0.001804 554 601.4%Nursing infants 0.000693 1,443 69.3%Non-nursing infants 0.002129 470 212.9%Children 1-6 yrs 0.002424 412 242.4%Children 7-12 yrs 0.001179 849 117.9%
Females 13-19 (not preg or nursing) 0.000562 1,779 56.2%Females 20+ (not preg or nursing) 0.000458 2,185 45.8%Females 13-50 yrs 0.000476 2,102 47.6%Females 13+ (preg/not nursing) 0.000732 1,366 73.2%Females 13+ (nursing) 0.000683 1,464 68.3%
Males 13-19 yrs 0.000657 1,523 65.7%Males 20+ yrs 0.000488 2,047 48.8%Seniors 55+ 0.000494 2,023 49.4%
*PAD in mg/kg-bw-day-------------------------------------------------------------------------------

DEEM Users Manual©2000 Novigen Sciences, Inc.
6 - 6
TABLE 6.2
CHRONIC DIETARY EXPOSURE ESTIMATES FOR NOVICHEMUSING ANTICIPATED RESIDUES
Novigen Sciences, Incorporated Ver. 7.06DEEM Chronic analysis for NOVICHEM (1994-96 data)Residue file name: H:\DEEM7 training\chronic7.RS7 Adjustment factor #2 used.Analysis Date 02-03-2000/15:35:50 Residue file dated: 02-03-2000/15:35:04/1Reference dose (RfD, Chronic) = .001 mg/kg bw/dayNOEL (Chronic) = 1 mg/kg bw/dayCOMMENT 1: Anticipated residues=============================================================================== Total exposure by population subgroup-------------------------------------------------------------------------------
Total Exposure ----------------------------------- Population mg/kg Margin of Percent Subgroup body wt/day Exposure 1/ of PAD-------------------------------------- ------------- ---------- ---------U.S. Population (total) 0.000178 5,608 17.8%
U.S. Population (spring season) 0.000177 5,638 17.7%U.S. Population (summer season) 0.000181 5,520 18.1%U.S. Population (autumn season) 0.000181 5,510 18.1%U.S. Population (winter season) 0.000173 5,788 17.3%
Northeast region 0.000170 5,872 17.0%Midwest region 0.000195 5,121 19.5%Southern region 0.000171 5,838 17.1%Western region 0.000179 5,601 17.9%
Hispanics 0.000202 4,961 20.2%Non-hispanic whites 0.000169 5,922 16.9%Non-hispanic blacks 0.000205 4,886 20.5%Non-hisp/non-white/non-black 0.000204 4,898 20.4%
All infants (< 1 year) (.0003*) 0.000117 8,575 38.9%Nursing infants 0.000024 41,387 2.4%Non-nursing infants 0.000144 6,960 14.4%Children 1-6 yrs 0.000402 2,487 40.2%Children 7-12 yrs 0.000259 3,855 25.9%
Females 13-19 (not preg or nursing) 0.000145 6,874 14.5%Females 20+ (not preg or nursing) 0.000115 8,696 11.5%Females 13-50 yrs 0.000126 7,940 12.6%Females 13+ (preg/not nursing) 0.000158 6,318 15.8%Females 13+ (nursing) 0.000149 6,699 14.9%
Males 13-19 yrs 0.000212 4,711 21.2%Males 20+ yrs 0.000164 6,080 16.4%Seniors 55+ 0.000120 8,346 12.0%
*PAD in mg/kg-bw-day-------------------------------------------------------------------------------
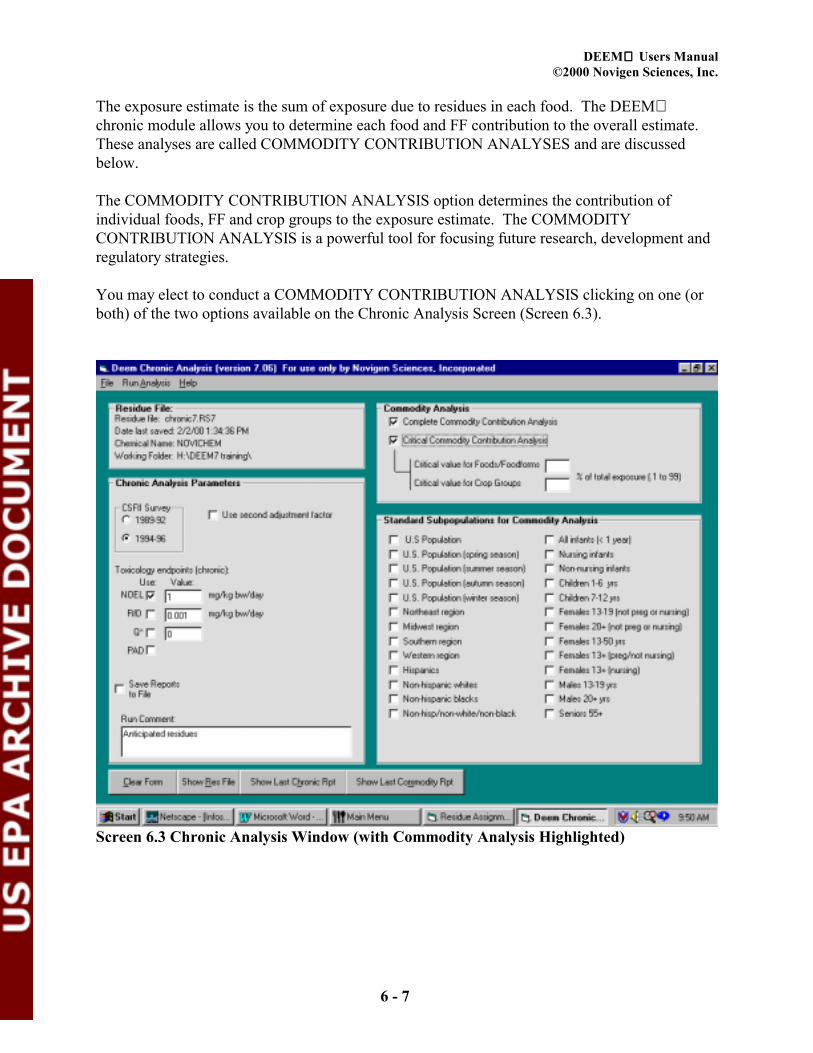
DEEM Users Manual©2000 Novigen Sciences, Inc.
6 - 7
The exposure estimate is the sum of exposure due to residues in each food. The DEEMchronic module allows you to determine each food and FF contribution to the overall estimate.These analyses are called COMMODITY CONTRIBUTION ANALYSES and are discussedbelow.
The COMMODITY CONTRIBUTION ANALYSIS option determines the contribution ofindividual foods, FF and crop groups to the exposure estimate. The COMMODITYCONTRIBUTION ANALYSIS is a powerful tool for focusing future research, development andregulatory strategies.
You may elect to conduct a COMMODITY CONTRIBUTION ANALYSIS clicking on one (orboth) of the two options available on the Chronic Analysis Screen (Screen 6.3).
Screen 6.3 Chronic Analysis Window (with Commodity Analysis Highlighted)

DEEM Users Manual©2000 Novigen Sciences, Inc.
6 - 8
1. Complete Commodity Analysis
The Complete Commodity Analysis reports the contribution of every commodity,expressed both as mg chemical/kg bw/day and as a percent of the Reference Dose(RfD) or PAD, or lifetime cancer risk, or MOE.
2. Critical Commodity Analysis
The critical commodity analysis reports the exposure from those foods thatcontribute a user-specified proportion of the overall exposure, e.g., 1% of totalexposure. The critical commodity listing is expressed as both a percent of theRfD (or PAD, or lifetime cancer risk, or MOE) and as a percent of total exposure.
Population subgroups for which commodity contribution analyses are desired are selected byclicking on the population of interest. If you request a critical commodity analysis, you must alsospecify the criteria for inclusion in the analysis, i.e., those foods that contribute at least X% of thetotal exposure (Screen 6.4).
Screen 6.4 Critical Commodity Contribution Analysis Options

DEEM Users Manual©2000 Novigen Sciences, Inc.
6 - 9
NOTE: The criteria for including foods and crop groups in the critical commodity analysis maybe different. For example, include those foods or FF that contribute at least 1% of exposure butonly those crop groups which contribute at least 5% of exposure and for which no individualfood contributes at least 1% of total exposure.
To view the analysis, click on Show Last Commodity Rpt at the bottom of the screen. You willbe given the option of viewing the report, sending it to a printer, or saving it to a disk file. Likethe chronic analysis report, DEEM will store the commodity report as a temporary file and willreplace the file each time an analysis is conducted. The user may save the report to file byselecting Save Reports to File prior to conducting the analysis.
When you’ve completed the commodity contribution analysis for all of the subgroups of interest,you may exit the window by clicking on “File” then “Exit.”
We will use the commodity contribution analysis to complete our chronic analysis ofNOVICHEM by conducting both a complete commodity contribution analysis and a criticalcommodity contribution analysis for the overall US population. For the example, we will use theTOLERANCE7.RS7 residue file constructed in Chapter 5. The chronic exposure analysis forTOLERANCE7.RS7 is shown in Table 6.1. We will limit our critical commodity analysis tothose foods that are greater than 1% of total exposure, and to those crop groups whose memberfoods contribute at least 5% of total exposure.
Table 6.3 presents the resulting critical commodity contribution analysis for the overall USpopulation. The complete commodity contribution analysis for the US Population is shown inTable 6.4.

DEEM Users Manual©2000 Novigen Sciences, Inc.
6 - 10
TABLE 6.3
CRITICAL COMMODITY CONTRIBUTION ANALYSIS FOR NOVICHEM(USING TOLERANCES AND 1994/1996 CSFII)
Novigen Sciences, Incorporated Ver. 7.06DEEM Chronic analysis for NOVICHEM (1994-96 data)Residue file name: H:\DEEM7 training\tolerance7.RS7 Adjustment factor #2 used.Analysis Date 02-02-2000/14:07:57 Residue file dated: 02-02-2000/13:33:29/1Reference dose (RfD, Chronic) = .001 mg/kg bw/dayNOEL (Chronic) = 1 mg/kg bw/dayCOMMENT 1: Tolerance-level residues=============================================================================== Critical Commodity Contribution Analysis for U.S. Population (total)
Total Exposure =.0007545 mg/kg bw/day
Crop groups with total exposure contribution > 5% Foods/Foodforms with exposure contribution > 1%-------------------------------------------------------------------------------
Crop group ------------ Exposure Analysis ----------- Food mg/kg |% of Total|Margin of| Percent Foodform body wt/day| Exposure |Exposr 1/| of RfD---------------------------------- -----------|----------|---------|---------
Crop Group = (O) Other Grapes-juice 0.0000108 1.44% 92,349 1.1%---------------------------------- -----------|----------|---------|--------- Total for crop group 0.0000331 4.39% 30,179 3.3%
Crop Group = (M) Meat Beef-fat w/o bones 0.0000180 2.38% 55,710 1.8% Beef-lean (fat/free) w/o bones 0.0000745 9.87% 13,428 7.4% Pork-fat w/o bone 0.0000102 1.35% 98,017 1.0% Pork-lean (fat free) w/o bone 0.0000312 4.14% 32,052 3.1%---------------------------------- -----------|----------|---------|--------- Total for crop group 0.0001386 18.37% 7,214 13.9%
Crop Group = (D) Dairy Products Milk-nonfat solids 0.0000206 2.74% 48,430 2.1% Milk-fat solids 0.0000157 2.08% 63,627 1.6% Milk sugar (lactose) 0.0000205 2.71% 48,831 2.0% Milk-based water 0.0002753 36.49% 3,632 27.5%---------------------------------- -----------|----------|---------|--------- Total for crop group 0.0003322 44.02% 3,011 33.2%
Crop Group = (4) Leafy Vegetables (except Brassica) Lettuce-head varieties 0.0000230 3.05% 43,437 2.3%---------------------------------- -----------|----------|---------|--------- Total for crop group 0.0000299 3.96% 33,486 3.0%
Crop Group = (4A) Leafy Greens Lettuce-head varieties 0.0000230 3.05% 43,437 2.3%---------------------------------- -----------|----------|---------|--------- Total for crop group 0.0000240 3.18% 41,672 2.4%

DEEM Users Manual©2000 Novigen Sciences, Inc.
6 - 11
TABLE 6.3 (CONT’D)
Crop group ------------ Exposure Analysis ----------- Food mg/kg |% of Total|Margin of| Percent Foodform body wt/day| Exposure |Exposr 1/| of RfD---------------------------------- -----------|----------|---------|---------
Crop Group = (8) Fruiting Vegetables Tomatoes-whole 0.0000092 1.22% 108,574 0.9% Tomatoes-puree 0.0000146 1.94% 68,462 1.5% Tomatoes-paste 0.0000138 1.83% 72,409 1.4%---------------------------------- -----------|----------|---------|--------- Total for crop group 0.0000420 5.56% 23,832 4.2%
Crop Group = (11) Pome Fruits Apples 0.0000155 2.06% 64,389 1.6% Apples-juice/cider 0.0000266 3.53% 37,568 2.7%---------------------------------- -----------|----------|---------|--------- Total for crop group 0.0000470 6.23% 21,260 4.7%
Crop Group = (12) Stone Fruits Nectarines 0.0000205 2.72% 48,745 2.1% Peaches 0.0001036 13.73% 9,650 10.4%---------------------------------- -----------|----------|---------|--------- Total for crop group 0.0001317 17.46% 7,593 13.2%
Total for crop groups listed above: 0.0007545 100.00% 1,325 75.4%-------------------------------------------------------------------------------
1. Margin of Exposure = NOEL / Dietary Exposure

DEEM Users Manual©2000 Novigen Sciences, Inc.
6 - 12
TABLE 6.4
COMPLETE COMMODITY CONTRIBUTION ANALYSIS FOR NOVICHEM(USING TOLERANCES AND 1994/1996 CSFII)
Novigen Sciences, Incorporated Ver. 7.06DEEM Chronic analysis for NOVICHEM (1994-96 data)Residue file name: H:\DEEM7 training\tolerance7.RS7 Adjustment factor #2 used.Analysis Date 02-02-2000/14:07:57 Residue file dated: 02-02-2000/13:33:29/1Reference dose (RfD, Chronic) = .001 mg/kg bw/dayNOEL (Chronic) = 1 mg/kg bw/dayCOMMENT 1: Tolerance-level residues=============================================================================== Complete commodity contribution analysis for U.S. Population (total)-------------------------------------------------------------------------------
Crop Group = (O) Other Exposure Analysis ---------------------------- Residue Adjustment mg/kg |Margin of| Perc. Food name (ppm) Factors body wt/day|Exposr 1/|of RfD------------------------- ---------- ------------- -----------|---------|------Grapes 0.050000 1.000 1.000 0.0000045 221,907 0.5%Grapes-raisins 0.050000 4.300 1.000 0.0000060 165,716 0.6%Grapes-juice 0.050000 1.200 1.000 0.0000108 92,349 1.1%Strawberries 0.020000 1.000 1.000 0.0000012 839,574 0.1%Grapes-leaves 0.050000 1.000 1.000 0.0000000 >1000000 0.0%Cottonseed-oil 0.050000 1.000 1.000 0.0000015 650,830 0.2%Cottonseed-meal 0.050000 1.000 1.000 0.0000000 >1000000 0.0%Grapes-wine and sherry 0.050000 1.000 1.000 0.0000064 156,987 0.6%Grapes-juice-concentrate 0.050000 3.600 1.000 0.0000026 387,525 0.3%Strawberries-juice 0.020000 1.000 1.000 0.0000001 >1000000 0.0% ----------- -------- ------- Crop group subtotal 0.0000331 30,179 3.3%
Crop Group = (M) Meat Exposure Analysis ---------------------------- Residue Adjustment mg/kg |Margin of| Perc. Food name (ppm) Factors body wt/day|Exposr 1/|of RfD------------------------- ---------- ------------- -----------|---------|------Beef-meat byproducts 0.200000 1.000 1.000 0.0000012 832,362 0.1%Beef-other organ meats 0.100000 1.000 1.000 0.0000003 >1000000 0.0%Beef-dried 0.100000 1.920 1.000 no exposureBeef-fat w/o bones 0.100000 1.000 1.000 0.0000180 55,710 1.8%Beef-kidney 0.100000 1.000 1.000 0.0000000 >1000000 0.0%Beef-liver 0.200000 1.000 1.000 0.0000011 928,505 0.1%Beef-lean (fat/free) w/o 0.100000 1.000 1.000 0.0000745 13,428 7.4%Goat-meat byproducts 0.200000 1.000 1.000 no exposureGoat-other organ meats 0.100000 1.000 1.000 no exposureGoat-fat w/o bone 0.100000 1.000 1.000 0.0000000 >1000000 0.0%Goat-kidney 0.100000 1.000 1.000 no exposureGoat-liver 0.200000 1.000 1.000 no exposureGoat-lean (fat/free) w/o 0.100000 1.000 1.000 0.0000002 >1000000 0.0%Horsemeat 0.200000 1.000 1.000 no exposureSheep-meat byproducts 0.200000 1.000 1.000 no exposure

DEEM Users Manual©2000 Novigen Sciences, Inc.
6 - 13
TABLE 6.4 (CONT’D)
Crop Group = (M) Meat (continued) Exposure Analysis ---------------------------- Residue Adjustment mg/kg |Margin of| Perc. Food name (ppm) Factors body wt/day|Exposr 1/|of RfD------------------------- ---------- ------------- -----------|---------|------Sheep-other organ meats 0.100000 1.000 1.000 no exposureSheep-fat w/o bone 0.100000 1.000 1.000 0.0000001 >1000000 0.0%Sheep-kidney 0.100000 1.000 1.000 no exposureSheep-liver 0.200000 1.000 1.000 no exposureSheep-lean (fat free) w/o 0.100000 1.000 1.000 0.0000005 >1000000 0.1%Pork-meat byproducts 0.200000 1.000 1.000 0.0000005 >1000000 0.1%Pork-other organ meats 0.100000 1.000 1.000 0.0000001 >1000000 0.0%Pork-fat w/o bone 0.100000 1.000 1.000 0.0000102 98,017 1.0%Pork-kidney 0.100000 1.000 1.000 no exposurePork-liver 0.200000 1.000 1.000 0.0000002 >1000000 0.0%Pork-lean (fat free) w/o 0.100000 1.000 1.000 0.0000312 32,052 3.1%Veal-fat w/o bones 0.100000 1.000 1.000 0.0000000 >1000000 0.0%Veal-lean (fat free) w/o 0.100000 1.000 1.000 0.0000005 >1000000 0.0%Veal-kidney 0.100000 1.000 1.000 0.0000000 >1000000 0.0%Veal-liver 0.200000 1.000 1.000 0.0000000 >1000000 0.0%Veal-other organ meats 0.100000 1.000 1.000 no exposureVeal-dried 0.100000 1.920 1.000 no exposureVeal-meat byproducts 0.200000 1.000 1.000 no exposure ----------- -------- ------- Crop group subtotal 0.0001386 7,214 13.9%
Crop Group = (D) Dairy Products Exposure Analysis ---------------------------- Residue Adjustment mg/kg |Margin of| Perc. Food name (ppm) Factors body wt/day|Exposr 1/|of RfD------------------------- ---------- ------------- -----------|---------|------Milk-nonfat solids 0.050000 1.000 1.000 0.0000206 48,430 2.1%Milk-fat solids 0.050000 1.000 1.000 0.0000157 63,627 1.6%Milk sugar (lactose) 0.050000 1.000 1.000 0.0000205 48,831 2.0%Milk-based water 0.050000 1.000 1.000 0.0002753 3,632 27.5% ----------- -------- ------- Crop group subtotal 0.0003322 3,011 33.2%
Crop Group = (4) Leafy Vegetables (except Brassica) Exposure Analysis ---------------------------- Residue Adjustment mg/kg |Margin of| Perc. Food name (ppm) Factors body wt/day|Exposr 1/|of RfD------------------------- ---------- ------------- -----------|---------|------Celery 0.100000 1.000 1.000 0.0000058 172,090 0.6%Lettuce-leafy varieties 0.100000 1.000 1.000 0.0000009 >1000000 0.1%Lettuce-unspecified 0.100000 1.000 1.000 0.0000000 >1000000 0.0%Lettuce-head varieties 0.100000 1.000 1.000 0.0000230 43,437 2.3%Celery juice 0.100000 1.000 1.000 0.0000001 >1000000 0.0% ----------- -------- ------- Crop group subtotal 0.0000299 33,486 3.0%

DEEM Users Manual©2000 Novigen Sciences, Inc.
6 - 14
TABLE 6.4 (CONT’D)
Crop Group = (4A) Leafy Greens Exposure Analysis ---------------------------- Residue Adjustment mg/kg |Margin of| Perc. Food name (ppm) Factors body wt/day|Exposr 1/|of RfD------------------------- ---------- ------------- -----------|---------|------Lettuce-leafy varieties 0.100000 1.000 1.000 0.0000009 >1000000 0.1%Lettuce-unspecified 0.100000 1.000 1.000 0.0000000 >1000000 0.0%Lettuce-head varieties 0.100000 1.000 1.000 0.0000230 43,437 2.3% ----------- -------- ------- Crop group subtotal 0.0000240 41,672 2.4%
Crop Group = (4B) Leaf Petioles Exposure Analysis ---------------------------- Residue Adjustment mg/kg |Margin of| Perc. Food name (ppm) Factors body wt/day|Exposr 1/|of RfD------------------------- ---------- ------------- -----------|---------|------Celery 0.100000 1.000 1.000 0.0000058 172,090 0.6%Celery juice 0.100000 1.000 1.000 0.0000001 >1000000 0.0% ----------- -------- ------- Crop group subtotal 0.0000059 170,454 0.6%
Crop Group = (8) Fruiting Vegetables Exposure Analysis ---------------------------- Residue Adjustment mg/kg |Margin of| Perc. Food name (ppm) Factors body wt/day|Exposr 1/|of RfD------------------------- ---------- ------------- -----------|---------|------Tomatoes-whole 0.020000 1.000 1.000 0.0000092 108,574 0.9%Tomatoes-juice 0.020000 1.500 1.000 0.0000012 864,970 0.1%Tomatoes-puree 0.020000 3.300 1.000 0.0000146 68,462 1.5%Tomatoes-paste 0.020000 5.400 1.000 0.0000138 72,409 1.4%Tomatoes-catsup 0.020000 2.500 1.000 0.0000032 315,851 0.3%Tomatoes-dried 0.020000 14.300 1.000 0.0000000 >1000000 0.0% ----------- -------- ------- Crop group subtotal 0.0000420 23,832 4.2%
Crop Group = (11) Pome Fruits Exposure Analysis ---------------------------- Residue Adjustment mg/kg |Margin of| Perc. Food name (ppm) Factors body wt/day|Exposr 1/|of RfD------------------------- ---------- ------------- -----------|---------|------Apples 0.035000 1.000 1.000 0.0000155 64,389 1.6%Apples-dried 0.035000 8.000 1.000 0.0000008 >1000000 0.1%Apples-juice/cider 0.035000 1.300 1.000 0.0000266 37,568 2.7%Apples-juice-concentrate 0.035000 3.900 1.000 0.0000041 246,576 0.4% ----------- -------- ------- Crop group subtotal 0.0000470 21,260 4.7%

DEEM Users Manual©2000 Novigen Sciences, Inc.
6 - 15
TABLE 6.4 (CONT’D)
Crop Group = (12) Stone Fruits Exposure Analysis ---------------------------- Residue Adjustment mg/kg |Margin of| Perc. Food name (ppm) Factors body wt/day|Exposr 1/|of RfD------------------------- ---------- ------------- -----------|---------|------Nectarines 1.000000 1.000 1.000 0.0000205 48,745 2.1%Peaches 1.000000 1.000 1.000 0.0001036 9,650 10.4%Peaches-dried 1.000000 7.000 1.000 0.0000020 499,501 0.2%Peaches-juice 1.000000 1.000 1.000 0.0000056 179,921 0.6% ----------- -------- ------- Crop group subtotal 0.0001317 7,593 13.2%
Population subgroup total 0.0007545 1,325 75.4%-------------------------------------------------------------------------------
1. Margin of Exposure = NOEL / Dietary Exposure
DEEM Users Manual©2000 Novigen Sciences, Inc.
7 - 1
CHAPTER 7. ACUTE EXPOSURE ANALYSIS
The Acute exposure analysis option of DEEM can be used to estimate short-term (e.g., daily)total exposure for the US population and for subgroups of the US population. For example, theAcute exposure analysis option can be used to evaluate potential exposure for various age, sex,reproductive status and ethnic subgroups. It also may be used to estimate exposure at differentseasons of the year and in different regions of the country. Although the program contains 27standard populations, you can define many additional subgroups. (Note that the populationsubgroups are not identical between the data sets. For example, the 1989/92 CSFII included thegeographical region, Western US and was further divided into the regions, Mountain and Pacific.In the 1994/96 CSFII, no further breakdown of the Western region was provided by USDA.)
Please note that if the advanced CEC functions have not been licensed, several of the CECcapaibilities will be unavailable, including: The commodity-level summary at the top of the CECreport; the ability to specify an upper bound other than 100%; the ability to perform “Redo LastCEC”.
Like the DEEM Chronic analysis, the Acute analysis option requires two data sets (1)individual food consumption files and (2) residue analysis files. The food consumption files areincluded with the DEEM programs and were installed along with the program files. Youcannot modify the food consumption files. You must create a residue analysis file for eachchemical for which you wish to conduct an exposure assessment.
After you have created and saved your residue analysis file, you can immediately conduct anacute exposure analysis by returning to the main menu and clicking on “Analysis” then “RunAcute.” You will be prompted to enter your password.
Once the password has been entered correctly, Screen 7.1 will be displayed.

DEEM Users Manual©2000 Novigen Sciences, Inc.
7 - 2
Screen 7.1: Acute analysis entry screen.
The program will save the files to the default directory specified during the initial setup unlessyou change the directory. To open a file, click on “File” then “Open.” You may select a file froma directory by highlighting the specific directory, then selecting the residue file of interest. If youselect a file from a directory other than the default directory, the directory must be valid.
To select a residue file, double click on the file of interest or single click, then press <enter>.
Information about the selected file appears under the heading Residue File in the upper leftsection of the window Screen 7.2. To select a different file, click on “File” then “Close.” Toopen a new file, click on “File” then “Open.”

DEEM Users Manual©2000 Novigen Sciences, Inc.
7 - 3
Screen 7.2: Acute Analysis Input Screen (after residue file is selected)
Note that once the residue file has been selected, you then will be given a choice of conductingthe analysis using the 1989/92 or 1994/96 CSFII data. If RDF files have been included in theresidue file, the acute menu will provide the user with the option of conducting a Monte Carloanalysis (Screen 7.3).

DEEM Users Manual©2000 Novigen Sciences, Inc.
7 - 4
Screen 7.3: Acute Analysis Input Screen (residue file for Monte Carlo analysis selected)
When electing to divide the exposure estimate by respondents’ body weights, the program willdisplay the aRfD and NOEL provided in the original residue file. The user has the opportunity tochange these values for this analysis only. If you wish to permanently change the aRfD or NOELin your analysis file you must return to the Add/Edit Header option (Residue File Editor) andmake the change in the “Header” information.
To compare exposure to an acute Population Adjusted Dose (aPAD), select the Use PAD option.A window will be displayed with a list of population subgroups. You then must enter the aPADvalue for the population group of interest. Note that if the aPAD applies to populationssubgroups not listed, the aPAD value may be entered under the custom population subgroupoption discussed below.
The user also has the option of including the second adjustment factor (Chapter 5) in the currentanalysis. Note that the program always multiplies the residue value by Adjustment factor #1.Including an additional adjustment is to be determined by the analyst.
DEEM Users Manual©2000 Novigen Sciences, Inc.
7 - 5
You have the choice to estimate exposure on a daily- or eating-occasion-basis. In the “dailytotal” assessments, the consumption values correspond to the total daily consumption of the foodor food form. In the “eating occasion” assessment the consumption values correspond to theconsumption levels at each eating occasion as reported in the consumption surveys. The totaldaily exposure estimate for each individual is obtained by summing the calculated exposure foreach food or food form reported consumed during that day and dividing by the persons bodyweight. Note that this option is intended for use with the Monte Carlo acute analyses. Duringeach iteration in a Monte Carlo analysis, a random residue value is assigned to the amount offood consumed, resulting in an exposure estimate.
Total daily amount will receive a single residue value at each iteration. In contrast, eatingoccasion amounts will receive a different residue value each time the food is reported consumed,then the exposure estimates are summed for the particular food of interest. For example, Person1 reported eating four apples in Day 1 of the survey; however, half an apple was consumed in themorning, 1 ½ apples in the afternoon and 2 apples at bedtime. The total amount consumed is 400grams.
The residue distribution for apples is 0.5 ppm to 4 ppm. During one iteration of the Monte Carloanalysis for the daily total, it is possible that the maximum residue will be selected and assignedto the total 400 grams consumed, resulting in an exposure estimate of 1.6 mg ai/person. Byselecting eating occasions, the maximum residue may be assigned to the half apple amount,resulting in an exposure estimate of 0.2 mg ai/person.
If a Monte Carlo Analysis is selected, you will be prompted to enter the number of iterations forthe analysis and the random number seed.
You may also save the analysis to disk by clicking Save Report Files. You will be prompted toenter a file name.
DEEM™ also produces a “plot” file consisting of the entire per-user exposure distribution. Theplot file also includes information about the actual (unweighted) and weighted number of people-days and user-days in the populations considered. The plot file is comma delimited and can beimported in a spreadsheet program for statistical manipulation or to produce graphs.
Another option in the Acute analysis window is the Critical Exposure Commodity (CEC)analysis. This will be discussed in detail later in this chapter. The CEC is analogous to thecritical commodity contribution for the chronic analysis. This feature permits the user to identifythose commodities that are contributing a user-specified percentage to exposure intervalsbetween the 95th percentile of exposure and the maximum exposure estimate.
The “Run Comment” box displays the original comment entered in the header information in theResidue File Editor. The user may enter additional comments that will remain with thedocumentation for the current analysis only.

DEEM Users Manual©2000 Novigen Sciences, Inc.
7 - 6
The screen also provides the user with the option to view the current residue file and RDFsummary (if RDF files are identified in the residue file). The user also is given the choice ofsaving the residue file and RDF summary to disk or sending them to the printer.
Prior to conducting the acute analysis, you must select the populations to be analyzed. You mayselect as many of the standard subgroups as you wish from the menu shown in Screen 7.1 and upto six CUSTOM POPULATIONS for any single analysis, Screen 7.4 presents the demographicparameters available for defining the population subgroups of interest. Once the populationgroup has been defined, click on the Definition Complete button and you will be returned to theDEEMTM Acute Analysis screen.
Screen 7.4: Custom Population Groups
Once you’ve identified the parameters for conducting the analyses and the population groups ofinterest, click on “Run Analysis” at the top of the Acute Analysis screen (Screen 7.2). Aprogress window will appear displaying the status of the analysis (Screen 7.5).

DEEM Users Manual©2000 Novigen Sciences, Inc.
7 - 7
Screen 7.5 Acute analysis progress report
Once the analysis is completed, you will have the option to view the results on the screen and tosave it to disk or to print the results by clicking the “Show Last Acute Rpt” button.
The results of the acute analysis will include the following information for each subgroup:
• the percent of the population who consumed at least one food included in the residuefile (percent consumers)
• mean per-capita consumption (expressed as mg chemical/kg bw/day)• mean consumption per consumer (expressed as mg chemical/kg bw/day)• margins of exposure (MOE) for each estimate of exposure (determined by dividing
the NOEL by the estimated exposure) or percent aRfD or aPAD• Percentiles of exposure expressed on a per-capita and a per-consumer basis. The
MOE (or percent aRfD/aPAD) also is calculated for each percentile.• A summary table of the exposure estimates at the upper percentiles of exposure for all
population groups analyzed is provided at the beginning of the acute report.
A sample analyses has been conducted using the residue file created in Chapter 5(ACUTE7.RS7). Table 7.1 displays the results of an Acute dietary exposure analysis for the USpopulation and for; this analysis is equivalent to an EPA Tier 2 acute analysis.

DEEM Users Manual©2000 Novigen Sciences, Inc.
7 - 8
TABLE 7.1
TIER 2 ACUTE ANALYSIS FOR NOVICHEM
Novigen Sciences, Incorporated Ver. 7.06DEEM ACUTE analysis for NOVICHEM (1994-96 data)Residue file: acute7.RS7 Adjustment factor #2 used.Analysis Date: 02-02-2000/14:17:32 Residue file dated: 02-02-2000/13:35:32/1NOEL (Acute) = 0.250000 mg/kg body-wt/dayAcute Pop Adjusted Dose (aPAD) varies with population; see individual reportsDaily totals for food and foodform consumption used.Run Comment: "Anticipated residues"===============================================================================
Summary calculations (per capita):
95th Percentile 99th Percentile 99.9th Percentile Exposure % aPAD MOE Exposure % aPAD MOE Exposure % aPAD MOE---------- ------- -------- ---------- ------- -------- ---------- ------- --------U.S. Population: 0.000915 36.60 273 0.002209 88.36 113 0.006680 267.21 37All infants: 0.004233 529.16 59 0.008168 1021.03 30 0.013630 1703.78 18

DEEM Users Manual©2000 Novigen Sciences, Inc.
7 - 9
TABLE 7.1 (CONT’D)
Novigen Sciences, Incorporated Ver. 7.06DEEM ACUTE analysis for NOVICHEM (1994-96 data)Residue file: acute7.RS7 Adjustment factor #2 used.Analysis Date: 02-02-2000/14:17:32 Residue file dated: 02-02-2000/13:35:32/1NOEL (Acute) = 0.250000 mg/kg body-wt/dayAcute Reference Dose (aRfD) = 0.002500 mg/kg body-wt/dayDaily totals for food and foodform consumption used.Run Comment: "Anticipated residues"===============================================================================
U.S. Population Daily Exposure Analysis 1/--------------- (mg/kg body-weight/day) per Capita per User ----------- ----------- Mean 0.000294 0.000296 Standard Deviation 0.000534 0.000535 Standard Error of mean 0.000003 0.000003 Margin of Exposure 2/ 849 844 Percent of aRfD 11.77 11.84
Percent of Person-Days that are User-Days = 99.40%
Estimated percentile of user-days falling below calculated exposure in mg/kg body-wt/day with Margin of Exposure (MOE) and Percent of aPAD
Perc. Exposure % aRfD MOE Perc. Exposure % aRfD MOE----- ----------- ------- ---------- ----- ----------- ------- ---------10.00 0.000031 1.26 7,952 90.00 0.000584 23.34 42820.00 0.000065 2.59 3,860 95.00 0.000919 36.75 27230.00 0.000099 3.97 2,515 97.50 0.001370 54.80 18240.00 0.000137 5.46 1,830 99.00 0.002214 88.55 11250.00 0.000177 7.08 1,413 99.50 0.003297 131.90 7560.00 0.000223 8.93 1,119 99.75 0.004852 194.10 5170.00 0.000286 11.43 874 99.90 0.006683 267.31 3780.00 0.000379 15.17 659
Estimated percentile of per-capita days falling below calculated exposure in mg/kg body-wt/day with Margin of Exposure (MOE) and Percent of aPAD
Perc. Exposure % aRfD MOE Perc. Exposure % aRfD MOE----- ----------- ------- ---------- ----- ----------- ------- ---------10.00 0.000030 1.19 8,412 90.00 0.000581 23.25 43020.00 0.000063 2.52 3,970 95.00 0.000915 36.60 27330.00 0.000098 3.91 2,554 97.50 0.001365 54.61 18340.00 0.000135 5.41 1,847 99.00 0.002209 88.36 11350.00 0.000176 7.03 1,422 99.50 0.003293 131.71 7560.00 0.000222 8.89 1,125 99.75 0.004836 193.44 5170.00 0.000285 11.38 878 99.90 0.006680 267.21 3780.00 0.000378 15.11 661-------------------------------------------------------------------------------1/ Analysis based on all two-day participant records in CSFII 1994-96 survey.2/ Margin of Exposure = NOEL/ Dietary Exposure.

DEEM Users Manual©2000 Novigen Sciences, Inc.
7 - 10
TABLE 7.1 (CONT’D)
Novigen Sciences, Incorporated Ver. 7.06DEEM ACUTE analysis for NOVICHEM (1994-96 data)Residue file: acute7.RS7 Adjustment factor #2 used.Analysis Date: 02-02-2000/14:17:32 Residue file dated: 02-02-2000/13:35:32/1NOEL (Acute) = 0.250000 mg/kg body-wt/dayAcute Pop Adjusted Dose (aPAD) = 0.000800 mg/kg body-wt/dayDaily totals for food and foodform consumption used.Run Comment: "Anticipated residues"===============================================================================
All infants Daily Exposure Analysis----------- (mg/kg body-weight/day) per Capita per User ----------- ----------- Mean 0.000614 0.000801 Standard Deviation 0.001701 0.001904 Standard Error of mean 0.000063 0.000083 Margin of Exposure 407 312 Percent of aPAD 76.73 100.06
Percent of Person-Days that are User-Days = 76.68%
Estimated percentile of user-days falling below calculated exposure in mg/kg body-wt/day with Margin of Exposure (MOE) and Percent of aPAD
Perc. Exposure % aPAD MOE Perc. Exposure % aPAD MOE----- ----------- ------- ---------- ----- ----------- ------- ---------10.00 0.000011 1.41 22,173 90.00 0.003004 375.51 8320.00 0.000029 3.59 8,705 95.00 0.005233 654.15 4730.00 0.000053 6.58 4,752 97.50 0.007353 919.08 3440.00 0.000068 8.48 3,683 99.00 0.008514 1064.25 2950.00 0.000084 10.49 2,978 99.50 0.011319 1414.87 2260.00 0.000120 15.02 2,080 99.75 0.013550 1693.80 1870.00 0.000251 31.39 995 99.90 0.015530 1941.24 1680.00 0.000528 65.94 473
Estimated percentile of per-capita days falling below calculated exposure in mg/kg body-wt/day with Margin of Exposure (MOE) and Percent of aPAD
Perc. Exposure % aPAD MOE Perc. Exposure % aPAD MOE----- ----------- ------- ---------- ----- ----------- ------- ---------10.00 0.000000 0.00 >1,000,000 90.00 0.001629 203.61 15320.00 0.000000 0.00 >1,000,000 95.00 0.004233 529.16 5930.00 0.000010 1.24 25,142 97.50 0.006686 835.77 3740.00 0.000034 4.25 7,357 99.00 0.008168 1021.03 3050.00 0.000061 7.60 4,113 99.50 0.010368 1296.05 2460.00 0.000080 9.94 3,144 99.75 0.011400 1425.03 2170.00 0.000128 15.95 1,959 99.90 0.013630 1703.78 1880.00 0.000327 40.92 763
DEEM Users Manual©2000 Novigen Sciences, Inc.
7 - 11
Results of the acute analysis can be used to describe the distribution of exposure among the USpopulation (either on a per-capita or per-consumer basis) or a selected subgroup of thepopulation. The results are expressed as the proportion of individuals in the population whohave an exposure less than or equal to the specified amount, e.g. in Table 7.1, 90% of the USpopulation has an exposure equal to or less than 0.000581 mg/kg bw/day (on a per-capita basis).
MONTE CARLO ANALYSES
The DEEM acute module also has the capability of using the entire consumption distributionin conjunction with residue distributions in a Monte Carlo simulation.
Results of the Monte Carlo analyses are displayed in the same format as a DEEM ACUTEMODULE analysis – the only difference being an indication that a Monte Carlo analysis wasconducted and the number of iterations listed in the report header.
In the Monte Carlo analysis, the exposure estimates are derived using the following procedure:
1. Consumption of food 1 by individual 1 on day 1 is multiplied by a randomly selectedresidue value from the residue distribution for food 1.
2. Step 1 is repeated for all foods in the assessment consumed by individual 1 on day 1.
3. The exposure estimates for all foods consumed by individual 1 on day 1 are summedto determine the total dietary exposure for individual 1.
4. Steps 1 to 3 are repeated N times, still using the consumption data for individual 1 onday 1.
5. The N exposure estimates for person 1 on day 1 are stored as frequencies in exposureintervals.
6. Steps 1 to 5 are repeated for individual 1 on the remaining survey day(s).
7. Steps 1 to 6 are repeated for all individuals in the population of concern.
8. The frequency distribution of the exposure estimates for all individuals on all surveydays is used to derive the percentile estimates.
N = an iteration.

DEEM Users Manual©2000 Novigen Sciences, Inc.
7 - 12
Performing Monte Carlo (MC) analyses requires two kinds of files:
(1) A residue file (R96 or RS7) similar to that used in the conventional (i.e., pointestimate) DEEM acute analyses.
• The residue value for the food/FF combination in the R96/RS7 file will beincluded in the MC exposure analysis unless a residue distribution is assigned tothat food/FF, in which case the latter will take precedence and the R96/RS7 valueis ignored.
(2) Residue distribution files
• Residue distributions for specific foods/foodforms can be drawn from (1) RDFfile (no change in format from pre-DEEM 7.0 versions1) or (2) parametricdistribution functions. Up to five parametric distribution functions (and/or RDFfiles), each having an associated probability of use, can be specified for a givenfood/foodform. (The probabilities of use for any given set of functions must addup to 1.0.) Screen 7.6 shows the residue input grid from the Residue File Editorwith five RDL pointers and associated probabilities (ratio) columns displayed.
1 RDFs may have TOTALLOD and LODRES keywords on the same line; however, there must be at least one blank spacebetween the numbers used with TOTALLOD and LODRES (e.g., TOTALLOD = 10 LODRES = 0.1). Also, RDFs now supporthaving residues associated with only TOTALZ and TOTALLOD (i.e., no residue distribution in the body of the RDF).

DEEM Users Manual©2000 Novigen Sciences, Inc.
7 - 13
Screeen 7.6: Residue File Editor
Parametric distribution functions and RDFs referenced in a RS7 residue file must be entered intoa “residue distribution list” (RDL), indexed from 1-500 (in a manner similar to the list of residuedistribution files in previous versions of DEEM ). This list is part of the residue file, alongwith the assignment of residue data for each food/foodform to be evaluated.

DEEM Users Manual©2000 Novigen Sciences, Inc.
7 - 14
To display the RDL, click on “Show RDL.” The RDL window will appear (Screen 7.7).
Screen 7.7: RDL Window
The RDL has 6 columns: (1) pre-assigned index numbers2; (2) the parametric distributionfunction (0-6), (3) parameter #1, (4) parameter #2, (5) parameter #3, and (6) comment ordocumentation. The parameters are entered as follows:
Distribution type 0 (constant): the constant residue value is parameter #1; otherparameters are left blankDistribution type 1 (uniform): the low bound is parameter #13, the high bound isparameter #2, parameter #3 may be left blank or used to specify the upper-boundvalue in the distribution.Distribution type 2 (pareto): the location is parameter #1, the shape is parameter#2, parameter #3 may be left blank or used to specify the upper-bound value in thedistribution.Distribution type 3 (triangular): the low bound of the distribution is parameter #1,the most likely value is parameter #2, the high bound is parameter #3.
2 Although identified as indices in the RDL, these values correspond to the RDL pointer# in the residue assignment grid.3 Low end distribution functions can be zero.
DEEM Users Manual©2000 Novigen Sciences, Inc.
7 - 15
Distribution type 4 (normal): the mean is parameter #1, the standard deviation isparameter #2, parameter #3 may be left blank or used to specify the upper-boundvalue in the distribution.Distribution type 5 (lognormal): the mean is parameter #1, the standard deviationis parameter #2, parameter #3 may be left blank or used to specify the upper-bound value in the distribution.Distribution type 6 (RDF file): the name of the RDF file is parameter #1; the otherparameters are left blank. The RDF file must be in the same directory as theresidue file. (If an R96 file that contains RDFs is edited using DEEM 7.0, theprogram automatically assigns the code 6 in the residue grid and RDL. Adiscussion of the format for RDF files is presented in Appendix E.)
Residue distributions in the RDL are assigned to food/foodforms in the residue file using pointerscorresponding to their indices in the RDL. For example, if the residue amount for rac 10, ff 11,is to be derived from the residue distribution function located in the second row (index #2) of theRDL, then the pointer “2” is entered in the column labeled “RDL Pntr #1” in the residue dataentry grid for that food/foodform.
When the residue data entry grid for a new residue file is first displayed, only one column isshown for entering RDL pointers, and no column for the RDL ratio is shown. (If only one RDLdistribution is referenced, it is assumed that the RDL ratio is 1.0). However, for any givenfood/foodform, up to 5 different parametric distribution functions can be referenced using RDLpointers, along with an RDL ratio for each function, i.e., the probability assigned to each functionfor this use. Probabilities must be in the range 0 to 1.00, with the sum of all RDL ratios for anygiven food/foodform adding to 1.00. An RDL ratio can be set to zero; however, the sum of allRDL ratios for any food/foodform must equal 1.00. (The program will confirm this before theresidue data entry grid form is closed.)
To add columns for additional RDL pointers and ratios in the residue data entry grid, click on thebox labeled “Max(imum number of) RDL pointers” at the bottom left of the residue data entryscreen and choose the number of pointers to be displayed. Up to five pointers (with theirrespective RDL ratios) can be displayed; however, the number displayed cannot be fewer thanthe maximum number of RDL pointers contained in the current file. (When editing an existingfile, the maximum number of RDL pointers in that file determines how many columns will beshown when the grid is first displayed.)
DEEM Users Manual©2000 Novigen Sciences, Inc.
7 - 16
The RDL form also contains several additional command buttons:
(1) “Help”: Displays general information about the RDL, or information specific tocommand buttons and column headings in this form. A small menu is displayedwhen the “Help” button is selected. First, click on the topic of interest (allpertaining to the RDL form) and then click on the “Show” button. To cancel help atthis time, click on the x in the upper corner of the menu box. No object outside thismenu box can be accessed until “Show” or cancel has been selected.
(2) “Code Defs”: Displays a list of the distribution codes, definitions, and associatedparameters, similar to the list shown above.
(3) “Compute Dist(ribution)”: Displays a matrix of the full range of computed residuevalues attributable to the parametric distribution function (or RDF file) referenced atthe currently highlighted line in the RDL file. The range of residues is expressed asa function of random sampling values at steps of 0.01 to 0.99 and at 0.9999999 (therandom sampling value is constrained to values less than 1.0.)
(4) “Import RDL”: Allows you to import a specially formatted RDL file that has beenpreviously saved to disk as an ASCII file (independent of a residue file). This filewill replace any information in the current file. (Verification of overwrite isrequested.)
(5) “Export RDL”: Saves the currently displayed RDL to the disk as an ASCII file. Thisfile can then be imported into another residue file.
(6) “Renum(ber) Pointers”: Allows the user to change all instances of a given pointer inthe current residue file (not in the RDL itself) from one pointer value to another.Clicking on this button opens “From” and “To” text boxes. Fill in these boxes withthe old and new pointer designators, then click on the Renum Pointers button asecond time to active these changes. Confirmation of the changes is reported.
(7) “Delete Unused Rows”: If distribution functions have been deleted from the RDL,there will be empty rows. To close up the list (i.e., delete empty rows) click on the“Delete Unused Row” button. Residue functions below the empty rows will beassociated with a new index number. The pointers in the current residue file will beupdated automatically to correspond to the new index numbers.
(8) “Print RDL”: Sends a copy of the current RDL to the printer. This feature permits avisual reference of the pointers to facilitate data entry. (The RDL will not remainopen on the screen while pointers for specific foods/foodforms are entered into theresidue grid.)
(9) “Cancel/Close”: Closes the RDL form without checking or saving any changesmade while the RDL was currently displayed. Confirmation requested. (Thismethod is not recommended to exit this form.)
(10) “Close”: This closes and checks the data in the RDL and returns you to the residuedata entry grid. (This is the recommended way to exit the RDL form.)
When computing a distribution for a large RDF, DEEM will alert the user that the RDF file islarge (e.g., over 100,000 residue values). This warning simply says that the file is large and willtake some time to set up.

DEEM Users Manual©2000 Novigen Sciences, Inc.
7 - 17
Another feature on the residue data entry screen is the “Quick RDL Pointer Find” text box. Tolocate a specific RDL pointer in the current residue file without visually scanning the entire file,enter the pointer number and press “Enter” or double click the mouse. The next food/foodformcombination with the target RDL pointer will be located and highlighted.
To conduct a Monte Carlo analysis using DEEM software, follow the same procedure forconducting a standard acute analysis as discussed earlier in this chapter. If the selected residuefile contains RDF files, a box labeled “Monte Carlo” automatically will be displayed. Click onthe box; two additional boxes will be displayed prompting the user to enter the number ofiterations and the random seed number (Screen 7.8).
Screen 7.8: Monte Carlo data entry screen
You will be prompted to enter the number of iterations to be used in the current analysis. Thenumber of iterations will depend on the number of residue data points in the residue distributionfiles. Typically, the more data points, the more iterations are needed to ensure that the entireresidue distribution is sampled.

DEEM Users Manual©2000 Novigen Sciences, Inc.
7 - 18
You also will be prompted to specify a random number seed. This number is used by theprogram to begin the random selection of residue values. Selecting the same seed number(except 0), the same number of iterations, and the same residue files should produce the sameresults each time the analysis is conducted; however, you must reinitialize the random seed. If azero is selected as the seed, the randomization is performed using the time on the computer’sclock to initiate the randomization.
Once you have identified the *.R96/RS7 file to be used in the analysis, the procedures are thesame as those discussed for the standard acute analysis.
For NOVICHEM, we have created several RDF files (an example of an RDF file is presented inTable 7.3). Based on EPA guidelines, we have incorporated percent of the crop treated into theRDF files for those foods identified by the EPA as single-serving foods and for which croptreated information was available (Table 5.6). Mean field trial residue values are used forblended/processed foods. Note that EPA policy on the proper use of residue data in acuteanalyses is still evolving. (See Chapter 4, Guidelines for Conducting Exposure Assessments forfurther discussion of the EPA tiered approach to acute analyses.)
TABLE 7.3
NOVICHEM RESIDUE DISTRIBUTION FILE (RDF)
APPLESPERCENT CROP TX = 10%TOTALNZ = 33TOTALZ = 297 0.0030 0.0038 0.0030 0.0051 0.0069 0.0051 0.0037 0.0020 0.0030 0.0030 0.0039
0.0030 0.0034 0.0122 0.0200 0.0020 0.0020 0.0078 0.0079 0.0045 0.0065 0.0036
0.0030 0.0020 0.0030 0.0020 0.0020 0.0030 0.0020 0.0030 0.0047 0.0043 0.0020
Note: Residue values can be in any order, but must be in ppm units.
We can use the ACUTE7.RS7 file created in Chapter 5; however, we first must modify it to addthe RDF file designations. (To simplify the example here, only RDF files will be used.)

DEEM Users Manual©2000 Novigen Sciences, Inc.
7 - 19
Using the Add/Edit/Food/Foodforms screen in the Residue File Editor, click on the “Show RDL”button. A grid will appear. Enter the index number 6 (designation for RDF), then double-clickon the first row of the Parameter #1 column. Because this uses an RDF, the other parameterswill remain blank. You may then assign one RDF file to each of the file numbers on the grid.All RDF files must be in the same directory as the related RS7 file.
Next, enter the index number in the “RDL pointer#” column in the residue grid. If, for example,the RDF list contained apple.rdf as Index 1, the number 1 would be entered in the “RDL pointer#” column for apples. If only one distribution is assigned to a food/foodform, the program doesnot require a value to be entered in the “RDL ratio” column. During the Monte Carlo analysis,the data in the apples.rdf file would be used for all foods and foodforms with a number 1 in the“RDL Pointer#” column. If no number is entered in the “RDL pointer #” column, the datain the “Residue” field will be used in the acute analysis. You do not have to use a residuedistribution for all foods in the residue file.
Your RS7 file should look like the one in Table 7.4. Table 7.5 shows the results of the MonteCarlo analysis for our hypothetical chemical NOVICHEM (in the interest of time, only 10iterations were performed). This analysis is equivalent to an EPA Tier 3 analysis.

DEEM Users Manual©2000 Novigen Sciences, Inc.
7 - 20
TABLE 7.4
RESIDUE FILE FOR MONTE CARLO ANALYSIS FOR NOVICHEM
Novigen Sciences, Incorporated Ver. 7.03DEEM Acute analysis for NOVICHEMResidue file name: C:\DEEM manual\acute7mc.RS7Analysis Date 02-06-2000 Residue file dated: 02-03-2000/15:38:17/1Reference dose: aRfD = 0.0025 mg/kg bw/day NOEL = 0.25 mg/kg bw/dayComment: Anticipated residues--------------------------------------------------------------------------------RDL indices and parameters for Monte Carlo Analysis:Index Dist Parameter #1 Param #2 Param #3 Comment # Code----- ---- ------------ ----------- ----------- ---------- 1 6 Apple.rdf 2 6 Grape.rdf 3 6 Lettuce.rdf 4 6 Peach.rdf 5 6 Celery.rdf 6 6 Straw.rdf 7 6 Tomato.rdf
Food Crop Food Name Def Res Adj.Factors RDLCode Grp (ppm) #1 #2 Ind---- ---- ------------------------------- ---------- ------ ------ --- 13 O Grapes 0.025000 1.000 1.000 2 14 O Grapes-raisins 0.025000 1.000 1.000 2 15 O Grapes-juice 0.025000 0.060 1.000 2 17 O Strawberries 0.014000 1.000 1.000 6 52 11 Apples 11-Uncooked 0.020000 0.200 1.000 1 12-Cooked: NFS 0.020000 0.050 1.000 1 13-Baked 0.020000 0.050 1.000 1 14-Boiled 0.020000 0.050 1.000 1 15-Fried 0.020000 0.050 1.000 1 18-Dried 0.020000 0.200 1.000 1 31-Canned: NFS 0.020000 0.050 1.000 1 32-Canned: Cooked 0.020000 0.050 1.000 1 33-Canned: Baked 0.020000 0.050 1.000 1 34-Canned: Boiled 0.020000 0.050 1.000 1 42-Frozen: Cooked 0.020000 0.050 1.000 1 53 11 Apples-dried 0.020000 8.000 1.000 1 54 11 Apples-juice/cider 0.020000 0.020 1.000 1 64 12 Nectarines 0.600000 1.000 1.000 4 65 12 Peaches 0.600000 1.000 1.000 4 66 12 Peaches-dried 0.600000 7.000 1.000 4 159 8 Tomatoes-whole 0.011000 1.000 1.000 7 160 8 Tomatoes-juice 0.011000 0.020 1.000 7 161 8 Tomatoes-puree 0.011000 0.020 1.000 7 162 8 Tomatoes-paste 0.011000 0.500 1.000 7 163 8 Tomatoes-catsup 0.011000 0.020 1.000 7 166 4B Celery 0.070000 1.000 1.000 5 176 4A Lettuce-leafy varieties 0.100000 1.000 1.000 3 182 4A Lettuce-unspecified 0.100000 1.000 1.000 3 192 4A Lettuce-head varieties 0.100000 1.000 1.000 3 195 O Grapes-leaves 0.025000 1.000 1.000 2 290 O Cottonseed-oil 0.005000 0.010 1.000 291 O Cottonseed-meal 0.005000 0.020 1.000 315 O Grapes-wine and sherry 0.025000 1.000 1.000 2 318 D Milk-nonfat solids 0.005000 1.000 1.000 319 D Milk-fat solids 0.005000 1.000 1.000 320 D Milk sugar (lactose) 0.005000 1.000 1.000 321 M Beef-meat byproducts 0.200000 1.000 1.000 322 M Beef-other organ meats 0.100000 1.000 1.000

DEEM Users Manual©2000 Novigen Sciences, Inc.
7 - 21
TABLE 7.4 (CONT’D)
323 M Beef-dried 0.100000 1.920 1.000 324 M Beef-fat w/o bones 0.100000 1.000 1.000 325 M Beef-kidney 0.100000 1.000 1.000 326 M Beef-liver 0.200000 1.000 1.000 327 M Beef-lean (fat/free) w/o bones 0.100000 1.000 1.000 328 M Goat-meat byproducts 0.200000 1.000 1.000 329 M Goat-other organ meats 0.100000 1.000 1.000 330 M Goat-fat w/o bone 0.100000 1.000 1.000 331 M Goat-kidney 0.100000 1.000 1.000 332 M Goat-liver 0.200000 1.000 1.000 333 M Goat-lean (fat/free) w/o bone 0.100000 1.000 1.000 334 M Horsemeat 0.200000 1.000 1.000 336 M Sheep-meat byproducts 0.200000 1.000 1.000 337 M Sheep-other organ meats 0.100000 1.000 1.000 338 M Sheep-fat w/o bone 0.100000 1.000 1.000 339 M Sheep-kidney 0.100000 1.000 1.000 340 M Sheep-liver 0.200000 1.000 1.000 341 M Sheep-lean (fat free) w/o bone 0.100000 1.000 1.000 342 M Pork-meat byproducts 0.200000 1.000 1.000 343 M Pork-other organ meats 0.100000 1.000 1.000 344 M Pork-fat w/o bone 0.100000 1.000 1.000 345 M Pork-kidney 0.100000 1.000 1.000 346 M Pork-liver 0.200000 1.000 1.000 347 M Pork-lean (fat free) w/o bone 0.100000 1.000 1.000 377 11 Apples-juice-concentrate 0.020000 0.060 1.000 1 384 4B Celery juice 0.070000 1.000 1.000 5 392 O Grapes-juice-concentrate 0.025000 0.180 1.000 2 398 D Milk-based water 0.005000 1.000 1.000 402 12 Peaches-juice 0.600000 1.000 1.000 4 416 O Strawberries-juice 0.014000 1.000 1.000 6 423 8 Tomatoes-dried 0.011000 14.300 1.000 7 424 M Veal-fat w/o bones 0.100000 1.000 1.000 425 M Veal-lean (fat free) w/o bones 0.100000 1.000 1.000 426 M Veal-kidney 0.100000 1.000 1.000 427 M Veal-liver 0.200000 1.000 1.000 428 M Veal-other organ meats 0.100000 1.000 1.000 429 M Veal-dried 0.100000 1.920 1.000 430 M Veal-meat byproducts 0.200000 1.000 1.000

DEEM Users Manual©2000 Novigen Sciences, Inc.
7 - 22
TABLE 7.5
RESULTS OF THE MONTE CARLO ACUTE ANALYSIS
Novigen Sciences, Incorporated Ver. 7.06DEEM ACUTE analysis for NOVICHEM (1994-96 data)Residue file: acute7mc.RS7 Adjustment factor #2 NOT used.Analysis Date: 02-03-2000/15:43:59 Residue file dated: 02-03-2000/15:38:17/1NOEL (Acute) = 0.250000 mg/kg body-wt/dayAcute Pop Adjusted Dose (aPAD) varies with population; see individual reportsDaily totals for food and foodform consumption used.MC iterations = 10 MC list in residue file MC seed = 10Run Comment: "Anticipated residues"===============================================================================
Summary calculations (per capita):
95th Percentile 99th Percentile 99.9th Percentile Exposure % aPAD MOE Exposure % aPAD MOE Exposure % aPAD MOE---------- ------- -------- ---------- ------- -------- ---------- ------- --------U.S. Population: 0.000536 21.45 466 0.000936 37.45 267 0.001708 68.33 146All infants: 0.000545 68.11 458 0.001382 172.73 180 0.001916 239.52 130

DEEM Users Manual©2000 Novigen Sciences, Inc.
7 - 23
TABLE 7.5 (CONT’D)
Novigen Sciences, Incorporated Ver. 7.06DEEM ACUTE analysis for NOVICHEM (1994-96 data)Residue file: acute7mc.RS7 Adjustment factor #2 NOT used.Analysis Date: 02-03-2000/15:43:59 Residue file dated: 02-03-2000/15:38:17/1NOEL (Acute) = 0.250000 mg/kg body-wt/dayAcute Reference Dose (aRfD) = 0.002500 mg/kg body-wt/dayDaily totals for food and foodform consumption used.MC iterations = 10 MC list in residue file MC seed = 10Run Comment: "Anticipated residues"===============================================================================
U.S. Population Daily Exposure Analysis 1/--------------- (mg/kg body-weight/day) per Capita per User ----------- ----------- Mean 0.000178 0.000179 Standard Deviation 0.000199 0.000199 Margin of Exposure 2/ 1,401 1,393 Percent of aRfD 7.13 7.18
Percent of Person-Days that are User-Days = 99.40%
Estimated percentile of user-days falling below calculated exposure in mg/kg body-wt/day with Margin of Exposure (MOE) and Percent of aPAD
Perc. Exposure % aRfD MOE Perc. Exposure % aRfD MOE----- ----------- ------- ---------- ----- ----------- ------- ---------10.00 0.000016 0.62 16,063 90.00 0.000401 16.04 62320.00 0.000036 1.44 6,945 95.00 0.000537 21.49 46530.00 0.000062 2.48 4,030 97.50 0.000688 27.50 36340.00 0.000092 3.69 2,707 99.00 0.000938 37.51 26650.00 0.000126 5.02 1,990 99.50 0.001141 45.65 21960.00 0.000164 6.54 1,528 99.75 0.001342 53.69 18670.00 0.000210 8.38 1,192 99.90 0.001711 68.43 14680.00 0.000277 11.08 902
Estimated percentile of per-capita days falling below calculated exposure in mg/kg body-wt/day with Margin of Exposure (MOE) and Percent of aPAD
Perc. Exposure % aRfD MOE Perc. Exposure % aRfD MOE----- ----------- ------- ---------- ----- ----------- ------- ---------10.00 0.000015 0.58 17,213 90.00 0.000400 16.00 62420.00 0.000035 1.40 7,167 95.00 0.000536 21.45 46630.00 0.000061 2.43 4,107 97.50 0.000687 27.47 36440.00 0.000091 3.65 2,743 99.00 0.000936 37.45 26750.00 0.000125 4.98 2,006 99.50 0.001141 45.62 21960.00 0.000163 6.50 1,537 99.75 0.001341 53.62 18670.00 0.000209 8.35 1,198 99.90 0.001708 68.33 14680.00 0.000276 11.03 906-------------------------------------------------------------------------------1/ Analysis based on all two-day participant records in CSFII 1994-96 survey.2/ Margin of Exposure = NOEL/ Dietary Exposure.

DEEM Users Manual©2000 Novigen Sciences, Inc.
7 - 24
TABLE 7.5 (CONT’D)
Novigen Sciences, Incorporated Ver. 7.06DEEM ACUTE analysis for NOVICHEM (1994-96 data)Residue file: acute7mc.RS7 Adjustment factor #2 NOT used.Analysis Date: 02-03-2000/15:43:59 Residue file dated: 02-03-2000/15:38:17/1NOEL (Acute) = 0.250000 mg/kg body-wt/dayAcute Pop Adjusted Dose (aPAD) = 0.000800 mg/kg body-wt/dayDaily totals for food and foodform consumption used.MC iterations = 10 MC list in residue file MC seed = 10Run Comment: "Anticipated residues"===============================================================================
All infants Daily Exposure Analysis----------- (mg/kg body-weight/day) per Capita per User ----------- ----------- Mean 0.000116 0.000152 Standard Deviation 0.000240 0.000264 Margin of Exposure 2,149 1,648 Percent of aPAD 14.54 18.96
Percent of Person-Days that are User-Days = 76.68%
Estimated percentile of user-days falling below calculated exposure in mg/kg body-wt/day with Margin of Exposure (MOE) and Percent of aPAD
Perc. Exposure % aPAD MOE Perc. Exposure % aPAD MOE----- ----------- ------- ---------- ----- ----------- ------- ---------10.00 0.000001 0.09 364,342 90.00 0.000417 52.15 59920.00 0.000009 1.11 28,105 95.00 0.000600 75.03 41630.00 0.000034 4.30 7,267 97.50 0.001000 125.00 25040.00 0.000053 6.68 4,681 99.00 0.001441 180.07 17350.00 0.000064 7.99 3,909 99.50 0.001756 219.55 14260.00 0.000078 9.77 3,197 99.75 0.001777 222.19 14070.00 0.000105 13.12 2,381 99.90 0.001919 239.85 13080.00 0.000209 26.18 1,193
Estimated percentile of per-capita days falling below calculated exposure in mg/kg body-wt/day with Margin of Exposure (MOE) and Percent of aPAD
Perc. Exposure % aPAD MOE Perc. Exposure % aPAD MOE----- ----------- ------- ---------- ----- ----------- ------- ---------10.00 0.000000 0.00 >1,000,000 90.00 0.000342 42.81 72920.00 0.000000 0.00 >1,000,000 95.00 0.000545 68.11 45830.00 0.000000 0.04 840,723 97.50 0.000760 95.01 32840.00 0.000011 1.39 22,548 99.00 0.001382 172.73 18050.00 0.000042 5.20 6,007 99.50 0.001747 218.37 14360.00 0.000062 7.80 4,004 99.75 0.001770 221.29 14170.00 0.000079 9.92 3,150 99.90 0.001916 239.52 13080.00 0.000133 16.63 1,879

DEEM Users Manual©2000 Novigen Sciences, Inc.
7 - 25
Acute Critical Exposure Commodity Analysis
The DEEM™ Acute Module allows the user to conduct sensitivity analyses, via the AcuteCritical Exposure Commodity (CEC) Analysis to determine those foods that contribute most tothe total exposure of all individuals with exposure levels between user-specified percentiles(between 95th percentile and the maximum exposure). The user can determine whether aparticular food, residue level or individual food “drives” the assessment, and whether more thanone food contributes to most of the exposure of the selected individuals.
Please note that if the advanced CEC functions have not been licensed, several of the CECcapaibilities will be unavailable, including: The commodity-level summary at the top of the CECreport; the ability to specify an upper bound other than 100%; the ability to perform “Redo LastCEC”.
The user chooses the maximum number of records to be included in the CEC file, e.g., 100. (Thisnumber is applied to each population, so that you will get 100 records for each populationincluded in the analysis). The records saved to the report are for the 100 highest exposureamounts in the entire analysis; however, only those records in the top 5% or less of actual (asopposed to per-capita) daily exposures will be included. Thus, if you ask for 100 records andonly 92 records show up for a given population, this means that only 92 records were in the top5%.
The number of individual exposure records that can be included for each subpopulation in a CECreport is limited to 500. But these are printed records, not representative records, becauseexposure records for an individual are saved and printed only if they have a unique exposureamount. The number of times each exposure amount is computed for the same person-day isincluded (along with demographic information) with the exposure amount. Previously you didnot know whether a given exposure amount in the CEC file represented one or many hits for thesame person-day.
The CEC file lists both the number of printed records and the number of records represented (i.e.,including multiple occasions for the same exposure amount for the same person in an MCA).(Theoretically, the total daily exposure number reported for an individual in the CEC file may bemade up of different combinations of food consumption amounts and residues in differentiterations in the MCA. However, the probability of this occurring is small and not likely to affectthe general conclusions that can be drawn from an examination of the CEC file).
The number of records represented (rather than the number printed) is used in the summarystatistics for each population. These summary statistics include the number of times a givenfood-foodform appears in the CEC records for each population, and the percent of the totalexposure represented by all of the records for a given population that is made up by a given food-foodform. These summary statistics by food/foodform are printed in descending order ofsignificance (based on the number of times that the food-foodform appears in the file for thepopulation).
DEEM Users Manual©2000 Novigen Sciences, Inc.
7 - 26

DEEM Users Manual©2000 Novigen Sciences, Inc.
7 - 27
Two CEC data formats are available to the user:
(1) *.CEC, text file (Table 7.6) where the user demographics and total dailyexposure are printed on one line and the following lines contain the rac-foodform contributions to the exposure; and
(2) *.CSV, an "Excel" ready format which provides demographic data and totaldaily exposure followed by the first rac-food form contributions, then repeatedon the immediately following lines for the second, third, etc. rac-foodform.
The first is more adaptable to viewing directly on screen or printing in a report; thesecond can be directly loaded into Excel (as a CSV file) with no modifications and allcolumns are aligned. The user chooses the format when launching the analysis.
After a residue file is loaded, a check box labeled “Save CEC File” appears on the screen. If thisbox is selected, then four text boxes appear (Screen 7.9).
Screen 7.9: CEC Options

DEEM Users Manual©2000 Novigen Sciences, Inc.
7 - 28
(1) CEC file name: As with the Acute analysis file name, if you do not include a path thefile will be saved to the default residue directory. CEC files always have the extension“CEC.” (Note, if Excel Format is selected, the file will have the extension CSV.)
(2) Maximum CEC records (1-500). This is the maximum number of individual exposurerecords that can be saved to a CEC file.
(3) Minimum Contribution (1% to 50%): Only foods\foodforms that contribute more thanthis percentage amount to an individual’s total exposure will be included in the CECfile.
(4) Low/High Percentiles: User-specified to determine commodities contributing toexposure between these percentiles.
The “Show Last CEC Rpt” button at the bottom of the DEEM Acute Analysis screenallows the user to view the last CEC (or CSV) file generated. This button appears onlywhen the “Save CEC File” check box is displayed and selected. Using this button, theuser can display the CEC file to the screen, send it to the printer, or save this file to disk.
The “Redo Last CEC” button permits the user to change parameters for the CEC (e.g.,different percentiles, different percentage of exposure) WITHOUT having to rerun theanalysis. It is also possible to change the format from a CEC to a CSV, simply byclicking on Excel Format and “Redo Last CEC.”

DEEM Users Manual©2000 Novigen Sciences, Inc.
7 - 29
TABLE 7.6
CRITICAL EXPOSURE COMMODITY ANALYSIS(*.CEC format)
Novigen Sciences, IncorporatedDEEM Acute Critical Exposure Contribution Analysis (Ver 7.06)CSFII 1994-96Residue file = H:\DEEM7 training\acute7.RS7Acute report = H:\DEEM7 training\acute7.AC7Date and time of analysis: 02-02-2000 14:15:09Daily totals for food and foodform consumption used.Minimum exposure contribution = 10%Exposures divided by body weight
Subpopulations: All infants
All infantsLow percentile for CEC records: 95 Exposure (mg/day) = 0.005233High percentile for CEC records: 99.9 Exposure (mg/day) = 0.015530Number of actual records in this interval: 22
Critical foods/foodforms for this population (as derived from these records): N=number of appearances in all records (including duplicates) %=percent of total exposure for all records (including duplicates)Food FF N % Name 65, 31, 19, 80.79, Peaches-Canned: NFS 65, 11, 2, 8.91, Peaches-Uncooked 64, 11, 1, 6.76, Nectarines-Uncooked402, 31, 2, 1.07, Peaches-juice-Canned: NFS
Number of printed records = 10Number of records represented = 10 (nf = number of foods/ff reported for this daily exposure amount (exceeding minimumcontribution) (nx = number of times this exposure amount was computed for the same person on thesame day.)
Demographic data for each record: pid day sex age bw-kg nf nx tot expos samplwt ------ --- --- --- ------ -- ---- ----------- -------
Exposure contribution data by food/ff consumed (nf lines): food ff amt(g) residue adj#1 adj#2 contributn percnt ---- -- ------ ---------- ----- ----- ---------- ------
620, 1, M, 8M, 7.27, 1, 1, 0.013545, 11713 65, 31, 163.2, 0.600000, 1.00, 1.00, 0.013464, 99.40
1843, 2, F, 8M, 7.27, 1, 1, 0.011365, 13992 64, 11, 136.0, 0.600000, 1.00, 1.00, 0.011220, 98.73
1539, 2, M, 7M, 8.18, 1, 1, 0.010414, 9591 65, 31, 139.4, 0.600000, 1.00, 1.00, 0.010223, 98.16
1761, 1, F, 9M, 9.55, 1, 1, 0.009967, 13959 65, 11, 157.0, 0.600000, 1.00, 1.00, 0.009869, 99.02
176, 1, M, 5M, 6.82, 1, 1, 0.008473, 5727 65, 31, 96.2, 0.600000, 1.00, 1.00, 0.008466, 99.91
776, 2, F, 9M, 7.27, 1, 1, 0.008162, 25040 65, 31, 96.1, 0.600000, 1.00, 1.00, 0.007928, 97.14

DEEM Users Manual©2000 Novigen Sciences, Inc.
7 - 30
TABLE 7.6 (CONT’D)
801, 2, M, 6M, 8.18, 1, 1, 0.007997, 6312 65, 31, 105.5, 0.600000, 1.00, 1.00, 0.007737, 96.74
1359, 1, M, 7M, 7.73, 1, 1, 0.007492, 8323 65, 31, 96.4, 0.600000, 1.00, 1.00, 0.007485, 99.91
620, 2, M, 8M, 7.27, 1, 1, 0.007390, 11713 65, 31, 81.6, 0.600000, 1.00, 1.00, 0.006732, 91.09
1280, 2, F, 5M, 5.91, 1, 1, 0.007367, 31113 65, 31, 72.3, 0.600000, 1.00, 1.00, 0.007341, 99.65
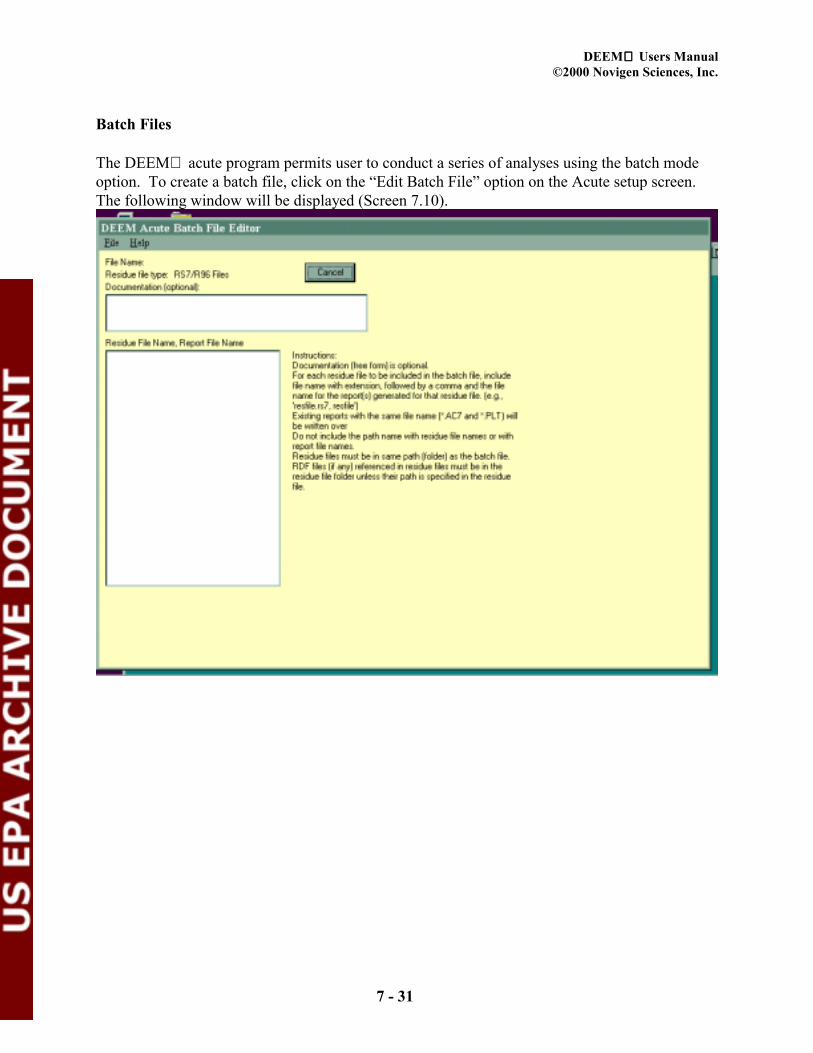
DEEM Users Manual©2000 Novigen Sciences, Inc.
7 - 31
Batch Files
The DEEM acute program permits user to conduct a series of analyses using the batch modeoption. To create a batch file, click on the “Edit Batch File” option on the Acute setup screen.The following window will be displayed (Screen 7.10).

DEEM Users Manual©2000 Novigen Sciences, Inc.
7 - 32
Screen 7.10: Batch File Editor
To create a batch file, click on “File” then “Open New File.” You will be prompted to name thebatch file (the file will have the extension B96). You may enter any information on thedocumentation lines. The format for the files to include in the analyses must be (1) the residuefile name (with RS7 or R96 extension) followed by a comma, then (2) the output file name.
Once the information has been completed, click “File” then “Save.” To exit the Batch FileEditor, click on “Exit.”
Note that the residue files listed in the batch file must have either a NOEL or aRfD/aPAD valueincluded in the header information if you select to divide the exposure estimate by body weight,otherwise, the program will not run.
If a Monte Carlo analysis is conducted for more than one residue file, the parameters assigned(i.e., number of iterations and seed) will be the same for all Monte Carlo analyses. Also,population groups selected will be the same for all analyses. It is possible to have both MonteCarlo and single-point acute analyses in the same batch file. Acute exposure anlyses calculatedusing the Batch mode are automatically saved to disk.

DEEM Users Manual©2000 Novigen Sciences, Inc.
8 - 1
CHAPTER 8. WORKING WITH RDFgen™ AND PRE-EXTRACTED USDA PDPMONITORING DATA
8.1 PURPOSE
The RDFgen™ module of DEEM™ automates residue distribution adjustments and the creationof summary statistics and Residue Distribution Files (hereafter referred to as RDF files). Usingthe Residue File Editor, the mean value of an adjusted residue distribution calculated byRDFgen™ can be used in a chronic or acute risk assessment, or an RDF file generated byRDFgen™ can be referenced in an acute risk assessment. RDFgen™ can also performcumulative residue adjustments and generate cumulative RDF files based on PDP data forsamples that have been tested for multiple analytes.
For maximum speed and accuracy, Novigen maintains sets of spreadsheets containing up-to-datemonitoring data from the most widely used source, the Pesticide Data Program of the U.S.Department of Agriculture. These sets of spreadsheets are ready for immediate use withRDFgen™, and are referred to by the following titles: “RDFgen™ Pre-extracted IndividualAnalyte Mode PDP Data Set” and “RDFgen™ Pre-extracted Cumulative Mode PDP Data Set”.
Additionally, to allow creation of RDFgen™ Cumulative Mode or Individual Analyte Mode PDPresidue input spreadsheets filtered for specific sample attributes (such as origin or date collected),Novigen maintains a pre-extracted data set integrating all PDP sample database and residuedatabase information, plus the following helpful standardized fields:
• COMMOD_NAM (Translated version of the two-character COMMOD field,including separation of processed commodities that share COMMOD code withunprocessed commodities, such as green beans/processed green beans andpeaches/canned peaches)
• FULL_PESTN (Standardized version of two-character PEST_NAME field)• BOOKYEAR (PDP data annual report year to which the record belongs)• YEARY2K (Ensures continued ability to correctly sort and query based on sample
date)• DETECT (Y/N field indicating whether sample is a detect or non-detect sample)• ORIGINSTD (Standardized version of ORIGIN field, facilitating separation of
domestic samples, imported samples, and samples of unknown origin)
This series of Excel workbooks is referred to as the RDFgen™ full Pre-extracted PDP Data Set.Creation of RDFgen™ Cumulative or Individual Analyte Mode PDP residue input spreadsheetscontaining user-defined subsets of the RDFgen™ full Pre-extracted PDP data set is automated bythe RDFgen™ Input Generator™ Excel add-in.

DEEM Users Manual©2000 Novigen Sciences, Inc.
8 - 2
Example Dialog From the RDFgen™ Input Generator™ Excel Add-in
RDFgen™ is closely integrated with USDA PDP pesticide monitoring data because it is the mostwidely used source of pesticide residue data. The merits of the PDP data for use in dietary riskassessments include:
• Rigorous statistical design• Many samples are taken of heavily consumed commodities over multi-year
periods• Sensitive methods• All analyzed samples (detects and non-detects) are explicitly reported• Good quality assurance• Most samples are tested for multiple analytes, enabling cumulative residue operations
8.2 DISTRIBUTION ADJUSTMENTS AND MODES
RDFgen™ can operate in either of two primary modes: Individual Analyte Mode andCumulative Mode. Individual Analyte mode allows the user to perform either or both of thefollowing residue adjustments on any single analyte residue distribution:
• Percent Crop Treated• Decompositing

DEEM Users Manual©2000 Novigen Sciences, Inc.
8 - 3
Cumulative mode allows the user to perform any of the following residue adjustments on anycombination of compounds, provided that individual samples have been tested for co-incidentresidues:
• Percent Crop Treated• Decompositing• Relative Potency• Processing Factors
RDFgen™ may be launched from within DEEM™ or using a shortcut in Windows®. To launchRDFgen™ using a shortcut in Windows®, click on the Windows® Start menu, select Programs,then click on the RDFgen™ icon, as in Figure 8.1, or double-click the RDFgen™ icon on theDesktop if you have created one. To launch RDFgen™ from within DEEM™, select “RDFgen”in the menu bar of the DEEM™ main menu screen, then click on “Run RDFgen” (Figure 8.2).
Figure 8.1: Launching RDFgen™ from the Windows® Start menu.
Figure 8.2: Launching RDFgen™ from DEEM™.
Figure 8.3 will be displayed. Enter your DEEM™ password, then press [Enter] or click OK.Note: Both DEEM™ and Microsoft Excel® 97 must be properly installed on your computer inorder to use RDFgen™. If Microsoft Excel® 97 is not properly installed on your computer,RDFgen™ will simply not be able to run. The first time RDFgen is launched after installation, itwill detect the location of the DEEM program files on your computer if they are installed in“C:\DEEM\” or “C:\Program Files\Novigen\DEEM\”. If DEEM is installed in a non-standarddirectory on your computer, you will need to specify the correct path to the DEEM program filesdirectory by clicking in the upper text field. An Open dialog will pop up, allowing you tonavigate to the appropriate directory.
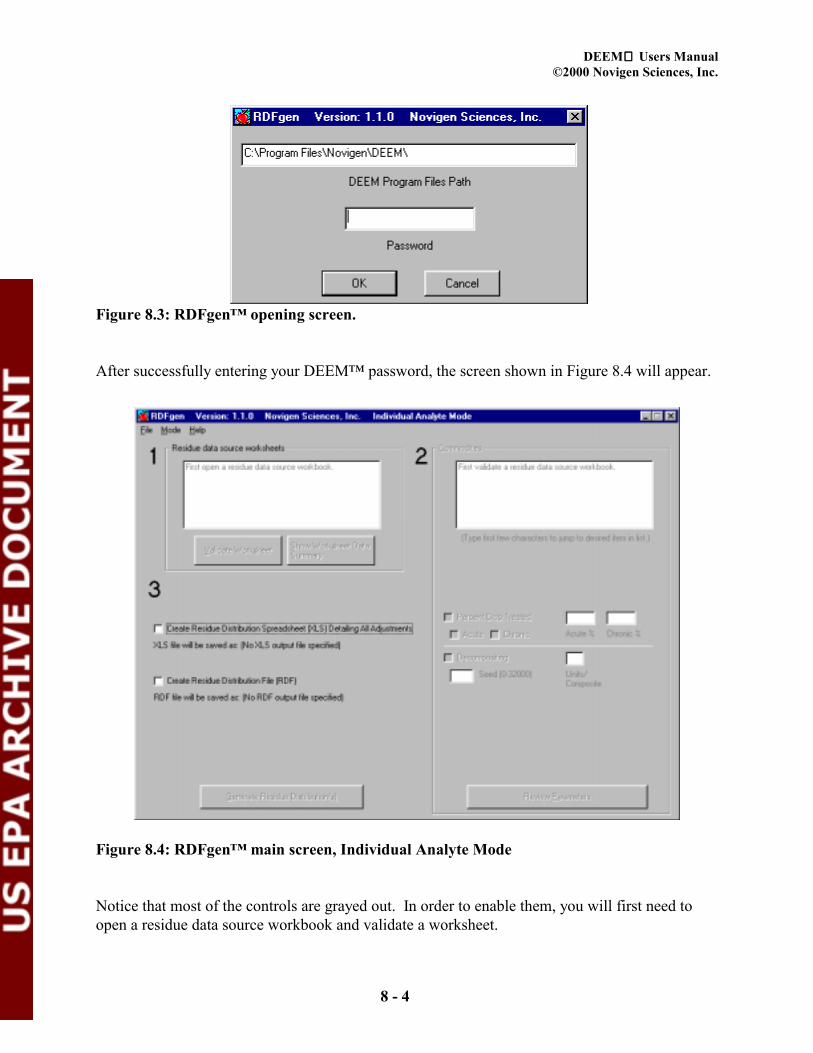
DEEM Users Manual©2000 Novigen Sciences, Inc.
8 - 4
Figure 8.3: RDFgen™ opening screen.
After successfully entering your DEEM™ password, the screen shown in Figure 8.4 will appear.
Figure 8.4: RDFgen™ main screen, Individual Analyte Mode
Notice that most of the controls are grayed out. In order to enable them, you will first need toopen a residue data source workbook and validate a worksheet.

DEEM Users Manual©2000 Novigen Sciences, Inc.
8 - 5
PERFORMING PERCENT CROP TREATED AND DECOMPOSITING ADJUSTMENTS FORAN INDIVIDUAL ANALYTE USING RDFGEN™ AND THE PRE-EXTRACTED PDP DATASET FORMATTED FOR RDFGEN™ INIDIVIDUAL ANALYTE MODE
The following example can be used as a guide to using RDFgen™ Individual Analyte Mode andunderstanding its output files (Excel® spreadsheets and Residue Distribution Files). It alsodemonstrates how easily residue distribution adjustments can be performed on the pre-extractedPDP data. Note: The values specified for Percent Crop Treated and Units Per Composite in thisexample are fictitious.
1) In the RDFgen™ main screen, ensure that Individual Analyte Mode is activated.
2) Select File!Open, or press [Control] + O. Note: Virtually every feature of RDFgencan be controlled using either the mouse or the keyboard. These instructions willfocus on using the mouse, but the device you use is a matter of preference. Manyusers find that they work most efficiently using a combination of mouse and keyboardto navigate the controls in RDFgen™. To use the keyboard, note that you canactivate the subsequent or previous control on the screen by pressing using [Tab] and[Shift] + [Tab]. You can also activate some controls by pressing [Alt] and theunderlined shortcut character. Buttons can be “clicked” by pressing [Enter], whilecheck boxes can be toggled by pressing the space bar.
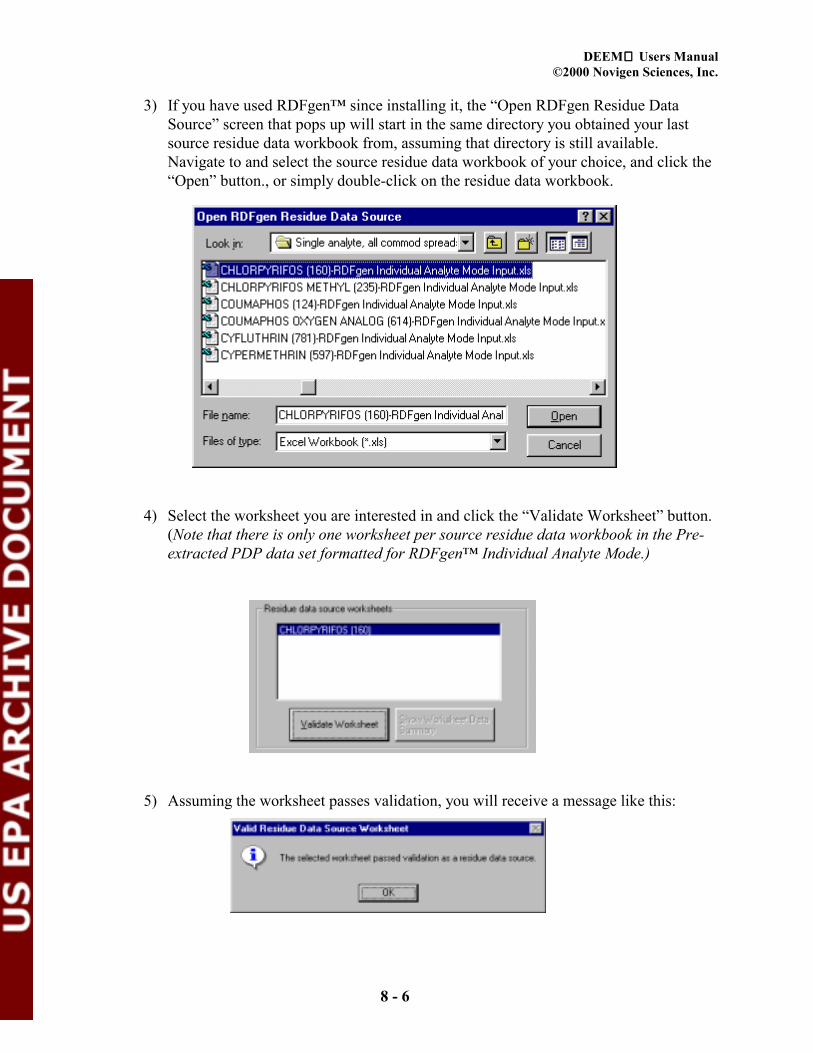
DEEM Users Manual©2000 Novigen Sciences, Inc.
8 - 6
3) If you have used RDFgen™ since installing it, the “Open RDFgen Residue DataSource” screen that pops up will start in the same directory you obtained your lastsource residue data workbook from, assuming that directory is still available.Navigate to and select the source residue data workbook of your choice, and click the“Open” button., or simply double-click on the residue data workbook.
4) Select the worksheet you are interested in and click the “Validate Worksheet” button.(Note that there is only one worksheet per source residue data workbook in the Pre-extracted PDP data set formatted for RDFgen™ Individual Analyte Mode.)
5) Assuming the worksheet passes validation, you will receive a message like this:

DEEM Users Manual©2000 Novigen Sciences, Inc.
8 - 7
6) Click OK on the validation confirmation message.
7) If you like, you may now click on the “Show Worksheet Data Summary” button to seedetails about the data source you have selected.
8) The Worksheet Data Summary starts with basic information about the selected sourceworkbook and worksheet. It then displays any information specified in the sourceworksheet Parameter Cell (this can include any combination of Description, Units andDecimals). Finally, summary statistics are given for each residue distribution in theselected source worksheet. Note: The Worksheet Data Summary will ultimately beincluded in your residue distribution spreadsheet output should you choose to haveRDFgen create spreadsheet output.
9) Click the “Close” button to return to the RDFgen™ main screen.
10) Select the commodity you are interested in from the list in the upper-right area of thescreen. (You can jump to the item of interest by typing the first few characters, butyou must first click on the list to make it the active control.)

DEEM Users Manual©2000 Novigen Sciences, Inc.
8 - 8
11) Click on the “Percent Crop Treated” checkbox if you would like to perform this typeof adjustment (you may then uncheck either the “Acute” or the “Chronic” checkbox ifyou do not want to perform that type of adjustment).
12) Fill in the Acute and Chronic Percent Crop Treated values for the selectedcommodity.
13) Click on the “Decompositing” checkbox if you would like to perform this type ofadjustment. Please note that RDFgen™ can not warn you if you are preparing todecomposite a distribution for an inappropriate commodity, such as a blendedcommodity. It is up to the user to determine what adjustments are appropriate.
14) Fill in a Seed value between 1 and 32,000 (inclusive) for the random numbergenerator, or enter a zero of you would like the computer to create the seeddynamically using the CPU timer. Note: The ability to specify a seed for the randomnumber generator is given to allow replication of results despite the fact that thedecompositing algorithm requires sequences of random numbers. Be aware that toduplicate the results, more than just the seed needs to be set the same: The exactsame source distribution must be used, and all other entered parameters must beidentical, including Percent Crop Treated and Units Per Composite.

DEEM Users Manual©2000 Novigen Sciences, Inc.
8 - 9
15) Fill in a value for Units Per Composite.
16) If you like, you can click on the “Review Parameters” button to review the parametersyou have specified.
17) The Parameter Summary starts with an indication of the mode RDFgen™ is in andthe commodity distribution that has been selected. Below the “Selected Adjustments”heading, the type(s) of adjustment(s) that you have selected and the correspondingparameters are documented. Note: The Worksheet Data Summary will ultimately beincluded in your residue distribution spreadsheet output should you choose to haveRDFgen create spreadsheet output.
18) Click the “Close” button to return to the RDFgen™ main screen.
19) If you would like output documenting the adjustments performed and showing thedata at each phase of adjustment, then click on the check box labeled “Create ResidueDistribution Spreadsheet (XLS) Detailing All Adjustments”. The following screenwill pop up:

DEEM Users Manual©2000 Novigen Sciences, Inc.
8 - 10
20) If you have used RDFgen™ since installing it, this screen will start in the samedirectory you saved your last Residue Distribution Worksheet output into, assumingthat directory is still available. Type the file name of your choice, or accept thedefault file name offered by RDFgen™, and click the “Save” button. Note that no filewill actually be saved until you click the “Generate Residue Distribution(s)” button.
21) If you would like to create a Residue Distribution File containing residue adistribution adjusted for Acute Percent Crop Treated and/or Decompositing, thenclick on the checkbox labeled “Create Residue Distribution File (RDF)”. Thefollowing screen will pop up:
22) If you have used RDFgen™ since installing it, this screen will start in the samedirectory you saved your last Residue Distribution File into, assuming that directory isstill available. Type the file name of your choice, or accept the default, and click the“Save” button. Note that no file will actually be saved until you click the “GenerateResidue Distribution(s)” button.
23) You are now ready to set RDFgen™ to work!

DEEM Users Manual©2000 Novigen Sciences, Inc.
8 - 11
24) Click the “Generate Residue Distribution(s)” button, and wait until the progresswindow in the middle of the screen disappears and a success message (or othermessage, such as a message confirming any file overwrite) pops up.
25) View the output file(s) that were generated the same way you normally view RDF andXLS files. RDF files are plain text files that should be viewed using a text editor likeMicrosoft Notepad (not a word processor like WordPerfect® or Word®). XLS filesshould be viewed using Microsoft Excel® 97 or later. You may minimizeRDFgen™, close it, or simply leave it as is when viewing output files.
8.3 INPUT SPREADSHEET SPECIFICATION
RDFgen™ accepts as input any residue data spreadsheet that has been formatted according to oneof two pre-defined specifications. In general, Individual Analyte Mode input spreadsheetscontain distributions for various commodities tested for a particular chemical, while CumulativeMode input spreadsheets contain distributions for various chemicals tested on a particularcommodity. Although the two specifications are similar, the specification for Cumulative Modeinput spreadsheets features additional requirements beyond those of the Individual Analyte Modeinput spreadsheet specification. As a result, it is important to keep in mind the following rule:Although all valid Cumulative Mode input spreadsheets will pass validation when RDFgen™ isin Individual Analyte Mode, not all valid Individual Analyte Mode input spreadsheets will passvalidation when RDFgen™ is in Cumulative Mode.
Example of a Cumulative Mode input spreadsheet, containing a unique listing of alphanumericsample IDs in column A, beginning at Row 4.

DEEM Users Manual©2000 Novigen Sciences, Inc.
8 - 12
This format supports data on co-incident residues for samples. Typically, a single spreadsheetfeatures data for many analytes tested on a single commodity. Note that in Cumulative Mode,RDFgen™ will only utilize samples where residue is available for all analytes selected by theuser.
EXAMPLE OF AN INDIVIDUAL ANALYTE MODE INPUT SPREADSHEET,CONTAINING NO SAMPLE IDENTIFIERS AND HAVING NO CORRELATION OFRESIDUE DATA ACROSS ROWS:
Typically, a single spreadsheet features data for many commodities tested for a single analyte.However, it is perfectly allowable to quickly create an RDFgen™ Individual Analyte Mode inputspreadsheet based on the user’s own residue data containing only a single distribution. An inputspreadsheet created by the user can look as simple as this:
Using the Parameter Cell (cell A2). The Parameter Cell is supported in both Cumulative andIndividual Analyte Modes. The Parameter Cell’s three supported keywords (“units”, “decimals”,and “description”) can provide RDFgen™ and the user of the residue data spreadsheet three typesof information:
• “units=”: PPM, PPB, or PPT (not case sensitive). RDFgen will report on the unitsused in the source data and will adjust values as appropriate when producing RDFfiles, since RDF files must be expressed in ppm. If the units keyword is omitted fromthe Parameter Cell, or if an unrecognized unit is specified, then creation of RDF fileswill be disabled when the input spreadsheet is used in RDFgen™.
• “decimals=”: Specifies the number of places to the right of the decimal that the inputdata is accurate to.

DEEM Users Manual©2000 Novigen Sciences, Inc.
8 - 13
• “description=”: Any text string that does not include any semicolons (;) and does notexceed 255 characters in length (any characters beyond the first 255 will be truncatedin spreadsheet-based output from RDFgen™).
A typical Parameter cell might read as follows (note that any combination or all of the keywordsmay be included):
units=ppm;decimals=3;description=This source data worksheet is one of 161 in acollection which contains all 1994-1997 PDP data. Each worksheet in this collectioncontains all of the residue data for one chemical. No samples have been omitted. Anydata subsets must be created separately.
8.4 ABOUT THE PRE-EXTRACTED PDP MONITORING DATA
The RDFgen ™ pre-extracted PDP monitoring data, at the time of this writing, contains all of the1994-1997 PDP data. Novigen will integrate PDP data for years subsequent to 1997 once USDAreleases them. Please note that since all samples have been included, any data subsets need to becreated separately by the user (this can be accomplished quickly and accurately using theRDFgen™ full Pre-extracted PDP data set with the RDFgen™ Input Generator™ Excel add-in).The pre-extracted data was compiled from the raw individual sample and residue databasesdistributed by the USDA PDP (see Chart 1). Because the records from the two USDA tables arelinked using unique sample identification numbers, each record in combined RDFgen™ full Pre-extracted PDP data set contains both analytical result data and sample information. The pre-extracted PDP residue data sets accompanying RDFgen™ begin in 1994, since 1994 was the firstyear in which the PDP began using a standardized data format where all non-detect samples wereexplicitly presented in the database and LOD values were explicitly given for each sample.Finally, all Novigen pre-extracted PDP data sets have been compared record by record againstthe raw data supplied by the USDA PDP to assure integrity of the data.

DEEM Users Manual©2000 Novigen Sciences, Inc.
8 - 14
CHART 1: OVERVIEW OF PROCESS USED TO PRODUCE PDP DATA SETSCOMPATIBLE WITH INDIVIDUAL ANALYTE AND CUMULATIVEANALYSES IN DEEM™
NOVIGEN MASTER PDP DATABASE
NOVIGEN FULL PRE-EXTRACTED 1994-1997PDP DATASET
ALL INFORMATION FOR EACH PDPCOMPOUND IN THE MASTER DATABASEEXTRACTED INTO A SEPARATE EXCEL
WORKBOOK WITH A SEPARATE WORKSHEETFOR EACH CROP
RDFGENTM PRE-EXTRACTED1994-1997 INDIVIDUAL ANALYTE
INPUT SPREADSHEETS
THESE CONTAIN CONCENTRATIONAND LOD DATA FOR EACH
COMPOUND. ALL COMMODITIESFOR ONE COMPOUND ARE ON THE
SAME WORKSHEET
RDFGENTM PRE-EXTRACTED 1994-1997 CUMULATIVE ANALYTE
INPUT SPREADSHEETS
THESE CONTAIN CONCENTRATIONAND LOD DATA FOR EACH
COMMODITY. ALL COMPOUNDSFOR ONE COMMODITY ARE ON
THE SAME WORKSHEET
RDFGENTM
INDIVIDUALANALYTE MODE
INPUTSPREADSHEETS CAN
BE CREATED FORANY DESIRED
SUBSET USING THERDFGENTM INPUT
GENERATORTM
EXCEL ADD-IN
RDFGENTM
CUMULATIVEMODE INPUT
SPREADSHEETSCAN BE CREATEDFOR ANY DESIREDSUBSET USING THERDFGENTM INPUT
GENERATORTM
EXCEL ADD-IN
PUBLICLY AVAILABLE USDA PDP MONITORING DATA
1994 SAMPLE INFORMATION RECORDS 1994 ANALYTICAL RESULTS RECORDS
1995 SAMPLE INFORMATION RECORDS 1995 ANALYTICAL RESULTS RECORDS
1996 SAMPLE INFORMATION RECORDS
1997 SAMPLE INFORMATION RECORDS
1996 ANALYTICAL RESULTS RECORDS
1997 ANALYTICAL RESULTS RECORDS

DEEM Users Manual©2000 Novigen Sciences, Inc.
8 - 15
NOTE ON CONCENTRATION VALUES LESS THAN LOD: The 1994 and 1996 USDAPDP data include 81 samples with concentration values that are greater than zero but less thanthe corresponding reported Limit Of Detection (LOD). Novigen has confirmed the presence ofthese values with USDA representatives. If any RDFgen input spreadsheet contains one or moreconcentration values that are greater than zero but less than the corresponding LOD value, anotification message (see Figure 8.5) containing details of the instances will appear during theRDFgen worksheet validation process. The user will be given the option to override this warningand use the input data as is.
Figure 8.5: RDFgen™ non-zero concentration value less than LOD warning.
NOTE ON DUPLICATE RECORDS IN THE PDP DATA: The 1994, 1995 and 1996 USDAPDP data included in the Pre-Extracted PDP data sets contain 3,543 duplicate records, the vastmajority of which (3,516) are for Thiabendazole data from 1995. These are records for whichresidue data for the same sample and the same analyte are reported more than once, potentiallywith different residue values. Novigen has confirmed the presence of these duplicate records withUSDA representatives, and concurrently with the release of the 1998 PDP monitoring data,USDA has indicated the 1994 through 1996 data will be revised to eliminate these duplicaterecords. In the meantime, users are strongly cautioned against using the Pre-Extracted PDP datafor any of the following analyte/commodity combinations:
DDT (TDE)/Carrots: 1 duplicate (1994)DICOFOL/Potatoes: 3 duplicates (1994)DICOFOL/Celery: 1 duplicates (1994)PERMETHRINS/Lettuce: 2 duplicates (1994)PERMETHRINS/Grapes: 20 duplicates (1996)THIABENDAZOLE/Carrots: 690 duplicates (1995)THIABENDAZOLE/Sweet Corn (Processed): 668 duplicates (1995)THIABENDAZOLE/Grapes: 685 duplicates (1995)

DEEM Users Manual©2000 Novigen Sciences, Inc.
8 - 16
THIABENDAZOLE/Oranges: 516 duplicates (1995)THIABENDAZOLE/Peaches: 361 duplicates (1995)THIABENDAZOLE/Spinach: 596 duplicates (1995)
8.5 MINIMUMS AND MAXIMUMS IN RDFGEN™
RDFgen enforces the following limits:
• Minimum number of samples in source distribution: 2• Maximum number of samples in source distribution: 32,767• Minimum number of units per composite when decompositing: 2• Maximum number of units per composite when decompositing: 1,000• Maximum number of decomposited samples (units per composite multiplied by number
of samples in source distribution): 32,767• Maximum source residue value: 1000 ppm• Potency coefficient range (Cumulative Mode only): >0, ≤10,000• Processing factor range (Cumulative Mode only): >0, ≤100• Minimum seed value for random number generator: 1 (0 is also valid, but is used to
request dynamic, timer-based seed)• Maximum seed value for random number generator: 32,000• Minimum number of residue distributions per input worksheet: 1 (Note that all residue
distributions must contain concentration and LOD values.)• Maximum number of distributions per input worksheet: 127 (determined by Excel®
workspace specifications)• Maximum number of worksheets per input workbook: 255 (determined by Excel®
workspace specifications)

DEEM Users Manual©2000 Novigen Sciences, Inc.
9 - 1
CHAPTER 9. AGGREGATE EXPOSURE ANALYSIS
Traditionally, the US EPA has assessed the potential risk associated with a chemical withmultiple uses separately by source. The Food Quality Protection Act of 1996 (FQPA) hasstressed the need for assessing the integrated exposure to chemicals, including dietary and non-dietary uses. The interim approach proposed by EPA uses the “risk cup” approach, wherebyinterim risk values are assigned to portions of the total risk for exposure through drinking water,residential uses and lawn treatment uses, while the remainder of the “risk cup” is left for dietaryexposures. While extensive data are usually available for estimating dietary risk, the converse isnot necessarily true for non-dietary exposures. Our Calendex model estimates potentialexposures to multiple products by multiple exposure routes that allow for the derivation ofrealistic estimates of the integrated exposure. The model uses a probabilistic approach toestimating potential exposures.
Many pest control or consumer products that are used around the home may contain the samechemical compound. In addition, that same compound could be used on many agriculturalcommodities. An integrated exposure model, Calendex has been developed to estimate thepotential for human exposure to multiple products by multiple exposure routes. This modelestimates the daily total exposure potential when various products containing the samecompound could be used in the same household and on food crops. The integrated exposuremodel provides more reasonable estimates of total exposure than simply summing maximumexposures for each individual product or use.
Personal characteristics, including, body weight, breathing rates, activity patterns, etc., vary notonly between individuals, but may vary from day to day, or season to season, within individuals.Similarly, concentration levels vary depending on when and where they are measured, when andwhere the chemical was applied, the type of residence, etc. The uncertainty introduced by usingsingle point estimates to represent these factors (whether average or upper percentile exposurelevel) increases with the number of variables used to derive these estimates. Thus, an assessmentof the potential exposure to a chemical with one or more uses needs to take into consideration thevariability in the factors affecting the exposure level. We propose an approach that uses MonteCarlo techniques to derive and combine exposure distributions from various uses withinformation about product use. The approach takes into account the probability that exposures tomore than one product may occur on a single day, and provides a more realistic exposureassessment than would occur if exposures resulting from single uses are summed.
Since pesticide and consumer product usage may be seasonal, and since activity levels, and theamount of time spent indoors and outdoors may depend on the day of the week, we propose touse a calendar-based approach to derive the probability distribution of potential exposures. Sincepeople are more likely to have exposures resulting from multiple product uses on some days thanon others, this calendar-based model estimates exposures for every day of the year. Theseexposure distributions for individual days may also be combined into a distribution of dailyexposure for all days of the year.

DEEM Users Manual©2000 Novigen Sciences, Inc.
9 - 2
The model allows the assessment of major contributing factors to the overall exposure.Sensitivity analyses can be performed to show those factors that contribute most to the variabilityin the exposure distributions and where additional data may be needed to better define theexposure estimates.
The model estimates the distribution of the daily exposures that could result from each of theproduct use types. These distributions are then combined to derive an estimate of the distributionof daily integrated exposures that could result from all uses.
9.1 MODEL INPUT PARAMETERS
A. Non-dietary uses
• The types of data needed generally fall into four categories:
• Personal exposure measurements/environmental concentration data on days before,during and after treatment.
• Exposure factors such as body weight and breathing rate.
• Personal and environmental factors such as activity patterns, residence type andprobability that a person applies the product himself or has a professional apply theproduct.
• Market use data provides information on market share of the products, frequency ofapplication and amount of product applied.
Distributions of input parameters are used in the model where sufficient data are available,otherwise point estimates may be used.
Market use information can be used to define the "typical" patterns for the uses considered in theassessment, and to estimate the likelihood that a house receives one or more treatments in a givenyear. In addition, since some treatments can be applied either by professional applicators or bythe homeowners (or residents), the market use information can be used to estimate theproportions of "professional" and "self" treatments, if necessary.
B. Dietary uses
The types of data generally needed fall in two categories:
• Consumption data, such as those derived from USDA’s 1989-1992 ContinuingSurvey of Intake by Individuals (CSFII).

DEEM Users Manual©2000 Novigen Sciences, Inc.
9 - 3
• Residue concentration data collected through monitoring programs or field trialstudies. In the absence of sufficient monitoring data or field trial studies, tolerancescan be used.
9.2 MODEL OUTPUTS
The model outputs consist of estimates of the distributions of daily integrated exposure (dermal,inhalation and ingestion). In addition, an estimate of the overall annual distributions of dailyexposures is derived. The estimates can be derived for the entire US population, and for thepopulation subgroups of interest.

DEEM Users Manual©2000 Novigen Sciences, Inc.
10 - 1
CHAPTER 10. MULTIPLE CHEMICAL EXPOSURE ANALYSIS
First, to eliminate situations that will not require a cumulative risk assessment, consider thecomparative potency of multiple chemicals and whether they
• share the same mechanism of toxicity• share common biological and/or molecular events• cause toxicity by acute or chronic exposures
In addition, evaluate
• whether there is exposure to multiple chemicals• the timing of exposures to multiple chemicals• routes of exposure• the spatial scale of exposure to multiple chemicals
The method used to estimate dietary exposure to multiple chemicals needs to adjust the detectedresidue levels of each of the chemicals considered, by "relative toxicity factors" that reflect thetoxicity levels of these chemicals relative to a "standard" chemical. A total adjusted residue thenmay be derived for each sample by summing the adjusted residue values corresponding to thatsample. An exposure assessment is then conducted using these total adjusted residues. Theapproach is based on the concepts proposed by the National Academy of Sciences (NAS) for theassessment of joint exposure to organophosphate pesticides, and is similar to that followed by theEPA in the case of dioxin-like compounds. DEEM™ does not specify the procedure forestablishing the relative potency, but once the user has determined the relative potency, DEEM™will adjust the residues accordingly.
Based on our experience in conducting cumulative exposures using DEEM™, there are severalfactors that must be considered in order to estimate reliably the probability of effects fromexposure to multiple chemicals. Some of these include:
# Conduct a realistic treatment of the samples with non-detectable residues to reflectactual pesticide usage practices, including the timing of the pesticide applications, andthe potential usage of multiple pesticides on the same crop. A probabilistic approachthat incorporates information about usage practices is recommended.
# Conduct a realistic treatment of the samples with non-detectable residues to reflect thepotential distribution of residue levels below the detection limit. A Monte Carloapproach that incorporates information about the potential association between thedetected levels of the various chemicals is recommended.
# Determine consistent procedures for addressing situations where one or more relevantcompounds were not estimated or where there is a correlation between the presence ofone compound and that of another.

DEEM Users Manual©2000 Novigen Sciences, Inc.
10 - 2
# Develop methodology to permit modeling that will include the differences in time forrecovery from potential toxic effects and to account for timing for potential exposureto the population.
# Develop a method for expressing toxicity that is not significantly affected by theexperimental doses that were selected for the toxicological testing.
# Identify a common mechanism of action and use that to determine the toxicity,especially in situations where experimental data show that there are multiplemechanisms of action. For example, in the case of organophosphates, some of thechemicals inhibit RBC cholinesterase at higher doses than they inhibit braincholinesterase, while the reverse is true for others.
# Consider using the dose response patterns in deriving the relative toxicity factors.
The cumulative exposure assessment should be as realistic as the data permit or as the intendedapplication requires. The analysis should identify major source contributions and, if possible,identify the impact of different assumptions. Generally, this will be accomplished by sensitivityanalyses. The cumulative exposure will be determined for each individual in a target population(or more often, for a representative sample drawn from the population). In computing thisexposure, it is essential that correlations and linkages in individual datasets be maintained.
The specific methodology should allow the best use of the available data, including the physico-chemical and biological information, use/usage, and source information. The exposureassessment methodology will be defined by the toxicity profile of the group of chemicals to beevaluated. The toxicity profile will determine the appropriate time frame, the need to reflectdifferences in potency of compounds within the group and framework to use to account forcorrelations in the sources of exposure.
The major problem in moving from single chemical exposure assessment (aggregate) to multiplechemical (cumulative) exposure is that of covariance in the individual datasets. Any cumulativeassessment must incorporate methods to ensure that covariance/linkage of residue levels ismaintained. In principle, a cumulative assessment could be derived from combinations ofaggregate exposure. In practice, the ability to accurately incorporate covariance/linkages willusually require that the cumulative assessments be conducted independently.
Cumulative exposures may be estimated by either deterministic or probabilistic methodologies,or by a combination of both techniques. Ideally, any method used should incorporate thoseparameters most affecting potential exposures. Not only do personal characteristics, such asbody weight, breathing rates and activity patterns vary between individuals, but many types ofexposure will occur as episodic events at variable intervals of time.

DEEM Users Manual©2000 Novigen Sciences, Inc.
10 - 3
In conclusion, cumulative exposure must be simultaneously temporally, spatially, anddemographically specific. The cumulative intake must refer to dietary, drinking water,residential and other relevant intakes that are for the same individual at the same time and place.The time periods modeled in the cumulative exposure assessment should be equivalent to thetime periods of exposure judged to be relevant for the toxicological endpoint that will be used toevaluate the significance of estimated exposures.

DEEM Users Manual©2000 Novigen Sciences, Inc.
A - 1
APPENDIX A
LISTING OF FOODS, FOOD FORMS, AND CROP GROUPS
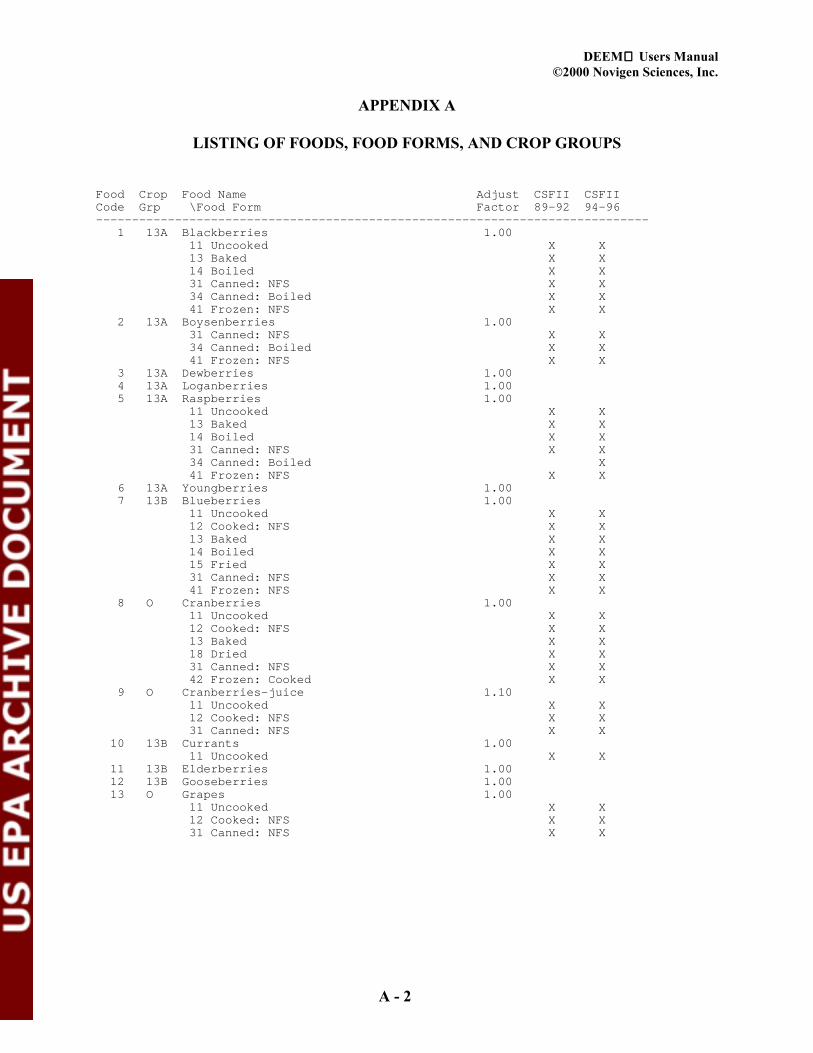
DEEM Users Manual©2000 Novigen Sciences, Inc.
A - 2
APPENDIX A
LISTING OF FOODS, FOOD FORMS, AND CROP GROUPS
Food Crop Food Name Adjust CSFII CSFIICode Grp \Food Form Factor 89-92 94-96----------------------------------------------------------------------------- 1 13A Blackberries 1.00 11 Uncooked X X 13 Baked X X 14 Boiled X X 31 Canned: NFS X X 34 Canned: Boiled X X 41 Frozen: NFS X X 2 13A Boysenberries 1.00 31 Canned: NFS X X 34 Canned: Boiled X X 41 Frozen: NFS X X 3 13A Dewberries 1.00 4 13A Loganberries 1.00 5 13A Raspberries 1.00 11 Uncooked X X 13 Baked X X 14 Boiled X X 31 Canned: NFS X X 34 Canned: Boiled X 41 Frozen: NFS X X 6 13A Youngberries 1.00 7 13B Blueberries 1.00 11 Uncooked X X 12 Cooked: NFS X X 13 Baked X X 14 Boiled X X 15 Fried X X 31 Canned: NFS X X 41 Frozen: NFS X X 8 O Cranberries 1.00 11 Uncooked X X 12 Cooked: NFS X X 13 Baked X X 18 Dried X X 31 Canned: NFS X X 42 Frozen: Cooked X X 9 O Cranberries-juice 1.10 11 Uncooked X X 12 Cooked: NFS X X 31 Canned: NFS X X 10 13B Currants 1.00 11 Uncooked X X 11 13B Elderberries 1.00 12 13B Gooseberries 1.00 13 O Grapes 1.00 11 Uncooked X X 12 Cooked: NFS X X 31 Canned: NFS X X

DEEM Users Manual©2000 Novigen Sciences, Inc.
A - 3
APPENDIX A (CONT’D)
Food Crop Food Name Adjust CSFII CSFIICode Grp \Food Form Factor 89-92 94-96----------------------------------------------------------------------------- 41 Frozen: NFS X X 14 O Grapes-raisins 4.30 11 Uncooked X X 12 Cooked: NFS X X 13 Baked X X 14 Boiled X X 18 Dried X X 42 Frozen: Cooked X X 15 O Grapes-juice 1.20 11 Uncooked X X 12 Cooked: NFS X X 14 Boiled X X 31 Canned: NFS X X 34 Canned: Boiled X X 41 Frozen: NFS X 16 13B Huckleberries 1.00 17 O Strawberries 1.00 11 Uncooked X X 12 Cooked: NFS X X 13 Baked X X 14 Boiled X X 31 Canned: NFS X X 34 Canned: Boiled X X 41 Frozen: NFS X X 18 O Juneberry 1.00 19 O Mulberries 1.00 11 Uncooked X X 20 10 Citrus citron 1.00 13 Baked X X 14 Boiled X X 22 10 Grapefruit-peeled fruit 1.00 11 Uncooked X X 12 Cooked: NFS X 31 Canned: NFS X X 23 10 Grapefruit-juice 2.10 11 Uncooked X X 31 Canned: NFS X X 24 10 Kumquats 1.00 26 10 Lemons-peeled fruit 1.00 11 Uncooked X X 12 Cooked: NFS X X 31 Canned: NFS X X 27 10 Lemons-peel 1.00 11 Uncooked X X 13 Baked X X 14 Boiled X X 31 Canned: NFS X 34 Canned: Boiled X X 41 Frozen: NFS X X 28 10 Lemons-juice 2.00 11 Uncooked X X 12 Cooked: NFS X X

DEEM Users Manual©2000 Novigen Sciences, Inc.
A - 4
APPENDIX A (CONT’D)
Food Crop Food Name Adjust CSFII CSFIICode Grp \Food Form Factor 89-92 94-96----------------------------------------------------------------------------- 13 Baked X X 14 Boiled X X 15 Fried X X 31 Canned: NFS X X 32 Canned: Cooked X X 34 Canned: Boiled X X 41 Frozen: NFS X X 42 Frozen: Cooked X X 30 10 Limes-peeled fruit 1.00 11 Uncooked X X 31 10 Limes-peel 1.00 13 Baked X X 14 Boiled X X 32 10 Limes-juice 2.00 11 Uncooked X X 31 Canned: NFS X X 32 Canned: Cooked X X 34 Canned: Boiled X X 41 Frozen: NFS X X 33 10 Oranges-juice-concentrate 6.70 11 Uncooked X X 12 Cooked: NFS X X 13 Baked X 14 Boiled X X 31 Canned: NFS X X 41 Frozen: NFS X X 42 Frozen: Cooked X X 34 10 Oranges-peeled fruit 1.00 11 Uncooked X X 12 Cooked: NFS X X 31 Canned: NFS X X 35 10 Oranges-peel 1.00 11 Uncooked X X 12 Cooked: NFS X X 31 Canned: NFS X X 41 Frozen: NFS X X 36 10 Oranges-juice 1.80 11 Uncooked X X 12 Cooked: NFS X X 31 Canned: NFS X X 41 Frozen: NFS X X 37 10 Tangelos 1.00 38 10 Tangerines 1.00 11 Uncooked X X 31 Canned: NFS X X 41 Frozen: NFS X 39 10 Tangerines-juice 2.30 11 Uncooked X 31 Canned: NFS X X 41 Frozen: NFS X 40 14 Almonds 1.00 11 Uncooked X X

DEEM Users Manual©2000 Novigen Sciences, Inc.
A - 5
APPENDIX A (CONT’D)
Food Crop Food Name Adjust CSFII CSFIICode Grp \Food Form Factor 89-92 94-96----------------------------------------------------------------------------- 12 Cooked: NFS X X 13 Baked X X 14 Boiled X X 18 Dried X X 41 Frozen: NFS X X 41 14 Brazil nuts 1.00 11 Uncooked X X 13 Baked X X 14 Boiled X X 16 Pasteurized X X 42 14 Cashews 1.00 11 Uncooked X X 13 Baked X X 14 Boiled X X 43 14 Chestnuts 1.00 12 Cooked: NFS X 13 Baked X 44 14 Filberts (hazelnuts) 1.00 11 Uncooked X X 13 Baked X X 14 Boiled X X 45 14 Hickory nuts 1.00 11 Uncooked X 46 14 Macadamia nuts (bush nuts) 1.00 13 Baked X X 47 14 Pecans 1.00 11 Uncooked X X 13 Baked X X 14 Boiled X X 48 14 Walnuts 1.00 11 Uncooked X X 12 Cooked: NFS X X 13 Baked X X 49 14 Butter nuts 1.00 50 O Pistachio nuts 1.00 11 Uncooked X X 12 Cooked: NFS X X 13 Baked X X 51 14 Beechnuts 1.00 52 11 Apples 1.00 11 Uncooked X X 12 Cooked: NFS X X 13 Baked X X 14 Boiled X X 15 Fried X X 18 Dried X X 31 Canned: NFS X X 32 Canned: Cooked X X 33 Canned: Baked X X 34 Canned: Boiled X X 42 Frozen: Cooked X X

DEEM Users Manual©2000 Novigen Sciences, Inc.
A - 6
APPENDIX A (CONT’D)
Food Crop Food Name Adjust CSFII CSFIICode Grp \Food Form Factor 89-92 94-96----------------------------------------------------------------------------- 53 11 Apples-dried 8.00 13 Baked X X 14 Boiled X X 18 Dried X X 42 Frozen: Cooked X 54 11 Apples-juice/cider 1.30 11 Uncooked X X 12 Cooked: NFS X 14 Boiled X X 31 Canned: NFS X X 41 Frozen: NFS X 55 11 Crabapples 1.00 31 Canned: NFS X 56 11 Pears 1.00 11 Uncooked X X 12 Cooked: NFS X X 13 Baked X 14 Boiled X X 31 Canned: NFS X X 57 11 Pears-dried 6.25 13 Baked X X 14 Boiled X 18 Dried X X 58 11 Quinces 1.00 59 12 Apricots 1.00 11 Uncooked X X 12 Cooked: NFS X X 14 Boiled X X 31 Canned: NFS X X 34 Canned: Boiled X X 60 12 Apricots-dried 6.00 13 Baked X X 14 Boiled X X 18 Dried X X 61 12 Cherries 1.00 11 Uncooked X X 12 Cooked: NFS X X 13 Baked X X 14 Boiled X X 31 Canned: NFS X X 33 Canned: Baked X X 41 Frozen: NFS X X 62 12 Cherries-dried 4.00 63 12 Cherries-juice 1.50 13 Baked X 14 Boiled X X 31 Canned: NFS X X 41 Frozen: NFS X 64 12 Nectarines 1.00 11 Uncooked X X 65 12 Peaches 1.00 11 Uncooked X X

DEEM Users Manual©2000 Novigen Sciences, Inc.
A - 7
APPENDIX A (CONT’D)
Food Crop Food Name Adjust CSFII CSFIICode Grp \Food Form Factor 89-92 94-96----------------------------------------------------------------------------- 12 Cooked: NFS X X 13 Baked X X 14 Boiled X X 31 Canned: NFS X X 41 Frozen: NFS X X 66 12 Peaches-dried 7.00 14 Boiled X 18 Dried X X 67 12 Plums (damsons) 1.00 11 Uncooked X X 12 Cooked: NFS X X 31 Canned: NFS X X 42 Frozen: Cooked X X 51 Cured: NFS (smoked/pickled/saltd) X 68 12 Plums-prunes (dried) 5.00 13 Baked X X 14 Boiled X X 18 Dried X X 31 Canned: NFS X X 69 12 Plums/prune-juice 1.40 11 Uncooked X X 31 Canned: NFS X X 70 O Avocados 1.00 11 Uncooked X X 72 O Bananas 1.00 11 Uncooked X X 12 Cooked: NFS X X 13 Baked X X 14 Boiled X X 15 Fried X X 31 Canned: NFS X X 32 Canned: Cooked X X 73 O Bananas-dried 3.90 13 Baked X X 15 Fried X X 18 Dried X X 32 Canned: Cooked X 74 O Coconut 1.00 11 Uncooked X X 13 Baked X X 14 Boiled X X 75 O Coconut-dried (copra) 2.10 12 Cooked: NFS X 13 Baked X X 14 Boiled X X 18 Dried X X 76 O Coconut-water 1.00 11 Uncooked X 14 Boiled X X 77 O Dates 1.00 13 Baked X X 14 Boiled X X

DEEM Users Manual©2000 Novigen Sciences, Inc.
A - 8
APPENDIX A (CONT’D)
Food Crop Food Name Adjust CSFII CSFIICode Grp \Food Form Factor 89-92 94-96----------------------------------------------------------------------------- 18 Dried X X 78 O Figs 1.00 11 Uncooked X X 13 Baked X X 79 O Guava 1.00 11 Uncooked X X 12 Cooked: NFS X X 31 Canned: NFS X X 80 O Mangoes 1.00 11 Uncooked X X 12 Cooked: NFS X X 31 Canned: NFS X X 81 11 Loquats 1.00 82 O Olives 1.00 60 Canned: Cured X X 84 O Papayas-pulp 1.00 11 Uncooked X X 12 Cooked: NFS X X 85 O Papayas-dried 1.80 18 Dried X 86 O Papayas-juice 1.50 11 Uncooked X X 87 O Pawpaws 1.00 88 O Persimmons 1.00 11 Uncooked X X 89 O Pineapples-peeled fruit 1.00 11 Uncooked X X 12 Cooked: NFS X X 13 Baked X X 14 Boiled X X 31 Canned: NFS X X 33 Canned: Baked X X 41 Frozen: NFS X X 90 O Pineapples-dried 5.00 18 Dried X X 91 O Pineapples-juice 1.70 11 Uncooked X X 12 Cooked: NFS X X 31 Canned: NFS X X 42 Frozen: Cooked X X 92 O Passion fruit (granadilla) 1.00 31 Canned: NFS X X 93 O Pomegranates 1.00 11 Uncooked X X 94 O Plantains-ripe 1.00 11 Uncooked X X 14 Boiled X X 15 Fried X X 95 O Lychees (litchi)/fresh 1.00 96 O Lychee-dried 1.85 97 O Kiwi fruit 1.00 11 Uncooked X X

DEEM Users Manual©2000 Novigen Sciences, Inc.
A - 9
APPENDIX A (CONT’D)
Food Crop Food Name Adjust CSFII CSFIICode Grp \Food Form Factor 89-92 94-96----------------------------------------------------------------------------- 31 Canned: NFS X 98 O Acerola 1.00 99 O Ginkgo nuts 1.00 100 O Maney (mammee apple) 1.00 11 Uncooked X 101 O Pitanga (surinam cherry) 1.00 102 O Soursop (annona muricata) 1.00 11 Uncooked X 103 O Sugar apples (sweetsop) 1.00 104 O Bread fruit 1.00 14 Boiled X 105 O Bread nuts 1.00 106 O Carambola (starfruit) 1.00 11 Uncooked X 107 O Cherimoya 1.00 108 O Longan fruit 1.00 109 O Genip (spanish lime) 1.00 110 O Chocolate-cocoa butter 1.00 12 Cooked: NFS X X 111 O Chocolate 1.00 12 Cooked: NFS X X 13 Baked X X 14 Boiled X X 31 Canned: NFS X X 32 Canned: Cooked X X 41 Frozen: NFS X X 112 O Coffee 1.00 12 Cooked: NFS X X 14 Boiled X X 113 O Tea 1.00 12 Cooked: NFS X X 114 1AB Chicory 1.00 115 19B Anise 1.00 14 Boiled X X 52 Cured: Cooked(smokd/pickld/saltd) X X 116 19A Basil 1.00 13 Baked X X 14 Boiled X X 117 19B Caraway 1.00 13 Baked X X 118 19B Cassia 1.00 119 19B Cinnamon 1.00 11 Uncooked X X 12 Cooked: NFS X X 13 Baked X X 120 19B Clove 1.00 12 Cooked: NFS X X 121 19B Coriander 1.00 12 Cooked: NFS X X 122 19B Cumin 1.00 11 Uncooked X X 12 Cooked: NFS X X

DEEM Users Manual©2000 Novigen Sciences, Inc.
A - 10
APPENDIX A (CONT’D)
Food Crop Food Name Adjust CSFII CSFIICode Grp \Food Form Factor 89-92 94-96----------------------------------------------------------------------------- 14 Boiled X X 42 Frozen: Cooked X 52Cured: Cooked(smokd/pickld/saltd) X X 123 19A Dill 1.00 13 Baked X 14 Boiled X X 124 1CD Ginger 1.00 11 Uncooked X X 12 Cooked: NFS X X 13 Baked X X 14 Boiled X X 125 O Hops 1.00 99 Alcohol/Fermented/Distilled X X 126 1AB Horseradish 1.00 12 Cooked: NFS X X 14 Boiled X X 34 Canned: Boiled X X 51 Cured: NFS (smoked/pickled/saltd) X X 127 19A Rosemary 1.00 12 Cooked: NFS X X 128 19A Marjoram 1.00 12 Cooked: NFS X X 18 Dried X 129 19A Oregano 1.00 11 Uncooked X X 12 Cooked: NFS X X 42 Frozen: Cooked X 130 19B Mustard seed 1.00 11 Uncooked X X 12 Cooked: NFS X X 42 Frozen: Cooked X 131 19B Nutmeg 1.00 12 Cooked: NFS X X 132 19B Mace 1.00 13 Baked X X 133 19A Sage 1.00 12 Cooked: NFS X X 134 19A Savory 1.00 135 19A Bay 1.00 12 Cooked: NFS X X 136 19A Thyme 1.00 12 Cooked: NFS X X 137 1CD Turmeric 1.00 12 Cooked: NFS X X 138 19B Allspice 1.00 12 Cooked: NFS X X 139 8 Paprika 1.00 12 Cooked: NFS X X 140 19B Poppy 1.00 12 Cooked: NFS X X 141 9A Melons-cantaloupes-juice 1.00 142 9A Melons-cantaloupes-pulp 1.00

DEEM Users Manual©2000 Novigen Sciences, Inc.
A - 11
APPENDIX A (CONT’D)
Food Crop Food Name Adjust CSFII CSFIICode Grp \Food Form Factor 89-92 94-96----------------------------------------------------------------------------- 11 Uncooked X X 143 9A Casabas 1.00 11 Uncooked X X 144 9A Crenshaws 1.00 145 9A Melons-honeydew 1.00 11 Uncooked X X 146 9A Melons-persian 1.00 147 9A Watermelon 1.00 11 Uncooked X X 148 9B Cucumbers 1.00 11 Uncooked X X 34 Canned: Boiled X X 60 Canned: Cured X X 149 9B Pumpkin 1.00 12 Cooked: NFS X X 13 Baked X X 14 Boiled X X 15 Fried X 33 Canned: Baked X X 34 Canned: Boiled X X 150 9B Squash-summer 1.00 11 Uncooked X X 12 Cooked: NFS X X 13 Baked X X 14 Boiled X X 15 Fried X X 34 Canned: Boiled X X 42 Frozen: Cooked X X 51 Cured: NFS (smoked/pickled/saltd) X 151 9B Squash-winter 1.00 11 Uncooked X 12 Cooked: NFS X X 13 Baked X X 14 Boiled X X 152 9B Bitter melon 1.00 12 Cooked: NFS X X 153 O Towelgourd 1.00 154 8 Eggplant 1.00 12 Cooked: NFS X X 13 Baked X X 14 Boiled X X 15 Fried X X 155 8 Peppers-sweet(garden) 1.00 11 Uncooked X X 12 Cooked: NFS X X 13 Baked X X 14 Boiled X X 31 Canned: NFS X X 32 Canned: Cooked X X 34 Canned: Boiled X X 42 Frozen: Cooked X X 51 Cured: NFS (smoked/pickled/saltd) X X

DEEM Users Manual©2000 Novigen Sciences, Inc.
A - 12
APPENDIX A (CONT’D)
Food Crop Food Name Adjust CSFII CSFIICode Grp \Food Form Factor 89-92 94-96----------------------------------------------------------------------------- 156 8 Peppers-chilli incl jalapeno 1.00 11 Uncooked X X 12 Cooked: NFS X X 13 Baked X X 14 Boiled X X 15 Fried X X 31 Canned: NFS X X 32 Canned: Cooked X X 33 Canned: Baked X X 34 Canned: Boiled X X 42 Frozen: Cooked X X 51 Cured: NFS (smoked/pickled/saltd) X X 52 Cured: Cooked(smokd/pickld/saltd) X X 60 Canned: Cured X X 157 8 Peppers-other 1.00 11 Uncooked X 158 8 Pimientos 1.00 12 Cooked: NFS X X 14 Boiled X 31 Canned: NFS X X 60 Canned: Cured X X 159 8 Tomatoes-whole 1.00 11 Uncooked X X 12 Cooked: NFS X X 13 Baked X X 14 Boiled X X 15 Fried X X 31 Canned: NFS X X 32 Canned: Cooked X X 33 Canned: Baked X X 34 Canned: Boiled X X 42 Frozen: Cooked X X 160 8 Tomatoes-juice 1.50 31 Canned: NFS X X 32 Canned: Cooked X X 34 Canned: Boiled X X 42 Frozen: Cooked X 161 8 Tomatoes-puree 3.30 12 Cooked: NFS X X 14 Boiled X X 31 Canned: NFS X X 32 Canned: Cooked X X 33 Canned: Baked X X 34 Canned: Boiled X X 42 Frozen: Cooked X X 162 8 Tomatoes-paste 5.40 14 Boiled X X 31 Canned: NFS X X 32 Canned: Cooked X X 33 Canned: Baked X X 34 Canned: Boiled X X
42 Frozen: Cooked X X

DEEM Users Manual©2000 Novigen Sciences, Inc.
A - 13
APPENDIX A (CONT’D)
Food Crop Food Name Adjust CSFII CSFIICode Grp \Food Form Factor 89-92 94-96----------------------------------------------------------------------------- 163 8 Tomatoes-catsup 2.50 34 Canned: Boiled X X 164 8 Groundcherries 1.00 165 2 Beets-garden-tops(greens) 1.00 11 Uncooked X 14 Boiled X X 166 4B Celery 1.00 11 Uncooked X X 12 Cooked: NFS X X 13 Baked X X 14 Boiled X X 15 Fried X X 31 Canned: NFS X X 32 Canned: Cooked X X 34 Canned: Boiled X X 42 Frozen: Cooked X X 167 4A Chicory(french/belgian endive) 1.00 11 Uncooked X X 168 5A Broccoli 1.00 11 Uncooked X X 12 Cooked: NFS X X 13 Baked X X 14 Boiled X X 15 Fried X X 32 Canned: Cooked X X 42 Frozen: Cooked X X 44 Frozen: Boiled X X 169 5A Brussels sprouts 1.00 14 Boiled X X 42 Frozen: Cooked X 170 5A Cabbage-green and red 1.00 11 Uncooked X X 12 Cooked: NFS X X 13 Baked X X 14 Boiled X X 15 Fried X X 31 Canned: NFS X X 32 Canned: Cooked X X 51 Cured: NFS (smoked/pickled/saltd) X X 171 5A Cauliflower 1.00 11 Uncooked X X 12 Cooked: NFS X X 14 Boiled X X 15 Fried X X 42 Frozen: Cooked X X 172 5B Collards 1.00 14 Boiled X X 32 Canned: Cooked X 42 Frozen: Cooked X 174 5B Kale 1.00 12 Cooked: NFS X 14 Boiled X X

DEEM Users Manual©2000 Novigen Sciences, Inc.
A - 14
APPENDIX A (CONT’D)
Food Crop Food Name Adjust CSFII CSFIICode Grp \Food Form Factor 89-92 94-96----------------------------------------------------------------------------- 32 Canned: Cooked X 175 5A Kohlrabi 1.00 14 Boiled X 176 4A Lettuce-leafy varieties 1.00 11 Uncooked X X 177 4A Dandelion-greens 1.00 11 Uncooked X X 178 4A Endive-curley and escarole 1.00 11 Uncooked X X 12 Cooked: NFS X X 179 19B Fennel 1.00 12 Cooked: NFS X X 180 4A Cress-garden/field 1.00 11 Uncooked X 14 Boiled X 181 O Artichokes-globe 1.00 14 Boiled X X 182 4A Lettuce-unspecified 1.00 31 Canned: NFS X X 183 5B Mustard greens 1.00 14 Boiled X X 184 4A Parsley 1.00 11 Uncooked X X 12 Cooked: NFS X X 13 Baked X X 14 Boiled X X 15 Fried X X 31 Canned: NFS X X 32 Canned: Cooked X 34 Canned: Boiled X X 185 4B Rhubarb 1.00 12 Cooked: NFS X X 13 Baked X 43 Frozen: Baked X X 186 4A Spinach 1.00 11 Uncooked X X 12 Cooked: NFS X X 14 Boiled X X 31 Canned: NFS X X 32 Canned: Cooked X X 34 Canned: Boiled X 42 Frozen: Cooked X X 44 Frozen: Boiled X 187 4A Swiss chard 1.00 11 Uncooked X 14 Boiled X X 188 2 Turnips-tops 1.00 14 Boiled X X 32 Canned: Cooked X 44 Frozen: Boiled X 189 O Watercress 1.00 11 Uncooked X X

DEEM Users Manual©2000 Novigen Sciences, Inc.
A - 15
APPENDIX A (CONT’D)
Food Crop Food Name Adjust CSFII CSFIICode Grp \Food Form Factor 89-92 94-96----------------------------------------------------------------------------- 14 Boiled X 31 Canned: NFS X X 190 2 Taro-greens 1.00 14 Boiled X 191 4A Cress-upland 1.00 192 4A Lettuce-head varieties 1.00 11 Uncooked X X 193 O Lambsquarter 1.00 12 Cooked: NFS X 194 O Cactus pads (nopal) 1.00 195 O Grapes-leaves 1.00 14 Boiled X X 196 O Oriental vegetables/leafy 1.00 197 1AB Beets-garden-roots 1.00 11 Uncooked X X 14 Boiled X X 31 Canned: NFS X X 32 Canned: Cooked X X 51 Cured: NFS (smoked/pickled/saltd) X X 198 1AB Carrots 1.00 11 Uncooked X X 12 Cooked: NFS X X 13 Baked X X 14 Boiled X X 31 Canned: NFS X X 32 Canned: Cooked X X 34 Canned: Boiled X X 42 Frozen: Cooked X X 44 Frozen: Boiled X X 199 1AB Celeriac 1.00 200 19A Chives 1.00 11 Uncooked X X 12 Cooked: NFS X X 13 Baked X X 18 Dried X 201 1CD Taro-root 1.00 12 Cooked: NFS X X 14 Boiled X X 202 3 Garlic 1.00 11 Uncooked X X 12 Cooked: NFS X X 13 Baked X X 14 Boiled X X 15 Fried X X 31 Canned: NFS X X 32 Canned: Cooked X X 33 Canned: Baked X X 34 Canned: Boiled X X 42 Frozen: Cooked X X 51 Cured: NFS (smoked/pickled/saltd) X X 52 Cured: Cooked(smokd/pickld/saltd) X X

DEEM Users Manual©2000 Novigen Sciences, Inc.
A - 16
APPENDIX A (CONT’D)
Food Crop Food Name Adjust CSFII CSFIICode Grp \Food Form Factor 89-92 94-96----------------------------------------------------------------------------- 203 1CD Artichokes-jerusalem 1.00 11 Uncooked X 204 3 Leeks 1.00 11 Uncooked X 12 Cooked: NFS X X 205 3 Onions-dry-bulb (cipollini) 1.00 11 Uncooked X X 12 Cooked: NFS X X 13 Baked X X 14 Boiled X X 15 Fried X X 31 Canned: NFS X X 32 Canned: Cooked X X 34 Canned: Boiled X X 42 Frozen: Cooked X X 43 Frozen: Baked X 44 Frozen: Boiled X X 60 Canned: Cured X X 206 3 Onions-dehydrated or dried 9.00 12 Cooked: NFS X X 13 Baked X X 14 Boiled X X 15 Fried X X 31 Canned: NFS X X 32 Canned: Cooked X X 34 Canned: Boiled X X 42 Frozen: Cooked X X 207 1C Potatoes/white-whole 1.00 11 Uncooked X 12 Cooked: NFS X X 13 Baked X X 14 Boiled X X 15 Fried X X 31 Canned: NFS X X 208 1C Potatoes/white-unspecified 1.00 31 Canned: NFS X 209 1C Potatoes/white-peeled 1.00 12 Cooked: NFS X X 13 Baked X X 14 Boiled X X 15 Fried X X 32 Canned: Cooked X X 34 Canned: Boiled X X 42 Frozen: Cooked X X 43 Frozen: Baked X X 45 Frozen: Fried X X 210 1C Potatoes/white-dry 6.50 12 Cooked: NFS X X 14 Boiled X X 15 Fried X X 31 Canned: NFS X X 34 Canned: Boiled X X

DEEM Users Manual©2000 Novigen Sciences, Inc.
A - 17
APPENDIX A (CONT’D)
Food Crop Food Name Adjust CSFII CSFIICode Grp \Food Form Factor 89-92 94-96----------------------------------------------------------------------------- 42 Frozen: Cooked X X 211 1C Potatoes/white-peel only 1.00 13 Baked X X 15 Fried X X 212 1AB Radishes-roots 1.00 11 Uncooked X X 12 Cooked: NFS X X 213 2 Radishes-tops 1.00 214 1AB Rutabagas-roots 1.00 215 2 Rutabagas-tops 1.00 12 Cooked: NFS X X 216 1AB Salsify(oyster plant) 1.00 217 3 Shallots 1.00 218 1CD Sweet potatoes (incl yams) 1.00 12 Cooked: NFS X X 13 Baked X X 14 Boiled X X 15 Fried X X 32 Canned: Cooked X X 34 Canned: Boiled X 219 1AB Turnips-roots 1.00 11 Uncooked X X 12 Cooked: NFS X X 14 Boiled X X 220 1AB Parsnips 1.00 14 Boiled X X 221 1CD Yambean tuber (jicama) 1.00 11 Uncooked X X 222 1CD Cassava (yuca blanca) 1.00 12 Cooked: NFS X X 13 Baked X X 14 Boiled X X 15 Fried X X 31 Canned: NFS X X 41 Frozen: NFS X X 224 1CD Yautia (tannier) 1.00 225 1AB Parsley roots 1.00 226 O Water chestnuts 1.00 14 Boiled X X 15 Fried X X 31 Canned: NFS X X 32 Canned: Cooked X X 34 Canned: Boiled X X 42 Frozen: Cooked X X 227 6C Beans-dry-great northern 1.00 32 Canned: Cooked X 228 6C Beans-dry-kidney 1.00 12 Cooked: NFS X 13 Baked X X 14 Boiled X X 32 Canned: Cooked X X 34 Canned: Boiled X X

DEEM Users Manual©2000 Novigen Sciences, Inc.
A - 18
APPENDIX A (CONT’D)
Food Crop Food Name Adjust CSFII CSFIICode Grp \Food Form Factor 89-92 94-96----------------------------------------------------------------------------- 42 Frozen: Cooked X X 229 6C Beans-dry-lima 1.00 14 Boiled X X 32 Canned: Cooked X X 230 6C Beans-dry-navy (pea) 1.00 32 Canned: Cooked X 34 Canned: Boiled X X 231 6C Beans-dry-other 1.00 12 Cooked: NFS X X 13 Baked X X 14 Boiled X X 15 Fried X X 34 Canned: Boiled X X 232 6C Beans-dry-pinto 1.00 12 Cooked: NFS X X 13 Baked X X 14 Boiled X X 15 Fried X X 32 Canned: Cooked X X 42 Frozen: Cooked X X 233 6B Beans-succulent-lima 1.00 11 Uncooked X X 12 Cooked: NFS X X 14 Boiled X X 32 Canned: Cooked X X 42 Frozen: Cooked X X 44 Frozen: Boiled X X 234 6A Beans-succulent-green 1.00 11 Uncooked X X 12 Cooked: NFS X X 14 Boiled X X 31 Canned: NFS X 32 Canned: Cooked X X 34 Canned: Boiled X X 42 Frozen: Cooked X X 44 Frozen: Boiled X X 51 Cured: NFS (smoked/pickled/saltd) X 235 6A Beans-succulent-other 1.00 34 Canned: Boiled X X 236 6A Beans-succulent-yellow/wax 1.00 14 Boiled X X 32 Canned: Cooked X X 42 Frozen: Cooked X 237 15 Corn/pop 1.00 12 Cooked: NFS X X 13 Baked X X 238 15 Corn/sweet 1.00 11 Uncooked X X 12 Cooked: NFS X X 13 Baked X X 14 Boiled X X 32 Canned: Cooked X X

DEEM Users Manual©2000 Novigen Sciences, Inc.
A - 19
APPENDIX A (CONT’D)
Food Crop Food Name Adjust CSFII CSFIICode Grp \Food Form Factor 89-92 94-96----------------------------------------------------------------------------- 34 Canned: Boiled X X 35 Canned: Fried X X 42 Frozen: Cooked X X 240 6C Peas (garden)-dry 1.00 12 Cooked: NFS X X 14 Boiled X X 31 Canned: NFS X X 32 Canned: Cooked X X 34 Canned: Boiled X X 241 6AB Peas (garden)-green 1.00 11 Uncooked X X 12 Cooked: NFS X X 13 Baked X X 14 Boiled X X 15 Fried X X 31 Canned: NFS X X 32 Canned: Cooked X X 34 Canned: Boiled X X 42 Frozen: Cooked X X 44 Frozen: Boiled X X 45 Frozen: Fried X X 243 6C Lentils 1.00 14 Boiled X X 244 6C Mung beans (sprouts) 1.00 11 Uncooked X X 12 Cooked: NFS X X 14 Boiled X X 15 Fried X X 245 O Okra 1.00 12 Cooked: NFS X X 14 Boiled X X 15 Fried X X 32 Canned: Cooked X X 42 Frozen: Cooked X 44 Frozen: Boiled X X 247 O Carob 1.00 13 Baked X X 248 O Alfalfa sprouts 1.00 11 Uncooked X X 249 6C Beans-dry-broadbeans 1.00 14 Boiled X X 250 6B Beans-succulent-broadbeans 1.00 251 6C Beans-dry-pigeon beans 1.00 252 O Sesame seeds 1.00 11 Uncooked X X 13 Baked X X 14 Boiled X X 42 Frozen: Cooked X 253 6 Beans-unspecified 1.00 254 O Pinenuts 1.00 11 Uncooked X X 14 Boiled X X

DEEM Users Manual©2000 Novigen Sciences, Inc.
A - 20
APPENDIX A (CONT’D)
Food Crop Food Name Adjust CSFII CSFIICode Grp \Food Form Factor 89-92 94-96----------------------------------------------------------------------------- 255 6A Soybeans-sprouted seeds 0.33 14 Boiled X X 256 6C Beans-dry-hyacinth 1.00 257 6 Beans-succulent-hyacinth 1.00 258 6C Beans-dry-blackeye peas/cowpea 1.00 14 Boiled X X 259 6C Beans-dry-garbanzo/chick pea 1.00 12 Cooked: NFS X 14 Boiled X X 15 Fried X 32 Canned: Cooked X X 260 O Asparagus 1.00 11 Uncooked X X 14 Boiled X X 32 Canned: Cooked X X 42 Frozen: Cooked X 261 O Mushrooms 1.00 11 Uncooked X X 12 Cooked: NFS X X 13 Baked X X 14 Boiled X X 15 Fried X X 31 Canned: NFS X X 32 Canned: Cooked X X 33 Canned: Baked X X 34 Canned: Boiled X X 42 Frozen: Cooked X X 262 3 Onions-green 1.00 11 Uncooked X X 12 Cooked: NFS X X 13 Baked X X 14 Boiled X X 15 Fried X X 31 Canned: NFS X X 32 Canned: Cooked X X 263 O Poke greens 1.00 14 Boiled X X 264 O Bamboo shoots 1.00 11 Uncooked X X 12 Cooked: NFS X X 14 Boiled X X 265 15 Barley 1.00 11 Uncooked X X 12 Cooked: NFS X X 13 Baked X X 14 Boiled X X 15 Fried X X 31 Canned: NFS X 32 Canned: Cooked X X 34 Canned: Boiled X X 99 Alcohol/Fermented/Distilled X X

DEEM Users Manual©2000 Novigen Sciences, Inc.
A - 21
APPENDIX A (CONT’D)
Food Crop Food Name Adjust CSFII CSFIICode Grp \Food Form Factor 89-92 94-96----------------------------------------------------------------------------- 266 15 Corn grain-endosperm 1.00 11 Uncooked X X 12 Cooked: NFS X X 13 Baked X X 14 Boiled X X 15 Fried X X 31 Canned: NFS X X 32 Canned: Cooked X X 33 Canned: Baked X X 34 Canned: Boiled X X 41 Frozen: NFS X X 42 Frozen: Cooked X X 43 Frozen: Baked X X 45 Frozen: Fried X X 99 Alcohol/Fermented/Distilled X X 267 15 Corn grain-bran 1.00 12 Cooked: NFS X X 13 Baked X X 14 Boiled X X 15 Fried X X 31 Canned: NFS X X 268 15 Corn grain/sugar/hfcs 1.50 98 Refined X X 269 15 Oats 1.00 11 Uncooked X X 12 Cooked: NFS X X 13 Baked X X 14 Boiled X X 15 Fried X X 31 Canned: NFS X X 270 15 Rice-rough (brown) 1.00 12 Cooked: NFS X X 13 Baked X X 14 Boiled X X 99 Alcohol/Fermented/Distilled X X 271 15 Rice-milled (white) 1.00 12 Cooked: NFS X X 13 Baked X X 14 Boiled X X 15 Fried X X 31 Canned: NFS X X 32 Canned: Cooked X X 34 Canned: Boiled X X 42 Frozen: Cooked X X 99 Alcohol/Fermented/Distilled X X 272 15 Rye-rough 1.00 12 Cooked: NFS X 13 Baked X X 273 15 Rye-germ 1.00 13 Baked X 274 15 Rye-flour 1.00 13 Baked X X

DEEM Users Manual©2000 Novigen Sciences, Inc.
A - 22
APPENDIX A (CONT’D)
Food Crop Food Name Adjust CSFII CSFIICode Grp \Food Form Factor 89-92 94-96----------------------------------------------------------------------------- 275 15 Sorghum (including milo) 1.00 14 Boiled X 276 15 Wheat-rough 1.00 11 Uncooked X 12 Cooked: NFS X X 13 Baked X X 14 Boiled X X 277 15 Wheat-germ 1.00 12 Cooked: NFS X X 13 Baked X X 14 Boiled X X 278 15 Wheat-bran 1.00 11 Uncooked X X 12 Cooked: NFS X X 13 Baked X X 279 15 Wheat-flour 1.00 11 Uncooked X X 12 Cooked: NFS X X 13 Baked X X 14 Boiled X X 15 Fried X X 31 Canned: NFS X X 32 Canned: Cooked X X 33 Canned: Baked X X 34 Canned: Boiled X X 41 Frozen: NFS X X 42 Frozen: Cooked X X 43 Frozen: Baked X X 45 Frozen: Fried X X 52 Cured: Cooked(smokd/pickld/saltd) X X 280 15 Millet 1.00 13 Baked X X 281 O Honey 1.00 11 Uncooked X X 13 Baked X X 14 Boiled X X 15 Fried X X 34 Canned: Boiled X X 52 Cured: Cooked(smokd/pickld/saltd) X 282 1A Sugar-beet 1.00 98 Refined X X 283 O Sugar-cane 1.00 98 Refined X X 284 O Sugar-cane/molasses 1.00 13 Baked X X 285 O Maple sugar 1.00 14 Boiled X X 286 15 Buckwheat 1.00 12 Cooked: NFS X X 287 6C Guar beans 1.00 13 Baked X X 288 O Castor beans 1.00

DEEM Users Manual©2000 Novigen Sciences, Inc.
A - 23
APPENDIX A (CONT’D)
Food Crop Food Name Adjust CSFII CSFIICode Grp \Food Form Factor 89-92 94-96----------------------------------------------------------------------------- 289 15 Corn grain-oil 1.00 98 Refined X X 290 O Cottonseed-oil 1.00 98 Refined X X 291 O Cottonseed-meal 1.00 13 Baked X X 292 O Flax seed 1.00 98 Refined X X 293 O Peanuts-oil 1.00 98 Refined X X 294 O Safflower-seed 1.00 295 O Safflower-oil 1.00 98 Refined X X 296 O Sesame-oil 1.00 98 Refined X X 297 6A Soybeans-oil 1.00 98 Refined X X 298 O Sunflower-oil 1.00 98 Refined X X 299 O Coconut-oil 1.00 98 Refined X X 300 O Olive oil 1.00 98 Refined X X 301 O Canola oil (rape seed oil) 1.00 98 Refined X X 302 O Palm oil 1.00 98 Refined X X 303 6A Soybean-other 1.00 304 6A Soybeans-mature seeds dry 1.00 12 Cooked: NFS X X 13 Baked X X 14 Boiled X X 15 Fried X X 41 Frozen: NFS X X 305 6A Soybeans-flour (full fat) 1.00 12 Cooked: NFS X X 13 Baked X 14 Boiled X X 34 Canned: Boiled X X 42 Frozen: Cooked X X 306 6A Soybeans-flour (low fat) 1.00 12 Cooked: NFS X X 13 Baked X X 15 Fried X X 31 Canned: NFS X X 307 6A Soybeans-flour (defatted) 1.00 12 Cooked: NFS X X 13 Baked X X 14 Boiled X X 15 Fried X X 31 Canned: NFS X X 34 Canned: Boiled X X
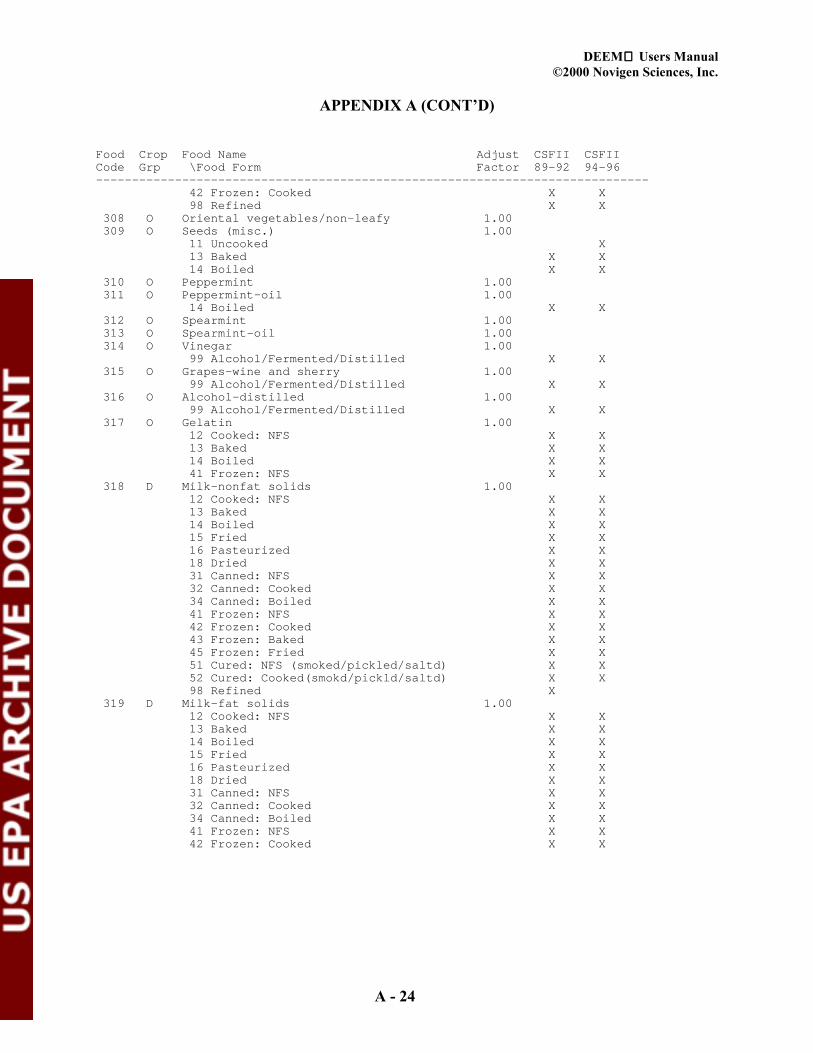
DEEM Users Manual©2000 Novigen Sciences, Inc.
A - 24
APPENDIX A (CONT’D)
Food Crop Food Name Adjust CSFII CSFIICode Grp \Food Form Factor 89-92 94-96----------------------------------------------------------------------------- 42 Frozen: Cooked X X 98 Refined X X 308 O Oriental vegetables/non-leafy 1.00 309 O Seeds (misc.) 1.00 11 Uncooked X 13 Baked X X 14 Boiled X X 310 O Peppermint 1.00 311 O Peppermint-oil 1.00 14 Boiled X X 312 O Spearmint 1.00 313 O Spearmint-oil 1.00 314 O Vinegar 1.00 99 Alcohol/Fermented/Distilled X X 315 O Grapes-wine and sherry 1.00 99 Alcohol/Fermented/Distilled X X 316 O Alcohol-distilled 1.00 99 Alcohol/Fermented/Distilled X X 317 O Gelatin 1.00 12 Cooked: NFS X X 13 Baked X X 14 Boiled X X 41 Frozen: NFS X X 318 D Milk-nonfat solids 1.00 12 Cooked: NFS X X 13 Baked X X 14 Boiled X X 15 Fried X X 16 Pasteurized X X 18 Dried X X 31 Canned: NFS X X 32 Canned: Cooked X X 34 Canned: Boiled X X 41 Frozen: NFS X X 42 Frozen: Cooked X X 43 Frozen: Baked X X 45 Frozen: Fried X X 51 Cured: NFS (smoked/pickled/saltd) X X 52 Cured: Cooked(smokd/pickld/saltd) X X 98 Refined X 319 D Milk-fat solids 1.00 12 Cooked: NFS X X 13 Baked X X 14 Boiled X X 15 Fried X X 16 Pasteurized X X 18 Dried X X 31 Canned: NFS X X 32 Canned: Cooked X X 34 Canned: Boiled X X 41 Frozen: NFS X X 42 Frozen: Cooked X X

DEEM Users Manual©2000 Novigen Sciences, Inc.
A - 25
APPENDIX A (CONT’D)
Food Crop Food Name Adjust CSFII CSFIICode Grp \Food Form Factor 89-92 94-96----------------------------------------------------------------------------- 45 Frozen: Fried X X 51 Cured: NFS (smoked/pickled/saltd) X X 52 Cured: Cooked(smokd/pickld/saltd) X X 320 D Milk sugar (lactose) 1.00 12 Cooked: NFS X X 13 Baked X X 14 Boiled X X 15 Fried X X 16 Pasteurized X X 18 Dried X X 31 Canned: NFS X X 32 Canned: Cooked X X 34 Canned: Boiled X X 41 Frozen: NFS X X 42 Frozen: Cooked X X 45 Frozen: Fried X X 51 Cured: NFS (smoked/pickled/saltd) X X 52 Cured: Cooked(smokd/pickld/saltd) X X 321 M Beef-meat byproducts 1.00 12 Cooked: NFS X X 52 Cured: Cooked(smokd/pickld/saltd) X X 322 M Beef-other organ meats 1.00 12 Cooked: NFS X X 14 Boiled X X 52 Cured: Cooked(smokd/pickld/saltd) X X 323 M Beef-dried 1.92 324 M Beef-fat w/o bones 1.00 11 Uncooked X 12 Cooked: NFS X X 13 Baked X X 14 Boiled X X 15 Fried X X 31 Canned: NFS X X 32 Canned: Cooked X X 34 Canned: Boiled X X 42 Frozen: Cooked X X 45 Frozen: Fried X X 51 Cured: NFS (smoked/pickled/saltd) X X 52 Cured: Cooked(smokd/pickld/saltd) X X 59 Cured: Dried (smokd/pickld/saltd) X X 325 M Beef-kidney 1.00 12 Cooked: NFS X 15 Fried X 326 M Beef-liver 1.00 12 Cooked: NFS X X 14 Boiled X X 15 Fried X X 327 M Beef-lean (fat/free) w/o bones 1.00 11 Uncooked X 12 Cooked: NFS X X 13 Baked X X 14 Boiled X X

DEEM Users Manual©2000 Novigen Sciences, Inc.
A - 26
APPENDIX A (CONT’D)
Food Crop Food Name Adjust CSFII CSFIICode Grp \Food Form Factor 89-92 94-96----------------------------------------------------------------------------- 15 Fried X X 31 Canned: NFS X X 32 Canned: Cooked X X 33 Canned: Baked X X 34 Canned: Boiled X X 42 Frozen: Cooked X X 51 Cured: NFS (smoked/pickled/saltd) X X 52 Cured: Cooked(smokd/pickld/saltd) X X 59 Cured: Dried (smokd/pickld/saltd) X X 328 M Goat-meat byproducts 1.00 329 M Goat-other organ meats 1.00 330 M Goat-fat w/o bone 1.00 13 Baked X X 14 Boiled X X 331 M Goat-kidney 1.00 332 M Goat-liver 1.00 333 M Goat-lean (fat/free) w/o bone 1.00 13 Baked X X 14 Boiled X X 334 M Horsemeat 1.00 335 M Rabbit 1.00 12 Cooked: NFS X X 336 M Sheep-meat byproducts 1.00 337 M Sheep-other organ meats 1.00 338 M Sheep-fat w/o bone 1.00 12 Cooked: NFS X X 13 Baked X X 14 Boiled X X 31 Canned: NFS X X 52 Cured: Cooked(smokd/pickld/saltd) X X 339 M Sheep-kidney 1.00 340 M Sheep-liver 1.00 341 M Sheep-lean (fat free) w/o bone 1.00 12 Cooked: NFS X X 13 Baked X X 14 Boiled X X 15 Fried X X 342 M Pork-meat byproducts 1.00 12 Cooked: NFS X X 14 Boiled X X 15 Fried X X 52 Cured: Cooked(smokd/pickld/saltd) X X 343 M Pork-other organ meats 1.00 12 Cooked: NFS X X 15 Fried X X 344 M Pork-fat w/o bone 1.00 11 Uncooked X 12 Cooked: NFS X X 13 Baked X X 14 Boiled X X 15 Fried X X 31 Canned: NFS X X

DEEM Users Manual©2000 Novigen Sciences, Inc.
A - 27
APPENDIX A (CONT’D)
Food Crop Food Name Adjust CSFII CSFIICode Grp \Food Form Factor 89-92 94-96----------------------------------------------------------------------------- 32 Canned: Cooked X X 34 Canned: Boiled X X 42 Frozen: Cooked X X 51 Cured: NFS (smoked/pickled/saltd) X X 52 Cured: Cooked(smokd/pickld/saltd) X X 60 Canned: Cured X X 345 M Pork-kidney 1.00 346 M Pork-liver 1.00 12 Cooked: NFS X X 15 Fried X X 347 M Pork-lean (fat free) w/o bone 1.00 12 Cooked: NFS X X 13 Baked X X 14 Boiled X X 15 Fried X X 31 Canned: NFS X X 32 Canned: Cooked X X 34 Canned: Boiled X X 42 Frozen: Cooked X X 51 Cured: NFS (smoked/pickled/saltd) X X 52 Cured: Cooked(smokd/pickld/saltd) X X 60 Canned: Cured X X 349 F Fish-shellfish 1.00 11 Uncooked X X 12 Cooked: NFS X X 13 Baked X X 14 Boiled X X 15 Fried X X 31 Canned: NFS X X 32 Canned: Cooked X X 34 Canned: Boiled X X 35 Canned: Fried X X 51 Cured: NFS (smoked/pickled/saltd) X X 350 O Meat-game 1.00 12 Cooked: NFS X X 13 Baked X X 14 Boiled X X 51 Cured: NFS (smoked/pickled/saltd) X 59 Cured: Dried (smokd/pickld/saltd) X X 351 F Fish-roe/caviar 1.00 11 Uncooked X X 352 F Fish-finfish/freshwater 1.00 12 Cooked: NFS X X 13 Baked X X 14 Boiled X X 15 Fried X X 51 Cured: NFS (smoked/pickled/saltd) X X 353 F Fish-finfish/saltwater (incl. tuna) 1.00 11 Uncooked X X 12 Cooked: NFS X X 13 Baked X X 14 Boiled X X
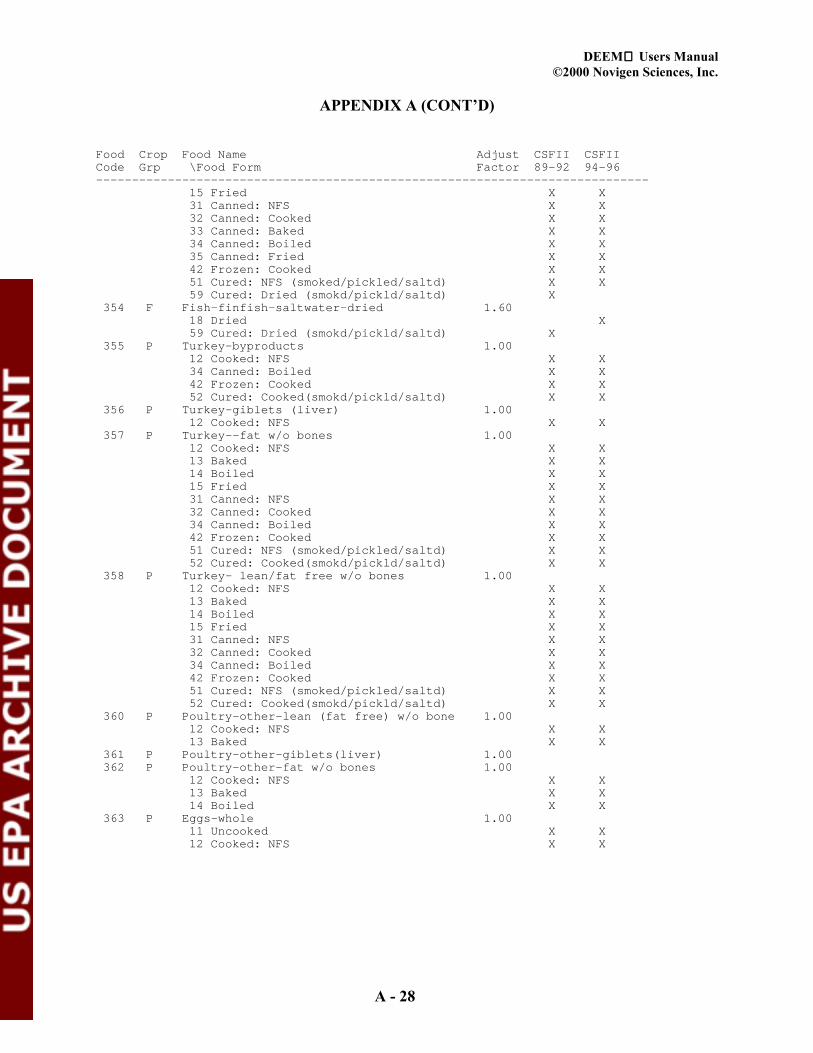
DEEM Users Manual©2000 Novigen Sciences, Inc.
A - 28
APPENDIX A (CONT’D)
Food Crop Food Name Adjust CSFII CSFIICode Grp \Food Form Factor 89-92 94-96----------------------------------------------------------------------------- 15 Fried X X 31 Canned: NFS X X 32 Canned: Cooked X X 33 Canned: Baked X X 34 Canned: Boiled X X 35 Canned: Fried X X 42 Frozen: Cooked X X 51 Cured: NFS (smoked/pickled/saltd) X X 59 Cured: Dried (smokd/pickld/saltd) X 354 F Fish-finfish-saltwater-dried 1.60 18 Dried X 59 Cured: Dried (smokd/pickld/saltd) X 355 P Turkey-byproducts 1.00 12 Cooked: NFS X X 34 Canned: Boiled X X 42 Frozen: Cooked X X 52 Cured: Cooked(smokd/pickld/saltd) X X 356 P Turkey-giblets (liver) 1.00 12 Cooked: NFS X X 357 P Turkey--fat w/o bones 1.00 12 Cooked: NFS X X 13 Baked X X 14 Boiled X X 15 Fried X X 31 Canned: NFS X X 32 Canned: Cooked X X 34 Canned: Boiled X X 42 Frozen: Cooked X X 51 Cured: NFS (smoked/pickled/saltd) X X 52 Cured: Cooked(smokd/pickld/saltd) X X 358 P Turkey- lean/fat free w/o bones 1.00 12 Cooked: NFS X X 13 Baked X X 14 Boiled X X 15 Fried X X 31 Canned: NFS X X 32 Canned: Cooked X X 34 Canned: Boiled X X 42 Frozen: Cooked X X 51 Cured: NFS (smoked/pickled/saltd) X X 52 Cured: Cooked(smokd/pickld/saltd) X X 360 P Poultry-other-lean (fat free) w/o bone 1.00 12 Cooked: NFS X X 13 Baked X X 361 P Poultry-other-giblets(liver) 1.00 362 P Poultry-other-fat w/o bones 1.00 12 Cooked: NFS X X 13 Baked X X 14 Boiled X X 363 P Eggs-whole 1.00 11 Uncooked X X 12 Cooked: NFS X X

DEEM Users Manual©2000 Novigen Sciences, Inc.
A - 29
APPENDIX A (CONT’D)
Food Crop Food Name Adjust CSFII CSFIICode Grp \Food Form Factor 89-92 94-96----------------------------------------------------------------------------- 13 Baked X X 14 Boiled X X 15 Fried X X 31 Canned: NFS X X 34 Canned: Boiled X X 41 Frozen: NFS X X 42 Frozen: Cooked X X 45 Frozen: Fried X X 364 P Eggs-white only 1.00 11 Uncooked X 12 Cooked: NFS X X 13 Baked X X 14 Boiled X X 31 Canned: NFS X X 32 Canned: Cooked X X 34 Canned: Boiled X X 41 Frozen: NFS X X 42 Frozen: Cooked X X 365 P Eggs-yolk only 1.00 11 Uncooked X X 12 Cooked: NFS X X 13 Baked X X 14 Boiled X X 15 Fried X X 31 Canned: NFS X X 32 Canned: Cooked X X 34 Canned: Boiled X X 41 Frozen: NFS X X 366 P Chicken-byproducts 1.00 12 Cooked: NFS X X 34 Canned: Boiled X X 367 P Chicken-giblets(liver) 1.00 12 Cooked: NFS X X 13 Baked X 15 Fried X X 42 Frozen: Cooked X 368 P Chicken-fat w/o bones 1.00 12 Cooked: NFS X X 13 Baked X X 14 Boiled X X 15 Fried X X 31 Canned: NFS X X 32 Canned: Cooked X X 34 Canned: Boiled X X 42 Frozen: Cooked X X 369 P Chicken-lean/fat free w/o bones 1.00 12 Cooked: NFS X X 13 Baked X X 14 Boiled X X 15 Fried X X 31 Canned: NFS X X 32 Canned: Cooked X X

DEEM Users Manual©2000 Novigen Sciences, Inc.
A - 30
APPENDIX A (CONT’D)
Food Crop Food Name Adjust CSFII CSFIICode Grp \Food Form Factor 89-92 94-96----------------------------------------------------------------------------- 34 Canned: Boiled X X 42 Frozen: Cooked X X 376 O Aloe vera-juice 1.00 11 Uncooked X 377 11 Apples-juice-concentrate 3.90 12 Cooked: NFS X X 13 Baked X X 31 Canned: NFS X X 41 Frozen: NFS X X 378 O Bananas-juice 1.00 11 Uncooked X X 31 Canned: NFS X X 379 1A Sugar-beet-molasses 1.00 98 Refined X 380 13A Blackberries-juice 1.00 11 Uncooked X X 31 Canned: NFS X X 381 19B Pepper/black 1.00 11 Uncooked X X 12 Cooked: NFS X X 13 Baked X X 14 Boiled X X 15 Fried X X 31 Canned: NFS X X 32 Canned: Cooked X X 42 Frozen: Cooked X X 52 Cured: Cooked(smokd/pickld/saltd) X X 382 1AB Burdock 1.00 12 Cooked: NFS X 383 5B Cabbage-savoy 1.00 12 Cooked: NFS X 384 4B Celery juice 1.00 31 Canned: NFS X X 385 P Chicken-giblets (excl. liver) 1.00 12 Cooked: NFS X X 14 Boiled X X 34 Canned: Boiled X X 42 Frozen: Cooked X 386 9B Christophine 1.00 387 O Coconut-milk 1.00 11 Uncooked X X 12 Cooked: NFS X X 31 Canned: NFS X X 388 15 Corn grain/sugar-molasses 1.50 12 Cooked: NFS X X 41 Frozen: NFS X X 389 O Cranberries-juice-concentrate 3.30 31 Canned: NFS X X 390 O Fern shoots (fiddleheads) 1.00 392 O Grapes-juice-concentrate 3.60 12 Cooked: NFS X X 13 Baked X X

DEEM Users Manual©2000 Novigen Sciences, Inc.
A - 31
APPENDIX A (CONT’D)
Food Crop Food Name Adjust CSFII CSFIICode Grp \Food Form Factor 89-92 94-96----------------------------------------------------------------------------- 14 Boiled X X 31 Canned: NFS X X 41 Frozen: NFS X X 393 O Guava-juice 1.00 31 Canned: NFS X 394 O Jackfruit 1.00 395 O Jobo 1.00 396 O Lotus root 1.00 14 Boiled X X 397 9B Okra/chinese (luffa) 1.00 398 D Milk-based water 1.00 12 Cooked: NFS X X 13 Baked X X 14 Boiled X X 15 Fried X X 16 Pasteurized X X 18 Dried X X 31 Canned: NFS X X 32 Canned: Cooked X X 33 Canned: Baked X X 34 Canned: Boiled X X 41 Frozen: NFS X X 42 Frozen: Cooked X X 43 Frozen: Baked X X 45 Frozen: Fried X X 52 Cured: Cooked(smokd/pickld/saltd) X X 399 15 Oats-bran 1.00 11 Uncooked X X 12 Cooked: NFS X 13 Baked X X 14 Boiled X X 15 Fried X 400 O Palm hearts 1.00 14 Boiled X X 401 O Passion fruit-juice 1.00 11 Uncooked X X 12 Cooked: NFS X X 14 Boiled X X 31 Canned: NFS X X 402 12 Peaches-juice 1.00 11 Uncooked X X 31 Canned: NFS X X 403 O Peanuts-butter 1.89 13 Baked X X 14 Boiled X X 404 11 Pears-juice 1.00 11 Uncooked X X 12 Cooked: NFS X X 13 Baked X X 31 Canned: NFS X X 33 Canned: Baked X X 41 Frozen: NFS X

DEEM Users Manual©2000 Novigen Sciences, Inc.
A - 32
APPENDIX A (CONT’D)
Food Crop Food Name Adjust CSFII CSFIICode Grp \Food Form Factor 89-92 94-96----------------------------------------------------------------------------- 42 Frozen: Cooked X X 405 6B Peas-succulent/blackeye/cowpea 1.00 12 Cooked: NFS X 14 Boiled X X 32 Canned: Cooked X 42 Frozen: Cooked X 406 O Pineapples-juice-concentrate 6.30 12 Cooked: NFS X X 31 Canned: NFS X X 33 Canned: Baked X X 41 Frozen: NFS X X 407 1AB Radishes-japanese (daiken) 1.00 12 Cooked: NFS X 408 15 Rice-bran 1.00 11 Uncooked X 12 Cooked: NFS X X 13 Baked X X 15 Fried X X 31 Canned: NFS X X 409 15 Rice-wild 1.00 14 Boiled X X 42 Frozen: Cooked X X 410 12 Apricot juice 1.00 11 Uncooked X X 12 Cooked: NFS X 31 Canned: NFS X X 42 Frozen: Cooked X X 411 O Seaweed 1.00 11 Uncooked X X 12 Cooked: NFS X X 412 O Sequin (portuguese squash) 1.00 413 6A Snowpeas 1.00 11 Uncooked X X 12 Cooked: NFS X X 14 Boiled X X 15 Fried X X 42 Frozen: Cooked X X 414 O Soursop-juice 1.00 415 9B Squash-spaghetti 1.00 14 Boiled X 416 O Strawberries-juice 1.00 11 Uncooked X X 12 Cooked: NFS X X 13 Baked X X 14 Boiled X X 31 Canned: NFS X X 417 O Sunflower-seeds 1.00 11 Uncooked X X 13 Baked X X 418 2 Sweet potatos-leaves 1.00 419 O Tamarind 1.00 11 Uncooked X

DEEM Users Manual©2000 Novigen Sciences, Inc.
A - 33
APPENDIX A (CONT’D)
Food Crop Food Name Adjust CSFII CSFIICode Grp \Food Form Factor 89-92 94-96----------------------------------------------------------------------------- 420 10 Tangerines-juice-concentrate 7.35 422 O Thistle leaves 1.00 423 8 Tomatoes-dried 14.30 12 Cooked: NFS X 15 Fried X 424 M Veal-fat w/o bones 1.00 12 Cooked: NFS X X 13 Baked X X 14 Boiled X X 15 Fried X X 31 Canned: NFS X 425 M Veal-lean (fat free) w/o bones 1.00 12 Cooked: NFS X X 13 Baked X X 14 Boiled X X 15 Fried X X 31 Canned: NFS X 426 M Veal-kidney 1.00 15 Fried X 427 M Veal-liver 1.00 14 Boiled X 428 M Veal-other organ meats 1.00 429 M Veal-dried 1.92 430 M Veal-meat byproducts 1.00 431 14 Walnut oil 1.00 432 O Water-bottled 1.00 433 O Water-tap 1.00 11 Uncooked X X 12 Cooked: NFS X X 13 Baked X X 14 Boiled X X 15 Fried X X 434 O Water-commercial processing 1.00 11 Uncooked X X 12 Cooked: NFS X X 13 Baked X X 14 Boiled X X 15 Fried X X 16 Pasteurized X X 18 Dried X X 31 Canned: NFS X X 32 Canned: Cooked X X 33 Canned: Baked X X 34 Canned: Boiled X X 35 Canned: Fried X X 41 Frozen: NFS X X 42 Frozen: Cooked X X 43 Frozen: Baked X X 44 Frozen: Boiled X 51 Cured: NFS (smoked/pickled/saltd) X X 52 Cured: Cooked(smokd/pickld/saltd) X X 60 Canned: Cured X X

DEEM Users Manual©2000 Novigen Sciences, Inc.
A - 34
APPENDIX A (CONT’D)
Food Crop Food Name Adjust CSFII CSFIICode Grp \Food Form Factor 89-92 94-96----------------------------------------------------------------------------- 98 Refined X X 435 O Water-non-food based 1.00 436 9A Watermelon-juice 1.00 437 15 Wheat-germ oil 1.00 13 Baked X X 438 O Wi-apple 1.00 439 9B Wintermelon 1.00 14 Boiled X 440 O Yeast 1.00 12 Cooked: NFS X X 99 Alcohol/Fermented/Distilled X X 441 10 Grapefruit-juice-concentrate 8.26 41 Frozen: NFS X X 442 10 Lemons-juice-concentrate 11.40 12 Cooked: NFS X X 13 Baked X X 14 Boiled X X 31 Canned: NFS X X 34 Canned: Boiled X X 41 Frozen: NFS X X 443 10 Limes-juice-concentrate 6.00 12 Cooked: NFS X X 41 Frozen: NFS X X 447 4A Chervil 1.00 14 Boiled X X 448 10 Grapefruit peel 1.00 449 P Turkey-other organ meats 1.00 12 Cooked: NFS X X 450 1AB Ginseng 1.00 11 Uncooked X 451 5A Broccoli-chinese 1.00 14 Boiled X X 452 5B Bok choy 1.00 11 Uncooked X X 12 Cooked: NFS X X 14 Boiled X X 42 Frozen: Cooked X X 51 Cured: NFS (smoked/pickled/saltd) X X 460 O Seafood-misc(turtle/frog) 1.00 12 Cooked: NFS X 14 Boiled X X 467 19B Celery seed 1.00 11 Uncooked X X 14 Boiled X X 31 Canned: NFS X X 51 Cured: NFS (smoked/pickled/saltd) X X 473 O Sapodilla 1.00 480 O Plantains-green 1.00 15 Fried X 481 O Plantains-dried 3.90 482 O Soybeans-protein isolate 1.00 12 Cooked: NFS X X

DEEM Users Manual©2000 Novigen Sciences, Inc.
A - 35
APPENDIX A (CONT’D)
Food Crop Food Name Adjust CSFII CSFIICode Grp \Food Form Factor 89-92 94-96----------------------------------------------------------------------------- 13 Baked X X 14 Boiled X X 15 Fried X X 31 Canned: NFS X X 32 Canned: Cooked X X 33 Canned: Baked X X 34 Canned: Boiled X X 41 Frozen: NFS X X 42 Frozen: Cooked X X 51 Cured: NFS (smoked/pickled/saltd) X 483 O Chayote 1.00 484 O Radishes-oriental 1.00 485 O Leaves (misc) 1.00 11 Uncooked X 14 Boiled X X 31 Canned: NFS X X 34 Canned: Boiled X X 489 O Vanilla 1.00 99 Alcohol/Fermented/Distilled X X 491 O Arugula 1.00 11 Uncooked X 492 O Radicchio 1.00 11 Uncooked X 493 O Tarragon 1.00 14 Boiled X X 494 O Saffron 1.00 14 Boiled X X 495 O Cilantro 1.00 11 Uncooked X 12 Cooked: NFS X 496 O Nopales 1.00 11 Uncooked X 14 Boiled X X 497 9B Balsam pear 1.00 498 4A Amaranth 1.00 13 Baked X X 890 O Miscellaneous/nfs 1.00 11 Uncooked X X 12 Cooked: NFS X X 13 Baked X X 14 Boiled X X 15 Fried X X 31 Canned: NFS X X 32 Canned: Cooked X X 33 Canned: Baked X X 34 Canned: Boiled X X 41 Frozen: NFS X X 42 Frozen: Cooked X X 51 Cured: NFS (smoked/pickled/saltd) X X 52 Cured: Cooked(smokd/pickld/saltd) X X 60 Canned: Cured X X

DEEM Users Manual©2000 Novigen Sciences, Inc.
A - 36
APPENDIX A (CONT’D)
Food Crop Food Name Adjust CSFII CSFIICode Grp \Food Form Factor 89-92 94-96----------------------------------------------------------------------------- 891 O Jute 1.00 892 O Chrysanthemum 1.00 893 O Salt 1.00 98 Refined X X 894 O Leavening agents 1.00 12 Cooked: NFS X X 895 O Psyllium 1.00 13 Baked X X 896 O Sweeteners-artificial 1.00 12 Cooked: NFS X X 897 O Gums/gels 1.00 11 Uncooked X X 12 Cooked: NFS X X 13 Baked X X 14 Boiled X X 15 Fried X X 31 Canned: NFS X X 32 Canned: Cooked X X 34 Canned: Boiled X X 41 Frozen: NFS X X 42 Frozen: Cooked X X 911 O Molasses-nfs 1.00 98 Refined X X 940 O Peanuts-hulled 1.00 12 Cooked: NFS X X 13 Baked X X 14 Boiled X X 15 Fried X X 41 Frozen: NFS X X 950 O Beer 1.00 99 Alcohol/Fermented/Distilled X X
DEEM Users Manual©2000 Novigen Sciences, Inc.
B - 1
APPENDIX B
BACKGROUND INFORMATION ON THE CONSUMPTION DATA USED IN DEEM

DEEM Users Manual©2000 Novigen Sciences, Inc.
B - 2
APPENDIX B
BACKGROUND INFORMATION ON THE CONSUMPTION DATA USED IN DEEM
1989 through 1992 Consumption Data
Consumption data used by the DEEMTM software have been generated by USDA foodconsumption surveys. Weights were developed by USDA to adjust for the differences in theprobability of selection, to adjust for non-response and to allow for the combination of the datafrom the three Continuing Surveys of Food Intake by Individuals (CSFII): 1989-90, 1990-91 and1991-92.
Regression weights were developed by a group of statisticians at Iowa State University. Fourteendemographic characteristics and month of the interview were used to derive the weights for theindividuals in the survey so that the distribution of the weighted sample becomes similar to thatof the US population with respect to the demographic characteristics. Weights were derivedseparately for males age 20 years and older, females age 20 years and older and persons less than20 years of age.
Meal planner/preparer reported the subject’s race/ethnicity.
States in the region:
The consumption data use the U.S. Census classification of four main regions, each ofwhich is subdivided into two or three geographical regions as follows:
1. North East:a. Middle Atlantic:
New Jersey, New York, Pennsylvaniab. New England:
Connecticut, Maine, Massachusetts, New Hampshire,Rhode Island, Vermont
2. Midwesta. East North Central:
Illinois, Indiana, Michigan, Ohio, Wisconsinb. West North Central:
Iowa, Kansas, Minnesota, Missouri, Nebraska,North Dakota, South Dakota
3. Southa. East South Central:
Alabama, Kentucky, Mississippi, Tennesseeb. South Atlantic:
Delaware, District of Columbia, Florida, Georgia,Maryland, North Carolina, South Carolina, Virginia,West Virginia

DEEM Users Manual©2000 Novigen Sciences, Inc.
B - 3
APPENDIX B (CONT’D)
c. West South Central:Arkansas, Louisiana, Oklahoma, Texas
4. West:a. Mountain:
Arizona, Colorado, Idaho, Montana, Nevada, New Mexico,Utah, Wyoming
b. Pacific:California, Oregon, Washington
Listing of the months included in the seasons
a. SpringApril, May, June
b. Summer:July, August, September
c. FallOctober, November, December
d. WinterJanuary, February, March
1994 through 1996 Consumption Data
Replicate weights were developed by statisticians at Westat, Inc. Seventeen demographiccharacteristics and month of the interview were used to derive the weights for the individuals inthe survey so that the distribution of the weighted sample becomes similar to that of the USpopulation with respect to the demographic characteristics. Weights were derived separately formales age 20 years and older, females age 20 years and older, children 5 years of age andyounger, and persons 6 to 19 years of age.
Meal planner/preparer reported the subject’s race/ethnicity.
States in the region:
The consumption data use the US Census classification of four main regions:
1. North East:New Jersey, New York, Pennsylvania, Connecticut, Maine, Massachusetts,New Hampshire, Rhode Island, Vermont
2. MidwestIllinois, Indiana, Michigan, Ohio, WisconsinIowa, Kansas, Minnesota, Missouri, Nebraska, North Dakota,South Dakota

DEEM Users Manual©2000 Novigen Sciences, Inc.
B - 4
APPENDIX B (CONT’D)
3. SouthAlabama, Kentucky, Mississippi, TennesseeDelaware, District of Columbia, Florida, Georgia,Maryland, North Carolina, South Carolina, Virginia,West Virginia, Arkansas, Louisiana, Oklahoma, Texas
4. West:Arizona, Colorado, Idaho, Montana, Nevada, New Mexico,Utah, Wyoming, California, Oregon, Washington
Listing of the months included in the seasons
a. SpringApril, May, June
b. Summer:July, August, September
c. FallOctober, November, December
d. WinterJanuary, February, March

DEEM Users Manual©2000 Novigen Sciences, Inc.
C - 1
APPENDIX C
FOOD LIST IN RAC CODE ORDER

DEEM Users Manual©2000 Novigen Sciences, Inc.
C - 2
APPENDIX C
FOOD LIST IN RAC CODE ORDER
RAC Crop AdjustmentCode Group Commodity # 1
1 13A Blackberries 12 13A Boysenberries 13 13A Dewberries 14 13A Loganberries 15 13A Raspberries 16 13A Youngberries 17 13B Blueberries 18 O Cranberries 19 O Cranberries-juice 1.1
10 13B Currants 111 13B Elderberries 112 13B Gooseberries 113 O Grapes 114 O Grapes-raisins 4.315 O Grapes-juice 1.216 13B Huckleberries 117 O Strawberries 118 O Juneberry 119 O Mulberries 120 10 Citrus citron 122 10 Grapefruit-peeled fruit 123 10 Grapefruit-juice 2.124 10 Kumquats 126 10 Lemons-peeled fruit 127 10 Lemons-peel 128 10 Lemons-juice 230 10 Limes-peeled fruit 131 10 Limes-peel 132 10 Limes-juice 233 10 Oranges-juice-concentrate 6.734 10 Oranges-peeled fruit 135 10 Oranges-peel 136 10 Oranges-juice 1.837 10 Tangelos 138 10 Tangerines 139 10 Tangerines-juice 2.340 14 Almonds 141 14 Brazil nuts 142 14 Cashews 143 14 Chestnuts 144 14 Filberts (hazelnuts) 145 14 Hickory nuts 1

DEEM Users Manual©2000 Novigen Sciences, Inc.
C - 3
APPENDIX C (CONT’D)
RAC Crop AdjustmentCode Group Commodity # 1
46 14 Macadamia nuts (bush nuts) 147 14 Pecans 148 14 Walnuts 149 14 Butter nuts 150 O Pistachio nuts 151 14 Beechnuts 152 11 Apples 153 11 Apples-dried 854 11 Apples-juice/cider 1.355 11 Crabapples 156 11 Pears 157 11 Pears-dried 6.2558 11 Quinces 159 12 Apricots 160 12 Apricots-dried 661 12 Cherries 162 12 Cherries-dried 463 12 Cherries-juice 1.564 12 Nectarines 165 12 Peaches 166 12 Peaches-dried 767 12 Plums (damsons) 168 12 Plums-prunes (dried) 569 12 Plums/prune-juice 1.470 O Avocados 172 O Bananas 173 O Bananas-dried 3.974 O Coconut 175 O Coconut-dried (copra) 2.176 O Coconut-water 177 O Dates 178 O Figs 179 O Guava 180 O Mangoes 181 11 Loquats 182 O Olives 184 O Papayas-pulp 185 O Papayas-dried 1.886 O Papayas-juice 1.587 O Pawpaws 1

DEEM Users Manual©2000 Novigen Sciences, Inc.
C - 4
APPENDIX C (CONT’D)
RAC Crop AdjustmentCode Group Commodity # 1
88 O Persimmons 189 O Pineapples-peeled fruit 190 O Pineapples-dried 591 O Pineapples-juice 1.792 O Passion fruit (granadilla) 193 O Pomegranates 194 O Plantains-ripe 195 O Lychees (litchi)/fresh 196 O Lychee-dried 1.8597 O Kiwi fruit 198 O Acerola 199 O Ginkgo nuts 1
100 O Maney (mammee apple) 1101 O Pitanga (surinam cherry) 1102 O Soursop (annona muricata) 1103 O Sugar apples (sweetsop) 1104 O Bread fruit 1105 O Bread nuts 1106 O Carambola (starfruit) 1107 O Cherimoya 1108 O Longan fruit 1109 O Genip (spanish lime) 1110 O Chocolate-cocoa butter 1111 O Chocolate 1112 O Coffee 1113 O Tea 1114 1AB Chicory 1115 19B Anise 1116 19A Basil 1117 19B Caraway 1118 19B Cassia 1119 19B Cinnamon 1120 19B Clove 1121 19B Coriander 1122 19B Cumin 1123 19A Dill 1124 1CD Ginger 1125 O Hops 1126 1AB Horseradish 1127 19A Rosemary 1128 19A Marjoram 1

DEEM Users Manual©2000 Novigen Sciences, Inc.
C - 5
APPENDIX C (CONT’D)
RAC Crop AdjustmentCode Group Commodity # 1
129 19A Oregano 1130 19B Mustard seed 1131 19B Nutmeg 1132 19B Mace 1133 19A Sage 1134 19A Savory 1135 19A Bay 1136 19A Thyme 1137 1CD Turmeric 1138 19B Allspice 1139 8 Paprika 1140 19B Poppy 1141 9A Melons-cantaloupes-juice 1142 9A Melons-cantaloupes-pulp 1143 9A Casabas 1144 9A Crenshaws 1145 9A Melons-honeydew 1146 9A Melons-persian 1147 9A Watermelon 1148 9B Cucumbers 1149 9B Pumpkin 1150 9B Squash-summer 1151 9B Squash-winter 1152 9B Bitter melon 1153 O Towelgourd 1154 8 Eggplant 1155 8 Peppers-sweet(garden) 1156 8 Peppers-chilli incl jalapeno 1157 8 Peppers-other 1158 8 Pimientos 1159 8 Tomatoes-whole 1160 8 Tomatoes-juice 1.5161 8 Tomatoes-puree 3.3162 8 Tomatoes-paste 5.4163 8 Tomatoes-catsup 2.5164 8 Groundcherries 1165 2 Beets-garden-tops(greens) 1166 4B Celery 1167 4A Chicory(french/belgian endive) 1168 5A Broccoli 1169 5A Brussels sprouts 1

DEEM Users Manual©2000 Novigen Sciences, Inc.
C - 6
APPENDIX C (CONT’D)
RAC Crop AdjustmentCode Group Commodity # 1
170 5A Cabbage-green and red 1171 5A Cauliflower 1172 5B Collards 1174 5B Kale 1175 5A Kohlrabi 1176 4A Lettuce-leafy varieties 1177 4A Dandelion-greens 1178 4A Endive-curley and escarole 1179 19B Fennel 1180 4A Cress-garden/field 1181 O Artichokes-globe 1182 4A Lettuce-unspecified 1183 5B Mustard greens 1184 4A Parsley 1185 4B Rhubarb 1186 4A Spinach 1187 4A Swiss chard 1188 2 Turnips-tops 1189 O Watercress 1190 2 Taro-greens 1191 4A Cress-upland 1192 4A Lettuce-head varieties 1193 O Lambsquarter 1194 O Cactus pads (nopal) 1195 O Grapes-leaves 1196 O Oriental vegetables/leafy 1197 1AB Beets-gargen-roots 1198 1AB Carrots 1199 1AB Celeriac 1200 19A Chives 1201 1CD Taro-root 1202 3 Garlic 1203 1CD Artichokes-jerusalem 1204 3 Leeks 1205 3 Onions-dry-bulb (cipollini) 1206 3 Onions-dehydrated or dried 9207 1C Potatoes/white-whole 1208 1C Potatoes/white-unspecified 1209 1C Potatoes/white-peeled 1210 1C Potatoes/white-dry 6.5211 1C Potatoes/white-peel only 1

DEEM Users Manual©2000 Novigen Sciences, Inc.
C - 7
APPENDIX C (CONT’D)
RAC Crop AdjustmentCode Group Commodity # 1
212 1AB Radishes-roots 1213 2 Radishes-tops 1214 1AB Rutabagas-roots 1215 2 Rutabagas-tops 1216 1AB Salsify(oyster plant) 1217 3 Shallots 1218 1CD Sweet potatoes (incl yams) 1219 1AB Turnips-roots 1220 1AB Parsnips 1221 1CD Yambean tuber (jicama) 1222 1CD Cassava (yuca blanca) 1224 1CD Yautia (tannier) 1225 1AB Parsley roots 1226 O Water chestnuts 1227 6C Beans-dry-great northern 1228 6C Beans-dry-kidney 1229 6C Beans-dry-lima 1230 6C Beans-dry-navy (pea) 1231 6C Beans-dry-other 1232 6C Beans-dry-pinto 1233 6B Beans-succulent-lima 1234 6A Beans-succulent-green 1235 6A Beans-succulent-other 1236 6A Beans-succulent-yellow/wax 1237 15 Corn/pop 1238 15 Corn/sweet 1240 6C Peas (garden)-dry 1241 6AB Peas (garden)-green 1243 6C Lentils 1244 6C Mung beans (sprouts) 1245 O Okra 1247 O Carob 1248 O Alfalfa sprouts 1249 6C Beans-dry-broadbeans 1250 6B Beans-succulent-broadbeans 1251 6C Beans-dry-pigeon beans 1252 O Sesame seeds 1253 6 Beans-unspecified 1254 O Pinenuts 1255 6A Soybeans-sprouted seeds 0.33256 6C Beans-dry-hyacinth 1

DEEM Users Manual©2000 Novigen Sciences, Inc.
C - 8
APPENDIX C (CONT’D)
RAC Crop AdjustmentCode Group Commodity # 1
257 6 Beans-succulent-hyacinth 1258 6C Beans-dry-blackeye peas/cowpea 1259 6C Beans-dry-garbanzo/chick pea 1260 O Asparagus 1261 O Mushrooms 1262 3 Onions-green 1263 O Poke greens 1264 O Bamboo shoots 1265 15 Barley 1266 15 Corn grain-endosperm 1267 15 Corn grain-bran 1268 15 Corn grain/sugar/hfcs 1.5269 15 Oats 1270 15 Rice-rough (brown) 1271 15 Rice-milled (white) 1272 15 Rye-rough 1273 15 Rye-germ 1274 15 Rye-flour 1275 15 Sorghum (including milo) 1276 15 Wheat-rough 1277 15 Wheat-germ 1278 15 Wheat-bran 1279 15 Wheat-flour 1280 15 Millet 1281 O Honey 1282 1A Sugar-beet 1283 O Sugar-cane 1284 O Sugar-cane/molasses 1285 O Maple sugar 1286 15 Buckwheat 1287 6C Guar beans 1288 O Castor beans 1289 15 Corn grain-oil 1290 O Cottonseed-oil 1291 O Cottonseed-meal 1292 O Flax seed 1293 O Peanuts-oil 1294 O Safflower-seed 1295 O Safflower-oil 1296 O Sesame-oil 1297 6A Soybeans-oil 1

DEEM Users Manual©2000 Novigen Sciences, Inc.
C - 9
APPENDIX C (CONT’D)
RAC Crop AdjustmentCode Group Commodity # 1
298 O Sunflower-oil 1299 O Coconut-oil 1300 O Olive oil 1301 O Canola oil (rape seed oil) 1302 O Palm oil 1303 6A Soybean-other 1304 6A Soybeans-mature seeds dry 1305 6A Soybeans-flour (full fat) 1306 6A Soybeans-flour (low fat) 1307 6A Soybeans-flour (defatted) 1308 O Oriental vegetables/non-leafy 1309 O Seeds (misc.) 1310 O Peppermint 1311 O Peppermint-oil 1312 O Spearmint 1313 O Spearmint-oil 1314 O Vinegar 1315 O Grapes-wine and sherry 1316 O Alcohol-distilled 1317 O Gelatin 1318 D Milk-nonfat solids 1319 D Milk-fat solids 1320 D Milk sugar (lactose) 1321 M Beef-meat byproducts 1322 M Beef-other organ meats 1323 M Beef-dried 1.92324 M Beef-fat w/o bones 1325 M Beef-kidney 1326 M Beef-liver 1327 M Beef-lean (fat/free) w/o bones 1328 M Goat-meat byproducts 1329 M Goat-other organ meats 1330 M Goat-fat w/o bone 1331 M Goat-kidney 1332 M Goat-liver 1333 M Goat-lean (fat/free) w/o bone 1334 M Horsemeat 1335 M Rabbit 1336 M Sheep-meat byproducts 1337 M Sheep-other organ meats 1338 M Sheep-fat w/o bone 1

DEEM Users Manual©2000 Novigen Sciences, Inc.
C - 10
APPENDIX C (CONT’D)
RAC Crop AdjustmentCode Group Commodity # 1
339 M Sheep-kidney 1340 M Sheep-liver 1341 M Sheep-lean (fat free) w/o bone 1342 M Pork-meat byproducts 1343 M Pork-other organ meats 1344 M Pork-fat w/o bone 1345 M Pork-kidney 1346 M Pork-liver 1347 M Pork-lean (fat free) w/o bone 1349 F Fish-shellfish 1350 O Meat-game 1351 F Fish-roe/caviar 1352 F Fish-finfish/freshwater 1353 F Fish-finfish/saltwater (incl. 1354 F Fish-finfish-saltwater-dried 1.6355 P Turkey-byproducts 1356 P Turkey-giblets (liver) 1357 P Turkey--fat w/o bones 1358 P Turkey- lean/fat free w/o bone 1360 P Poultry-other-lean (fat free) 1361 P Poultry-other-giblets(liver) 1362 P Poultry-other-fat w/o bones 1363 P Eggs-whole 1364 P Eggs-white only 1365 P Eggs-yolk only 1366 P Chicken-byproducts 1367 P Chicken-giblets(liver) 1368 P Chicken-fat w/o bones 1369 P Chicken-lean/fat free w/o bone 1376 O Aloe vera-juice 1377 11 Apples-juice-concentrate 3.9378 O Bananas-juice 1379 1A Sugar-beet-molasses 1380 13A Blackberries-juice 1381 19B Pepper/black 1382 1AB Burdock 1383 5B Cabbage-savoy 1384 4B Celery juice 1385 P Chicken-giblets (excl. liver) 1386 9B Christophine 1387 O Coconut-milk 1

DEEM Users Manual©2000 Novigen Sciences, Inc.
C - 11
APPENDIX C (CONT’D)
RAC Crop AdjustmentCode Group Commodity # 1
388 15 Corn grain/sugar-molasses 1.5389 O Cranberries-juice-concentrate 3.3390 O Fern shoots (fiddleheads) 1392 O Grapes-juice-concentrate 3.6393 O Guava-juice 1394 O Jackfruit 1395 O Jobo 1396 O Lotus root 1397 9B Okra/chinese (luffa) 1398 D Milk-based water 1399 15 Oats-bran 1400 O Palm hearts 1401 O Passion fruit-juice 1402 12 Peaches-juice 1403 O Peanuts-butter 1.89404 11 Pears-juice 1405 6B Peas-succulent/blackeye/cowpea 1406 O Pineapples-juice-concentrate 6.3407 1AB Radishes-japanese (daiken) 1408 15 Rice-bran 1409 15 Rice-wild 1410 12 Apricot juice 1411 O Seaweed 1412 O Sequin (portuguese squash) 1413 6A Snowpeas 1414 O Soursop-juice 1415 9B Squash-spaghetti 1416 O Strawberries-juice 1417 O Sunflower-seeds 1418 2 Sweet potatos-leaves 1419 O Tamarind 1420 10 Tangerines-juice-concentrate 7.35422 O Thistle leaves 1423 8 Tomatoes-dried 14.3424 M Veal-fat w/o bones 1425 M Veal-lean (fat free) w/o bones 1426 M Veal-kidney 1427 M Veal-liver 1428 M Veal-other organ meats 1429 M Veal-dried 1.92430 M Veal-meat byproducts 1

DEEM Users Manual©2000 Novigen Sciences, Inc.
C - 12
APPENDIX C (CONT’D)
RAC Crop AdjustmentCode Group Commodity # 1
431 14 Walnut oil 1432 O Water-bottled 1433 O Water-tap 1434 O Water-commercial processing 1435 O Water-non-food based 1436 9A Watermelon-juice 1437 15 Wheat-germ oil 1438 O Wi-apple 1439 9B Wintermelon 1440 O Yeast 1441 10 Grapefruit-juice-concentrate 8.26442 10 Lemons-juice-concentrate 11.4443 10 Limes-juice-concentrate 6447 4A Chervil 1448 10 Grapefruit peel 1449 P Turkey-other organ meats 1450 1AB Ginseng 1451 5A Broccoli-chinese 1452 5B Bok choi 1460 O Seafood-misc(turtle/frog) 1467 19B Celery seed 1473 O Sapodilla 1480 O Plantains-green 1481 O Plantains-dried 3.9482 O Soybeans-protein isolate 1483 O Chayote 1484 O Radishes-oriental 1485 O Leaves (misc) 1489 O Vanilla 1491 O Arugula 1492 O Radicchio 1493 O Tarragon 1494 O Saffron 1495 O Cilantro 1496 O Nopales 1497 9B Balsam pear 1498 4A Amaranth 1890 O Miscellaneous/nfs 1891 O Jute 1892 O Chrysanthemum 1893 O Salt 1

DEEM Users Manual©2000 Novigen Sciences, Inc.
C - 13
APPENDIX C (CONT’D)
RAC Crop AdjustmentCode Group Commodity # 1
894 O Leavening agents 1895 O Psyllium 1896 O Sweeteners-artificial 1897 O Gums/gels 1911 O Molasses-nfs 1940 O Peanuts-hulled 1950 O Beer 1

DEEM Users Manual©2000 Novigen Sciences, Inc.
D - 1
APPENDIX D
FOOD LIST IN ALPHABETICAL ORDER

DEEM Users Manual©2000 Novigen Sciences, Inc.
D - 2
APPENDIX D
FOOD LIST IN ALPHABETICAL ORDER
RAC Crop AdjustmentCode Group Commodity # 1
98 O Acerola 1316 O Alcohol-distilled 1248 O Alfalfa sprouts 1138 19B Allspice 1
40 14 Almonds 1376 O Aloe vera-juice 1498 4A Amaranth 1115 19B Anise 1
52 11 Apples 153 11 Apples-dried 854 11 Apples-juice/cider 1.3
377 11 Apples-juice-concentrate 3.9410 12 Apricot juice 1
59 12 Apricots 160 12 Apricots-dried 6
181 O Artichokes-globe 1203 1CD Artichokes-jerusalem 1491 O Arugula 1260 O Asparagus 1
70 O Avocados 1497 9B Balsam pear 1264 O Bamboo shoots 1
72 O Bananas 173 O Bananas-dried 3.9
378 O Bananas-juice 1265 15 Barley 1116 19A Basil 1135 19A Bay 1258 6C Beans-dry-blackeye peas/cowpea 1249 6C Beans-dry-broadbeans 1259 6C Beans-dry-garbanzo/chick pea 1227 6C Beans-dry-great northern 1256 Beans-dry-hyacinth 1228 6C Beans-dry-kidney 1229 6C Beans-dry-lima 1230 6C Beans-dry-navy (pea) 1231 6C Beans-dry-other 1251 6C Beans-dry-pigeon beans 1232 6C Beans-dry-pinto 1250 6B Beans-succulent-broadbeans 1234 6A Beans-succulent-green 1257 Beans-succulent-hyacinth 1233 6B Beans-succulent-lima 1235 6A Beans-succulent-other 1236 6A Beans-succulent-yellow/wax 1

DEEM Users Manual©2000 Novigen Sciences, Inc.
D - 3
APPENDIX D (CONT’D)
RAC Crop AdjustmentCode Group Commodity # 1
253 6 Beans-unspecified 151 14 Beechnuts 1
323 M Beef-dried 1.92324 M Beef-fat w/o bones 1325 M Beef-kidney 1327 M Beef-lean (fat/free) w/o bones 1326 M Beef-liver 1321 M Beef-meat byproducts 1322 M Beef-other organ meats 1950 O Beer 1197 1AB Beets-gargen-roots 1165 2 Beets-garden-tops(greens) 1152 9B Bitter melon 1
1 13A Blackberries 1380 13A Blackberries-juice 1
7 13B Blueberries 1452 5B Bok choi 1
2 13A Boysenberries 141 14 Brazil nuts 1
104 O Bread fruit 1105 O Bread nuts 1168 5A Broccoli 1451 5A Broccoli-chinese 1169 5A Brussels sprouts 1286 15 Buckwheat 1382 1AB Burdock 1
49 14 Butter nuts 1170 5A Cabbage-green and red 1383 5B Cabbage-savoy 1194 O Cactus pads (nopal) 1301 O Canola oil (rape seed oil) 1106 O Carambola (starfruit) 1117 19B Caraway 1247 O Carob 1198 1AB Carrots 1143 9A Casabas 1
42 14 Cashews 1222 1CD Cassava (yuca blanca) 1118 19B Cassia 1288 O Castor beans 1171 5A Cauliflower 1199 1AB Celeriac 1166 4B Celery 1384 4B Celery juice 1467 19B Celery seed 1483 O Chayote 1107 O Cherimoya 1

DEEM Users Manual©2000 Novigen Sciences, Inc.
D - 4
APPENDIX D (CONT’D)
RAC Crop AdjustmentCode Group Commodity # 1
61 12 Cherries 162 12 Cherries-dried 463 12 Cherries-juice 1.5
447 4A Chervil 143 14 Chestnuts 1
366 P Chicken-byproducts 1368 P Chicken-fat w/o bones 1367 P Chicken-giblets(liver) 1385 P Chicken-giblets (excl. liver) 1369 P Chicken-lean/fat free w/o bone 1114 1AB Chicory 1167 4A Chicory(french/belgian endive) 1200 19A Chives 1111 O Chocolate 1110 O Chocolate-cocoa butter 1386 9B Christophine 1892 O Chrysanthemum 1495 O Cilantro 1119 19B Cinnamon 1
20 10 Citrus citron 1120 19B Clove 1
75 O Coconut-dried (copra) 2.1387 O Coconut-milk 1299 O Coconut-oil 1
76 O Coconut-water 174 O Coconut 1
112 O Coffee 1172 5B Collards 1121 19B Coriander 1267 15 Corn grain-bran 1266 15 Corn grain-endosperm 1289 15 Corn grain-oil 1268 15 Corn grain/sugar/hfcs 1.5388 15 Corn grain/sugar-molasses 1.5237 15 Corn/pop 1238 15 Corn/sweet 1291 O Cottonseed-meal 1290 O Cottonseed-oil 1
55 11 Crabapples 18 O Cranberries 19 O Cranberries-juice 1.1
389 O Cranberries-juice-concentrate 3.3144 9A Crenshaws 1180 4A Cress-garden/field 1191 4A Cress-upland 1148 9B Cucumbers 1122 19B Cumin 1
10 13B Currants 1

DEEM Users Manual©2000 Novigen Sciences, Inc.
D - 5
APPENDIX D (CONT’D)
RAC Crop AdjustmentCode Group Commodity # 1
177 4A Dandelion-greens 177 O Dates 1
3 13A Dewberries 1123 19A Dill 1154 8 Eggplant 1364 P Eggs-white only 1363 P Eggs-whole 1365 P Eggs-yolk only 1
11 13B Elderberries 1178 4A Endive-curley and escarole 1179 19B Fennel 1390 O Fern shoots (fiddleheads) 1
78 O Figs 144 14 Filberts (hazelnuts) 1
352 F Fish-finfish/freshwater 1354 F Fish-finfish-saltwater-dried 1.6353 F Fish-finfish/saltwater (incl. 1351 F Fish-roe/caviar 1349 F Fish-shellfish 1292 O Flax seed 1202 3 Garlic 1317 O Gelatin 1109 O Genip (spanish lime) 1124 1CD Ginger 1
99 O Ginkgo nuts 1450 1AB Ginseng 1330 M Goat-fat w/o bone 1331 M Goat-kidney 1333 M Goat-lean (fat/free) w/o bone 1332 M Goat-liver 1328 M Goat-meat byproducts 1329 M Goat-other organ meats 1
12 13B Gooseberries 123 10 Grapefruit-juice 2.1
441 10 Grapefruit-juice-concentrate 8.26448 10 Grapefruit peel 1
22 10 Grapefruit-peeled fruit 113 O Grapes 115 O Grapes-juice 1.2
392 O Grapes-juice-concentrate 3.6195 O Grapes-leaves 1
14 O Grapes-raisins 4.3315 O Grapes-wine and sherry 1164 8 Groundcherries 1287 6C Guar beans 1393 O Guava-juice 1
79 O Guava 1897 O Gums/gels 1

DEEM Users Manual©2000 Novigen Sciences, Inc.
D - 6
APPENDIX D (CONT’D)
RAC Crop AdjustmentCode Group Commodity # 1
45 14 Hickory nuts 1281 O Honey 1125 O Hops 1334 M Horsemeat 1126 1AB Horseradish 1
16 13B Huckleberries 1394 O Jackfruit 1395 O Jobo 1
18 O Juneberry 1891 O Jute 1174 5B Kale 1
97 O Kiwi fruit 1175 5A Kohlrabi 1
24 10 Kumquats 1193 O Lambsquarter 1894 O Leavening agents 1485 O Leaves (misc) 1204 3 Leeks 1
28 10 Lemons-juice 2442 10 Lemons-juice-concentrate 11.4
27 10 Lemons-peel 126 10 Lemons-peeled fruit 1
243 6C Lentils 1182 4A Lettuce-unspecified 1176 4A Lettuce-leafy varieties 1192 4A Lettuce-head varieties 1
32 10 Limes-juice 2443 10 Limes-juice-concentrate 6
31 10 Limes-peel 130 10 Limes-peeled fruit 1
4 13A Loganberries 1108 O Longan fruit 1
81 11 Loquats 1396 O Lotus root 1
96 O Lychee-dried 1.8595 O Lychees (litchi)/fresh 146 14 Macadamia nuts (bush nuts) 1
132 19B Mace 1100 O Maney (mammee apple) 1
80 O Mangoes 1285 O Maple sugar 1128 19A Marjoram 1350 O Meat-game 1141 9A Melons-cantaloupes-juice 1142 9A Melons-cantaloupes-pulp 1145 9A Melons-honeydew 1146 9A Melons-persian 1398 D Milk-based water 1

DEEM Users Manual©2000 Novigen Sciences, Inc.
D - 7
APPENDIX D (CONT’D)
RAC Crop AdjustmentCode Group Commodity # 1
319 D Milk-fat solids 1318 D Milk-nonfat solids 1320 D Milk sugar (lactose) 1280 15 Millet 1890 O Miscellaneous/nfs 1911 O Molasses-nfs 1
19 O Mulberries 1244 6C Mung beans (sprouts) 1261 O Mushrooms 1183 5B Mustard greens 1130 19B Mustard seed 1
64 12 Nectarines 1496 O Nopales 1131 19B Nutmeg 1399 15 Oats-bran 1269 15 Oats 1245 O Okra 1397 9B Okra/chinese (luffa) 1
82 O Olives 1300 O Olive oil 1206 3 Onions-dehydrated or dried 9205 3 Onions-dry-bulb (cipollini) 1262 3 Onions-green 1
36 10 Oranges-juice 1.833 10 Oranges-juice-concentrate 6.735 10 Oranges-peel 134 10 Oranges-peeled fruit 1
129 19A Oregano 1196 O Oriental vegetables/leafy 1308 O Oriental vegetables/non-leafy 1400 O Palm hearts 1302 O Palm oil 1
85 O Papayas-dried 1.886 O Papayas-juice 1.584 O Papayas-pulp 1
139 8 Paprika 1184 4A Parsley 1225 1AB Parsley roots 1220 1AB Parsnips 1401 O Passion fruit-juice 1
92 O Passion fruit (granadilla) 187 O Pawpaws 165 12 Peaches 166 12 Peaches-dried 7
402 12 Peaches-juice 1403 O Peanuts-butter 1.89940 O Peanuts-hulled 1293 O Peanuts-oil 1

DEEM Users Manual©2000 Novigen Sciences, Inc.
D - 8
APPENDIX D (CONT’D)
RAC Crop AdjustmentCode Group Commodity # 1
56 11 Pears 157 11 Pears-dried 6.25
404 11 Pears-juice 1240 6C Peas (garden)-dry 1241 6AB Peas (garden)-green 1405 6B Peas-succulent/blackeye/cowpea 1
47 14 Pecans 1381 19B Pepper/black 1310 O Peppermint 1311 O Peppermint-oil 1156 8 Peppers-chilli incl jalapeno 1157 8 Peppers-other 1155 8 Peppers-sweet(garden) 1
88 O Persimmons 1158 8 Pimientos 1
90 O Pineapples-dried 591 O Pineapples-juice 1.7
406 O Pineapples-juice-concentrate 6.389 O Pineapples-peeled fruit 1
254 O Pinenuts 150 O Pistachio nuts 1
101 O Pitanga (surinam cherry) 1480 O Plantains-green 1
94 O Plantains-ripe 1481 O Plantains-dried 3.9
67 12 Plums (damsons) 168 12 Plums-prunes (dried) 569 12 Plums/prune-juice 1.4
263 O Poke greens 193 O Pomegranates 1
140 19B Poppy 1344 M Pork-fat w/o bone 1345 M Pork-kidney 1347 M Pork-lean (fat free) w/o bone 1346 M Pork-liver 1342 M Pork-meat byproducts 1343 M Pork-other organ meats 1210 1C Potatoes/white-dry 6.5209 1C Potatoes/white-peeled 1211 1C Potatoes/white-peel only 1208 1C Potatoes/white-unspecified 1207 1C Potatoes/white-whole 1362 P Poultry-other-fat w/o bones 1361 P Poultry-other-giblets(liver) 1360 P Poultry-other-lean (fat free) 1895 O Psyllium 1149 9B Pumpkin 1
58 11 Quinces 1

DEEM Users Manual©2000 Novigen Sciences, Inc.
D - 9
APPENDIX D (CONT’D)
RAC Crop AdjustmentCode Group Commodity # 1
335 M Rabbit 1492 O Radicchio 1407 1AB Radishes-japanese (daiken) 1484 O Radishes-oriental 1212 1AB Radishes-roots 1213 2 Radishes-tops 1
5 13A Raspberries 1185 4B Rhubarb 1408 15 Rice-bran 1271 15 Rice-milled (white) 1270 15 Rice-rough (brown) 1409 15 Rice-wild 1127 19A Rosemary 1214 1AB Rutabagas-roots 1215 2 Rutabagas-tops 1274 15 Rye-flour 1273 15 Rye-germ 1272 15 Rye-rough 1295 O Safflower-oil 1294 O Safflower-seed 1494 O Saffron 1133 19A Sage 1216 1AB Salsify(oyster plant) 1893 O Salt 1473 O Sapodilla 1134 19A Savory 1460 O Seafood-misc(turtle/frog) 1411 O Seaweed 1309 O Seeds (misc.) 1412 O Sequin (portuguese squash) 1252 O Sesame seeds 1296 O Sesame-oil 1217 3 Shallots 1338 M Sheep-fat w/o bone 1339 M Sheep-kidney 1341 M Sheep-lean (fat free) w/o bone 1340 M Sheep-liver 1336 M Sheep-meat byproducts 1337 M Sheep-other organ meats 1413 6A Snowpeas 1275 15 Sorghum (including milo) 1102 O Soursop (annona muricata) 1414 O Soursop-juice 1303 6A Soybean-other 1307 6A Soybeans-flour (defatted) 1306 6A Soybeans-flour (low fat) 1305 6A Soybeans-flour (full fat) 1304 6A Soybeans-mature seeds dry 1

DEEM Users Manual©2000 Novigen Sciences, Inc.
D - 10
APPENDIX D (CONT’D)
RAC Crop AdjustmentCode Group Commodity # 1
297 6A Soybeans-oil 1482 O Soybeans-protein isolate 1255 6A Soybeans-sprouted seeds 0.33312 O Spearmint 1313 O Spearmint-oil 1186 4A Spinach 1150 9B Squash-summer 1415 9B Squash-spaghetti 1151 9B Squash-winter 1
17 O Strawberries 1416 O Strawberries-juice 1282 1A Sugar-beet 1379 1A Sugar-beet-molasses 1283 O Sugar-cane 1284 O Sugar-cane/molasses 1103 O Sugar apples (sweetsop) 1298 O Sunflower-oil 1417 O Sunflower-seeds 1218 1CD Sweet potatoes (incl yams) 1418 2 Sweet potatos-leaves 1896 O Sweeteners-artificial 1187 4A Swiss chard 1419 O Tamarind 1
37 10 Tangelos 138 10 Tangerines 139 10 Tangerines-juice 2.3
420 10 Tangerines-juice-concentrate 7.35201 1CD Taro-root 1190 2 Taro-greens 1493 O Tarragon 1113 O Tea 1422 O Thistle leaves 1136 19A Thyme 1163 8 Tomatoes-catsup 2.5423 8 Tomatoes-dried 14.3160 8 Tomatoes-juice 1.5162 8 Tomatoes-paste 5.4161 8 Tomatoes-puree 3.3159 8 Tomatoes-whole 1153 O Towelgourd 1355 P Turkey-byproducts 1357 P Turkey--fat w/o bones 1356 P Turkey-giblets (liver) 1358 P Turkey- lean/fat free w/o bone 1449 P Turkey-other organ meats 1137 1CD Turmeric 1219 1AB Turnips-roots 1188 2 Turnips-tops 1

DEEM Users Manual©2000 Novigen Sciences, Inc.
D - 11
APPENDIX D (CONT’D)
RAC Crop AdjustmentCode Group Commodity # 1
489 O Vanilla 1429 M Veal-dried 1.92424 M Veal-fat w/o bones 1426 M Veal-kidney 1425 M Veal-lean (fat free) w/o bones 1427 M Veal-liver 1430 M Veal-meat byproducts 1428 M Veal-other organ meats 1314 O Vinegar 1431 14 Walnut oil 1
48 14 Walnuts 1226 O Water chestnuts 1432 O Water-bottled 1434 O Water-commercial processing 1435 O Water-non-food based 1433 O Water-tap 1189 O Watercress 1147 9A Watermelon 1436 9A Watermelon-juice 1278 15 Wheat-bran 1279 15 Wheat-flour 1277 15 Wheat-germ 1437 15 Wheat-germ oil 1276 15 Wheat-rough 1438 O Wi-apple 1439 9B Wintermelon 1221 1CD Yambean tuber (jicama) 1224 1CD Yautia (tannier) 1440 O Yeast 1
6 13A Youngberries 1

DEEM Users Manual©2000 Novigen Sciences, Inc.
E - 1
APPENDIX E
MONTE CARLO ANALYSES ANDDATA ENTRY SIMPLIFICATION

DEEM Users Manual©2000 Novigen Sciences, Inc.
E - 2
APPENDIX E
MONTE CARLO ANALYSES ANDDATA ENTRY SIMPLIFICATION
HELPFUL INFORMATION REGARDING ACUTE DISTRIBUTIONAL ANALYSESAND THE MONTE CARLO OPTION
• What is the appropriate number of iterations?
The number of iterations depends on the variability and number of observations in theresidue data as well as on the number of foods being analyzed. The larger thevariability and the larger the number of observations, the greater the number ofiterations. From our own experience, it does not appear as if much is gained byutilizing more than 500 iterations, as long as the number of residue values (includingzeroes) is bellow 500.
• What is a sufficient number of residue samples?
The minimum number of residue samples depends on theapplication/distribution/level of precision desired. Generally, there is no minimumfor Monte Carlo procedures; however, you will want to determine that the residuedata are representative of the desired universe and that there are sufficient samples forthis purpose.
• How is the frequency distribution generated?
The program does not divide the residue distribution into bins. It does, however,divide the exposure range into bins that are equally spaced in the log-scale. Thewidth of the intervals in log-scale is 1/7, which, in the scale of the originalobservations, means that the ratio of the upper limit of the bin to its lower limit is1.15 (=exp(1/7)). Thus, the width of the intervals is 15% their lower limits. Thus, thebins are wider at the higher exposure values.
Because the intervals increase in size, it is more likely to have a more evendistribution of the number of observations in each interval in the case of skeweddistributions (i.e., with a long tail).
No parametric assumption are made about the distributions. But, the method used tocreate the intervals usually is used for skewed distributions such as the log-normaldistributions.

DEEM Users Manual©2000 Novigen Sciences, Inc.
E - 3
APPENDIX E (CONT’D)
• Discussion of the uncertainties inherent in the program.
DEEM™ ACUTE MODULE and MONTE CARLO assume the same basicunderlying mode, namely that the exposure random variable (E) is the product of theconsumption ( C ) and residue ( R ) random variables (E=CxR), and that C and R arestatistically independent. In other words, the amount consumed is not related to theamount of residue in/on the food. The programs differ in the assumption of theresidue distribution, i.e., the use of the residue distribution, or the derivation of theexposure distribution. Thus, the uncertainty in the programs can come from twosources:
1. Uncertainty of the model: The model assumes that dietary exposure is the productof the amount consumed and the residue concentration in the foods. The modeldoes not take into consideration individual differences that may exist inabsorption, or the correlation, if any, between amounts of foods consumed andresidue concentrations, or between the consumption levels of various members ofthe same household, or the consumption levels on the three days of the survey.(Note that the CSFII for 1994 through 1996 collected data for only two days. Datawere collected 3 to 10 days apart to ensure that nutrient intakes on the 2 dayswould be statistically uncorrelated and 10 days was chosen as the maximum limitof endurance for interviewer-respondent rapport.)
2. Uncertainty in the residue/consumption data: The uncertainty is related to suchfactors as whether the consumption data used in the assessment are trulyrepresentative of the usual food consumption of the various individuals in thepopulation, and whether the residue data are representative of the residueconcentrations in the foods. Another source of uncertainty in the data relates tothe uncertainty in the data about foods as eaten to amounts of raw agriculturalcommodities.
The variability between individual records with respect to the amounts of foodconsumed and the variability in the residue distribution determine the variabilityin the residue distribution and determine the variability in the exposuredistribution. This variability can be assessed through the estimate of the standarddeviation, and the percentiles of the exposure distribution.

DEEM Users Manual©2000 Novigen Sciences, Inc.
E - 4
APPENDIX E (CONT’D)
• Can the Monte Carlo option be modified to include the residue buildingprogram as opposed to having the build the files outside the program?
Given the sheer magnitude of the number of residue values that could beused with these applications, this may not be recommended. It may bemore useful if NOVIGEN develops a bridge between a designated“spreadsheet” program so that the values can be readily imported.
• Weighted data and DEEM™ Acute Module: Can unweighted data also beprovided?
Given the survey design, the statistical weights should always be used withthe CSFII data.
• Monte Carlo and Adjustment Factors:
Adjustment factor #1 is always used by the program. The user has the optionof selecting adjustment factor #2; if this is chose, the program will multiply allresidue values by both adjustment factors, even those in the RDF files.Typically, factor #2 should not be used in an acute analysis (since RDF filescontain zero values to account for percent crop treated).
SHORT CUTS TO DATA ENTRY OF RDF FILES
RDF files contain residue data for a particular chemical that are representative of the distributionof residue levels found in particular foods. The DEEM , FARE , and CALENDEXprograms running in the Monte Carlo analysis mode draw residue values at random from this filefor use in an exposure analysis of that food. RDF files are generated using a text editor or wordprocessor, or automatically using RDFgen™. RDF files must always be saved as ASCII (DOS)text files (i.e., no coded characters in the file).
The first four lines in the RDF file are reserved for documentation and key words only. Do NOTplace residue values other than those included with keywords in the first four lines. (This is tomaintain consistency with an older file format.)
RDF files can have an unlimited number of documentation lines at the top but all documentationlines must start with the word “doc” (case insensitive) or an apostrphe, e.g.:
doc this is documentationor' this is documentation.

DEEM Users Manual©2000 Novigen Sciences, Inc.
E - 5
There are five keywords to describe the content of a RDF file. The key words must be onseparate lines (except LODRES). Do not place other documentation or comments on these lines.Do not use a keyword more than once in a RDF file.
APPENDIX E (CONT’D)
Key words:
TOTALNZ = xxx (total number of non-zero residues that are included in the file, one to a line,not including residues that are designated with frequencies or LODRES.
TOTALZ = xxx (total number of zeros residues to be included as a block in the analysis, notincluding any zeros which are entered as stand-alone residues or with frequencies.
TOTALLOD = xxx (total number of limit-of-detection residue values entered as a single block;must be followed by “LODRES = xxx” which is the limit-of-detection residue amount.
TOTALFREQ = xxx (total number of residue entries that are preceded by a frequency, whichindicates how many times that residue amount appears in the original residue data. Frequency-residue pairs must be separated by a comma and only one pair can be entered on a line; e.g., 5,0.1means that the residue value 0.1 appears 5 times in the original residue data.
Note: TOTALNZ and TOTALFREQ are optional; the program will count occurrences of eachtype and assign the sum to each variable type; however, use of these key words provides a meansof cross checking your data (the counted sums will be matched to their respective declarations).
Note: The total number of residues in any given RDF file, including each residue multiplied byits frequency and summed, cannot exceed 32,767. (A check is made on this.) This does notinclude TOTALZ or TOTALLOD, which can be any size.
There is no required order for residues entered alone or with frequencies. That is, they can be inmixed order as long as there is not more than one residue value or frequency-residue pair on anyline. The comma is the character that the program uses to differentiate between the two types ofentries.
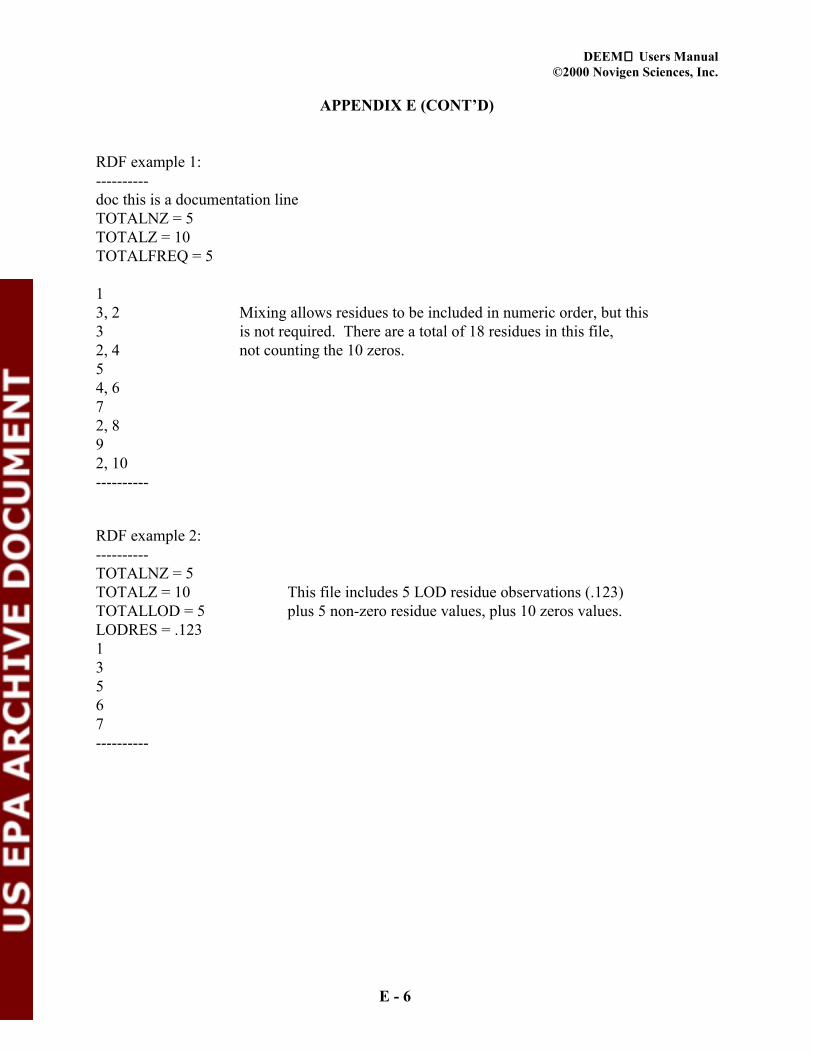
DEEM Users Manual©2000 Novigen Sciences, Inc.
E - 6
APPENDIX E (CONT’D)
RDF example 1:----------doc this is a documentation lineTOTALNZ = 5TOTALZ = 10TOTALFREQ = 5
13, 2 Mixing allows residues to be included in numeric order, but this3 is not required. There are a total of 18 residues in this file,2, 4 not counting the 10 zeros.54, 672, 892, 10----------
RDF example 2:----------TOTALNZ = 5TOTALZ = 10 This file includes 5 LOD residue observations (.123)TOTALLOD = 5 plus 5 non-zero residue values, plus 10 zeros values.LODRES = .12313567----------

DEEM Users Manual©2000 Novigen Sciences, Inc.
E - 7
APPENDIX E (CONT’D)
RDF example 3:----------TOTALNZ = 18TOTALZ = 10 Note that four lines are reserved at top before residue values
are shown.
1 This example is equivalent to example 1. However, you2 will not get exactly the same results as it you run with2 example 1 because the data are not processed in the2 same order. When you use freq data the freq data3 are processed first; then the single residues are processed;4 the random number sequence as applied to the individual4 residues is thus different.5666 See example 4 to see the equivalent RDF file that6 will give identical results to example 1 when the7 same seed is used and the program is started fresh.8891010----------

DEEM Users Manual©2000 Novigen Sciences, Inc.
E - 8
APPENDIX E (CONT’D)
RDF example 4:----------TOTALNZ = 18TOTALZ = 10
Must leave four lines at top before residue entries.2224 This example will give exactly the same results4 as example 1 when used with the same seed.666688101013579----------
If adjusting for percent of the crop treated, instead of “augmenting” the data file byentering the appropriate number of zeroes, simply tell the program the number of zeroes by using
TOTALZ = XX
NOTE: This feature is not case sensitive: the number of zeros will be dependent on thenumber of residue values in the RDF file (i.e., the maximum number cannot exceed32,767).
The limit of detection or a fraction of it, can be included by specifying the number of samples atthe LOD and the LOD value as follows:
TOTALLOD = XXXLODRES = XXX.XXXX

DEEM Users Manual©2000 Novigen Sciences, Inc.
E - 9
APPENDIX E (CONT’D)
NOTE: the unit for the LOD residue value must be the same as the others in the file (i.e.,ppm).
As a check, the number of positive residue values in the RDF file may be provided as follows:
TOTALNZ = XXX
NOTE: This feature is not case sensitive; the number of values will depend on the totalnumber of residue values in the RDF file (i.e., the maximum number cannot exceed32,000). Even though TOTALNZ stands for “non-zero,” any zero value in the file will becounted as a valid residue value and used in the analysis in addition to the zeroes broughtin by the TOTALZ declaration.
RDF files may contain documentation information in any line that contains a code word ORresidue value. This documentation is in addition to any included in the first four lines of the file.Any documentation listed outside the first four lines MUST begin with a non-numeric characteror code word (e.g., “doc”) that follows the code word information or the residue value. Note thata blank space by itself is not sufficient to initiate a documentation statement. Thus, a residuevalue followed by a blank space and then a numeric character will cause an error when readingthe line.
Example:
TOTALZ=10 doc this is documentation10, 0.001 doc this is documentation0.01 this is documentation
but not:TOTALZ = 10 10 is from source xyz (this will result in the 10 being interpreted by the programas 1000)

DEEM Users Manual©2000 Novigen Sciences, Inc.
F - 1
APPENDIX F
FOOD DEFINITIONS
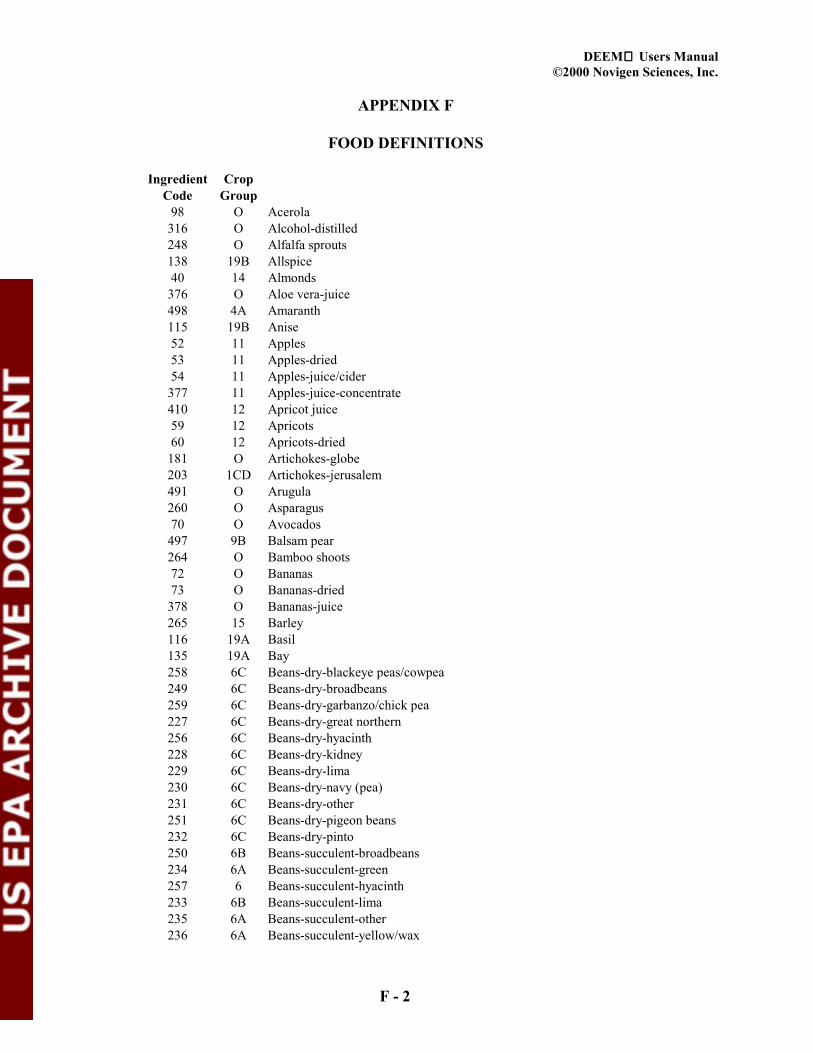
DEEM Users Manual©2000 Novigen Sciences, Inc.
F - 2
APPENDIX F
FOOD DEFINITIONS
Ingredient CropCode Group
98 O Acerola316 O Alcohol-distilled248 O Alfalfa sprouts138 19B Allspice40 14 Almonds
376 O Aloe vera-juice498 4A Amaranth115 19B Anise52 11 Apples53 11 Apples-dried54 11 Apples-juice/cider
377 11 Apples-juice-concentrate410 12 Apricot juice59 12 Apricots60 12 Apricots-dried
181 O Artichokes-globe203 1CD Artichokes-jerusalem491 O Arugula260 O Asparagus70 O Avocados
497 9B Balsam pear264 O Bamboo shoots72 O Bananas73 O Bananas-dried
378 O Bananas-juice265 15 Barley116 19A Basil135 19A Bay258 6C Beans-dry-blackeye peas/cowpea249 6C Beans-dry-broadbeans259 6C Beans-dry-garbanzo/chick pea227 6C Beans-dry-great northern256 6C Beans-dry-hyacinth228 6C Beans-dry-kidney229 6C Beans-dry-lima230 6C Beans-dry-navy (pea)231 6C Beans-dry-other251 6C Beans-dry-pigeon beans232 6C Beans-dry-pinto250 6B Beans-succulent-broadbeans234 6A Beans-succulent-green257 6 Beans-succulent-hyacinth233 6B Beans-succulent-lima235 6A Beans-succulent-other236 6A Beans-succulent-yellow/wax
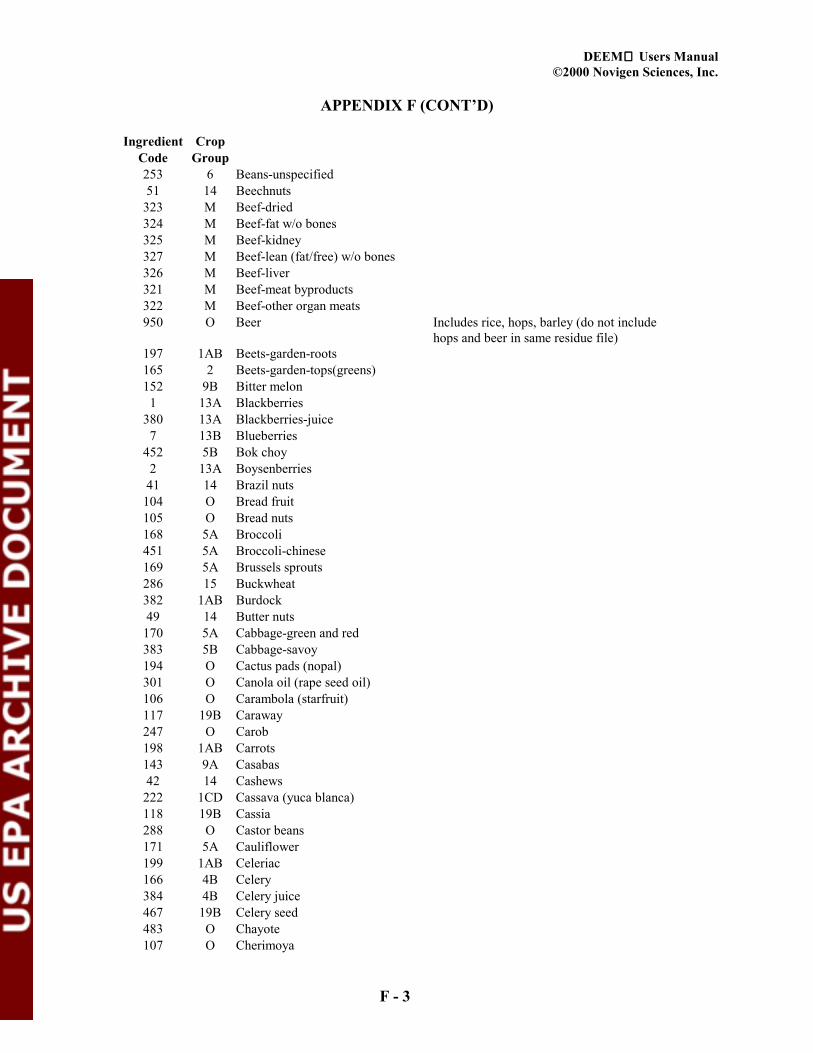
DEEM Users Manual©2000 Novigen Sciences, Inc.
F - 3
APPENDIX F (CONT’D)
Ingredient CropCode Group253 6 Beans-unspecified51 14 Beechnuts
323 M Beef-dried324 M Beef-fat w/o bones325 M Beef-kidney327 M Beef-lean (fat/free) w/o bones326 M Beef-liver321 M Beef-meat byproducts322 M Beef-other organ meats950 O Beer Includes rice, hops, barley (do not include
hops and beer in same residue file)197 1AB Beets-garden-roots165 2 Beets-garden-tops(greens)152 9B Bitter melon
1 13A Blackberries380 13A Blackberries-juice
7 13B Blueberries452 5B Bok choy
2 13A Boysenberries41 14 Brazil nuts
104 O Bread fruit105 O Bread nuts168 5A Broccoli451 5A Broccoli-chinese169 5A Brussels sprouts286 15 Buckwheat382 1AB Burdock49 14 Butter nuts
170 5A Cabbage-green and red383 5B Cabbage-savoy194 O Cactus pads (nopal)301 O Canola oil (rape seed oil)106 O Carambola (starfruit)117 19B Caraway247 O Carob198 1AB Carrots143 9A Casabas42 14 Cashews
222 1CD Cassava (yuca blanca)118 19B Cassia288 O Castor beans171 5A Cauliflower199 1AB Celeriac166 4B Celery384 4B Celery juice467 19B Celery seed483 O Chayote107 O Cherimoya

DEEM Users Manual©2000 Novigen Sciences, Inc.
F - 4
APPENDIX F (CONT’D)
Ingredient CropCode Group
61 12 Cherries62 12 Cherries-dried63 12 Cherries-juice
447 4A Chervil43 14 Chestnuts
366 P Chicken-byproducts368 P Chicken-fat w/o bones367 P Chicken-giblets(liver)385 P Chicken-giblets (excl. liver)369 P Chicken-lean/fat free w/o bones114 1AB Chicory root vegetable167 4A Chicory(french/belgian endive) leafy vegetable200 19A Chives111 O Chocolate110 O Chocolate-cocoa butter386 9B Christophine892 O Chrysanthemum495 O Cilantro119 19B Cinnamon20 10 Citrus citron
120 19B Clove75 O Coconut-dried (copra)
387 O Coconut-milk299 O Coconut-oil76 O Coconut-water74 O Coconut
112 O Coffee172 5B Collards121 19B Coriander267 15 Corn grain-bran outer hull of the corn kernel266 15 Corn grain-endosperm corn kernel excluding hull, bran and germ289 15 Corn grain-oil268 15 Corn grain/sugar/hfcs388 15 Corn grain/sugar-molasses237 15 Corn/pop238 15 Corn/sweet291 O Cottonseed-meal290 O Cottonseed-oil55 11 Crabapples8 O Cranberries9 O Cranberries-juice
389 O Cranberries-juice-concentrate144 9A Crenshaws180 4A Cress-garden/field191 4A Cress-upland148 9B Cucumbers122 19B Cumin10 13B Currants

DEEM Users Manual©2000 Novigen Sciences, Inc.
F - 5
APPENDIX F (CONT’D)
Ingredient CropCode Group177 4A Dandelion-greens77 O Dates3 13A Dewberries
123 19A Dill154 8 Eggplant364 P Eggs-white only363 P Eggs-whole365 P Eggs-yolk only11 13B Elderberries
178 4A Endive-curley and escarole179 19B Fennel390 O Fern shoots (fiddleheads)78 O Figs44 14 Filberts (hazelnuts)
352 F Fish-finfish/freshwater354 F Fish-finfish-saltwater-dried353 F Fish-finfish/saltwater (incl. Tuna)351 F Fish-roe/caviar349 F Fish-shellfish292 O Flax seed202 3 Garlic317 O Gelatin109 O Genip (spanish lime)124 1CD Ginger99 O Ginkgo nuts
450 1AB Ginseng330 M Goat-fat w/o bone331 M Goat-kidney333 M Goat-lean (fat/free) w/o bone332 M Goat-liver328 M Goat-meat byproducts329 M Goat-other organ meats12 13B Gooseberries23 10 Grapefruit-juice
441 10 Grapefruit-juice-concentrate448 10 Grapefruit peel22 10 Grapefruit-peeled fruit13 O Grapes15 O Grapes-juice
392 O Grapes-juice-concentrate195 O Grapes-leaves14 O Grapes-raisins
315 O Grapes-wine and sherry164 8 Groundcherries287 6C Guar beans393 O Guava-juice79 O Guava45 14 Hickory nuts

DEEM Users Manual©2000 Novigen Sciences, Inc.
F - 6
APPENDIX F (CONT’D)
Ingredient CropCode Group897 O Gums/gels Carboxy-methyl cellulose, gums, stabilizers, etc.281 O Honey125 O Hops334 M Horsemeat126 1AB Horseradish16 13B Huckleberries
394 O Jackfruit395 O Jobo18 O Juneberry
891 O Jute174 5B Kale97 O Kiwi fruit
175 5A Kohlrabi24 10 Kumquats
193 O Lambsquarter894 O Leavening agents Baking soda, powder485 O Leaves (misc) Includes those without their own category204 3 Leeks28 10 Lemons-juice
442 10 Lemons-juice-concentrate27 10 Lemons-peel26 10 Lemons-peeled fruit
243 6C Lentils182 4A Lettuce-unspecified176 4A Lettuce-leafy varieties192 4A Lettuce-head varieties32 10 Limes-juice
443 10 Limes-juice-concentrate31 10 Limes-peel30 10 Limes-peeled fruit4 13A Loganberries
108 O Longan fruit81 11 Loquats
396 O Lotus root96 O Lychee-dried95 O Lychees (litchi)/fresh46 14 Macadamia nuts (bush nuts)
132 19B Mace100 O Maney (mammee apple)80 O Mangoes
285 O Maple sugar Sugar made from sugar maple (Acer saccharum)128 19A Marjoram350 O Meat-game141 9A Melons-cantaloupes-juice142 9A Melons-cantaloupes-pulp145 9A Melons-honeydew146 9A Melons-persian398 D Milk-based water Water fraction of milk products

DEEM Users Manual©2000 Novigen Sciences, Inc.
F - 7
APPENDIX F (CONT’D)
Ingredient CropCode Group319 D Milk-fat solids318 D Milk-nonfat solids Includes whey, other milk proteins320 D Milk sugar (lactose)280 15 Millet890 O Miscellaneous/nfs Includes flavors, colors, nutrients (added) and a
variety of food additives that are listed onproduct label.
911 O Molasses-nfs Molasses other than cane sugar molasses, beetsugar molasses, or corn sugar molasses.
19 O Mulberries244 6C Mung beans (sprouts)261 O Mushrooms183 5B Mustard greens130 19B Mustard seed64 12 Nectarines
496 O Nopales131 19B Nutmeg399 15 Oats-bran269 15 Oats245 O Okra397 9B Okra/chinese (luffa)82 O Olives
300 O Olive oil206 3 Onions-dehydrated or dried205 3 Onions-dry-bulb (cipollini)262 3 Onions-green Includes spring onions36 10 Oranges-juice33 10 Oranges-juice-concentrate35 10 Oranges-peel34 10 Oranges-peeled fruit
129 19A Oregano196 O Oriental vegetables/leafy308 O Oriental vegetables/non-leafy400 O Palm hearts302 O Palm oil85 O Papayas-dried86 O Papayas-juice84 O Papayas-pulp
139 8 Paprika184 4A Parsley225 1AB Parsley roots220 1AB Parsnips401 O Passion fruit-juice92 O Passion fruit (granadilla)87 O Pawpaws65 12 Peaches66 12 Peaches-dried
402 12 Peaches-juice

DEEM Users Manual©2000 Novigen Sciences, Inc.
F - 8
APPENDIX F (CONT’D)
Ingredient CropCode Group403 O Peanuts-butter940 O Peanuts-hulled293 O Peanuts-oil56 11 Pears57 11 Pears-dried
404 11 Pears-juice240 6C Peas (garden)-dry241 6AB Peas (garden)-green405 6B Peas-succulent/blackeye/ cowpea47 14 Pecans
381 19B Pepper/black310 O Peppermint311 O Peppermint-oil156 8 Peppers-chilli incl jalapeno157 8 Peppers-other155 8 Peppers-sweet(garden)88 O Persimmons
158 8 Pimientos90 O Pineapples-dried91 O Pineapples-juice
406 O Pineapples-juice-concentrate89 O Pineapples-peeled fruit
254 O Pinenuts50 O Pistachio nuts
101 O Pitanga (surinam cherry)480 O Plantains-green94 O Plantains-ripe
481 O Plantains-dried67 12 Plums (damsons)68 12 Plums-prunes (dried)69 12 Plums/prune-juice
263 O Poke greens93 O Pomegranates
140 19B Poppy344 M Pork-fat w/o bone345 M Pork-kidney347 M Pork-lean (fat free) w/o bone346 M Pork-liver342 M Pork-meat byproducts343 M Pork-other organ meats210 1C Potatoes/white-dry209 1C Potatoes/white-peeled211 1C Potatoes/white-peel only208 1C Potatoes/white-unspecified207 1C Potatoes/white-whole362 P Poultry-other-fat w/o bones361 P Poultry-other-giblets(liver)360 P Poultry-other-lean (fat free) w/

DEEM Users Manual©2000 Novigen Sciences, Inc.
F - 9
APPENDIX F (CONT’D)
Ingredient CropCode Group895 O Psyllium149 9B Pumpkin58 11 Quinces
335 M Rabbit492 O Radicchio407 1AB Radishes-japanese (daiken)484 O Radishes-oriental212 1AB Radishes-roots213 2 Radishes-tops
5 13A Raspberries185 4B Rhubarb408 15 Rice-bran Layer beneath hull; contains outer bran and parts
of the germ.271 15 Rice-milled (white) Rice kernels after milling is complete and
hulls, bran, and germ are removed.270 15 Rice-rough (brown) Rice with hulls removed, but bran remaining409 15 Rice-wild127 19A Rosemary214 1AB Rutabagas-roots215 2 Rutabagas-tops274 15 Rye-flour273 15 Rye-germ Embryo or sprouting part of the grain.272 15 Rye-rough295 O Safflower-oil294 O Safflower-seed494 O Saffron133 19A Sage216 1AB Salsify(oyster plant)893 O Salt473 O Sapodilla134 19A Savory460 O Seafood-misc(turtle/frog)411 O Seaweed309 O Seeds (misc.) Other than those identified as separate RACs
(e.g., sesame seeds, sunflower seeds)412 O Sequin (portuguese squash)252 O Sesame seeds296 O Sesame-oil217 3 Shallots338 M Sheep-fat w/o bone339 M Sheep-kidney341 M Sheep-lean (fat free) w/o bone340 M Sheep-liver336 M Sheep-meat byproducts337 M Sheep-other organ meats413 6A Snowpeas275 15 Sorghum (including milo)102 O Soursop (annona muricata)

DEEM Users Manual©2000 Novigen Sciences, Inc.
F - 10
APPENDIX F (CONT’D)
Ingredient CropCode Group414 O Soursop-juice303 6A Soybean-other307 6A Soybeans-flour (defatted)306 6A Soybeans-flour (low fat)305 6A Soybeans-flour (full fat)304 6A Soybeans-mature seeds dry297 6A Soybeans-oil482 O Soybeans-protein isolate255 6A Soybeans-sprouted seeds312 O Spearmint313 O Spearmint-oil186 4A Spinach150 9B Squash-summer415 9B Squash-spaghetti151 9B Squash-winter17 O Strawberries
416 O Strawberries-juice282 1A Sugar-beet379 1A Sugar-beet-molasses283 O Sugar-cane284 O Sugar-cane/molasses103 O Sugar apples (sweetsop)298 O Sunflower-oil417 O Sunflower-seeds218 1CD Sweet potatoes (incl yams)418 2 Sweet potatos-leaves896 O Sweeteners-artificial187 4A Swiss chard419 O Tamarind37 10 Tangelos38 10 Tangerines39 10 Tangerines-juice
420 10 Tangerines-juice-concentrate201 1CD Taro-root190 2 Taro-greens493 O Tarragon113 O Tea422 O Thistle leaves136 19A Thyme163 8 Tomatoes-catsup423 8 Tomatoes-dried160 8 Tomatoes-juice162 8 Tomatoes-paste161 8 Tomatoes-puree159 8 Tomatoes-whole153 O Towelgourd355 P Turkey-byproducts357 P Turkey--fat w/o bones

DEEM Users Manual©2000 Novigen Sciences, Inc.
F - 11
APPENDIX F (CONT’D)
Ingredient CropCode Group356 P Turkey-giblets (liver)358 P Turkey- lean/fat free w/o bones449 P Turkey-other organ meats137 1CD Turmeric219 1AB Turnips-roots188 2 Turnips-tops489 O Vanilla429 M Veal-dried424 M Veal-fat w/o bones426 M Veal-kidney425 M Veal-lean (fat free) w/o bones427 M Veal-liver430 M Veal-meat byproducts428 M Veal-other organ meats314 O Vinegar431 14 Walnut oil48 14 Walnuts
226 O Water chestnuts432 O Water-bottled434 O Water-commercial processing Water added during processing (e.g., water in
canned vegetables, infant foods, etc.)435 O Water-non-food based Tap water consumed as a separate beverage.
Amount reported in response to survey question,“How many glasses of water do you drink in aday?”
433 O Water-tap Tap water added to foods duringcooking/preparation (e.g., water added to rice inhome-prepared dish)
189 O Watercress147 9A Watermelon436 9A Watermelon-juice278 15 Wheat-bran Coarse, outer layer of grain279 15 Wheat-flour Finely ground endosperm fraction of
grain277 15 Wheat-germ Embryo or sprouting part of the grain437 15 Wheat-germ oil Oil fraction pressed from germ276 15 Wheat-rough Grain and bran438 O Wi-apple439 9B Wintermelon221 1CD Yambean tuber (jicama)224 1CD Yautia (tannier)440 O Yeast
6 13A Youngberries