Embed Size (px)
Citation preview

1
Dietary predictors of young children’s exposure to current-use pesticides using urinary biomonitoring
Marsha K. Morgan*, Paul A. Jones
United States Environmental Protection Agency’s National Exposure Research Laboratory, 109 T.W. Alexander Drive, Durham, North Carolina 27711, USA
Abstract: Few data exist on the association between dietary habits and urinary biomarker concentrations of pesticides in children. The objective was to examined the association between the weekly intake frequency of 65 food items and urinary biomarkers of exposure to chlorpyrifos (3,5,6-trichloro-2-pyridinol [TCP]), permethrin (3-phenoxybenzoic acid [3-PBA]), and 2,4-dichlorophenoxyacetic acid [2,4-D] in 135 preschool-aged children. TCP and 3-PBA are nonspecific biomarkers as they are also urinary metabolites of other pesticides. TCP, 3-PBA, and 2,4-D were detected in 99%, 64%, and 92% of the urine samples, respectively. Mean urinary TCP concentrations were statistically significantly higher in children consuming fresh apples (9.40±15.5 ng/mL versus 5.76±3.57 ng/mL, p=0.040) and fruit juices (8.41±11.5 ng/mL versus 4.11±2.77 ng/mL, p=0.020) > 3 times a week compared to < 3 times a week. For 3-PBA, mean urinary metabolite concentrations were statistically significantly greater in children consuming chicken/turkey meats (0.79±0.81 versus 0.41±0.39, p=0.013) > 3 times a week compared to < 3 times a week. No association occurred between the consumption of any food item and children’s mean urinary 2,4-D concentrations by intake group. In conclusion, frequent consumption of fresh apples and fruit juices or chicken/turkey meats were significant dietary predictors of urinary levels of TCP or 3-PBA, respectively.
Keywords: Preschool children, food, ingestion, TCP, 3-PBA, 2,4-D, urinary biomarkers
____________
Abbreviations: 2,4-D, 2,4-dichlorophenoxyacetic acid; 3-PBA, 3-phenoxybenzoic acid; LOD, limit of detection; LOQ, limit of quantification; TCP, 3,5,6-trichloro-2-pyridinal; US, United States
* Corresponding author. Address: US Environmental Protection Agency’s National Exposure Research Laboratory, 109. T.W. Alexander Drive, Durham, North Carolina, USA. Tel.: 919-541-2598; fax: 919-541-0905 Email addresses: [email protected] (M.K. Morgan), [email protected] (P.A. Jones)

2
1. Introduction
In the United States (US), chlorpyrifos and permethrin are insecticides that are frequently
used to control insect pests on a variety of agricultural crops (US EPA, 2007; Dow
AgroSciences, 2013). 2,4-Dichlorophenoxyacetic acid (2,4-D) is a phenoxy herbicide that is also
commonly applied to farm fields for selective control of broadleaf weeds (Arbuckle and Ritter,
2005). It is estimated that approximately 10, 1, and 30 million pounds of chlorpyrifos,
permethrin, and 2,4-D, respectively, are used in agricultural settings each year (US EPA, 2002,
2005, 2007). Chlorpyrifos and permethrin residues have been detected in a number of different
types of fresh fruits and vegetables and other processed food products (e.g., fruit juices, grains,
and meats) purchased at supermarkets and grocery stores across the US (Katz and Winter, 2009;
FDA, 2013). For 2,4-D, residues have been mainly found in purchased cereal and bread products
(FDA, 2013). As children typically consume these kinds of foods, they are likely being exposed
to pesticides in their diets.
Once absorbed into the body, 2,4-D undergoes little metabolism and is mainly renally
eliminated as the parent compound (Sauerhoff et al., 1977). For chlorpyrifos, it is quickly
metabolized into diethylphosphate, diethylthiophosphate, and 3, 5, 6-trichloro-2-pyridinol (TCP),
and these metabolites are primarily excreted in urine (CDC, 2009). Permethrin is also rapidly
metabolized and is mainly eliminated in urine as cis-3-(2,2-dichlorovinyl)-2,2-dimethyl-
cyclopropane carboxylic acid, trans-3-(2,2-dichlorovinyl)-2,2-dimethylcyclopropane carboxylic
acid, and 3-phenoxybenzoic acid (3-PBA) (CDC, 2009). These metabolites of chlorpyrifos and
permethrin are nonspecific urinary biomarkers as other pesticides in consumed foods can also be
broken down in the body to form these metabolites in urine (CDC, 2009).
In the past, several observational exposure measurements studies have shown that dietary
ingestion is a major route of children’s exposure to these three pesticides (Clayton et al., 2003;
3
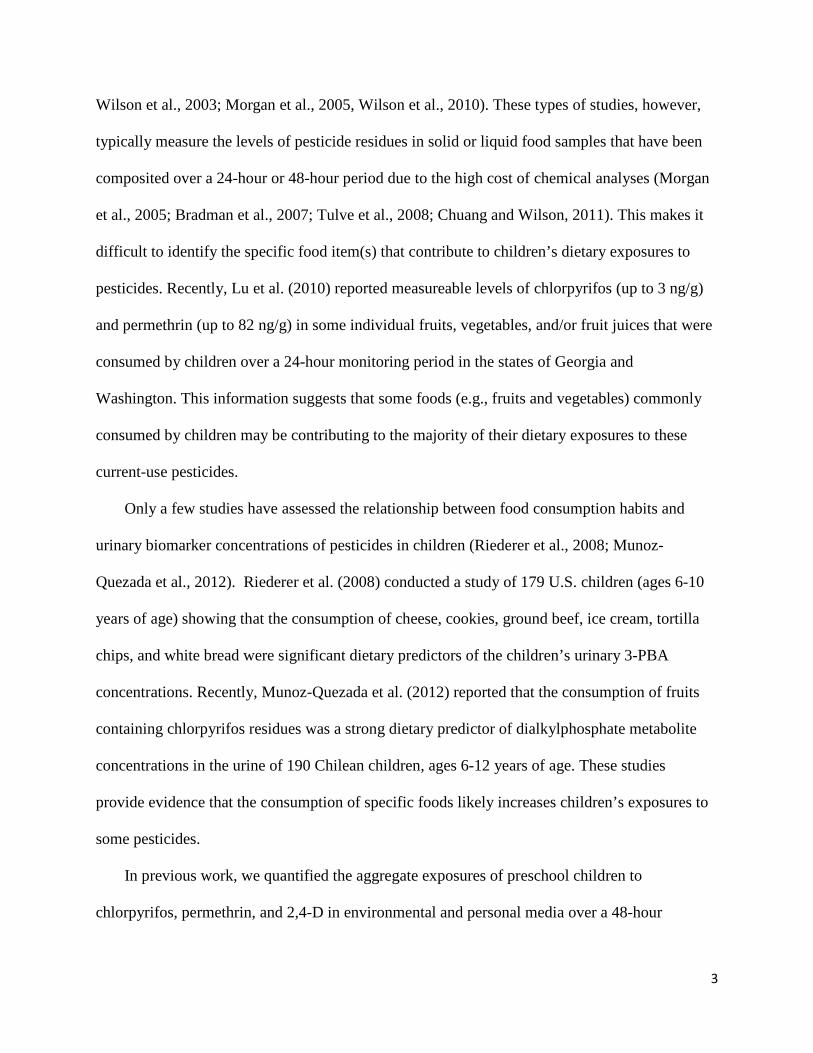
Wilson et al., 2003; Morgan et al., 2005, Wilson et al., 2010). These types of studies, however,
typically measure the levels of pesticide residues in solid or liquid food samples that have been
composited over a 24-hour or 48-hour period due to the high cost of chemical analyses (Morgan
et al., 2005; Bradman et al., 2007; Tulve et al., 2008; Chuang and Wilson, 2011). This makes it
difficult to identify the specific food item(s) that contribute to children’s dietary exposures to
pesticides. Recently, Lu et al. (2010) reported measureable levels of chlorpyrifos (up to 3 ng/g)
and permethrin (up to 82 ng/g) in some individual fruits, vegetables, and/or fruit juices that were
consumed by children over a 24-hour monitoring period in the states of Georgia and
Washington. This information suggests that some foods (e.g., fruits and vegetables) commonly
consumed by children may be contributing to the majority of their dietary exposures to these
current-use pesticides.
Only a few studies have assessed the relationship between food consumption habits and
urinary biomarker concentrations of pesticides in children (Riederer et al., 2008; Munoz-
Quezada et al., 2012). Riederer et al. (2008) conducted a study of 179 U.S. children (ages 6-10
years of age) showing that the consumption of cheese, cookies, ground beef, ice cream, tortilla
chips, and white bread were significant dietary predictors of the children’s urinary 3-PBA
concentrations. Recently, Munoz-Quezada et al. (2012) reported that the consumption of fruits
containing chlorpyrifos residues was a strong dietary predictor of dialkylphosphate metabolite
concentrations in the urine of 190 Chilean children, ages 6-12 years of age. These studies
provide evidence that the consumption of specific foods likely increases children’s exposures to
some pesticides.
In previous work, we quantified the aggregate exposures of preschool children to
chlorpyrifos, permethrin, and 2,4-D in environmental and personal media over a 48-hour
4
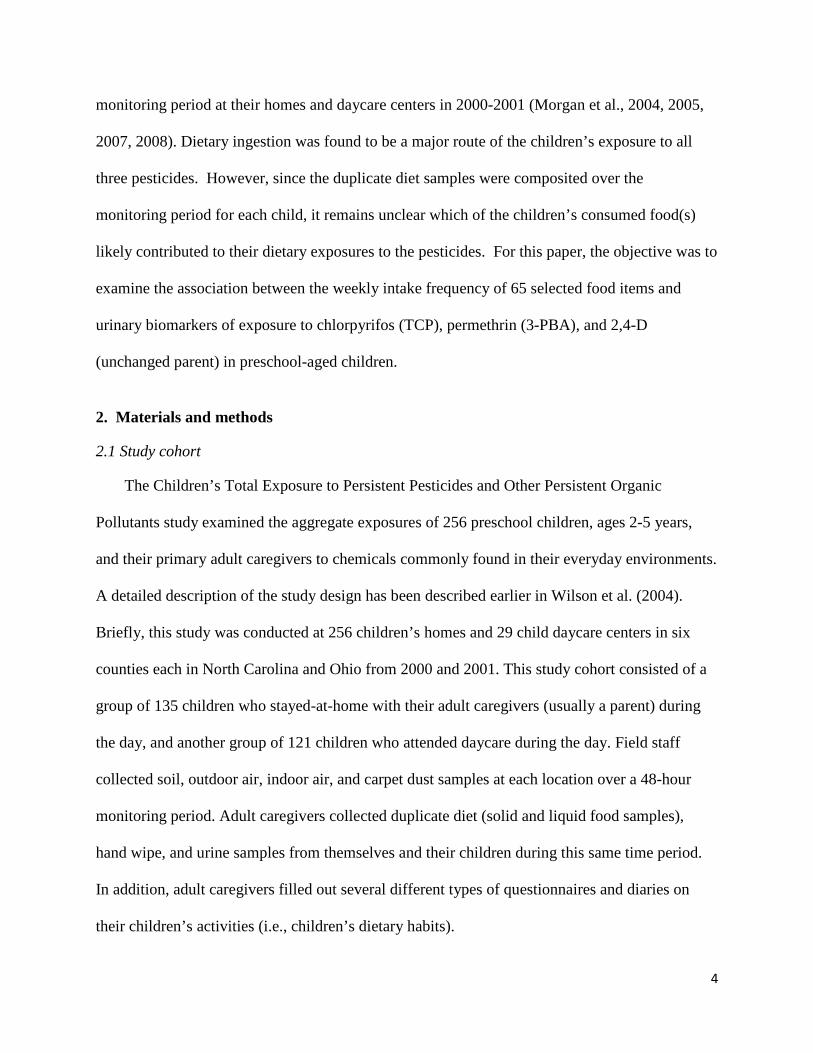
monitoring period at their homes and daycare centers in 2000-2001 (Morgan et al., 2004, 2005,
2007, 2008). Dietary ingestion was found to be a major route of the children’s exposure to all
three pesticides. However, since the duplicate diet samples were composited over the
monitoring period for each child, it remains unclear which of the children’s consumed food(s)
likely contributed to their dietary exposures to the pesticides. For this paper, the objective was to
examine the association between the weekly intake frequency of 65 selected food items and
urinary biomarkers of exposure to chlorpyrifos (TCP), permethrin (3-PBA), and 2,4-D
(unchanged parent) in preschool-aged children.
2. Materials and methods
2.1 Study cohort
The Children’s Total Exposure to Persistent Pesticides and Other Persistent Organic
Pollutants study examined the aggregate exposures of 256 preschool children, ages 2-5 years,
and their primary adult caregivers to chemicals commonly found in their everyday environments.
A detailed description of the study design has been described earlier in Wilson et al. (2004).
Briefly, this study was conducted at 256 children’s homes and 29 child daycare centers in six
counties each in North Carolina and Ohio from 2000 and 2001. This study cohort consisted of a
group of 135 children who stayed-at-home with their adult caregivers (usually a parent) during
the day, and another group of 121 children who attended daycare during the day. Field staff
collected soil, outdoor air, indoor air, and carpet dust samples at each location over a 48-hour
monitoring period. Adult caregivers collected duplicate diet (solid and liquid food samples),
hand wipe, and urine samples from themselves and their children during this same time period.
In addition, adult caregivers filled out several different types of questionnaires and diaries on
their children’s activities (i.e., children’s dietary habits).
5
For this present work, we used a subset of the CTEPP data consisting of 135 children that
stayed-at-home with their adult caregivers during the day. In our statistically analyses, we
examined the children’s weekly food consumption diary data and their 48-hour urinary
measurement data for TCP, 3-PBA, and 2,4-D. One additional child was excluded from this
dataset as they had a missing urine sample.
2.2 Human subjects research
This was an observational research study, as defined in 40 Code of Federal Regulations, Part
26.402. The study protocol and procedures to obtain the assent of the preschool children and
informed consent of their adult caregivers were reviewed and approved by an independent
institutional review board and complied with all applicable requirements of the Common Rule
regarding additional protections for children (Subpart D).
2.3. Food frequency consumption diary and urine sample collection
During the 48-hour monitoring period, the adult caregivers filled out a food frequency
consumption diary that recorded information on their children’s usual eating habits (i.e., on a
weekly basis) for 65 specific food items that were consumed over the past year. Food items in
the diary included a number of different types of fruits, vegetables, meats, breads, snacks, and
beverages (excluding water). In addition, up to six spot urine voids (i.e., morning, after lunch,
and before bedtime) were collected from each child by their adult caregiver over this monitoring
period. A spot urine void was collected from a child by placing a plastic collector (bonnet) under
the toilet seat prior to urination. The adult caregiver transferred the urine void from the bonnet
into a 120 mL plastic container with lid. Individual urine samples were stored in provided
coolers with ice by adult caregivers at residences until they were picked up by field staff. Urine

6
samples were stored in freezers (< -20oC) at the Battelle laboratory in Columbus, Ohio until
analyses.
2.4. Urine sample analysis
At the laboratory, spot urine samples were pooled over a 48-hour monitoring period for each
child, except for children that had a recent pesticide application(s) at home within seven days of
field sampling. For these children, all of their spot urine samples (up to six) were analyzed
separately. For chemical analyses, 1 mL of urine was used per sample. The urine samples were
analyzed for biomarkers of exposure to chlorpyrifos (TCP), permethrin (3-PBA), and 2,4-D
(parent compound). Detailed information on the extraction and analysis procedures used to
quantify for TCP, 3-PBA (Ohio, only), and 2,4-D in the urine samples, including quality
assurance and quality control information, can be found in Morgan et al. (2005, 2007, and 2008).
Briefly, urine samples were analyzed for the target analytes by a gas chromatography/mass
selective detector (Hewlett-Packard 6890/5973A) in the selected ion-monitoring mode. The limit
of quantification (LOQ) was defined “as the minimum concentration at which an analyte can be
quantitatively measured in a sample medium with acceptable accuracy and precision” (Morgan et
al., 2005). For the LOQs, they were derived from the lowest calibration standard for each analyte
with a signal-to-noise ratio above 2. The lowest calibration standard was 2 ng/mL for TCP and
2,4-D and 1 ng/mL for 3-PBA. The estimated LOQ’s for TCP, 3-PBA, and 2,4-D in urine were
2.0, 0.4, and 0.4 ng/mL, respectively. The estimated limit of detection (LOD) was defined “as the
minimum analyte level detected in a sample and was estimated to be ½ of the LOQ” (Morgan et
al., 2004).
7
2.5 Data analysis
All pooled and non-pooled urine measurement values less than the LOD were replaced by
the LOD divided by the square root of two. For the non-pooled urine samples, the mean
concentration value was used for each analyte. Descriptive statistics (sample size, frequency of
detection, arithmetric mean and standard deviation, geometric mean, median, range, and
percentiles (25th, 75th, and 95th)) were calculated as unadjusted urine values (ng/mL) by analyte.
Unadjusted urine values were used in all statistical analyses. Creatinine-adjusted urine values
were not used as this common correction method for variable dilutions in spot urine samples is
probably not a reliable method for young children (O’Rourke et al., 2000; Barr et al., 2005).
Each child’s consumption frequency for the 65 specific food items was computed on a
weekly basis. Based on the children’s weekly food habits, they were then placed into either a low
food intake group (< 3 times per week) or a high food intake group (> 3 times per week) for each
food item. A total of 31 food items were excluded because they were not commonly consumed
by either intake group (< 20 children for both states or < 10 children for Ohio [3-PBA, only]).
The distribution of the metabolite concentrations of TCP, 3-PBA and 2,4-D were first
examined for normality. Based on a normality plot and the Kolmogorv Smirnov test, the data
from all three distributions were found to be non-normal. For this reason, both the arithmetric
and geometric means were presented in the descriptive analysis for comparison. Although these
data are non-normal, the standard t-test was used based on the central limit theorem (CLT), a
well-established and commonly used statistical principle. For a large sample size n, the CLT
indicates that the means of the samples from a population with finite variance approach a normal
distribution even if the underlying distribution of the individual observations (xi’s) in the
population is not normal. Therefore, a more robust two-sample t-test was used to determine
8
whether statistically significant differences existed between the children’s weekly food habits for
34 specific food items and their urinary TCP, 3-PBA, or 2,4-D concentrations by intake group.
In addition, a multivariate analysis was used to examine the impact of selected covariates
(gender, body weight, and recent residential pesticide-use) on the relationship between a food
item found to be statistically significant and urinary biomarker concentrations. All statistical
analyses were performed using SAS version 9.1 (SAS, Cary, North Carolina).
3. Results
3.1 Demographics
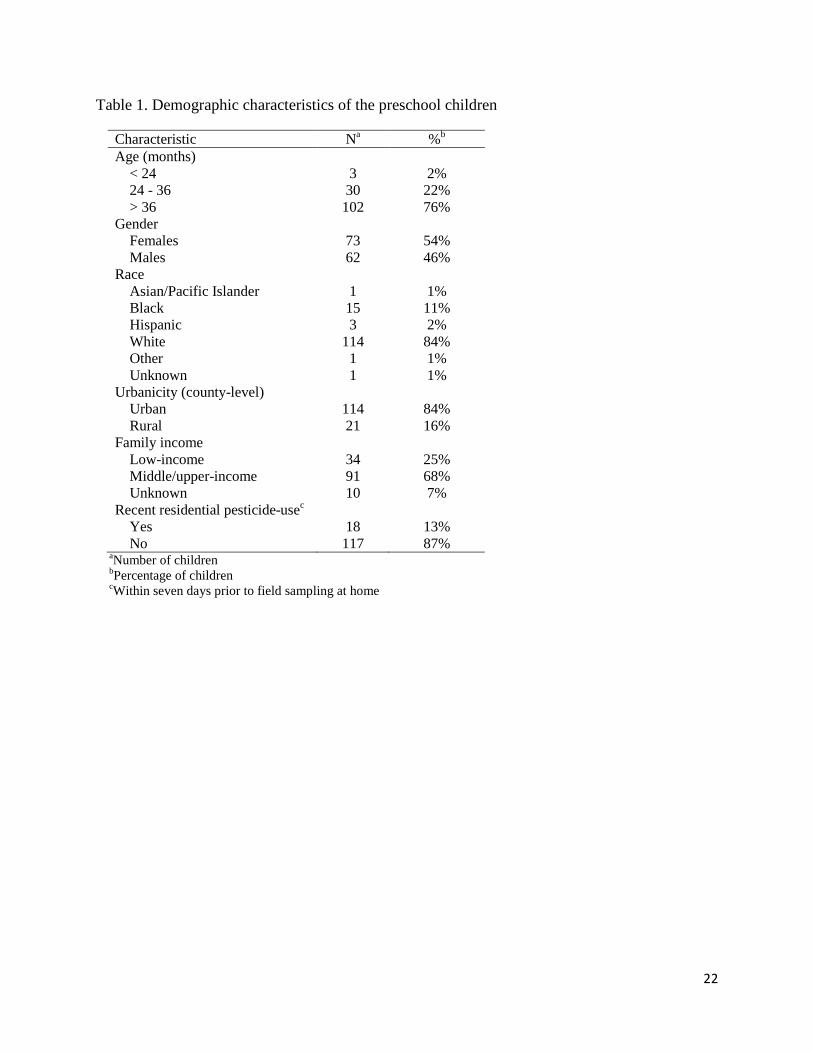
Table 1 presents the demographic characteristics for the 135 stay-at-home children from
North Carolina and Ohio. The preschool children’s ages ranged from 20 to 67 months and 75%
of them were between the ages of 37 and 67 months. Of these children, 54% were female and
46% were male. The children’s median body weight was 16.2 kg, and their weights ranged from
10.4 to 44.1 kg. The majority of the children were white (84%), resided in urban areas (84%),
and came from middle/upper-income families (68%). A total of 18 households had a recent
application of a pesticide occurring at their residence within seven days of field sampling. Of
these residences, four homeowners reported using a product containing either chlorpyrifos,
permethrin, or 2,4-D. In North Carolina, one homeowner sprayed permethrin using an aerosol
can in their kitchen to control for cockroaches, and another owner applied chlorpyrifos granules
with a broadcast spreader to their yard to control a variety of insect pests. In Ohio, one
homeowner sprayed chlorpyrifos using an aerosol can in the garage to control ants, and a second
one applied 2,4-D granules with a broadcast spreader to their landscaping and garden to control
for weeds.
9
3.2 Weekly food consumption patterns
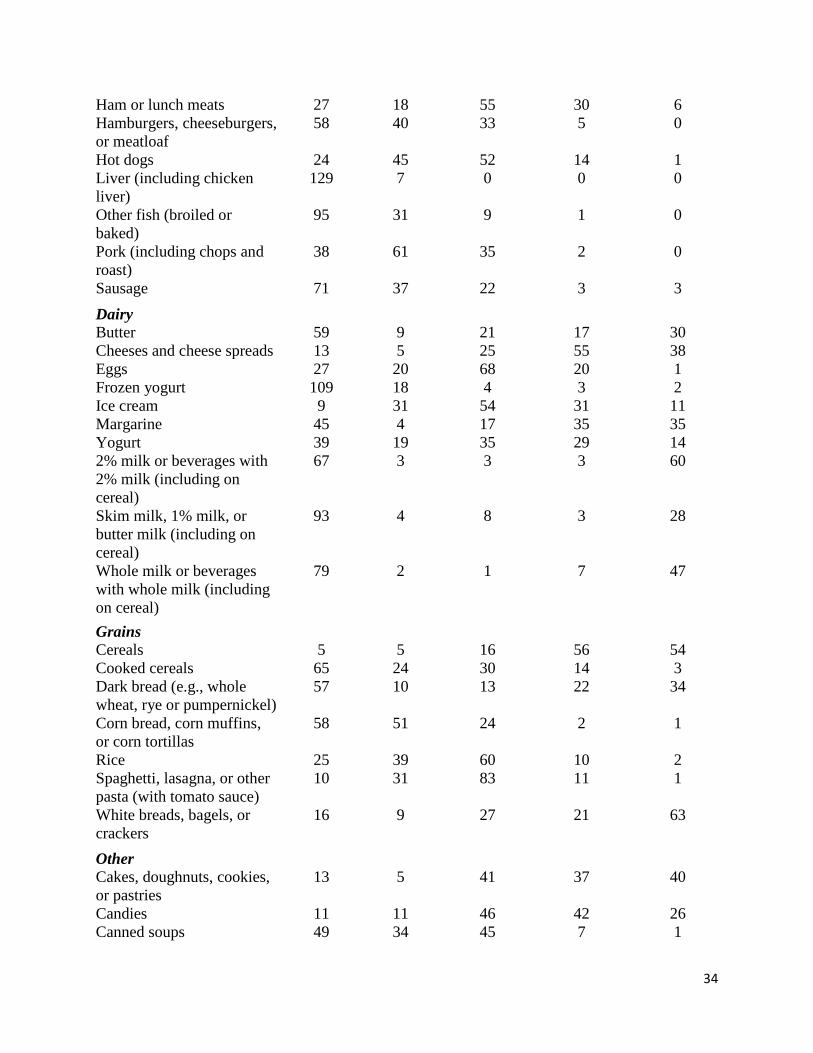
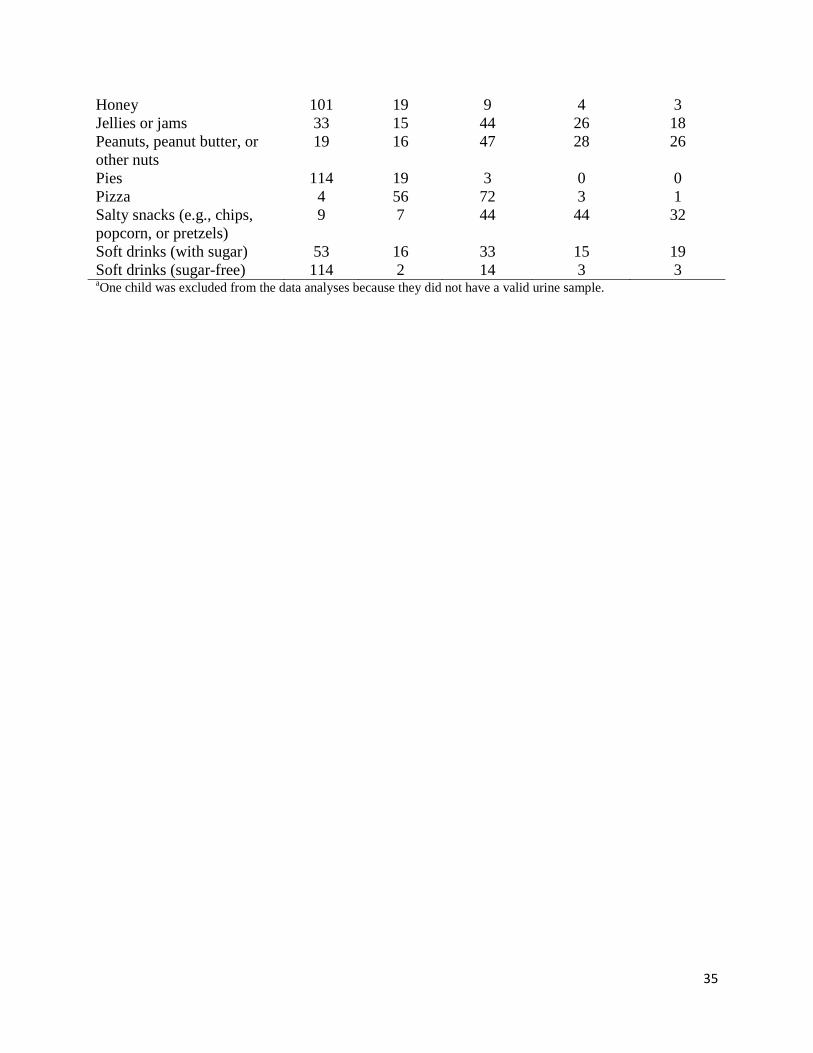
The weekly consumption of specific food items by the preschool children is presented in
Supplemental Table S-1. In this cohort, apples, bananas, carrots, grapes, and potatoes were the
most frequently eaten (> 3 times a week) fresh fruits and vegetables. For meats, the top ones
consumed three or more times a week by the children were chicken/turkey (baked, stewed,
roasted, or broiled) and ham/lunch meats. Cheeses/cheese spreads, butter, margarine, and milk
(2% and whole) were the most often consumed dairy products. Rarely or never eaten food items
among the children were melons, grapefruits, oranges/tangerines, peaches/nectarines, pears,
broccoli, cabbage, cauliflower, corn, greens/spinach, bacon, beef steak/roasts, beef stew/pot pie,
fried chicken, fried fish/fish sandwich, other fish, hamburgers, hotdogs, liver, pork, sausage,
frozen yogurt, cooked cereals, corn bread/muffins, rice, spaghetti/lasagna, canned soups, honey,
pies, pizza, and sugar-free soft drinks.
3.3 Urinary biomarker concentrations
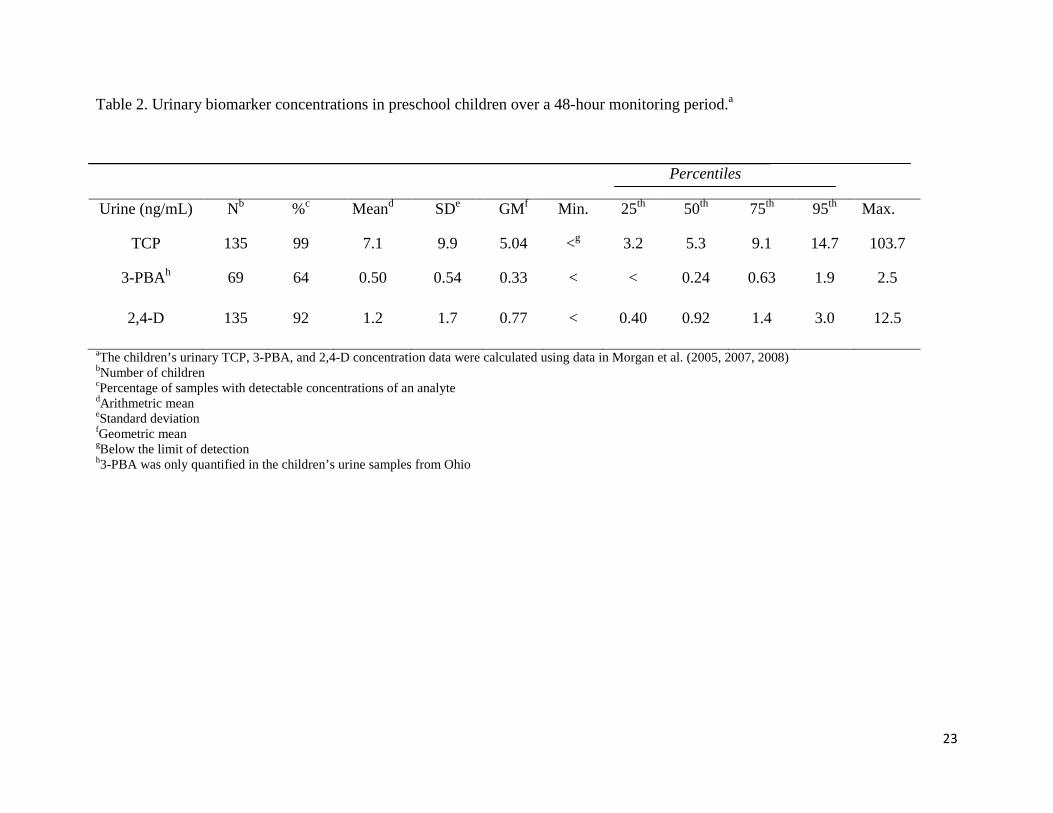
Table 2 presents the biomarker concentrations that were measured in the children’s urine
samples. TCP, 3-PBA (Ohio, only), and 2,4-D were detected in 99%, 64%, and 92% of the urine
samples, respectively. The children’s median urinary concentrations were 5.3 ng/mL for TCP,
0.24 ng/mL for 3-PBA, and 0.92 ng/mL for 2,4-D. The median level of TCP was at least 5.5
times greater than median levels of 3-PBA or 2,4-D in the children’s urine samples. The two
children that had a recent pesticide application of chlorpyrifos at their homes had mean urinary
TCP concentrations of 1.5±1.1 ng/mL (range, <LOD-3.30 ng/mL) and 11.0±8.1 ng/mL (range,
4.3-25.3 ng/mL). For the latter child who had this insecticide applied in their garage, two of
their spot urine samples had TCP concentrations (15.2 ng/mL and 25.4 ng/mL) that were greater
10
than the 95th percentile. In addition, the child that had a recent outdoor application of 2,4-D at
their home had a mean urinary concentration of 0.66±0.38 ng/mL for this herbicide, and all of
their spot urine measurements (range, 0.22-1.26 ng/mL) were below the 75th percentile.
3.4 Association between food habits and urinary biomarker concentrations
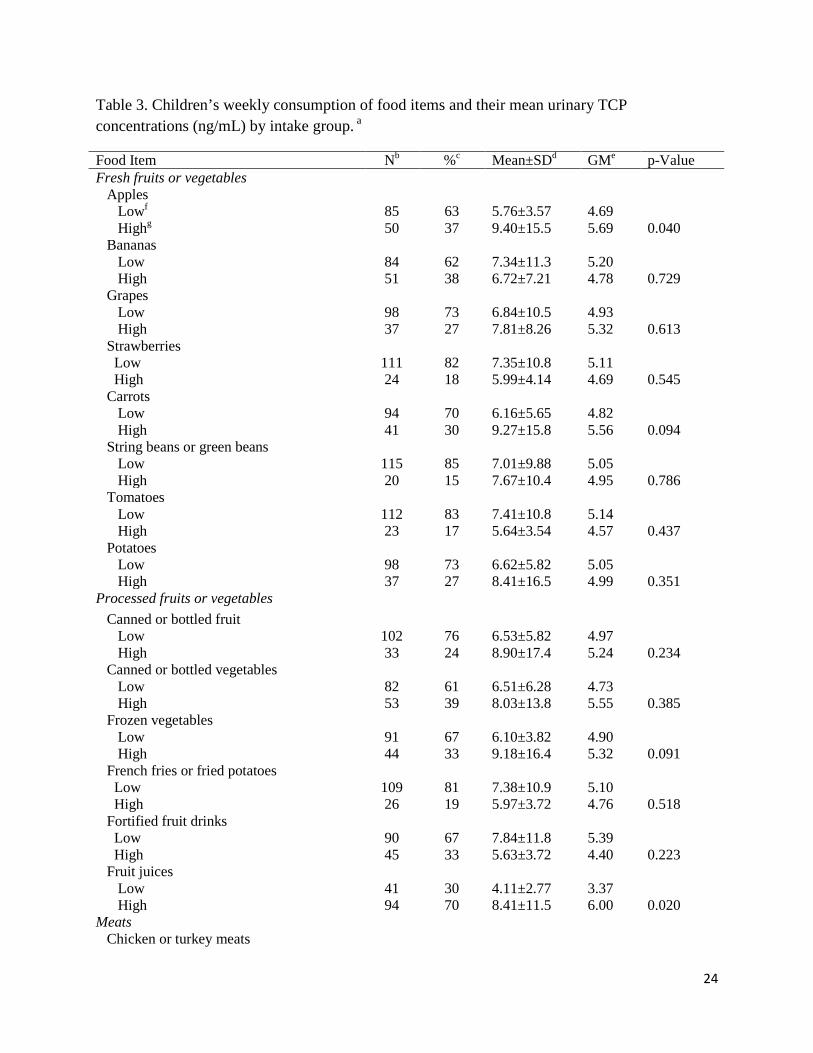
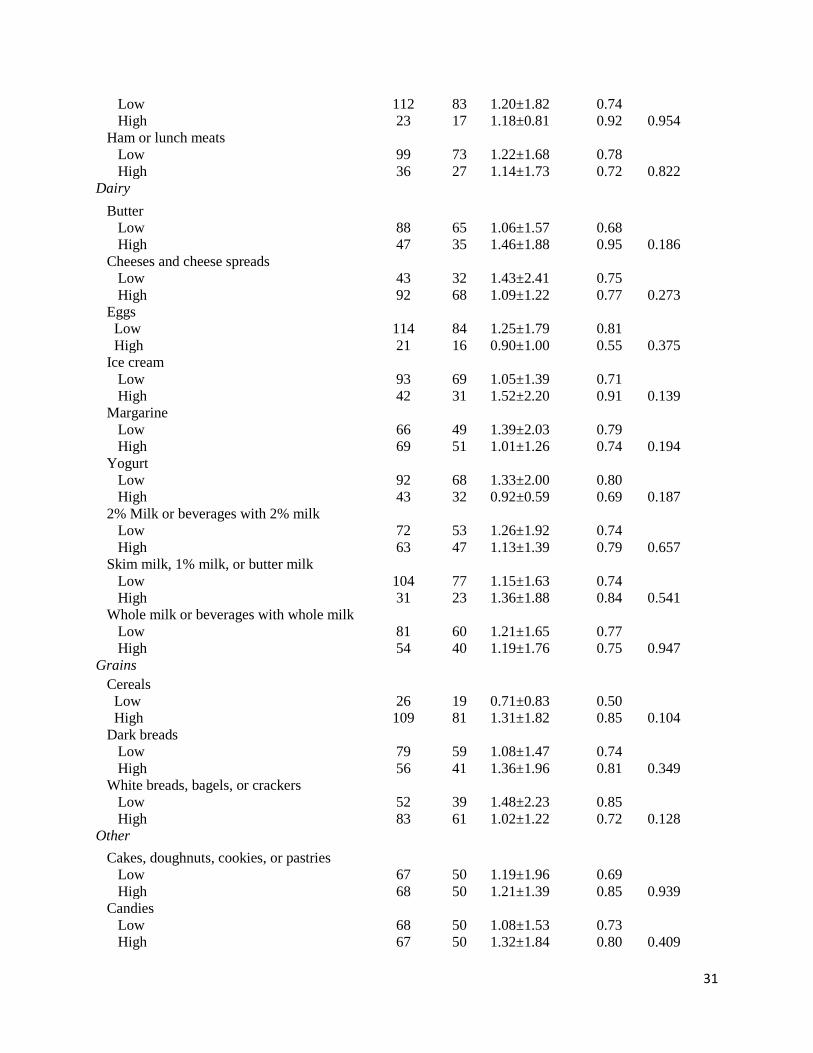
Tables 3, 4, and 5 present the association (i.e., differences between mean groups) between
the consumption of a food item and urinary biomarker concentrations for TCP, 3-PBA, and 2,4-
D, respectively, by intake group. Mean urinary TCP concentrations were statistically
significantly higher in children consuming fresh apples (9.40±15.5 ng/mL versus 5.76±3.57
ng/mL, p=0.040) and fruit juices (8.41±11.5 ng/mL versus 4.11±2.77 ng/mL, p=0.020) three or
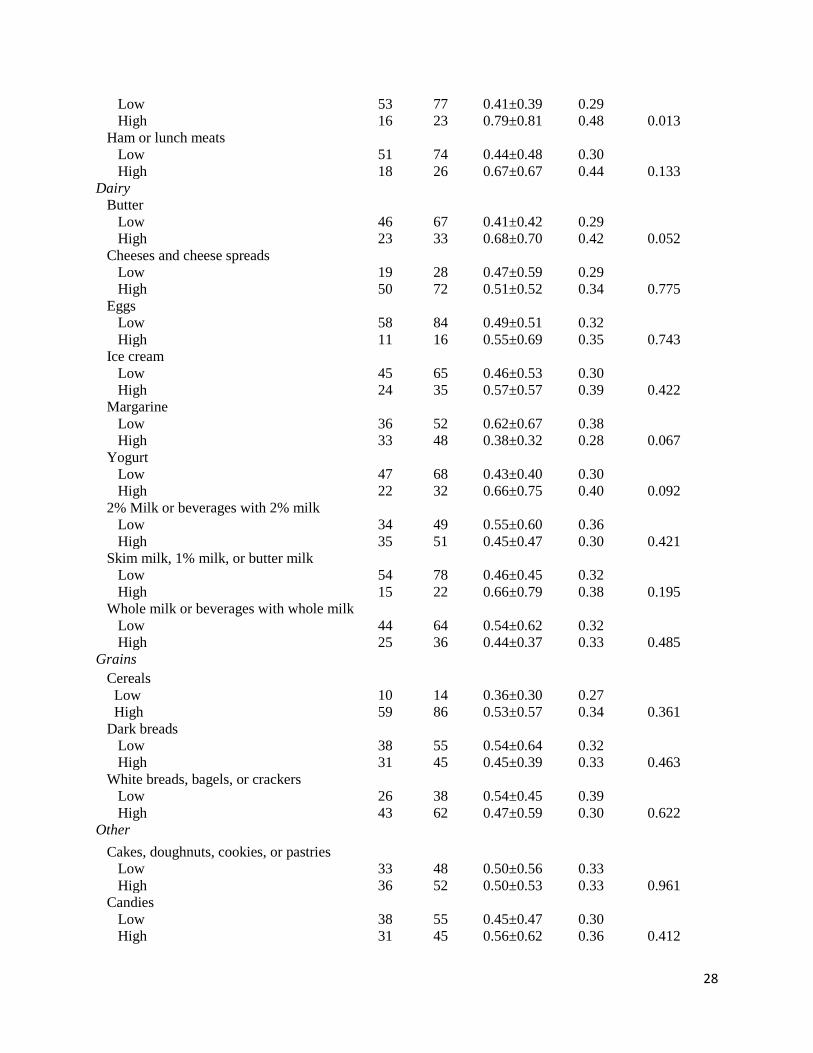
more times a week compared to less than three times a week. For 3-PBA, mean urinary
metabolite concentrations were statistically significantly greater in children consuming
chicken/turkey meats (0.79±0.81 versus 0.41±0.39, p=0.013) > 3 times a week compared to < 3
times a week; while mean urinary 3-PBA concentrations were marginally significant for those
consuming butter (0.68±0.70 ng/mL versus 0.41±0.42, p=0.052) or fresh apples (0.65±0.71
versus 0.40±0.37, p=0.058). No association existed between the consumption of any food item
and mean urinary 2,4-D concentrations by intake group. In our multivariate analyses after
adjusting for gender, body weight, and recent residential pesticide application, all covariates
were non-significant, except gender (p=0.034) in which fresh apple consumption was the main
effect variable on the children’s mean urinary TCP concentrations.
4. Discussion
4.1 Children’s food consumption habits
11
Research has shown that children’s diets can vary greatly by life stage (i.e., infant, toddlers,
preschoolers, and adolescence) and among children of similar age bins (Hubal et al., 2000). Few
studies have investigated the food consumption habits of preschool children, particularly over
time in the US (Kranz et al., 2004; Reedy and Krebs-Smith, 2010; Ford et al., 2013). From 2003-
2006, Reedy and Krebs-Smith (2010) reported that foods substantially contributing to the caloric
intake of US children, ages 24-36 months, were whole and reduced fat milks, fruit juices (100%),
pastas, and desserts (e.g., cakes, cookies, donuts, and pies). In our analyses, the top food items
frequently eaten (> 5 times a week) by the preschool children between 2000-2001 were fruit
juices (100%), 2% and whole milk, cereals, white breads/bagels/crackers, and cakes/doughnuts/
cookies/pastries. In addition, Ford et al. (2013) recently reported that there has been a significant
increase in the per capita intake of foods high in added sugars, salt, and solid fats (i.e., sweet and
salty snacks, candy, pizzas, calzones, cheeses, and fruit juices) among children, ages 24-72
months of age, from 1989 to 2008 in the US. This is also supported by research conducted by
Kranz et al. (2004) that showed that there was a marked increase in the dietary consumption of
added sugars and fruit juices among US preschool children between 1977 and 1998. As dietary
habits have changed over time in the US, more research is necessary to understand young
children’s food consumption patterns and how these patterns impact their exposures to pesticides
and to other chemicals today.
4.2 Diet as a source of exposure to pesticides
The diet is a major source of children’s exposure to a number of current-use pesticides
including chlorpyrifos, permethrin, and 2,4-D (NRC, 1993; Morgan et al., 2004; Lu et al., 2006).
It is suspected that only a portion of the foods eaten by children on a daily basis actually contain

12
pesticide residues. However, little information exists on the pesticide levels in the actual foods
and beverages consumed by children. In the US, only two studies have quantified the levels of
some pesticide residues in individual food items consumed by children (Fenske et al., 2002; Lu
et al., 2010). In 1998, Fenske et al. (2002) measured the levels of 15 different organophosphorus
pesticides in a small number of foods and beverages consumed over a 24-hour period by 13
preschool children, ages 2-5 years old, in the state of Washington. Up to six different
organophosphates were detected in fresh produce, beverage, and/or processed food samples, but
none of them in dairy samples. Chlorpyrifos residues were found in one child’s cherry tomato
sample at 350 ng/g, which was the highest pesticide level measured in any food sample.
Recently, Lu et al. (2010) quantified the levels of several different organophosphorus and
pyrethroid pesticides in 24-hour duplicate diet samples consisting of all consumed fruits,
vegetables, and fruit juices of 46 children, ages 3-11 years old, from the states of Georgia and
Washington. A total of 11 different organophosphates (range, 1-387 ng/g) and three different
pyrethroids (range, 2-1,133 ng/g) were found in the food samples (Lu et al., 2010). In
individually analyzed food items, chlorpyrifos residues were measureable in a child’s orange
juice sample (1 ng/g) and fresh orange sample (3 ng/g). Permethrin residues were also present in
a child’s cooked broccoli sample (82 ng/g) and fresh apple sample (4 ng/g). In addition, Lu et al.
(2010) conducted a market basket analysis of fresh fruits and vegetables frequently eaten by the
study children at a local grocery store in Washington state. Chlorpyrifos residues were found in
samples of grapes (22 ng/g), nectarines (1 ng/g), and strawberries (363 ng/g), however, no foods
contained detectable levels of permethrin residues. This above research suggests that pesticide
levels in agricultural foods are variable and are likely impacted by factors such as usage patterns,
seasonality, weather conditions, geographical region, and peeling or prewashing fruits and

13
vegetables prior to consumption (Kimata et al, 2009; Lu et al., 2010). As young children have a
less varied diet, particularly consuming more fruits and vegetables based on their body size, they
are likely exposed to higher amounts of pesticide residues in foods they eat than older children
and adults (Hubal et al., 2000). More research is needed to quantify the levels of pesticide
residues in food items that children eat as certain ones likely contribute to the majority of their
dietary exposures to current-use pesticides.
4.3 Children’s estimated intake doses of the pesticides
Assuming steady state absorption, the preschool children’s estimated maximum aggregate
intake doses to chlorpyrifos, permethrin, and 2,4-D were 2.32, 0.056, and 0.28 ug/kg/day,
respectively. The children’s intake doses were calculated by multiplying the highest urinary
concentration of each metabolite in Table 2 by an estimated daily urine excretion rate (22.4
mL/kg body weight) for a child (Miller and Stapleton, 1989; Szabo and Fegyverneki, 1995). The
children’s exposure levels to permethrin and 2,4-D were 893 and 36 times lower than the
established oral reference doses of 50 ug/kg/day and 10 ug/kg/day, respectively, in the US EPA’s
Integrated Risk Information System (IRIS) (IRIS, 2013). For chlorpyrifos, there is currently no
oral reference dose available in IRIS. However as a protective measure in 2001, the US EPA
phased out almost all residential uses of chlorpyrifos to greatly reduce children’s potential
exposures and possible health risks to this insecticide (US EPA, 2002).
4.4 Association between food consumption habits and urinary biomarker concentrations
A limited number of published studies have assessed the relationship between food
consumption habits and urinary biomarker concentrations of pesticide in children or adults

14
(Kieszak et al., 2002; Riederer et al., 2008; Kimata et al., 2009; Munoz-Quezada et al., 2012;
Fortes et al., 2013). Kieszak et al. (2002) reported that no association existed between the self-
reported monthly consumption of fruits, vegetables, or bread products and urinary pesticide
biomarker concentrations, including TCP, for 978 adults from the Third US National Health and
Nutritional Examination Survey 1988-1994. However, the authors stated that the lack of
association between food consumption habits and urinary biomarker levels in adults were likely
due more to the limitations of the study data (i.e., frequency of intake). In a later Survey (1999-
2002), Riederer et al. (2008) showed that diet was a significant predictor of urinary
concentrations of 3-PBA in pre-adolescents (6-10 years old), adolescents (11-18 years old), and
adults. In particular for 179 preadolescents, the consumption of cheese, cookies, ground beef, ice
cream, tortilla chips, and white bread were statistically significantly (p<0.05) associated with
urinary 3-PBA concentrations. The authors, however, reported that gender, body mass index,
and residential pesticide-use were not significantly associated with the children’s urinary levels
of 3-PBA. Recently, Fortes et al. (2013) reported that a higher intake of fresh and cooked
vegetables greater than five times a week were significantly (p<0.05) associated with higher
mean urinary 3-PBA concentrations in 55 adults from Italy, and this association was not
impacted by age, sex, body mass index, or household insecticide use. In our study, results
showed that consumption of chicken/turkey meats and butter more than three times a week were
significantly (p<0.05) associated with higher mean urinary 3-PBA concentrations in preschool
children. We also showed similar results as Riederer et al. (2008) that gender and body weight of
children and recent residential pesticide-use were not major factors influencing urinary 3-PBA
concentrations. Lastly, Munoz-Quezada et al. (2012) reported that consumption of fruits
containing chlorpyrifos residues was a significant dietary predictor of urinary (dialkylphosphate)

15
metabolite concentrations in 190 children, ages 6-12 years old, from Chile. This is in agreement
with our study that also showed that the frequent consumption of fruits (apples and juices) were
significantly associated with higher urinary TCP concentrations in children which suggested that
some of their consumed fruit items likely contain measureable levels of chlorpyrifos.
4.5 Limitations of the study data
The study data had several limitations. The food frequency consumption data were based on
the children’s normal weekly eating habits for 65 specific food items over the past year and may
not reflect the actual food items they ate over the 48-hour monitoring period. In addition, no
diary data were collected on the weight or volume of individual food items typically consumed
by the children on a daily or weekly basis. The amount of solid or liquid food items consumed by
a child over time would likely impact their exposure levels to pesticides and resulting urinary
biomarker concentrations. Lastly as most of the children (87%) had one spot urine measurement,
the temporal association between the children’s food consumption habits and urinary pesticide
biomarker concentrations could not be determined.
5. Conclusions
Urinary biomarker data showed that the majority of the preschool children were exposed to
chlorpyrifos, permethrin, and 2,4-D at their homes during the 48-hour monitoring period. The
frequency of consumption of fresh apples and fruit juices or chicken/turkey meats were
confirmed to strongly predict the urinary concentrations of TCP or 3-PBA, respectively, in the
children. However, no association was found between the consumption of any food item and
children’s urinary 2,4-D levels by intake group.

16
Conflict of Interest
The authors declare that there are no conflicts of interest.
Disclaimer
“This United States Environmental Protection Agency through its Office of Research and
Development has provided administrative review of this article and approved it for publication.”
References
Arbuckle T., Ritter, L., 2005. Phenoxyacetic acid herbicide exposure for women on Ontario
farms. J. Toxicol. Environ. Health A 68, 1359-1370.
Barr, D.B., Wilder, L.C., Caudill, S.P., Gonzalez, A.J., Needham, L.L., Pirkle, J.L., 2005.
Urinary creatinine concentrations in the U.S. Population: Implications for urinary biologic
monitoring measurements. Environ. Health Perspect. 113, 192-200.
Bradman, A., Whitaker, D., Quiros, L., Castorina, R., Henn, C., Nishioka, M., Morgan, J., Barr,
D, Harnly, M., Brisbin, J., Sheldon, L., McKone, T., and Eskenazi, B., 2007. Pesticides and their
metabolites in the homes and urine of farmworker children living in the Salinas Valley, CA. J.
Expo. Sci. Environ. Epidemiol. 17, 331-349.
Centers for Disease Control and Prevention (CDC), 2009. Fourth national report on human
exposure to environmental chemicals. 2009. http://www.cdc.gov/exposurereport (accessed
February 20, 2013).

17
Chuang, J.C., Wilson, N.K., 2011. Multiresidue analysis of organophosphate and pyrethroid
pesticides in duplicate-diet solid food by pressurized liquid extraction. J. Environ. Sci. Heal. B.
46, 41-50.
Clayton, C.A., Pellizzari, E.D., Whitmore, R.W., Quackenboss, J.J., Adgate, J., Sefton, K., 2003.
Distributions, associations, and partial aggregate exposure of pesticides and polynuclear aromatic
hydrocarbons in the Minnesota Children’s Pesticide Exposure Study (MNCPES). J. Expo. Anal.
Environ. Epidemiol. 13, 100-111.
Dow AgroSciences, 2013. Chlorpyrifos protects: Benefits and uses by crops.
http://www.chlorpyrifos.com/benefits_uses.htm (accessed February 27, 2013).
Ford, C.N, Slining, M.M., Popkin, B.M., 2013. Trends in dietary intake among US 2- to 6-year-
old children, 1989-2008. J. Acad. Nutr. Diet. 113, 35-42.
Food and Drug Administration (FDA), 2013. FDA’s Total Diet Study – Monitoring U.S. food
supply safety. 2013. http://www.fda.gov/Food/FoodSafety/FoodContaminantsAdulteration-
/TotalDietStudy/default.htm. (accessed February 27, 2013).
Fortes, C., Mastroeni, S., Pilla, M.A., Antonelli, G., Lunghini, L., Aprea, C., 2013. The relation
between dietary habits and uninary levels of 3-phenoxybenzoic acid, a pyrethroid metabolite.
Food Chem. Toxicol. 52, 91-96.
Hubal, E.A., Sheldon, L.S., Burke, J.M., McCurdy, T.R., Berry, M.R., Rigas, M.L., Zartarian,
V.G., Freeman, N.G., 2000. Children’s exposure assessment: A review of factors influencing
children’s exposure, and the data available to characterize and assess that exposure. Environ.
Health Perspect. 108, 475-486.
18
Integrated Risk Information System (IRIS), 2013. U.S. EPA’s Integrated Risk Information
System Homepage. http://www.epa.gov/IRIS/ (accessed July 10, 2013).
Katz, J.M., Winter, C.K., 2009. Comparison of pesticide exposure from consumption of
domestic and imported fruits and vegetables. Food Chem. Toxicol. 47, 335-338.
Kieszak, S.M., Naeher, L.P., Rubin, C.S., Needham, L.L., Backer, L., Barr, D., McGeehin, M.,
2002. Investigation of the relation between self-reported food consumption and household
chemical exposures with urinary levels of selected nonpersistent pesticides. J. Expo. Sci.
Environ. Epidemiol. 12, 404-408.
Kimata, A., Takaaki, K., Ueyama, J., Yamamoto, K., Kamijima, M., Suzuki, K., Inoue, T., Ito,
Y., Hamajima, N., 2009. Relationship between dietary habits and urinary concentrations of 3-
phenoxybenzoic acid in a middle-aged and elderly general population in Japan. Environ. Health
Prev. Med. 14, 173-179.
Kranz, S., Siega-Riz, A.M., Herring, A.H., 2004. Changes in diet quality of American
preschoolers between 1977 and 1998. Am. J. Public Health. 94: 1525-1530.
Lu, C., Toepei, K., Irish, R., Fenske, R., Barr, D., Bravo, R., 2006. Organic diets significantly
lower children’s dietary exposure to organophosphorus pesticides. Environ. Health Perspect.
114, 260-263.
Lu, C., Schenck, F.J., Pearson, M.A., Wong, J.W., 2010. Assessing children’s dietary pesticide
exposure: Direct measurement of pesticide residues in 24-hr duplicate food samples. Environ.
Health Perspect. 118, 1625-1630.

19
Miller L.A., Stapleton F.B., 1989. Urinary volume in children with urolithiasis. J. Urol. 141(4): 918–920. Morgan, M., Sheldon, L., Croghan, C., Chuang, J., Lordo, R., Wilson, N., Lyu, C., Brinkman,
M., Morse, N., Chou, Y., Hamilton, C., Finegold, J., Hand, K., Gordon, S., 2004. A pilot study
of children’s total exposure to persistent pesticides and other persistent organic pollutants
(CTEPP). EPA/600/R-041/193.
Morgan, M., Sheldon, L., Croghan, C., Jones, P., Robertson, G., Chuang, J., Wilson, N., Lyu, C.,
2005. Exposures of preschool children to chlorpyrifos and its degradation product 3,5,6-
trichloro-2-pyridinol in their everyday environments. J. Expo. Anal. Environ. Epidemiol. 15,
297-309.
Morgan, M., Sheldon, L., Croghan, C., Jones, P., Chuang, J., Wilson N., 2007. An observational
study of 127 preschool children at their homes and daycare centers in Ohio: Environmental
pathways to cis- and trans-permethrin exposure. Environ. Res. 104, 266-274.
Morgan, M., Sheldon, L., Thomas, K., Egeghy, P., Croghan, C., Jones, P., Chuang, J., Wilson,
N., 2008. Adult and children’s exposure to 2,4-D from multiple sources and pathways. J. Expo.
Anal. Environ. Epidemiol. 18, 486-494.
Munoz-Quezada, M.T., Iglesias, V., Lucero, B., Steenland, K., Boyd Barr, D., Levy, K., Ryan,
P.B., Alvarado, S., Concha, C., 2012. Predictors of exposure to organophosphate pesticides in
school children in the Province of Talca, Chile. Environ. Int. 47, 28-36.
National Resource Council (NRC), 1993. Pesticides in the diets of infants and children.
Washington, DC: National Academy Press.
20
O’Rourke, M.K., Lizardi, P.S., Rogan, S.P., Freeman, N.C., Aguierre, A., Saint, C.G., 2000.
Pesticide exposure and creatinine variation among young children. J. Expo. Anal. Environ.
Epidemiol. 10, 672-681.
Reedy, J., Krebs-Smith, S.M., 2010. Dietary sources of energy, solid fats, and added sugars
among children and adolescents in the United States. J. Am. Diet Assoc. 110, 1477-1484.
Riederer, A.M., Bartell, S.M., Barr, D.B., Ryan, B.P., 2008. Diet and nondiet predictors of
urinary 3-phenoxybenzoic acid in NHANES 1999-2002. Environ. Health Perspect. 116, 1015-
1022.
Sauerhoff, M.W., Braun, W.H., Blau, G.E., Gehring, P.J., 1977. The fate of 2,4-dichlorophenoxy
acetic acid (2,4-D) following oral administration to man. Toxicology 8, 3-11.
Szabo, L., Fegyverneki, S., 1995. Maximum and average urine flow rates in normal children— the Miskolc nomograms. Br. J. Urol. 76 (1), 16–20.
Tulve, N.S., Egeghy, P.P., Fortmann, R.C., Whitaker, D.A., Nishioka, M.G., Naeher, L.P.,
Hilliard, A., 2008. Multimedia measurements and activity patterns in an observational pilot study
of nine young children. J. Expo. Sci. Environ. Epidemiol. 18, 31-44.
United States Environmental Protection Agency (US EPA), 2002. Chlorpyrifos facts.
http://www.epa.gov/oppsrrd1/REDs/factsheets/chlorpyrifos_fs.htm (accessed February 20,
2013).
United States Environmental Protection Agency (US EPA), 2005. 2,4-D RED facts.
http://www.epa.gov/oppsrrd1/REDs/factsheets/24d_fs.htm. (accessed February 20, 2013).

21
United States Environmental Protection Agency (US EPA), 2007. Reregistration eligibility
decision (RED) for permethrin. EPA/738/R-06/07. (accessed February 20, 2013).
Wilson, N.K., Chuang, J.C., Lyu, C., Menton, R., Morgan, M.K., 2003. Aggregate exposures of
nine preschool children to persistent organic pollutants at day care and at home. J. Expo. Anal.
Environ. Epidemiol. 13, 187-202.
Wilson N.K., Chuang J.C., Iachan R., Lyu C., Gordon S., Morgan M.K, Ozkaynak H., and
Sheldon L.S., 2004. Design and sampling methodology for a large study of preschool children’s
aggregate exposures to persistent organic pollutants in their everyday environments. J. Expo.
Anal. Environ. Epidemiol. 14, 260-274.
Wilson, N.K., Strauss, W.J., Iroz-Elardo, N., and Chuang, J.C., 2010. Exposures of preschool
children to chlorpyrifos, diazinon, pentachlorophenol, and 2,4-dichlorophenoxyacetic acetic over
3 years from 2003-2005: A longitudinal model. J. Expo. Sci. Environ. Epidemiol. 20, 546-558.
22
Table 1. Demographic characteristics of the preschool children
Characteristic Na %b Age (months) < 24 24 - 36 > 36
3
30 102
2%
22% 76%
Gender Females Males
73 62
54% 46%
Race Asian/Pacific Islander Black Hispanic White Other Unknown
1
15 3
114 1 1
1%
11% 2%
84% 1% 1%
Urbanicity (county-level) Urban Rural
114 21
84% 16%
Family income Low-income Middle/upper-income Unknown
34 91 10
25% 68% 7%
Recent residential pesticide-usec Yes No
18
117
13% 87%
aNumber of children bPercentage of children cWithin seven days prior to field sampling at home
23
Table 2. Urinary biomarker concentrations in preschool children over a 48-hour monitoring period.a
Percentiles
Urine (ng/mL) Nb %c Meand SDe GMf Min. 25th 50th 75th 95th Max.
TCP 135 99 7.1 9.9 5.04 <g 3.2 5.3 9.1 14.7 103.7
3-PBAh 69 64 0.50 0.54 0.33 < < 0.24 0.63 1.9 2.5
2,4-D 135 92 1.2 1.7 0.77 < 0.40 0.92 1.4 3.0 12.5
aThe children’s urinary TCP, 3-PBA, and 2,4-D concentration data were calculated using data in Morgan et al. (2005, 2007, 2008) bNumber of children cPercentage of samples with detectable concentrations of an analyte dArithmetric mean eStandard deviation fGeometric mean gBelow the limit of detection h3-PBA was only quantified in the children’s urine samples from Ohio
24
Table 3. Children’s weekly consumption of food items and their mean urinary TCP concentrations (ng/mL) by intake group. a
Food Item Nb %c Mean±SDd GMe p-Value Fresh fruits or vegetables Apples Lowf Highg
85 50
63 37
5.76±3.57 9.40±15.5
4.69 5.69
0.040
Bananas Low High
84 51
62 38
7.34±11.3 6.72±7.21
5.20 4.78
0.729
Grapes Low High
98 37
73 27
6.84±10.5 7.81±8.26
4.93 5.32
0.613
Strawberries Low High
111 24
82 18
7.35±10.8 5.99±4.14
5.11 4.69
0.545
Carrots Low High
94 41
70 30
6.16±5.65 9.27±15.8
4.82 5.56
0.094
String beans or green beans Low High
115 20
85 15
7.01±9.88 7.67±10.4
5.05 4.95
0.786
Tomatoes Low High
112 23
83 17
7.41±10.8 5.64±3.54
5.14 4.57
0.437
Potatoes Low High
98 37
73 27
6.62±5.82 8.41±16.5
5.05 4.99
0.351
Processed fruits or vegetables Canned or bottled fruit Low High
102 33
76 24
6.53±5.82 8.90±17.4
4.97 5.24
0.234
Canned or bottled vegetables Low High
82 53
61 39
6.51±6.28 8.03±13.8
4.73 5.55
0.385
Frozen vegetables Low High
91 44
67 33
6.10±3.82 9.18±16.4
4.90 5.32
0.091
French fries or fried potatoes Low High
109 26
81 19
7.38±10.9 5.97±3.72
5.10 4.76
0.518
Fortified fruit drinks Low High
90 45
67 33
7.84±11.8 5.63±3.72
5.39 4.40
0.223
Fruit juices Low High
41 94
30 70
4.11±2.77 8.41±11.5
3.37 6.00
0.020
Meats Chicken or turkey meats

25
Low High
112 23
83 17
7.22±10.8 6.54±3.89
4.98 5.33
0.763
Ham or lunch meats Low High
99 36
73 27
7.51±11.4 5.99±3.74
5.09 4.88
0.435
Dairy Butter Low High
88 47
65 35
6.91±11.1 7.47±7.27
4.77 5.58
0.758
Cheeses and cheese spreads Low High
43 92
32 68
7.61±15.4 6.87±5.96
4.50 5.31
0.691
Eggs Low High
114 21
84 16
7.56±10.7 4.63±2.94
5.33 3.69
0.214
Ice cream Low High
93 42
69 31
6.41±5.92 8.65±15.5
4.78 5.65
0.225
Margarine Low High
66 69
49 51
5.89±6.54 8.27±12.3
4.22 5.96
0.165
Yogurt Low High
92 43
68 32
7.64±11.8 5.96±3.45
5.10 4.90
0.361
2% Milk or beverages with 2% milk Low High
72 63
53 47
7.71±13.2 6.41±3.47
4.73 5.41
0.450
Skim milk, 1% milk, or butter milk Low High
104 31
77 23
7.25±11.1 6.62±4.26
5.01 5.13
0.755
Whole milk or beverages with whole milk Low High
81 54
60 40
6.98±6.08 7.30±13.9
5.39 4.55
0.858
Grains Cereals Low High
26 109
19 81
4.16±2.42 7.81±10.9
3.35 5.55
0.093
Dark breads Low High
79 56
59 41
7.09±11.6 7.12±7.08
4.97 5.12
0.986
White breads, bagels, or crackers Low High
52 83
39 61
6.33±7.21 7.59±11.3
4.30 5.56
0.475
Other Cakes, doughnuts, cookies, or pastries Low High
67 68
50 50
7.31±13.5 6.91±4.05
4.39 5.77
0.816
Candies Low High
68 67
50 50
6.26±6.50 7.97±12.5
4.57 5.56
0.320

26
Jellies and jams Low High
91 44
67 33
6.20±5.88 8.98±15.1
4.65 5.94
0.128
Peanuts, peanut butter, or other nuts Low High
81 54
60 40
7.40±12.4 6.66±3.95
4.84 5.35
0.671
Salty snacks Low High
59 76
44 56
6.73±6.98 7.40±11.8
4.83 5.20
0.698
Soft drinks (with sugar) Low High
101 34
75 25
6.56±5.79 8.74±17.2
4.98 5.20
0.268
aTCP was quantified in the urine samples of 135 stay-at-home children in North Carolina and Ohio bNumber of children cPercentage of children dArithmetric mean and standard deviation eGeometric mean fLow equals the group of children that typically consumed a food item < 3 times per week gHigh equals the group of children that typically consumed a food item > 3 times or greater per week

27
Table 4. Children’s weekly consumption of food items and their mean urinary 3-PBA concentrations (ng/mL) by intake group.a
Food Item Nb %c Mean±SDd GMe p-Value Fresh fruits or vegetables Apples Lowf Highg
42 27
61 39
0.40±0.37 0.65±0.71
0.29 0.40
0.058
Bananas Low High
41 28
59 41
0.44±0.43 0.59±0.67
0.31 0.37
0.276
Grapes Low High
49 20
71 29
0.47±0.50 0.57±0.63
0.32 0.36
0.515
Strawberries Low High
56 13
81 19
0.50±0.54 0.50±0.55
0.33 0.32
0.991
Carrots Low High
43 26
62 38
0.51±0.55 0.49±0.53
0.33 0.33
0.874
Potatoes Low High
47 22
68 32
0.44±0.42 0.63±0.73
0.31 0.38
0.164
String beans or green beans Low High
58 11
84 16
0.48±0.51 0.64±0.67
0.32 0.38
0.363
Tomatoes Low High
59 10
86 14
0.47±0.52 0.66±0.67
0.32 0.42
0.303
Processed fruits or vegetables Canned or bottled fruit Low High
51 18
74 26
0.46±0.50 0.62±0.64
0.31 0.37
0.275
Canned or bottled vegetables Low High
41 28
59 41
0.45±0.49 0.58±0.61
0.30 0.37
0.342
Frozen vegetables Low High
46 23
67 33
0.45±0.47 0.61±0.65
0.31 0.37
0.230
French fries and fried potatoes Low High
56 13
81 19
0.52±0.58 0.40±0.33
0.34 0.29
0.452
Fortified fruit drinks Low High
45 24
65 35
0.58±0.59 0.36±0.41
0.38 0.25
0.109
Fruit juices Low High
22 47
32 68
0.64±0.64 0.44±0.48
0.41 0.30
0.153
Meats Chicken or turkey meats
28
Low High
53 16
77 23
0.41±0.39 0.79±0.81
0.29 0.48
0.013
Ham or lunch meats Low High
51 18
74 26
0.44±0.48 0.67±0.67
0.30 0.44
0.133
Dairy Butter Low High
46 23
67 33
0.41±0.42 0.68±0.70
0.29 0.42
0.052
Cheeses and cheese spreads Low High
19 50
28 72
0.47±0.59 0.51±0.52
0.29 0.34
0.775
Eggs Low High
58 11
84 16
0.49±0.51 0.55±0.69
0.32 0.35
0.743
Ice cream Low High
45 24
65 35
0.46±0.53 0.57±0.57
0.30 0.39
0.422
Margarine Low High
36 33
52 48
0.62±0.67 0.38±0.32
0.38 0.28
0.067
Yogurt Low High
47 22
68 32
0.43±0.40 0.66±0.75
0.30 0.40
0.092
2% Milk or beverages with 2% milk Low High
34 35
49 51
0.55±0.60 0.45±0.47
0.36 0.30
0.421
Skim milk, 1% milk, or butter milk Low High
54 15
78 22
0.46±0.45 0.66±0.79
0.32 0.38
0.195
Whole milk or beverages with whole milk Low High
44 25
64 36
0.54±0.62 0.44±0.37
0.32 0.33
0.485
Grains Cereals Low High
10 59
14 86
0.36±0.30 0.53±0.57
0.27 0.34
0.361
Dark breads Low High
38 31
55 45
0.54±0.64 0.45±0.39
0.32 0.33
0.463
White breads, bagels, or crackers Low High
26 43
38 62
0.54±0.45 0.47±0.59
0.39 0.30
0.622
Other Cakes, doughnuts, cookies, or pastries Low High
33 36
48 52
0.50±0.56 0.50±0.53
0.33 0.33
0.961
Candies Low High
38 31
55 45
0.45±0.47 0.56±0.62
0.30 0.36
0.412

29
Jellies and jams Low High
45 24
65 35
0.52±0.60 0.46±0.52
0.34 0.30
0.642
Peanuts, peanut butter, or other nuts Low High
38 31
55 45
0.49±0.53 0.51±0.56
0.33 0.33
0.858
Salty snacks Low High
29 40
42 58
0.50±0.55 0.50±0.54
0.33 0.33
0.955
Soft drinks (with sugar) Low High
55 14
80 20
0.50±0.53 0.52±0.58
0.33 0.33
0.907
a3-PBA was only quantified in the urine samples of 69 stay-at-home children in Ohio bNumber of children
cPercentage of children dArithmetic mean and standard deviation eGeometric mean fLow equals the group of children that typically consumed a food item < 3 times per week gHigh equals the group of children that typically consumed a food item > 3 times or greater per week

30
Table 5. Children’s weekly consumption of food items and their mean urinary 2,4-D concentrations (ng/mL) by intake group.a
Food Item Nb %c Mean±SDd GMe p-Value Fresh fruits or vegetables Apples Lowf Highg
85 50
63 37
1.21±1.79 1.17±1.52
0.76 0.77
0.894
Bananas Low High
84 51
62 38
1.18±1.63 1.23±1.79
0.77 0.76
0.884
Grapes Low High
98 37
73 27
1.25±1.70 1.06±1.67
0.81 0.66
0.567
Strawberries Low High
111 24
82 18
1.26±1.84 0.90±0.51
0.78 0.72
0.344
Carrots Low High
94 41
70 30
1.23±1.96 1.13±0.79
0.73 0.85
0.757
Potatoes Low High
115 20
73 27
1.19±1.59 1.22±1.95
0.73 0.86
0.913
String beans or green beans Low High
112 23
85 15
1.18±1.80 1.29±0.80
0.72 1.05
0.797
Tomatoes Low High
98 37
83 17
1.23±1.81 1.05±0.88
0.77 0.72
0.648
Processed fruits or vegetables Canned or bottled fruit Low High
102 33
76 24
1.24±1.89 1.06±0.81
0.76 0.79
0.587
Canned or bottled vegetables Low High
82 53
61 39
1.04±1.23 1.44±2.21
0.73 0.82
0.175
Frozen vegetables Low High
91 44
67 33
1.31±1.99 0.96±0.71
0.79 0.71
0.255
French fries or fried potatoes Low High
109 26
81 19
1.27±1.86 0.90±0.52
0.78 0.70
0.324
Fortified fruit drinks Low High
90 45
67 33
1.23±1.60 1.14±1.88
0.80 0.69
0.769
Fruit juices Low High
41 94
30 70
1.16±1.75 1.21±1.67
0.68 0.80
0.872
Meats Chicken or turkey meats
31
Low High
112 23
83 17
1.20±1.82 1.18±0.81
0.74 0.92
0.954
Ham or lunch meats Low High
99 36
73 27
1.22±1.68 1.14±1.73
0.78 0.72
0.822
Dairy Butter Low High
88 47
65 35
1.06±1.57 1.46±1.88
0.68 0.95
0.186
Cheeses and cheese spreads Low High
43 92
32 68
1.43±2.41 1.09±1.22
0.75 0.77
0.273
Eggs Low High
114 21
84 16
1.25±1.79 0.90±1.00
0.81 0.55
0.375
Ice cream Low High
93 42
69 31
1.05±1.39 1.52±2.20
0.71 0.91
0.139
Margarine Low High
66 69
49 51
1.39±2.03 1.01±1.26
0.79 0.74
0.194
Yogurt Low High
92 43
68 32
1.33±2.00 0.92±0.59
0.80 0.69
0.187
2% Milk or beverages with 2% milk Low High
72 63
53 47
1.26±1.92 1.13±1.39
0.74 0.79
0.657
Skim milk, 1% milk, or butter milk Low High
104 31
77 23
1.15±1.63 1.36±1.88
0.74 0.84
0.541
Whole milk or beverages with whole milk Low High
81 54
60 40
1.21±1.65 1.19±1.76
0.77 0.75
0.947
Grains Cereals Low High
26
109
19 81
0.71±0.83 1.31±1.82
0.50 0.85
0.104
Dark breads Low High
79 56
59 41
1.08±1.47 1.36±1.96
0.74 0.81
0.349
White breads, bagels, or crackers Low High
52 83
39 61
1.48±2.23 1.02±1.22
0.85 0.72
0.128
Other Cakes, doughnuts, cookies, or pastries Low High
67 68
50 50
1.19±1.96 1.21±1.39
0.69 0.85
0.939
Candies Low High
68 67
50 50
1.08±1.53 1.32±1.84
0.73 0.80
0.409

32
Jellies and jams Low High
91 44
67 33
1.29±2.00 1.02±0.71
0.76 0.78
0.391
Peanuts, peanut butter, or other nuts Low High
81 54
60 40
1.33±2.10 1.00±0.71
0.76 0.77
0.268
Salty snacks Low High
59 76
44 56
1.14±1.66 1.24±1.73
0.73 0.80
0.747
Soft drinks (with sugar) Low High
101 34
75 25
1.30±1.88 0.90±0.85
0.82 0.63
0.230
a2,4-D was quantified in the urine samples of 135 stay-at-home children in North Carolina and Ohio bNumber of children
cPercentage of children Arithmetric mean and standard deviation eGeometric mean fLow equals the group of children that typically consumed a food item < 3 times per week gHigh equals the group of children that typically consumed a food item > 3 times or greater per week

33
Table S-1. Weekly consumption of food items by the preschool children.
Food item
Number of childrena Never
Rarely
(<1 time) Low
(1-2 times) Moderate
(3-5 times) High
(> 5 times) Fresh Fruit Apples 19 22 44 44 7 Bananas 10 16 59 42 9 Cantaloupes, honeydews, or watermelons
38 44 37 14 3
Grapefruits 120 9 5 0 2 Grapes 13 39 47 26 11 Oranges or tangerines 39 41 41 9 6 Peaches or nectarines 61 31 36 6 2 Pears 80 26 19 9 2 Strawberries 28 40 43 19 6 Fresh Vegetables Broccoli 58 34 34 10 0 Cabbage 96 34 5 0 1 Carrots 25 30 40 28 13 Cauliflower 102 23 10 0 1 Corn 21 35 63 17 0 Mustard greens, turnip greens, collards, or spinach
105 21 7 3 0
Potatoes 19 23 57 34 3 String beans or green beans 51 33 32 18 2 Tomatoes 65 20 27 20 4 Other Fruits or Vegetables Canned or bottled fruits 33 33 36 24 10 Canned or bottled vegetables
29 14 39 37 17
Frozen vegetables 20 24 48 30 14 Fortified fruit drinks (e.g., Hi-C)
51 18 21 18 28
French fries or fried potatoes
11 26 73 21 5
Fruit juices (100%) 15 7 20 20 74
Meats Bacon 52 44 36 4 0 Beef steak or roasts 39 48 42 7 0 Beef stew or pot pie 77 43 14 2 0 Chicken or turkey (baked, roasted, stewed, broiled)
15 24 74 16 7
Fried chicken 56 51 21 8 0 Fried fish or fish sandwich 80 38 18 0 0
34
Ham or lunch meats 27 18 55 30 6 Hamburgers, cheeseburgers, or meatloaf
58 40 33 5 0
Hot dogs 24 45 52 14 1 Liver (including chicken liver)
129 7 0 0 0
Other fish (broiled or baked)
95 31 9 1 0
Pork (including chops and roast)
38 61 35 2 0
Sausage 71 37 22 3 3 Dairy Butter 59 9 21 17 30 Cheeses and cheese spreads 13 5 25 55 38 Eggs 27 20 68 20 1 Frozen yogurt 109 18 4 3 2 Ice cream 9 31 54 31 11 Margarine 45 4 17 35 35 Yogurt 39 19 35 29 14 2% milk or beverages with 2% milk (including on cereal)
67 3 3 3 60
Skim milk, 1% milk, or butter milk (including on cereal)
93 4 8 3 28
Whole milk or beverages with whole milk (including on cereal)
79 2 1 7 47
Grains Cereals 5 5 16 56 54 Cooked cereals 65 24 30 14 3 Dark bread (e.g., whole wheat, rye or pumpernickel)
57 10 13 22 34
Corn bread, corn muffins, or corn tortillas
58 51 24 2 1
Rice 25 39 60 10 2 Spaghetti, lasagna, or other pasta (with tomato sauce)
10 31 83 11 1
White breads, bagels, or crackers
16 9 27 21 63
Other Cakes, doughnuts, cookies, or pastries
13 5 41 37 40
Candies 11 11 46 42 26 Canned soups 49 34 45 7 1
35
Honey 101 19 9 4 3 Jellies or jams 33 15 44 26 18 Peanuts, peanut butter, or other nuts
19 16 47 28 26
Pies 114 19 3 0 0 Pizza 4 56 72 3 1 Salty snacks (e.g., chips, popcorn, or pretzels)
9 7 44 44 32
Soft drinks (with sugar) 53 16 33 15 19 Soft drinks (sugar-free) 114 2 14 3 3 aOne child was excluded from the data analyses because they did not have a valid urine sample.