Embed Size (px)
Citation preview
Karan Kaul and Laurie Goodman
November 2015
The media are reporting widely that liquidity in fixed income markets, including the
agency mortgage-backed securities (MBS) market, has declined since the housing
market crisis and could pose risks to the financial system if left unaddressed.1 Most
research on this topic has attributed this trend to tougher regulation,2 specifically the
requirement for financial services firms to hold more capital and reduce the amount of
risk taken. Financial regulators on the other hand are largely pushing back against
industry claims that liquidity is down because of tighter regulation.3
The debate surrounding bond market liquidity has thus far focused mostly on the US Treasury and
corporate credit markets, with very limited attention paid to the agency MBS market. In this brief we
examine recent trends in the agency MBS market to assess whether liquidity represents a serious
problem and identify its likely causes. According to our analysis, agency MBS liquidity has declined since
the crisis, yet remains at the pre-bubble levels of the early to mid-2000s. We also find that this drop is
driven by several factors, of which tighter regulation is one, but by no means the only one or even the
primary one. Our view is that the factors driving this decline are unlikely to ease any time soon,
suggesting current levels of liquidity are here to stay.
This brief is organized as follows:
First, we describe what we mean by liquidity in the agency MBS market and why it matters.
Liquidity can have many dimensions, some of which can be extremely difficult to measure.
Understanding each of these dimensions is critical to comprehending what generally drives or
constrains liquidity.
H O U S I N G F I N A N C E P O L I C Y C E N T E R
Declining Agency MBS Liquidity Is Not
All about Financial Regulation
2 D E C L I N I N G A G E N C Y M B S L I Q U I D I T Y I S N O T A L L A B O U T F I N A N C I A L R E G U L A T I O N
Second, we study measurable dimensions of liquidity over time to get a longer-term perspective on
how much liquidity has really declined and where it stands today.
Third, we discuss the causes of the decline and offer reasons regulation is just one among several
factors.
Finally, we explain why this trend is unlikely to reverse anytime soon.
Liquidity in the Agency MBS Market
The US agency mortgage-backed securities market is one of the most liquid fixed-income markets in the
world, behind only the US Treasury market. Owners of agency mortgage-backed securities—the vast
majority of which are issued by either the two government-sponsored enterprises (GSEs), Fannie Mae
and Freddie Mac, or Ginnie Mae, a government agency—are entitled to timely principal and interest
payments on the residential mortgages underlying these securities (Vickery and White 2013). The vast
majority of these securities are traded in the to-be-announced (TBA) market. The TBA market functions
much like a futures market where investors commit to buy or sell agency MBS that meet certain broad
criteria. The exact securities delivered to the buyer are “announced” just before the settlement date,
rather than at the time of the trade.
The agency MBS market is huge, with approximately $5.7 trillion in securities outstanding as of the
second quarter of 2015, according to Securities Industry and Financial Markets Association data; most
of that balance is TBA eligible. This market has historically been very liquid because participants have
been able to trade large volumes of securities relatively easily and quickly. As a result, plenty of
potential buyers and sellers can transact with each other without incurring large transaction costs or
facing too much price volatility.
Always a defining feature of the TBA market, ample liquidity produces four critical benefits for the
broader housing market:
Lowers mortgage costs. A liquid market reduces transaction costs. Because such costs are
eventually passed on to borrowers as part of the mortgage rate, a liquid TBA market helps
reduce mortgage borrowing costs.
Attracts global capital. A liquid TBA market is able to attract capital from a wide variety of
investors around the world. Investors hold TBA securities in their portfolios because they
believe these securities can be converted to cash quickly if needed. If markets were to become
less liquid, many of these investors would likely divert their cash to alternatives (such as the US
Treasury market) and deprive the $10 trillion US housing market of much-needed capital.
Allows borrowers to lock in rates. Liquidity also allows mortgage originators to short-sell MBS
to hedge the risk that interest rates will fluctuate between when the mortgage application is
received and when the mortgage is sold in the secondary market. If lenders did not have this
ability, borrowers would be unable to lock in rates before closing.
D E C L I N I N G A G E N C Y M B S L I Q U I D I T Y I S N O T A L L A B O U T F I N A N C I A L R E G U L A T I O N 3
Moderates price fluctuations. When markets are liquid, any new developments and events are
priced in almost instantaneously, creating smoother price movements and reducing volatility.
As important as liquidity is, it is inherently difficult to measure for two main reasons. First, there is
no standardized or commonly accepted definition of liquidity. Although liquidity generally refers to
ease of transacting, market participants can have very different views of what constitutes that ease
depending upon the types of securities they trade, the sizes of those trades, and other factors. Second,
even when liquidity is defined (Borio 2000), it can be very hard, if not impossible, to quantify. This
inability makes it very difficult to judge whether liquidity is too high, too low, or just right, let alone to
trace the causes of liquidity trends.
Four dimensions of liquidity are relevant to today’s agency MBS market. Though the first two are
largely measurable, the last two are largely observed as trends and may be open to interpretation.
Transaction volume measures total trading activity over a certain period. It is most commonly
represented as the average daily trading volume, which reflects the average dollar volume of
MBS transacted in a given day. Higher trading volume is generally associated with higher
liquidity because it signals a large number of active buyers and sellers transacting frequently.
All other things equal, a buyer (or seller) should have an easier time finding a seller (or buyer)
when both are present in large numbers.
Transaction cost, also known as the bid-ask spread, is the difference between the price market-
makers pay the seller of a security and the price at which they sell the security to another
buyer. The transaction cost compensates market-makers for the cost (risk of adverse price
movements, hedging cost, capital cost, profit margin) of warehousing the security between the
time of purchase and the subsequent sale (also called the holding period).
When markets are liquid and volatility is low, dealers tend to be less worried about
finding buyers for warehoused securities and therefore more willing to provide
market-making services to their customers. Because this creates competition among
dealers, bid-ask spreads tend to be low when markets are functioning smoothly. But
when volatility is high, dealers are more exposed to the risk of adverse price movement
on warehoused assets or of an extended holding period because they may not be able
to find a buyer quickly. Dealers typically respond by either offering sellers a lower price
or charging buyers a higher price, or both, ultimately widening the bid-ask spread and
increasing the transaction cost. When the market is extremely volatile—such as during
the 2008 panic—these risks can rise to levels that eventually force dealers to stop
making markets altogether. In general, lower bid-ask spreads indicate that markets are
liquid because these risks are perceived as low.
Resilience refers to the ability of markets to self-correct temporary price dislocations or
mitigate minor volatility spikes so prices can return to normal quickly. Although large trading
volumes can aid resilience, volume may not always be enough. The ability of markets to self-
correct is also affected by the number of participants that are able and willing to provide a bid

4 D E C L I N I N G A G E N C Y M B S L I Q U I D I T Y I S N O T A L L A B O U T F I N A N C I A L R E G U L A T I O N
when others may be less willing to. This requires the presence of a heterogeneous investor base
with diversity in both investment approach and horizon. Because the agency MBS market has
been able to attract capital from around the globe and from a diverse investor base,4 resilience
hasn’t been a major concern historically.
Depth refers to the ease of executing large trades. Dealers find it easier to warehouse smaller
trades because of their lower risk exposure and because buyers are more readily available. In
contrast, large trades can take longer to execute because dealers may have to wait longer or
work harder to find a buyer with an equally large appetite. The alternative is to break large
trades into smaller chunks that can then be sold individually, but this approach often involves
costs. Generally, dealers’ willingness to warehouse large trades depends on holding costs,
market conditions, and dealers’ confidence in their ability to offload the securities quickly and
easily.
Liquidity can often represent a trade-off among these dimensions. For example, while tightening
bid-ask spreads can reduce transaction costs for all market participants, they also reduce the
profitability of the market-making business. Overly tight bid-ask spreads can eventually force smaller or
less profitable dealers to either pull back or exit the business altogether, thus affecting the ease of
execution. The key point here is that there is no right level of liquidity, there are often trade-offs
involved, and not everyone will always be happy.
Trends in Agency MBS Liquidity
Average Daily Trading Volume
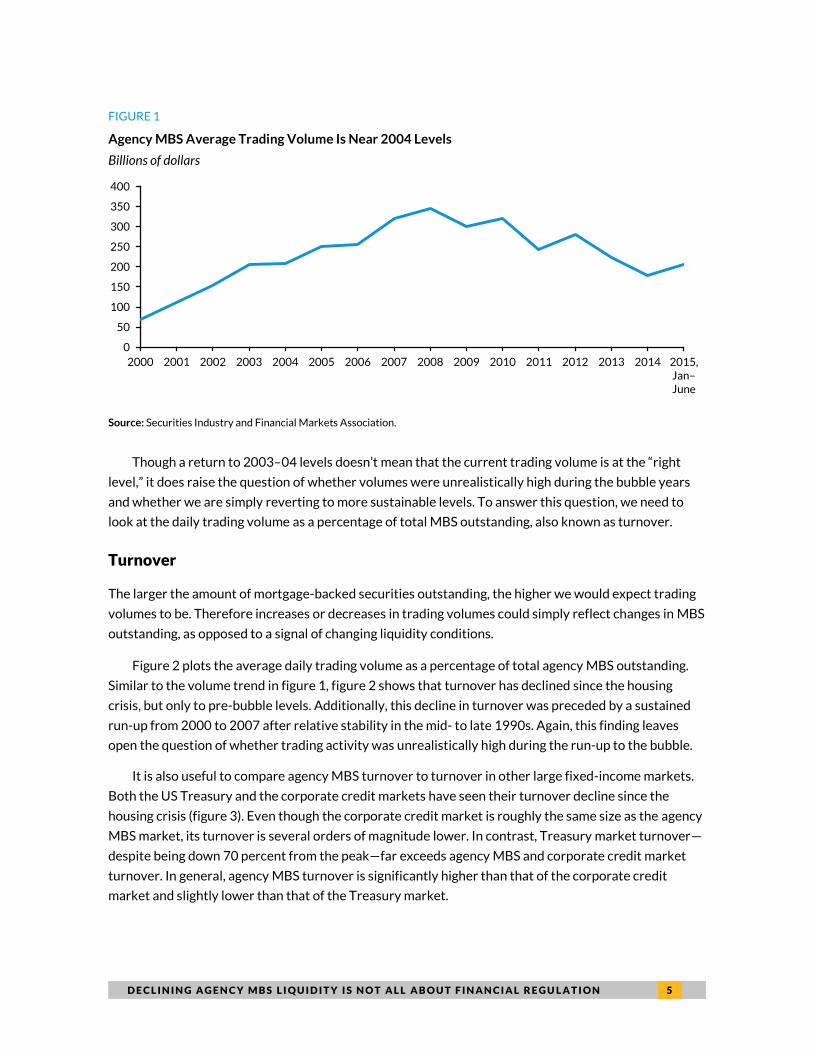
The average daily trading volume for agency MBS has declined recently. To put this decline into proper
perspective it is useful to look at the longer-term trend. Figure 1 shows agency MBS average daily
trading volume from 2000 to June 2015. The three main insights from this chart:
1. The average daily trading volume is decidedly down from the highs of the bubble years (volume
peaked at nearly $350 billion in 2008). Equally important, this decline was preceded by a
sustained run-up until 2008.
2. Even though volume has fallen substantially since the crisis, it has remained relatively stable,
averaging about $190 billion a day since the beginning of 2014.
3. Today’s daily volume of $190 billion also closely mirrors the 2003–04 level, just before the
euphoria began.
D E C L I N I N G A G E N C Y M B S L I Q U I D I T Y I S N O T A L L A B O U T F I N A N C I A L R E G U L A T I O N 5
FIGURE 1
Agency MBS Average Trading Volume Is Near 2004 Levels
Billions of dollars
Source: Securities Industry and Financial Markets Association.
Though a return to 2003–04 levels doesn’t mean that the current trading volume is at the “right
level,” it does raise the question of whether volumes were unrealistically high during the bubble years
and whether we are simply reverting to more sustainable levels. To answer this question, we need to
look at the daily trading volume as a percentage of total MBS outstanding, also known as turnover.
Turnover
The larger the amount of mortgage-backed securities outstanding, the higher we would expect trading
volumes to be. Therefore increases or decreases in trading volumes could simply reflect changes in MBS
outstanding, as opposed to a signal of changing liquidity conditions.
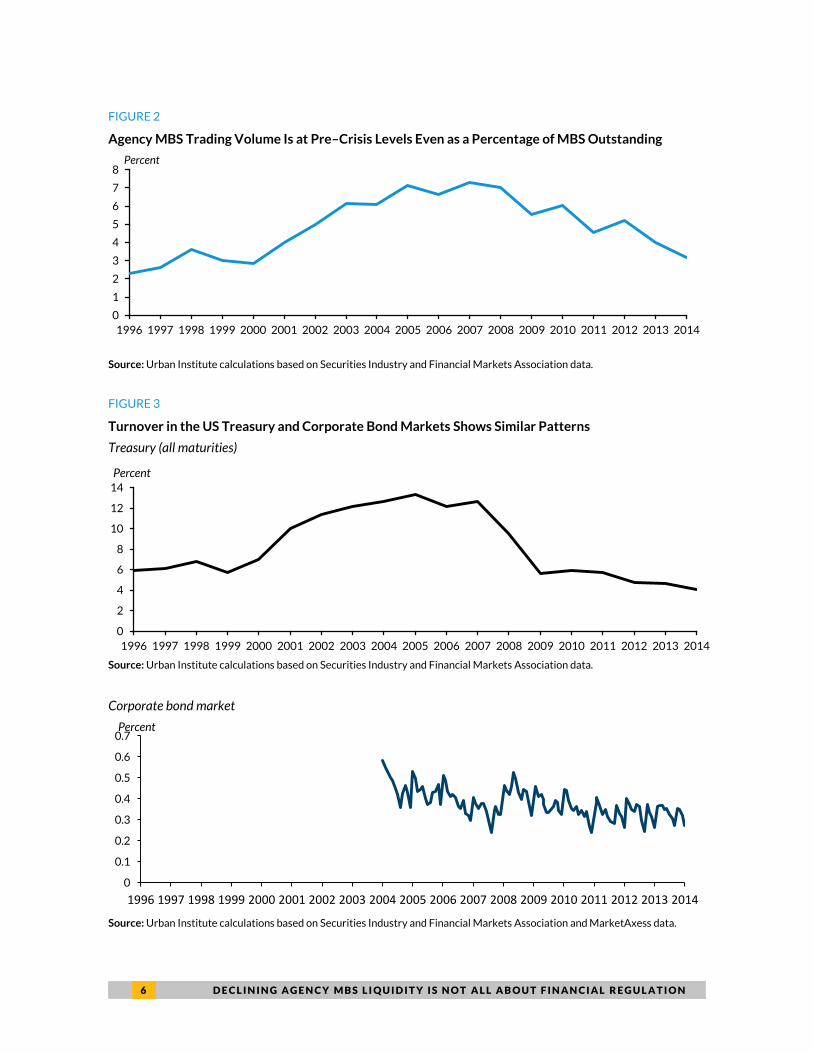
Figure 2 plots the average daily trading volume as a percentage of total agency MBS outstanding.
Similar to the volume trend in figure 1, figure 2 shows that turnover has declined since the housing
crisis, but only to pre-bubble levels. Additionally, this decline in turnover was preceded by a sustained
run-up from 2000 to 2007 after relative stability in the mid- to late 1990s. Again, this finding leaves
open the question of whether trading activity was unrealistically high during the run-up to the bubble.
It is also useful to compare agency MBS turnover to turnover in other large fixed-income markets.
Both the US Treasury and the corporate credit markets have seen their turnover decline since the
housing crisis (figure 3). Even though the corporate credit market is roughly the same size as the agency
MBS market, its turnover is several orders of magnitude lower. In contrast, Treasury market turnover—
despite being down 70 percent from the peak—far exceeds agency MBS and corporate credit market
turnover. In general, agency MBS turnover is significantly higher than that of the corporate credit
market and slightly lower than that of the Treasury market.
0
50
100
150
200
250
300
350
400
2000 2001 2002 2003 2004 2005 2006 2007 2008 2009 2010 2011 2012 2013 2014 2015, Jan–June
6 D E C L I N I N G A G E N C Y M B S L I Q U I D I T Y I S N O T A L L A B O U T F I N A N C I A L R E G U L A T I O N
FIGURE 2
Agency MBS Trading Volume Is at Pre–Crisis Levels Even as a Percentage of MBS Outstanding
Source: Urban Institute calculations based on Securities Industry and Financial Markets Association data.
FIGURE 3
Turnover in the US Treasury and Corporate Bond Markets Shows Similar Patterns
Treasury (all maturities)
Source: Urban Institute calculations based on Securities Industry and Financial Markets Association data.
Corporate bond market
Source: Urban Institute calculations based on Securities Industry and Financial Markets Association and MarketAxess data.
0
1
2
3
4
5
6
7
8
1996 1997 1998 1999 2000 2001 2002 2003 2004 2005 2006 2007 2008 2009 2010 2011 2012 2013 2014
Percent
0
2
4
6
8
10
12
14
1996 1997 1998 1999 2000 2001 2002 2003 2004 2005 2006 2007 2008 2009 2010 2011 2012 2013 2014
Percent
0
0.1
0.2
0.3
0.4
0.5
0.6
0.7
1996 1997 1998 1999 2000 2001 2002 2003 2004 2005 2006 2007 2008 2009 2010 2011 2012 2013 2014
Percent
D E C L I N I N G A G E N C Y M B S L I Q U I D I T Y I S N O T A L L A B O U T F I N A N C I A L R E G U L A T I O N 7
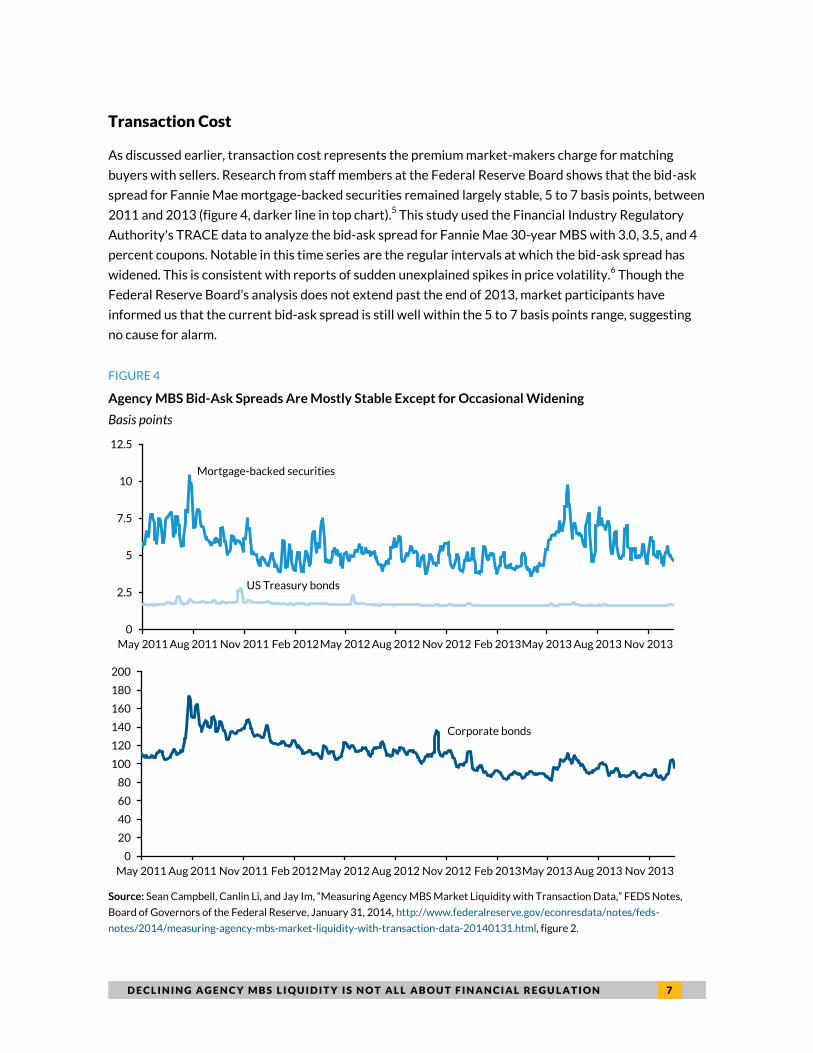
Transaction Cost
As discussed earlier, transaction cost represents the premium market-makers charge for matching
buyers with sellers. Research from staff members at the Federal Reserve Board shows that the bid-ask
spread for Fannie Mae mortgage-backed securities remained largely stable, 5 to 7 basis points, between
2011 and 2013 (figure 4, darker line in top chart).5 This study used the Financial Industry Regulatory
Authority's TRACE data to analyze the bid-ask spread for Fannie Mae 30-year MBS with 3.0, 3.5, and 4
percent coupons. Notable in this time series are the regular intervals at which the bid-ask spread has
widened. This is consistent with reports of sudden unexplained spikes in price volatility.6 Though the
Federal Reserve Board’s analysis does not extend past the end of 2013, market participants have
informed us that the current bid-ask spread is still well within the 5 to 7 basis points range, suggesting
no cause for alarm.
FIGURE 4
Agency MBS Bid-Ask Spreads Are Mostly Stable Except for Occasional Widening
Basis points
Source: Sean Campbell, Canlin Li, and Jay Im, “Measuring Agency MBS Market Liquidity with Transaction Data,” FEDS Notes,
Board of Governors of the Federal Reserve, January 31, 2014, http://www.federalreserve.gov/econresdata/notes/feds-
notes/2014/measuring-agency-mbs-market-liquidity-with-transaction-data-20140131.html, figure 2.
0
2.5
5
7.5
10
12.5
May 2011 Aug 2011 Nov 2011 Feb 2012May 2012 Aug 2012 Nov 2012 Feb 2013May 2013 Aug 2013 Nov 2013
Mortgage-backed securities
Corporate bonds
0
20
40
60
80
100
120
140
160
180
200
May 2011 Aug 2011 Nov 2011 Feb 2012 May 2012 Aug 2012 Nov 2012 Feb 2013May 2013 Aug 2013 Nov 2013
US Treasury bonds
8 D E C L I N I N G A G E N C Y M B S L I Q U I D I T Y I S N O T A L L A B O U T F I N A N C I A L R E G U L A T I O N
For comparison, figure 4 also shows the bid-ask spread for the 10-year Treasury bond and a typical
investment-grade corporate bond. The bid-ask spread for mortgage-backed securities is a few basis
points higher than the spread for the 10-year Treasury bond (lighter line in top chart) but a fraction of
the corporate bid-ask spread (lower chart). This suggests that the historical relationship between these
three markets—with Treasury the most liquid and corporate the least—is still intact.
To summarize, the average daily trading volume of agency MBS has clearly retreated since the
housing crisis, but only to pre-bubble levels, supporting the hypothesis of excessive liquidity leading up
to the crisis. Further, the Federal Reserve Board’s study shows that transaction costs are relatively
stable, except for occasional spread-widening. These findings raise two new questions: Why has the bid-
ask spread become more volatile recently? And why has the average daily trading volume declined?
Reasons for the Decline in Liquidity
Dwindling trading volumes and greater bid-ask volatility can have serious implications for market
resiliency and depth, both of which are essential for ease of trade execution. Whether the decline in
trading volumes is simply a reversion to more sustainable levels or a sign of a more serious problem,
however, is still an open question. Also unclear are the reasons behind the increased frequency of
volatility spikes witnessed in the bid-ask data. Existing research and press reports have suggested that
declining fixed income liquidity is largely a result of more stringent financial services regulation put in
place after the crisis (Elliott 2015; Pricewaterhouse-Coopers 2015). Specifically, higher capital
requirements, conservative leverage ratios and curbs on proprietary trading under the Dodd-Frank Act
have made it more expensive for large financial services institutions to take risks. While that is certainly
true, our view is there is more to declining agency MBS liquidity than just regulation. Two high-level
trends are at play here:
a major shift in MBS ownership from active traders to “buy-and-hold” investors has reduced
investor heterogeneity, and with it the ability of markets to self-correct temporary price
dislocations, resulting in more pronounced episodes of volatility; and
a steep drop in mortgage refinance volume without a corresponding uptick in purchase
originations has led to a decline in agency MBS issuances and in turn in the trading volume.
A Major Shift in MBS Ownership from Active Traders to “Buy-and-Hold” Investors
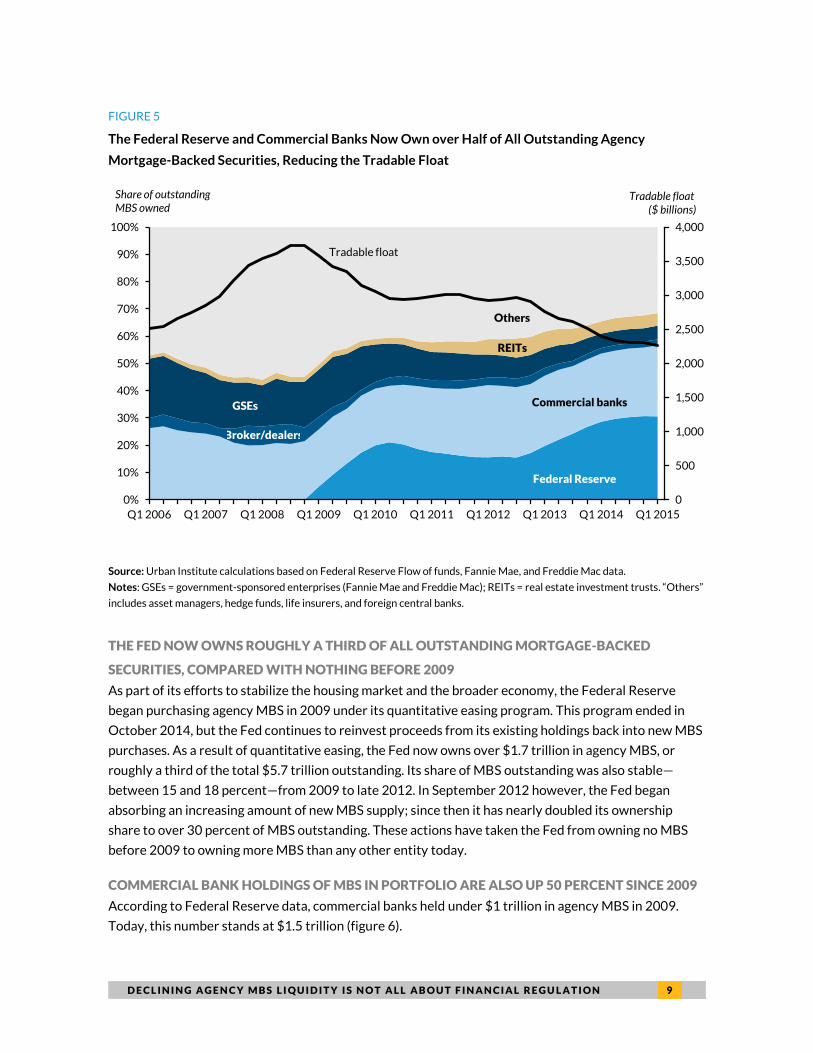
Figure 5 shows how the MBS ownership pattern has changed since 2006. Several points jump out from
this chart.
D E C L I N I N G A G E N C Y M B S L I Q U I D I T Y I S N O T A L L A B O U T F I N A N C I A L R E G U L A T I O N 9
FIGURE 5
The Federal Reserve and Commercial Banks Now Own over Half of All Outstanding Agency
Mortgage-Backed Securities, Reducing the Tradable Float
Source: Urban Institute calculations based on Federal Reserve Flow of funds, Fannie Mae, and Freddie Mac data.
Notes: GSEs = government-sponsored enterprises (Fannie Mae and Freddie Mac); REITs = real estate investment trusts. “Others”
includes asset managers, hedge funds, life insurers, and foreign central banks.
THE FED NOW OWNS ROUGHLY A THIRD OF ALL OUTSTANDING MORTGAGE-BACKED
SECURITIES, COMPARED WITH NOTHING BEFORE 2009
As part of its efforts to stabilize the housing market and the broader economy, the Federal Reserve
began purchasing agency MBS in 2009 under its quantitative easing program. This program ended in
October 2014, but the Fed continues to reinvest proceeds from its existing holdings back into new MBS
purchases. As a result of quantitative easing, the Fed now owns over $1.7 trillion in agency MBS, or
roughly a third of the total $5.7 trillion outstanding. Its share of MBS outstanding was also stable—
between 15 and 18 percent—from 2009 to late 2012. In September 2012 however, the Fed began
absorbing an increasing amount of new MBS supply; since then it has nearly doubled its ownership
share to over 30 percent of MBS outstanding. These actions have taken the Fed from owning no MBS
before 2009 to owning more MBS than any other entity today.
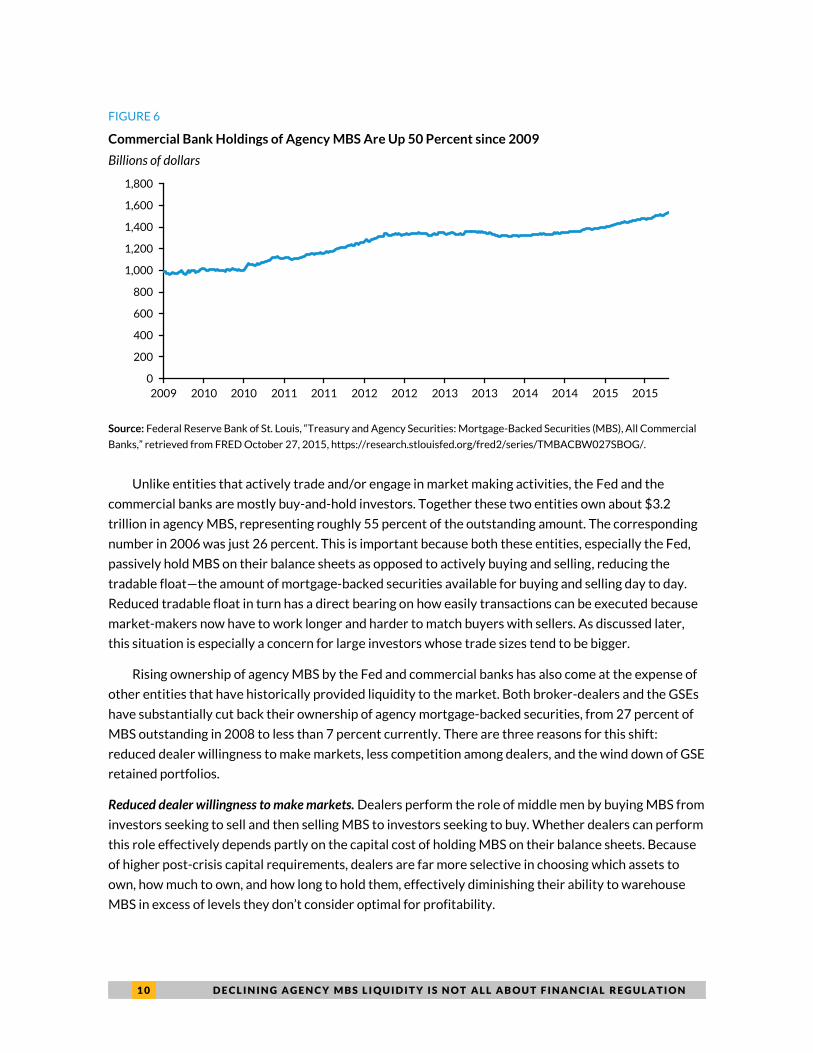
COMMERCIAL BANK HOLDINGS OF MBS IN PORTFOLIO ARE ALSO UP 50 PERCENT SINCE 2009
According to Federal Reserve data, commercial banks held under $1 trillion in agency MBS in 2009.
Today, this number stands at $1.5 trillion (figure 6).
Tradable float
0
500
1,000
1,500
2,000
2,500
3,000
3,500
4,000
0%
10%
20%
30%
40%
50%
60%
70%
80%
90%
100%
Q1 2006 Q1 2007 Q1 2008 Q1 2009 Q1 2010 Q1 2011 Q1 2012 Q1 2013 Q1 2014 Q1 2015
GSEs Commercial banks
Federal Reserve
Broker/dealers
REITs
Others
Tradable float ($ billions)
Share of outstanding MBS owned
1 0 D E C L I N I N G A G E N C Y M B S L I Q U I D I T Y I S N O T A L L A B O U T F I N A N C I A L R E G U L A T I O N
FIGURE 6
Commercial Bank Holdings of Agency MBS Are Up 50 Percent since 2009
Billions of dollars
Source: Federal Reserve Bank of St. Louis, “Treasury and Agency Securities: Mortgage-Backed Securities (MBS), All Commercial
Banks,” retrieved from FRED October 27, 2015, https://research.stlouisfed.org/fred2/series/TMBACBW027SBOG/.
Unlike entities that actively trade and/or engage in market making activities, the Fed and the
commercial banks are mostly buy-and-hold investors. Together these two entities own about $3.2
trillion in agency MBS, representing roughly 55 percent of the outstanding amount. The corresponding
number in 2006 was just 26 percent. This is important because both these entities, especially the Fed,
passively hold MBS on their balance sheets as opposed to actively buying and selling, reducing the
tradable float—the amount of mortgage-backed securities available for buying and selling day to day.
Reduced tradable float in turn has a direct bearing on how easily transactions can be executed because
market-makers now have to work longer and harder to match buyers with sellers. As discussed later,
this situation is especially a concern for large investors whose trade sizes tend to be bigger.
Rising ownership of agency MBS by the Fed and commercial banks has also come at the expense of
other entities that have historically provided liquidity to the market. Both broker-dealers and the GSEs
have substantially cut back their ownership of agency mortgage-backed securities, from 27 percent of
MBS outstanding in 2008 to less than 7 percent currently. There are three reasons for this shift:
reduced dealer willingness to make markets, less competition among dealers, and the wind down of GSE
retained portfolios.
Reduced dealer willingness to make markets. Dealers perform the role of middle men by buying MBS from
investors seeking to sell and then selling MBS to investors seeking to buy. Whether dealers can perform
this role effectively depends partly on the capital cost of holding MBS on their balance sheets. Because
of higher post-crisis capital requirements, dealers are far more selective in choosing which assets to
own, how much to own, and how long to hold them, effectively diminishing their ability to warehouse
MBS in excess of levels they don’t consider optimal for profitability.
0
200
400
600
800
1,000
1,200
1,400
1,600
1,800
2009 2010 2010 2011 2011 2012 2012 2013 2013 2014 2014 2015 2015
D E C L I N I N G A G E N C Y M B S L I Q U I D I T Y I S N O T A L L A B O U T F I N A N C I A L R E G U L A T I O N 1 1
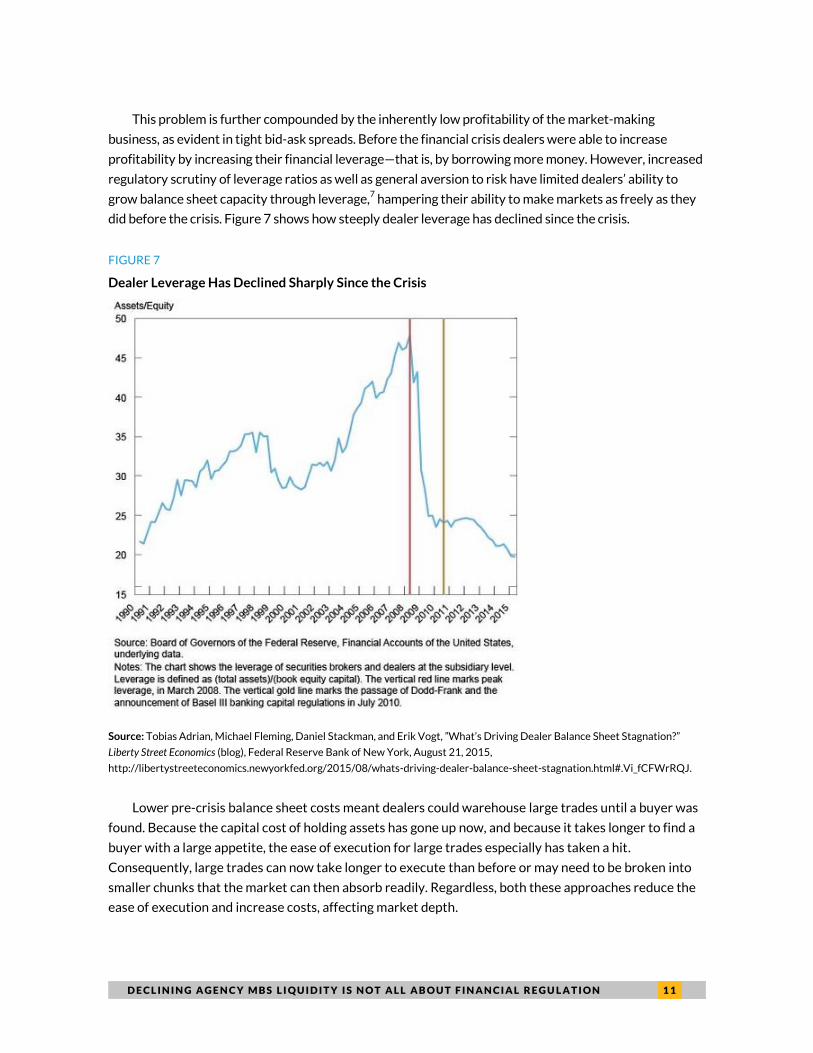
This problem is further compounded by the inherently low profitability of the market-making
business, as evident in tight bid-ask spreads. Before the financial crisis dealers were able to increase
profitability by increasing their financial leverage—that is, by borrowing more money. However, increased
regulatory scrutiny of leverage ratios as well as general aversion to risk have limited dealers’ ability to
grow balance sheet capacity through leverage,7 hampering their ability to make markets as freely as they
did before the crisis. Figure 7 shows how steeply dealer leverage has declined since the crisis.
FIGURE 7
Dealer Leverage Has Declined Sharply Since the Crisis
Source: Tobias Adrian, Michael Fleming, Daniel Stackman, and Erik Vogt, ”What’s Driving Dealer Balance Sheet Stagnation?”
Liberty Street Economics (blog), Federal Reserve Bank of New York, August 21, 2015,
http://libertystreeteconomics.newyorkfed.org/2015/08/whats-driving-dealer-balance-sheet-stagnation.html#.Vi_fCFWrRQJ.
Lower pre-crisis balance sheet costs meant dealers could warehouse large trades until a buyer was
found. Because the capital cost of holding assets has gone up now, and because it takes longer to find a
buyer with a large appetite, the ease of execution for large trades especially has taken a hit.
Consequently, large trades can now take longer to execute than before or may need to be broken into
smaller chunks that the market can then absorb readily. Regardless, both these approaches reduce the
ease of execution and increase costs, affecting market depth.
1 2 D E C L I N I N G A G E N C Y M B S L I Q U I D I T Y I S N O T A L L A B O U T F I N A N C I A L R E G U L A T I O N
Less competition among dealers. Increased balance sheet costs have proved especially problematic for
less profitable smaller dealers. Unlike their larger “bulge bracket” peers, these firms often can’t offer a
comprehensive suite of products and services to their buy-side clients (for example, presence across all
asset classes, global reach, access to research, margin lending, and so on), effectively limiting their
revenue streams. Larger, more diversified dealers on the other hand can afford to sustain lower
profitability in one business unit for the sake of maintaining larger client relationships. Often, this
creates cross-sell opportunities that help subsidize lower-margin businesses.
The run-up to the financial crisis and the accompanying investor euphoria had substantially
increased the demand for most asset classes. Strong demand for risk across the board had essentially
grown the pie and created opportunities for several smaller dealers to enter the market. The potential
for profits was further amplified by low capital requirements and the ability to leverage up. However, as
the market for many of these assets dried up after the bubble, many smaller dealers—with limited
offerings and a less diversified business model—experienced a sudden loss of revenue and were forced
to either substantially downsize their mortgage desks or exit the business altogether.8 Three such
players—Nomura, HSBC, and the Royal Bank of Scotland—have completely exited the US mortgage
securities business while many others have pulled back significantly. The result is substantial market
share gains for those that remain in business.
The bankruptcy of Lehman Brothers and the sales of Bear Stearns and Merrill Lynch to JP Morgan
and Bank of America, respectively, have exacerbated broker-dealer concentration even further.
According to New York Fed data on primary dealer market share, the 5 largest dealers accounted for
about 55 percent of agency MBS transaction volume in 2006. In contrast, today’s top 5 account for
about 80 percent of the market. Reduced competition among dealers allows them to be pickier about
what risks to take and which opportunities to pursue without the fear of losing market share.
GSE retained portfolio wind down. GSE-retained portfolios have historically performed a somewhat
different role in the agency MBS market than dealers, but they have also been providers of liquidity,
especially during volatile periods. The GSEs performed this role by buying agency MBS when markets
were turbulent and spreads were wide, funding their purchases at lower borrowing costs because of
their implicit federal guarantee (Pearce and Miller 2001). This intervention helped absorb volatility and
brought prices closer to normal. Massive retained portfolios no doubt fostered more trading activity,
but the resulting liquidity improvements were also driven by a subsidized funding regime that
encouraged excessive risk taking—the costs of which, as we know now, far outweighed any potential
benefits. Nevertheless, Fannie’s and Freddie’s singular focus on mortgages, an active hedge fund–like
trading operation, and a deep understanding of the agency MBS market permitted them to be more
focused and strategic about the timing of their intervention, the price at which to intervene, and the
specific coupons/vintages to buy, ultimately helping reduce volatility. This was no doubt done with a
profit motive, but it also provided lubrication to the system when needed.
Since the crisis, the regulatory mandate to shrink their retained portfolios by 15 percent annually9
and the reputational risk arising from the intense political scrutiny of the portfolios have greatly
diminished Fannie’s and Freddie’s ability and the desire to perform the market lubrication role. The
D E C L I N I N G A G E N C Y M B S L I Q U I D I T Y I S N O T A L L A B O U T F I N A N C I A L R E G U L A T I O N 1 3
amount of agency MBS held in GSEs’ retained portfolios has declined from $770 billion in 2006 to $270
billion today, a decline of $500 billion.10
In terms of share, the GSEs owned about 22 percent of the
amount outstanding in 2006 versus only 5 percent today.
Because of the role the GSEs and dealers played in absorbing volatility during market disruptions,
their pullback is felt the most during precisely such periods. Before the crisis, these entities would try to
benefit from price dislocations created by volatility in exchange for getting compensated for buying low
and selling high. By providing a bid when other market participants were less willing to, these entities
essentially acted as shock absorbers and helped smooth prices. Their diminished role has effectively
reduced investor heterogeneity. The result is fewer contrarian trades, more pronounced bouts of
volatility than before and a longer duration before prices return to normal.
A Steep Drop in Refinance Volume without a Corresponding Uptick in Purchase
Originations
Agency MBS trading volume tends to be positively correlated to new MBS issuance activity, which in
turn is a function of mortgage origination activity. Periods during which issuances are strong generally
result in increased trading activity, giving trading volumes a boost. A new security is typically bought
and sold several times upon issuance as traders try to benefit from minor price imbalances before long-
term investors step in and trading activity falls off.
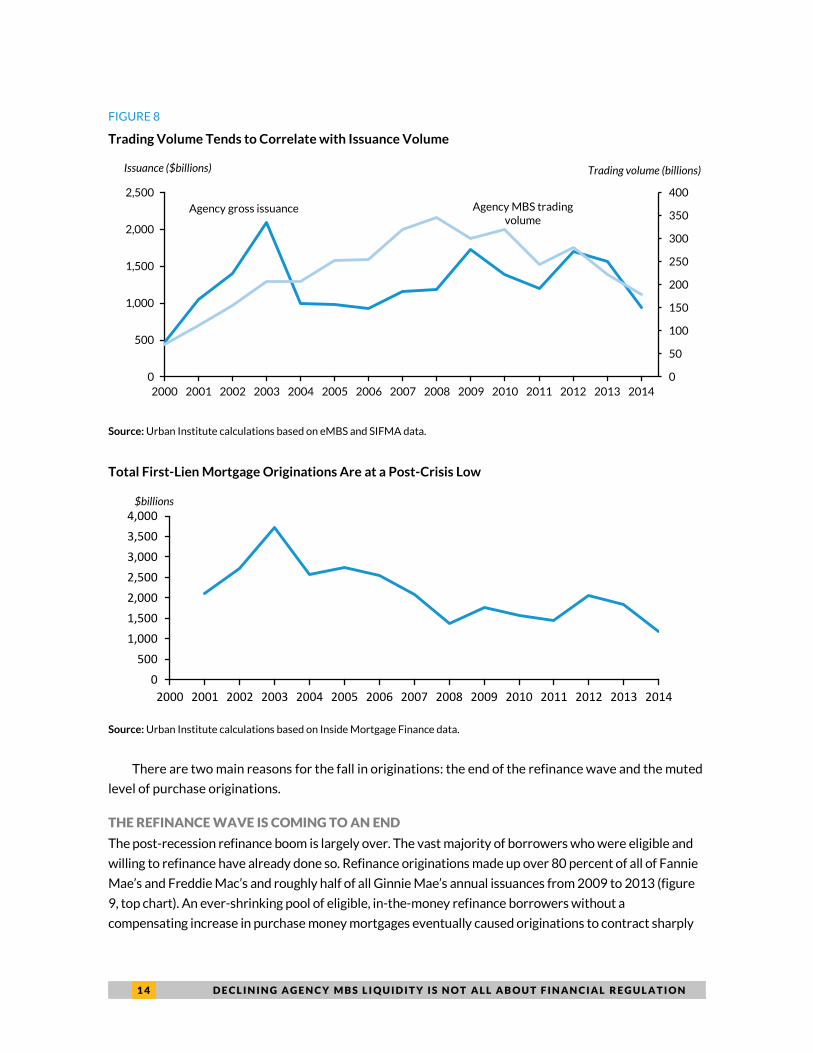
The top chart in figure 8 shows that agency MBS gross issuance (or agency securitizations) and the
average daily trading volume have both declined recently. The bottom chart also shows that total first-
lien origination volume—a key driver of issuances—has not only declined steeply since 2012 but is also
at its lowest level in at least 15 years.
1 4 D E C L I N I N G A G E N C Y M B S L I Q U I D I T Y I S N O T A L L A B O U T F I N A N C I A L R E G U L A T I O N
FIGURE 8
Trading Volume Tends to Correlate with Issuance Volume
Source: Urban Institute calculations based on eMBS and SIFMA data.
Total First-Lien Mortgage Originations Are at a Post-Crisis Low
Source: Urban Institute calculations based on Inside Mortgage Finance data.
There are two main reasons for the fall in originations: the end of the refinance wave and the muted
level of purchase originations.
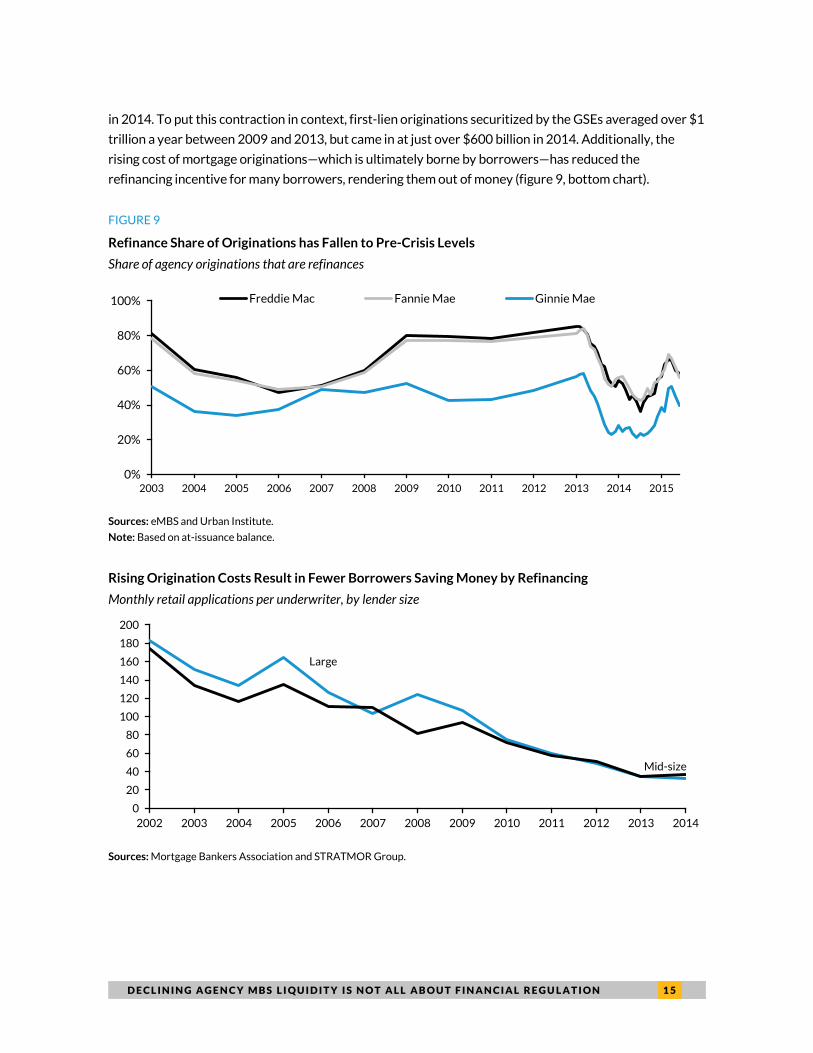
THE REFINANCE WAVE IS COMING TO AN END
The post-recession refinance boom is largely over. The vast majority of borrowers who were eligible and
willing to refinance have already done so. Refinance originations made up over 80 percent of all of Fannie
Mae’s and Freddie Mac’s and roughly half of all Ginnie Mae’s annual issuances from 2009 to 2013 (figure
9, top chart). An ever-shrinking pool of eligible, in-the-money refinance borrowers without a
compensating increase in purchase money mortgages eventually caused originations to contract sharply
Agency gross issuance Agency MBS trading volume
0
50
100
150
200
250
300
350
400
0
500
1,000
1,500
2,000
2,500
2000 2001 2002 2003 2004 2005 2006 2007 2008 2009 2010 2011 2012 2013 2014
Issuance ($billions) Trading volume (billions)
0
500
1,000
1,500
2,000
2,500
3,000
3,500
4,000
2000 2001 2002 2003 2004 2005 2006 2007 2008 2009 2010 2011 2012 2013 2014
$billions
D E C L I N I N G A G E N C Y M B S L I Q U I D I T Y I S N O T A L L A B O U T F I N A N C I A L R E G U L A T I O N 1 5
in 2014. To put this contraction in context, first-lien originations securitized by the GSEs averaged over $1
trillion a year between 2009 and 2013, but came in at just over $600 billion in 2014. Additionally, the
rising cost of mortgage originations—which is ultimately borne by borrowers—has reduced the
refinancing incentive for many borrowers, rendering them out of money (figure 9, bottom chart).
FIGURE 9
Refinance Share of Originations has Fallen to Pre-Crisis Levels
Share of agency originations that are refinances
Sources: eMBS and Urban Institute.
Note: Based on at-issuance balance.
Rising Origination Costs Result in Fewer Borrowers Saving Money by Refinancing
Monthly retail applications per underwriter, by lender size
Sources: Mortgage Bankers Association and STRATMOR Group.
0%
20%
40%
60%
80%
100%
2003 2004 2005 2006 2007 2008 2009 2010 2011 2012 2013 2014 2015
Freddie Mac Fannie Mae Ginnie Mae
Large
Mid-size
0
20
40
60
80
100
120
140
160
180
200
2002 2003 2004 2005 2006 2007 2008 2009 2010 2011 2012 2013 2014

1 6 D E C L I N I N G A G E N C Y M B S L I Q U I D I T Y I S N O T A L L A B O U T F I N A N C I A L R E G U L A T I O N
PURCHASE ORIGINATIONS REMAIN MUTED
The void left by falling refinance originations unfortunately has not been filled by a proportionate
increase in purchase money originations – the purchase remains weak (figure 10, top chart). Although
house prices have recovered most of their lost ground, slow wage growth and tight credit standards
have prevented millions of households from getting a mortgage. In addition, geographical mobility for
both homeowners and renters has been in a secular decline for the past 25 years (figure 10, bottom
chart). Together, these factors have created significant headwinds for the purchase market, causing
origination volumes (and therefore issuances) to decline.
FIGURE 10
Purchase Originations Haven’t Yet Compensated for the Steep Fall in Refinances
Agency securitization volume by origination type, January 2013–June 2015 (billions of dollars)
Source: Urban Institute calculations based on eMBS data.
Geographical Mobility Has Been Declining for Decades
Share of movers by housing type, 1988–2013
Sources: US Bureau of the Census, CPS Historical Geographical Mobility tables, and Urban Institute.
0
20
40
60
80
100
120
140
160
Jan 2013 Jul 2013 Jan 2014 Jul 2014 Jan 2015
Purchase Refinance Total
9.5%
5.1%
35.2%
24.9%
19
88
19
89
19
90
19
91
19
92
19
93
19
94
19
96
19
97
19
98
19
99
20
00
20
01
20
02
20
03
20
04
20
05
20
06
20
07
20
08
20
09
20
10
20
11
20
12
20
13
Owner-occupied units Renter-occupied units
D E C L I N I N G A G E N C Y M B S L I Q U I D I T Y I S N O T A L L A B O U T F I N A N C I A L R E G U L A T I O N 1 7
The Future of Agency MBS Liquidity
Capital markets have fundamentally changed during the last few years. These changes are a direct
outcome of the excessive risk-taking before the housing crisis and the subsequent policy, regulatory,
and industry response to reduce that risk. Although the days of market panic are long gone, the after-
effects of the crisis—including the near-universal focus on de-risking among consumers, industry, and
regulators—continue to drive the trends described in this brief. There are also no signs yet that these
trends will reverse materially in the foreseeable future, leading us to believe that present levels of
liquidity are here to stay.
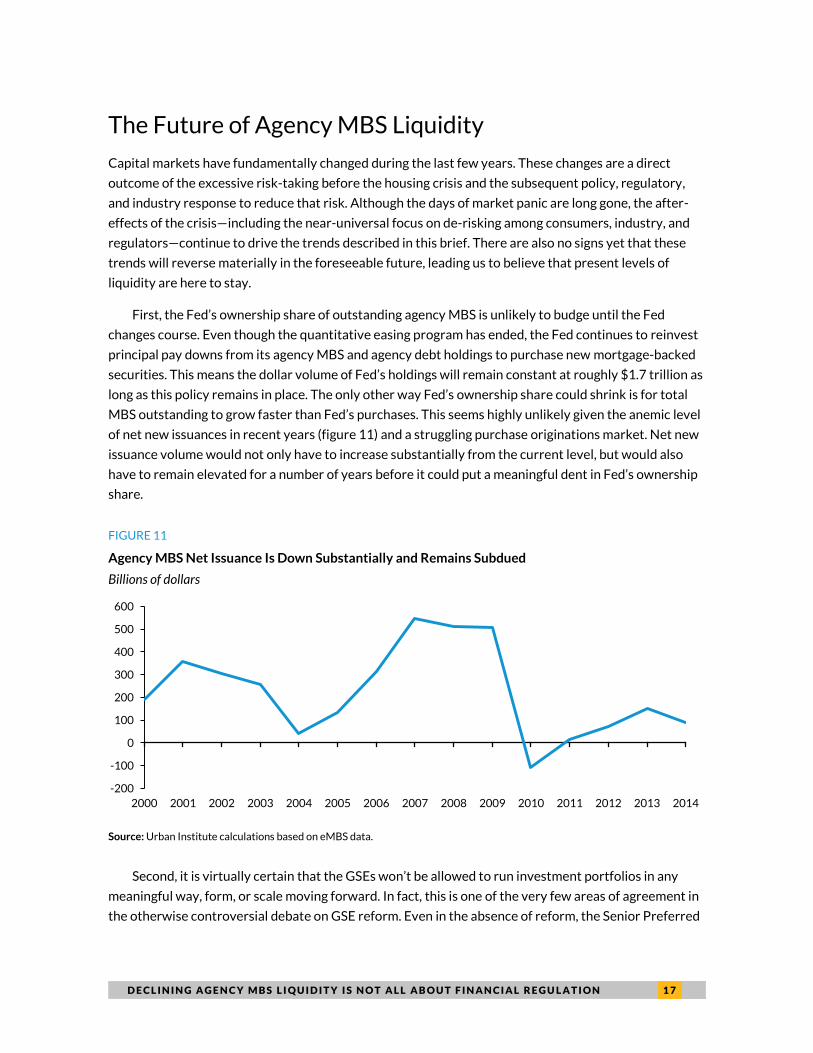
First, the Fed’s ownership share of outstanding agency MBS is unlikely to budge until the Fed
changes course. Even though the quantitative easing program has ended, the Fed continues to reinvest
principal pay downs from its agency MBS and agency debt holdings to purchase new mortgage-backed
securities. This means the dollar volume of Fed’s holdings will remain constant at roughly $1.7 trillion as
long as this policy remains in place. The only other way Fed’s ownership share could shrink is for total
MBS outstanding to grow faster than Fed’s purchases. This seems highly unlikely given the anemic level
of net new issuances in recent years (figure 11) and a struggling purchase originations market. Net new
issuance volume would not only have to increase substantially from the current level, but would also
have to remain elevated for a number of years before it could put a meaningful dent in Fed’s ownership
share.
FIGURE 11
Agency MBS Net Issuance Is Down Substantially and Remains Subdued
Billions of dollars
Source: Urban Institute calculations based on eMBS data.
Second, it is virtually certain that the GSEs won’t be allowed to run investment portfolios in any
meaningful way, form, or scale moving forward. In fact, this is one of the very few areas of agreement in
the otherwise controversial debate on GSE reform. Even in the absence of reform, the Senior Preferred
-200
-100
0
100
200
300
400
500
600
2000 2001 2002 2003 2004 2005 2006 2007 2008 2009 2010 2011 2012 2013 2014
1 8 D E C L I N I N G A G E N C Y M B S L I Q U I D I T Y I S N O T A L L A B O U T F I N A N C I A L R E G U L A T I O N
Stock Purchase Agreements with the Treasury require both GSE portfolios to be downsized by 15
percent a year until they each hit $250 billion. This means Fannie Mae’s current portfolio of $390 billion
needs to shrink an additional $140 billion, while Freddie’s $383 billion portfolio needs to shrink another
$133 billion. Of course, not all of this $273 billion in additional reduction will come out of GSEs’ agency
MBS holdings. But a significant chunk will, further diminishing the role of two traditionally active
market participants.
Finally, there is no concrete reason to expect any meaningful softening of the stringent regulatory
requirements put in place after the crisis. Over the past several years, regulators have focused almost
exclusively on reducing individual firm and systemic risks and there are no signs that the environment is
going to ease. The leverage ratio requirements especially have led to a reduction in dealer market-
making activity. Some regulators are reportedly discussing a possible concession that, if implemented,
could mildly soften the leverage ratio requirement for financial firms,11
but these discussions are very
preliminary, and not everyone is on board.12
And, perhaps most important, the last thing regulators
want is to be accused of going easy on Wall Street.
Conclusion
The euphoria in the run-up to the financial crisis, which was caused by ever-increasing house prices,
investor complacency, weak capital requirements, inadequate oversight of financial firms, and
unchecked leverage, led to a strong increase in demand for all asset classes, including agency mortgage-
backed securities. The result was not only an asset price bubble, but also a “liquidity bubble,” which
burst along with the asset price bubble. If excessive risk-taking led to an increase in liquidity previously,
then it should be no surprise that a reduction in risk will cause liquidity to decline. Part of this reduction
in risk and liquidity is no doubt driven by tighter regulation, but it is also driven by an extraordinary shift
in MBS ownership pattern as well as weak mortgage originations and issuance activity. The new
regulatory safeguards have had their intended effect of reducing the amount of risk taken by financial
firms. But to expect a reduction in risk without causing some impact on liquidity is trying to have it both
ways.
Notes
1. For example, see Chris Cumming, “Mortgage-Backed Bond Slump Could Portend Liquidity Crunch,” National Mortgage News, May 8, 2015, http://www.nationalmortgagenews.com/news/secondary/mortgage-backed-bond-slump-could-portend-liquidity-crunch-1050362-1.html; Matt Levine, “People Are Worried about Bond Market Liquidity,” Bloomberg View, June 3, 2015,http://www.bloombergview.com/articles/2015-06-03/people-are-worried-about-bond-market-liquidity; Lisa Abramowicz, “The Scariest Word in Bond Markets Is Also the Least Understood,” Bloomberg News, May 22, 2015, http://www.bloomberg.com/news/articles/2015-05-22/the-scariest-word-in-bond-markets-is-also-the-least-understood; and Sarah Krouse, “Wall Street Bemoans Bond Market Liquidity Squeeze,” The Wall Street Journal, June 22, 2015, http://blogs.wsj.com/moneybeat/2015/06/02/wall-street-bemoans-bond-market-liquidity-squeeze/?mod=WSJBlog
D E C L I N I N G A G E N C Y M B S L I Q U I D I T Y I S N O T A L L A B O U T F I N A N C I A L R E G U L A T I O N 1 9
2. See Hugh Son, Sonali Basak and Doni Bloomfield, “'Once-in-3-Billion-Year' Jump in Bonds Was a Warning Shot, Dimon Says,” Bloomberg News, April 8, 2015, http://www.bloomberg.com/news/articles/2015-04-08/dimon-says-once-in-3-billion-year-treasury-move-a-warning-shot-; and Finbarr Flynn and Takako Taniguchi, “Prudential Chief Echoes Dimon Saying Liquidity Is Top Worry,” Bloomberg News, April 13, 2015, http://www.bloomberg.com/news/articles/2015-04-14/prudential-chief-says-biggest-worry-is-liquidity-echoing-dimon
3. See Tobias Adrian, Michael Fleming, and Ernst Schaumburg, “Introduction to a Series on Market Liquidity,” Liberty Street Economics (blog), Federal Reserve Bank of New York, August 17, 2015, http://libertystreeteconomics.newyorkfed.org/2015/08/introduction-to-a-series-on-market-liquidity.html; William C. Dudley, president and chief executive officer, Federal Reserve Bank of New York, “Regulation and Liquidity Provision” (remarks at the SIFMA Liquidity Forum, New York City, September 30, 2015), http://www.newyorkfed.org/newsevents/speeches/2015/dud150930.html; and Richard Leong, “Ample Liquidity in U.S. Corporate Bond Market: N.Y. Fed,” Reuters, October 5, 2015, http://www.reuters.com/article/2015/10/05/us-usa-corporatebonds-fed-idUSKCN0RZ1RE20151005.
4. Joseph Tracy and Joshua Wright, “Why Mortgage Refinancing Is Not a Zero-Sum Game,” Liberty Street Economics (blog), Federal Reserve Bank of New York, January 11, 2012, http://libertystreeteconomics.newyorkfed.org/2012/01/why-mortgage-refinancing-is-not-a-zero-sum-game.html.
5. Sean Campbell, Canlin Li, and Jay Im, “Measuring Agency MBS Market Liquidity with Transaction Data,” FEDS Notes, Board of Governors of the Federal Reserve, January 31, 2014, http://www.federalreserve.gov/econresdata/notes/feds-notes/2014/measuring-agency-mbs-market-liquidity-with-transaction-data-20140131.html.
6. Suzanne Walker Barton and Liz McCormick, “There’s Lots of Liquidity in Treasuries, Except When Needed Most,” Bloomberg News, October 6, 2015, http://www.bloomberg.com/news/articles/2015-10-06/there-s-lots-of-liquidity-in-treasuries-except-when-needed-most.
7. Tobias Adrian, Michael Fleming, Daniel Stackman, and Erik Vogt, ”What’s Driving Dealer Balance Sheet Stagnation?” Liberty Street Economics (blog), Federal Reserve Bank of New York, August 21, 2015, http://www.newyorkfed.org/research/publication_annuals/research_topics20150922.html.
8. See Bloomberg News, “HSBC Exits Mortgage Securities,” New York Times, November 9, 2007, http://www.nytimes.com/2007/11/09/business/09hsbc.html; Ankush Sharma, “Royal Bank of Scotland to Exit U.S. Mortgage Business,” Reuters, November 13, 2014, http://www.reuters.com/article/2014/11/14/royal-bank-scot-divestiture-idUSL3N0T400G20141114; Nathan Layne and Emi Emoto, “Nomura to Exit U.S. Residential Mortgage Securities,” Reuters, October 15, 2007, http://www.reuters.com/article/2007/10/15/us-nomura-usa-idUST27041620071015; and Jody Shenn, “Barclays to End Trading in $700 Billion of Mortgage Bonds,” Bloomberg News, June 17, 2015, http://www.bloomberg.com/news/articles/2015-06-17/barclays-to-end-trading-in-700-billion-of-u-s-mortgage-bonds.
9. See the third amendment to the GSEs’ Senior Preferred Stock Purchase Agreements, at http://www.treasury.gov/press-center/press-releases/Documents/Freddie.Mac.Amendment.pdf; http://www.treasury.gov/press-center/press-releases/Documents/Fannie.Mae.Amendement.pdf
10. The GSE combined portfolios currently total about $772 billion; $270 billion of this is agency MBS. The rest is non-agency MBS and whole loans.
11. Timothy G. Massad, chairman, US Commodity Futures Trading Commission (keynote address before the Institute of International Bankers, Washington, DC, March 2, 2015), http://www.cftc.gov/PressRoom/SpeechesTestimony/opamassad-13.
12. Silla Brush and Jesse Hamilton, “Bank Regulators Considering Concessions on Key Capital Rule,” Bloomberg News, August 26, 2015, http://www.bloomberg.com/news/articles/2015-08-26/banks-said-to-gain-ground-in-effort-to-ease-leverage-ratio-rule.

2 0 D E C L I N I N G A G E N C Y M B S L I Q U I D I T Y I S N O T A L L A B O U T F I N A N C I A L R E G U L A T I O N
References
Borio, Claudio. 2000. “Special Feature: Market Liquidity and Stress: Selected Issues and Policy Implications.” IBIS Quarterly Review (May): 38–51. https://www.bis.org/publ/r_qt0011e.pdf.
Elliott, Douglas J. 2015. “Market Liquidity: A Primer.” Washington, DC: Brookings Institution. http://www.brookings.edu/~/media/research/files/papers/2015/06/market-liquidity/elliott--market-liquidity--a-primer_06222015.pdf.
Pearce, James E., and James C. Miller III. 2001. “Freddie Mac and Fannie Mae: Their Funding Advantage and Benefits to Consumers.” McLean, VA: Freddie Mac. http://www.freddiemac.com/news/pdf/cbo-final-pearcemiller.pdf.
PricewaterhouseCoopers. 2015. Global Financial Markets Liquidity Study. London: PricewaterhouseCoopers. http://preview.thenewsmarket.com/Previews/PWC/DocumentAssets/394415.pdf.
Vickery, James, and Joshua Wright. 2013. “TBA Trading and Liquidity in the Agency MBS Market.” FRBNY Economic Policy Review (May): 1–18. http://www.newyorkfed.org/research/epr/2013/1212vick.pdf.

About the Authors
Karan Kaul is a research associate in the Housing Finance Policy Center, where he
researches topical housing finance issues to highlight the market impact of ongoing
regulatory, industry, and related developments. He is also responsible for monitoring
and reporting on mortgage market trends and current events weekly. He brings a deep
understanding of key GSE reform issues, political landscape surrounding reform, and
pros and cons of different approaches concerning their impact on mortgage rates,
credit availability, private capital, and other factors.
Kaul came to Urban after five years at Freddie Mac, where he worked on various
housing policy issues primarily related to the future of housing finance and the reform
of the government-sponsored enterprises. Before Freddie Mac, Kaul worked as a
research analyst covering financial institutions. He holds a bachelor’s degree in
electrical engineering and an MBA from the University of Maryland, College Park.
Laurie Goodman is the director of the Housing Finance Policy Center at the Urban
Institute. The center is dedicated to providing policymakers with data-driven analysis
of housing finance policy issues that they can depend on for relevance, accuracy, and
independence. Before joining Urban in 2013, Goodman spent 30 years as an analyst
and research department manager at a number of Wall Street firms. From 2008 to
2013, she was a senior managing director at Amherst Securities Group, LP, where her
strategy effort became known for its analysis of housing policy issues. From 1993 to
2008, Goodman was head of global fixed income research and manager of US
securitized products research at UBS and predecessor firms, which were ranked
number one by Institutional Investor for 11 straight years. Before that, she was a
senior fixed income analyst, a mortgage portfolio manager, and a senior economist at
the Federal Reserve Bank of New York. Goodman was inducted into the Fixed Income
Analysts Hall of Fame in 2009.
Goodman is on the board of directors of MFA Financial, is an advisor to Amherst
Capital Management, and is a member of the Bipartisan Policy Center’s Housing
Commission, the Federal Reserve Bank of New York’s Financial Advisory Roundtable,
and the New York State Mortgage Relief Incentive Fund Advisory Committee. She has
published more than 200 journal articles and has coauthored and coedited five books.
Goodman has a BA in mathematics from the University of Pennsylvania and an MA and
PhD in economics from Stanford University.
2 2 D E C L I N I N G A G E N C Y M B S L I Q U I D I T Y I S N O T A L L A B O U T F I N A N C I A L R E G U L A T I O N
Acknowledgments
The Urban Institute’s Housing Finance Policy Center (HFPC) was launched with generous support at the
leadership level from the Citi Foundation and John D. and Catherine T. MacArthur Foundation. Additional support
was provided by The Ford Foundation and The Open Society Foundations.
Ongoing support for HFPC is also provided by the Housing Finance Council, a group of firms and individuals
supporting high-quality independent research that informs evidence-based policy development. Funds raised
through the Council provide flexible resources, allowing HFPC to anticipate and respond to emerging policy issues
with timely analysis. This funding supports HFPC’s research, outreach and engagement, and general operating
activities.
This brief was funded by these combined sources. We are grateful to our funders, who make it possible for Urban to
advance its mission.
The views expressed are those of the author and should not be attributed to the Urban Institute, its trustees, or its
funders. Funders do not determine our research findings or the insights and recommendations of our experts.
Further information on the Urban Institute’s funding principles is available at www.urban.org/support.
ABOUT THE URBAN INST ITU TE The nonprofit Urban Institute is dedicated to elevating the debate on social and
economic policy. For nearly five decades, Urban scholars have conducted research
and offered evidence-based solutions that improve lives and strengthen
communities across a rapidly urbanizing world. Their objective research helps
expand opportunities for all, reduce hardship among the most vulnerable, and
strengthen the effectiveness of the public sector.
Copyright © October 2015. Urban Institute. Permission is granted for reproduction
of this file, with attribution to the Urban Institute.
2100 M Street NW
Washington, DC 20037
www.urban.org


![[Bank of America] An Introduction to Agency MBS Derivatives.pdf](https://img.pdfslide.us/doc/110x75/55cf9904550346d0339b0e6e/bank-of-america-an-introduction-to-agency-mbs-derivativespdf.jpg)


![[Bank of America] Prepayments on Agency Hybrid ARM MBS](https://img.pdfslide.us/doc/110x75/577d38c61a28ab3a6b9877d9/bank-of-america-prepayments-on-agency-hybrid-arm-mbs.jpg)


![An Introduction to Agency MBS Derivatives-[Bank of America]](https://img.pdfslide.us/doc/110x75/55cf99cd550346d0339f42bb/an-introduction-to-agency-mbs-derivatives-bank-of-america.jpg)