Embed Size (px)
Citation preview
Declines in benthic macroinvertebratepopulations in southern Lake Michigan,1980–1993
Thomas F. Nalepa, David J. Hartson, David L. Fanslow, Gregory A. Lang, andStephen J. Lozano
Abstract: Densities of the major benthic macroinvertebrate groups declined dramatically at sites shallower than 50 min southern Lake Michigan between 1980 and 1993. Declines inDiporeia, Oligochaeta, and Sphaeriidae ranged from40 to 75% at these depths. Total densities declined from 16 800·m–2 in 1980–1981 to 4800·m–2 in 1992–1993 at sitesin the 16–30 m depth interval and from 21 300 to 11 300·m–2 at sites in the 31–50 m depth interval. Changes at sitesdeeper than 50 m were minimal; only sphaeriids declined to any extent. Declines in oligochaetes and sphaeriidsoccurred uniformly throughout the nearshore region and over the entire sampling period. Declines in these two groupswere most likely related to reductions in phosphorus loads and a general decrease in productivity in the nearshore areaover the sampling period. On the other hand, declines inDiporeia occurred mainly in the later portion of the samplingperiod and were greatest in the southeastern region of the lake. Densities at many sites in the southeastern region were<100·m–2 in 1993, down from 3000–8000·m–2 in 1980–1987. We hypothesize that the filtering activities of largepopulations ofDreissena polymorphain nearshore waters may be having a negative impact onDiporeia in deeperwaters by decreasing the amount of food available to this surface-feeding detritivore.
Résumé: La densité des principaux groupes de macroinvertébrés benthiques a fortement diminué entre 1980 et 1993dans les zones peu profondes (<50 m) du sud du lac Michigan. Les déclins observés chezDiporeia, les oligochètes etles sphaeriides atteignaient 40 à 75% à ces profondeurs. Les densités totales sont passées de 16 800·m–2 en 1980–1981à 4 800·m–2 en 1992–1993 dans les zones de 16 à 30 m de profondeur et de 21 300 à 11 300·m–2 dans les zones de 31à 50 m de profondeur. Dans les secteurs plus profonds, les changements étaient de façon générale peu importants, lesseuls déclins prononcés ayant été observés chez les sphaeriides. Les déclins chez les oligochètes et les sphaeriides sesont produits de façon uniforme à l’échelle de toute la zone côtière et durant toute la durée de l’échantillonnage. Lesdéclins chez ces deux groupes étaient vraisemblablement attribuables à des réductions des charges de phosphore et àune diminution générale de la productivité dans la zone côtière durant la période d’échantillonnage. ChezDiporeia, lesdéclins ont été observés principalement durant la dernière portion de la période d’échantillonnage et se sont révélésplus prononcés dans la région sud-est du lac. En plusieurs endroits de cette région, les densités sont passées de 3 000 à8 000·m–2 en 1980–1987 à <100·m–2 en 1993. Nous croyons que la filtration exercée par les fortes populations deDreissena polymorphadans les eaux côtières pourrait avoir nui aux populations deDiporeia établies en zones plusprofondes en réduisant la quantité de nourriture disponible pour cette espèce détritivore se nourrissant en surface.
[Traduit par la Rédaction] Nalepa et al. 2413
Over the past few decades, nearshore regions of the GreatLakes have undergone dramatic changes in real and per-ceived trophic status as a result of two important events: the
planned reduction of nutrient loads and the establishment ofthe zebra mussel (Dreissena polymorpha). Reductions inphosphorus inputs have led to declines in phytoplanktonabundances and shifts in algal species composition in near-shore waters (Edsall and Charlton 1996) whereas the filter-ing activities ofD. polymorphahave reduced phytoplankton,increased water clarity, and shifted productivity from thepelagic to the benthic region without any real change introphic status (Fahnenstiel et al. 1995a, 1995b). Becausebenthic macroinvertebrate communities integrate changes inboth the pelagic and benthic regions, trends in abundancesand species composition are useful in assessing changes inoverall system productivity as well as interpreting causes ofobserved changes.
Prior to the mid-1970s, excessive nutrient loads (phospho-rus) in the Great Lakes led to increased pelagic productivityand deterioration of the benthic environment. Macroinverte-brate species that could best take advantage of increased
Can. J. Fish. Aquat. Sci.55: 2402–2413 (1998) © 1998 NRC Canada
2402
Received February 5, 1998. Accepted July 17, 1998.J14409
T.F. Nalepa,1 D.L. Fanslow, and G.A. Lang. Great LakesEnvironmental Research Laboratory, NOAA, 2205Commonwealth Blvd., Ann Arbor, MI 48105. U.S.A.D.J. Hartson. Cooperative Institute for Limnology andEcosystems Research, University of Michigan, 2200 BonisteelBlvd., Ann Arbor, MI 48109, U.S.A.S.J. Lozano.U.S. Environmental Protection Agency,Mid-Continent Ecology Division, 6201 Congdon Blvd.,Duluth, MN 55804, U.S.A.
1Author to whom all correspondence should be addressed.e-mail: [email protected]
I:\cjfas\cjfas55\CJfas-11\F98-112.vpTuesday, November 24, 1998 9:03:37 AM
Color profile: DisabledComposite Default screen
food inputs to the benthic region became abundant, whilemore sensitive forms declined (see Cook and Johnson 1974for review). Since the reduction of phosphorus loads, therehas been a general shift to communities indicative of im-proved conditions; changes in densities and species compo-sition have generally been the reverse of changes whenconditions were deteriorating (Johnson and McNeil 1986;Schloesser et al. 1995). For instance, in the Bay of Quinte,the density and biomass of some major benthic groups (oli-gochaetes, sphaeriids, and chironomids) declined between1966 and 1984 in response to a decline in phosphorus loadsand bay productivity (Johnson and McNeil 1986). Also, inwestern Lake Erie, declines in oligochaete abundances andshifts in species composition in nearshore waters between1961 and 1982 indicated improved water quality (Schloesseret al. 1995).
The introduction and widespread abundance ofD. poly-morpha have confounded our interpretations of trophictrends using benthic macroinvertebrate communities. Theoverall impact ofD. polymorpha’s filtering activities on ben-
thic populations has varied, depending on the feeding modeand life habit of the particular species or taxonomic group.Dreissena polymorphahas had a negative impact on sometaxa via competitive exclusion (Nalepa et al. 1996; Dermottand Kerec 1997), a positive impact by increasing habitatcomplexity and detrital food (Stewart and Haynes 1994,Botts et al. 1996), or no impact at all (Dermott and Kerec1997).
In this study, we assess long-term changes in benthicmacroinvertebrate populations of the southern basin of LakeMichigan. Benthic communities in this basin are greatly in-fluenced by changes in nutrient loads, since a large portion(43%) of suspended material and total phosphorus enters thelake at the southern end (Robertson 1997). We collectedsamples in 1986–1987 and in 1992–1993 at the same sitesthat were sampled in 1980–1981 (Nalepa 1987). In the1980–1981 survey, densities of the major benthic macroin-vertebrate groups (Diporeia (Amphipoda), Oligochaeta, andSphaeriidae) increased over twofold between the mid-1960sand 1980–1981 at depths <50 m (Nalepa 1987). This finding
© 1998 NRC Canada
Nalepa et al. 2403
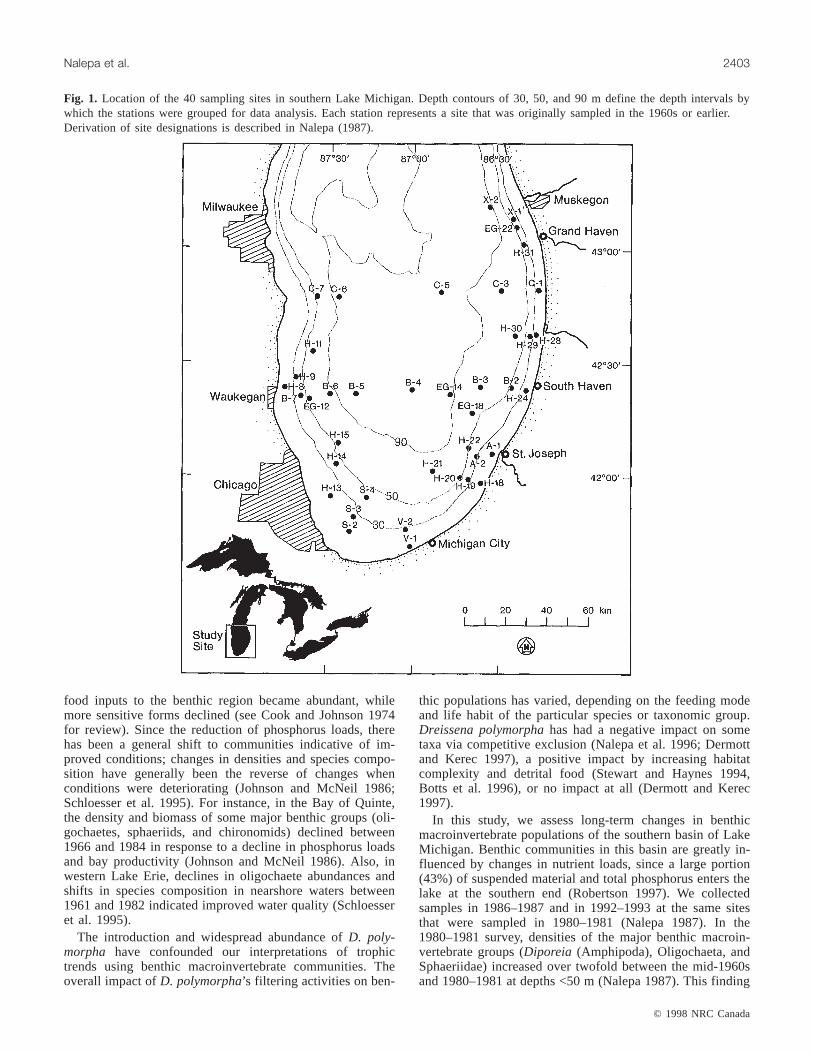
Fig. 1. Location of the 40 sampling sites in southern Lake Michigan. Depth contours of 30, 50, and 90 m define the depth intervals bywhich the stations were grouped for data analysis. Each station represents a site that was originally sampled in the 1960s or earlier.Derivation of site designations is described in Nalepa (1987).
I:\cjfas\cjfas55\CJfas-11\F98-112.vpTuesday, November 24, 1998 9:03:41 AM
Color profile: DisabledComposite Default screen

© 1998 NRC Canada
2404 Can. J. Fish. Aquat. Sci. Vol. 55, 1998
followed a similar trend of increasing densities between theearly 1930s and 1964 (Robertson and Alley 1966). Bothstudies attributed increased densities to accelerated nutrientloads and higher productivity within the lake between the1950s and early 1970s (Chapra 1977; Schelske 1978). Apositive, direct relationship between pelagic productivityand densities of amphipods, oligochaetes, and sphaeriids is acommon feature of large, deep lakes (Saether 1980). Reduc-tions in phosphorus loads in the mid-1970s led to declines intotal phosphorus, summer epilimnetic chlorophyll, and theintensity of the spring diatom bloom by the late 1970s –early 1980s (Vandercastle 1985; Scavia et al. 1986; Changand Rossman 1988). Nalepa (1987) hypothesized thatmacroinvertebrate densities in southern Lake Michigan in1980–1981 had not yet reflected observed productivity de-clines in the pelagic region. Since phosphorus loads havecontinued to decline through the 1980s (Johengen et al.1994), our subsequent surveys were designed to determine ifthe macroinvertebrate community had now responded tothese productivity changes. Furthermore, withD. polymor-pha becoming established in southern Lake Michigan in1989 (Marsden et al. 1993), our surveys provide a relativemeasure of initial changes in the macroinvertebrate commu-nity that may have resulted fromD. polymorphafiltering ac-tivities.
Samples were collected in 1986–1987 and 1992–1993 at thesame 40 sites sampled in 1980–1981 using exactly the same meth-ods (Nalepa 1987) (Fig. 1). Bottom substrates ranged from coarsesand and gravel to fine silt, and sampling depths ranged from 16 to157 m. Exact location, water depth, and substrate type at each siteare given in Nalepa et al. (1985). Sampling was conducted inspring (mid-May – early June), summer (late July – early August),and fall (September–October) over a 1-week period in each seasonof each year. The sampling period sometimes extended longer than1 week because of poor weather conditions. Samples were taken intriplicate with a Ponar grab (area = 0.046 m2) and washed into anelutriation device fitted with a nitex sleeve having 0.5-mm open-ings (Nalepa et al. 1985). Retained material was immediately pre-served in 10% buffered formalin containing rose bengal stain.
Retained residue was placed into a white enamel pan and organ-isms were picked, counted, and sorted into major benthic groups(Diporeia, Oligochaeta, Sphaeriidae, Chironomidae, Gastropoda,D. polymorpha, and others). In some samples, the number of or-ganisms was extremely large and only a randomly chosen portion(one eighth to one half) of the residue was picked and then appliedto the entire sample. All organisms collected in 1980–1981 and1992–1993 were identified to the lowest practical taxonomic level,but organisms collected in 1986–1987 were identified only to thegroup level as given above. For oligochaetes, between 75 and 100individuals in a replicate (proportionately split with a Folsomplankton splitter when numbers were higher) were cleared in lacto-phenol before identification. Only oligochaetes with a prostomiumwere included in abundance estimates. Since fragments (withoutprostomium) can only be recognized during the process of speciesidentification and not when counted and sorted, the total number ofoligochaetes in 1986–1987 at each site was corrected based on themean proportion of fragments found in the other four years at thesame site.
Spatial and temporal trends were examined by dividing
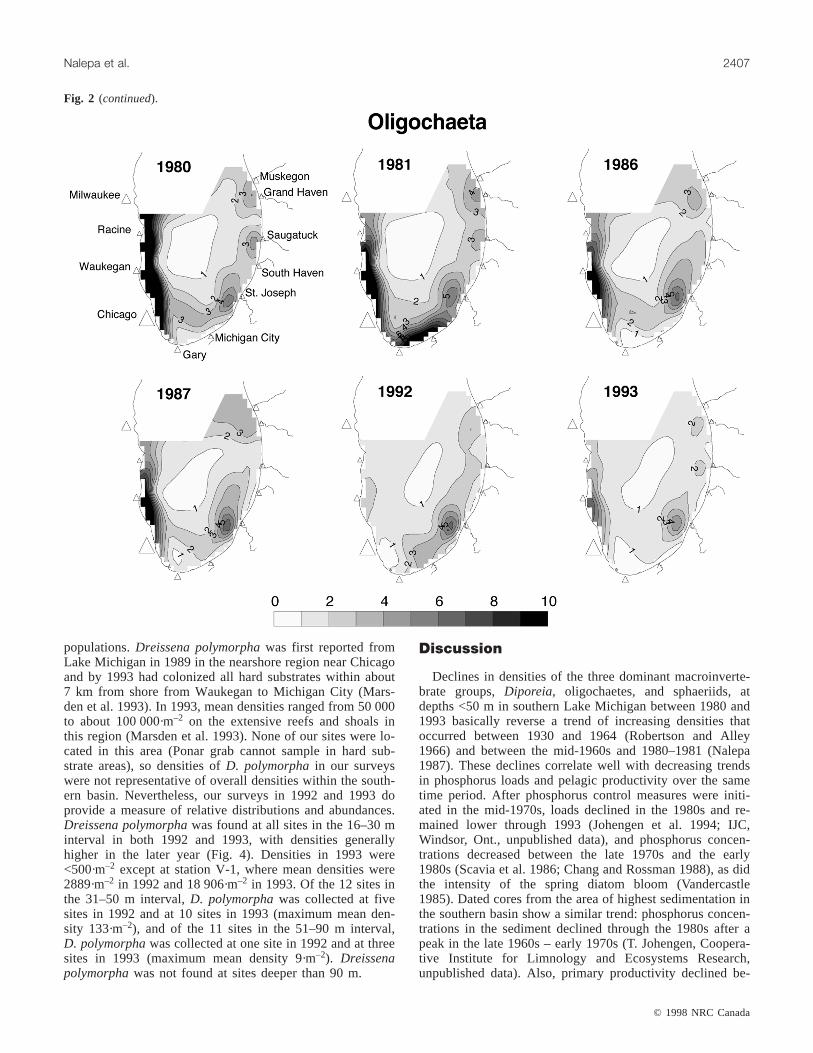
the sampling sites into four depth intervals (16–30, 31–50,51–90, and >90 m) and calculating yearly means for thethree major macroinvertebrate groups,Diporeia, Oligo-chaeta, and Sphaeriidae. These depth intervals are consistentwith prior characterization of depth–macroinvertebrate asso-ciations in Lake Michigan (Alley and Mozley 1975; Nalepa1987) and approximate regions of varying sediment resus-pension and deposition within the southern basin (Chambersand Eadie 1981; Eadie et al. 1984). Between 1980 and 1993,there was a general downward trend in density in each of thethree macroinvertebrate groups at the 16–30 and 31–50 mintervals (Table 1). At these two shallowest intervals,Diporeia declined 68 and 43%, respectively, oligochaetesdeclined 75 and 40%, and sphaeriids declined 75 and 72%.Overall, total mean density at the 11 sites in the 16–30 m in-terval declined from 16 800·m–2 in 1980 to 4800·m–2 in1993, while total mean density at the 12 sites in the 31–50 minterval declined from 21 300 to 11 300·m–2. Yearly differ-ences at these two shallow intervals were significant foreach group (ANOVA,P < 0.01) except for sphaeriids at 16–30 m (P = 0.16) (Table 1). When yearly differences weresignificant, multiple range tests (Tukey HSD) indicated thatdensities in 1993 were significantly lower (P < 0.05) thandensities in most other years except for densities in 1992(Table 1).
Density trends at the two deeper intervals were not asconsistent as at the shallower intervals. Overall, a downwardtrend in total density was not readily apparent (Table 1).Yearly differences were significant forDiporeia at these twodeeper depth intervals (P < 0.001), but mean densities ofDiporeia in 1992 or 1993 were not always lower than meansin previous years (see low densities in 1981 at both inter-vals; Table 1). For oligochaetes, densities at the 51–90 m in-terval were lowest in 1993, but were only significantly lowerthan densities in 1980 (Tukey HSD,P < 0.05). Yearly differ-ences in density at the >90 m interval were not significant(P = 0.80). Yearly differences in sphaereiid densities weresignificant at both intervals (P < 0.05), with lowest densitiesoccurring in 1993.
Since the 1986–1987 survey was conducted just prior tothe establishment ofD. polymorphain Lake Michigan, thesesurvey years are important when comparing potential im-pacts of phosphorus reductions versusD. polymorphafilter-ing activities. Declines between 1980–1981 and 1986–1987represent potential responses to phosphorus load reductions,while declines between 1986–1987 and 1992–1993 representpotential responses to both phosphorus reductions andD. polymorpha. In order to distinguish the relative impact ofthese two events, we calculated and then compared rates ofdecline (percent decline per year) for the two time periods(1980–1981 to 1986–1987, 1986–1987 to 1992–1993) foreach of the three groups (Table 2). At the 16–30 m interval,rates of decline were greater in the 1980–1981 to 1986–1987time period for oligochaetes and sphaeriids, but greater inthe 1986–1987 to 1992–1993 time period forDiporeia. De-cline rates in oligochaetes were significant for both time pe-riods (pairedt-test,P < 0.05) (Table 2), declines inDiporeiawere significant only in the later period, and declines insphaeriids were not significant (P > 0.05) for either period.This suggests that, of the three groups, oligochaetes weremost responsive to nutrient reductions and thatDiporeia
I:\cjfas\cjfas55\CJfas-11\F98-112.vpTuesday, November 24, 1998 9:03:42 AM
Color profile: DisabledComposite Default screen

may have been most affected byD. polymorpha.For the 31–50 m interval, rates of decline in all three groups weregreater in the 1986–1987 to 1992–1993 time period. De-clines were significant (P < 0.05) (Table 2) for each groupduring this later period, but were not significant for the ear-lier period (P > 0.05).
The effects of sampling season (spring, summer, fall) werenot significant for any of the groups (ANOVA, log(x + 1)-transformed,P > 0.05) except forDiporeia at the 16–30 minterval (P = 0.02).Diporeia abundances were highest in thespring and declined through summer and fall. This specieshas a 1-year life cycle at these depths, and population densi-ties are high in the spring when newly hatched young enterthe population but then decline (Winnell and White 1984).
Declines in densities were observed at most all sites<50 m between 1980–1981 and 1992–1993 (Table 2). To de-termine if declines occurred to a similar extent over all sitesat these depths, all sites <50 m (23 total) were ranked by rel-ative mean density in both 1980–1981 and 1992–1993 and
rank differences between the two 2-year surveys compared.For oligochaetes and sphaeriids, rank differences were notsignificant (chi-square,P > 0.05), indicating that relative de-clines in these two groups were consistent for all sites atthese depths. However, forDiporeia, there was a significantdifference in ranks (P < 0.01), indicating that densities atsome sites declined more than at others. Clearly,Diporeiadeclined to a greater extent at sites <50 m in the southeast-ern portion of the lake (Fig. 2). All 11 sites whereDiporeiadeclined more than 60% between 1980–1981 and 1992–1993 were located in this area of the lake (Fig. 3). The meandecline at these sites was 81.6% (range 60.3–99.2%), whilethe mean decline at the other sites whereDiporeia decreasedwas only 26.2% (range 7.0–49.0%). At four of the sites(A-1, H-18, S-2, V-1), densities in 1993 were <100·m–2.Mean densities at these same sites in 1980–1987 rangedfrom 3381 to 8294·m–2.
The trophic status of the most common oligochaete spe-cies is generally well known; thus, community composition
© 1998 NRC Canada
Nalepa et al. 2405
1980 1981 1986 1987 1992 1993 ANOVA
Depth: 16–30 mDiporeia 8 310±1242a 7 455±987a 8 041±1292a 5 377±826a 2 618±504b 2 698±543b <0.001Oligochaeta 6 393±2286a 5 613±1578a 3 127±933ab 2 925±960ab 1 713±376ab 1 647±434b <0.002Sphaeriidae 2 129±577 2 643±741 1 257±345 1 348±347 1 381±384 535±123<0.156Total 16 832 15 711 12 425 9 650 5 712 4 880
Depth: 31–50 mDiporeia 12 216±995a 9 693±622a 10 377±523a 10 524±594a 8 710±759ab 7 021±870b <0.003Oligochaeta 5 308±410a 4 692±349a 4 722±463a 5 004±584a 4 487±466ab 3 166±330b <0.002Sphaeriidae 3 789±396a 2 862±381a 2 394±255a 3 083±418a 2 273±303a 1 068±166b <0.001Total 21 313 17 247 17 493 18 611 15 470 11 255
Depth: 51–90 mDiporeia 6 466±285ac 5 071±375b 6 622±456ac 7 652±346ac 6 380±332ac 5 352±373ab <0.001Oligochaeta 2 190±184a 2 077±154ab 2 248±204ab 1 976±232ab 2 042±135ab 1 530±97b <0.026Sphaeriidae 758±93a 844±98a 838±122a 797±111a 801±153a 384±72b <0.001Total 9 414 7 992 9 708 10 425 9 223 7 266
Depth: >90 mDiporeia 3 662±363a 2 407±357b 5 314±537a 4 672±356a 3 195±389ab 3 226±515ab <0.001Oligochaeta 989±167 1 007±227 1 132±271 1 384±426 1 179±151 1 123±159<0.794Sphaeriidae 198±37a 191±53ab 329±184ab 151±46ab 113±30ab 98±36b <0.028Total 4 849 3 605 6 775 6 207 4 487 4 447
Note: Differences between years were tested using ANOVA on log(x + 1)-transformed values. Statistical tests and estimates of variability were basedon means of three replicates per site per sampling date. Values followed by a different letter are significantly different (Tukey HSD,P < 0.05).
Table 1. Mean (± SE) yearly densities (no.·m–2) of the three major macroinvertebrate groups at various depth intervals in southernLake Michigan.
Diporeia Oligochaeta Sphaeriidae
Depth: 16–30 m1980–1981 to 1986–1987 2.6 (6, 0.345) 8.2 (9, 0.014) 7.5 (7, 0.216)1986–1987 to 1992–1993 10.0 (8, 0.005) 7.4 (6, 0.009) 4.5 (8, 0.069)1980–1981 to 1992–1993 5.5 (11, <0.001) 6.0 (11, 0.001) 5.0 (11, 0.006)
Depth: 30–50 m1980–1981 to 1986–1987 0.7 (6, 0.758) 0.5 (7, 0.403) 2.9 (7, 0.549)1986–1987 to 1992–1993 4.1 (8, 0.014) 3.5 (10, 0.002) 6.5 (8, 0.031)1980–1981 to 1992–1993 2.3 (8, 0.085) 2.0 (11, 0.003) 4.1 (12, 0.001)
Note: Declines were calculated as the percent decline per year (assume 6 years between surveys). The first value in parentheses is the number of sitesshowing a decrease in densities over the given time period. The second value in parentheses is theP for a pairedt-test comparing densities of all sites inthat depth interval. For the 16–30 m interval, one site was not collected in 1986–1987; thus,n = 10 for the first two time periods andn = 11 for the last.Similarly, one site was not sampled in the 31–50 m interval in 1986–1987; thus,n = 11 for the first two time periods andn = 12 for the last.
Table 2. Rates of decline for the three major macroinvertebrate groups for each survey period.
I:\cjfas\cjfas55\CJfas-11\F98-112.vpTuesday, November 24, 1998 9:03:44 AM
Color profile: DisabledComposite Default screen

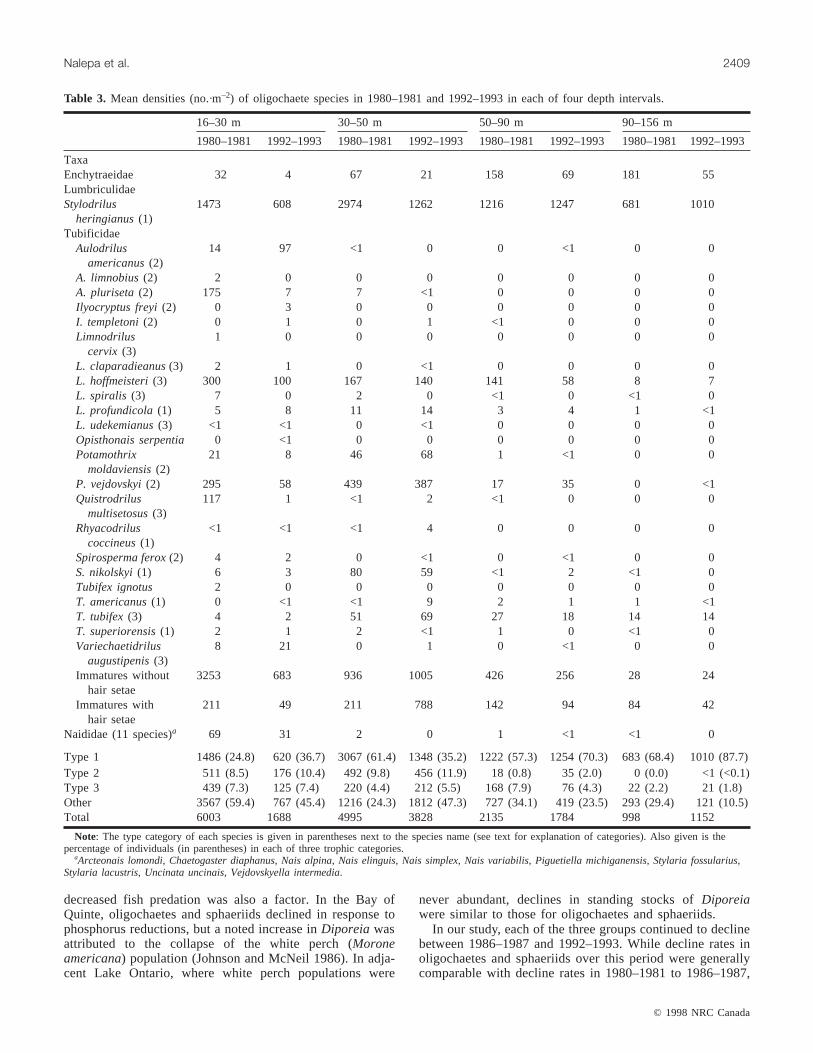
has often been used to assess a lake’s trophic state (Milbrink1983; Lauritsen et al. 1985) and also to assess changes introphic state over time (Lang and Reymond 1992; Schloes-ser et al. 1995). Species can be divided into three categoriesbased on their distribution and abundance relative to knownareas of enrichment: type 1, largely restricted to oligotrophicwaters; type 2, characteristic of mesotrophic conditions; type3, tolerant of extreme organic enrichment. The abundance ofeach of the major species and the percentage of individualsin each trophic category in 1980–1981 and 1992–1993 werecompared (Table 3). Dominant species in each category, re-gardless of time period, wereStylodrilus heringianusin type1 (98%),Potamothrix vejdovskyiin type 2 (73%), andLim-nodrilus hoffmeisteriin type 3 (72%). The proportion of in-dividuals in each trophic category (relative to the totalnumber collected) changed significantly (chi-square,P <0.05) between 1980–1981 and 1992–1993 at each depth in-terval (Table 3). In effect, differences between the two sur-vey periods were a result of changes in the proportion oftype 1 individuals, essentially allS. heringianus, and ofchanges in the proportion of individuals categorized as un-identifiable immatures. The proportion ofS. heringianusin-
creased between 1980–1981 and 1992–1993 at the 16–30,51–90, and >90 m intervals, while the proportion of uniden-tifiable immatures declined. BecauseS. heringianuscan beidentified to species even when immature, most of the un-identifiable individuals were likely species of types 2 and 3.These changes would indicate less eutrophic conditions in1992–1993 than in 1980–1981 at these depths. However,changes in species composition at the 31–50 m interval wereinconsistent with those at the other three depth intervals. Theproportion ofS. heringianusdeclined, while the proportionand actual abundance of unidentifiable immatures increased(Table 3).
Other commonly collected macroinvertebrate taxa in-cluded Chironomidae, Gastropoda, andD. polymorpha. Den-sities of the former two taxa were low, and they comprisedonly a minor portion of the total macroinvertebrate commu-nity. Mean yearly densities between 1980 and 1993 werehighest at the 16–30 m interval for both taxa and rangedfrom 173 to 320·m–2 for chironomids and from 13 to 88·m–2
for gastropods. Of special interest are the abundance anddistribution of D. polymorpha, since the filtering activitiesof this species can affect food inputs to macroinvertebrate
© 1998 NRC Canada
2406 Can. J. Fish. Aquat. Sci. Vol. 55, 1998
Fig. 2. Densities (no.·m–2 × 10³) of Diporeia, Oligochaeta, and Sphaeriidae in each of the survey years. (Figure 2 is continued on nextpage.)
I:\cjfas\cjfas55\CJfas-11\F98-112.vpTuesday, November 24, 1998 9:03:48 AM
Color profile: DisabledComposite Default screen
populations.Dreissena polymorphawas first reported fromLake Michigan in 1989 in the nearshore region near Chicagoand by 1993 had colonized all hard substrates within about7 km from shore from Waukegan to Michigan City (Mars-den et al. 1993). In 1993, mean densities ranged from 50 000to about 100 000·m–2 on the extensive reefs and shoals inthis region (Marsden et al. 1993). None of our sites were lo-cated in this area (Ponar grab cannot sample in hard sub-strate areas), so densities ofD. polymorphain our surveyswere not representative of overall densities within the south-ern basin. Nevertheless, our surveys in 1992 and 1993 doprovide a measure of relative distributions and abundances.Dreissena polymorphawas found at all sites in the 16–30 minterval in both 1992 and 1993, with densities generallyhigher in the later year (Fig. 4). Densities in 1993 were<500·m–2 except at station V-1, where mean densities were2889·m–2 in 1992 and 18 906·m–2 in 1993. Of the 12 sites inthe 31–50 m interval,D. polymorphawas collected at fivesites in 1992 and at 10 sites in 1993 (maximum mean den-sity 133·m–2), and of the 11 sites in the 51–90 m interval,D. polymorphawas collected at one site in 1992 and at threesites in 1993 (maximum mean density 9·m–2). Dreissenapolymorphawas not found at sites deeper than 90 m.
Declines in densities of the three dominant macroinverte-brate groups,Diporeia, oligochaetes, and sphaeriids, atdepths <50 m in southern Lake Michigan between 1980 and1993 basically reverse a trend of increasing densities thatoccurred between 1930 and 1964 (Robertson and Alley1966) and between the mid-1960s and 1980–1981 (Nalepa1987). These declines correlate well with decreasing trendsin phosphorus loads and pelagic productivity over the sametime period. After phosphorus control measures were initi-ated in the mid-1970s, loads declined in the 1980s and re-mained lower through 1993 (Johengen et al. 1994; IJC,Windsor, Ont., unpublished data), and phosphorus concen-trations decreased between the late 1970s and the early1980s (Scavia et al. 1986; Chang and Rossman 1988), as didthe intensity of the spring diatom bloom (Vandercastle1985). Dated cores from the area of highest sedimentation inthe southern basin show a similar trend: phosphorus concen-trations in the sediment declined through the 1980s after apeak in the late 1960s – early 1970s (T. Johengen, Coopera-tive Institute for Limnology and Ecosystems Research,unpublished data). Also, primary productivity declined be-
© 1998 NRC Canada
Nalepa et al. 2407
Fig. 2 (continued).
I:\cjfas\cjfas55\CJfas-11\F98-112.vpTuesday, November 24, 1998 9:03:51 AM
Color profile: DisabledComposite Default screen

tween the early 1980s and early 1990s (G.L. Fahnenstiel,Great Lakes Environmental Research Laboratory, personalcommunication); however, recent declines may be more re-lated to the filtering activities ofD. polymorpha than tophosphorus load reductions. With corresponding declines inmacroinvertebrate densities through the 1980s and early1990s, densities in 1993 were equal to or lower than densi-ties found in the mid-1960s (Table 4).
In the period between 1980–1981 and 1986–1987, whenproductivity in Lake Michigan was declining andD. poly-morphawas not yet present, the two groups that declined tothe greatest extent in the nearshore region were oligochaetesand sphaeriids, while declines inDiporeia were minimal.The two former groups generally respond directly tochanges in benthic food inputs (Wiederholm 1980; Clarke etal. 1997), but forDiporeia, other factors such as fish preda-tion may complicate interpretations of relationships betweenbenthic food inputs and abundances (Johnson and McNeil1986; McDonald et al. 1990). When densities of all threegroups increased two- to fivefold at depths <50 m betweenthe mid-1960s and 1980–1981, Nalepa (1987) attributed theincreases to enrichment and greater benthic food inputs but,in the case ofDiporeia, provided evidence that suggested
© 1998 NRC Canada
2408 Can. J. Fish. Aquat. Sci. Vol. 55, 1998
Fig. 2 (concluded).
Fig. 3. Region of the study area whereDiporeia declined morethan 60% between 1980–1981 and 1992–1993.
I:\cjfas\cjfas55\CJfas-11\F98-112.vpTuesday, November 24, 1998 9:03:56 AM
Color profile: DisabledComposite Default screen
decreased fish predation was also a factor. In the Bay ofQuinte, oligochaetes and sphaeriids declined in response tophosphorus reductions, but a noted increase inDiporeia wasattributed to the collapse of the white perch (Moroneamericana) population (Johnson and McNeil 1986). In adja-cent Lake Ontario, where white perch populations were
never abundant, declines in standing stocks ofDiporeiawere similar to those for oligochaetes and sphaeriids.
In our study, each of the three groups continued to declinebetween 1986–1987 and 1992–1993. While decline rates inoligochaetes and sphaeriids over this period were generallycomparable with decline rates in 1980–1981 to 1986–1987,
© 1998 NRC Canada
Nalepa et al. 2409
16–30 m 30–50 m 50–90 m 90–156 m
1980–1981 1992–1993 1980–1981 1992–1993 1980–1981 1992–1993 1980–1981 1992–1993
TaxaEnchytraeidae 32 4 67 21 158 69 181 55LumbriculidaeStylodrilus
heringianus(1)1473 608 2974 1262 1216 1247 681 1010
TubificidaeAulodrilus
americanus(2)14 97 <1 0 0 <1 0 0
A. limnobius(2) 2 0 0 0 0 0 0 0A. pluriseta(2) 175 7 7 <1 0 0 0 0Ilyocryptus freyi(2) 0 3 0 0 0 0 0 0I. templetoni(2) 0 1 0 1 <1 0 0 0Limnodrilus
cervix (3)1 0 0 0 0 0 0 0
L. claparadieanus(3) 2 1 0 <1 0 0 0 0L. hoffmeisteri(3) 300 100 167 140 141 58 8 7L. spiralis (3) 7 0 2 0 <1 0 <1 0L. profundicola(1) 5 8 11 14 3 4 1 <1L. udekemianus(3) <1 <1 0 <1 0 0 0 0Opisthonais serpentia 0 <1 0 0 0 0 0 0Potamothrix
moldaviensis(2)21 8 46 68 1 <1 0 0
P. vejdovskyi(2) 295 58 439 387 17 35 0 <1Quistrodrilus
multisetosus(3)117 1 <1 2 <1 0 0 0
Rhyacodriluscoccineus(1)
<1 <1 <1 4 0 0 0 0
Spirosperma ferox(2) 4 2 0 <1 0 <1 0 0S. nikolskyi(1) 6 3 80 59 <1 2 <1 0Tubifex ignotus 2 0 0 0 0 0 0 0T. americanus(1) 0 <1 <1 9 2 1 1 <1T. tubifex(3) 4 2 51 69 27 18 14 14T. superiorensis(1) 2 1 2 <1 1 0 <1 0Variechaetidrilus
augustipenis(3)8 21 0 1 0 <1 0 0
Immatures withouthair setae
3253 683 936 1005 426 256 28 24
Immatures withhair setae
211 49 211 788 142 94 84 42
Naididae (11 species)a 69 31 2 0 1 <1 <1 0
Type 1 1486 (24.8) 620 (36.7) 3067 (61.4) 1348 (35.2) 1222 (57.3) 1254 (70.3) 683 (68.4) 1010 (87.7)Type 2 511 (8.5) 176 (10.4) 492 (9.8) 456 (11.9) 18 (0.8) 35 (2.0) 0 (0.0) <1 (<0.1)Type 3 439 (7.3) 125 (7.4) 220 (4.4) 212 (5.5) 168 (7.9) 76 (4.3) 22 (2.2) 21 (1.8)Other 3567 (59.4) 767 (45.4) 1216 (24.3) 1812 (47.3) 727 (34.1) 419 (23.5) 293 (29.4) 121 (10.5)Total 6003 1688 4995 3828 2135 1784 998 1152
Note: The type category of each species is given in parentheses next to the species name (see text for explanation of categories). Also given is thepercentage of individuals (in parentheses) in each of three trophic categories.
aArcteonais lomondi, Chaetogaster diaphanus, Nais alpina, Nais elinguis, Nais simplex, Nais variabilis, Piguetiella michiganensis, Stylaria fossularius,Stylaria lacustris, Uncinata uncinais, Vejdovskyella intermedia.
Table 3. Mean densities (no.·m–2) of oligochaete species in 1980–1981 and 1992–1993 in each of four depth intervals.
I:\cjfas\cjfas55\CJfas-11\F98-112.vpTuesday, November 24, 1998 9:03:57 AM
Color profile: DisabledComposite Default screen

decline rates inDiporeia increased fivefold and were fo-cused primarily in the south–southeastern portion of thelake. SinceD. polymorphabecame established in this area in1989, we hypothesize that food competition withD. poly-morpha may have led to accelerated declines inDiporeia.By 1993, D. polymorphahad heavily infested the south–
southwestern portion of the lake, as extensive shoals andreefs in this area provided an ideal substrate for colonization(Marsden et al. 1993). Water clarity at many sites in this re-gion increased twofold between 1990 and 1993 (Marsden etal. 1993), an increase similar to that found in other GreatLakes areas heavily infested byD. polymorpha(Fahnenstielet al. 1995a). Diporeia relies on freshly sedimented organicmatter as a food source (i.e., mostly diatoms), whileD. poly-morpha is a filter-feeder that intercepts this material beforeit actually settles to the bottom. In the profundal region ofeastern Lake Erie,Diporeia declined 88% afterDreissenabecame established; also, there was a direct inverse relation-ship between numbers ofDiporeia andDreissenain individ-ual samples (Dermott and Kerec 1997). In 1992–1993,D. polymorphawas not abundant at most sites in the south-eastern region. However, with a counterclockwise circula-tion pattern in southern Lake Michigan, extensiveD. polymorphapopulations in the south–southwestern por-tion of the lake may have affectedDiporeia populations inareas to the east. Changes in water clarity and pelagic pro-ductivity have been observed in areas with lowD. polymor-pha populations when circulation patterns integrate watersfrom nearby areas with higher populations (Fahnenstiel et al.1995a). Also, since physical processes readily resuspend andtransport organic matter from nearshore to offshore areas inthe southern basin (Eadie et al. 1984), we suspect that thefiltering activities of extensiveD. polymorphapopulationsin shallow, nearshore areas are causing decreased benthic in-puts toDiporeia in deeper areas.
Many species of fish feed heavily onDiporeia, andchanges inDiporeia densities have been related to shifts infish communities and predation pressure (Johnson andMcNeil 1986; McDonald et al. 1990). Thus, the role of fishpredation in causing observed changes inDiporeia densitiesmust be examined. Between 1980–1981 and 1992–1993, anumber of changes occurred in the nearshore fish communi-ties of Lake Michigan. In the early years of this period, thedecline in alewife (Alosa pseudoharengus), which began in
© 1998 NRC Canada
2410 Can. J. Fish. Aquat. Sci. Vol. 55, 1998
Fig. 4. Distribution and density (no.·m–2) of the zebra musselDreissena polymorphain 1992 and 1993. Note log scale.
1962–1967 1993 P
Depth: 16–30 mDiporeia 3 061±962 2158±847 nsOligochaeta 2 090±983 1599±827 nsSphaeriidae 1 860±1251 508±213 nsTotal 7 011 4265
Depth: 31–50 mDiporeia 6 361±921 5648±1155 nsOligochaeta 4 096±903 2733±715 nsSphaeriidae 2 859±579 1273±399 <0.05Total 13 316 9654
Depth: 51–90 mDiporeia 3 974±374 5161±705 nsOligochaeta 1 690±591 1494±168 nsSphaeriidae 729±150 362±134 <0.05Total 6 393 7017
Depth: >90 mDiporeia 2 796±543 3372±940 nsOligochaeta 2 089±840 1040±237 nsSphaeriidae 178±48 106±68 <0.05Total 5 063 4518
Note: The 1962–1967 data were taken from Alley and Mozley (1975)and A.M. Beeton (Great Lakes Environmental Research Laboratory,unpublished data). Because sites were sampled at different frequencies in1962–1967, SEs were derived from station means.n = 10 (<30 m),n = 8(31–50 m),n = 8 (51–90 m), andn = 5 (>90 m). Only stations sampledin both periods were included. Differences between periods were testedusing the Wilcoxon matched-pairs signed-rank test. ns, not significant.
Table 4. Mean (± SE) density (no.·m–2) of the three majormacroinvertebrate groups at different depth intervals in 1962–1967 and 1993.
I:\cjfas\cjfas55\CJfas-11\F98-112.vpTuesday, November 24, 1998 9:04:00 AM
Color profile: DisabledComposite Default screen
the 1970s, continued, while yellow perch (Perca flavescens)and bloater (Coregonus hoyi) increased (Jude and Tesar1985; Fabrizio et al. 1995). McDonald et al. (1990) found atwofold decline in Diporeia densities between 1979–1980and 1984–1985 in the southern basin and attributed this de-cline to increased predation from perch and bloater. We didnot sample in 1984 or 1985, but benthic samples were takenat one of our sites (H-31) in these same two years (M.A.Quigley, Great Lakes Environmental Research Laboratory,unpublished data). H-31 is located off Grand Haven, Mich.,in the same general location where McDonald et al. (1990)sampled. Mean densities ofDiporeia at this site in 1980,1981, 1984, 1985, 1986, and 1987 were 10 362, 10 048,7519, 7815, 9354, and 10 687·m–2, respectively. Densities atthis site do indeed appear lower in 1984 and 1985, whichagrees with the findings of McDonald et al. (1990). How-ever, note that densities in 1986–1987 were similar to densi-ties in 1980–1981, so any predation effects appear to havebeen temporary. Also, minimal declines inDiporeia be-tween 1980–1981 and 1986–1987 at <50 m suggest that po-tential increases in fish predation (at least from perch andbloater) had little impact on overall densities. In the periodbetween 1986–1987 and 1992–1993, yellow perch declineddramatically in the southern basin, while bloater and otherfish species that feed heavily onDiporeia declined or re-mained fairly stable (Fabrizio et al. 1995). Given that thegreatest declines inDiporeia occurred over this period (Ta-ble 2), it appears that changes in fish predation cannot ac-count for the observed declines.
Unlike Diporeia, declines in oligochaetes and sphaeriidsin the south–southeastern portion of the study area were notsignificantly different from declines in other areas, implyingminimal D. polymorpha impacts. For oligochaetes, thesefindings are consistent with those in eastern Lake Erie whereoligochaete densities were unaffected by the presence ofDreissena(Dermott and Kerec 1997). Oligochaetes are in-faunal detritivores that are not as dependent on freshly set-tled material as Diporeia (Gardner et al. 1985) andpotentially utilizeD. polymorphafeces and pseudofeces as afood source. In some studies, oligochaete densities actuallyincreased afterD. polymorphabecame established (Stewartand Haynes 1994). Decreased oligochaete densities between1980–1981 and 1992–1993 in our study area would there-fore indicate a true response to declines in nutrient loads andoverall productivity. The relative proportion of the oligo-trophic indicatorS. heringianusdid increase at three of thefour depth intervals, which is consistent with a shift to moreoligotrophic conditions. The reason for the contrary trend atthe 31–50 m interval is not clear. Although total oligochaetedensities at this depth interval declined, there was an in-crease in densities ofTubifex tubifexand immatures of thetype with hair setae, most likely immatures of this species.Tubifex tubifexis considered a eutrophic indicator speciesbut also does well in oligotrophic waters (Milbrink 1983).When oligochaete densities increased between the mid-1960s and 1980–1981, an overall shift in species composi-tion did not occur (Nalepa 1987).
For sphaeriids, our findings in Lake Michigan contrastwith those in Lake Erie where this group declined dramati-cally in areas whereD. polymorphawas abundant (Dermottand Kerec 1997). Of the three major groups, sphaeriids were
the least abundant, and declined the most, at all of our depthintervals. With such a marked decline in sphaeriids through-out the study area, regional declines specific toD. poly-morpha impacts may have been difficult to discern. Also,the dominant sphaeriid genus in the southern basin isPisi-dium (Nalepa et al. 1985). This genus occurs in the uppersediments and feeds by filtering suspended microorganismsfrom interstitial waters (Lopez and Holopainen 1987). Thus,like oligochaetes, it is not dependent on freshly settled algalmaterial as a direct source of food.
Macroinvertebrate densities declined to the greatest extentat depths <30 m, were less pronounced at 30–50 m, andwere minimal at depths >50 m. A similar depth-dependentresponse was apparent when densities increased between themid-1960s and 1980–1981 (Nalepa 1987). Such a benthicresponse might be expected, as pelagic productivity isgreater and more closely integrated with nutrient inputs innearshore waters compared with offshore (Ladewski andStoermer 1973; Schelske et al. 1980). At the shallowest in-terval, rates of decline in oligochaetes and sphaeriids weregreater early in the study period (1980–1981 to 1986–1987)compared with later (1986–1987 to 1992–1993), indicating arapid early response to load reductions. In reality, declinesmight have been observed earlier if densities had been docu-mented in the 1970s. At the 31–50 m interval, rates of de-cline were greater in the later time period, indicating moreof a delayed response to productivity declines. At the veryleast, observed declines in both the 16–30 and 31–50 m in-tervals seemed consistent with the turnover time of bottomparticulate material in the southern basin, which is estimatedto be 9 years at 12 m, 16 years at 65 m, and 23 years at100 m (Robbins et al. 1998).
Oligochaetes and sphaeriids were not uniformly distrib-uted throughout the study area at depths <50 m; higher den-sities were found near Waukegan and in the depositionalbasins of the southeastern portion of the lake (Fig. 3). De-spite these spatial differences, density declines occurred to asimilar extent throughout the study area. This apparent in-consistency is likely a reflection of the high degree of mix-ing and materials transport that occurs within the nearshoreof the southern basin (Chambers and Eadie 1981; Eadie etal. 1984). Within this region, particulate material is con-stantly being redistributed by storms and longshore currentsbefore being transported to deeper waters. Resuspension oc-curs on the order of weeks or months, while transport occursover years. These physical processes greatly influence spa-tial distributions of macroinvertebrate communities in thenearshore (Stimpson et al. 1975; Winnell and White 1985).
Most permanent deposition of particulate material in LakeMichigan occurs at depths >50 m (Edgington and Robbins1975). Because of the integrative nature of food inputs tothis deep region, 60–100 m has been suggested as the bestsampling depth interval to monitor trends in benthic popula-tions relative to the changing trophic status of the lake (Win-nell and White 1985). This may be true over the long term,but the response of the macroinvertebrate community to tro-phic changes occurs more slowly at these depths, and there-fore, longer time periods between surveys are needed todetect changes. In the 13-year time interval of this study, de-clines were apparent for all groups at depths <50 m, but onlysphaeriids declined at depths >50 m. Similarly, in the ap-
© 1998 NRC Canada
Nalepa et al. 2411
I:\cjfas\cjfas55\CJfas-11\F98-112.vpTuesday, November 24, 1998 9:04:01 AM
Color profile: DisabledComposite Default screen
© 1998 NRC Canada
2412 Can. J. Fish. Aquat. Sci. Vol. 55, 1998
proximately 15-year time period between the mid-1960s and1980–1981, all groups increased at depths <50 m, but onlyoligochaetes increased at depths >50 m (Nalepa 1987). Withthe relatively long turnover time of benthic particulate mate-rial at deeper depths, our inability to detect consistentchanges in all groups was likely a result of the short timespan between our surveys. Robertson and Alley (1966)found thatDiporeia, oligochaetes, and sphaeriids increasedin the deeper waters of Lake Michigan between 1931 and1964, a time span of 33 years.
In summary, densities of the three dominant macroinverte-brate groups in southern Lake Michigan declined dramati-cally between the early 1980s and early 1990s at depths<50 m; by 1993, densities were equal to or lower than densi-ties found in the mid-1960s. Both reductions in phosphorusloads and the filtering activities ofD. polymorpha likelyplayed a role in this decline. Oligochaetes and sphaeriidswere most impacted by nutrient reductions, whileDiporeiawas apparently most impacted byD. polymorpha.Of utmostconcern is the decline inDiporeia populations in the south-east region of the lake where numbers at many sites <50 mwere approaching zero in 1993. AsD. polymorphaspreadsand becomes increasingly abundant, further declines inDip-oreia populations may be expected. Further declines are alsoimminent if the otherDreissenaspecies,Dreissena bugensis,becomes established on the soft, offshore sediments of LakeMichigan as it has in lakes Erie and Ontario (Mills et al.1993; Dermott and Kerec 1997). BecauseDiporeia accountsfor a major portion of benthic invertebrate biomass in LakeMichigan (Nalepa 1989) and is a major energy link betweenpelagic production and fish (Gardner et al. 1990), declines inDiporeia over large areas will likely lead to serious disrup-tions in the Lake Michigan food web.
We thank the following people whose contributions aremuch appreciated: B. Burns for his support during field op-erations, J. Buchanan, R. Derosario, G. Gostenik, J. Holman,P. Hurst, K. McElroy, M. Lansing, and A. Vielmetti for theirdedication in picking and sorting, S. Brandt and P. Landrumfor helpful comments, and A. Beeton, M. Quigley, T. Johen-gen, and J. Robbins for access to unpublished data. This isGLERL contribution No. 1079.
Alley, W.P., and Mozley, S.C. 1975. Seasonal abundance and spa-tial distribution of Lake Michigan macrobenthos, 1964–67.Great Lakes Research Division Spec. Publ. 54, University ofMichigan, Ann Arbor, Mich.
Botts, P.S., Patterson, B.A., and Schloesser, D.W. 1996. Zebramussel effects on benthic invertebrates: physical or biotic? J. N.Am. Benthol. Soc.15: 179–184.
Chambers, R.L., and Eadie, B.J. 1981. Nepheloid and suspendedparticulate matter in south-eastern Lake Michigan. Sedimentol-ogy, 28: 439–447.
Chang, W.Y.B., and Rossman, R. 1988. Change in the abundanceof blue green algae related to nutrient loadings in the nearshoreof Lake Michigan. Hydrobiologia,157: 271–278.
Chapra, S. 1977. Total phosphorus model for the Great Lakes.1977. J. Environ. Eng. Div.103: 147–161.
Clarke, K.D., Knoechel, R., and Ryan, P.M. 1997. Influence oftrophic role and life-cycle duration on timing and magnitude ofbenthic macoinvertebrate response to whole-lake enrichment.Can. J. Fish. Aquat. Sci.54: 89–95.
Cook, D.G., and Johnson, M.G. 1974. Benthic macroinvertebratesof the St. Lawrence Great Lakes. J. Fish. Res. Board Can.31:763–782.
Dermott, R., and Kerec, D. 1997. Changes in the deepwaterbenthos of eastern Lake Erie since the invasion ofDreissena:1979–1993. Can. J. Fish. Aquat. Sci.54: 922–930.
Eadie, B.J., Chambers, R.L., Gardner, W.S., and Bell, G.L. 1984.Sediment trap studies in Lake Michigan: resuspension andchemical fluxes in the southern basin. J. Great Lakes Res.10:307–321.
Edgington, D.N., and Robbins, J.A. 1975. The behavior of pluto-nium and other long-lived radionuclides in Lake Michigan. II.Patterns of deposition in the sediments.In Impact of nuclear re-leases into the aquatic environment. IAEA, Vienna, Austria.pp. 245–260.
Edsall, T.A., and Charlton, M.N. 1996. Nearshore waters of theGreat Lakes. Background Paper, State of the Lakes EcosystemConference ’96, Environment Canada–U.S. EPA, EPA 905-D-96-001b.
Fabrizio, M.C., Ferreri, C.P., and Hansen, M.J. 1995. Prey fishcommunities as indicators of ecosystem health in Lake Michi-gan. Project Completion Report to the Environmental ProtectionAgency. Great Lakes Science Center, U.S. Geological Survey,Ann Arbor, Mich.
Fahnenstiel, G.L., Lang, G.A., Nalepa, T.F., and Johengen, T.H.1995a. Effects of zebra mussel (Dreissena polymorpha) coloni-zation on water quality parameters in Saginaw Bay, Lake Huron.J. Great Lakes Res.21: 435–448.
Fahnenstiel, G.L., Bridgeman, T.B., Lang, G.A., McCormick, M.J.,and Nalepa, T.F. 1995b. Phytoplankton productivity in SaginawBay, Lake Huron: effects of zebra mussel (Dreissena polymor-pha) colonization. J. Great Lakes Res.21: 465–475.
Gardner, W.S., Nalepa, T.F., Frez, W.A., Cichocki, E.A., andLandrum, P.F. 1985. Seasonal patterns in lipid content of LakeMichigan macroinvertebrates. Can. J. Fish. Aquat. Sci.42:1827–1832.
Gardner, W.S., Quigley, M.A., Fahnenstiel, G.L., Scavia, D., andFrez, W.A. 1990.Pontoporeia hoyi— a direct trophic link be-tween spring diatoms and fish in Lake Michigan.In Large lakes:ecological structures and functions.Edited byM.M. Tilzer andC. Serruya. Springer-Verlag, Berlin, Germany.
Johengen, T.H., Johannsson, O.E., Pernie, G.L., and Millard, E.S.1994. Temporal and seasonal trends in nutrient dynamics andbiomass measures in Lakes Michigan and Ontario in response tophosphorus control. Can. J. Fish. Aquat. Sci.51: 2570–2578.
Johnson, M.G., and McNeil, O.C. 1986. Changes in abundance andspecies composition in benthic macroinvertebrate communitiesof the Bay of Quinte, 1966–1984.In Project Quinte: point-source phosphorus control and ecosystem response in the Bay ofQuinte, Lake Ontario.Edited byC.K. Minns, D.A. Hurley, andK.H. Nicholls. Can. Spec. Publ. Fish. Aquat. Sci. No. 86.
Jude, D.J., and Tesar, F.J. 1985. Recent changes in the inshore for-age fish of Lake Michigan. Can. J. Fish. Aquat. Sci.42: 1154–1157.
Ladewski, T.B., and Stoermer, E.F. 1973. Water transparency ofsouthern Lake Michigan in 1971 and 1972. Proceedings of the16th Conference on Great Lakes Research. International Associ-ation for Great Lakes Research, Ann Arbor, Mich. pp. 791–807.
Lang, C., and Reymond, O. 1992. Reversal of eutrophication in
I:\cjfas\cjfas55\CJfas-11\F98-112.vpTuesday, November 24, 1998 9:04:02 AM
Color profile: DisabledComposite Default screen
© 1998 NRC Canada
Nalepa et al. 2413
Lake Geneva: evidence from the oligochaete communities.Freshwater Biol.28: 145–148.
Lauritsen, D.D., Mozley, S.C., and White, D.S. 1985. Distributionof oligochaetes in Lake Michigan and comments on their use asindices of pollution. J. Great Lakes Res.11: 67–76.
Lopez, G.R., and Holopainen, I.J. 1987. Interstitial suspension-feeding byPisidium spp. (Pisidiidae:Bivalvia): a new guild inthe lentic benthos? Am. Malacol. Bull.5: 21–30.
Marsden, J.E., Trudeau, N., and Keniry, T. 1993. Zebra musselstudy of Lake Michigan. Aquat. Ecol. Tech. Rep. 93/14, IllinoisNatural History Survey, Zion, Ill.
McDonald, M.E., Crowder, L.B., and Brandt, S.B. 1990. Changesin Mysis and Pontoporeia populations in southeastern LakeMichigan: a response to shifts in the fish community. Limnol.Oceanogr.35: 220–227.
Milbrink, G. 1983. An improved environmental index based on therelative abundance of oligochaete species. Hydrobiologia,102:89–97.
Mills, E.L., Dermott, R.M., Roseman, E.F., Dustin, D., Mellina, E.,Conn, D.B., and Spidel, A. 1993. Colonization, ecology, andpopulation structure of the “quagga mussel” in the lower GreatLakes. Can. J. Fish. Aquat. Sci.50: 2305–2314.
Nalepa, T.F. 1987. Long term changes in the macrobenthos ofsouthern Lake Michigan. Can. J. Fish. Aquat. Sci.44: 515–524.
Nalepa, T.F. 1989. Estimates of macroinvertebrate biomass in LakeMichigan. J. Great Lakes Res.15: 437–443.
Nalepa, T.F., Quigley, M.A., Childs, K.F., Gauvin, J.M., Heatlie,T.S., Parker, M.P., and Vanover, L. 1985. Macrobenthos ofsouthern Lake Michigan, 1980–81. NOAA Data Rep. ERLGLERL-28. Great Lakes Environmental Research Laboratory,Ann Arbor, Mich.
Nalepa, T.F., Hartson, D.J., Gostenik, G.W., Fanslow, D.L., andLang, G.A. 1996. Changes in the freshwater mussel communityof Lake St. Clair: from Unionidae toDreissena polymorphaineight years. J. Great Lakes. Res.22: 354–369.
Robbins, J.A., Eadie, B.J., and Edgington, D.N. 1998. Spatiallyvariable, first order averaging of cesium-137 fluxes to sedimentsin Lake Michigan revealed by long-term changes in activities ofbenthic trap samples and sediments. Ocean Sciences Meeting.American Geophysical Union, San Diego, Calif. (Abstr.)
Robertson, D.M. 1997. Regionalized loads of sediment and phos-phorus to Lakes Michigan and Superior — high flow and long-term average. J. Great Lakes Res.23: 416–439.
Robertson, A., and Alley, W.P. 1966. A comparative study of LakeMichigan macrobenthos. Limnol. Oceanogr.11: 576–583.
Saether, O.A. 1980. The influence of eutrophication on deep lakebenthic invertebrate communities. Prog. Water Technol.12:161–180.
Scavia, D., Fahnenstiel, G.L., Evans, M.S., Jude, D.J., andLehman, J.T. 1986. Influence of salmonid predation and weatheron long-term water quality trends in Lake Michigan. Can. J.Fish. Aquat. Sci.43: 435–443.
Schelske, C.L. 1978. Detecting trends in Great Lakes water quality.In The Great Lakes. 2. Water Qual. Bull. Vol. 3. Canada Centrefor Inland Waters, Burlington, Ont.
Schelske, C.L., Feldt, L.E., and Simmons, M.S. 1980. Phytoplank-ton and physical–chemical conditions in selected rivers and thecoastal zone of Lake Michigan, 1972. Great Lakes Research Di-vision Publ. 19, University of Michigan, Ann Arbor, Mich.
Schloesser, D.W., Reynoldson, T.B., and Manny, B.A. 1995. Oligo-chaete fauna of western Lake Erie 1961 and 1982: signs of sedi-ment quality recovery. J. Great Lakes Res.21: 294–306.
Stewart, T.W., and Haynes, J.M. 1994. Benthic macroinvertebratecommunities of southwestern Lake Ontario following invasionof Dreissena polymorpha. J. Great Lakes Res.20: 479–493.
Stimpson, K.S., Brice, J.R., Barbour, M.T., and Howe, P. 1975.Distribution and abundance of inshore oligochaetes in LakeMichigan. Trans. Am. Microsc. Soc.94: 384–394.
Vandercastle, J.R. 1985. A study of long-term changes of the phy-toplankton community and seasonal changes in alkaline phos-phate activity observed in Lake Michigan. Ph.D. thesis,University of Wisconsin, Milwaukee, Wis.
Wiederholm, T. 1980. Use of benthos in lake monitoring. J. WaterPollut. Control Fed.52: 537–547.
Winnell, M.H., and White, D.S. 1984. Ecology of shallow anddeep water populations ofPontoporeia hoyi(Smith) (Amphi-poda) in Lake Michigan. Freshwat. Invertebr. Biol.3: 118–138.
Winnell, M.H., and White, D.S. 1985. Trophic status of southeast-ern Lake Michigan based on the Chironomidae (Diptera). J.Great Lakes Res.11: 540–548.
I:\cjfas\cjfas55\CJfas-11\F98-112.vpTuesday, November 24, 1998 9:04:03 AM
Color profile: DisabledComposite Default screen


![Methods Protocol Benthic Macroinvertebrate … · Methods Protocol Benthic Macroinvertebrate ... Wyoming Department of Environmental Quality [DEQ]) ... (see Chapter 5 ;](https://img.pdfslide.us/doc/110x75/5b1bec1a7f8b9a37258f374c/methods-protocol-benthic-macroinvertebrate-methods-protocol-benthic-macroinvertebrate.jpg)