Embed Size (px)
Citation preview
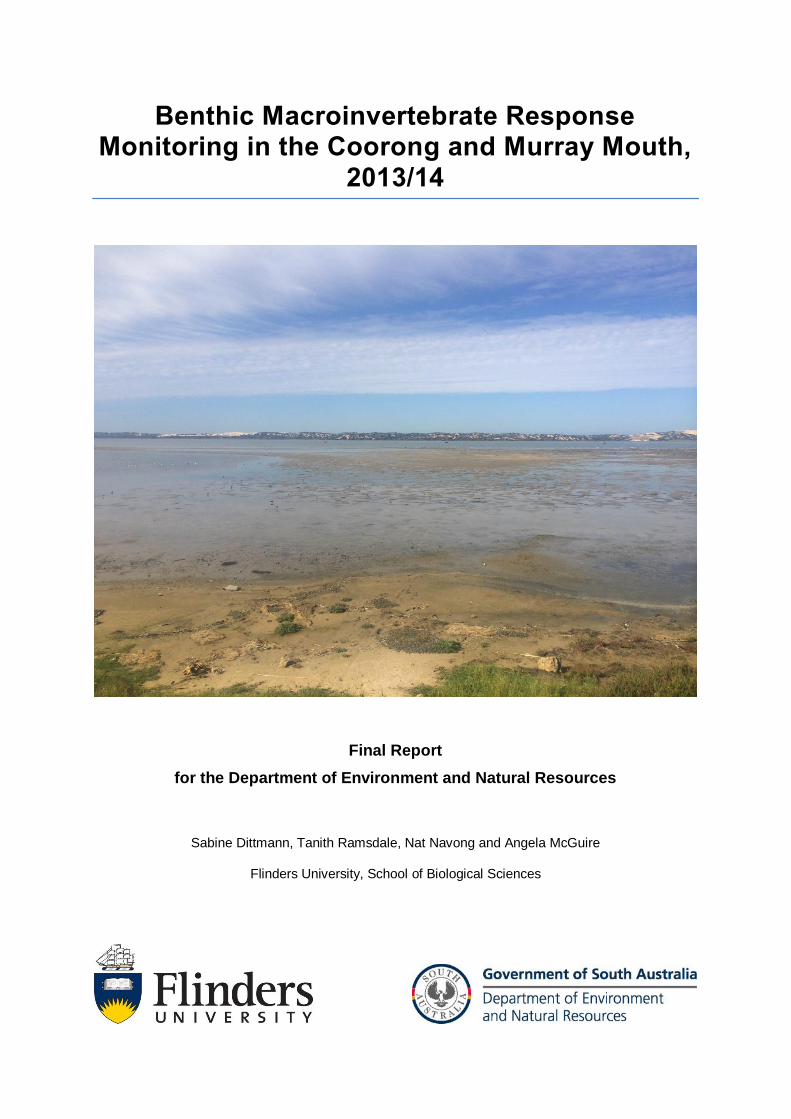
Benthic Macroinvertebrate Response Monitoring in the Coorong and Murray Mouth,
2013/14
Final Report
for the Department of Environment and Natural Resources
Sabine Dittmann, Tanith Ramsdale, Nat Navong and Angela McGuire
Flinders University, School of Biological Sciences

This report may be cited as: Dittmann, S., Ramsdale, T., Navong, N. and McGuire, A., 2014: Benthic Macroinvertebrate Response Monitoring in the Coorong and Murray Mouth, 2013/14. Report for the Department of Environment, Water and Natural Resources, Adelaide.
Contents
1. Executive Summary ........................................................................................................................1
2. Introduction .....................................................................................................................................5
3. Materials and Methods ....................................................................................................................7
3.1 Sampling sites and dates ..............................................................................................................7
3.2 Environmental parameters .........................................................................................................9
3.3 Macrofauna ............................................................................................................................. 10
3.4 Data analysis ........................................................................................................................... 10
4. Results and Discussion ................................................................................................................. 12
4.1 Environmental Conditions ........................................................................................................ 12
4.2 Macroinvertebrate Recruitment ................................................................................................ 15
4.3 Macroinvertebrate Recolonisation ............................................................................................ 24
4.4 Relationships between Macroinvertebrate Communities and Environmental Conditions ........... 40
5 Conclusions ................................................................................................................................... 46
6 Acknowledgements ........................................................................................................................ 47
7 References .................................................................................................................................... 47

1
1. Executive Summary
This report presents findings from monitoring the response of macroinvertebrates in the Murray
Mouth and Coorong in the fourth year since flow resumed in late 2010. All methods used followed
procedures as during previous monitoring. The nine mudflat sites were located between
Monument Road near the Goolwa barrage, and Villa de Yumpa at the northern end of the South
Lagoon. Sampling occurred on three occasions between late November 2013 and March 2014,
with the sampling in December 20013 also covering the subtidal sediments and two locations on
the Younghusband Peninsula.
The monitoring centred on a series of key questions on indications for continued recovery of this
estuarine and lagoon system (Table 1). Following indications of a recovery in the previous
monitoring period, the predictions for this current survey had been that further recolonisation would
occur and populations of macroinvertebrates re-establish in mudflat of the Murray Mouth and
Coorong.
To establish recovery of macroinvertebrate populations and communities, measurements were
taken to assess species richness, abundance and size-frequencies. To explore for evidence of
how macroinvertebrate communities are affected by environmental conditions, water and sediment
variables were determined on each sampling occasion.
Signs of recovery were based on higher numbers of species and increased abundances of species
like Simplisetia aequisetis at multiple sites throughout the Murray Mouth and in the northern North
Lagoon. Most species maintained their distribution ranges as described in the 2012/13 monitoring,
and single individuals of more species were found around Hells Gate and the northern South
Lagoon. Species like the small bivalve Arthritica helmsi, which was very abundant before the
drought, continued to recolonise the mudflats. Small hydrobiid snails became abundant as well
and larger bivalves (Soletellina alba, Spisula trigonella) were found at several sites. The findings
from the monitoring indicate an increasing complexity of the macroinvertebrate community with
more functional richness, such as increased bioturbation in sediments.
Macroinvertebrate abundances were mostly higher in subtidal sediments than intertidal mudflats
during the November/December 2013 survey. In February and March 2014, abundances in the
mudflats were substantially reduced, reflecting a decrease in numbers of amphipods and
chironomid larvae. As subtidal sediments were not sampled at these further surveys, it is unknown
whether abundances remained high in the subtidal or not. The lack of further sampling in the
subtidal also affected the assessment of population sizes for several species.
Size frequency distributions gave indications of recruitment for most species of macroinvertebrates
and signs of continuous recruitment over the summer period for some polychaete species.
Juvenile S. aequisetis and N. australiensis were more frequent in sub- than intertidal sediments in
December 2013.
The macroinvertebrate communities in the Murray Mouth and Coorong during the 2013/14
monitoring were similar to the previous post-flow period. In the Murray Mouth, several analyses
indicated a return to pre-drought conditions, while the trajectory for the Coorong may lead into a
new direction. Clear community differences for pre-drought, drought and flow periods were
identified. In the current monitoring, variations in macroinvertebrate communities were explained
mainly by salinity and sediment compositions.
This monitoring documented that macroinvertebrate populations were re-establishing in the Murray
Mouth and Coorong, yet the unexplained decrease in abundances over summer 2013/14 could
have affected further recovery. More comprehensive sampling of inter- and subtidal sediments in
2
the future may ascertain whether the subtidal sediments can function as a source for mudflat
recolonisation and thus support the resilience of this ecosystem.
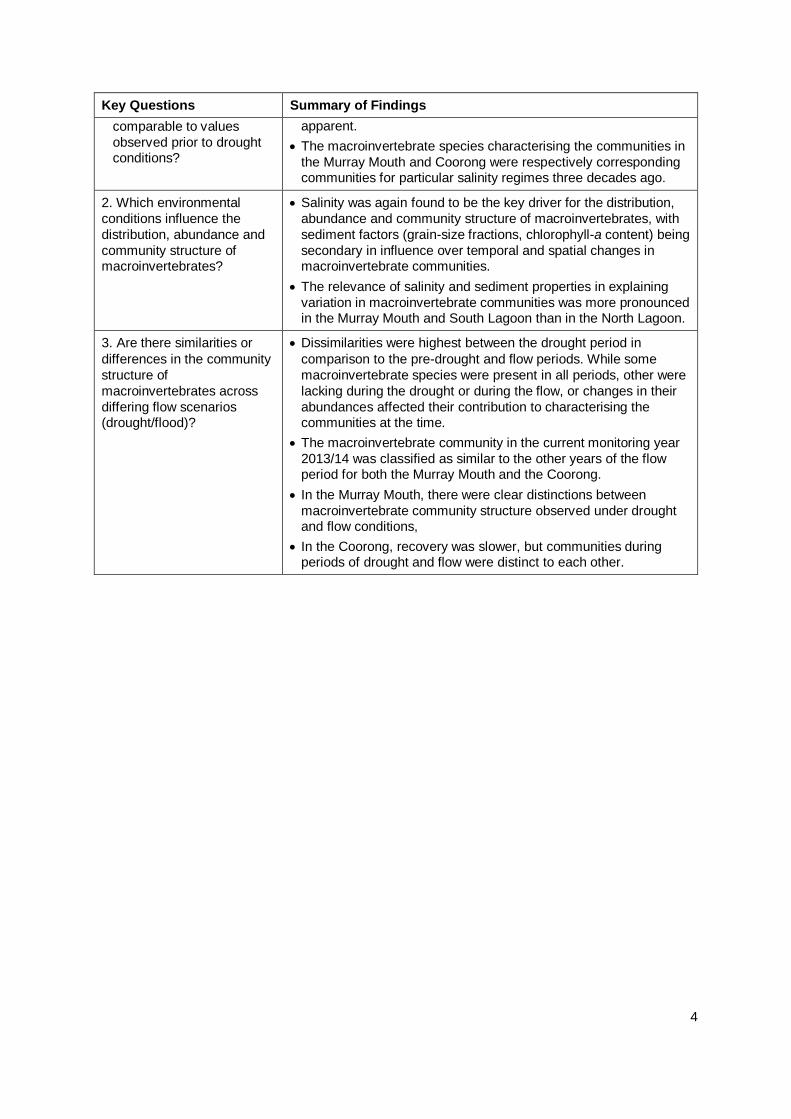
Table 1. Summary table of key questions and findings for the 2013/2014 macroinvertebrate surveys in response to continued flow.
Key Questions Summary of Findings
1. Are there indications of
continued system recovery in
2013/14 following the
significant flows of 2010-11
and further flows in 2011, 2012 and 2013?
Yes, monitoring revealed improved estuarine conditions in the
Murray Mouth and North Lagoon and macroinvertebrate
communities started to re-establish. This was particularly
pronounced in late spring/early summer, while abundances of
several benthic taxa decreased over the course of summer for unknown reasons.
a) Will environmental
conditions within the Murray
Mouth reflect true estuarine
conditions and have they
further improved in the North
and South Lagoons since flows recommenced in 2010?
Seasonal changes in salinity occurred in response to the volume
of flow across the barrages, with lower salinities recorded in late
spring/early summer, and increasing salinities over summer when
flow volumes decreased. Seasonal variations in salinity subject to
river flow are typical for estuaries, and estuarine conditions were
thus improved in the Murray Mouth and North Lagoon. Salinities remained hypersaline in the South Lagoon.
While the salinity gradient from brackish to marine conditions in
the Murray Mouth to hypersaline conditions in the South Lagoon
persisted, salinities were >30 ppt lower in each region than during the drought.
In the Murray Mouth, salinities changed from freshwater during
the 2010/11 flow, to brackish and marine in the following
monitoring periods. Salinities in the 2013/14 monitoring period were comparable to the previous 2012/13 monitoring.
Salinities were slightly higher at the subtidal and peninsula
locations during sampling in December, yet no vertical stratification of salinity was recorded.
b) Has recruitment continued
for macroinvertebrate
species that began recovery
in 2011-12 and is recruitment
occurring for other species in 2013-14?
Recruitment continued for most macroinvertebrate species as in
the previous survey, with additional recruitment of Arthritica helmsi recorded in this survey.
Small individuals were encountered for most macroinvertebrate
species in the Murray Mouth and North Lagoon, and amphipods carrying eggs were seen in the December samples.
Recruitment continued in summer 2013/14 for the polychaetes
Simplisetia aequisetis, Boccardiella limnicola and Capitella spp..
Other polychaetes (Nephtys australiensis and Australonereis
ehlersi) occurred in too low numbers to evaluate recruitment, although small sized N. australiensis were found in December.
Juveniles of S. aequisetis, Capitella spp. and the small bivalve A.
helmsi were present at all three sampling events, indicating
continuous reproduction over summer. Size-frequency
distributions for B. limnicola indicated a recruitment event in December.
The bivalve Arthritica helmsi was recorded with a similar size
range over all three sampling events in the Murray Mouth and
North Lagoon. Other unidentified juvenile bivalves occurred in
December 2013 in the Murray Mouth. Small individuals of
3
Key Questions Summary of Findings
Soletellina alba were found in the Murray Mouth.
The occurrence of juveniles at sampling sites overlapped with the
distribution of larger specimens. The frequency of small sized S.
aequisetis and N. australiensis was higher in sub- than intertidal sediments.
c) Can the recruitment of
species in 2013/14 be linked
with the timing of differing
flow scenarios to identify
drivers of macroinvertebrate recruitment?
The presence of small-sized specimens of several
macroinvertebrate species, in particular in December and
February, gave an indication of recruitment occurring in early summer, as flow volumes decreased and salinities increased.
The continuous recruitment of some macroinvertebrates indicates
either that recruitment is triggered by other cues than those
related to flow and salinity changes, or a life history adapted to the variable environment of estuaries.
d) Will there be any further
recolonisation of mudflats by
macroinvertebrates absent
from areas in previous monitoring 2010-12?
The number of macroinvertebrate species found in mudflats was
higher than in the previous survey.
Macroinvertebrates that had previously colonised mudflats from
subtidal locations had strengthened their population size in mudflats in the Murray Mouth and North Lagoon.
The small bivalve, Arthritica helmsi continues to recolonise
mudflat areas, with abundances increasing at several mudflat sites during the 2013/14 survey.
Apart from Hunters Creek and Ewe Island, macroinvertebrate
abundances were higher in the subtidal than intertidal mudflats in December 2013.
Abundances in mudflats decreased substantially over summer 2013/14.
e) Will recolonisation of
macroinvertebrate species
occur in the South Lagoon if
salinities remain lowered in this region?
Insect larvae (mainly chironomids and Ephydridae) were still
prominent in sediments at Parnka Point and Villa de Yumpa. Yet numerically, ostracods were more abundant at Parnka Point.
Single individuals of estuarine macroinvertebrates were found,
such as amphipods in December 2013 and March 2014,
oligochaetes and the polychaete Capitella spp. in subtidal
sediments at Villa de Yumpa, and Arthritica helmsi in the mudflat at this site in December 2013.
Finding specimens of estuarine macroinvertebrates around Hells
Gate may indicate that recolonisation may occur if environmental conditions continue to improve.
f) Have species maintained
or further increased their
distribution range in comparison to 2011-12?
Most species maintained their distribution range in comparison to
previous expansions observed between 2012 and 2013.
While species occurred again at the same sites, shifts in abundance across sites were recorded.
There were only few indications for increased distribution ranges
in 2013/14, such as Capitella sp. expanding into the Murray Mouth.
g) Has the macroinvertebrate
community been restored
to pre-drought conditions
following the barrage flows
into the Coorong since late
2010 and are they
In the Murray Mouth, a return to a macroinvertebrate community
more similar to the pre-drought was indicated by the trajectory of community change over the last decade.
In the Coorong, site and regional differences in community
developments obscured a clear trend, yet change away from
macroinvertebrate communities present during the drought was
4
Key Questions Summary of Findings
comparable to values
observed prior to drought conditions?
apparent.
The macroinvertebrate species characterising the communities in
the Murray Mouth and Coorong were respectively corresponding communities for particular salinity regimes three decades ago.
2. Which environmental
conditions influence the
distribution, abundance and
community structure of macroinvertebrates?
Salinity was again found to be the key driver for the distribution,
abundance and community structure of macroinvertebrates, with
sediment factors (grain-size fractions, chlorophyll-a content) being
secondary in influence over temporal and spatial changes in macroinvertebrate communities.
The relevance of salinity and sediment properties in explaining
variation in macroinvertebrate communities was more pronounced in the Murray Mouth and South Lagoon than in the North Lagoon.
3. Are there similarities or
differences in the community
structure of
macroinvertebrates across
differing flow scenarios (drought/flood)?
Dissimilarities were highest between the drought period in
comparison to the pre-drought and flow periods. While some
macroinvertebrate species were present in all periods, other were
lacking during the drought or during the flow, or changes in their
abundances affected their contribution to characterising the communities at the time.
The macroinvertebrate community in the current monitoring year
2013/14 was classified as similar to the other years of the flow period for both the Murray Mouth and the Coorong.
In the Murray Mouth, there were clear distinctions between
macroinvertebrate community structure observed under drought and flow conditions,
In the Coorong, recovery was slower, but communities during periods of drought and flow were distinct to each other.
5
2. Introduction
Restored freshwater flows into the Murray Mouth and Coorong were predicted to lead to a recovery of
this ecosystem, composed of estuarine and lagoon habitats. The flow that resumed in late 2010
provided the first freshwater input after a prolonged drought (Leblanc et al. 2012) and restored
connectivity between the river, lake, estuary, lagoon and adjacent sea. Restoring the physico-chemical
setting and boundary conditions has supported ecological recovery in coastal and estuarine
ecosystems elsewhere (Elliott et al. 2007, Borja et al. 2010). Recovery can be idiosyncratic, affected
by species traits and connectivity, and the types of pressures that occurred (see review by (Duarte et
al. 2014)). In many examples worldwide, recovery is slow and only partial as thresholds differ for
degradation and recovery phases and global change causes shifting baselines (Duarte et al. 2014).
Prior disturbance history can also affect resilience of estuarine populations (Dolbeth et al. 2007). With
recovery ecology receiving more recent scientific attention (Lotze et al. 2006, Verdonschot et al.
2013), monitoring the response of macroinvertebrates in the Murray Mouth and Coorong can not only
advise management on the efficiency of flow restoration measures (Verissimo et al. 2012, Marques et
al. 2013), but also contribute to the general understanding of processes for the recovery of benthic
communities, which are an essential part of coastal and marine ecosystems (Levin et al. 2001).
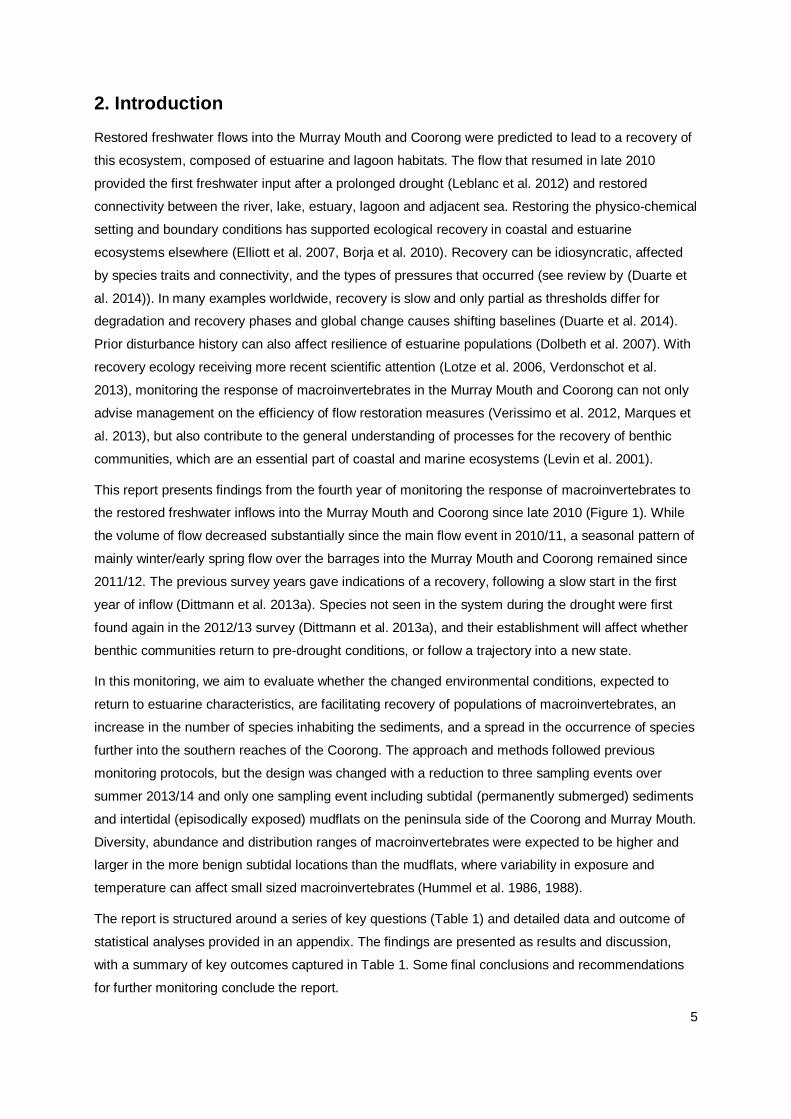
This report presents findings from the fourth year of monitoring the response of macroinvertebrates to
the restored freshwater inflows into the Murray Mouth and Coorong since late 2010 (Figure 1). While
the volume of flow decreased substantially since the main flow event in 2010/11, a seasonal pattern of
mainly winter/early spring flow over the barrages into the Murray Mouth and Coorong remained since
2011/12. The previous survey years gave indications of a recovery, following a slow start in the first
year of inflow (Dittmann et al. 2013a). Species not seen in the system during the drought were first
found again in the 2012/13 survey (Dittmann et al. 2013a), and their establishment will affect whether
benthic communities return to pre-drought conditions, or follow a trajectory into a new state.
In this monitoring, we aim to evaluate whether the changed environmental conditions, expected to
return to estuarine characteristics, are facilitating recovery of populations of macroinvertebrates, an
increase in the number of species inhabiting the sediments, and a spread in the occurrence of species
further into the southern reaches of the Coorong. The approach and methods followed previous
monitoring protocols, but the design was changed with a reduction to three sampling events over
summer 2013/14 and only one sampling event including subtidal (permanently submerged) sediments
and intertidal (episodically exposed) mudflats on the peninsula side of the Coorong and Murray Mouth.
Diversity, abundance and distribution ranges of macroinvertebrates were expected to be higher and
larger in the more benign subtidal locations than the mudflats, where variability in exposure and
temperature can affect small sized macroinvertebrates (Hummel et al. 1986, 1988).
The report is structured around a series of key questions (Table 1) and detailed data and outcome of
statistical analyses provided in an appendix. The findings are presented as results and discussion,
with a summary of key outcomes captured in Table 1. Some final conclusions and recommendations
for further monitoring conclude the report.
6
Figure 1: Monthly barrage flow from the Lower Lakes into the Murray Mouth and Coorong from August 2010 up until April 2014, based on data from the MDBA. The asterisks indicate when sampling took place for monitoring the response of macroinvertebrates to the recommenced flow.
0
500
1000
1500
2000
2500
Aug
-10
Sep
-10
Oct-
10
No
v-1
0D
ec-1
0Ja
n-1
1F
eb-1
1M
ar-
11
Apr-
11
Ma
y-1
1Ju
n-1
1Ju
l-1
1A
ug
-11
Sep
-11
Oct-
11
No
v-1
1D
ec-1
1Ja
n-1
2F
eb-1
2M
ar-
12
Apr-
12
Ma
y-1
2Ju
n-1
2Ju
l-1
2A
ug
-12
Sep
-12
Oct-
12
No
v-1
2D
ec-1
2Ja
n-1
3F
eb-1
3M
ar-
13
Apr-
13
Ma
y-1
3Ju
n-1
3Ju
l-1
3A
ug
-13
Sep
-13
Oct-
13
No
v-1
3D
ec-1
3Ja
n-1
4F
eb-1
4M
ar-
14
Apr-
14
GL
/mo
nth
* * * * * * * * * * * * * * **
7
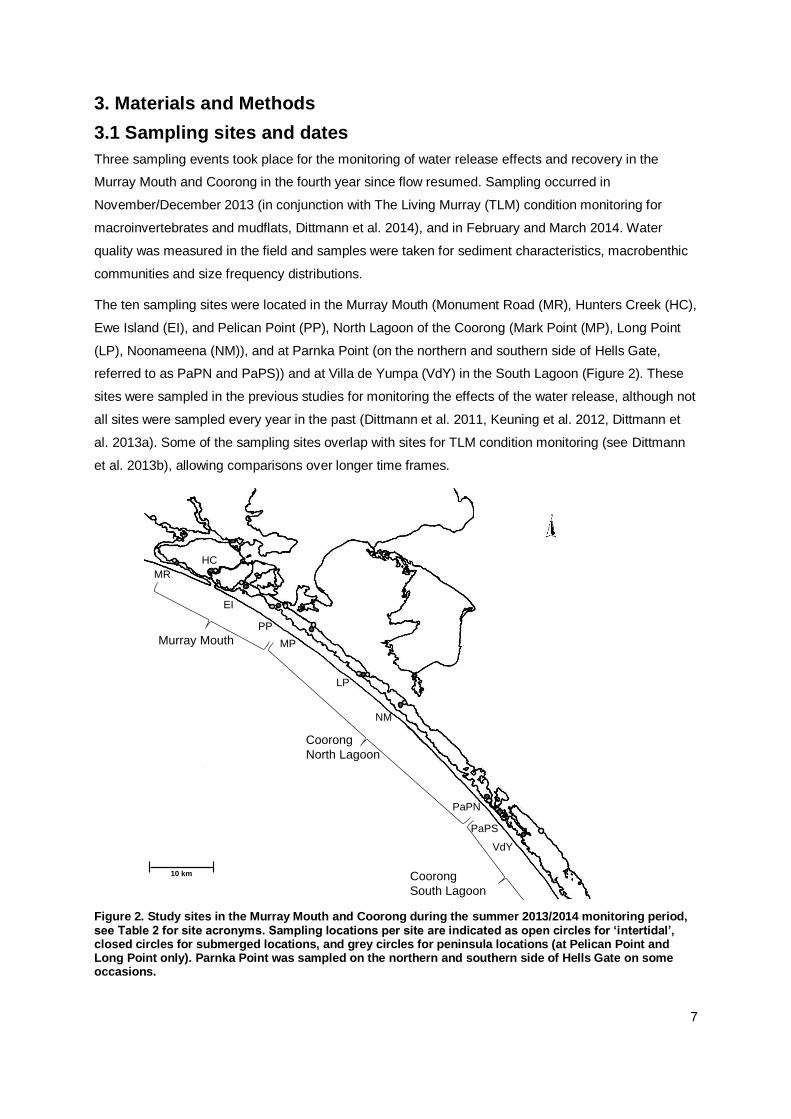
3. Materials and Methods
3.1 Sampling sites and dates
Three sampling events took place for the monitoring of water release effects and recovery in the
Murray Mouth and Coorong in the fourth year since flow resumed. Sampling occurred in
November/December 2013 (in conjunction with The Living Murray (TLM) condition monitoring for
macroinvertebrates and mudflats, Dittmann et al. 2014), and in February and March 2014. Water
quality was measured in the field and samples were taken for sediment characteristics, macrobenthic
communities and size frequency distributions.
The ten sampling sites were located in the Murray Mouth (Monument Road (MR), Hunters Creek (HC),
Ewe Island (EI), and Pelican Point (PP), North Lagoon of the Coorong (Mark Point (MP), Long Point
(LP), Noonameena (NM)), and at Parnka Point (on the northern and southern side of Hells Gate,
referred to as PaPN and PaPS)) and at Villa de Yumpa (VdY) in the South Lagoon (Figure 2). These
sites were sampled in the previous studies for monitoring the effects of the water release, although not
all sites were sampled every year in the past (Dittmann et al. 2011, Keuning et al. 2012, Dittmann et
al. 2013a). Some of the sampling sites overlap with sites for TLM condition monitoring (see Dittmann
et al. 2013b), allowing comparisons over longer time frames.
Figure 2. Study sites in the Murray Mouth and Coorong during the summer 2013/2014 monitoring period, see Table 2 for site acronyms. Sampling locations per site are indicated as open circles for ‘intertidal’, closed circles for submerged locations, and grey circles for peninsula locations (at Pelican Point and Long Point only). Parnka Point was sampled on the northern and southern side of Hells Gate on some occasions.
MR
EI
PP
MP
LP
NM
PaPN
VdY
Murray Mouth
Coorong
North Lagoon
Coorong
South Lagoon
10 km
HC
PaPS
8
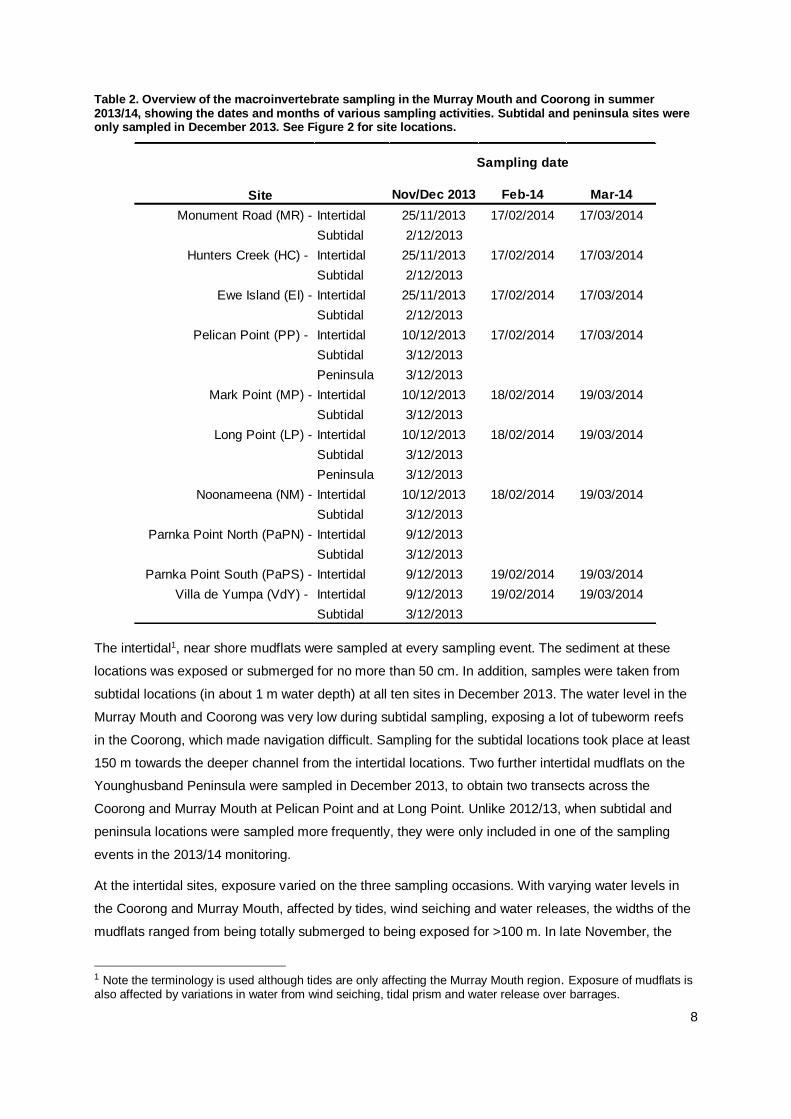
Table 2. Overview of the macroinvertebrate sampling in the Murray Mouth and Coorong in summer 2013/14, showing the dates and months of various sampling activities. Subtidal and peninsula sites were only sampled in December 2013. See Figure 2 for site locations.
The intertidal1, near shore mudflats were sampled at every sampling event. The sediment at these
locations was exposed or submerged for no more than 50 cm. In addition, samples were taken from
subtidal locations (in about 1 m water depth) at all ten sites in December 2013. The water level in the
Murray Mouth and Coorong was very low during subtidal sampling, exposing a lot of tubeworm reefs
in the Coorong, which made navigation difficult. Sampling for the subtidal locations took place at least
150 m towards the deeper channel from the intertidal locations. Two further intertidal mudflats on the
Younghusband Peninsula were sampled in December 2013, to obtain two transects across the
Coorong and Murray Mouth at Pelican Point and at Long Point. Unlike 2012/13, when subtidal and
peninsula locations were sampled more frequently, they were only included in one of the sampling
events in the 2013/14 monitoring.
At the intertidal sites, exposure varied on the three sampling occasions. With varying water levels in
the Coorong and Murray Mouth, affected by tides, wind seiching and water releases, the widths of the
mudflats ranged from being totally submerged to being exposed for >100 m. In late November, the
1 Note the terminology is used although tides are only affecting the Murray Mouth region. Exposure of mudflats is also affected by variations in water from wind seiching, tidal prism and water release over barrages.
Nov/Dec 2013 Feb-14 Mar-14
Monument Road (MR) - Intertidal 25/11/2013 17/02/2014 17/03/2014
Subtidal 2/12/2013
Hunters Creek (HC) - Intertidal 25/11/2013 17/02/2014 17/03/2014
Subtidal 2/12/2013
Ewe Island (EI) - Intertidal 25/11/2013 17/02/2014 17/03/2014
Subtidal 2/12/2013
Pelican Point (PP) - Intertidal 10/12/2013 17/02/2014 17/03/2014
Subtidal 3/12/2013
Peninsula 3/12/2013
Mark Point (MP) - Intertidal 10/12/2013 18/02/2014 19/03/2014
Subtidal 3/12/2013
Long Point (LP) - Intertidal 10/12/2013 18/02/2014 19/03/2014
Subtidal 3/12/2013
Peninsula 3/12/2013
Noonameena (NM) - Intertidal 10/12/2013 18/02/2014 19/03/2014
Subtidal 3/12/2013
Parnka Point North (PaPN) - Intertidal 9/12/2013
Subtidal 3/12/2013
Parnka Point South (PaPS) - Intertidal 9/12/2013 19/02/2014 19/03/2014
Villa de Yumpa (VdY) - Intertidal 9/12/2013 19/02/2014 19/03/2014
Subtidal 3/12/2013
Site
Sampling date

9
mudflats sampled in the Murray Mouth were exposed, yet during sampling in early December for the
remaining sites, water levels were rising quickly and sampling took place in knee-deep water. During
February 2013, water levels were again variable, even among sites within regions sampled on the
same day. Wide mudflats were exposed at Ewe Island (200 m), Pelican Point (100 m) and Villa de
Yumpa (250 m), but only narrow sections of mudflat were exposed at other sites (between 2 m at
Long Point – 50 m at Parnka Point South). Water levels continued to fluctuate over summer and were
generally high during March 2013, when only narrow areas of mudflat were exposed (between 2 m at
Pelican Point – 100 m at Villa dei Yumpa) at the time of sampling.
Patches of Ruppia spp. (cf. tuberosa and megacarpa) were observed at most sites during December
2013, with some flowers observed on R. cf. tuberosa.
3.2 Environmental parameters
Water quality was measured in the field using a hand-held YSI Pro2030 multi-parameter electrode to
record water temperature (° C), salinity (ppt), oxygen concentration (O2 mg/l) and saturation (O2 %).
The pH of the water overlying the mudflats (intertidal) or subtidal sediments were measured using pH
indicator-strips (Acilit 0-14).
Sediment characteristics were determined from samples taken in the field, frozen and later analysed in
the laboratory. Three replicate samples were taken per site and location for each of the following
variables to characterise sediment properties; grain size, organic matter and chlorophyll-a.
For sediment grain size, samples were taken with a 60 ml cut-off syringe (surface area 6.6 cm2 to a
depth of approximately 10 cm). Grain size was determined by laser diffraction using a particle size
analyser (Malvern Mastersizer 2000). Sediment grain size samples were thawed and the fraction
>1 mm sieved off manually to avoid blockage in the machine. The weights of this fraction and of the
remaining sediment were determined for later normalisation of the data to correct for this procedure.
Median and quartiles, as well as percentage of various particle sizes were obtained from the
Mastersizer output. Sediment sorting (So) was calculated from the ratio of the quartiles (P25 and P75)
So= (P25/P75)1/2, based on the metric scale.
For sediment organic matter, samples were taken with a 60 ml cut-off syringe (surface area 6.6 cm2 to
a depth of approximately 10 cm). Sediment samples were dried to constant weight using an Ohaus
MB45 Moisture Balance. The sediment was homogenously distributed onto aluminium trays and dried
using the standard drying protocol (controlling the temperature profile at 80 ºC). The profile burn was
automatically completed after all moisture content was dried and remained stabilised for 30 seconds.
Samples were then burnt in a muffle furnace at 450 ºC for 5 hrs. Organic matter was thus determined
by combustion and expressed as % dry weight (d.w.).
For sediment chlorophyll-a, samples were taken by inserting a 5 ml vial about 1 cm into the sediment.
While in the field, 5 ml of methanol was added to extract the chlorophyll, and the vial was thoroughly
shaken before being wrapped in aluminium foil (Seuront and Leterme 2006) and frozen for later
analysis with a fluorometer (Turner 450). After the initial reading for total chlorophyll, drops of 0.1 M
hydrochloric acid (HCl) were added to the samples to correct for phaeophorbides.
10
3.3 Macrofauna
Samples for macroinvertebrates in the sediments of the Murray Mouth and Coorong were taken with
handheld PVC corers (83.32 cm2 surface area). The corer was inserted into the sediment to
approximately 15 cm depth, sealed with a stopper to avoid disturbance of the sample and dug out with
a shovel or by hand. For subtidal locations, samples were taken using the same PVC corer, as the
water level was very low (< 1 m) at the time of sampling, allowing operators to leave the boat. At each
site and location, ten haphazardly placed replicate samples were taken for macroinvertebrates at each
of the three sampling times.
Samples were sieved through a 500 µm mesh size while still in the field. In the laboratory, samples
were sorted within several days while organisms were alive. Due to the sample and specimen volume
for each sampling occasion, the sorted specimens were preserved in 70% ethanol for later
identification. When not all samples could be processed within a few days, the entire sample was
preserved in 70% ethanol. This occurred only in December 2013, when an unexpected high number of
macroinvertebrates was encountered in the samples.
Idenitfication was carried out under dissecting microscopes, and organisms were identified to the
lowest possible taxonomic level and the number of individuals for each species per sample recorded.
Amphipods were not differentiated into family or species. For insects, larval and pupae life stages
were distinguished during sorting, but considered together for data analysis.
An assessment of recruitment of major macroinvertebrate species was carried out by size frequency
analyses of the polychaete species Capitella sp., Simplisetia aequisetis and Boccardiella limnicola and
the micro-mollusc Arthritica helmsi. When abundances of these species were high, no more than 30
individuals per species and sample were measured, if <30 individuals occurred in a sample, they were
all measured. Too few specimens of Australonereis ehlersi, and Nephtys australiensis2 were found for
size-frequency analysis. Only complete specimens were used for size determinations, and length was
measured on laminated graph paper under a dissecting microscope to the nearest 1 mm accuracy.
Measurements were also taken of additional macroinvertebrates (e.g. bivalves) to obtain a range of
their sizes.
3.4 Data analysis
To test for differences in salinity between the sampling sites, only intertidal locations sampled on all
three occasions in the 2013/14 survey were considered, with month as factor (Dec-13, Feb-14 and
Mar-14). Differences in salinity between the inter- and subtidal as well as peninsula locations were
tested in December-13, the only months in the current survey when all locations were sampled. Data
were square-root transformed before permutational analysis of variance (PERMANOVA) using a
Euclidian distance-based similarity matrix.
2Note that Nephtys australiensis is now recognised as Aglaophamus australiensis but N. australiensis is retained throughout this report for ease of comparison to earlier reports and data sets.
11
To test for differences in the total abundance of macroinvertebrates in all survey years, data were
fourth root transformed before calculating a Euclidean distance matrix (as single variable) used with a
PERMANOVA design including year (2010/11, 2011/12, 2012/13, 2013/14) and region (Murray Mouth,
North Lagoon, South Lagoon) as fixed factors.
To test for differences in total abundances between the depth locations (intertidal, subtidal and
peninsula (at two sites)) for the survey in December 2013, data were prepared as above and a design
including site and depth as fixed factors. Pairwise tests were run to assess site-specific differences in
abundances with depth locations. To investigate recruitment of macroinvertebrate species and
recolonisation of mudflats (key questions 1b-g), current (2013/2014) distribution ranges, abundances
of key species (e.g. polychaetes) and taxonomic groups (e.g. amphipods, larval insects) as well as
size frequency distributions were determined and compared to previous surveys.
Macroinvertebrate communities over the survey periods and study regions were characterised based
on SIMPER analysis identifying species contributing most to communities within sites or time periods,
or to the differentiation between sites, regions, survey years or periods. These species lists were
compared with historical information (Geddes & Butler 1984; Geddes 1987) and records from earlier
monitoring (Dittmann et al. 2010, Dittmann et al. 2011, Keuning et al. 2012, Dittmann et al. 2013a, b)
and long-term data from TLM monitoring (Dittmann et al. 2014). For long-term community
comparisons, including the TLM monitoring timeframe (Dittmann et al. 2014), the years were divided
into three periods; pre-drought (2004-2006), drought (2007-2009), and flow (since 2010). To visualise
differences in macroinvertebrate communities, Principle Coordinate Plots (PCO) were created, based
on fourth root transformed data and Bray-Curtis similarity with a dummy value due to many zero
values in the data.Canonical analysis of principle coordinates (CAP) discriminate analysis based on
different flow scenarios was used to determine if distinct communities existed during different flow
scenarios in each region. Samples collected during the 2013/2014 survey were then fitted to the CAP
model generated for each location and assigned to a community type based on the two flow regimes
to investigate the current state of macroinvertebrate communities within the Coorong.
Links between environmental conditions (using variabiles for water and sediment quality) and
macroinvertebrate communities reestablishing in the Murray Mouth and Coorong were analysed
through distance-based linear models (DistLM), visualised with distance-based redundancy analysis
(dbRDA) plots. All analyses were carried out using the software PRIMER v6 with PERMANOVA add-
on.
12
4. Results and Discussion
4.1 Environmental Conditions
Key Question 1a) Will environmental conditions within the Murray Mouth reflect true estuarine
conditions and have they further improved in the North and South Lagoons since flows
recommenced in 2010?
Characteristic of estuarine conditions include seasonal variations in salinities with riverine inflow or
drought, and stratification of salinities resulting from freshwater inflow or saltwater intrusion (Potter et
al. 2010). The salinity profiles in estuaries are one of the main determinants of estuarine fauna
(Whitfield et al. 2012), and salinity had emerged in previous monitoring as the main variable affecting
macroinvertebrate distributions in the Murray Mouth and Coorong (Dittmann et al. 2013a). During the
2013/14 response monitoring for macroinvertebrates, salinities measured during the sampling events
gave indications for estuarine conditions improving.
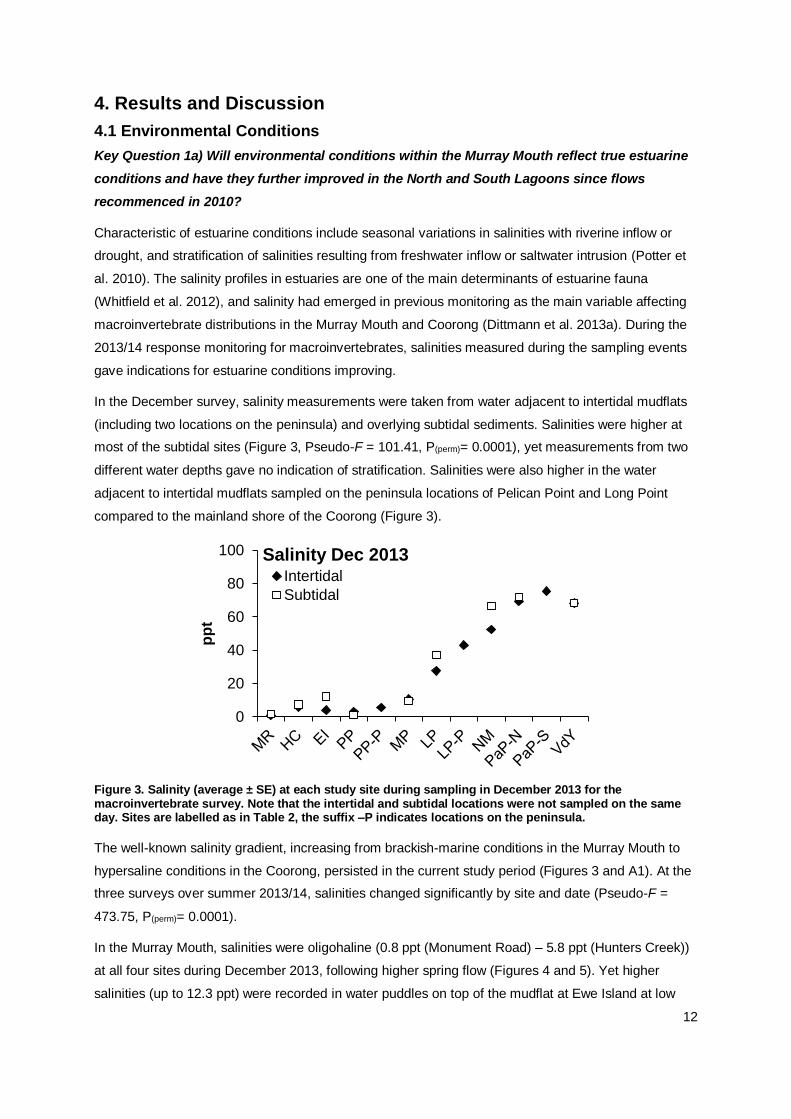
In the December survey, salinity measurements were taken from water adjacent to intertidal mudflats
(including two locations on the peninsula) and overlying subtidal sediments. Salinities were higher at
most of the subtidal sites (Figure 3, Pseudo-F = 101.41, P(perm)= 0.0001), yet measurements from two
different water depths gave no indication of stratification. Salinities were also higher in the water
adjacent to intertidal mudflats sampled on the peninsula locations of Pelican Point and Long Point
compared to the mainland shore of the Coorong (Figure 3).
Figure 3. Salinity (average ± SE) at each study site during sampling in December 2013 for the macroinvertebrate survey. Note that the intertidal and subtidal locations were not sampled on the same day. Sites are labelled as in Table 2, the suffix –P indicates locations on the peninsula.
The well-known salinity gradient, increasing from brackish-marine conditions in the Murray Mouth to
hypersaline conditions in the Coorong, persisted in the current study period (Figures 3 and A1). At the
three surveys over summer 2013/14, salinities changed significantly by site and date (Pseudo-F =
473.75, P(perm)= 0.0001).
In the Murray Mouth, salinities were oligohaline (0.8 ppt (Monument Road) – 5.8 ppt (Hunters Creek))
at all four sites during December 2013, following higher spring flow (Figures 4 and 5). Yet higher
salinities (up to 12.3 ppt) were recorded in water puddles on top of the mudflat at Ewe Island at low
0
20
40
60
80
100
pp
t
Salinity Dec 2013Intertidal
Subtidal
13
tide. With reduced freshwater inflow over summer, salinities increased in the Murray Mouth and were
meso-haline (24 ppt (Monument Road) - 31 ppt (Ewe Island)) in February, reaching marine salinities at
Ewe Island in March (35 ppt) (Figure 4).
In the North Lagoon, salinities during December 2013 were mesohaline at the northern-most sites
Mark Point (11 ppt) and Long Point (28 ppt), increasing to hypersaline at Noonameena (52 ppt) and
Parnka Point (69 ppt, north of Hells Gate) (Figure 4). This wide range of salinity narrowed over the
Figure 4. Salinity (average ± SE) at each study site for each sampling occasion during the 2013/2014 macroinvertebrate survey. Sites are labelled as in Table 2. The northern side of Parnka Point (PaPN) was only sampled in December 2013 in conjunction with The Living Murray condition montoring. Note different scales of the y-axis. The dashed line shows the salinity of seawater (36 ppt) for comparison among panels.
0
5
10
15
20
25
30
35
40
Dec-13 Jan-14 Feb-14 Mar-14
Sa
lin
ity (
pp
t)
Murray Mouth
MR HC EI PP
0
10
20
30
40
50
60
70
80
Dec-13 Jan-14 Feb-14 Mar-14
Sa
lin
ity (
pp
t)
North Lagoon
MP LP NM PaPN
0
20
40
60
80
100
120
Dec-13 Jan-14 Feb-14 Mar-14
Sa
lin
ity (
pp
t)
South Lagoon
PaPS VdY
14
following summer sampling events and seawater salinities (~36 ppt) were recorded in March 2014 at
all sampled sites. Salinities had increased over summer at the northern section of the North Lagoon,
but decreased at the southernmost sections (Figure 4).
In the South Lagoon, salinities remained hypersaline and less variation was recorded between the
three sampling events. Parnka Point South (just south of Hells Gate), salinity was more stable, with a
slight decrease in salinity from 75 ppt in December 2013 to 63 ppt in March 2014 (Figure 4). Salinity at
Villa de Yumpa rose over the study period from 68 ppt in December 2013 to 93 ppt in March 2014.
Figure 5. Average salinity at those study sites in the Murray Mouth and Coorong surveyed for several summer surveys of the water release project since December 2010. Note that not all sites were sampled in every summer period. Sites in the Murray Mouth are Monument Road (MR), Hunters Creek (HC), Ewe Island (EI), Pelican Point (PP), and sites in the Coorong comprise Mark Point (MP), Long Point (LP), Noonameena (NM), Parnka Point (PaP) and Villa de Yumpa (VdY). Note different scales of the y-axis. Flow data are based on MDBA (see Figure 1).
0
500
1000
1500
2000
2500
0
5
10
15
20
25
30
35
40
Aug
-10
Oct-
10
Dec-1
0
Fe
b-1
1
Apr-
11
Ju
n-1
1
Aug
-11
Oct-
11
Dec-1
1
Fe
b-1
2
Apr-
12
Ju
n-1
2
Aug
-12
Oct-
12
Dec-1
2
Fe
b-1
3
Apr-
13
Ju
n-1
3
Aug
-13
Oct-
13
Dec-1
3
Fe
b-1
4
Apr-
14
GL
/mo
nth
Sa
lin
ity (
pp
t)
Murray Mouth
MR HC EI PP Barrage Flow (GL)
0
500
1000
1500
2000
2500
0
10
20
30
40
50
60
70
80
90
100
Aug
-10
Oct-
10
Dec-1
0
Fe
b-1
1
Apr-
11
Ju
n-1
1
Aug
-11
Oct-
11
Dec-1
1
Fe
b-1
2
Apr-
12
Ju
n-1
2
Aug
-12
Oct-
12
Dec-1
2
Fe
b-1
3
Apr-
13
Ju
n-1
3
Aug
-13
Oct-
13
Dec-1
3
Fe
b-1
4
Apr-
14
GL
/mo
nth
Sa
lin
ity (
pp
t)
Coorong
MP LP NM PaP VdY Barrage Flow (GL)
15
Since flows resumed, salinities reduced substantially (by >30 ppt) in the Murray Mouth, North and
South Lagoon (Appendix Figure A2) (Dittmann et al. 2014). The more frequent sampling over the
summer months for the water release monitoring indicates fluctuations in salinity in response to the
flow volume (Figure 5). The lower salinities in spring following freshwater inflow over winter, and the
higher salinities over summer when flows were reduced, reflect estuarine conditions. This pattern has
been apparent in the Murray Mouth over the last two summers and a similar seasonal variation in
salinity can also be seen from the Coorong, especially at the sampling sites in the North Lagoon
(Figure 5). A continuation of seasonal freshwater flows is needed to further improve the estuarine
characteristics of the Murray Mouth and Coorong.
4.2 Macroinvertebrate Recruitment
Key Question 1b) Has recruitment continued for macroinvertebrate species that began
recovery in 2011-12 and is recruitment occurring for other species in 2013-14?
Recolonisation of marine sediments disturbed on a large scale relies on larval influx from source
populations elsewhere (Thrush et al. 1996, Whitlatch et al. 1998, Cummings & Thrush 2004). Larvae
and juvenile stages have a higher dispersal potential than adult macroinvertebrates (Günther 1992),
although emergence of larger benthic organisms has been documented (Oishi & Saigusa 1999). For
the recolonisation of mudflats in the Murray Mouth and Coorong, presence of small sized individuals
(assumed to have been recently recruited to the population) gives a good indication of the potential for
recovery. Based on findings from the previous surveys we had predicted that recruitment of
polychaetes and other benthic taxa would occur, and that additional species would recruit into the
sediments. The analyses of size frequency distributions of polychaetes and records of size ranges in
the summer survey 2013/14 indicated that several of the key macroinvertebrate species, such as of
Simplisetia aequisetis, Capitella spp. and Boccardiella limnicola recruited throughout the summer
months (Table 3).
The polychaete Simplisetia aequisetis ranged in size from 2 mm to 67 mm length (Appendix Table
A1). Small-sized individuals were observed in the Murray Mouth and North Lagoon during late spring
and early summer and, in the Murray Mouth, also in late summer (Figure 6). Size-frequency
distributions for this species were similar in the Murray Mouth and North Lagoon regions during
December 2013 and February 2014, while smaller and mid-sized worms were more frequent in the
Murray Mouth than North Lagoon in March 2014. The presence of small individuals in each month
indicates continuous recruitment over the survey period, yet there was little increase in the frequency
of larger worms in the following months.
Size frequency distributions of S. aequisetis were similar between inter- and subtidal locations in the
Murray Mouth region in December 2013, with a high proportion of small-sized individuals indicating
recruitment in mudflats and shallow subtidal sediments (Figure 6). In the North Lagoon, the proportion
of small-sized individuals was higher in the subtidal than intertidal mudflat samples (Figure 7). The
size-frequency plots also showed that larger specimens of S. aequisetis were mostly found in the
subtidal sediments (Figure 7).
16
Over the last three summer surveys, the size-frequency distributions of S. aequisetis were comparable
and skewed to the left, with a higher frequency of small (~6-12 mm) than large worms (Appendix
Figure A8).
Another polychaete related to S. aequisetis, Australonereis ehlersi, had been found in the previous
surveys with a wider size range, indicating recruitment and large mature worms, occurring mainly in
subtidal sediments (Appendix Figure A10 and Dittmann et al. 2013a). This species was rare in the
recent survey as only one large individual of 138 mm length was found in the mudflat at Ewe Island.
Figure 6. Size-frequency distribution histograms for Simplisetia aequisetis for each sampling occasion in the Murray Mouth and North Lagoon over the summer 2013/14 survey. The number of individuals measured in each month is given by n.
0
2
4
6
8
10
12
14
16
18
0 4 8 12 16 20 24 28 32 36 40 44 48 52 56 60 64 68
Pe
rce
nt
Fre
qu
en
cy (
%)
Length (mm)
a) December 2013
Murray MouthNorth Lagoon
n = 1120
0
2
4
6
8
10
12
14
16
18
0 4 8 12 16 20 24 28 32 36 40 44 48 52 56 60 64 68
Pe
rce
nt
Fre
qu
en
cy (
%)
Length (mm)
b) February 2014
Murray MouthNorth Lagoon
n = 639
0
2
4
6
8
10
12
14
16
18
0 4 8 12 16 20 24 28 32 36 40 44 48 52 56 60 64 68
Pe
rce
nt
Fre
qu
en
cy (
%)
Length (mm)
c) March 2014
Murray MouthNorth Lagoon
n = 352
17
Figure 7. Size-frequency distribution histograms for Simplisetia aequisetis for both subtidal and intertidal populations in a) the Murray Mouth and b) the North Lagoon sampled during December 2013. The number of individuals measured in each region is given by n.
During the 2012/13 survey, A. ehlersi was recorded almost exclusively at Noonameena and most
abundant in the subtidal in the September 2012 survey (Dittmann et al. 2013a). The population size
and structure of this species could have been underestimated in the present survey as subtidal
sediments were only sampled once.
The polychaete Capitella sp. ranged in size from 2 mm to 18 mm length (Appendix Table A1). Large
populations of this species were only found in the North Lagoon, at Long Point and Noonameena
during December 2013, at Long Point in February 2014 and at Noonameena in March 2014 (Figure 8).
The size frequency distributions gave no indication of any particular recruitment event that was
captured in the samples, and worms of all sizes for this species were found in every month. The
continued presence of small-sized individuals may indicate recruitment of this opportunistic species
throughout the summer months.
Smaller worms occurred in samples from Noonameena compared to medium to large sized at Long
Point. As Noonameena is located further south in the North Lagoon, this size-frequency distribution
may hint to more recent colonisation at Noonameena. Specimens of Capitella sp. found in subtidal
sediments of the North Lagoon in December 2013 were larger than in intertidal sediments (Figure 9).
This distinct difference in the size frequency distribution could indicate recruitment or colonisation in
the mudflats.
0
5
10
15
20
25
0 4 8 12 16 20 24 28 32 36 40 44 48 52 56 60 64 68
Pe
rce
nt
Fre
qu
en
cy (
%)
Length (mm)
a) Murray Mouth
IntertidalSubtidaln = 831
0
5
10
15
20
25
0 4 8 12 16 20 24 28 32 36 40 44 48 52 56 60 64 68
Pe
rce
nt
Fre
qu
en
cy (
%)
Length (mm)
b) North Lagoon
IntertidalSubtidaln = 239
18
Size frequency distributions of Capitella sp. were similar over the last three summer surveys and
unimodal, with a high frequency of worms 8-10 mm in lengths (Appendix Figure A9). Smaller
specimens occurred each year, yet the frequency of larger specimens was more prominent in the
previous two summers. In 2011/12 and 2013/14 the frequency of medium and large sized Capitella sp.
appeared to be higher in subtidal sediments.
Figure 8. Size-frequency distribution histograms for Capitella sp. for Long Point (LP) and Noonameena (NM) in the North Lagoon for each sampling occasion of the survey over summer 2013/14. The number of individuals measured in each month is given by n.
0
5
10
15
20
25
30
0 1 2 3 4 5 6 7 8 9 1011121314151617181920
Pe
rce
nt
Fre
qu
en
cy (
%)
Length (mm)
a) December 2013
NMLP
n=581
0
5
10
15
20
25
30
0 1 2 3 4 5 6 7 8 9 1011121314151617181920
Pe
rce
nt
Fre
qu
en
cy (
%)
Length (mm)
b) February 2014
LP
n=301
0
5
10
15
20
25
30
0 1 2 3 4 5 6 7 8 9 1011121314151617181920
Pe
rce
nt
Fre
qu
en
cy (
%)
Length (mm)
c) March 2014
NM
n=88
19
Figure 9. Size-frequency distribution histograms for Capitella sp. for both subtidal and intertidal populations in the North Lagoon sampled during December 2013. The number of individuals measured in each depth is given by n.
Few (n=21) specimens of Nephtys australiensis were found in early summer 2013/14 and their length
ranged from 12 to 58 mm. Small-sized specimens occurred in subtidal sediments, and the two largest
worms were found in the mudflat mainly at Ewe Island. As in previous surveys, no recruitment peaks
were apparent from the size-frequency distributions, and worms of all sizes were present (Appendix
Figure A11). The range of sizes measured in summer 2013/14 was narrower than the size range
found in summer 2011/12 (Appendix Figure A11). With no further subtidal sampling beyond December
2013, it is unknown whether this species persisted in subtidal sediments.
The spionid polychaete, Boccardiella limnicola, ranged in size from 2 mm to 22 mm length (Appendix
Table A2) and was only found at sites in the Murray Mouth. The size frequency distribution in
December 2013 was bimodal, with a high frequency of small sized worms in both inter- and subtidal
sediments indicating possible recent recruitment, and a second peak of larger worms around 15 mm
lengths (Figure 10a). A similar recruitment event in late spring was also observed in the 2012/13
survey (Dittmann et al. 2013). By February 2014, worms of all sizes were found with similar frequency
(Figure 10b). The sample size for size measurements of B. limnicola was small and only two
individuals could be measured during March 2014, which were larger specimens (14 and 16 mm
lengths).
Taking the size measurements of B. limnicola from over all survey months of the last two summer
monitoring periods, a spread of smaller and larger worms was found in each year, slightly skewed to
smaller sized specimens, especially in the subtidal when taken over the entire summer 2013/14
(Appendix Figure A12).
0
5
10
15
20
25
30
0 1 2 3 4 5 6 7 8 9 1011121314151617181920
Pe
rcen
t F
req
uen
cy (
%)
Length (mm)
n=1069
Intertidal
Subtidal
20
Figure 10. Size-frequency distribution histograms for Boccardiella limnicola for a) both subtidal and intertidal populations in the Murray Mouth sampled during December 2013, and intertidal populations in b) February 2014. Only two specimens were found in March 2014 of 14 and 16 mm lengths. The number of individuals measured in each month is given by n.
Table 3. Occurrence of small individuals of key species observed in benthic samples on each sampling occasion. Subtidal sampling was only conducted during December 2013. Ticks indicate small individuals were present at the specified location on the sampling occasion.
The micro-mollusc Arthritica helmsi is a small sized bivalve which had been prominent in the Murray
Mouth and Coorong before the drought and started to return last year (Dittmann et al. 2013 a, b). The
population size of this species was higher again in the recent survey and they were found at all three
sampling events. The size-frequency distributions were uni-modal with most bivalves 2 mm in size
0
5
10
15
20
25
30
35
40
0 2 4 6 8 10 12 14 16 18 20 22 24 26 28 30 32 34 36
Pe
rce
nt
Fre
qu
en
cy (
%)
Length (mm)
Intertidal
Subtidal
a) December
n = 39
0
5
10
15
20
25
30
35
40
0 2 4 6 8 10 12 14 16 18 20 22 24 26 28 30 32 34 36
Pe
rce
nt
Fre
qu
en
cy (
%)
Length (mm)
b) February 2014
n = 25
Feb-14 Mar-14
Intertidal Subtidal Intertidal Intertidal
Simplisetia aequisetis Murray Mouth P P P P
North Lagoon P P P P
Capitella spp. Murray Mouth
North Lagoon P P P P
Boccardiella limnicola Murray Mouth P P P
North Lagoon
Arthritica helmsi Murray Mouth P P P P
North Lagoon P P P
Small individuals observed
Dec-13Species Location
21
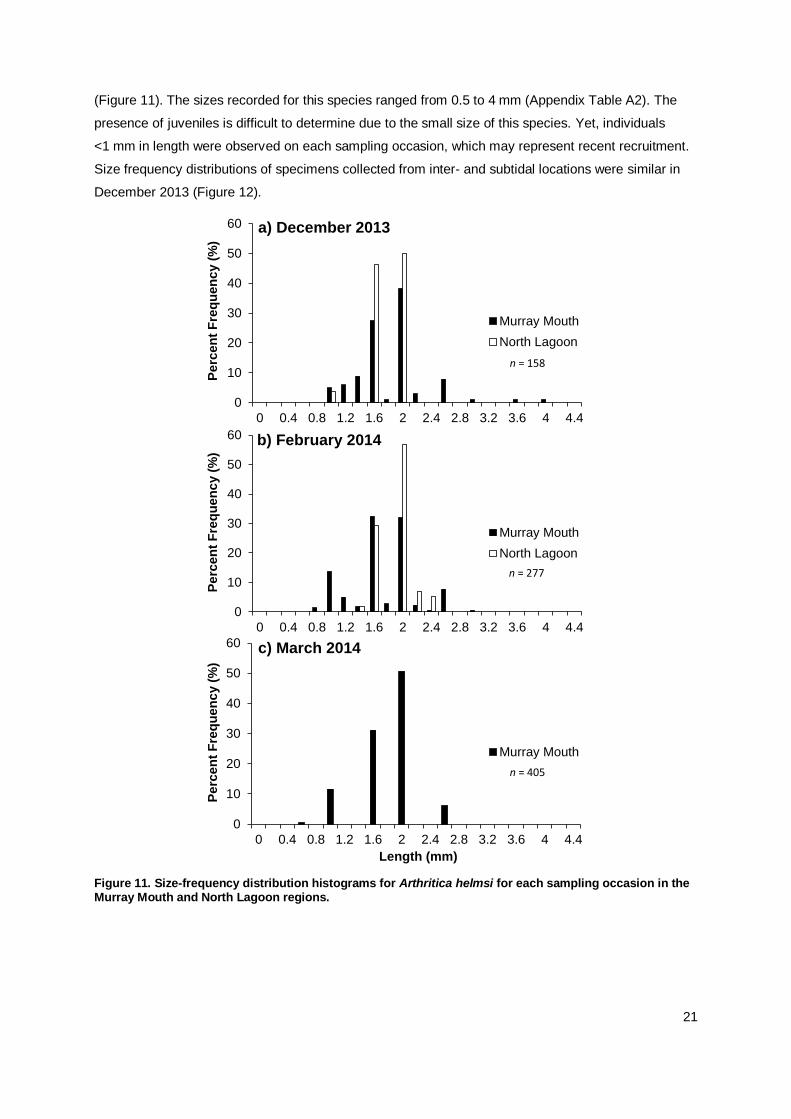
(Figure 11). The sizes recorded for this species ranged from 0.5 to 4 mm (Appendix Table A2). The
presence of juveniles is difficult to determine due to the small size of this species. Yet, individuals
<1 mm in length were observed on each sampling occasion, which may represent recent recruitment.
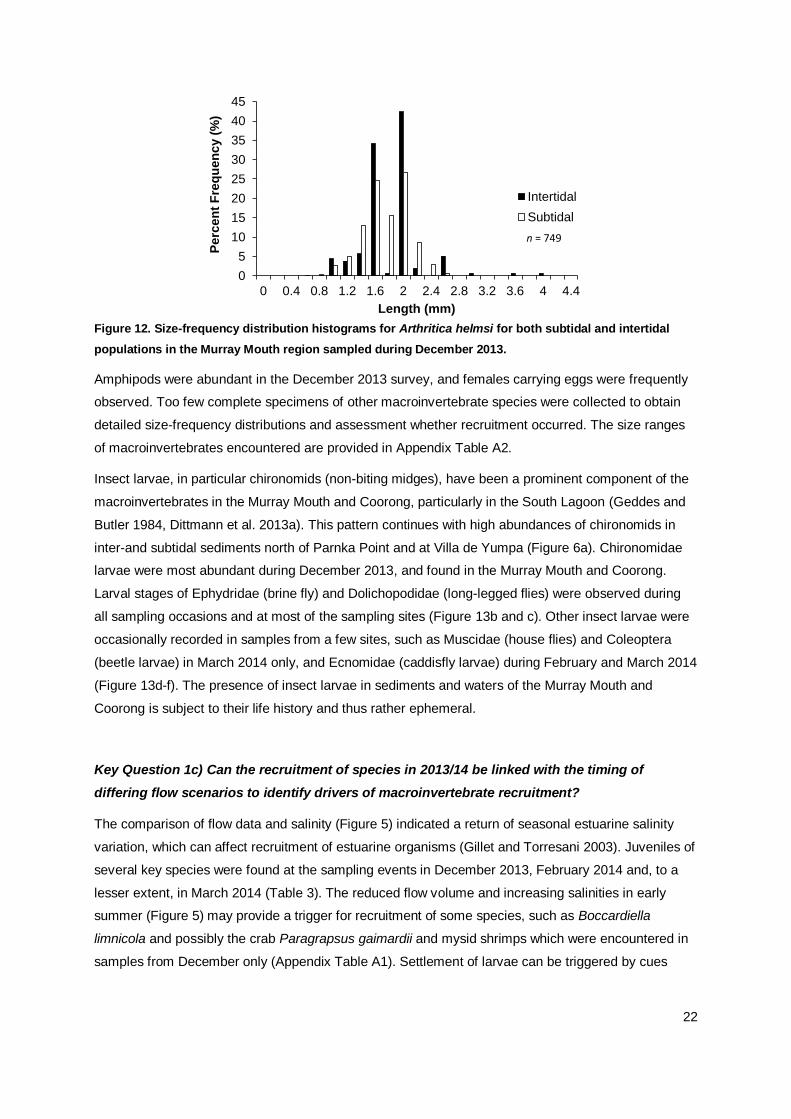
Size frequency distributions of specimens collected from inter- and subtidal locations were similar in
December 2013 (Figure 12).
Figure 11. Size-frequency distribution histograms for Arthritica helmsi for each sampling occasion in the Murray Mouth and North Lagoon regions.
0
10
20
30
40
50
60
0 0.4 0.8 1.2 1.6 2 2.4 2.8 3.2 3.6 4 4.4
Pe
rce
nt
Fre
qu
en
cy (
%)
Length (mm)
a) December 2013
Murray Mouth
North Lagoon
n = 158
0
10
20
30
40
50
60
0 0.4 0.8 1.2 1.6 2 2.4 2.8 3.2 3.6 4 4.4
Pe
rce
nt
Fre
qu
en
cy (
%)
Length (mm)
b) February 2014
Murray Mouth
North Lagoon
n = 277
0
10
20
30
40
50
60
0 0.4 0.8 1.2 1.6 2 2.4 2.8 3.2 3.6 4 4.4
Pe
rce
nt
Fre
qu
en
cy (
%)
Length (mm)
c) March 2014
Murray Mouth
n = 405
22
Figure 12. Size-frequency distribution histograms for Arthritica helmsi for both subtidal and intertidal
populations in the Murray Mouth region sampled during December 2013.
Amphipods were abundant in the December 2013 survey, and females carrying eggs were frequently
observed. Too few complete specimens of other macroinvertebrate species were collected to obtain
detailed size-frequency distributions and assessment whether recruitment occurred. The size ranges
of macroinvertebrates encountered are provided in Appendix Table A2.
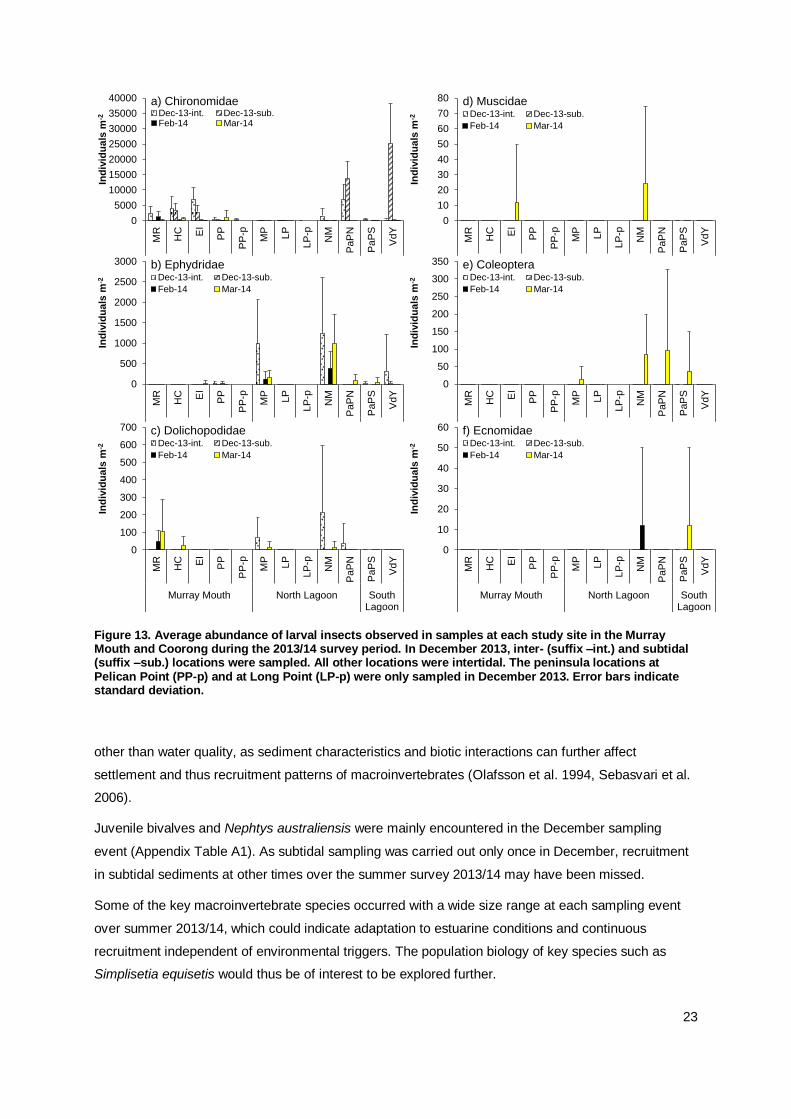
Insect larvae, in particular chironomids (non-biting midges), have been a prominent component of the
macroinvertebrates in the Murray Mouth and Coorong, particularly in the South Lagoon (Geddes and
Butler 1984, Dittmann et al. 2013a). This pattern continues with high abundances of chironomids in
inter-and subtidal sediments north of Parnka Point and at Villa de Yumpa (Figure 6a). Chironomidae
larvae were most abundant during December 2013, and found in the Murray Mouth and Coorong.
Larval stages of Ephydridae (brine fly) and Dolichopodidae (long-legged flies) were observed during
all sampling occasions and at most of the sampling sites (Figure 13b and c). Other insect larvae were
occasionally recorded in samples from a few sites, such as Muscidae (house flies) and Coleoptera
(beetle larvae) in March 2014 only, and Ecnomidae (caddisfly larvae) during February and March 2014
(Figure 13d-f). The presence of insect larvae in sediments and waters of the Murray Mouth and
Coorong is subject to their life history and thus rather ephemeral.
Key Question 1c) Can the recruitment of species in 2013/14 be linked with the timing of
differing flow scenarios to identify drivers of macroinvertebrate recruitment?
The comparison of flow data and salinity (Figure 5) indicated a return of seasonal estuarine salinity
variation, which can affect recruitment of estuarine organisms (Gillet and Torresani 2003). Juveniles of
several key species were found at the sampling events in December 2013, February 2014 and, to a
lesser extent, in March 2014 (Table 3). The reduced flow volume and increasing salinities in early
summer (Figure 5) may provide a trigger for recruitment of some species, such as Boccardiella
limnicola and possibly the crab Paragrapsus gaimardii and mysid shrimps which were encountered in
samples from December only (Appendix Table A1). Settlement of larvae can be triggered by cues
0
5
10
15
20
25
30
35
40
45
0 0.4 0.8 1.2 1.6 2 2.4 2.8 3.2 3.6 4 4.4
Pe
rce
nt
Fre
qu
en
cy (
%)
Length (mm)
Intertidal
Subtidal
n = 749
23
Figure 13. Average abundance of larval insects observed in samples at each study site in the Murray Mouth and Coorong during the 2013/14 survey period. In December 2013, inter- (suffix –int.) and subtidal (suffix –sub.) locations were sampled. All other locations were intertidal. The peninsula locations at Pelican Point (PP-p) and at Long Point (LP-p) were only sampled in December 2013. Error bars indicate standard deviation.
other than water quality, as sediment characteristics and biotic interactions can further affect
settlement and thus recruitment patterns of macroinvertebrates (Olafsson et al. 1994, Sebasvari et al.
2006).
Juvenile bivalves and Nephtys australiensis were mainly encountered in the December sampling
event (Appendix Table A1). As subtidal sampling was carried out only once in December, recruitment
in subtidal sediments at other times over the summer survey 2013/14 may have been missed.
Some of the key macroinvertebrate species occurred with a wide size range at each sampling event
over summer 2013/14, which could indicate adaptation to estuarine conditions and continuous
recruitment independent of environmental triggers. The population biology of key species such as
Simplisetia equisetis would thus be of interest to be explored further.
0
5000
10000
15000
20000
25000
30000
35000
40000
MR
HC EI
PP
PP
-p
MP
LP
LP
-p
NM
PaP
N
PaP
S
VdY
Murray Mouth North Lagoon SouthLagoon
Ind
ivid
ua
ls m
-2a) Chironomidae
Dec-13-int. Dec-13-sub.Feb-14 Mar-14
0
500
1000
1500
2000
2500
3000
MR
HC EI
PP
PP
-p
MP
LP
LP
-p
NM
PaP
N
PaP
S
VdY
Murray Mouth North Lagoon SouthLagoon
Ind
ivid
ua
ls m
-2
b) EphydridaeDec-13-int. Dec-13-sub.
Feb-14 Mar-14
0
100
200
300
400
500
600
700
MR
HC EI
PP
PP
-p
MP
LP
LP
-p
NM
PaP
N
PaP
S
VdY
Murray Mouth North Lagoon SouthLagoon
Ind
ivid
ua
ls m
-2
c) DolichopodidaeDec-13-int. Dec-13-sub.
Feb-14 Mar-14
0
10
20
30
40
50
60
70
80
MR
HC EI
PP
PP
-p
MP
LP
LP
-p
NM
PaP
N
PaP
S
VdY
Murray Mouth North Lagoon SouthLagoon
Ind
ivid
ua
ls m
-2
d) MuscidaeDec-13-int. Dec-13-sub.
Feb-14 Mar-14
0
50
100
150
200
250
300
350
MR
HC EI
PP
PP
-p
MP
LP
LP
-p
NM
PaP
N
PaP
S
VdY
Murray Mouth North Lagoon SouthLagoon
Ind
ivid
ua
ls m
-2
e) ColeopteraDec-13-int. Dec-13-sub.
Feb-14 Mar-14
0
10
20
30
40
50
60
MR
HC EI
PP
PP
-p
MP
LP
LP
-p
NM
PaP
N
PaP
S
VdY
Murray Mouth North Lagoon SouthLagoon
Ind
ivid
ua
ls m
-2
f) EcnomidaeDec-13-int. Dec-13-sub.
Feb-14 Mar-14
24
4.3 Macroinvertebrate Recolonisation
Key Question 1d) Will there be any further recolonisation of mudflats by macroinvertebrates
absent from areas in previous monitoring 2010-12?
At the three sampling events in summer 2013/14, 32 macroinvertebrate taxa were differentiated in the
samples, composed of molluscs (12 taxa), annelids (8 taxa), insect larvae (7 taxa) and crustaceans (5
taxa) (Appendix Table A1 and Figure A7). The total number of species found in intertidal mudflats had
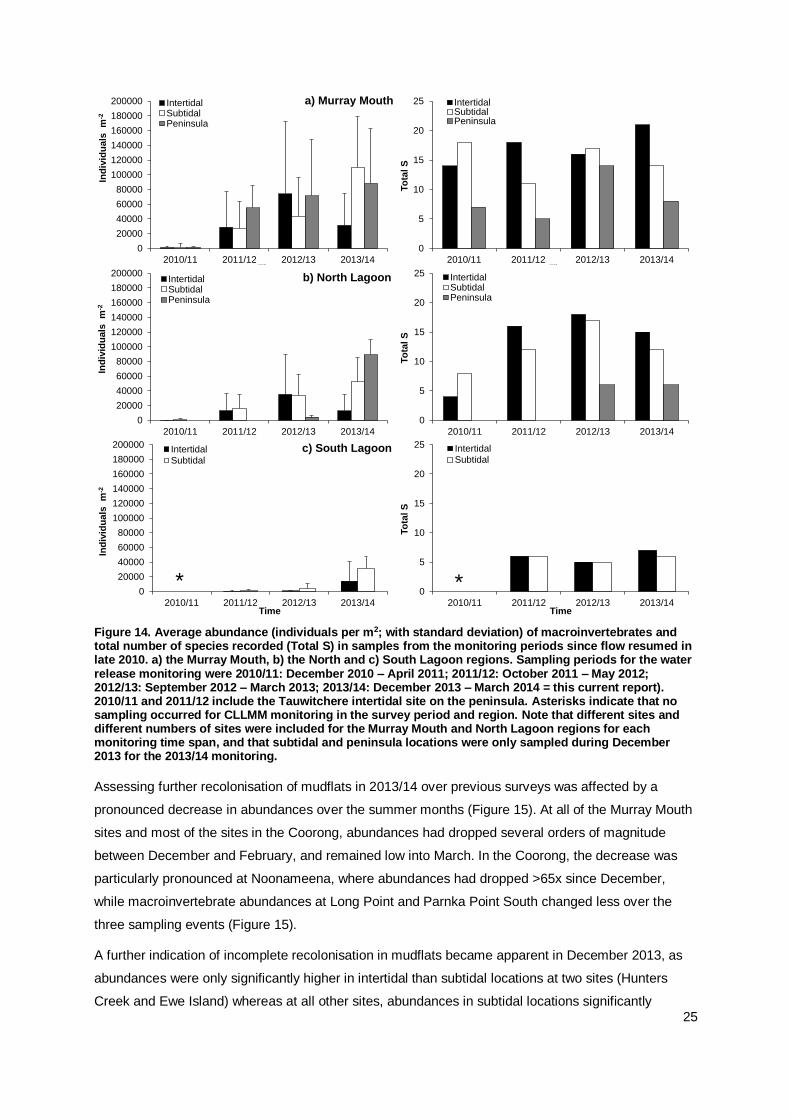
thus increased over previous monitoring (2010/11, 2011/12 and 2012/13: 14, 21 and 20 taxa
respectively (Dittmann et al. 2011, Keuning et al. 2012, Dittmann et al. 2013a)). Looking at species
numbers by region, the further increase was less pronounced (Figure 14). As sampling effort varied
over the monitoring years (number of sampling events, sites and locations sampled), species numbers
for the Coorong and peninsula locations have to be considered with caution. The number of species
found in mudflat samples also varied within sites over the three sampling events in 2013/14, without
any consistent pattern of increase or decrease (Appendix Figure A6).
Two species were recorded in the 2013/14 survey for the first time again since the drought and flow
resumed, the scavenging polychaete Phyllodoce novaehollandiae at Ewe Island and an isopod at
Parnka Point. Juvenile bivalves of possibly three different species were found in the December
sampling event. Larvae of Ecnomidae and Coleoptera had not been found in the previous water
release monitoring.
The increase in the total species number in 2013/14 was largely due to molluscs. Six morphospecies
of small hydrobiid snails were identified, which occurred at sites in the Murray Mouth. Hydrobiids were
rarely encountered in previous surveys and species not consistently differentiated. For a comparison
of species numbers over the survey years, they were thus combined to family level (Hydrobiidae) and
the real species numbers in 2013/14 will be higher than the comparison shown in Figure 14.
For mudflat sediments, abundances of macroinvertebrates in the current monitoring year were
comparable or lower than in the previous surveys since flow resumed, while similar or higher
abundances were recorded for the subtidal study sites (Appendix Figure A13). Abundances of
macroinvertebrates in mudflat sediments were highly variable within each of the survey years, in
particular in the Murray Mouth, where a decrease was recorded over summer (Figures 14 and 15,
Appendix Figure A14). Abundances were significantly different between the survey years (Appendix
Table A3). Yet for intertidal mudflats in the Murray Mouth and North Lagoon, abundances in 2013/14
were not significantly different to those found in 2011/12, possibly affected by the decline over summer
2013/14. For the South Lagoon (note, only the northern end to Villa de Yumpa sampled since
2011/12), macroinvertebrate abundances in mudflats were significantly higher in the 2013/14 survey
than in any of the previous two survey years. In mudflats at the two peninsula locations first sampled
in 2012/13, abundances were similar between years for Pelican Point in the Murray Mouth, but had
significantly (P(perm)=0.0001) increased at the pensinsula mudflat at Long Point by 2013/14 (Figure 14).
For macroinvertebrate abundances in subtidal sediments, pairwise tests showed significant increases
between any two years for the three regions (Appendix Table A3).
25
Figure 14. Average abundance (individuals per m2; with standard deviation) of macroinvertebrates and total number of species recorded (Total S) in samples from the monitoring periods since flow resumed in late 2010. a) the Murray Mouth, b) the North and c) South Lagoon regions. Sampling periods for the water release monitoring were 2010/11: December 2010 – April 2011; 2011/12: October 2011 – May 2012; 2012/13: September 2012 – March 2013; 2013/14: December 2013 – March 2014 = this current report). 2010/11 and 2011/12 include the Tauwitchere intertidal site on the peninsula. Asterisks indicate that no sampling occurred for CLLMM monitoring in the survey period and region. Note that different sites and different numbers of sites were included for the Murray Mouth and North Lagoon regions for each monitoring time span, and that subtidal and peninsula locations were only sampled during December 2013 for the 2013/14 monitoring.
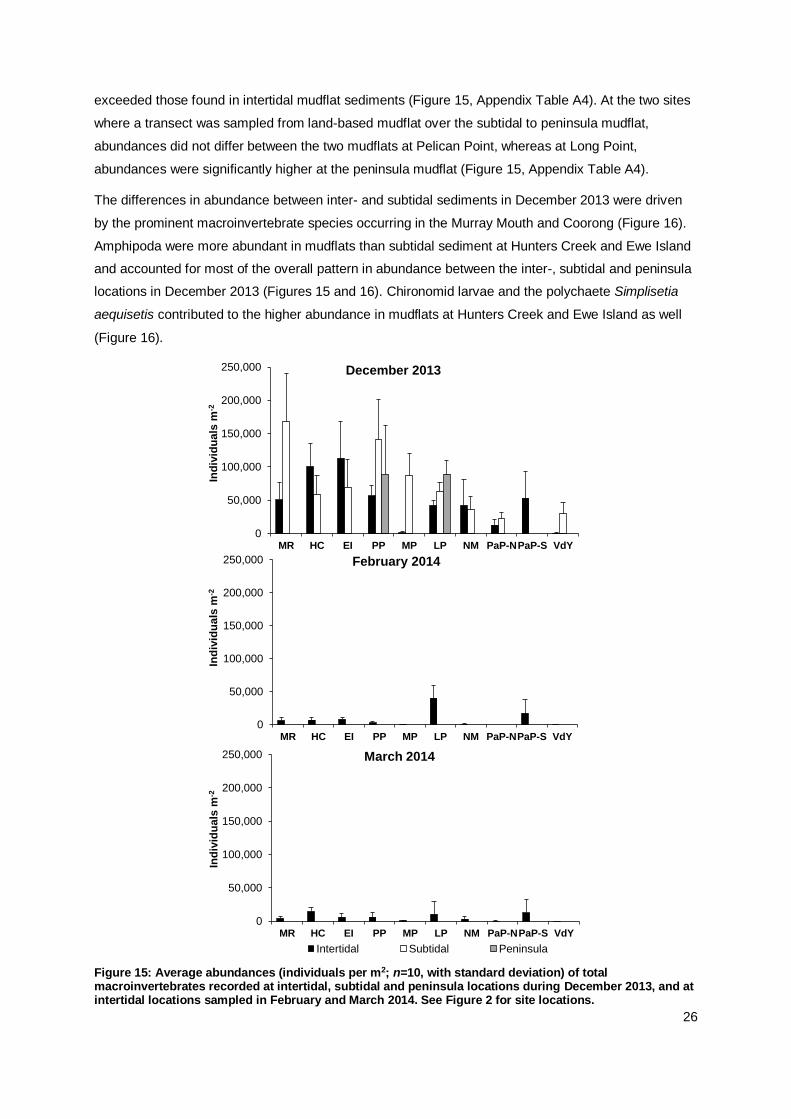
Assessing further recolonisation of mudflats in 2013/14 over previous surveys was affected by a
pronounced decrease in abundances over the summer months (Figure 15). At all of the Murray Mouth
sites and most of the sites in the Coorong, abundances had dropped several orders of magnitude
between December and February, and remained low into March. In the Coorong, the decrease was
particularly pronounced at Noonameena, where abundances had dropped >65x since December,
while macroinvertebrate abundances at Long Point and Parnka Point South changed less over the
three sampling events (Figure 15).
A further indication of incomplete recolonisation in mudflats became apparent in December 2013, as
abundances were only significantly higher in intertidal than subtidal locations at two sites (Hunters
Creek and Ewe Island) whereas at all other sites, abundances in subtidal locations significantly
0
20000
40000
60000
80000
100000
120000
140000
160000
180000
200000
2010/11 2011/12 2012/13 2013/14
Ind
ivid
ua
ls
m-2
Time
a) Murray MouthIntertidalSubtidalPeninsula
0
5
10
15
20
25
2010/11 2011/12 2012/13 2013/14
To
tal S
Time
IntertidalSubtidalPeninsula
0
20000
40000
60000
80000
100000
120000
140000
160000
180000
200000
2010/11 2011/12 2012/13 2013/14
Ind
ivid
uals
m
-2
Time
b) North LagoonIntertidalSubtidalPeninsula
0
5
10
15
20
25
2010/11 2011/12 2012/13 2013/14
To
tal S
Time
IntertidalSubtidalPeninsula
0
20000
40000
60000
80000
100000
120000
140000
160000
180000
200000
2010/11 2011/12 2012/13 2013/14
Ind
ivid
ua
ls
m-2
Time
c) South LagoonIntertidal
Subtidal
*0
5
10
15
20
25
2010/11 2011/12 2012/13 2013/14
To
tal S
Time
Intertidal
Subtidal
*
26
exceeded those found in intertidal mudflat sediments (Figure 15, Appendix Table A4). At the two sites
where a transect was sampled from land-based mudflat over the subtidal to peninsula mudflat,
abundances did not differ between the two mudflats at Pelican Point, whereas at Long Point,
abundances were significantly higher at the peninsula mudflat (Figure 15, Appendix Table A4).
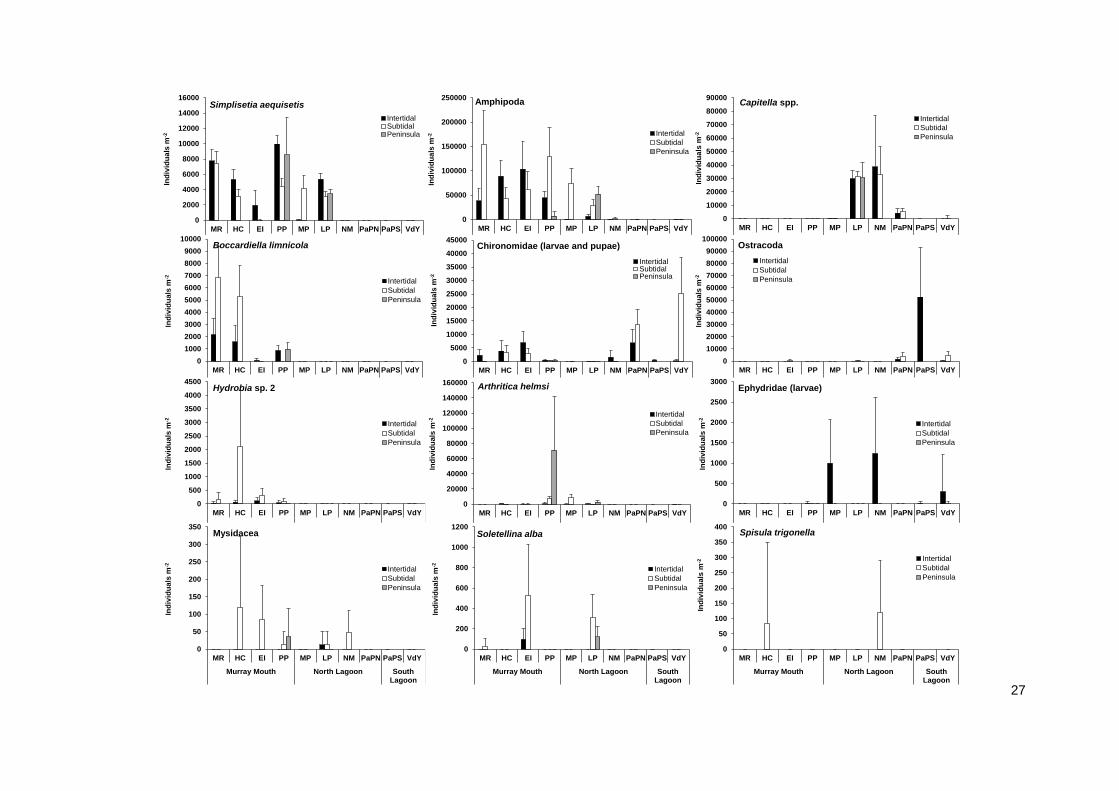
The differences in abundance between inter- and subtidal sediments in December 2013 were driven
by the prominent macroinvertebrate species occurring in the Murray Mouth and Coorong (Figure 16).
Amphipoda were more abundant in mudflats than subtidal sediment at Hunters Creek and Ewe Island
and accounted for most of the overall pattern in abundance between the inter-, subtidal and peninsula
locations in December 2013 (Figures 15 and 16). Chironomid larvae and the polychaete Simplisetia
aequisetis contributed to the higher abundance in mudflats at Hunters Creek and Ewe Island as well
(Figure 16).
Figure 15: Average abundances (individuals per m2; n=10, with standard deviation) of total macroinvertebrates recorded at intertidal, subtidal and peninsula locations during December 2013, and at intertidal locations sampled in February and March 2014. See Figure 2 for site locations.
0
50,000
100,000
150,000
200,000
250,000
MR HC EI PP MP LP NM PaP-NPaP-S VdY
Ind
ivid
ua
ls m
-2
December 2013
Intertidal Subtidal Peninsula
0
50,000
100,000
150,000
200,000
250,000
MR HC EI PP MP LP NM PaP-NPaP-S VdY
Ind
ivid
ua
ls m
-2
February 2014
Intertidal Subtidal Peninsula
0
50,000
100,000
150,000
200,000
250,000
MR HC EI PP MP LP NM PaP-NPaP-S VdY
Ind
ivid
ua
ls m
-2
March 2014
Intertidal Subtidal Peninsula
27
0
10000
20000
30000
40000
50000
60000
70000
80000
90000
MR HC EI PP MP LP NM PaPN PaPS VdY
Murray Mouth North Lagoon SouthLagoon
Ind
ivid
ua
ls m
-2
Capitella spp.
Intertidal
Subtidal
Peninsula
0
50000
100000
150000
200000
250000
MR HC EI PP MP LP NM PaPN PaPS VdY
Murray Mouth North Lagoon SouthLagoon
Ind
ivid
ua
ls m
-2
Amphipoda
Intertidal
Subtidal
Peninsula
0
10000
20000
30000
40000
50000
60000
70000
80000
90000
100000
MR HC EI PP MP LP NM PaPN PaPS VdY
Murray Mouth North Lagoon SouthLagoon
Ind
ivid
ua
ls m
-2
Ostracoda
Intertidal
Subtidal
Peninsula
0
500
1000
1500
2000
2500
3000
MR HC EI PP MP LP NM PaPN PaPS VdY
Murray Mouth North Lagoon SouthLagoon
Ind
ivid
ua
ls m
-2
Ephydridae (larvae)
Intertidal
Subtidal
Peninsula
0
2000
4000
6000
8000
10000
12000
14000
16000
MR HC EI PP MP LP NM PaPN PaPS VdY
Murray Mouth North Lagoon SouthLagoon
Ind
ivid
ua
ls m
-2
Simplisetia aequisetis
IntertidalSubtidalPeninsula
0
1000
2000
3000
4000
5000
6000
7000
8000
9000
10000
MR HC EI PP MP LP NM PaPN PaPS VdY
Murray Mouth North Lagoon SouthLagoon
Ind
ivid
ua
ls m
-2
Boccardiella limnicola
Intertidal
Subtidal
Peninsula
0
500
1000
1500
2000
2500
3000
3500
4000
4500
MR HC EI PP MP LP NM PaPN PaPS VdY
Murray Mouth North Lagoon SouthLagoon
Ind
ivid
ua
ls m
-2
Hydrobia sp. 2
Intertidal
Subtidal
Peninsula
0
50
100
150
200
250
300
350
MR HC EI PP MP LP NM PaPN PaPS VdY
Murray Mouth North Lagoon SouthLagoon
Ind
ivid
ua
ls m
-2
Mysidacea
Intertidal
Subtidal
Peninsula
0
50
100
150
200
250
300
350
400
MR HC EI PP MP LP NM PaPN PaPS VdY
Murray Mouth North Lagoon SouthLagoon
Ind
ivid
ua
ls m
-2
Spisula trigonella
Intertidal
Subtidal
Peninsula
0
5000
10000
15000
20000
25000
30000
35000
40000
45000
MR HC EI PP MP LP NM PaPN PaPS VdY
Murray Mouth North Lagoon SouthLagoon
Ind
ivid
ua
ls m
-2
Chironomidae (larvae and pupae)
IntertidalSubtidalPeninsula
0
20000
40000
60000
80000
100000
120000
140000
160000
MR HC EI PP MP LP NM PaPN PaPS VdY
Murray Mouth North Lagoon SouthLagoon
Ind
ivid
ua
ls m
-2
Arthritica helmsi
Intertidal
Subtidal
Peninsula
0
200
400
600
800
1000
1200
MR HC EI PP MP LP NM PaPN PaPS VdY
Murray Mouth North Lagoon SouthLagoon
Ind
ivid
ua
ls m
-2
Soletellina alba
Intertidal
Subtidal
Peninsula
28
Figure 16 (previous page). Average abundances (individuals per m-2; n=10, with standard deviation) of several abundant macroinvertebrate taxa recorded at intertidal, subtidal and peninsula locations during December 2013. Note the differences in the scale of the y-axis. See Figure 2 for site locations. The high error bars are a reflection of the patchiness of benthic macroinvertebrates.
For the numerically dominant amphipods, abundances in intertidal mudflats decreased from Pelican
Point into the Coorong, while they were abundant in subtidal sediments. Abundances of amphipods
collapsed over summer (Figure 17). The polychaete Simplisetia aequisetis had a similar distribution
range as the amphipods, and was abundant in mudflats at most of the Murray Mouth and North
Lagoon at all three sampling events (Figures 16 and 17). Both amphipods and S. aequisetis were,
however, constricted to subtidal sediments at Mark Point in December 2013 and continued to be
absent from mudflats at this sites in February and March 2014, yet occurred in mudflats further south
in the Coorong at Long Point (Figures 16 and 17). Another polychaete, Nephtys australiensis, which
was common in the past, was recorded from Hunters Creek and Ewe Island mudflats only, and
subtidal sediments at Ewe Island.
The high abundance in mudflats on the peninsula location at Pelican Point was composed of S.
aequisetis and the small bivalve Arthritica helmsi, whereas at Long Point, amphipods and the
polychaetes Capitella sp. and S. aequisetis contributed most (Figure 16). At Long Point and
Noonameena, Capitella sp. occurred in similar abundances in inter- and subtidal sediments and, at
Long Point, also on the peninsula mudflat (Figure 16). This pattern was similar to the occurrence of
Capitella seen in previous surveys (Dittmann et al. 2013a), yet this year the species was also found in
mudflats and subtidal sediments at Parnka Point.
Ostracoda and larvae of Ephydridae occurred almost exclusively at mudflats in the Coorong, with
ostracods very abundant in sediments on the southern side of Parnka Point, accounting for the high
overall abundance at this site (Figures 15 and 16). Chironomid larvae were also abundant at Parnka
Point and in the South Lagoon, yet found mostly in subtidal sediments (Figure 16).
The potential for further recolonisation of intertidal mudflats arises from the presence and abundance
of several macroinvertebrate species in sediments of adjacent subtidal sampling locations (Figure 16).
For the bivalves Soletellina alba and Spisula trigonella, specimens were found mostly or only in
subtidal sediments. At Hunters Creek, S. trigonella occurred in subtidal sediments in December 2013
and was found in mudflat sediments in February 2014 (Figure 17). Mysid shrimps and also the snail
Hydrobia sp. 2 were more numerous in subtidal sediments at some sites in the Murray Mouth.
Arthritica helmsi, which was prominent in the system before the drought and started to reappear in
2012/13 (Dittmann et al. 2007, 2013b) also re-established in mudflats throughout most of the Murray
Mouth and into the North Lagoon over this survey (Figure 17).
As subtidal sediments were only sampled in December 2013, it is unknown whether the decrease in
abundances in mudflats over the summer months occurred at these locations as well. In previous
monitoring, indications were found that mudflats were recolonised from subtidal locations (Dittmann et
al. 2013b). The size of the potential source populations of the named species for recolonising the
mudflats could thus not be assessed in the 2013/14 monitoring.
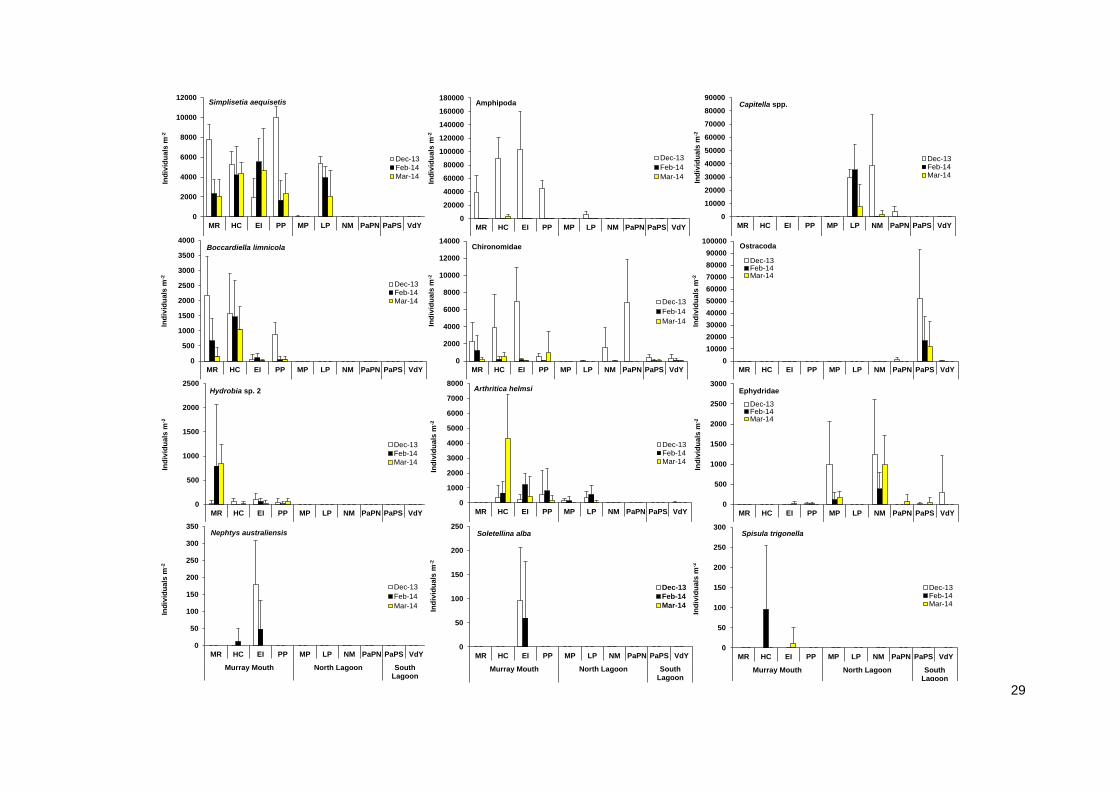
29
0
2000
4000
6000
8000
10000
12000
MR HC EI PP MP LP NM PaPN PaPS VdY
Murray Mouth North Lagoon SouthLagoon
Ind
ivid
ua
ls m
-2
Simplisetia aequisetis
Dec-13
Feb-14
Mar-14
0
10000
20000
30000
40000
50000
60000
70000
80000
90000
MR HC EI PP MP LP NM PaPN PaPS VdY
Murray Mouth North Lagoon SouthLagoon
Ind
ivid
ua
ls m
-2
Capitella spp.
Dec-13Feb-14Mar-14
0
20000
40000
60000
80000
100000
120000
140000
160000
180000
MR HC EI PP MP LP NM PaPN PaPS VdY
Murray Mouth North Lagoon SouthLagoon
Ind
ivid
ua
ls m
-2
Amphipoda
Dec-13
Feb-14
Mar-14
0
2000
4000
6000
8000
10000
12000
14000
MR HC EI PP MP LP NM PaPN PaPS VdY
Murray Mouth North Lagoon SouthLagoon
Ind
ivid
ua
ls m
-2
Chironomidae
Dec-13
Feb-14
Mar-14
0
500
1000
1500
2000
2500
3000
3500
4000
MR HC EI PP MP LP NM PaPN PaPS VdY
Murray Mouth North Lagoon SouthLagoon
Ind
ivid
ua
ls m
-2
Boccardiella limnicola
Dec-13Feb-14Mar-14
0
500
1000
1500
2000
2500
MR HC EI PP MP LP NM PaPN PaPS VdY
Murray Mouth North Lagoon SouthLagoon
Ind
ivid
ua
ls m
-2
Hydrobia sp. 2
Dec-13
Feb-14
Mar-14
0
10000
20000
30000
40000
50000
60000
70000
80000
90000
100000
MR HC EI PP MP LP NM PaPN PaPS VdY
Murray Mouth North Lagoon SouthLagoon
Ind
ivid
ua
ls m
-2
Ostracoda
Dec-13Feb-14Mar-14
0
500
1000
1500
2000
2500
3000
MR HC EI PP MP LP NM PaPN PaPS VdY
Murray Mouth North Lagoon SouthLagoon
Ind
ivid
ua
ls m
-2
Ephydridae
Dec-13Feb-14Mar-14
0
50
100
150
200
250
300
350
MR HC EI PP MP LP NM PaPN PaPS VdY
Murray Mouth North Lagoon SouthLagoon
Ind
ivid
ua
ls m
-2
Nephtys australiensis
Dec-13
Feb-14
Mar-14
0
50
100
150
200
250
300
MR HC EI PP MP LP NM PaPN PaPS VdY
Murray Mouth North Lagoon SouthLagoon
Ind
ivid
ua
ls m
-2
Spisula trigonella
Dec-13Feb-14Mar-14
0
1000
2000
3000
4000
5000
6000
7000
8000
MR HC EI PP MP LP NM PaPN PaPS VdY
Murray Mouth North Lagoon SouthLagoon
Ind
ivid
ua
ls m
-2
Arthritica helmsi
Dec-13Feb-14Mar-14
0
50
100
150
200
250
MR HC EI PP MP LP NM PaPN PaPS VdY
Murray Mouth North Lagoon SouthLagoon
Ind
ivid
ua
ls m
-2
Soletellina alba
Dec-13
Feb-14
Mar-14
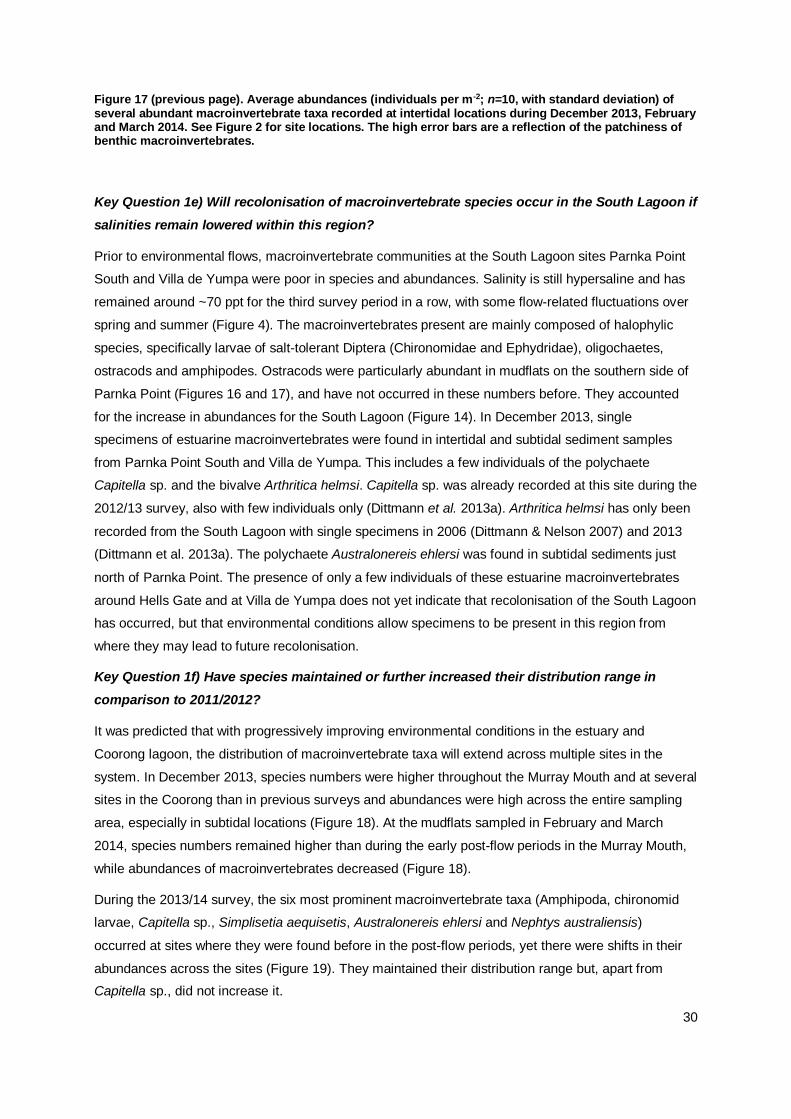
30
Figure 17 (previous page). Average abundances (individuals per m-2; n=10, with standard deviation) of several abundant macroinvertebrate taxa recorded at intertidal locations during December 2013, February and March 2014. See Figure 2 for site locations. The high error bars are a reflection of the patchiness of benthic macroinvertebrates.
Key Question 1e) Will recolonisation of macroinvertebrate species occur in the South Lagoon if
salinities remain lowered within this region?
Prior to environmental flows, macroinvertebrate communities at the South Lagoon sites Parnka Point
South and Villa de Yumpa were poor in species and abundances. Salinity is still hypersaline and has
remained around ~70 ppt for the third survey period in a row, with some flow-related fluctuations over
spring and summer (Figure 4). The macroinvertebrates present are mainly composed of halophylic
species, specifically larvae of salt-tolerant Diptera (Chironomidae and Ephydridae), oligochaetes,
ostracods and amphipodes. Ostracods were particularly abundant in mudflats on the southern side of
Parnka Point (Figures 16 and 17), and have not occurred in these numbers before. They accounted
for the increase in abundances for the South Lagoon (Figure 14). In December 2013, single
specimens of estuarine macroinvertebrates were found in intertidal and subtidal sediment samples
from Parnka Point South and Villa de Yumpa. This includes a few individuals of the polychaete
Capitella sp. and the bivalve Arthritica helmsi. Capitella sp. was already recorded at this site during the
2012/13 survey, also with few individuals only (Dittmann et al. 2013a). Arthritica helmsi has only been
recorded from the South Lagoon with single specimens in 2006 (Dittmann & Nelson 2007) and 2013
(Dittmann et al. 2013a). The polychaete Australonereis ehlersi was found in subtidal sediments just
north of Parnka Point. The presence of only a few individuals of these estuarine macroinvertebrates
around Hells Gate and at Villa de Yumpa does not yet indicate that recolonisation of the South Lagoon
has occurred, but that environmental conditions allow specimens to be present in this region from
where they may lead to future recolonisation.
Key Question 1f) Have species maintained or further increased their distribution range in
comparison to 2011/2012?
It was predicted that with progressively improving environmental conditions in the estuary and
Coorong lagoon, the distribution of macroinvertebrate taxa will extend across multiple sites in the
system. In December 2013, species numbers were higher throughout the Murray Mouth and at several
sites in the Coorong than in previous surveys and abundances were high across the entire sampling
area, especially in subtidal locations (Figure 18). At the mudflats sampled in February and March
2014, species numbers remained higher than during the early post-flow periods in the Murray Mouth,
while abundances of macroinvertebrates decreased (Figure 18).
During the 2013/14 survey, the six most prominent macroinvertebrate taxa (Amphipoda, chironomid
larvae, Capitella sp., Simplisetia aequisetis, Australonereis ehlersi and Nephtys australiensis)
occurred at sites where they were found before in the post-flow periods, yet there were shifts in their
abundances across the sites (Figure 19). They maintained their distribution range but, apart from
Capitella sp., did not increase it.
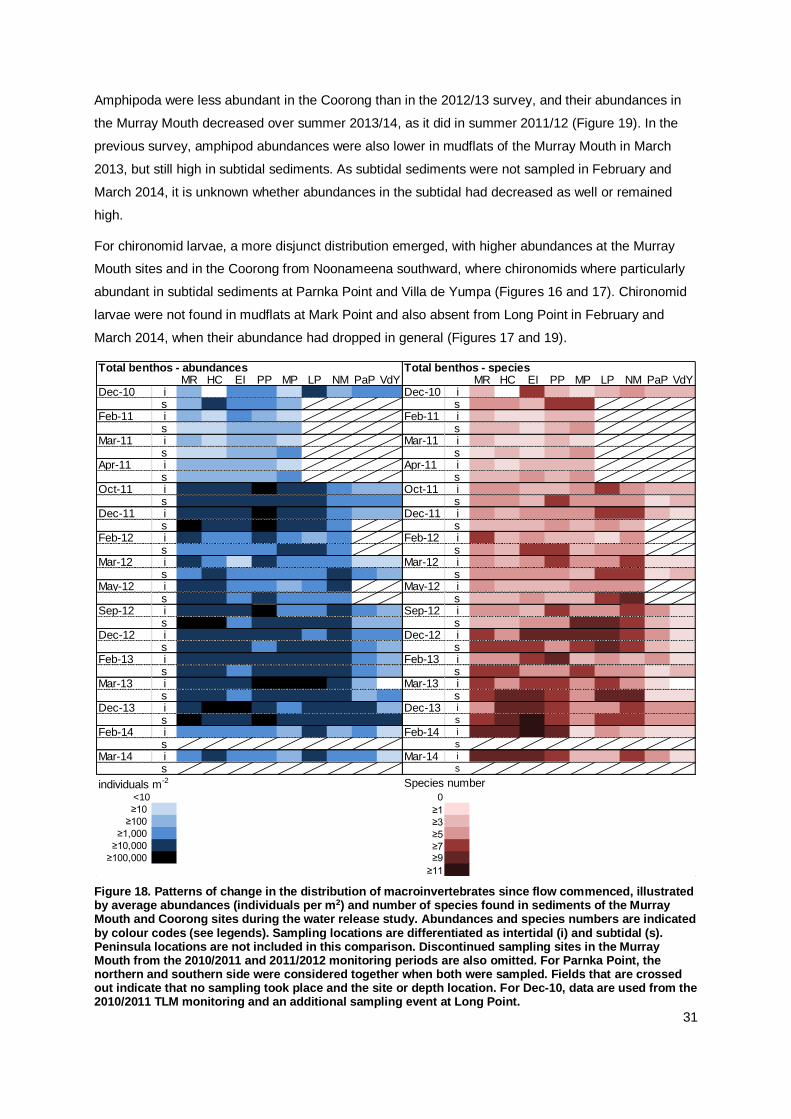
31
Amphipoda were less abundant in the Coorong than in the 2012/13 survey, and their abundances in
the Murray Mouth decreased over summer 2013/14, as it did in summer 2011/12 (Figure 19). In the
previous survey, amphipod abundances were also lower in mudflats of the Murray Mouth in March
2013, but still high in subtidal sediments. As subtidal sediments were not sampled in February and
March 2014, it is unknown whether abundances in the subtidal had decreased as well or remained
high.
For chironomid larvae, a more disjunct distribution emerged, with higher abundances at the Murray
Mouth sites and in the Coorong from Noonameena southward, where chironomids where particularly
abundant in subtidal sediments at Parnka Point and Villa de Yumpa (Figures 16 and 17). Chironomid
larvae were not found in mudflats at Mark Point and also absent from Long Point in February and
March 2014, when their abundance had dropped in general (Figures 17 and 19).
Figure 18. Patterns of change in the distribution of macroinvertebrates since flow commenced, illustrated by average abundances (individuals per m2) and number of species found in sediments of the Murray Mouth and Coorong sites during the water release study. Abundances and species numbers are indicated by colour codes (see legends). Sampling locations are differentiated as intertidal (i) and subtidal (s). Peninsula locations are not included in this comparison. Discontinued sampling sites in the Murray Mouth from the 2010/2011 and 2011/2012 monitoring periods are also omitted. For Parnka Point, the northern and southern side were considered together when both were sampled. Fields that are crossed out indicate that no sampling took place and the site or depth location. For Dec-10, data are used from the 2010/2011 TLM monitoring and an additional sampling event at Long Point.
Total benthos - abundances Total benthos - speciesMR HC EI PP MP LP NM PaP VdY MR HC EI PP MP LP NM PaP VdY
Dec-10 i Dec-10 is s
Feb-11 i Feb-11 is s
Mar-11 i Mar-11 is s
Apr-11 i Apr-11 is s
Oct-11 i Oct-11 is s
Dec-11 i Dec-11 is s
Feb-12 i Feb-12 is s
Mar-12 i Mar-12 is s
May-12 i May-12 is s
Sep-12 i Sep-12 is s
Dec-12 i Dec-12 is s
Feb-13 i Feb-13 is s
Mar-13 i 0 Mar-13 is s
Dec-13 i Dec-13 i
s s
Feb-14 i Feb-14 i
s s
Mar-14 i Mar-14 i
s s
individuals m-2 Species number
<10 0
≥10 ≥1≥100 ≥3
≥1,000 ≥5≥10,000 ≥7
≥100,000 ≥9
≥11
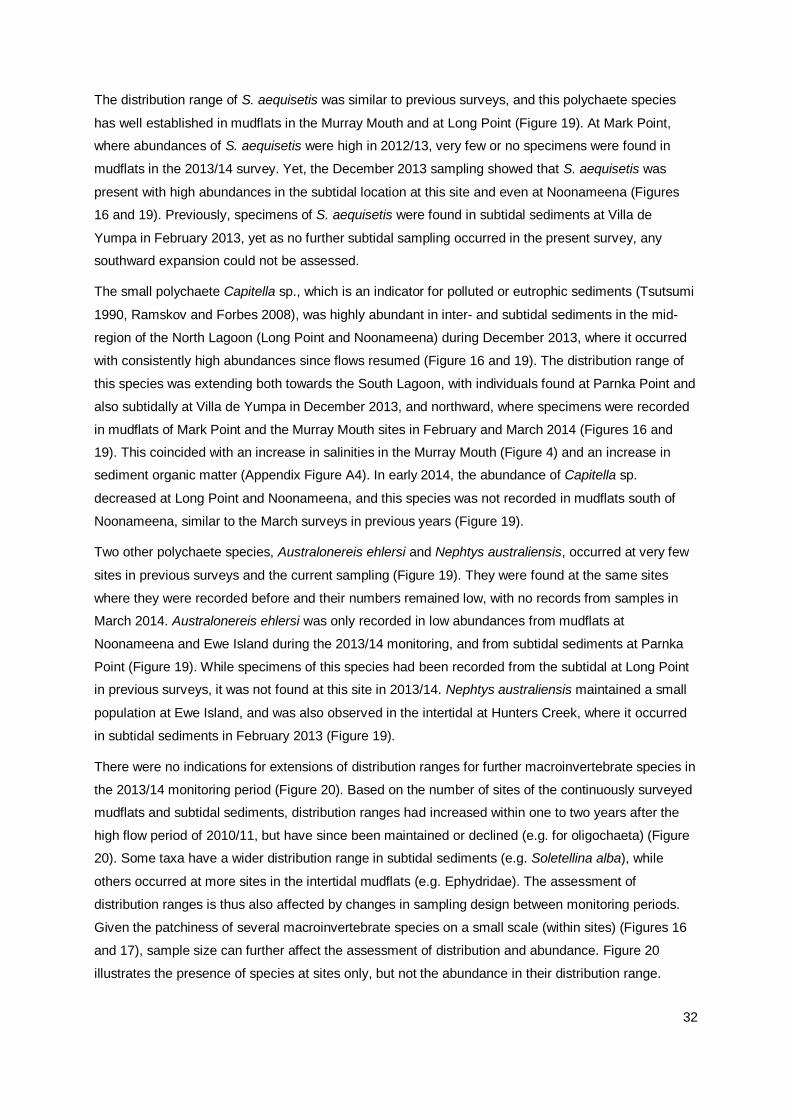
32
The distribution range of S. aequisetis was similar to previous surveys, and this polychaete species
has well established in mudflats in the Murray Mouth and at Long Point (Figure 19). At Mark Point,
where abundances of S. aequisetis were high in 2012/13, very few or no specimens were found in
mudflats in the 2013/14 survey. Yet, the December 2013 sampling showed that S. aequisetis was
present with high abundances in the subtidal location at this site and even at Noonameena (Figures
16 and 19). Previously, specimens of S. aequisetis were found in subtidal sediments at Villa de
Yumpa in February 2013, yet as no further subtidal sampling occurred in the present survey, any
southward expansion could not be assessed.
The small polychaete Capitella sp., which is an indicator for polluted or eutrophic sediments (Tsutsumi
1990, Ramskov and Forbes 2008), was highly abundant in inter- and subtidal sediments in the mid-
region of the North Lagoon (Long Point and Noonameena) during December 2013, where it occurred
with consistently high abundances since flows resumed (Figure 16 and 19). The distribution range of
this species was extending both towards the South Lagoon, with individuals found at Parnka Point and
also subtidally at Villa de Yumpa in December 2013, and northward, where specimens were recorded
in mudflats of Mark Point and the Murray Mouth sites in February and March 2014 (Figures 16 and
19). This coincided with an increase in salinities in the Murray Mouth (Figure 4) and an increase in
sediment organic matter (Appendix Figure A4). In early 2014, the abundance of Capitella sp.
decreased at Long Point and Noonameena, and this species was not recorded in mudflats south of
Noonameena, similar to the March surveys in previous years (Figure 19).
Two other polychaete species, Australonereis ehlersi and Nephtys australiensis, occurred at very few
sites in previous surveys and the current sampling (Figure 19). They were found at the same sites
where they were recorded before and their numbers remained low, with no records from samples in
March 2014. Australonereis ehlersi was only recorded in low abundances from mudflats at
Noonameena and Ewe Island during the 2013/14 monitoring, and from subtidal sediments at Parnka
Point (Figure 19). While specimens of this species had been recorded from the subtidal at Long Point
in previous surveys, it was not found at this site in 2013/14. Nephtys australiensis maintained a small
population at Ewe Island, and was also observed in the intertidal at Hunters Creek, where it occurred
in subtidal sediments in February 2013 (Figure 19).
There were no indications for extensions of distribution ranges for further macroinvertebrate species in
the 2013/14 monitoring period (Figure 20). Based on the number of sites of the continuously surveyed
mudflats and subtidal sediments, distribution ranges had increased within one to two years after the
high flow period of 2010/11, but have since been maintained or declined (e.g. for oligochaeta) (Figure
20). Some taxa have a wider distribution range in subtidal sediments (e.g. Soletellina alba), while
others occurred at more sites in the intertidal mudflats (e.g. Ephydridae). The assessment of
distribution ranges is thus also affected by changes in sampling design between monitoring periods.
Given the patchiness of several macroinvertebrate species on a small scale (within sites) (Figures 16
and 17), sample size can further affect the assessment of distribution and abundance. Figure 20
illustrates the presence of species at sites only, but not the abundance in their distribution range.
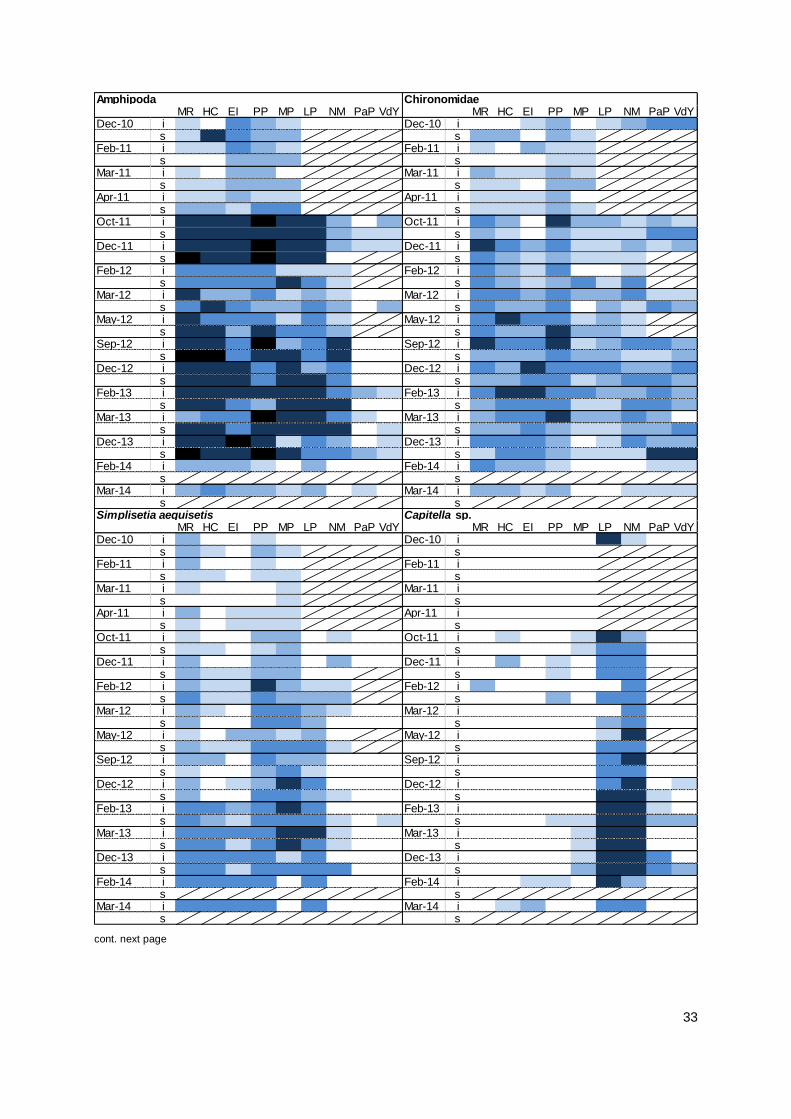
33
cont. next page
Amphipoda ChironomidaeMR HC EI PP MP LP NM PaP VdY MR HC EI PP MP LP NM PaP VdY
Dec-10 i Dec-10 is s
Feb-11 i Feb-11 is s
Mar-11 i Mar-11 is s
Apr-11 i Apr-11 is s
Oct-11 i Oct-11 is s
Dec-11 i Dec-11 is s
Feb-12 i Feb-12 is s
Mar-12 i Mar-12 is s
May-12 i May-12 is s
Sep-12 i Sep-12 is s
Dec-12 i Dec-12 is s
Feb-13 i Feb-13 is s
Mar-13 i Mar-13 is s
Dec-13 i Dec-13 is s
Feb-14 i Feb-14 is s
Mar-14 i Mar-14 is s
Simplisetia aequisetis Capitella sp.MR HC EI PP MP LP NM PaP VdY MR HC EI PP MP LP NM PaP VdY
Dec-10 i Dec-10 is s
Feb-11 i Feb-11 is s
Mar-11 i Mar-11 is s
Apr-11 i Apr-11 is s
Oct-11 i Oct-11 is s
Dec-11 i Dec-11 is s
Feb-12 i Feb-12 is s
Mar-12 i Mar-12 is s
May-12 i May-12 is s
Sep-12 i Sep-12 is s
Dec-12 i Dec-12 is s
Feb-13 i Feb-13 is s
Mar-13 i Mar-13 is s
Dec-13 i Dec-13 is s
Feb-14 i Feb-14 is s
Mar-14 i Mar-14 is s
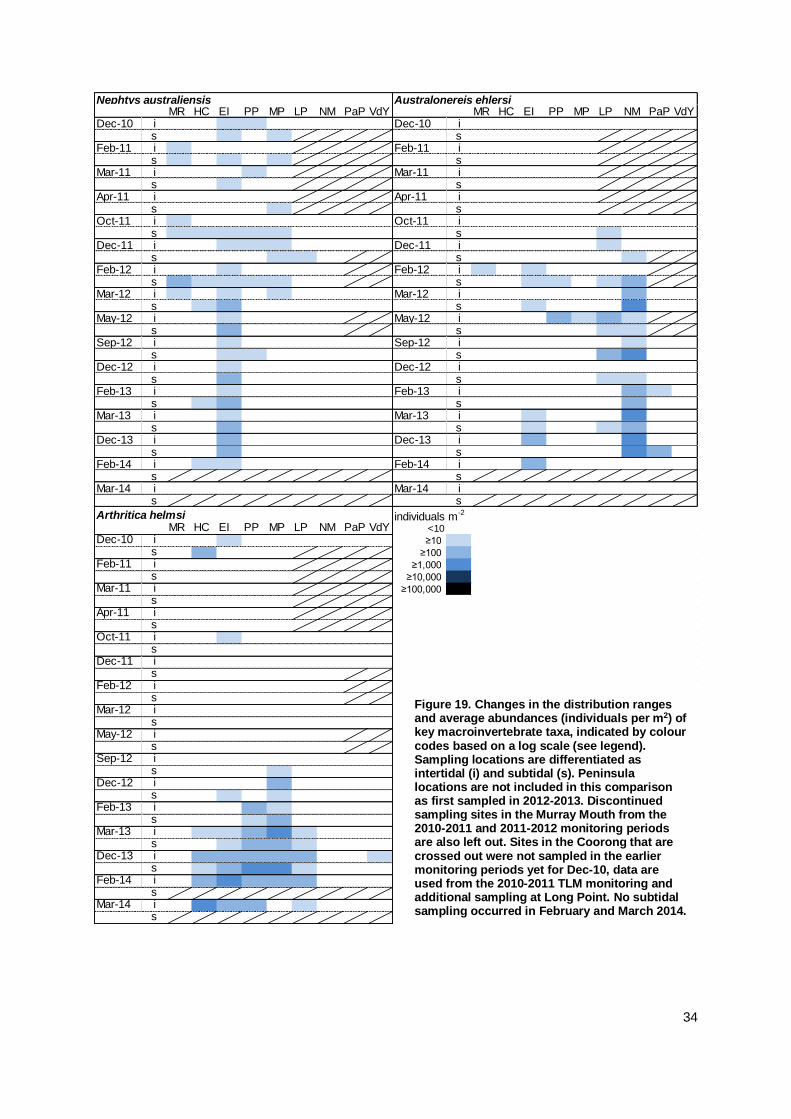
34
Nephtys australiensis Australonereis ehlersiMR HC EI PP MP LP NM PaP VdY MR HC EI PP MP LP NM PaP VdY
Dec-10 i Dec-10 is s
Feb-11 i Feb-11 is s
Mar-11 i Mar-11 is s
Apr-11 i Apr-11 is s
Oct-11 i Oct-11 is s
Dec-11 i Dec-11 is s
Feb-12 i Feb-12 is s
Mar-12 i Mar-12 is s
May-12 i May-12 is s
Sep-12 i Sep-12 is s
Dec-12 i Dec-12 is s
Feb-13 i Feb-13 is s
Mar-13 i Mar-13 is s
Dec-13 i Dec-13 is s
Feb-14 i Feb-14 is s
Mar-14 i Mar-14 is s
Arthritica helmsi individuals m-2
MR HC EI PP MP LP NM PaP VdY <10Dec-10 i ≥10
s ≥100Feb-11 i ≥1,000
s ≥10,000Mar-11 i ≥100,000
sApr-11 i
sOct-11 i
sDec-11 i
sFeb-12 i
sMar-12 i
sMay-12 i
sSep-12 i
sDec-12 i
sFeb-13 i
sMar-13 i
sDec-13 i
sFeb-14 i
sMar-14 i
s
Figure 19. Changes in the distribution ranges and average abundances (individuals per m2) of key macroinvertebrate taxa, indicated by colour codes based on a log scale (see legend). Sampling locations are differentiated as intertidal (i) and subtidal (s). Peninsula locations are not included in this comparison as first sampled in 2012-2013. Discontinued sampling sites in the Murray Mouth from the 2010-2011 and 2011-2012 monitoring periods are also left out. Sites in the Coorong that are crossed out were not sampled in the earlier monitoring periods yet for Dec-10, data are used from the 2010-2011 TLM monitoring and additional sampling at Long Point. No subtidal sampling occurred in February and March 2014.
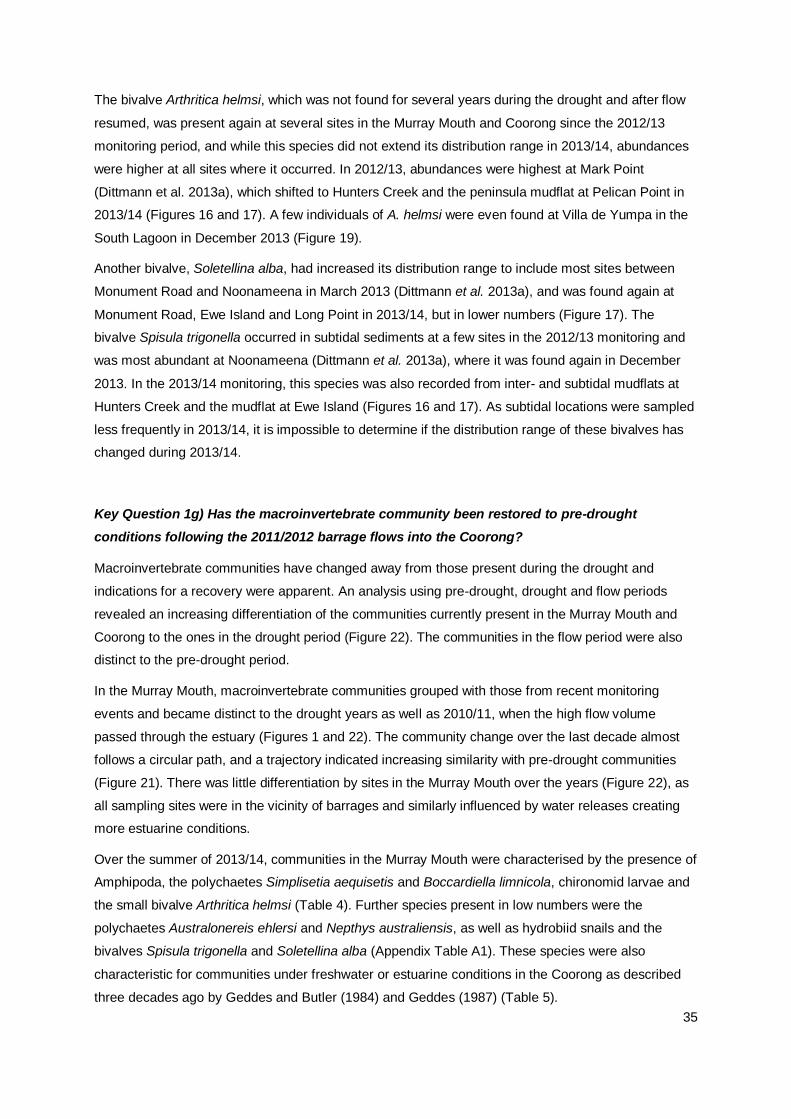
35
The bivalve Arthritica helmsi, which was not found for several years during the drought and after flow
resumed, was present again at several sites in the Murray Mouth and Coorong since the 2012/13
monitoring period, and while this species did not extend its distribution range in 2013/14, abundances
were higher at all sites where it occurred. In 2012/13, abundances were highest at Mark Point
(Dittmann et al. 2013a), which shifted to Hunters Creek and the peninsula mudflat at Pelican Point in
2013/14 (Figures 16 and 17). A few individuals of A. helmsi were even found at Villa de Yumpa in the
South Lagoon in December 2013 (Figure 19).
Another bivalve, Soletellina alba, had increased its distribution range to include most sites between
Monument Road and Noonameena in March 2013 (Dittmann et al. 2013a), and was found again at
Monument Road, Ewe Island and Long Point in 2013/14, but in lower numbers (Figure 17). The
bivalve Spisula trigonella occurred in subtidal sediments at a few sites in the 2012/13 monitoring and
was most abundant at Noonameena (Dittmann et al. 2013a), where it was found again in December
2013. In the 2013/14 monitoring, this species was also recorded from inter- and subtidal mudflats at
Hunters Creek and the mudflat at Ewe Island (Figures 16 and 17). As subtidal locations were sampled
less frequently in 2013/14, it is impossible to determine if the distribution range of these bivalves has
changed during 2013/14.
Key Question 1g) Has the macroinvertebrate community been restored to pre-drought
conditions following the 2011/2012 barrage flows into the Coorong?
Macroinvertebrate communities have changed away from those present during the drought and
indications for a recovery were apparent. An analysis using pre-drought, drought and flow periods
revealed an increasing differentiation of the communities currently present in the Murray Mouth and
Coorong to the ones in the drought period (Figure 22). The communities in the flow period were also
distinct to the pre-drought period.
In the Murray Mouth, macroinvertebrate communities grouped with those from recent monitoring
events and became distinct to the drought years as well as 2010/11, when the high flow volume
passed through the estuary (Figures 1 and 22). The community change over the last decade almost
follows a circular path, and a trajectory indicated increasing similarity with pre-drought communities
(Figure 21). There was little differentiation by sites in the Murray Mouth over the years (Figure 22), as
all sampling sites were in the vicinity of barrages and similarly influenced by water releases creating
more estuarine conditions.
Over the summer of 2013/14, communities in the Murray Mouth were characterised by the presence of
Amphipoda, the polychaetes Simplisetia aequisetis and Boccardiella limnicola, chironomid larvae and
the small bivalve Arthritica helmsi (Table 4). Further species present in low numbers were the
polychaetes Australonereis ehlersi and Nepthys australiensis, as well as hydrobiid snails and the
bivalves Spisula trigonella and Soletellina alba (Appendix Table A1). These species were also
characteristic for communities under freshwater or estuarine conditions in the Coorong as described
three decades ago by Geddes and Butler (1984) and Geddes (1987) (Table 5).
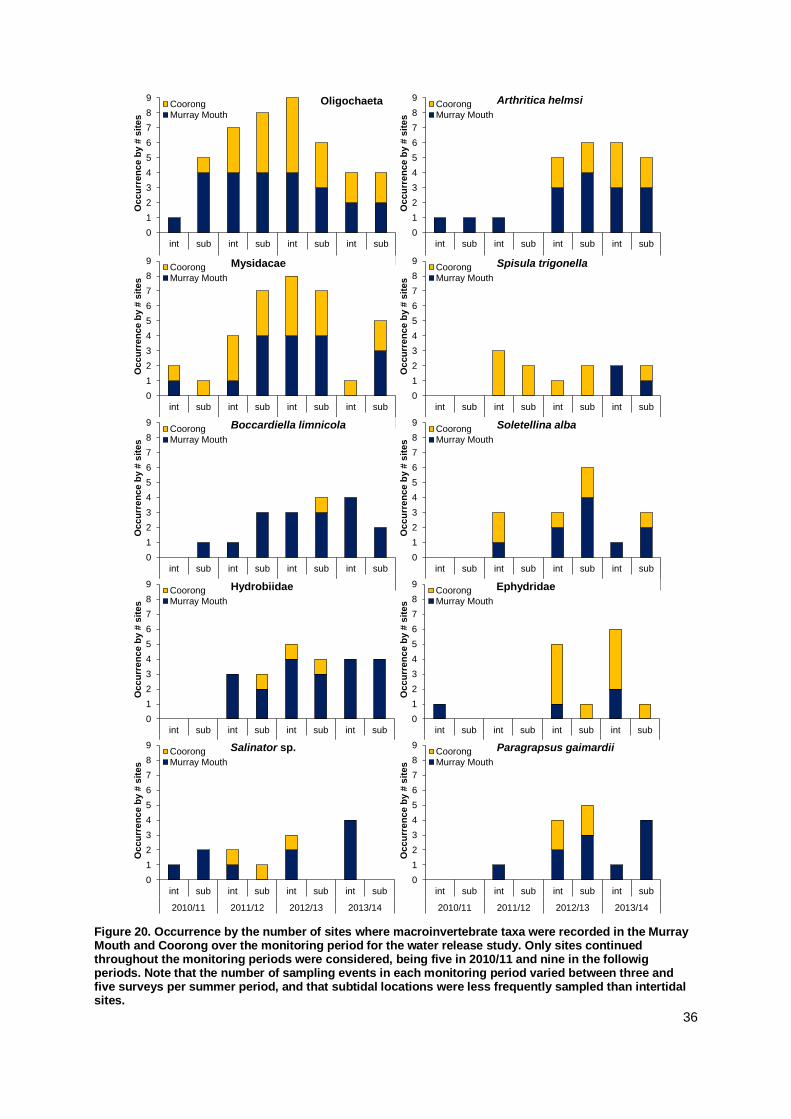
36
Figure 20. Occurrence by the number of sites where macroinvertebrate taxa were recorded in the Murray Mouth and Coorong over the monitoring period for the water release study. Only sites continued throughout the monitoring periods were considered, being five in 2010/11 and nine in the followig periods. Note that the number of sampling events in each monitoring period varied between three and five surveys per summer period, and that subtidal locations were less frequently sampled than intertidal sites.
0
1
2
3
4
5
6
7
8
9
int sub int sub int sub int sub
2010/11 2011/12 2012/13 2013/14
Oc
cu
rre
nc
e b
y #
sit
es
OligochaetaCoorongMurray Mouth
0
1
2
3
4
5
6
7
8
9
int sub int sub int sub int sub
2010/11 2011/12 2012/13 2013/14
Oc
cu
rre
nc
e b
y #
sit
es
Arthritica helmsiCoorongMurray Mouth
0
1
2
3
4
5
6
7
8
9
int sub int sub int sub int sub
2010/11 2011/12 2012/13 2013/14
Oc
cu
rre
nc
e b
y #
sit
es
MysidacaeCoorongMurray Mouth
0
1
2
3
4
5
6
7
8
9
int sub int sub int sub int sub
2010/11 2011/12 2012/13 2013/14
Oc
cu
rre
nc
e b
y #
sit
es
Spisula trigonellaCoorongMurray Mouth
0
1
2
3
4
5
6
7
8
9
int sub int sub int sub int sub
2010/11 2011/12 2012/13 2013/14
Oc
cu
rre
nc
e b
y #
sit
es
Boccardiella limnicolaCoorongMurray Mouth
0
1
2
3
4
5
6
7
8
9
int sub int sub int sub int sub
2010/11 2011/12 2012/13 2013/14
Oc
cu
rre
nc
e b
y #
sit
es
Soletellina albaCoorongMurray Mouth
0
1
2
3
4
5
6
7
8
9
int sub int sub int sub int sub
2010/11 2011/12 2012/13 2013/14
Oc
cu
rre
nc
e b
y #
sit
es
HydrobiidaeCoorongMurray Mouth
0
1
2
3
4
5
6
7
8
9
int sub int sub int sub int sub
2010/11 2011/12 2012/13 2013/14
Oc
cu
rre
nc
e b
y #
sit
es
EphydridaeCoorongMurray Mouth
0
1
2
3
4
5
6
7
8
9
int sub int sub int sub int sub
2010/11 2011/12 2012/13 2013/14
Oc
cu
rre
nc
e b
y #
sit
es
Paragrapsus gaimardiiCoorongMurray Mouth
0
1
2
3
4
5
6
7
8
9
int sub int sub int sub int sub
2010/11 2011/12 2012/13 2013/14
Oc
cu
rre
nc
e b
y #
sit
es
Salinator sp.CoorongMurray Mouth

37
For the Coorong lagoons, differences in macroinvertebrate communities over drought and flow periods
were less clear, with some overlap between communities during the drought and flow (Figure 21). The
northern and southern sections of the North Lagoon had distinct macroinvertebrate communities,
which each changed slightly over time and site specific responses. The macroinvertebrate community
at Long Point, for example, changed little over the last ten years, while at Noonameena, large
differences occurred between drought and flow periods (Figure 22). For the North Lagoon, a trajectory
indicated that macroinvertebrate community was very different from all other years in 2010 when flow
commenced, with only slight indication of a return in the last three years (Figure 21).
Over the summer of 2013/14, communities at sites in the northern part of the North Lagoon (Mark
Point and Long Point) were characterised by the presence of Capitella sp., Simplisetia aequisetis,
Amphipoda, Ephydridae larvae and Arthritica helmsi (Table 4). This community was similar to those
described historically as characteristic of estuarine to hypermarine communities in the Coorong (Table
5).Communities in the southern part of the North Lagoon (Noonameena and Parnka Point North) were
characterised by the presence of larvae of salt tolerant Chironomidae and Ephydridae, and the
polychaete Capitella sp. (Table 4). In addition, Ostracoda were also recorded at Parnka Point North
(Appendix Table A2). This community resembled characteristics of historical hypermarine to
hypersaline conditions (Table 5). Communities in the South Lagoon were characterised by the
presence of Ostracoda and chironomid larvae (Table 4). Larvae of Ephydridae were also recorded in
samples from both South Lagoon sites (Appendix Table A1). This community was characteristic of
historically hypersaline communities (Table 5).
Table 4. SIMPER results showing average similarities (Ave. Sim.) and characteristic taxa that contributed highly (greater than 10%) to average similarity among samples within each region (divided into northern and southern reaches for the North Lagoon based on observed differences in salinities, see Figure 4), for each sampling occasion during the 2013/14 monitoring period. Taxa are listed in decreasing order of contribution to average similarity (percent contribution for each species is given in brackets). Site acronyms are listed in Table 2.
Region SiteAve.
Sim.Characteristic taxa
Ave.
Sim.Characteristic taxa
Ave.
Sim.Characteristic taxa
Amphipoda (44.7) Simplisetia aequisetis (54.5) Simplisetia aequisetis (57.2)
Simplisetia aequisetis (24.0) Arthritica helmsi (13.1) Amphipoda (13.6)
Chironomidae larvae (16.7) Boccardiella limnicola (10.2)
Capitella spp. (24.1) Capitella spp. (43.6) Ephydridae larvae (70.3)
Simplisetia aequisetis (21.7) Simplisetia aequisetis (26.7) Simplisetia aequisetis (15.9)
Amphipoda (20.3) Arthritica helmsi (16.3)
Ephydridae larvae (17.6)
Arthritica helmsi (14.2)
Capitella spp. (53.4) Ephydridae larvae (71.3)
Chironomidae larvae (27.4) Capitella spp. (19.4)
Ostracoda (74.6) Ostracoda (73.4)
Chironomidae larvae (24.6) Chironomidae larvae (25.2)
South
LagoonAll 43.48 23.67 Ostracoda (95.6) 13.48
North
Lagoon
40 25.74 10.06
55.14 13.15 Ephydridae larvae (90.8) 25.59
Southern
NM,
PaPN
Northern
MP, LP
Mar-14
Murray
MouthAll 73.84 45.45 42.24
Dec-13 Feb-14
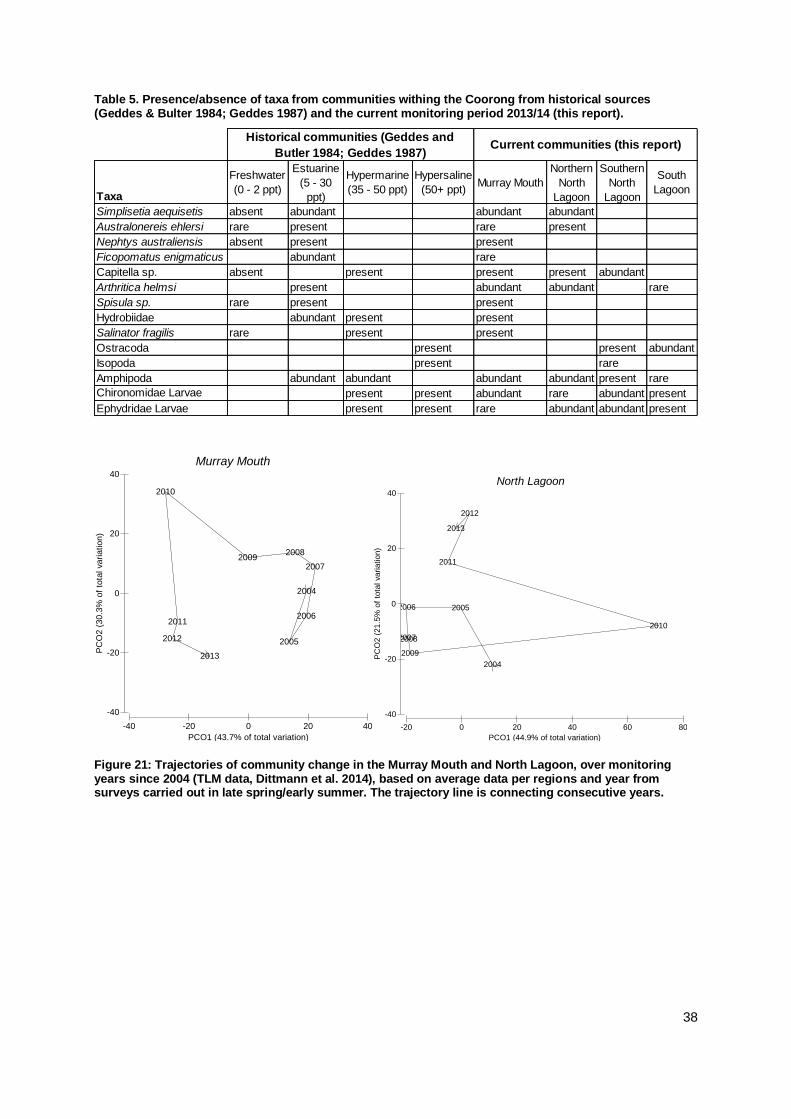
38
Table 5. Presence/absence of taxa from communities withing the Coorong from historical sources (Geddes & Bulter 1984; Geddes 1987) and the current monitoring period 2013/14 (this report).
Figure 21: Trajectories of community change in the Murray Mouth and North Lagoon, over monitoring years since 2004 (TLM data, Dittmann et al. 2014), based on average data per regions and year from surveys carried out in late spring/early summer. The trajectory line is connecting consecutive years.
Taxa
Freshwater
(0 - 2 ppt)
Estuarine
(5 - 30
ppt)
Hypermarine
(35 - 50 ppt)
Hypersaline
(50+ ppt)Murray Mouth
Northern
North
Lagoon
Southern
North
Lagoon
South
Lagoon
Simplisetia aequisetis absent abundant abundant abundant
Australonereis ehlersi rare present rare present
Nephtys australiensis absent present present
Ficopomatus enigmaticus abundant rare
Capitella sp. absent present present present abundant
Arthritica helmsi present abundant abundant rare
Spisula sp. rare present present
Hydrobiidae abundant present present
Salinator fragilis rare present present
Ostracoda present present abundant
Isopoda present rare
Amphipoda abundant abundant abundant abundant present rare
Chironomidae Larvae present present abundant rare abundant present
Ephydridae Larvae present present rare abundant abundant present
Historical communities (Geddes and
Butler 1984; Geddes 1987)Current communities (this report)
Murray Mouth
-40 -20 0 20 40
PCO1 (43.7% of total variation)
-40
-20
0
20
40
PC
O2 (
30.3
% o
f to
tal variation)
2010
2011
2012
2013
2004
2005
2006
2007
20082009
North Lagoon
-20 0 20 40 60 80
PCO1 (44.9% of total variation)
-40
-20
0
20
40
PC
O2 (
21.5
% o
f to
tal variation)
2010
2011
2012
2013
2004
20052006
20072008
2009
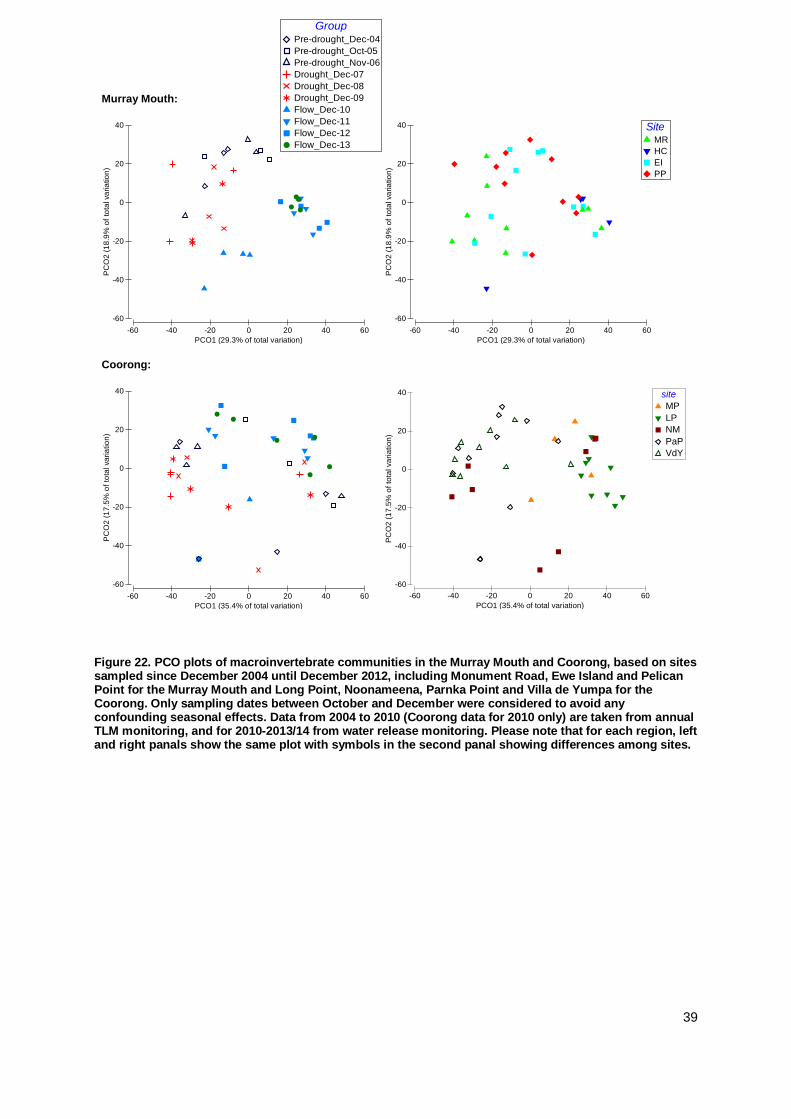
39
Figure 22. PCO plots of macroinvertebrate communities in the Murray Mouth and Coorong, based on sites sampled since December 2004 until December 2012, including Monument Road, Ewe Island and Pelican Point for the Murray Mouth and Long Point, Noonameena, Parnka Point and Villa de Yumpa for the Coorong. Only sampling dates between October and December were considered to avoid any confounding seasonal effects. Data from 2004 to 2010 (Coorong data for 2010 only) are taken from annual TLM monitoring, and for 2010-2013/14 from water release monitoring. Please note that for each region, left and right panals show the same plot with symbols in the second panal showing differences among sites.
Murray Mouth:
Coorong:
-60 -40 -20 0 20 40 60
PCO1 (29.3% of total variation)
-60
-40
-20
0
20
40
PC
O2
(1
8.9
% o
f to
tal va
ria
tio
n)
-60 -40 -20 0 20 40 60
PCO1 (29.3% of total variation)
-60
-40
-20
0
20
40
PC
O2
(1
8.9
% o
f to
tal va
ria
tio
n)
-60 -40 -20 0 20 40 60
PCO1 (35.4% of total variation)
-60
-40
-20
0
20
40
PC
O2
(1
7.5
% o
f to
tal va
ria
tio
n)
-60 -40 -20 0 20 40 60
PCO1 (35.4% of total variation)
-60
-40
-20
0
20
40P
CO
2 (
17
.5%
of
tota
l va
ria
tio
n)
site
MP
LP
NM
PaP
VdY
-60 -40 -20 0 20 40 60
PCO1 (29.3% of total variation)
-60
-40
-20
0
20
40
PC
O2
(1
8.9
% o
f to
tal va
ria
tio
n)
SiteMR
HC
EI
PP-60 -40 -20 0 20 40 60
PCO1 (29.3% of total variation)
-60
-40
-20
0
20
40
PC
O2
(1
8.9
% o
f to
tal va
ria
tio
n)
GroupPre-drought_Dec-04
Pre-drought_Oct-05
Pre-drought_Nov-06
Drought_Dec-07
Drought_Dec-08
Drought_Dec-09
Flow_Dec-10
Flow_Dec-11
Flow_Dec-12
Flow_Dec-13
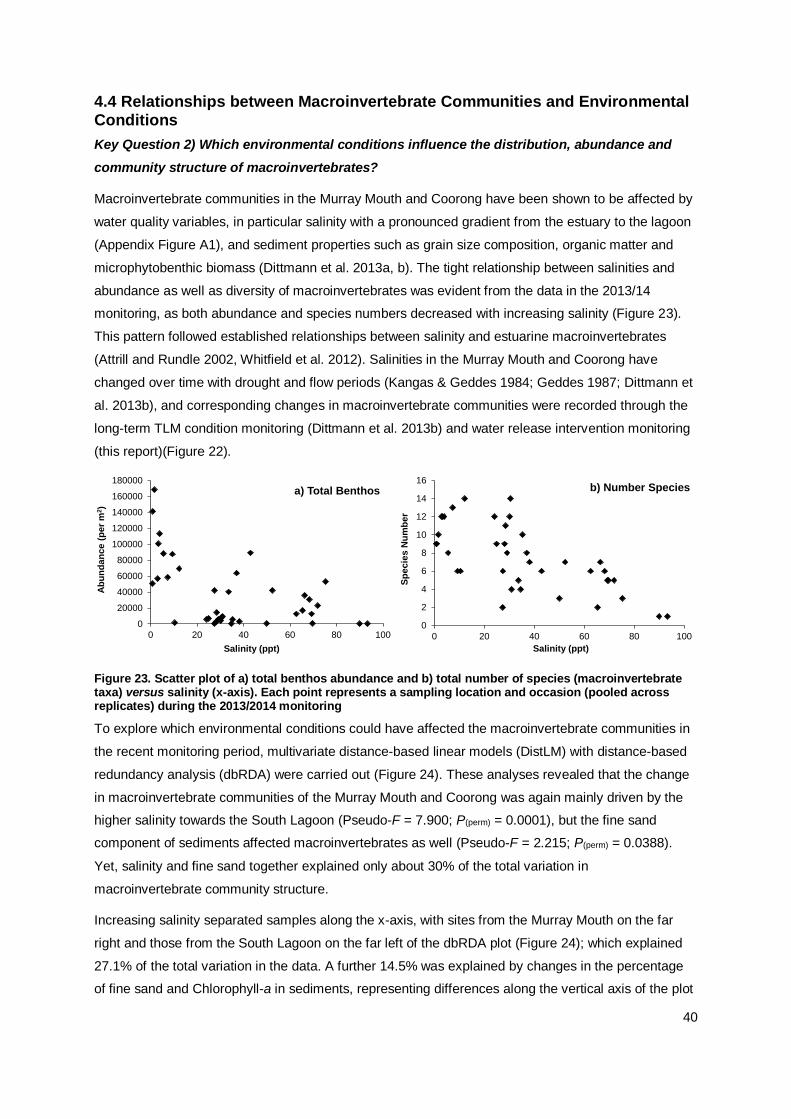
40
4.4 Relationships between Macroinvertebrate Communities and Environmental Conditions
Key Question 2) Which environmental conditions influence the distribution, abundance and
community structure of macroinvertebrates?
Macroinvertebrate communities in the Murray Mouth and Coorong have been shown to be affected by
water quality variables, in particular salinity with a pronounced gradient from the estuary to the lagoon
(Appendix Figure A1), and sediment properties such as grain size composition, organic matter and
microphytobenthic biomass (Dittmann et al. 2013a, b). The tight relationship between salinities and
abundance as well as diversity of macroinvertebrates was evident from the data in the 2013/14
monitoring, as both abundance and species numbers decreased with increasing salinity (Figure 23).
This pattern followed established relationships between salinity and estuarine macroinvertebrates
(Attrill and Rundle 2002, Whitfield et al. 2012). Salinities in the Murray Mouth and Coorong have
changed over time with drought and flow periods (Kangas & Geddes 1984; Geddes 1987; Dittmann et
al. 2013b), and corresponding changes in macroinvertebrate communities were recorded through the
long-term TLM condition monitoring (Dittmann et al. 2013b) and water release intervention monitoring
(this report)(Figure 22).
Figure 23. Scatter plot of a) total benthos abundance and b) total number of species (macroinvertebrate taxa) versus salinity (x-axis). Each point represents a sampling location and occasion (pooled across replicates) during the 2013/2014 monitoring
To explore which environmental conditions could have affected the macroinvertebrate communities in
the recent monitoring period, multivariate distance-based linear models (DistLM) with distance-based
redundancy analysis (dbRDA) were carried out (Figure 24). These analyses revealed that the change
in macroinvertebrate communities of the Murray Mouth and Coorong was again mainly driven by the
higher salinity towards the South Lagoon (Pseudo-F = 7.900; P(perm) = 0.0001), but the fine sand
component of sediments affected macroinvertebrates as well (Pseudo-F = 2.215; P(perm) = 0.0388).
Yet, salinity and fine sand together explained only about 30% of the total variation in
macroinvertebrate community structure.
Increasing salinity separated samples along the x-axis, with sites from the Murray Mouth on the far
right and those from the South Lagoon on the far left of the dbRDA plot (Figure 24); which explained
27.1% of the total variation in the data. A further 14.5% was explained by changes in the percentage
of fine sand and Chlorophyll-a in sediments, representing differences along the vertical axis of the plot
0
20000
40000
60000
80000
100000
120000
140000
160000
180000
0 20 40 60 80 100
Ab
un
da
nc
e (
per
m2)
Salinity (ppt)
a) Total Benthos
0
2
4
6
8
10
12
14
16
0 20 40 60 80 100
Sp
ec
ies
Nu
mb
er
Salinity (ppt)
b) Number Species
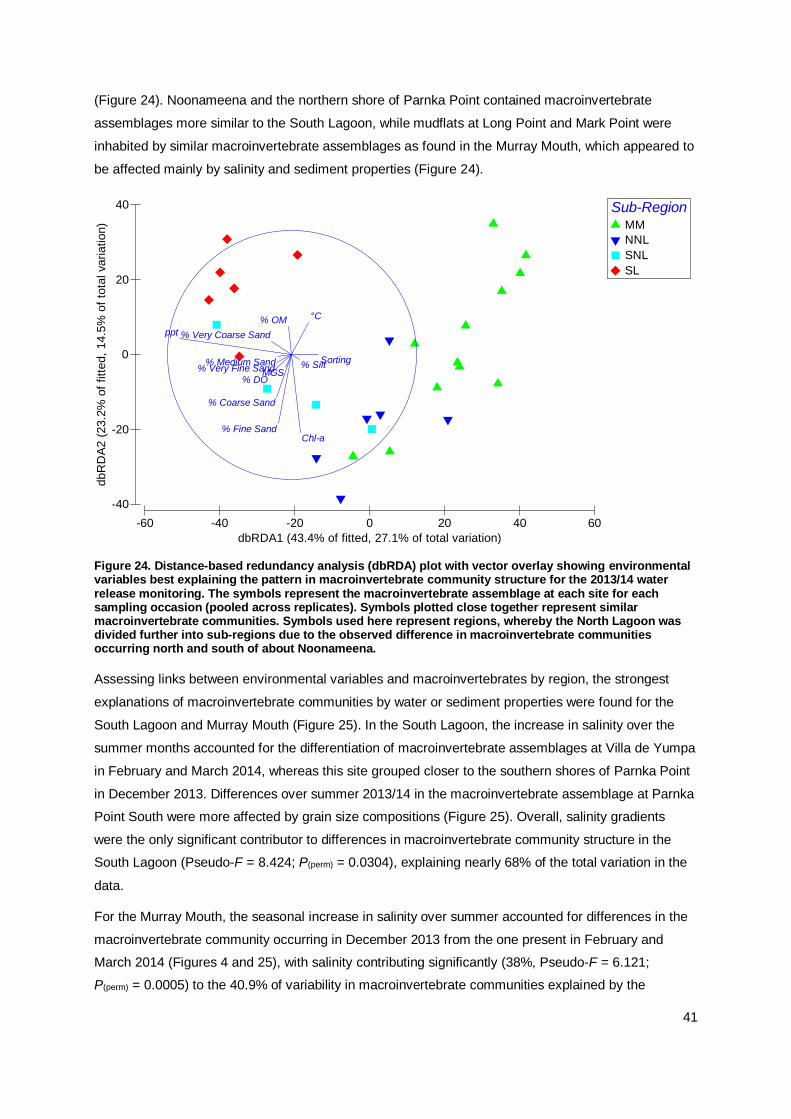
41
(Figure 24). Noonameena and the northern shore of Parnka Point contained macroinvertebrate
assemblages more similar to the South Lagoon, while mudflats at Long Point and Mark Point were
inhabited by similar macroinvertebrate assemblages as found in the Murray Mouth, which appeared to
be affected mainly by salinity and sediment properties (Figure 24).
Figure 24. Distance-based redundancy analysis (dbRDA) plot with vector overlay showing environmental variables best explaining the pattern in macroinvertebrate community structure for the 2013/14 water release monitoring. The symbols represent the macroinvertebrate assemblage at each site for each sampling occasion (pooled across replicates). Symbols plotted close together represent similar macroinvertebrate communities. Symbols used here represent regions, whereby the North Lagoon was divided further into sub-regions due to the observed difference in macroinvertebrate communities occurring north and south of about Noonameena.
Assessing links between environmental variables and macroinvertebrates by region, the strongest
explanations of macroinvertebrate communities by water or sediment properties were found for the
South Lagoon and Murray Mouth (Figure 25). In the South Lagoon, the increase in salinity over the
summer months accounted for the differentiation of macroinvertebrate assemblages at Villa de Yumpa
in February and March 2014, whereas this site grouped closer to the southern shores of Parnka Point
in December 2013. Differences over summer 2013/14 in the macroinvertebrate assemblage at Parnka
Point South were more affected by grain size compositions (Figure 25). Overall, salinity gradients
were the only significant contributor to differences in macroinvertebrate community structure in the
South Lagoon (Pseudo-F = 8.424; P(perm) = 0.0304), explaining nearly 68% of the total variation in the
data.
For the Murray Mouth, the seasonal increase in salinity over summer accounted for differences in the
macroinvertebrate community occurring in December 2013 from the one present in February and
March 2014 (Figures 4 and 25), with salinity contributing significantly (38%, Pseudo-F = 6.121;
P(perm) = 0.0005) to the 40.9% of variability in macroinvertebrate communities explained by the
-60 -40 -20 0 20 40 60
dbRDA1 (43.4% of fitted, 27.1% of total variation)
-40
-20
0
20
40
dbR
DA
2 (
23.2
% o
f fitt
ed,
14.5
% o
f to
tal variation)
Sub-RegionMM
NNL
SNL
SL
ppt
% Fine SandChl-a
% Very Coarse Sand
% DO
°C
% Silt
% Coarse Sand
MGS
Sorting
% OM
% Very Fine Sand% Medium Sand
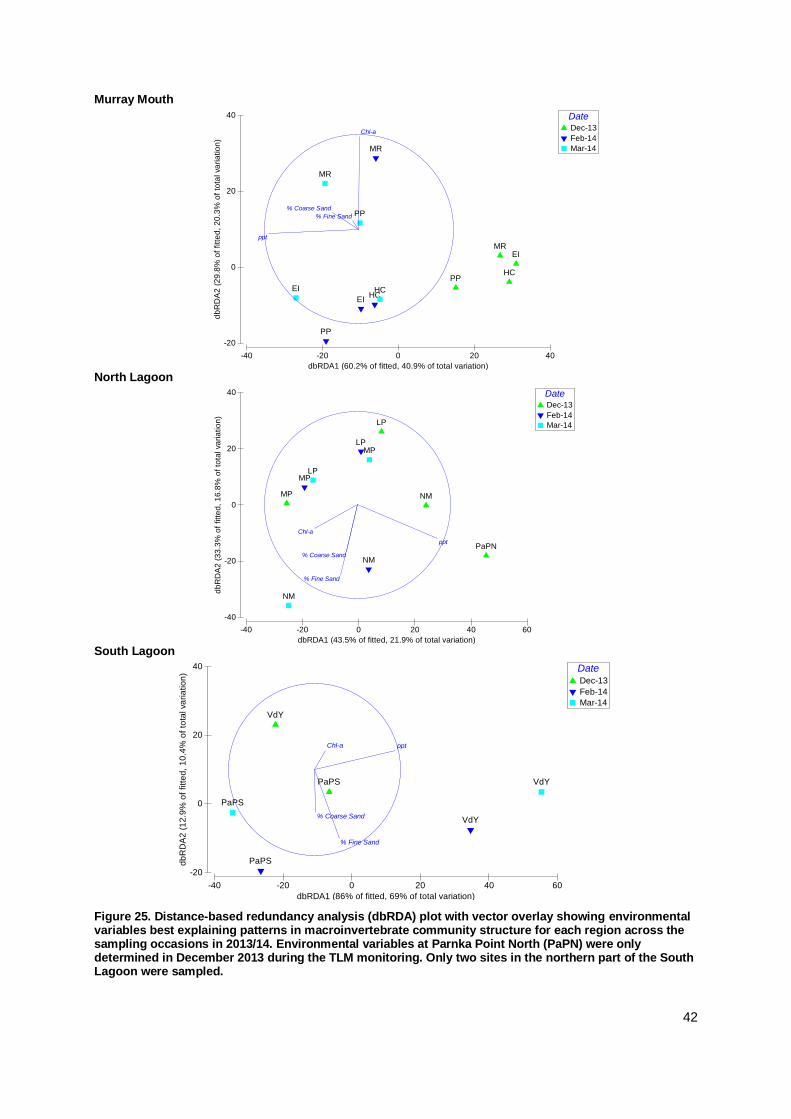
42
Murray Mouth
North Lagoon
South Lagoon
Figure 25. Distance-based redundancy analysis (dbRDA) plot with vector overlay showing environmental variables best explaining patterns in macroinvertebrate community structure for each region across the sampling occasions in 2013/14. Environmental variables at Parnka Point North (PaPN) were only determined in December 2013 during the TLM monitoring. Only two sites in the northern part of the South Lagoon were sampled.
-40 -20 0 20 40
dbRDA1 (60.2% of fitted, 40.9% of total variation)
-20
0
20
40
db
RD
A2
(2
9.8
% o
f fitt
ed
, 2
0.3
% o
f to
tal va
ria
tio
n)
DateDec-13
Feb-14
Mar-14
MR
HC
EI
PP
MR
HCEI
PP
MR
HCEI
PP
ppt
Chl-a
% Coarse Sand
% Fine Sand
-40 -20 0 20 40 60
dbRDA1 (43.5% of fitted, 21.9% of total variation)
-40
-20
0
20
40
db
RD
A2
(3
3.3
% o
f fitt
ed
, 1
6.8
% o
f to
tal va
ria
tio
n)
DateDec-13
Feb-14
Mar-14
MP
LP
NM
PaPN
MP
LP
NM
MP
LP
NM
ppt
% Fine Sand
Chl-a
% Coarse Sand
-40 -20 0 20 40 60
dbRDA1 (86% of fitted, 69% of total variation)
-20
0
20
40
db
RD
A2
(1
2.9
% o
f fitt
ed
, 1
0.4
% o
f to
tal va
ria
tio
n)
DateDec-13
Feb-14
Mar-14
PaPS
VdY
PaPS
VdY
PaPS
VdY
ppt
% Fine Sand
% Coarse Sand
Chl-a
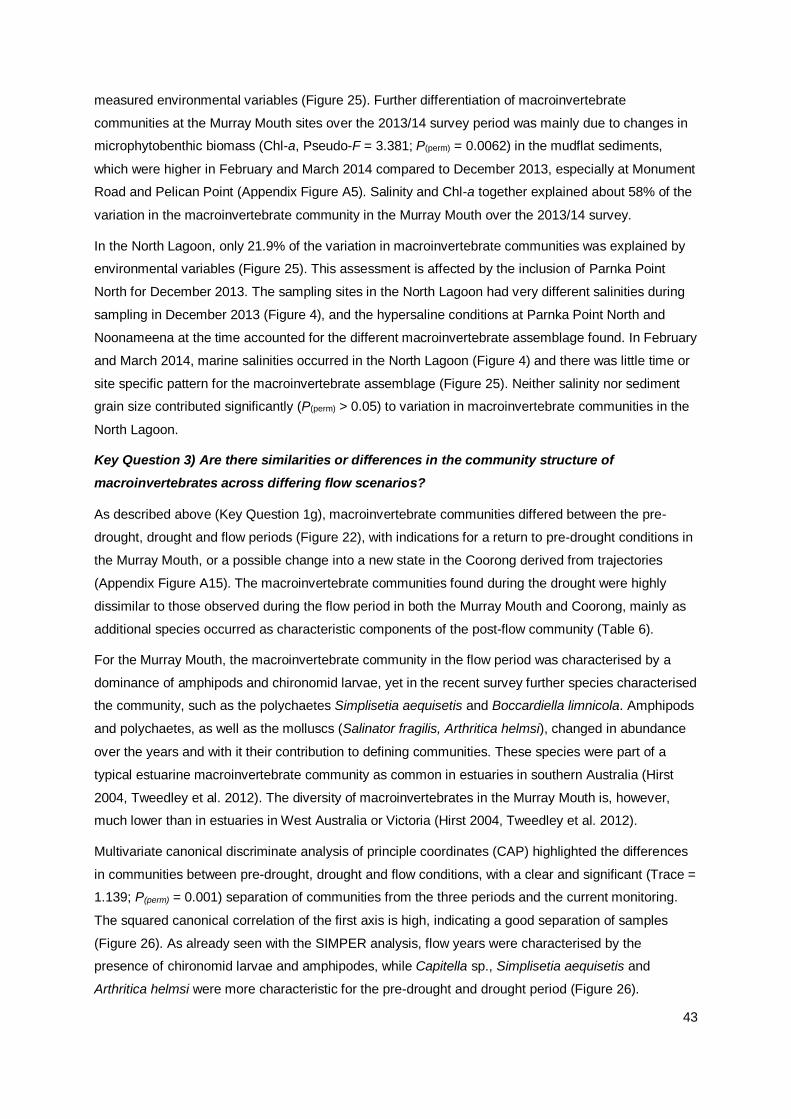
43
measured environmental variables (Figure 25). Further differentiation of macroinvertebrate
communities at the Murray Mouth sites over the 2013/14 survey period was mainly due to changes in
microphytobenthic biomass (Chl-a, Pseudo-F = 3.381; P(perm) = 0.0062) in the mudflat sediments,
which were higher in February and March 2014 compared to December 2013, especially at Monument
Road and Pelican Point (Appendix Figure A5). Salinity and Chl-a together explained about 58% of the
variation in the macroinvertebrate community in the Murray Mouth over the 2013/14 survey.
In the North Lagoon, only 21.9% of the variation in macroinvertebrate communities was explained by
environmental variables (Figure 25). This assessment is affected by the inclusion of Parnka Point
North for December 2013. The sampling sites in the North Lagoon had very different salinities during
sampling in December 2013 (Figure 4), and the hypersaline conditions at Parnka Point North and
Noonameena at the time accounted for the different macroinvertebrate assemblage found. In February
and March 2014, marine salinities occurred in the North Lagoon (Figure 4) and there was little time or
site specific pattern for the macroinvertebrate assemblage (Figure 25). Neither salinity nor sediment
grain size contributed significantly (P(perm) > 0.05) to variation in macroinvertebrate communities in the
North Lagoon.
Key Question 3) Are there similarities or differences in the community structure of
macroinvertebrates across differing flow scenarios?
As described above (Key Question 1g), macroinvertebrate communities differed between the pre-
drought, drought and flow periods (Figure 22), with indications for a return to pre-drought conditions in
the Murray Mouth, or a possible change into a new state in the Coorong derived from trajectories
(Appendix Figure A15). The macroinvertebrate communities found during the drought were highly
dissimilar to those observed during the flow period in both the Murray Mouth and Coorong, mainly as
additional species occurred as characteristic components of the post-flow community (Table 6).
For the Murray Mouth, the macroinvertebrate community in the flow period was characterised by a
dominance of amphipods and chironomid larvae, yet in the recent survey further species characterised
the community, such as the polychaetes Simplisetia aequisetis and Boccardiella limnicola. Amphipods
and polychaetes, as well as the molluscs (Salinator fragilis, Arthritica helmsi), changed in abundance
over the years and with it their contribution to defining communities. These species were part of a
typical estuarine macroinvertebrate community as common in estuaries in southern Australia (Hirst
2004, Tweedley et al. 2012). The diversity of macroinvertebrates in the Murray Mouth is, however,
much lower than in estuaries in West Australia or Victoria (Hirst 2004, Tweedley et al. 2012).
Multivariate canonical discriminate analysis of principle coordinates (CAP) highlighted the differences
in communities between pre-drought, drought and flow conditions, with a clear and significant (Trace =
1.139; P(perm) = 0.001) separation of communities from the three periods and the current monitoring.
The squared canonical correlation of the first axis is high, indicating a good separation of samples
(Figure 26). As already seen with the SIMPER analysis, flow years were characterised by the
presence of chironomid larvae and amphipodes, while Capitella sp., Simplisetia aequisetis and
Arthritica helmsi were more characteristic for the pre-drought and drought period (Figure 26).
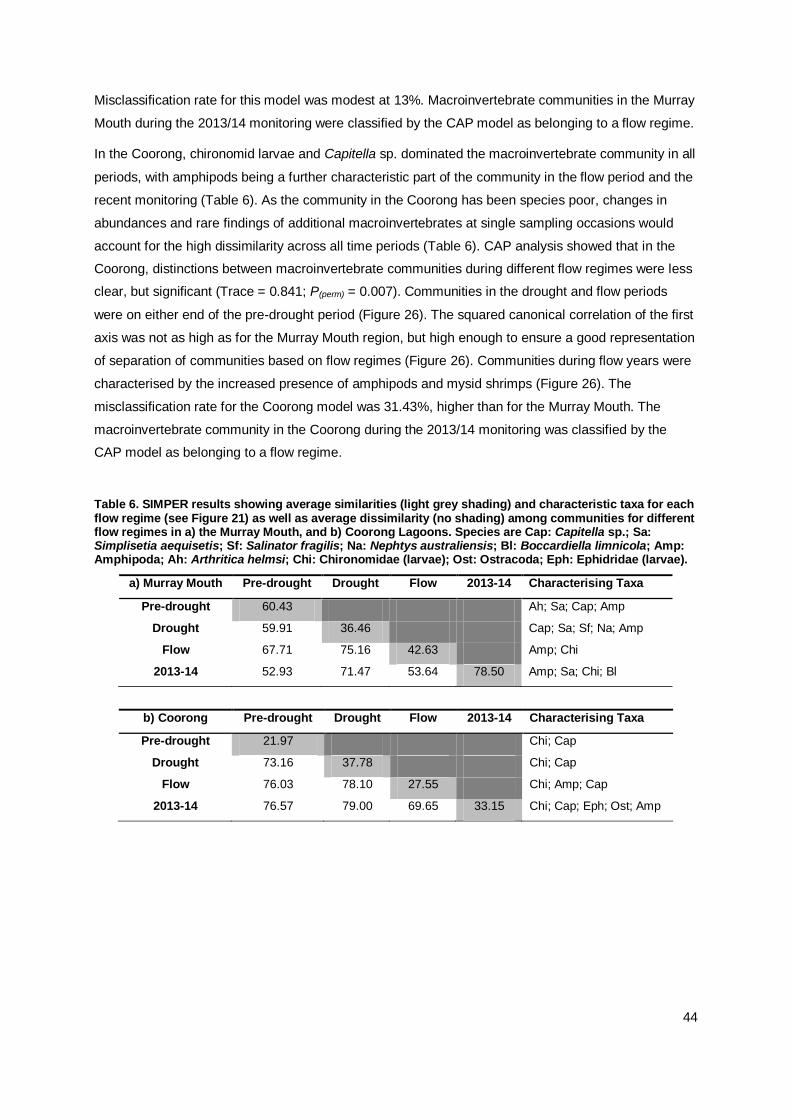
44
Misclassification rate for this model was modest at 13%. Macroinvertebrate communities in the Murray
Mouth during the 2013/14 monitoring were classified by the CAP model as belonging to a flow regime.
In the Coorong, chironomid larvae and Capitella sp. dominated the macroinvertebrate community in all
periods, with amphipods being a further characteristic part of the community in the flow period and the
recent monitoring (Table 6). As the community in the Coorong has been species poor, changes in
abundances and rare findings of additional macroinvertebrates at single sampling occasions would
account for the high dissimilarity across all time periods (Table 6). CAP analysis showed that in the
Coorong, distinctions between macroinvertebrate communities during different flow regimes were less
clear, but significant (Trace = 0.841; P(perm) = 0.007). Communities in the drought and flow periods
were on either end of the pre-drought period (Figure 26). The squared canonical correlation of the first
axis was not as high as for the Murray Mouth region, but high enough to ensure a good representation
of separation of communities based on flow regimes (Figure 26). Communities during flow years were
characterised by the increased presence of amphipods and mysid shrimps (Figure 26). The
misclassification rate for the Coorong model was 31.43%, higher than for the Murray Mouth. The
macroinvertebrate community in the Coorong during the 2013/14 monitoring was classified by the
CAP model as belonging to a flow regime.
Table 6. SIMPER results showing average similarities (light grey shading) and characteristic taxa for each flow regime (see Figure 21) as well as average dissimilarity (no shading) among communities for different flow regimes in a) the Murray Mouth, and b) Coorong Lagoons. Species are Cap: Capitella sp.; Sa: Simplisetia aequisetis; Sf: Salinator fragilis; Na: Nephtys australiensis; Bl: Boccardiella limnicola; Amp: Amphipoda; Ah: Arthritica helmsi; Chi: Chironomidae (larvae); Ost: Ostracoda; Eph: Ephidridae (larvae).
a) Murray Mouth Pre-drought Drought Flow 2013-14 Characterising Taxa
Pre-drought 60.43 Ah; Sa; Cap; Amp
Drought 59.91 36.46 Cap; Sa; Sf; Na; Amp
Flow 67.71 75.16 42.63 Amp; Chi
2013-14 52.93 71.47 53.64 78.50 Amp; Sa; Chi; Bl
b) Coorong Pre-drought Drought Flow 2013-14 Characterising Taxa
Pre-drought 21.97 Chi; Cap
Drought 73.16 37.78 Chi; Cap
Flow 76.03 78.10 27.55 Chi; Amp; Cap
2013-14 76.57 79.00 69.65 33.15 Chi; Cap; Eph; Ost; Amp
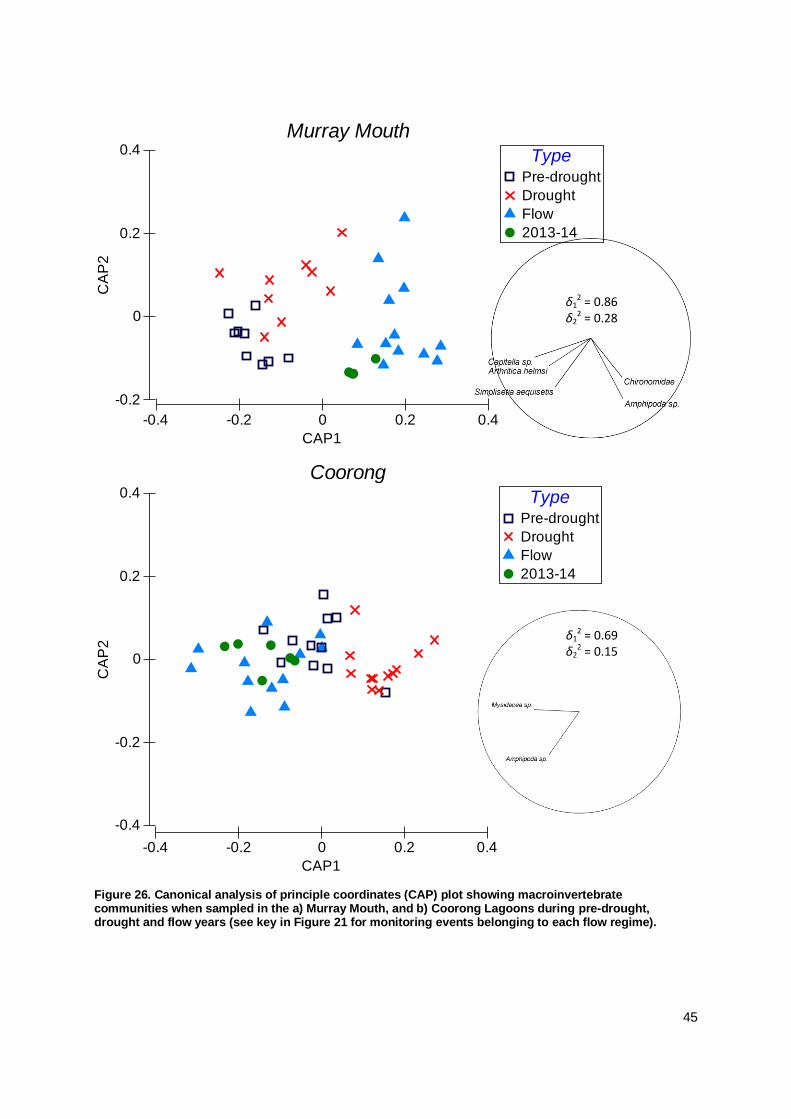
45
Figure 26. Canonical analysis of principle coordinates (CAP) plot showing macroinvertebrate communities when sampled in the a) Murray Mouth, and b) Coorong Lagoons during pre-drought, drought and flow years (see key in Figure 21 for monitoring events belonging to each flow regime).
Murray Mouth
-0.4 -0.2 0 0.2 0.4
CAP1
-0.2
0
0.2
0.4
CA
P2
TypePre-drought
Drought
Flow
2013-14
Coorong
-0.4 -0.2 0 0.2 0.4
CAP1
-0.4
-0.2
0
0.2
0.4
CA
P2
TypePre-drought
Drought
Flow
2013-14
δ12 = 0.86
δ22 = 0.28
δ12 = 0.69
δ22 = 0.15
46
5 Conclusions
In the fourth year since flows returned, the diversity and abundances of macroinvertebrates in the
Murray Mouth and Coorong were showing stronger signs of recovery in late spring/early summer,
followed by a drop in numbers of previously dominant species in the course of summer. Based on
long-term comparisons of late spring/early summer surveys, a cycle of change was apparent for the
Murray Mouth, where macroinvertebrate communities were becoming more similar to the pre-drought
period, while a similar development in the Coorong was less pronounced. Whether the recovery will
lead to a restoration of pre-drought conditions or to a new condition remains to be further investigated.
Recovery of estuarine ecosystems can take time (Duarte et al. 2014) and, as this monitoring showed,
pre-drought condition have not yet been restored. A sequence of multiple stressors can affect the
resilience of estuarine macroinvertebrates (Verdelhos et al. 2014) and the prolonged drought and
intensive flow peak in 2010/11 may have affected the resilience of the Murray Mouth and Coorong.
Freshwater flows can have effects similar to other disturbances and lead to a peak of opportunists in
the early phases of recolonisation, followed by transitional periods to recovery (Pearson & Rosenberg
1978, Cañedo-Argüelles & Rieradevall 2010, Duggan et al. 2014). For future climate scenarios with
increased frequencies of extreme events, findings from this monitoring will assist management
considerations into the future.
Subtidal locations were only sampled on one occasion in the 2013/14 monitoring, and revealed higher
abundances in sediments in shallow water. By not continuing subtidal sampling over summer,
population size estimates or assessments of recruitment could not be given for some species as they
were mostly or only recorded from subtidal sediments. For the records of presence and distribution of
species such as some of the larger bivalves, the present monitoring has very likely underestimated the
distribution ranges of macroinvertebrate species.
The decrease in abundances of amphipods and chironomid larvae in early 2014 exceeded smaller
seasonal reductions in abundances seen in the previous surveys. Foraging depletion by shorebirds
can reduce prey abundances in overwintering habitats (Saleem et al. 2014) and the effect of predation
pressure from shorebirds in the Murray Mouth and Coorong merits investigation. Alternative
explanations for the decrease could lie in the extreme heat wave in South Australia in January 2014,
which could have exceeded the thermal tolerance of macroinvertebrate species (Poertner et al. 2002).
Polychaetes like Simplisetia aequisetis did not show such a pronounced reduction in abundances over
summer, and their ability to dwell deeper in the sediment may have provided a thermal refuge. Their
burrowing activity will further benefit the biogeochemical recovery of sediments in the Murray Mouth
and Coorong, which have been anaerobic in many places and covered with filamentous macroalgae
(Kristensen & Mikkelsen 2003, Lohrer et al. 2004). With more grazing snails and surface deposit-
feeding bivalves present, the texture of the sediment-water/sediment-air interface will become
roughened, which could further benefit exchange processes and improvements of sediment
biogeochemistry (Maire et al. 2007). Such feedback mechanisms along the recovery pathway are of
interest to understand the processes driving the resilience of the system.
47
6 Acknowledgements
This monitoring would not have been possible without further helping hands in the field and lab that
were provided by Michael Drew, Shea Cameron, Sasha Whitmarsh and Stephanie Baggalley. Their
assistance in collecting, sorting and identifying samples is greatly appreciated. For longer term
comparisons, data obtained through The Living Murray Icon Site Monitoring, funded by the Murray-
Darling Basin Authority, were used in this report. This project was funded by the Department of
Environment, Water and Natural Resources and is part of the South Australian Government’s Murray
Futures program, funded in turn by the Australian Government’s Water for the Future initiative. The
entire CLLMM team are acknowledged for ongoing discussion and support of the project.
7 References
Attrill, M.J., Rundle, S.D., 2002. Ecotone or Ecocline: Ecological Boundaries in Estuaries. Estuarine, Coastal and Shelf Science 55, 929-936.
Baring, R., Dittmann, S., Dutton, A., Gannon, R., Cummings, S., Humphries, J., Hunt, T., 2009. Macrobenthic Survey 2008: Murray Mouth, Coorong and Lower Lakes Ramsar Site. Report for the South Australian Murray-Darling Basin Natural Resources Management Board, Adelaide, pp. 67 pp.
Borja, A., Dauer, D.M., Elliott, M., Simenstad, C.A., 2010. Medium- and long-term recovery of estuarine and coastal ecosystems: patterns, rates and restoration effectiveness. Estuaries and Coasts 33, 1249-1260.
Cañedo-Argüelles, M., Rieradevall, M., 2010. Disturbance caused by freshwater releases of different magnitude on the aquatic macroinvertebrate communities of two coastal lagoons. Estuarine, Coastal and Shelf Science 88(2), 190-198.
Cummings, V.J., Thrush, S.F., 2004. Behavioural response of juvenile bivalves to terrestrial sediment deposits: implications for post-disturbance recolonisation. Marine Ecology Progress Series 278, 179-191.
Dittmann, S., Nelson, M., 2007. Macrobenthic Survey 2006 in the Murray Mouth, Coorong and Lower Lakes Ramsar Site. Report for the Department for Environment and Heritage, Adelaide.
Dittmann, S., Dutton, A., Earl, J., 2008. Macrobenthic Survey 2007 in the Murray Mouth, Coorong and Lower Lakes Ramsar Site. Report for the Department for Environment and Heritage, Adelaide.
Dittmann, S., Cantin, A., Noble, W., Pocklington, J., 2006. Macrobenthic Survey 2004 in the Murray Mouth, Coorong and Lower Lakes Ramsar Site, with an Evaluation of Food Availability for Shorebirds and Possible Indicator Functions of Benthic Species., Adelaide, pp. 55 pp.
Dittmann, S., Cantin, A., Imgraben, S., Ramsdale, T., 2006. Macrobenthic Survey 2005 in the Murray Mouth, Coorong and Lower Lakes Ramsar Site. Report for the Department for Environment and Heritage, Adelaide.
Dittmann, S., Baggalley, S., Brown, E., Drew, M., Keuning, J., 2011. Benthic macroinvertebrate monitoring for the Goolwa Channel Water Level Management Project, year two, and Barrage Releases within the Coorong, Lower Lakes and Murray Mouth region. Report for the Department of Environment and Natural Resources. Flinders University, Adelaide.
Dittmann, S., Ramsdale, T., Keuning, J., Navong, N., Baggalley, S., 2013. Benthic Macroinvertebrate Response Monitoring in the Coorong and Murray Mouth, 2012/13. Report for the Department of Environment, Water and Natural Resources, Adelaide.
Dittmann, S., Baggalley, S., Baring, R., Brown, E., Gannon, R., Silvester, L., 2010. Macrobenthic survey 2009: Murray Mouth, Coorong and Lower Lakes Ramsar site. Report for the South Australian Murray Darling Basin Natural Rsources Management Board, Adelaide.
Dittmann, S., Ramsdale, T., Navong, N., Cummings, C., Baggalley, S., Keuning, J., 2013. Benthic macroinvertebrate survey 2012-13: Lower Lakes, Coorong and Murray Mouth Icon Site. , Report
48
for the Department of Environment, Water and Natural Resorces and the Murray-Darling Basin Authority. Flinders University of South Australia.
Dittmann, S., Brown, E., Navong, N., Beyer, K., Silvester, L., Baggalley, S., Keuning, J., 2012. Macrobenthic invertebrate survey 2011-12: Lower Lakes, Coorong and Murray Mouth Icon Site. Report for the Department for Water and Murray-Darling Basin Authority. Flinders University of South Australia.
Dolbeth, M., Cardoso, P.G., Ferreira, S.M., Verdelhos, T., Raffaelli, D., Pardal, M.A., 2007. Anthropogenic and natural disturbance effects on a macrobenthic estuarine community over a 10-year period. Marine Pollution Bulletin 54(5), 576-585.
Duarte, C.M., Borja, A., Carstensen, J., Elliott, M., Krause-Jensen, D., Marbà, N., 2014. Paradigms in the Recovery of Estuarine and Coastal Ecosystems. Estuaries and Coasts, (in press).
Duggan, M., Connolly, R.M., Whittle, M., Curwen, G., Burford, M.A., 2014. Effects of freshwater flow extremes on intertidal biota of a wet-dry tropical estuary. Marine Ecology Progress Series 502, 11-23.
Elliot, M., Burdon, D., Hemingway, K.L., Apitz, S.E., 2007. Estuarine, coastal and marine ecosystem restoration: Confusing management and science - A revision of concepts. Estuarine, Coastal and Shelf Science 74, 349-366.
Geddes, M.C., 1987. Changes in salinity and in the distribution of macrophytes, macrobenthos and fish in the Coorong lagoons, South Australia, following a period of River Murray flow. Trans. R. Soc. S. Aus. 111(4), 173-181.
Geddes, M.C., Butler, A.J., 1984. Physiochemical and biological studies on the Coorong Lagoons, South Australia, and the effects of salinity on the distribution of the macrobenthos. Transactions of the Royal Society of South Australia 108, 51-62.
Gillet, P., Torresani, S., 2003. Structure of the population and secondary production of Hediste diversicolor (O.F. Müller, 1776), (Polychaeta, Nereidae) in the Loire estuary, Atlantic Coast, France. Estuarine, Coastal and Shelf Science 56(3–4), 621-628.
Günther, C.-P., 1992. Dispersal of intertidal invertebrates: A strategy to react to disturbances of different scales? Netherlands Journal of Sea Research 30, 45-56.
Hirst, A., 2004. Broad-scale environmental gradients among estuarine benthic macrofaunal assemblages of south-eastern Australia: implications for monitoring estuaries. Marine and Freshwater Research 55, 79-92.
Hummel, H., Meijeboom, A., De Wolf, L., 1986. The effects of extended periods of drainage and submersion on condition and mortality of benthic animals. Hydrobiologia 103, 251-266.
Hummel, H., Fortuin, A.W., De Wolf, L., Meijeboom, A., 1988. Mortality of intertidal benthic animals after a period of prolonged emersion. Journal of Experimental Marine Biology and Ecology 121, 247-254.
Kangas, M.I., Geddes, M.C., 1984. The effects of salinity on the distribution of amphipods in the Coorong, South Australia, in relation to their salinity tolerance. Transactions of the Royal Society of South Australia 108(3), 139-145.
Keuning, J., Brown, E., Navong, N., Beyer, K., Baggalley, S., Dittmann, S., 2012. Benthic macroinvertebrate response monitoring in the Murray Mouth and Coorong, 2011/12. Report for the Department for Environment and Natural Resources, Adelaide.
Kristensen, E., Mikkelsen, O.L., 2003. Impact of the burrow-dwelling polychaete Nereis diversicolor on the degradation of fresh and aged macroalgal detritus in a coastal marine sediment. Marine Ecology Progress Series 265, 141-153.
Leblanc, M., Tweed, S., van Dijk, A., Timbal, B., 2012. A review of historic and future hydrological changes in the Murray-Darling Basin. Global and Planetary Change 80-81, 226-246.
Levin, L.A., Boesch, D.F., Covich, A., Dahm, C., Erséus, C., Ewel, K.C., Kneib, R.T., Moldenke, A., Palmer, M.A., Snelgrove, P.V.R., Strayer, D., Weslawski, J.M., 2001. The function of marine critical transition zones and the importance of sediment biodiversity. Ecosystems 4, 430-451.
Lohrer, A.M., Thrush, S.F., Gibbs, M.M., 2004. Bioturbators enhance ecosystem function through complex biogeochemical interactions. Nature 431, 1092-1095.
49
Lotze, H.K., Lenihan, H.S., Bourque, B.J., Bradbury, R.H., Cooke, R.G., Kay, M.C., Kidwell, S.M., Kirby, M.X., Peterson, C.H., Jackson, J.B.C., 2006. Depletion, Degradation, and Recovery Potential of Estuaries and Coastal Seas. Science 312(5781), 1806-1809.
Maire, O., Duchêne, J.C., Grémare, A., Malyuga, V.S., Meysman, F.J.R., 2007. A comparison of sediment reworking rates by the surface deposit-feeding bivalve Abra ovata during summertime and wintertime, with a comparison between two models of sediment reworking. Journal of Experimental Marine Biology and Ecology 343(1), 21-36.
Marques, L., Carrico, A., Bessa, F., Gaspar, R., Neto, J.M., Patricio, J., 2013. Response of intertidal macrobenthic communities and primary producers to mitigation measures in a temperate estuary. Ecological Indicators 25, 10-22.
Oishi, K., Saigusa, M., 1999. Rhythmic patterns of abundance in small sublittoral crustaceans: variety in the synchrony with day/night and tidal cycles. Marine Biology 133(2), 237-247.
Olafsson, E.B., Peterson, C.H., Ambrose, W.G.j., 1994. Does recruitment limitation structure populations and communities of macro-invertebrates in marine soft sediments: the relative significance of pre- and post-settlement processes. Oceanography and Marine Biology: an Annual Review 32, 65-109.
Pearson, T.H., Rosenberg, R., 1978. Macrobenthic succession in relation to organic enrichment and pollution of the marine environment Oceanography Marine Biology Annual Review 16, 229-311.
Poertner, H.O., 2002. Climate variations and the physiological basis of temperature depend on biogeography: systemic to molecular hierarchy of thermal tolerance in animals Comparitive Biochemistry and Physiology Part A 132, 739-761.
Potter, I.C., Chuwen, B.M., Hoeksema, S.D., Elliott, M., 2010. The concept of an estuary: A definition that incorporates systems which can become closed to the ocean and hypersaline. Estuarine, Coastal and Shelf Science 87, 497-500.
Ramskov, T., Forbes, V.E., 2008. Life history and population dynamics of the opportunistic polychaete Capitella sp. I in relation to sediment organic matter. Marine Ecology Progress Series 369, 181-1192.
Salem, M.V.A., van der Geest, M., Piersma, T., Saoud, Y., van Gils, J.A., 2014. Seasonal changes in mollusc abundance in a trpoical intertidal ecosystem, Banc d'Arguin (Mauritania): Testing the 'depletion by shorebirds' hypothesis. Estuarine, Coastal and Shelf Science 136, 26-34.
Sebasvari, Z., Esser, F., Harder, T., 2006. Sediment-associated cues for larval settlement of the infaunal spionid polychaetes Polydora cornuta and Streblospio benedicti. Journal of Experimental Marine Biology and Ecology 337, 109-120.
Thrush, S.F., Whitlatch, R.B., Pridmore, R.D., Hewitt, J.E., Cummings, V.J., Wilkinson, M.R., 1996. Scale-dependent recolonization: The role of sediment stability in a dynamic sandflat habitat. Ecology 77(8), 2472-2487.
Tsutsumi, H., 1990. Population persistence of Capitella sp. (Polychaeta; Capitellidae) on a mud flat subject to environmental disturbance by organic enrichment. Marine Ecology Progress Series 63, 147-156.
Tweedley, J.R., Warwick, R.M., Valesini, F.J., Platell, M.E., Potter, I.C., 2012. The use of benthic macroinvertebrates to establish a benchmark for evaluating the environmental quality of microtidal, temperate southern hemisphere estuaries. Marine Pollution Bulletin 64(6), 1210-1221.
Verdelhos, T., Cardoso, P.G., Dolbeth, M., Pardal, M.A., 2014. Recovery trends of Scrobicularia plana populations after restoration measures, affected by extreme climate events. Marine Environmental Research 98, 39-48.
Verdonschot, P.F.M., Spears, B.M., Feld, C.K., Brucet, S., Keizer-Vlek, H., Borja, A., Elliott, M., Kernan, M., Johnson, R.K., 2013. A comparative review of recovery processes in rivers, lakes, estuarine and coastal waters. Hydrobiologia 704(1), 453-474.
Verissimo, H., Bremner, J., Garcia, C., Patricio, J., van der Linden, P., Marques, J.C., 2012. Assessment of the subtidal macrobenthic community functioning of a temperate estuary following environmental restoration. Ecological Indicators 23, 312-322.
Whitfield, A.K., Elliott, M., Basset, A., Blaber, S.J.M., West, R.J., 2012. Paradigms in estuarine ecology - A review of the Remane diagram with a suggested revised model for estuaries. Estuarine, Coastal and Shelf Science 97, 78-90.
50
Whitlatch, R.B., Lohrer, A.M., Thrush, S.F., Pridmore, R.D., Hewitt, J.E., Cummings, V.J., Zajac, R.N., 1998. Scale-dependent benthic recolonization dynamics: life stage-based dispersal and demographic consequences. Hydrobiologia 375/376, 217-226.