Embed Size (px)
Citation preview
Decision Analysis to Guide Policy on the Introduction of a Routine Second Dose of
Measles Vaccine
Maia Rabaa, MHSWladimir Alonso, PhDRicardo Giglio, MScMark Miller, MD

Introduction• The model is compartmentalized by age group and geographical
features, and incorporates country-specific demographics, socio-economic development status, historical vaccine coverage rates, and age-specific vaccine efficacy and forces of infection.
• Due to its dependence on annual rather than averaged data, this model is responsive to year-to-year variations such as major changes in routine vaccine coverage or supplementary immunization activities, which can rapidly alter population immunity levels.
• This cohort method allows for the rapid estimation of realistic age-structured immunity levels within a population, and assesses country-specific and global measles burden.

Flux flow of the events that each age-group is submitted to at each year cycle
• Events during the cycle not only change the proportions that will be exported for the next cycle (year), but also generate intermediate outcomes (namely proportions of cases and deaths).
• Each of the rectangular boxes represents a matrix of 104 age-groups X 71 years

Cost Estimates
Total cost to vaccinate one child with a routine dose
of MCV (USD)
Total cost to vaccinate one child through SIAs (USD)
Cameroon 1.42 1.04India 1.36 1.00
El Salvador 1.72 1.27
Estimates based on economic indicators and cost data from country-specific studies.

Time-series showing vaccination opportunities and the effects of vaccination in the total
populationUpper graphic shows the three vaccination opportunities (each one on a different axis) with the size of the bars proportional to the coverage.
In the lower graphic, the total size of the bars represents the proportion of susceptible individuals, with the red segment indicating measles cases.

Questions from September Meeting
Question 1: For countries that currently have a single dose strategy, what is the most cost-effective strategy to accelerate measles control?
Question 2: What is the added value for a country that is already doing regular SIAs to introduce a 2nd routine dose?
Question 3: For countries with 2 routine doses & SIAs, when is it appropriate to consider stopping SIAs?

Question 1: For countries that currently have a single dose strategy, what is the most cost-effective strategy to accelerate measles control?
Ex. India (Bihar, Maharashtra, Orissa, Karnataka,
Tamil Nadu)
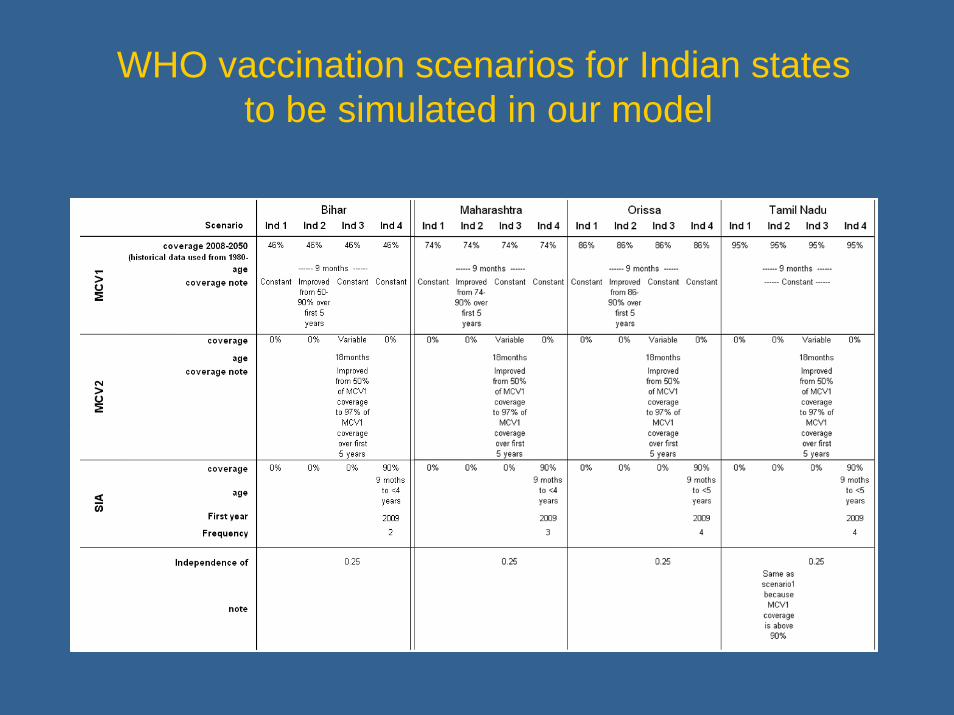
WHO vaccination scenarios for Indian states to be simulated in our model

Example: Bihar - Scenario Ind1 (baseline; MCV1 only)

Example: Bihar - Scenario Ind2 (improved MCV1 coverage)

Example: Bihar - Scenario Ind 3 (MCV1 + MCV2)

Example: Bihar - Scenario Ind 4 (MCV1 + SIAs)
(Catch-up SIA, then 9 months to <4 years)

Results for Indian StatesNumber of measles cases estimated for the period 2008‐2050
Number of measles deaths estimated for the period 2008‐2050
Ind 1 (Baseline)
Ind 2(increased MCV1)
Ind 3(MCV1 + MCV2)
Ind 4(MCV1 + SIAs)
Bihar 259,381 97,177 140,058 2
Maharashtra 113,464 72,332 26,222 2
Orissa 26,436 21,435 2,438 1
Tamil Nadu 19,327 19,327 3,070 1
0
5,000,000
10,000,000
15,000,000
20,000,000
25,000,000
30,000,000
Bihar Maharashtra Orissa Tamil Nadu
Ind1 (MCV1)Ind2 (increased MCV1)Ind3 (MCV1 + MCV2)Ind4 (MCV1 + SIAs)
MCV1 46% MCV1 74% MCV1 86% MCV1 95%

Indian states Annual Incidence 2008-2050
0
1000
2000
3000
4000
5000
6000
Bihar Maharashtra Orissa Karnataka Tamil Nadu
BaselineIncrease MCV1MCV2SIA
0
10
20
30
40
50
60
Bihar Maharashtra Orissa Karnataka Tamil Nadu
BaselineIncrease MCV1MCV2SIA
Cases/Million
Deaths/Million

Indian states EconomicsCost of measles vaccination estimated for the period 2008‐2050
Cost per DALY averted
$0.00$2.00$4.00$6.00$8.00
$10.00$12.00$14.00$16.00$18.00$20.00
Bihar
Mahara
shtra
Orissa
Karnata
ka
Tamil N
adu
Increase MCV1MCV2SIA
Baseline Increase MCV1 MCV2 SIABihar $10,537,414 $20,186,559 $20,342,681 $70,665,263
Maharashtra $18,750,017 $22,708,565 $36,346,073 $63,791,507Orissa $7,461,080 $7,808,851 $14,357,275 $28,964,820
Karnataka $8,946,623 $8,946,623 $17,293,172 $35,912,122Tamil Nadu $9,383,638 $9,383,638 $18,146,930 $35,559,755

Results for Indian States
• For each of the Indian states, the marginal impact is greatest with the addition of regular SIAs over the baseline
• For Bihar, a significant reduction would be achieved by increasing MCV1 coverage
• The addition of MCV2 also reduces incidence by 40 to 90%

Results for Indian States
• At very low 1st dose coverage (46%), improving MCV1 coverage is integral (optimization of MCV1 coverage modeled separately)
• Even at 74% coverage with MCV1, addition of a 2nd routine dose (MCV2) is more effective than improving MCV1 coverage

Question 2: What is the added value for a country that is already doing regular SIAs to introduce a 2nd routine dose?
Ex. Africa & Cambodia(Equatorial Guinea, Cameroon, DRC, Cambodia, Rwanda, Ghana)

WHO vaccination scenarios for Africa and Cambodia to be simulated in our model

Example: Cameroon - Scenario AC1 (baseline; MCV1 + SIAs)

Example: Cameroon - Scenario AC2 (MCV1 + MCV2 + SIAs; MCV2 @ 18 months [25% independence])
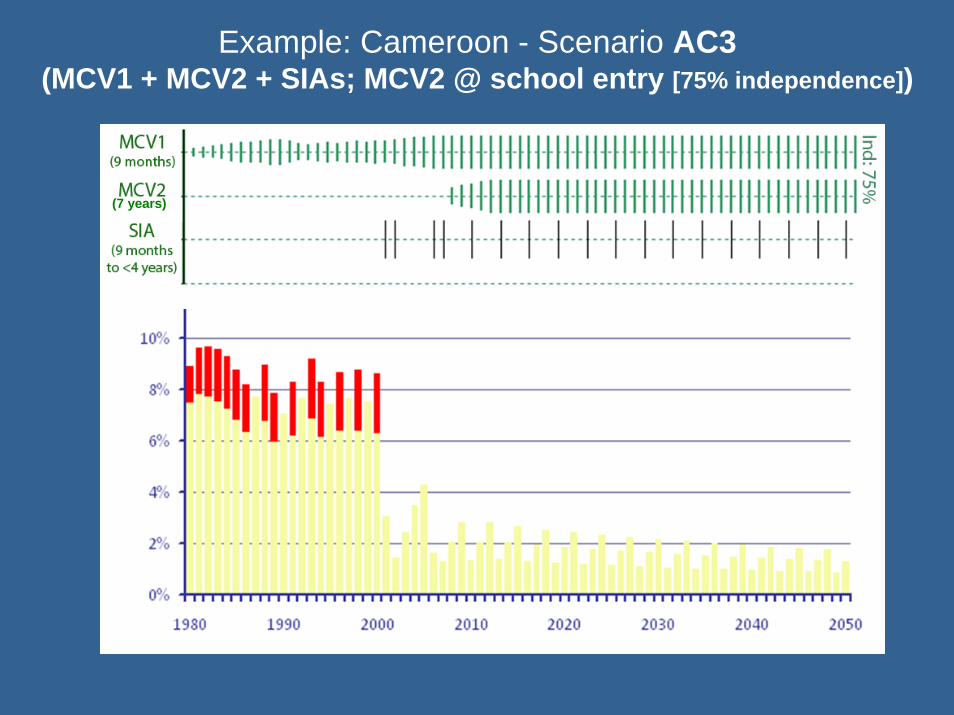
Example: Cameroon - Scenario AC3 (MCV1 + MCV2 + SIAs; MCV2 @ school entry [75% independence])
(7 years)

Results for Africa and CambodiaIncidence (cases/1,000,000) of measles estimated for the period 2008‐2050
Number of measles deaths estimated for the period 2008‐2050
AC1 ‐Baseline AC2 AC3
Equatorial Guinea 0 0 0
Cameroon 3 1 2
DRC 24 15 23
Cambodia 1 1 1
Ghana 5 2 5
Rwanda 2 1 1
Note: Country scenarios differed in the frequencies of SIAs and the age groups targeted
0.00.00.00.00.0
0.00.00.00.0
Cameroon DRC EquatorialGuinea
Ghana Rwanda Cambodia
AC1 ‐ Baseline
AC2
AC3
0.16
0.12
0.08
0.04
0
AC2 – MCV1 + MCV2 (18mos) + SIAs
AC3 – MCV1 + MCV2 (7yrs) + SIAs
MCV1 73% MCV1 73% MCV1 79% MCV1 85% MCV1 95%MCV1 51%

0.000.020.040.060.080.100.120.140.16
CameroonDRC EquatorialGuinea
Ghana RwandaCambo
BaseliMCV2 MCV2
Cases/Million
Africa/Cambodia Annual Incidence 2008-2050

Africa/Cambodia EconomicsCost of measles vaccination estimated for the period 2008‐2050
Cost per DALY averted
Baseline MCV2 18M MCV2 7YCameroon $57,209,782 $82,995,309 $81,482,298
DRC $208,805,313 $300,832,548 $291,169,261Equatorial Guinea $2,953,642 $3,964,573 $3,854,009
Ghana $65,747,809 $95,201,623 $94,016,958Rwanda $36,707,724 $54,286,095 $52,361,357
Cambodia $36,363,126 $51,377,746 $50,882,474
$0
$100,000
$200,000
$300,000
$400,000
$500,000
$600,000
Cameroon DRC EquatorialGuinea
Ghana Rwanda Cambodia
MCV2 18M

Africa and Cambodia
• For the African countries and Cambodia, the model shows that it would not be cost-effective to provide a routine 2nd dose in addition to current strategy of MCV1 and continued scheduled SIAs
• MCV2 at 18 months is slightly more effective at case reduction for approximately the same cost compared to MCV2 at 7 years

Question 3: For countries with 2 routine doses & SIAs, when is it appropriate to consider stopping SIAs?
Ex. Latin America(Paraguay, Costa Rica, Mexico, El Salvador)

WHO vaccination scenarios for Latin America to be simulated in our model
Target for elimination <1 case/1,000,000 population

Example: Mexico – Scenario LA1 (baseline; MCV1 + MCV2 [0% independence] + SIAs)

Example: Mexico – Scenario LA2 (MCV1 + MCV2 [0% independence])

Results for Latin America
Incidence (cases/1,000,000) of measles estimated for the period 2008‐2050
LA1 – Baseline LA2 (No SIAs)
Paraguay 31 70
40
561
45
Costa Rica 23
Mexico 272
El Salvador 26
Number of measles cases estimated for the period 2008‐2050
0.0
0.0
0.0
0.0
0.0
0.0
Costa Rica El Salvador Paraguay Mexico
LA 1 (baseline)
LA 2
LA 3
LA 4
0.25
0.20
0.15
0.10
0.05
0
2 (No SIAs)
MCV1 98%MCV1 88% MCV1 89% MCV1 96%

Latin America Annual Incidence 2008-2050
Deaths/Million0.00
0.05
0.10
0.15
0.20
0.25
Costa Rica El Salvador Paraguay Mexico
BaseliNo SIA
Cases/Million
Deaths None

Latin America EconomicsCost of measles vaccination estimated for the period 2008‐2050
Cost per Case averted*
Baseline No SIACosta Rica $16,660,772 $10,755,809El Salvador $33,715,082 $20,458,114
Paraguay $23,190,576 $13,781,456Mexico $380,820,157 $233,008,200
No SIA
$0
$200,000
$400,000
$600,000
$800,000
Costa Rica El Salvador Paraguay Mexico
No SIA

Latin America
• In Latin America, the baseline scenarios of coverage (88-98%) for MCV1 and high coverage of SIAs
• estimated numbers of cases, deaths, and DALYs when the independence between the 1st and 2nd vaccine doses is increased from 0% (LA1) to 100% in LA2 (namely, non-recipients of the 1st routine dose are targeted first for receipt of a dose offered at the 2nd opportunity).

Latin America
• For the scenarios provided by the WHO for Latin America, the model shows that SIAs are not needed to contain measles transmission and cases, given the use of MCV1 and MCV2 with the high coverage suggested (MCV2 between 58% and 98%).

Limitations
• No cost function was used in the model to account for the expected higher marginal costs at higher coverage rates
• Single coverage figure provided for year may not reflect heterogeneity within population modeled
• For Latin America -- Alternative strategy of eliminating routine second MCV2 rather than SIA not modelled

ConclusionsQuestion 1: For countries that currently have a single
dose strategy, what is the most cost-effective strategy to accelerate measles control?– In the Indian states, alternative interventions of a routine
second dose would reduce cases by 40-90%; deaths even more due to age-shifts in incidence with CFR declines at higher ages
– Increasing coverage for first dose for those not already at 90%; adding a second dose at various ages or SIA would all be considered cost-effective for Indian States by over an order of magnitude
– SIA are the most effective as modelled resulting in the greatest reduction of disease though relatively more expensive than other options; nevertheless still CE by over an order of magnitude

ConclusionsQuestion 2: What is the added value for a country that is
already doing regular SIA's to introduce a 2nd routine dose?
Africa– Assuming continuation of campaigns as conducted
for the last decade, for time period measured, limited reduction in number of cases, deaths
– Slight reduction in number of susceptible persons– High cost; not cost-effective

ConclusionsQuestion 3: For countries with 2 routine doses and SIAs, when is it appropriate
to consider stopping SIAs?– Depends on goal (reduction of deaths, cases or susceptible persons)
and routine MCV2 coverage; – For Latin America, immunity offered by historical campaigns and current
routine scheduled coverage rates are sufficient to effectively prevent outbreaks through the period modeled; however, the number of susceptible persons might increase above a threshold in certain countries (Paraguay) to allow the recurrence of outbreak after 2050
– Currently, no discernible utility if current coverage continues;
– High cost; not cost-effective to keep both SIAs and MCV2

Suggested Next Steps• Optimization strategies can be observed with fully
dynamic alternative model• Elimination? -- Can use existing models to ascertain
coverage necessary to maintain immune profile above a certain threshold – Requires verification of uniformity of coverage rates
throughout sub-national districts; alternatively, analyses could be completed at greater granularity based on sub-national populations
• Cost effectiveness of elimination would require data for cost function at exponential part of curve given required immunity in excess of 90% to maintain local elimination
• Utilization of existing models at country level exploiting full versatility of sensitivity analyses and alternative strategies