Embed Size (px)
Citation preview
FACULTY OF ENGINEERING AND SUSTAINABLE DEVELOPMENT Department of Industrial Development, IT and Land Management
Decision analysis: determining the most appropriate drilling method for production drilling in underground
mining
w to decide the most appropriate drilling method for production drilling in underground mining
Fredrik Gransell
Fredrik Gransell
Fredrik Gransell
2016
2016
2016
Student thesis, Master degree (one year), 15 HE Decision, Risk and Policy Analysis
Master Programme in Decision, Risk and Policy Analysis
Supervisor: Fredrik Bökman Examiner: Ulla Ahonen-Jonnarth
Student thesis, Master degree (one year), 15 HE Decision, Risk and Policy Analysis
Master Programme in Decision, Risk and Policy Analysis

Decision analysis: determining the most appropriate drilling
method for production drilling in underground mining
by
Fredrik Gransell
Faculty of Engineering and Sustainable Development
University of Gävle
S-801 76 Gävle, Sweden
Email:
Abstract
The mining industry contains many factors with a high degree of uncertainty.
Therefore, there is a need for decision analysis. The production drill process is an
initial process in underground mining, thus it is important that the most appropriate
drilling method is used for specific mining operations. The current study provides
examples of important variables that can be used in the decision analysis of the given
decision problem. Drill methods included in the decision analysis are hydraulic top-
hammer, pneumatic, and hydraulic down-the-hole hammers. Monte Carlo simulations
are used as decision analysis method and tornado diagrams are used to determine how
large effect the variables have on the results given the variation in each variable. The
Monte Carlo simulations are based on a hypothetical case. It is challenging to analyze
only the drilling process because the results of this process influence other processes
in the mine. Thus, a comprehensive decision model that includes several processes of
the mining operation would be of value to the decision maker. The presented
calculations focus on cost per ton in terms of direct and indirect costs of drilling.
Examples of safety and environmental criteria are given, for a possible extension of
the analysis.

Contents
1 Introduction ............................................................................................................. 1 1.1 Background .................................................................................................................. 1 1.2 How the drilling method is typically determined ......................................................... 2 1.3 Problem definition ........................................................................................................ 3 1.4 Delimitations and simplifications ................................................................................. 3 1.5 Related work ................................................................................................................. 4 1.6 Disposition .................................................................................................................... 4
2 Introduction to decision analysis ........................................................................... 5 2.1 Decision analysis under uncertainty ............................................................................. 5 2.2 Multi-criteria decision analysis..................................................................................... 6
3 Introduction to underground mining .................................................................... 6
4 Production drilling methods in underground mining ......................................... 7 4.1 Top–hammer drilling .................................................................................................... 8 4.2 Pneumatic DTH-hammer drilling ................................................................................. 8 4.3 Hydraulic DTH-hammer drilling .................................................................................. 8
5 The importance of straight holes ........................................................................... 9 5.1 Dilution ....................................................................................................................... 10 5.2 Ore Recovery .............................................................................................................. 11 5.3 Calculating the influence of deviation on dilution and ore recovery .......................... 11 5.4 Calculating the influence of deviation on the success of the blast .............................. 11
6 Monte Carlo simulations and variables used in the current study ................... 11 6.1 Variables used in the simulation ................................................................................. 14
6.1.1 Price of the ore ................................................................................................ 14 6.1.2 The grade of the ore ........................................................................................ 14 6.1.3 Deviation ......................................................................................................... 15 6.1.4 How drill hole deviation influences dilution and ore recovery factors ........... 15 6.1.5 How drill hole deviation influences the success of the blast factor ................. 15 6.1.6 The rate of penetration (ROP) ......................................................................... 16 6.1.7 The life span of the percussion unit ................................................................. 16 6.1.8 The life span of the DTH-hammer ................................................................... 16 6.1.9 The life span of drill bits ................................................................................. 16 6.1.10 The life span of drill rods ................................................................................ 16 6.1.11 The cost and use of energy .............................................................................. 17 6.1.12 The cost of operators ....................................................................................... 17 6.1.13 The cost of handling dilution ........................................................................... 17 6.1.14 Drilled meters/ton ........................................................................................... 18
6.2 Tornado diagram ........................................................................................................ 18
7 Examples of Monte Carlo simulations ................................................................ 19 7.1 Calculations ................................................................................................................ 21 7.2 Direct costs of drilling ................................................................................................ 21 7.3 Dilution cost ............................................................................................................... 21 7.4 Cost of ore loss ........................................................................................................... 22 7.5 Cost of an unsuccessful blast ...................................................................................... 22 7.6 To calculate the total cost/ton ..................................................................................... 22 7.7 Input values ................................................................................................................ 22
8 Analysis of the results ........................................................................................... 27 8.1 Sensitivity analysis ..................................................................................................... 31
9 The choice of drilling method as a multi-criteria decision problem ................. 35 9.1 Safety criterion ........................................................................................................... 36 9.2 Environmental criterion .............................................................................................. 36 9.3 Multi-criteria decision analysis under uncertainty ...................................................... 37
10 Discussion .............................................................................................................. 38 10.1 Further recommendations ........................................................................................... 39

11 Conclusion ............................................................................................................. 40
References ................................................................................................................... 42
Abbreviations & explanations
Mining
DTH-Hammer Down-The-Hole-Hammer (percussive unit behind the drill bit)
Top-Hammer Percussive unit located on the drill rig
LHD Laud Haul Dumper (machine used for mucking)
ROP Rate of Penetration (how fast the drill advances)
Fragmentation Sizes of the rock after a blast
Boulder Oversized rock
Dilution Rock that does not contain ore
Ore recovery The amount of ore that is recovered
Stope “Vertical pillar” underground that contains ore and is blasted
Tramming Transporting rock with a LHD from the stope to the rock shaft
Powder factor Amount of explosive/metric ton of rock
Deviation When a drill hole deviates from the designed path (see chapter 5,
Figure 2 for a detailed explanation of how to calculate drill hole
deviation)
Decision analysis
MCDA Multi Criteria Decision Analysis
CDF Cumulative distribution function

1
1 Introduction
The first chapter provides an explanation of the background of the current thesis and
details why the thesis is useful for the industry. This is followed by a definition of the
problem that the thesis answers. Then, simplifications of the analysis are described and
the structure of the thesis is presented.
1.1 Background
Mining is one of the oldest professions. Most modern technology used in mining comes
from centuries of experience through traditional trial and error. However, in modern
mining, it is not always possible to simply try a mining method or technology. The
process has to be determined prior to the mining process. The book Underground
mining methods: Engineering fundamentals and international case studies (W. A.
Hustrulid 2001) provides some examples of this determination.
In cases of a new mine that is under construction, or an existing mine that is reaching
a new ore body to be extracted, a specific drill method will require a specific mine
design. The decision can be complex, mainly because of uncertainties that are often
involved in mining. It is also challenging to use data (acquired through experience) from
another mine as a reference because rock conditions and the shapes of ore bodies are
unique for each mine.
A decision regarding the mining technique to be used must be made prior to mining
in many cases. Different software, based on mathematical models, can be used to
simulate the mining process. This is a cost efficient method. A common simulation
method within decision analysis is the Monte Carlo simulation. However, an extensive
search for documentation regarding the use of simulation methods for decision making
in the mining industry shows limited results, suggesting that they are rarely used.
Several decision analysis methods exist that could be useful for various decisions within
the mining industry, just as in other industries. Though, there appears to be a lack of
knowledge within the mining industry as to how to use these methods for decision
analysis problems as they are rarely used. Therefore, general studies demonstrating how
some of these decision analysis methods can be used for a particular problem within the
industry are valuable. Such a study is presented in the current thesis.
Hustrulid (2001, p 266-267) presents a case study describing the cost distribution of
the underground process at the El Saldado mine. The ore is mined with the siblevel open
stoping mining method. This is also the mining method that the current decision analysis
is based on. In Figure 1, a cost distribution is presented for different underground mining
processes. The figure shows that the total cost of the drill and the blast process is 17%
of the total cost of the underground production process.

2
Figure 1. Cost distribution of the underground mining process at the El Saldado mine,
using sublevel open stoping (after Hustrulid 2001).
The cost distribution between the drill and blast process is unclear. Because drilling
occurs in the beginning of the mining process, it is likely to greatly impact the
subsequent mining processes. The cost distribution seen in the El Saldado mine case
study is focused on the direct cost of a process, for example, it only includes the cost of
drill consumables. However, the result of the drill process can significantly influence
the cost of the subsequent processes. Such indirect costs are included in the decision
analysis model described of the current thesis. Therefore, it is important that the most
appropriate drilling method is used depending on the particular circumstances of the
mine.
Although the decision problem will be different for each mine, the decision analysis
process can be carried out in a similarly structured manner. The decision is often
whether the hydraulic top-hammer, the pneumatic Down The Hole (DTH) -hammer, or
the hydraulic DTH-hammer would be the most appropriate drilling method for
production drilling in underground mining.
1.2 How the drilling method is typically determined
Generally, it is up to three stakeholders in the decision group to determine which drilling
method to use. The three stakeholders are the mine company, the equipment supplier,
and a consultant. Currently, there are two drill equipment manufacturers with a large
market share, Atlas Copco and Sandvik. These companies supply the most commonly
used and available drilling methods, therefore, decision makers at the mine often rely
on the manufacturer’s recommendation. After all, the general, fundamental objective of
the manufacturer is to add value to its customers by supplying them with the most
appropriate method or technique. According to Lunenburg (2003, p 1-4), decision
analysis is rarely used for common decision making, in contrast, decisions tend to be
based on intuition. The choice of a drilling method has many different aspects which
are explained in this thesis. When analyzing the marketing material of the suppliers
drilling methods, a particular focus is often given to one aspect, such as the length of
the drill hole. Some even imply that there are “rules of thumb” for when a particular
drilling method should be used up to a particular drill hole length. The length of the drill
hole is important because it determines the deviation of the drill hole to a high degree.
Although I have not been able to find any general relation between the length of the drill
hole and the deviation, it depends on the drilling method, rock formations, and the skill
32%
12%
28%
17%
11%
0%
5%
10%
15%
20%
25%
30%
35%
Development Extraction Infrastructure Drill and blast Transport
Cost Distribution

3
of the operator, etc. Therefore, it is interesting to analyze how drill hole deviation
influences the overall cost of drilling and, indirectly, the length of the hole to some
degree.
1.3 Problem definition
The current study examines the determination of the drilling method that is the most
appropriate for underground production drilling. Cost is the criterion that is analyzed in
this decision model. The aim of the study is to describe how the decision maker can
analyze the decision problem with help of the decision analysis method, Monte Carlo
simulations. The analysis should provide a comprehensive overview to readers by
including the consequences of processes following the drill process; and also help
decision makers identify and determine which variable variation is the most important
for the decision in terms of how uncertainty influences the cost.
1.4 Delimitations and simplifications
There are several drilling methods available for production drilling. The current study
includes hydraulic top-hammer drilling, pneumatic DTH-hammer drilling, and
hydraulic DTH-hammer drilling. More unusual drilling methods are not examined in
the decision model. While writing this thesis, I worked for a company that manufactures
a hydraulic DTH-hammer. However, the aim is to generate an impartial decision
analysis model.
In chapter 5, the importance of drilling straight holes is explained. To some extent,
this is taken into consideration in the Monte Carlo simulations presented later in the
thesis, but some simplifications were necessary to do so. If a drill hole deviates from its
designed path (see chapter 5), the rock is likely to be nonhomogeneous. How drill hole
deviation influences fragmentation is not considered by this thesis, but the consequences
of different fragmentations are still reflected in the form of uncertainty for such costs.
Another simplification related to drill hole deviation is the risk of an unsuccessful
blast if drill hole deviation is severe. There can be many underlying factors that cause
an unsuccessful blast. Blast design can be poor or undesired initiation times of the
detonators can cause cut offs of the explosives. The decision model includes only how
the deviation of drill holes influences the probability of an unsuccessful blast. How
much the deviation of the drill holes actually influences the probability of an
unsuccessful blast is unique for each drill and blast design; hence, determinations of
how the drill hole deviation influences the probability of an unsuccessful blast must be
simplified. Another simplification related to unsuccessful blasts is the ore loss (%).
When a blast is unsuccessful and the stope needs to be re-drilled and blasted again, it is
challenging to recover all of the ore. This uncertainty is not reflected in the model
because it depends on the stope and particular blast. However, a fixed percentage (5%)
is used for calculations to represent ore loss. Another simplification related to
unsuccessful blasts concerns the necessary additional drilling and charging. In the
hypothetical case used by this study, the drill costs are identical to the initial drill cost
to drill the stope. The charge cost is the same value as the drill cost.
How drill hole deviation influences dilution and ore recovery also depends on the
actual drill and blast design. It is not possible to use a general factor to describe how
drill hole deviation influences these variables because it varies from mine to mine, in
this study, a simplified factor is used.
The decision analysis focuses on vertical mining methods where the perimeter of the
ore body is mined, such as sublevel stoping. It does not include horizontal mining
methods or large-scale mining methods where the perimeter of the ore body is less
crucial.

4
1.5 Related work
Limited results arise from an search for related work, where simulations are used to
simulate a decision problem within the mining industry. There has been some research
in mining, or closely related fields, to simulate a mining process or a decision problem
with the help of decision analysis and computer software. Examples include the doctoral
thesis Rock Quarrying prediction models and blasting safety (Olsen 2009, p 120-138),
where a blast result is simulated with Monte Carlo simulations. The research article
Planning Tunnel construction using Markov Chain Monte Carlo (Vargas, Koppe, Pérez,
Juan, 2015, p 1-9) simulates a process in underground mining (tunneling) with Monte
Carlo simulations. One of the leading explosive suppliers and consultancies for the
mining industry (Orica) published the book Tunneling in rock by drilling and blasting
which explains how shock waves during the blast process can be simulated with Monte
Carlo simulations (Spathis & Gupta 2012, p 59-67). Simulations have also been used in
mining to predict rock falls, etc. This can be seen in the book, Practical rock engineer
(Hoek 2006, p 3-6). The mining company Boliden, based in Sweden, has also carried
out the research, namely Monte Carlo reliability simulation of underground drill rig
(Lundberg, AL-Chalabi & Hosseini 2016, p 1-6), to simulate the reliability of a drill rig
to improve productivity. I did not find research related to decision analysis or
simulations for production drilling for underground mining in terms of cost,
environmental, or safety perspectives.
1.6 Disposition
The thesis is divided into 11 chapters.
Chapter 1 – Introduction
In this chapter, the background to the thesis is explained. The definition of the decision
problem and the aim of the study are presented. The delimitations and simplifications
are explained and a brief summary presented.
Chapter 2 – Introduction to decision analysis
In this chapter, an introduction to decision analysis is given, where decisions under
uncertainty and multi-criteria decision analysis are included. The purpose of this chapter
is to help readers with limited knowledge of decision analysis theory to understand the
concepts. Because the targeted audiences are likely to have limited knowledge within
decision analysis, this chapter is an important introduction to this field of study. The
chapter is related to the decision analysis in the current study, but reading this chapter
is not necessary to follow the decision analysis process presented in the rest of the thesis.
Chapter 3 – Introduction to underground mining
In this chapter, the underground mining process is briefly described in a general manner.
The purpose of this chapter is to introduce underground mining to readers with limited
knowledge of the industry. This is particularly useful for the secondary audience of this
thesis. The chapter is related to the decision analysis in the current study. However, this
chapter is not necessary for a reader to follow the decision process.
Chapter 4 – Production drilling in underground mining
This chapter describes the production drilling process in underground mining in detail.
Different drilling methods included in the decision problems are explained.
Chapter 5 – The importance of straight holes
In this chapter, the importance of straight holes during production drilling is explained.
This includes a description of how drill hole deviation occurs, how to calculate the drill

5
hole deviation, and how it influences the dilution, ore recovery, and the overall success
of the blast.
Chapter 6 – Monte Carlo simulations and variables used in the current study
In this chapter, the Monte Carlo simulation method is explained. The chapter contains
sections for each variable included in the calculations, described in terms of how to
gather data and reflect uncertainty with the use of probability distributions.
Chapter 7 – Examples of Monte Carlo simulations
In this chapter, calculations from Monte Carlo simulations are described and how each
variable is used is shown in a calculation spreadsheet.
Chapter 8 – Analysis of results
In this chapter, results from the Monte Carlo simulations are analyzed.
Chapter 9 – The choice of drilling method as a multi-criteria decision problem
In this chapter, Multi Criteria Decision Analysis (MCDA) and examples of criteria that
can be useful for inclusion in the decision analysis are described.
Chapter 10 – Discussion
In this chapter, the decision analysis is discussed and recommendations as to how to
further improve the decision model are presented. Reflections are also provided, such
as how such decision models can be introduced to and implemented in the mining
industry.
Chapter 11 – Conclusion
In this chapter, a conclusion is given, including an analysis of how successfully the aim
of the study was met.
2 Introduction to decision analysis
Decision analysis is used in a variety of fields, such as business (marketing and
planning), health care research, management studies, energy exploration, and product
launches, among others. Decision analysis can be used for many types of decisions.
The book Making hard decisions (Clemen & Reilly, 2001, p 6) is a comprehensive
introduction to decision analysis. Clemen and Reilly describe that decision analysis
cannot guarantee the best possible outcome if there is any level of uncertainty in the
decision. For the current study, the most appropriate drilling method will depend on the
objectives, such as cost, environmental aspects, or a combination of several aspects. The
objectives can be unique for every decision maker. How the decision maker determines
subjective probabilities and prioritize trade-offs can also be unique. Clemen and Reilly
(2001, p 5) describe that personal judgments about uncertainty and values are important
inputs for decision analysis. Developing these judgments involves thinking hard and
systematically about important aspects of a decision problem.
2.1 Decision analysis under uncertainty
When a decision maker is unsure of the outcome of a decision, for example, if a drill
hole is drilled, there is uncertainty regarding the deviation of the drill hole. Atlas Copco,
as industry leader in drill equipment supplies, explains in their compendium
Underground mining: A global review of methods and practices (Atlas Copco, 2014, p
95) that a certain degree of drill hole deviation is simply unavoidable for a number of

6
reasons. Factors that a decision maker cannot control create a decision under
uncertainty. To handle uncertainties and make a decision model representative of the
actual decision problem, graphical representations of decision analysis are often used.
Examples of these include influence diagrams and decision trees (Clemen & Reilly,
2001, p 146). These graphical representations represent alternatives available to a
decision maker given a particular decision problem.
2.2 Multi-criteria decision analysis
When more than one criterion is included in the decision analysis, the decision problem
requires MCDA. When a decision maker has several objectives, for example, cost
efficiency and safety, the first step is to understand the objectives (Clemen & Reilly,
2001, p 44). An example of a purpose of the MCDA is to enable the alternatives to be
ranked, for example, from worst to the best, or sorted into classes such as “bad” or
“good”. Different criteria can be defined generally, such as “cost of drilling”, but they
should still be associated with a measurable attribute that provides a qualitative or
quantitative scale for assessing the performance of the underlying criteria.
Clemen and Reilly (2001, p 600) describe multi attribute utility theory (MAUT) as
useful for a decision maker using MCDA when multiple objectives are of interest. In
the book Smart choices: A practical guide to making better decisions (Hammond,
Keeney, Raiffa 2002) the decision analysis method PrOACT (Problem, Objective,
Alternatives, Consequences, Tradeoffs) is described. This decision analysis method
describes the general flow of the decision analysis and the method can be used for
MCDA problems. The first step is to define the problem, as it is important that a decision
maker is focusing on the right decision. Then, the objective is important to evaluate,
asking questions such as what are the objectives with the decision. Different alternatives
need to be evaluated as well and the decision model should in some way reflect the
consequences of each alternative. Tradeoffs need to be considered when objectives
conflict with each other. It is also important for a decision maker to understand risk
tolerance, meaning the decision makers willingness to take risks. Finally, linked
decisions are described, where a decision maker needs to plan ahead by effectively
coordinating current and future decisions.
3 Introduction to underground mining
Hustrulid (2001, p 3) describes underground mining as a process of extracting minerals
that are buried sufficiently deep under the surface to be mined with conventional surface
mining methods. Underground mining can be divided into hard and soft rock. Hard rock
typically contains metals such as gold, copper, silver, zinc, lead, etc., while soft rock
contains coal.
Underground mining can be completed in different ways and ore body can be mined
either horizontally or vertically, depending on the orientation of the ore body. The book
Underground mining methods: Engineering fundamentals and international case
studies (Hustrulid, 2001) provides examples of horizontal mining methods, such as
room and pillar mining, and cut and fill mining. Examples of vertical mining methods
include sub level stoping (the most common mining method) and sub level caving.
Hustrulid (2001, p 4) also explains that the first step in the creation of a mining
method is the design of the infrastructure, such as tunnels. The layout of the overall
tunnel system will determine which mining method can be used. It can be cost and time
consuming to change the mining method once the mine is operating. Therefore, the
planning of a mine is particularly important. Tunnels can be described as declines,
which transport vehicles to different levels in the mine. Tunnels can also be described
as drifts, which connect declines with the ore body. They serve as accesses to different
production areas of the mine.

7
The book also highlights the importance of having the proper infrastructure for rock
flow and sufficient ventilation. This is achieved through vertical shafts connecting each
level of the mine. Rock is normally dumped into a shaft with a Laud haul dumper (LHD)
and then collected at a main level and transported by dumpers or trains to a hoist shaft
that brings the rock from the underground to the surface. Ventilation shafts are divided
into two categories, fresh air and exhaust air shafts.
The first step of underground production is drilling blast holes. Blast holes can have
varying lengths and dimensions, but generally, for horizontal drilling, they are between
30–50 mm in diameter and up to 5 m in length, while vertical drill holes are generally
between 64–127 mm in diameter and between 10–40 meters in length. The holes are
charged with explosives and the blast has a designed sequence between each individual
blast hole, therefore, it is important that the blast hole is in the correct position according
to the design. Once the ore has been blasted, the mucking process takes place. As
described, an LHD typically dumps the blasted rock into shafts and dumpers or trains
transport the rock to the hoist shaft. Depending on the hoist shaft, the rock often has to
be crushed into a certain fragmentation size prior to haulting. This is done with an
underground crusher. The book mentions that the typical size of the fragmentation after
the first crushing is 0–250 mm.
Once the ore has reached the surface, it is crushed into even smaller fragments with
secondary crushers and mills. Depending on the mineral being mined, different
separation processes exist to separate the mineral from the waste rock, for example,
flotation or leaching. The book notes the relationship between each process, from the
start of the production to the final product, and the importance of correct planning from
the start. In other words, it is more favourable if the correct decisions are made from the
beginning of the process.
4 Production drilling methods in underground mining
The book Surface and underground excavations: Methods, Techniques and Equipment
(Tatiya 2013, p 97-100) describes drilling in underground mining as a process that is
required for the placement of explosives. The explosives are used to break rocks. Drill
holes are referred as shot holes, blast holes, or big blast holes, depending on the size.
The current study focuses on the drilling of blast holes (45 mm–75 mm) and big blast
holes (>75 mm) as shot holes are typically used for horizontal mining methods
(tunneling).
Tatiya (2013, p 62) also explains that there are four functional components of a drill
system:
1. The drill which acts as the prime mover, converting an original form of energy,
hydraulic, pneumatic, or electric, into mechanical energy to actuate the system
2. The drill rod which transfers the energy from the prime mover to the drill bit.
An exception is DTH-hammer drilling, where the drill rod transfers the
circulation fluid and rotation.
3. The drill bit is the applicator of energy which strikes the rock to achieve the
penetration.
4. The circulation fluid cleans the drill hole from drill cuttings, cools the drill bit,
and can act as a stabilizer for the hole. Generally, air or water is used as fluid.
All of these functional components need to be considered during decision analysis
when choosing a proper drilling method. As described, drilling methods analyzed in the
current study include percussive drilling methods, namely hydraulic top-hammers,
hydraulic DTH-hammers, and pneumatic DTH-hammers.

8
4.1 Top–hammer drilling
Tatiya (2013, p 100) describes top-hammer drilling as a piston strike hitting a shank
adapter and creating a shock wave. The shock wave is transferred through the drill string
(a series of connected drill rods) to the drill bit. The drill bit transfers the energy to the
rock and the surface of the rock is crushed into drill cuttings. Drill cuttings are then
transported away from the hole by means of flushing air, supplied through the flushing
hole of the drill string. Because the drill string is rotating, together with the drill bit, new
rock is constantly being hit and penetrated. The rock drill and the drill string are
arranged on a feeding device. The feed force makes sure that the drill bit is constantly
in contact with the rock to use the impact power at the maximum level. Top-hammer
drilling is the most commonly used drilling method for underground mining due to its
relatively low cost, low energy consumption, and high productivity. However, a
disadvantage of this drilling method is increased deviation over the length of the drill
hole. Atlas Copco (2014, p 95) suggests that deviation can be between 5–10% for holes
that are 30 m in length. The reason why deviation occurs, and the importance of
minimizing deviation, is explained in chapter 5. Tatiya (2013, p 100) also explains that
there is energy loss when energy is transferred through the drill string. DTH-hammer
drilling helps alleviate these disadvantages.
4.2 Pneumatic DTH-hammer drilling
Tatiya (2013, p 100-101) explains that the impact mechanism operates down the hole
in a down-the-hole hammer. This is to say that the piston directly strikes the drill bit and
there is no energy loss through the joints of the drill string. The drill string transfers the
compressed air to the impact mechanism and transmits rotational torque and feed force.
The exhaust air (the compressed air that leaves the drill bit) blows and cleans the hole
and transports drill cuttings to the surface. Such drills (percussive unit) are referred to
as DTH-drills. Because no energy is lost in the drill string, the rate of penetration (ROP)
remains constant throughout the hole, regardless of the depth. Pneumatic DTH-
hammers work with compressed air and only a small amount of water can be added.
The work environment can be harsh unless dust collectors are used. Tatiya (2013, p 101)
further explains that this method is often used for deep holes that require high accuracy.
Common dimensions ranges are between 86–165 mm in diameter.
4.3 Hydraulic DTH-hammer drilling
The manufacturers of a hydraulic DTH-hammer explain in the technical brochure Water
powered drilling: The water hydraulic DTH Technology (Wassara, 2014) that the set up
of a hydraulic DTH-hammer drill system is similar to the pneumatic DTH-hammer.
Instead of using a compressor to compress air, a high pressure pump is used to power
the hammer. The brochure explains that changing from pneumatic to hydraulic increases
the efficiency of the hammer. The brochure suggests the overall energy consumption is
lower with this drilling method compared to pneumatic DTH-hammer drilling.
Moreover, a main advantage of the hydraulic system is that it enables straight holes.
The hydraulic DTH-hammer can drill much straighter holes because of guide ribs
located on the outside of the hammer case.
Guide ribs enable a tight clearance (1–2 mm) between the hammer and the drill hole
which makes the hammer more stable inside the hole. They prevent the hammer from
deviating which results in a straighter hole. A case study from Wassara (2016a) shows
that drill hole deviation was less than 1% for a 20 m drill hole compared to the clearance
with a pneumatic DTH-hammer which is about 20 mm. The reason for this difference
is the media used to power the hammer. The manufacturer’s website (Wassara 2016b)
explains that a large amount of air needs to be compressed to build up a high pressure
while drilling with air (needed for the piston to strike on the drill bit). As Tatiya (2013,
p 100-101) notes, pneumatic DTH-hammers are often used when high accuracy is

9
necessary, higher accuracy than for hydraulic top-hammers. However, Thompson
(2010, p 23) shows that a hydraulic DTH-hammer can drill significantly straighter holes
than a pneumatic DTH-hammer. Based on these findings, one could argue that in
general, the hydraulic DTH-hammer has the lowest drill hole deviation, followed by the
pneumatic DTH hammer, and then the hydraulic top-hammer.
To power a 152 mm air powered DTH-hammer, roughly 570 liters/second of air is
required. When the compressed air leaves the hammer, the air expands to its original
volume. This generates large volumes of air with a velocity of 40–80 m/second. This
high velocity and volume requires a larger clearance, up to 20 times as high as in a
hydraulic DTH-hammer. Because water is a non-compressible media with no expansion
of volume, the velocity of the water is much lower (0.5–2 liter/second). This also lowers
the energy for drill cuttings which should yield longer life spans of drill rods and
hammer cases.
The disadvantage of this drilling method is the availability of drilling media. When
drilling with pneumatic DTH-hammer, it is rarely difficult to supply the hammer with
compressed air as air is easily accessible. However, it can be more challenging to
provide water to power a hydraulic DTH-hammer. Further, as described on a suppliers
website, the water needs to be relatively clean (maximum particle sizes of 50 micron
and 150 mg/l of particles). If these limits are not met, the overall life span of the hammer
can be severely reduced which will have a large impact on the overall cost and
productivity of the drilling process.
This drilling method is relatively new compared to the other drilling methods.
However, the technical brochure Water powered drilling: The water hydraulic DTH
Technology (Wassara, 2014) notes that the technology’s inventor (LKAB) is using it in
their underground mines, described as the two largest underground iron ore mines in the
world.
5 The importance of straight holes
The compendium Underground mining: A global review of methods and practices
(Atlas Copco, 2014, p 94-99) explains that the risk of drill hole deviation increases with
the increased length of the drill hole. It is reasonable to assume that lengthy drill holes
can never be entirely straight, regardless of the equipment or experience of the drill
operator. A certain degree of deviation is simply unavoidable. Some of the most
common reasons as to why deviation in the drill hole appears include poor hole
alignment, a lack of guide tubes, too high feed force, poor collaring, badly selected drill
steel, and various rock types with faults that can steer the drill bit in the wrong direction.
The compendium also notes that drill hole deviation is extremely undesirable for the
operator, not to mention the drill and blast engineers who have carefully planned the
blast design based on drill holes in an exact position. The position of holes has a direct
effect on blast result. Holes that are not parallel will lead to uneven fragmentation. If
holes are too far apart from each other, there is a great risk that the blast will be
unsuccessful (freezing rock). In other words, straight holes are key to optimal blast
results.
While mining an ore body along its ore boundary, the importance of straight holes
even greater. Drill and blast engineers determine drill and blast design such that it
maximizes ore recovery with as little dilution as possible. Figure 2 provides an example
of a drill design adjacent to the ore boundary, referred to as the hanging wall (HW) and
foot wall (FW). The figure also explains how a drill hole can deviate from its designed
path and generate increased dilution (see section 5.1) and ore loss (see section 5.2)
during the blast. To calculate drill hole deviation, with reference to Figure 2, the width
(perpendicular distance between the designed drill hole and the position of the toe of
the deviated drill hole) is divided by the length of the drill hole. If the length of the drill
hole is 30 m and the width is 1.5 m, the deviation is 5%.

10
Figure 2. General drill design of sub level stoping with drill hole deviation that results
in dilution.
In this decision analysis, costs of drilling are categorized into four different costs:
direct cost of drilling, cost of dilution, cost of ore loss, and cost of an unsuccessful blast.
The deviation variable will have a great effect on all of these costs. As increased
deviation increases dilution, additional costs are allocated to handle dilution. Indirect
costs are generated when deviation causes ore loss, meaning a loss in revenue. Increased
cost is generated when deviation causes an unsuccessful blast because the stope needs
to be re-drilled and blasted again with decreased chances of retrieving all of the ore.
Deviation affects the direct cost when it is measured in cost per ton because additional
drill holes can be drilled to allow drill holes to deviate. For example, if the powder factor
(kg explosives per metric ton rock) should be 1 kg/metric ton, 1.2 kg/metric ton can
instead be used as more drill holes are drilled and tightly spaced. Therefore, the direct
cost/ton would also increase, but this is not reflected in the decision model because it is
not a common practice.
5.1 Dilution
Tatiya (2013, p 537) explains that an optimal mining system should maintain dilution
at a minimum level. While mining close to ore boundaries (holes adjacent to the HW
and FW), it is crucial that drill holes do not deviate. If drill holes deviate outside of ore
boundary, additional waste rock (green in Figure 2) is mined. This dilution continues
along the process, all the way to separation ( described in chapter 3), which means
additional operation costs and time is necessary during mucking, haulage, crushing, and
milling. It is also important in terms of safety. Damaging the hanging wall can lead to a
greater risk of additional hanging wall failure, a hazard for both the operator and the
machine. Additional operating times will also increase exposure to hazards. Reducing
operating times reduces risk. Dilution is an important factor in deciding which mining
method to use and general dilution percentages are often described for each mining
method.
Dilution is generally calculated as follows. If the drill design in Figure 2 contains
10,000 tons, but the blast result yield in 11,000 tons, then the dilution would be 10%

11
(1,000 tons), assuming the ore recovery is 100%. If the ore recovery is 95%, but the
total amount of mucked tons was 11,000, the dilution is 15.8% (1,500 tons). Dilution is
usually measured with a caving monitory system (CMS) and summarized in a
reconciliation report.
5.2 Ore Recovery
Tatiya (2013, p 537) explains that ore loss is generated when drill holes deviate to the
center of the stope. This can result in a blast which does not cover all of the ore adjacent
to the ore boundary and can be referred as “foot wall ore loss” or “hanging wall ore
loss”. Generally, there is no feasible way of recovering ore that is not mined in the initial
blast. This is especially important while mining high grade ore with high ore prices,
such as precious metals. Therefore, there are incentives for straight holes and they are
an important factor in decision analysis.
Ore recovery is calculated as follows. If the drill design in Figure 2 contains 10 tons
of ore, but the blast results in 9 tons, then the ore recovery is calculated by dividing the
amount of recovered ore with the amount of ore the stope contained. In this case, 9/10
= 90% ore recovery.
5.3 Calculating the influence of deviation on dilution and ore recovery
The degree to which drill hole deviation influences dilution and ore recovery is unique
for each drill and blast design and also depends on rock conditions. It is important for
the decision maker to determine how much a certain drill hole deviation influences
dilution and ore recovery. For example, does a 5% deviation cause a dilution of 5%? To
calculate or determine this, the decision maker should design the drill and blast design
with software such as CAD. With such software it is possible to offset the toe (top-
position) of each drill hole with a preferred percentage of deviation. Then, the outline
of drill holes can be drawn to represent the blast result. Dividing the area of the shapes
located outside of the designed shape (the green area in Figure 2) with the designed
shape will result in the percentages of dilution. Deviation will influence dilution and ore
recovery to a higher degree for narrow stopes compared to bulk (wide) stopes. The same
method can be used to calculate how deviation influences ore recovery. It is important
to do this in a mining software where the decision maker has access to the ore model,
otherwise ore recovery calculations will not be accurate.
5.4 Calculating the influence of deviation on the success of the blast
If the distance between drill holes is supposed to be 2 m, but deviation has caused the
distance to be 5 m, then there is more or less a guarantee that the blast will be
unsuccessful. As discussed in section 1.4, there are factors other than drill hole deviation
that can cause a blast to fail, but they are not reflected in the current model. The easiest
way to determine or calculate the influence of deviation on the success of the blast is to
rely on measurements and statistics, meaning the mine operation should calculate drill
hole deviation and the rate of unsuccessful blasts. For example, if 4% drill hole
deviation yields a rate of 8% unsuccessful blasts, the influence factor would be 2 (8
divided by 4).
6 Monte Carlo simulations and variables used in the current study
In the previous chapters, the complexity of the production drilling process was
described. It is challenging to calculate the cost per meter ($/m) or cost per ton ($/t) with
fixed values from a drilling perspective because the drill process affects many of the

12
subsequent processes and produces uncertainties. A more feasible method for
calculating or presenting this cost is simulation. A simulation should include all
uncertainties and present the cost over an interval, covering the cost from minimum to
maximum, and a probability assigned to each of these values. A suitable method to
accomplish this is the Monte Carlo simulation method, discussed in the introduction.
The Monte Carlo simulation is described by Clemen and Reilly (2001, p 459-468)
as a useful method for decision analysis when the values of variables are unknown.
Instead of using an exact value for a variable, a probability distribution can be used.
Figure 3 provides an example of a probability distribution created in @RISK, showing
a normal probability distribution of lead ore reserves with the mean value of 3% and a
standard deviation of 0.3%. The calculations in the decision analysis are based on this
ore reserve and probability distribution.
Figure 3. Example of a normal distribution created in @RISK.
Monte Carlo simulation uses random sampling to obtain numerical results. With the
software @Risk, the simulation can be done on a computer with a mathematical model.
A Monte Carlo simulation (The Oxford dictionary, 2016) is defined as “A technique in
which a large quantity of randomly generated numbers are studied using a probabilistic
model to find an approximate solution to a numerical problem that would be difficult to
solve by other methods”. The software used for Monte Carlo simulations in this decision
analysis is @Risk from Palisade Corporation. The software is presented on their website
(Palisade 2016).
Figure 4 is an example, unrelated to actual simulations in the current study, of a
Monte Carlo simulation created in @RISK. The simulation is based on several different
input variables with assigned probability distributions. In the table, it is possible to read
the minimum, mean, and maximum values that the simulation produced. The X-axis
displays the measured unit for the graph, such as cost ($) per ton. The Y-axis shows the
probability density based on 1,000 iterations in the simulation. The graph presents two
different simulations. As can be seen in the table, the standard deviation is higher for
simulation 2, which results in a graph shape with a greater range in the X-axis, compared
to simulation 1 with a lower standard deviation. The values at the top of the graph
explain that 50% of the iterations had a result below value 10 for simulation 1, and 50%
had a result above 10, while 100% of iterations from simulation 2 had a result above 10.

13
The same simulation can also be presented in a cumulative ascending graph as shown
in Figure 5. In the graph, the X-axis shows the same value as in the probability density
distribution in Figure 4, while the Y-axis shows the percentage of simulations that have
fallen below the X-axis value.
Comparing the values between simulation 1 and 2 in Figure 4 shows that the
maximum value of simulation 1 is lower than the minimum value of simulation 2.
Clemen and Reilly (2001, p 133-134) describes this as deterministic dominance. In this
example, the simulations describe drill cost per ton of rock, and any decision maker that
prefers a low cost would choose the alternative represented by simulation 1. Hence, if
deterministic dominance occurs, it is easier for the decision maker to determine which
alternative is of the highest value for the decision.
Figure 4. Results of a Monte Carlo simulation created in @Risk. Density probability
distribution.

14
Figure 5. Results of a Monte Carlo simulation created in @Risk. Cumulative
distribution function (CDF).
6.1 Variables used in the simulation
This section describes the variables used in the mathematical model for the Monte Carlo
simulation. The section also describes how the decision maker should think about or
approach variables to determine their input values. Different probability distributions
are briefly discussed. The specific input values used in the examples of Monte Caro
simulations are described in section 7.7. The input values are used to generate a result
for further analysis in the current thesis.
6.1.1 Price of the ore
The price of the ore is an important variable in the Monte Carlo simulation. As
described, deviation can generate a decrease in ore recovery. Therefore, knowing the
price of the ore is important for calculating the indirect cost of drilling (in terms of
decreased ore recovery). Some analyst companies specialize in forecasting the prices of
metals. The decision maker should consult such a company to obtain input data. If
decision analysis concerns a drill process lasting five years, the average value during
this period can be used as a reasonable approximation, or more elaborate, time series
simulations could be made. To reflect uncertainty about the price of ore, a probability
distribution can be assigned to the value.
6.1.2 The grade of the ore
The grade of the ore is always an uncertainty. The grade is often defined by geologists
as a percentage of the total rock volume. For example, if 0.1 ton of lead is found in rock
with the a of 1 ton, the ore grade would be 10% (0.1 divided by 1). A common method
is to core drill and analyze the grade of core samples. However, core drilling does not
address the entire stope. Parmodh (2009, p 527) describes the classification system of
ore grades. The first category of ore is possible. The certainty of the grade of the ore in
this category is small since it depends less on physical evidence and more on geological
inference and knowledge of how ore is known to occur. The second category is
probable, meaning uncertainty in the figures and the projected amount. The final

15
category is proved, meaning that the ore has been closely sampled, both at the surface
and underground. The certainty of the grade of the ore in the proved category has to be
at least 90%. When production drilling takes place, it is always proved ore that is being
mined. The decision maker should consult a geologist to estimate the value of the
variable and probability distribution to reflect the uncertainty. The grade of the ore will
indirectly affect the costs of drilling because ore price is multiplied by the grade of the
ore to calculate loss in revenue.
6.1.3 Deviation
Variable deviation has already been explained in chapter 5 “The importance of straight
holes”. To determine possible values of this variable for each drilling method, drill tests
can be completed so that drill hole deviation can be measured. If the decision maker
does not have access to such drill tests, drill manufacturers can be contacted for
references and review the drills. A deviation from one reference most likely does not
equal the same deviation the decision maker is analyzing. Studies of deviation of
different drilling methods should be compared in the same project, which will be of high
value because it can give an indication of the relationship between them. Once this is
decided, probability distributions can be assigned to reflect the level of uncertainty.
6.1.4 How drill hole deviation influences dilution and ore recovery factors
As described in section 1.4, the calculation of the influence of drill hole deviation on
dilution and ore recovery is simplified as aspects other than deviation influence it, such
as rock characteristics. For example, in competent rock, a deviated blast hole might only
damage the hanging wall in one location (causing dilution), while in a soft formation, a
deviated blast hole might cause the entire hanging wall to collapse. The decision maker
should consult with the drill and blast engineer who can calculate how drill hole
deviation influences dilution and ore recovery (section 5.3 explains this in detail).The
probability distribution of how drill hole deviation influences dilution and ore recovery
is used to show how large effect the variables have on the results given the variation in
each variable, rather than describing the uncertainty of the factor itself. It is useful to
include this variable in tornado diagrams to compare the change of value of this variable
with the variation of other variables. If the deviation-dilution factor is 0.25, a 1% drill
hole deviation results in 0.25% dilution.
6.1.5 How drill hole deviation influences the success of the blast factor Section 5.4 described how the decision maker can calculate how drill hole deviation
influences the risk of having an unsuccessful blast. If the decision maker does not have
available data from the particular mine where the decision is relevant, references from
a similar mine can be used. A probability distribution can be used to reflect the level of
uncertainty of this variable. In this case, a pert probability distribution is used and its
minimum value set to 0 to avoid negative values in the probability distribution. The
input value of the deviation-unsuccessful blast factor used in the calculations is
presented in Table 3. This input value is based on several mine sites where I gained
experience in a career as a mining engineer. For specific drill hole lengths, with a drill
hole deviation of around 4%, the unsuccessful blast rate is about 10%. By using an
influence factor of 1.5, the drill hole deviation generates a probability of 6% (4*1.5)
that an unsuccessful blast will occur, while the remaining probability (10-6=4%) arises
from other factors described in section 1.4. This variable differs depending on the drill
and blast design for each mine, therefore the decision maker needs estimate the
influence factor for each particular case.

16
6.1.6 The rate of penetration (ROP)
The ROP is important for the simulation for several reasons. It affects the amount of
energy used, the cost per meter of percussive units, the life span of the drill bits and drill
rods, and the total operating cost. To determine the rate of penetration, references from
the suppliers should be used. Rock properties have a great influence on the rate of
penetration. Aalizad and Rashidenejad (2015, p 715-716) describe that rock properties
that affect the ROP are density, rock quality designation (RQD), uni-axial compressive
strength, Brazilian tensile strength, porosity, Mohs hardness, Young modulus, and P-
wave velocity. Geologists should be consulted for the decision analysis to gain
knowledge concerning rock properties. However, rock properties differ from stope to
stope, so there is still uncertainty regarding the rate of penetration. Rock and geological
conditions are generally described as uncontrollable parameters, though other
parameters (such as the drilling method) also affect the rate of penetration. Probability
distributions can be assigned to the ROP to reflect the level of uncertainty.
6.1.7 The life span of the percussion unit
As described in chapter 4.1 “Top-hammer drilling method”, this drilling method uses a
percussion unit fitted on the drill rig which requires service after a certain number of
operating hours. The cost of this service can be determined (for example, it can be
controlled by a service contract from the supplier.). There is a degree of uncertainty due
to the service interval. The decision maker needs to consult the supplier to gather data
and a probability distribution can be made to reflect the uncertainty of the input value.
If the decision maker would like to measure the cost in cost/m or cost/t, the service cost
of the percussion unit will be dependent on the rate of penetration.
6.1.8 The life span of the DTH-hammer
The life span of the DTH-hammer can also be measured in terms of the number of
operating hours. The life span in terms of meter significantly depends on the ROP.
Statistics from suppliers can again be used as input data. Probability distributions can
be used to reflect the uncertainty. The price of the product is determined by the supplier.
However, the price/m or price/t is unknown due to the uncertainty of the life span and
the ROP.
6.1.9 The life span of drill bits
The life span of drill bits is usually measured in the number of drilled meters. This
depends on the rock characteristic, as explained in section 6.1.6. Hard rock wears down
drill bits faster in terms of drilled meters. The drill bit supplier can provide the decision
maker with rough information about the life spans and accurate prices/drill bit.
6.1.10 The life span of drill rods
The life span of drill rods, measured in the number of drilled meters, is likely different
for each method. As described in chapter 4 “Drilling methods in underground mining”,
there is a clear difference in how drill rods are used. In top-hammer drilling, the
percussive unit strikes the neck of the drill rod and the energy is transported through the
drill string. This causes high wear on drill rods. The pneumatic DTH-hammer generates
large amounts of energy on drill cuttings due to the large volume and the velocity of the
exhaust air. These particles also wear down drill rods. Theoretically, drill rods should
have the longest life spans with hydraulic DTH-hammers. Once again the decision
maker should consult with suppliers to gather statistics about these values and generate
a probability distribution based on the input data to reflect the level of uncertainty.

17
6.1.11 The cost and use of energy
The cost of energy ($/kWh) should be forecasted by the decision maker as it varies with
time and location. Similar to forecasting metal prices, the decision maker can get help
from companies specialized in these forecasts. Alternatively, mines can agree on a fixed
price of power consumption for a certain time period. In this case, there is no uncertainty
regarding the price, which would be favorable for the decision maker.
The amount of energy is measured with the percussive units for each drilling method.
It depends on the ROP if the amount of energy is measured per drilled meter or per ton
of rock. The difference in energy that the drill rig itself consumes (except for the
percussive unit) is negligible, therefore it is not included in the decision analysis.
6.1.12 The cost of operators
The cost of the operator depends significantly on the ROP if the cost is measured per
drilled meter or per ton ore. The cost of the operator should be fixed depending on a
contract. If the cost is measured as cost/m or cost/t, it is also important to multiply this
variable with a utility factor that reflects the actual percentages of the time that the
percussive unit strikes. This is described in section 7.2. The cost of the operator is
measured as cost/hour. The calculation, based on monthly salary, is divided by the total
number of hours in one month (approximately 24 multiplied by 30).
6.1.13 The cost of handling dilution
Dilution is a variable that contains several aspects. When dilution is generated from the
blast, it affects the mining process through mucking, transport, crushing, haulage,
secondary crushing, milling, and separation processes.
The cost of mucking depends on the tramming distance between the stope and
the ore shaft. The distance is important because it is a time consuming process.
Another factor that influences mucking capacity is fragmentation. For example,
deviation can cause large boulders which slow the productivity of the mucking
process. The decision maker should consult mine planning engineers to
determine the production layout (tramming distance) and reflect the uncertainty
with a probability distribution. The distance will be uncertain since different
production areas will have different distances, and some distances may even be
unknown if the final planning of the layout is not yet designed.
The cost of transportation depends on the technique, for example, trucks,
dumpers, or trains. This should be decided on prior to the decision of the drilling
method. The distance of the transport between the ore pass and the underground
crusher or hoist shaft (depending on the mine design) will be the main cost
factor. This distance differs depending on the stope being mined. The decision
maker should consult the mine planning engineers to determine this distance
from all the production areas. As in the mucking process, the same factors make
this variable uncertain. Based on the provided data, a probability distribution
can be made to reflect the uncertainty.
The cost of crushing and milling is dependent on the technique used, for
example, gyratory crusher or jaw crusher. The cost is principally based on the
capacity of the crushed rock/time period. Oversized rock and uneven
fragmentation can also influence the capacity (throughput) of crushers. The
book Rock fragmentation by blasting: Fragblast 10 (Singh & Sinha, 2012 p
164) notes that an even powder factor (which controls the fragmentation) can
increase throughput by up to 25%. So, the cost of crushing and milling is
dependent on throughput, itself uncertain. The level of uncertainty can be
reflected with a probability distribution. Suppliers of equipment should be able

18
to provide the decision maker with the required input data for the probability
distributions.
The cost of haulage and separation are dependent on the technique used and the
fragmentation of the rock. For example, a very fine fragmentation will result in
a larger volume and less density. If the fragmentation is fine, the productivity
of the ore that can be hauled will be lower. This uncertainty can also be reflected
by a probability distribution.
6.1.14 Drilled meters/ton
The calculations are based on cost/ton, for example, $/ton ore. Therefore, the decision
maker needs to determine the number of drill meters per ton of ore. This depends on the
dimension of the drill hole. Larger dimensions equate to less drilled meters/ton. It also
depends on the orientation of the ore body and different designs equate to different
numbers of drilled meters (see Figure 2 for an understanding of drill design). The
decision maker needs to consult with drill and blast engineers and calculate the number
of drilled meters/ton based on different production areas in the mine. This will give
enough input data to reflect the uncertainty with a probability distribution.
6.2 Tornado diagram
Clemen and Reilly (2001, p 180-184) describe tornado diagrams as a special type of bar
chart where data categories are listed vertically instead of horizontally. Categories are
ordered such that the largest bar appears at the top of the chart, followed by the second
largest, and so on. These diagrams are useful for sensitivity analysis when comparing
the relative importance of variables given the variation in the variables. Tornado
diagrams show an uncertainty for each variable and enable the decision maker to
determine the minimum and maximum outcomes during a Monte Carlo simulation. In
other words, Tornado diagrams allow the decision maker to compare one-way
sensitivity analysis for many input variables at once. This allows the decision maker to
focus on the variable that has the highest effect on the results given the variation in each
variable. Figure 6, created in @Risk from Palisade, describes a general tornado diagram
where the variation in variable 1 had the highest effect on the results given the variation
in each variable.

19
Figure 6. A tornado diagram shows the variables on the Y-axis and the total cost value
on the X-axis. How large effect the variables had on the results given the variation in
each variable is shown.
7 Examples of Monte Carlo simulations
Calculations are set up in an excel spreadsheet in @Risk. The following tables (1 and
2) show the setup of the input variables and the probability distributions.
Table 1. Calculation spreadsheet of the Monte Carlo simulation showing the
common variables that are used in the calculations for all drilling methods.
Common variables for all drill methods Value Probability distribution / Formula
Factor 1 hour in minutes C3
Meters drilled/tonnage C4 Normal
Energy cost/Kwh (Dollar) ($) C5 Normal
Cost of operator/hour ($/h) C6
Utility factor during the drilling C7
Deviation-dilution factor C8 Normal
Deviation–ore loss factor C9 Normal
Deviation–unsuccessful blast factor C10 Pert
Mucking cost/t ($/t) C11 Normal
Transport cost/t ($/t) C12 Normal
Crushing cost/t ($/t) C13 Normal
Haulage cost/t ($/t) C14 Normal
Milling cost/t ($/t) C15 Normal
Separation cost/t ($/t) C16 Normal
Sum of processing costs C17 =C11+C12+C13+C14+C15+C16
Deviation-ore loss factor C18 Normal
Grade of the ore (ton ore/ton rock) C19 Normal
Price of the ore/t ($/t) C20 Normal
Ore loss from unsuccessful blast C21

20
Table 2. Calculation spreadsheet of the Monte Carlo simulation for all costs of
the drill methods.
Drill Method Value Probability distribution / Formula
Deviation C26 Normal
Service cost of the percussive unit ($) C28
Life span of the percussive unit (minutes) C29 Normal
Rate of penetration (m/minute) C30 Normal
Percussive unit cost/drilled meter ($/m) C31 =C28/(C29*C30)
Cost of the drill bits ($) C33
Life span of the drill bits (meters) C34 Normal
Drill bit cost/drilled meter ($/m) C35 =C33/C34
Cost of the drill rods ($) C37
Life span of the drill rods (meters) C38 Normal
Drill rods cost/drilled meter ($/m) C39 =C37/C38
Energy consumption (KWh) / h C41
Energy cost/drilled meter ($/m) C42 =(C41*C5)/(C30*C3)
Cost of operator/m ($/m) C44 =C6/(C30*C3*C7)
Direct cost of drilling/ton ($/t) C46 =(C31+C35+C39+C42+C44)*C4
Dilution C48 =C26*C8
Cost of dilution ($)/t C49 C48*C17
Ore loss C51 =C26*C9
Cost of ore loss ($)/t C52 =(C51*C19*C20)-(C51*C17)
Probability of unsuccessful blast (%) C54 =C26*C10
Additional cost of drilling/t ($/t) C55 =C46
Additional cost of blasting/t ($/t) C56 =C46
Loss of revenue/t ($/t) C57 =(C21*C19*C20)-(C21*C17)
Cost if unsuccessful blast $/t C58 =C55+C56+C57
Unsuccessful blast? C59 =RiskBinomial(1;C54)
Cost of unsuccessful blast $/t C60 =C58*C59
Top-Hammer Total cost/t ($/t) C62 =C46+C49+C52+C60

21
7.1 Calculations
Calculations are based on tables 1 and 2 from the previous section. Calculations are set
up identically for all three drilling methods. Methods to determine the variables used in
these calculations are explained in section 6.1.
7.2 Direct costs of drilling
The percussive unit or hammer cost/drilled meter ($/m) is calculated by dividing the
service cost of the percussion unit ($) with the product of the life span of the percussive
unit (minutes) and the ROP (m/minute):
C31 = C28/(C29*C30).
Drill bit cost/drilled meter ($/m) is calculated by dividing the drill bit cost ($) with the
life of the drill bit (m):
C35 = C33/C34.
Drill rods cost/drilled meter ($/m) is calculated by dividing the drill rod cost ($) with
the life span of the drill rod (m):
C39 = C37/C38.
Energy cost/drilled meter ($/m) is the product of the energy consumption and the energy
cost/kWh ($) divided by the product of the ROP (m/minute) and 60 (to convert from
minutes to hours):
C42 = (C41*C5)/(C30*C3).
The cost of operator/m ($/m) is calculated by dividing the cost of operator/hour ($/h)
with the product of utility factor during the drilling, the ROP (m/min), and 60 (to convert
from minutes to hours). The utility factor reflects an inconstant ROP during the drilling,
as drill rods and drill bits etc. must be changed. Hence, the actual amount of drilled
meters in a minute is lower compared to the capacity of the percussive unit:
C44 = C6/(C30*C3*C7).
The direct cost of drilling/ton ($/t) is the sum of the service cost of the percussion
unit/hammer per meter, the drill bit cost/drilled meter, the drill rod cost/drilled meter,
the energy cost/drilled meter, and the cost of the operator/drilled meter. The sum is
multiplied by the number of meters drilled/ton in order to convert the cost from m to
ton:
C46 = (C31+C35+C39+C42+C44)*C4.
7.3 Dilution cost
The dilution (%) is calculated by multiplying the deviation by the deviation-dilution
factor. This factor and is calculation are described in sections 5.3 and 6.1.4:
C48 = C26*C8.
The handling dilution cost/t ($/t) is the sum of the mucking cost/t, transport cost/t,
crushing cost/t, haulage cost/t, milling cost/t, and the separation cost/t:
C17 = C11+C12+C13+C14+C15+C16.
The dilution cost/t ($)/t is calculated by multiplying the dilution (%) by the handling
cost of dilution ($/t):
C49 = C48*C17.

22
7.4 Cost of ore loss
The ore loss (%) is calculated by multiplying the deviation by the deviation-ore loss
factor. This factor and its calculation are described in sections 5.3 and 6.1.4:
C51 = C26*C9.
The total loss of revenue - processing cost ($)/t is the product of ore loss (%), grade of
the ore (%), and price of the ore ($/ton), subtracted by the product of ore loss (%) and
the handling of dilution cost ($/t):
C52 = (C51*C19*C20)-(C51*C17).
7.5 Cost of an unsuccessful blast
The probability of having an unsuccessful blast is the product of the deviation (%) and
the deviation–unsuccessful blast factor. This factor and its determination is described in
section 6.1.5
C54 = C26*C10.
When the blast is unsuccessful, it is not likely that a second attempt to blast the ore will
recover all of the ore for various reasons. This is highly dependent on the circumstance.
Hence, the simplification discussed earlier, a fixed number (not an uncertainty
reflected), represents the ore loss (%) in an unsuccessful blast. To calculate the loss of
revenue, the product of ore loss (%), grade of the ore (%), and the price of the ore/t ($/t),
is subtracted by the product of ore loss (%) and the cost of handling dilution ($/t):
C57 = (C21*C19*C20)-(C21*C17).
The cost of an unsuccessful blast is the sum of the additional cost of drilling, additional
cost of blasting, and loss of revenues. As discussed, C55 and C56 (additional cost of
drilling and blasting) is the same cost as the initial cost of drilling (C46):
C58 = C55+C56+C57.
The probability of having an unsuccessful blast is used in a riskbinomial function to
represent the probability of having a successful or unsuccessful blast in the simulations.
The riskbinomial function generates the number of successful blasts in a sequence of n
independent trials when the probability of success, p, remains constant from trial to trial.
Hence, a probability (C54) needs to be used which is the product of deviation and the
influence factor of deviation and having an unsuccessful blast:
C59 = RiskBinomial(1;C54).
The cost of having an unsuccessful blast is the product of the cost of having an
unsuccessful blast and the riskbonomial function:
C60 = C58*C59.
7.6 To calculate the total cost/ton
The total cost/ton is the sum of the direct cost of drilling, cost of dilution, cost of ore
loss, and the cost of having an unsuccessful blast:
C62 = C46+C49+C52+C60.
7.7 Input values
Input values are used in the model to simulate a result based on the presented formulas.
The decision maker should determine the input values of each variable as described in
chapter 6. In this case, simulations are based on a hypothetical case, but the used input
values are based on experiences on several mine sites. The particular ore type in this
simulation is based on a lead ore with the mean reserve of 3% and the length of the drill

23
holes are 25 m (estimated deviations are used for this length). It is important to present
and analyze a simulated result for decision makers to understand the process, hence the
need for input values. Tables 3–6 describe the values used in the calculations. As the
values are based on data from mining operations in both northern Europe and Australia,
the results should be somewhat realistic. It important to note that the reader should not
make a general conclusion based on the results presented here, for example, that one
drilling method is more favorable, since it is very likely to differ from mine to mine.
Table 3. Input values of the common variables.
Common variables for all drilling methods Value Probability distribution
Factor 1 hour in minutes 60
Meters drilled/tonnage 0.05 Normal µ 0.05 σ 0.005
Energy cost/Kwh (Dollar) ($) 0.02 Normal µ 0.02 σ 0.002
Cost of operator / hour ($/h) 10.00
Utility factor during the drilling 50%
Deviation-dilution factor 0.25 Normal µ 0.25 σ 0.025
Deviation-ore loss factor 0.25 Normal µ 0.25 σ 0.025
Deviation-unsuccessful blast factor 1.5 Pert min 0, mean 1.5, max 3
Mucking cost/t ($/t) 2.00 Normal µ 2 σ 0,2
Transport cost/t ($/t) 0.70 Normal µ 0.7 σ 0.07
Crushing cost/t ($/t) 2.50 Normal µ 2.5 σ 0.25
Haulage cost/t ($/t) 1.00 Normal µ 1 σ 0.05
Milling cost/t ($/t) 4.50 Normal µ 4.5 σ 0.45
Separation cost/t ($/t) 2.00 Normal µ 2 σ 0.1
Sum of processing costs 12.70
Deviation-ore loss factor 0.25 Normal µ 0.25 σ 0.025
Grade of the ore (ton ore/ton rock) 0.03 Normal µ 0.03 σ 0.003
Price of the ore/t ($/t) 1750.00 Normal µ 1750 σ 175
Ore loss from unsuccessful blast 5%

24
Table 4. Input values of the Top-hammer drilling method to simulate a result
Top-Hammer drilling method Value Probability distribution
Deviation 4 % Normal µ 0.04 σ 0.004
Service cost of the percussive unit ($) 10000.00
Life span of the percussive unit (minutes) 14000.00 Normal µ 14000 σ 0.1400
Rate of penetration (m/minute) 1.00 Normal µ 1 σ 0.1
Percussive unit cost/drilled meter ($/m) 0.71
Cost of the drill bits ($) 400.00
Life span of the drill bits (meters) 500.00 Normal µ 500 σ 50
Drill bit cost/drilled meter ($/m) 0.80
Cost of the drill rods ($) 180.00
Life span of the drill rods (meters) 1000.00 Normal µ 10000 σ 100
Drill rods cost/drilled meter ($/m) 0.18
Energy consumption (KWh) / h 100.00
Energy cost/drilled meter ($/m) 0.03
Cost of operator/m ($/m) 0.33
Direct cost of drilling/ton ($/t) 0.10
Dilution 1 %
Cost of dilution ($)/t 0.13
Ore loss 1 %
Cost of ore loss ($)/t 0.40
Probability of unsuccessful blast (%) 0.02
Additional cost of drilling/t ($/t) 0.10
Additional cost of blasting/t ($/t) 0.10
Loss of revenue/t ($/t) 1.99
Cost if unsuccessful blast $/t 2.20
Unsuccessful blast? 0.00
Cost of unsuccessful blast $/t 0.00
Top-Hammer Total cost/t ($/t) 0.63

25
Table 5. Input values of the pneumatic DTH-hammer drilling method to simulate
a result
Pneumatic DTH-hammer drilling method Value Probability distribution
Deviation 2 % Normal µ 0.02 σ 0.002
Service cost of the percussive unit ($) 7500.00
Life span of the percussive unit (minutes) 6000.00 Normal µ 6000 σ 600
Rate of penetration (m/minute) 0.80 Normal µ 0.8 σ 0.08
Percussive unit cost/drilled meter ($/m) 1.56
Cost of the drill bits ($) 400.00
Life span of the drill bits (meters) 500.00 Normal µ 500 σ 50
Drill bit cost/drilled meter ($/m) 0.80
Cost of the drill rods ($) 180.00
Life span of the drill rods (meters) 15000.00 Normal µ 15000 σ 1500
Drill rods cost/drilled meter ($/m) 0.01
Energy consumption (KWh) / h 200.00
Energy cost/drilled meter ($/m) 0.08
Cost of operator/m ($/m) 0.42
Direct cost of drilling/ton ($/t) 0.14
Dilution 0.5 %
Cost of dilution ($)/t 0.06
Ore loss 0.5 %
Cost of ore loss ($)/t 0.20
Probability of unsuccessful blast (%) 0.01
Additional cost of drilling/t ($/t) 0.14
Additional cost of blasting/t ($/t) 0.14
Loss of revenue/t ($/t) 1.99
Cost if unsuccessful blast $/t 2.28
Unsuccessful blast? 0.00
Cost of unsuccessful blast $/t 0.00
Pneumatic DTH Total cost/t ($/t) 0.41

26
Table 6. Input values of the hydraulic DTH-hammer drilling method to simulate
a result
Hydraulic DTH-hammer drilling method Value Probability distribution
Deviation 1 % Normal µ 0.01 σ 0.001
Service cost of the percussive unit ($) 15000.00
Life span of the percussive unit (minutes) 5000.00 Normal µ 5000 σ 500
Rate of penetration (m/minute) 0.80 Normal µ 0.8 σ 0.08
Percussive unit cost/drilled meter ($/m) 3.75
Cost of the drill bits ($) 600.00
Life span of the drill bits (meters) 500.00 Normal µ 500 σ 50
Drill bit cost/drilled meter ($/m) 1.20
Cost of the drill rods ($) 300.00
Life span of the drill rods (meters) 30000.00 Normal µ 30000 σ 3000
Drill rods cost/drilled meter ($/m) 0.01
Energy consumption (KWh) / h 100.00
Energy cost/drilled meter ($/m) 0.04
Cost of operator/m ($/m) 0.42
Direct cost of drilling/ton ($/t) 0.27
Dilution 0.25 %
Cost of dilution ($)/t 0.03
Ore loss 0.25 %
Cost of ore loss ($)/t 0.10
Probability of unsuccessful blast (%) 0.01
Additional cost of drilling/t ($/t) 0.27
Additional cost of blasting/t ($/t) 0.27
Loss of revenue/t ($/t) 1.99
Cost if unsuccessful blast $/t 2.53
Unsuccessful blast? 0.00
Cost of unsuccessful blast $/t 0.00
Hydraulic DTH Total cost/t ($/t) 0.40

27
8 Analysis of the results
As described in chapter 7, the input values used in the calculations are based on data
from mining operations in Northern Europe and Australia to produce a more realistic
result to analyze. Figures 7–9 show the simulation results of the total cost/ton.
Figure 7. Probability density graph showing the total cost/ton of each drilling method.
Figure 8. A cumulative distribution function (CDF) shows the total cost/ton of each
drilling method.

28
Figure 9. A CDF shows the total cost/ton of each drilling method, zoomed in version of
Figure 8.
None of the drilling methods presented in Figures 7–9 have deterministic dominance,
as in Figures 4 and 5. First-order stochastic dominance occurs for the Pneumatic and
Hydraulic DTH-hammer over the top-hammer, which Clemen and Reilly (2001, p 134-
135) describe as occurring if the graphs simulation results do not cross and there is space
between the curves. That is, if a graph of two cumulative simulation results are such
that no part of alternative 1 lies to the left of alternative 2, and at least some part of it
lies to the right of alternative 2, then alternative 1 stochastically dominates alternative
2. The hydraulic DTH-hammer has the lowest mean value, while the top-hammer has
the highest mean value.
It can also be interesting to break down the total cost/ton into the four different costs
described in the previous chapter: direct cost of drilling, cost of dilution, cost of ore loss,
and cost of having an unsuccessful blast. Table 7 shows these costs.
Table 7. Costs from simulations for each drill method.
Costs ($/t) Top Hammer Pneumatic DTH Hydraulic DTH
Direct cost of drilling 0.096 0.146 0.276
Cost of dilution 0.127 0.063 0.032
Cost of ore loss 0.398 0.199 0.099
Cost of unsuccessful blast 0.136 0.064 0.038
Total cost 0.75 0.47 0.44
The mean values of the simulation results presented in Table 7 are also shown is
Figures 10–12. It can be useful for the decision maker to analyze each cost to understand
the total cost picture. It can also be interesting to compare the direct cost of drilling, cost
of dilution, cost of ore loss, and cost of having an unsuccessful blast between the
different drilling methods. Figures 10–12 show results of such simulations.

29
Figure 10. A CDF shows the direct cost of drilling/ton for each drilling method.
Figure 11. A CDF shows the cost of dilution/ton for each drilling method.

30
Figure 12. A CDF shows the cost of ore loss/ton for each drilling method.
Based on the values from the simulation results given in Figures 10–12 and Table 7,
it is clear that the top-hammer method is the cheapest drilling method in terms of direct
costs of drilling, but also the most expensive method in terms of indirect costs, the
opposite of the hydraulic DTH hammer. These kinds of presentations can help a
decision maker understand how costs are allocated between different drilling methods.
The cost/ton value has a very wide range and the maximum value is 10–20 times
higher than the minimum value. The wide range of the cost/ton value depends on what
parameter values and input values that were used in the calculations. The values used in
the binomial function that was used to represent the success of the blast generates values
for either a successful or unsuccessful blast which will also contribute to the wide range
of cost/ton value. Such wide range of the cost/ton value is a severe risk for the decision
maker. If an unsuccessful blast generates the maximum cost values, the cost is likely to
be above the breakeven point (when the cost is as high as the revenue). If the risk of
having an unsuccessful blast cannot be decreased, it can be useful to analyze graphs to
determine the probability of a certain cost interval. For example, if the breakeven point
for the particular mine is 0.46 $/ton in terms of drilling cost, the following functions can
be used based on the input values and cells from previous tables. Figure 13 shows graphs
of the functions below by setting the 0.46 value at the delimiters at the top of the figure.
These functions calculate the probability of having a cost below the given cost (0.46
$/ton) based on simulation results:
Top-hammer = RiskTarget (C62,0.46) = 5% (see Table 4)
Pneumatic DTH-hammer = RiskTarget (G62,0.46) = 84.5% (see Table 5)
Hydraulic DTH-hammer = RiskTarget (K52,0.46) = 88.5% (see Table 6)

31
Figure 13. A CDF shows simulations for each drilling method where the probability of
having a cost below 0.46 $/t is presented. By adjusting the vertical line to 0.46, the
same values can be viewed directly in the graph.
These breakeven values can be useful as an efficient way to determine which drilling
methods to eliminate as alternatives. In this example, it is unlikely that the top hammer
would be a more appropriate drilling method than the other two alternatives if the
probability of having a drill cost below the breakeven point is 5%.
8.1 Sensitivity analysis
To further analyze the uncertainty of the decision problem, regarding how large effect
the variables have on the results given the variation in each variable, tornado diagrams
can be used, as described in chapter 6.2, to perform a sensitivity analysis. It is important
to understand that tornado graphs in the current study are based on the input values used
for these simulations, which means how large effect the variables have on the results
given the variation in each variable will be different depending on the input values that
are used.
Figure 14 shows how large effect the variables had on the results given the variation
in each variable with the top-hammer drilling method. The variable “Successful blast?”
shown in Figure 14 was the variable that had the largest effect on the results given the
variation in each variable, followed by the price and grade of the ore variables. In the
current study, the decision maker should prioritize to focus on these variables since they
had the largest effect on the results given the variation in each variable. By decreasing
the variation of the value of the variable, the effect the variable had on the result would
be decreased. For example, if drill and blast tests were done and the drill hole deviation
was measured, the variation of the variable “successful blast?” shown in Figure 14 will
be decreased.
The effect on the results given the variation of the grade of the ore can be decreased by
drilling additional exploration holes and analysing retrieved core samples. However,
such activities would require resources. That would be an additional decision to make,
namely, whether or not additional input data for the decision model is desirable.

32
Figure 14. Tornado diagram showing how large effect the variables had on the results
given the variation in each variable with the top-hammer drilling method.
For the pneumatic DTH-hammer (described in Figure 15) and the hydraulic DTH-
hammer (described in Figure 16), the cost of an unsuccessful blast is also the variable
that had the highest effect on the results given the variation of each variable. The price
of the ore is the variable that had the second highest effect on the results given the
variation of each variable with the pneumatic DTH-hammer while the amount of drill
meters/ton and ROP had a higher effect on the results with the hydraulic DTH-
hammer giving the variation used in the model. This is likely explained by the fact that
the direct cost of drilling is higher with the hydraulic DTH hammer compared to other
drilling methods.
Figure 15. Tornado diagram showing how large effect the variables had on the results
given the variation in each variable with the pneumatic DTH-hammer drilling method.

33
Figure 16. Tornado diagram showing how large effect the variables had on the results
given the variation in each variable with the hydraulic DTH-hammer drilling method.
To analyze how large effect a variation of the deviation–unsuccessful blast factor
have on the results, a sensitivity analysis can be performed, by performing the
simulation several times with different values for this factor. The values used are based
on the pert distribution shown in Figure 17 and values from the 5%, 50% and 95%
fractiles are used.
Figure 17. Pert distribution of the deviation–unsuccessful blast factor.
Following this, three different values for the deviation–unsuccessful blast factor
were used and separate simulations completed. Table 8 describes the different values of
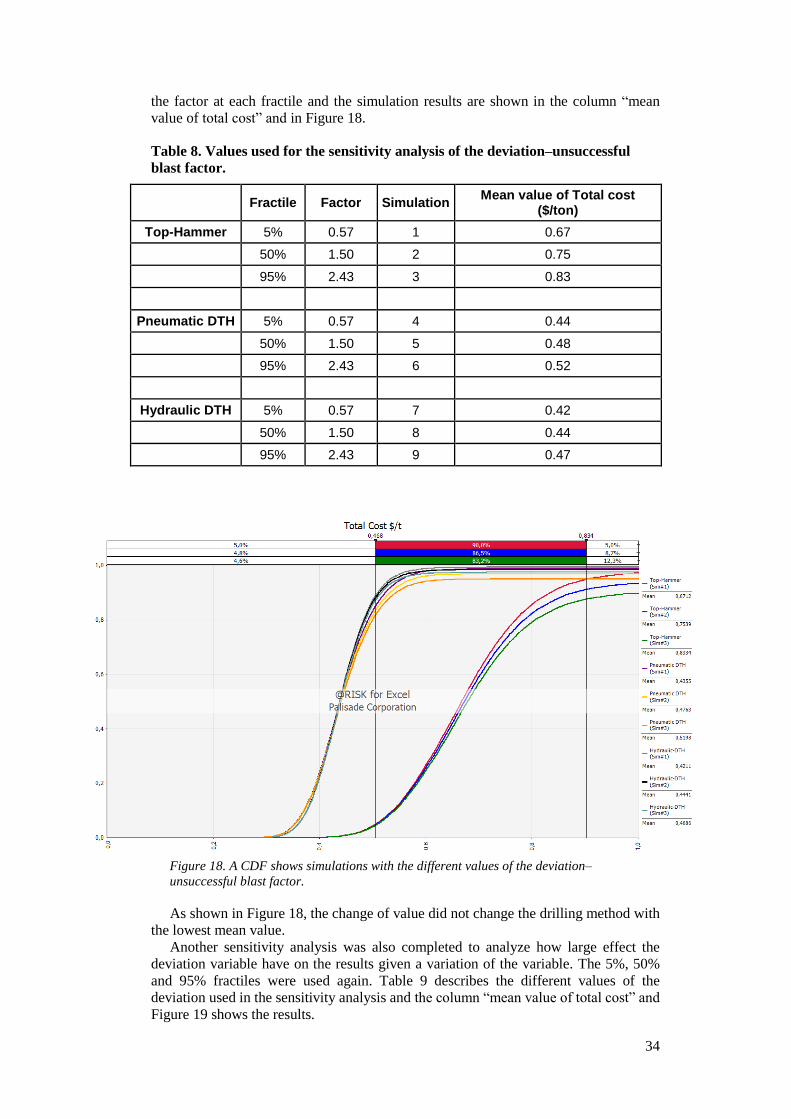
34
the factor at each fractile and the simulation results are shown in the column “mean
value of total cost” and in Figure 18.
Table 8. Values used for the sensitivity analysis of the deviation–unsuccessful
blast factor.
Fractile Factor Simulation Mean value of Total cost
($/ton)
Top-Hammer 5% 0.57 1 0.67
50% 1.50 2 0.75
95% 2.43 3 0.83
Pneumatic DTH 5% 0.57 4 0.44
50% 1.50 5 0.48
95% 2.43 6 0.52
Hydraulic DTH 5% 0.57 7 0.42
50% 1.50 8 0.44
95% 2.43 9 0.47
Figure 18. A CDF shows simulations with the different values of the deviation–
unsuccessful blast factor.
As shown in Figure 18, the change of value did not change the drilling method with
the lowest mean value.
Another sensitivity analysis was also completed to analyze how large effect the
deviation variable have on the results given a variation of the variable. The 5%, 50%
and 95% fractiles were used again. Table 9 describes the different values of the
deviation used in the sensitivity analysis and the column “mean value of total cost” and
Figure 19 shows the results.

35
Table 9. Values used for the sensitivity analysis of the deviation.
Fractile Deviation Simulation Mean value of Total cost
($/ton)
Top-Hammer 5% 3.34% 1 0.65
50% 4.0% 2 0.75
95% 4.66% 3 0.86
Pneumatic DTH 5% 1.67% 4 0.42
50% 2.0% 5 0.48
95% 2.33% 6 0.53
Hydraulic DTH 5% 0.84% 7 0.42
50% 1.0% 8 0.44
95% 1.16% 9 0.47
Figure 19. A CDF shows the simulations with the different values of the deviation.
By comparing the mean values in Figure 19, the change in deviation did not change
the drilling method with the lowest expected cost/ton.
9 The choice of drilling method as a multi-criteria decision problem
Besides the cost criterion that the study has mainly focused on, other criteria associated
with the drilling process are important for the decision maker. For example, many large
mining companies work with Environment, Health, and Safety (EHS) processes (EHS
Data, 2016), which indicate that EHS procedures should be integrated into all processes
of the mining operation. Thus, it makes sense that decision analysis should also include
how these different criteria influence the choice of different drilling methods. The
following sections discuss some of the criteria.

36
9.1 Safety criterion
Coleman and Kerkering (2007, p 1) describe that it is common for injuries to be
measured with the Lost-Time Injury (LTI) scale which measures the number of injuries
during a certain number of worked hours. This value can also reflect an indication of
risk in the work environment. In risk management, there are several methods to improve
the work environment by handling risks in different ways. Mattsson (2003, p 344)
describes risk management, suggesting one method to approach risk is to decrease
exposure to the risk. If a work task can be completed more quickly, for example, by
substituting a drilling method for another drilling method, risk exposure to certain risks
can be decreased. For example, in underground production drilling, there is always a
risk that a rock fall appears near the production front, which means a potential risk that
the drill rig and operator will be buried under the rock. By completing the job more
quickly, controlled by the ROP in this case, risk exposure would be lower. The top-
hammer drilling method likely has the highest ROP which means that it would reduce
time exposure to certain risks. However, as described in chapter 6.1.13, Singh and Sinha
(2012, p 164) note that an even fragmentation of the rock can increase productivity in
the subsequent processes (such as crushing) by up to 25%. The top-hammer drilling
method is more likely to have higher deviation than other, comparable drilling methods,
hence the overall risk exposure may be higher for this alternative, despite the higher
ROP. This demonstrates the importance of analyzing the consequences of drill deviation
rather than simply direct safety aspects around drilling.
If the decision maker receives additional information regarding how drill hole
deviation influences fragmentation (not included in the decision analysis), a scenario
can be simulated to estimate how much additional time a certain deviation would yield
for the subsequent processes. If the capacity of the crusher, for example, is 100 tons/hour
under the best circumstances, uneven fragmentation results in a maximum capacity of
80 tons/hour, and there would be an additional 15 minutes of crushing to crush a total
of 100 tons. This means that exposure to risks associated with crushing increases. The
value of risk exposure could be calculated with a Monte Carlo simulation in a similar
set up as with the cost criterion.
Besides risk reduction, the decision maker has to evaluate whether drilling methods
will eliminate or substitute risks associated with the drilling process. One of the
hydraulic DTH-hammer suppliers’ website (Wassara, 2016b) describes that if a high-
pressure water hose (used to transport water from the pump to the DTH-hammer) should
fail, the pressure immediately disappears. Just like a garden hose, the supplying hose
will lose the stiffness created by the high-pressure water. A failing hose used for air-
powered drilling (compressed air) will act like a powerful whip, generating high risk of
harm to both equipment and people. This could also be reflected in calculations as it is
likely that the hydraulic DTH hammer eliminates this particular risk. The methods also
differ in that the top-hammer and pneumatic DTH-hammer use compressors to
compress air, while the hydraulic DTH-hammer uses a pump to power the percussive
unit. One possible risk with great consequences in underground mining is fire. The
decision maker should compare the probability of a compressor and a water pump
beginning a fire. By using one of the techniques, the risk can be reduced through
substitution.
9.2 Environmental criterion
Environmental criterion, an aspect of the EHS process, includes many different aspects.
This means the decision maker must define the concepts to make decision analysis
possible. The environment is included in concepts of sustainability which many mining
companies refer to in their policies. Morelli (2011, p 2) notes that sustainability is often
described by three pillars or three legged approaches, consisting of economy, society,
and environment. Brundtland (1987, p 16) defines sustainable development as
development that meets the needs of the present without compromising the ability of

37
future generations to meet their own needs. The following paragraphs are based on a
review on sustainable mining practices completed by Kumar (2014). The review is
based on concepts from the Brundtland report and discusses how the mining industry
can implement the concepts. Hence, the review contains the opinions of the author
which are yet to be considered widely accepted within the mining industry.
Kumar (2014, p 26-27) describes that mining can become more environmentally
friendly and sustainable by adopting and integrating innovative technology, social,
environmental, and economic developments that minimize the environmental impact of
mining operations. One of these commonly measured factors is the amount of energy
used in the mining process. Sustainable development in this sector suggests a concept
of needs, an idea of limitations, an oriented paradigm, and a process of change.
Kumar (2014, p 27) further describes that for a mining company to achieve
sustainability, it needs to be economically viable, financially cost effective, and
technically efficient or even innovative. This enables the mining company to maintain
continuous, environmental, socio-economic improvements. In operational terms,
sustainable development in the mining sector implies a mix of scientific mining,
technological developments, environmental responsibility, socioeconomic development
in local communities, stakeholder engagement, and transparency in communication.
These are the necessary underlying factors to ensure the growth and sustainability of the
industry. Modes to achieve sustainable mining can be narrowed down to two aspects.
The people who are responsible for deciding the most appropriate mining method
(scientific mining) will indirectly determine the technology to be used (technological
advancement).
Kumar (2014, p 27) also describes that the objective or purpose of scientific mining
is primarily to improve the environmental impact and concerns which include
innovative mining methods and practices originating from a systematic approach to
mine development and operations. This involves a continuous development of
technology reflected in equipment advances and management practices. In the
technology advancement process, it is common that mining companies encourage
suppliers to develop innovative solutions to the mining industry that will empower
technological advancement and contribute to a more sustainable mining process.
Some criteria are easier to measure and simulate, for example, energy consumption,
which can be simulated with a Monte Carlo simulation in a similar set up as the cost
criterion. Another aspect of the environmental criterion for this decision analysis could
be negative aspects, such as contaminated water from hydraulic DTH hammer drilling
methods, compared to compressed air with a higher energy cost from pneumatic DTH
hammer drilling methods.
9.3 Multi-criteria decision analysis under uncertainty
When analyzing decisions under uncertainty, a choice or decision has to be made
regarding how the uncertainty is modeled. A large number of potential approaches to
handle uncertainty within MCDA exist. Durbach and Stewart (2012, p 2) reviewed the
process of modeling uncertainty in MCDA. Due to the large number of models that
exist, they organized the review around two main themes: formal models for
representing preferences under uncertainty, and the assessment of judgments about
uncertain outcomes and preferences associated with these outcomes. Within these
themes, they found five uncertainty formats that account for most of the published work
on the subject. The five formats are decision weights, probabilities, explicit risk
measures, fuzzy numbers, and scenarios. The probabilities approach could be useful for
the current study’s MCDA because it is partially based on Monte Carlo simulations.
I will not further describe how these MCDA methods can be used for this particular
decision. The section serves as a useful guide for decision makers in terms of how to
proceed with MCDA if the decision requires criteria with uncertainty other than the cost
criterion.

38
10 Discussion
I personally believe that the use of decision analysis will become increasingly common
in the mining industry. As presented in this thesis, underground mining processes
consist of many uncertainties and it is challenging to design a simulation because
production varies from area to area, unlike manufacturing plants with fixed machinery.
I believe that decision analysis will become more common because of changes that the
mining industry is currently facing and experiences. These changes include moves
towards automation by adapting to lean principles and turning relatively uncontrolled
production into leaner controlled production. Rio Tinto is one of the largest mining
companies and its CEO, Sam Walsh, reinforced in an interview (Mining global, 2014)
the importance of working with lean principles in the mining industry. Lean production
principles in the mining industry enable better circumstances for the use of decision
analysis because the processes are measured and standardized over time. This likely
reduces the degree of uncertainty and also provides decision makers with better
circumstances to design more representative decision models based on a mine.
One challenge this thesis demonstrates is how processes influence other processes in
a mine. It is challenging to narrow down the decision problem by only analyzing the
cost of the drill process because the results of the drilling influence the subsequent
processes. Based on the input values used, the simulation results demonstrates that
indirect costs of drilling could be higher compared to direct costs of drilling. I believe
that Monte Carlo simulations are an efficient method to calculate and demonstrate this
aspect. Tornado diagrams show that the uncertainty surrounding an unsuccessful blast
is the uncertainty causing the largest variation in cost. The unsuccessful blast variable
is based on the product between the deviation and the factor that describes how drill
hole deviation influences the risk of having an unsuccessful blast. The decision makers
should be careful to suggest that factors such as deviation of the blast hole determine
the decision because other aspects may be more important. For example, the deeper the
mine is, the more expensive it may be to handle dilution, which means the operational
cost for handling dilution may be the main determinant. More importantly, the decision
maker also needs to evaluate whether uncertainty (variation of value from the baseline)
is modeled correctly for a particular decision and its circumstances. If not, the
simulation results shown in the tornado graphs can be misleading in terms of how large
effect the variables have on the results given the variation in each variable.
It is also important to evaluate how useful the decision analysis model (based on the
calculations) is in its current state, or if delimitations and simplifications make the
calculations inaccurate. When evaluating the probability of an unsuccessful blast, it is
important to evaluate whether the probability is reasonable. As in this example, the
mean value of 4% deviation of the top-hammer yields in a 6% probability of having an
unsuccessful blast due to the deviation. This rate of unsuccessful blasts, based on
personal experiences, appears reasonable for sub level stoping, especially for narrow
stopes which are more likely to freeze compared to wider stopes. Although, the decision
maker still needs to evaluate how often a blast freezes from other factors. If a mine
usually experiences 10% freezes (which appears to be a high number), the calculations
above that yields in a 6% probability of having an unsuccessful blast due to drill hole
deviation suggest that 60% of unsuccessful blasts would be due to hole deviation and
the other 40% for other reasons.
As explained in section 1.4, calculation of ore loss during an unsuccessful blast were
simplified to be 5% in the simulations. This will vary from blast to blast and it also
impacts the total cost. The deviation of the unsuccessful blast factor is likely to be
different depending on the dimension of the stope in terms of width and height. Often
stope width for a mine is similar unless the ore body has a varied width and the height
is determined by the mine design. Also, the additional cost of an unsuccessful blast was
simplified, as I used the same direct drill cost/ton for re-drilling the stope, and the cost
of the additional blast was set to the same value. From my personal experience, the cost

39
of drilling and the cost of charging are similar, but certainly this will be different for
every mine and depends on the dimensions used.
The factor that describes how drill hole deviation influences dilution and ore
recovery is certainly important for the decision. As described, the factor used in this
decision analysis to some extent simplified. It is possible to calculate the factor to some
degree of certainty, as explained in chapter 5, but other factors (such as rock condition)
will also influence this factor, as explained in section 6.1.4. Hence, the deviation of the
dilution and ore recovery factor can vary depending on ground conditions.
The mine could also design the drill and blast designs to include redundancy for the
drill hole deviation, which means deviation would only cause additional dilution. For
example, if an ore-body is 3 m in width, the stope width would usually be designed to
be 3.5 m to ensure that all of the ore is recovered by the blast. Although, severe drill
hole deviation will still cause ore loss. By designing with drill hole redundancy, the
stope width could instead be 5 m, meaning a severe amount of dilution would be mined
but minimum amount of ore loss would be achieved. In fact, this could be another
valuable decision analysis. By increasing the drilled meters/ton to avoid the probability
of having unsuccessful blasts and ore loss due to deviation, would the additional direct
cost of drilling and dilution be lower than the cost of having an unsuccessful blast and
ore loss? Performing drill and blast tests and measuring the results over time would
likely be a useful approach.
It is interesting but challenging to determine which drilling method is the most
environmentally friendly. Even when reducing this to energy consumption, it will be a
discussion. Reducing energy consumption of a single process is favorable. However,
the drilling method that may be the most energy effective (the hydraulic DTH-hammer)
method consumes significant volumes of clean water and fresh water becomes
contaminated in the drill process. Clean water is a limited resource in many areas and
the decision as to whether high energy consumptions or contamination of fresh water
has the largest, negative impact on the environment needs to be analyzed. The answer
to this question may be on a governmental level with many stakeholders. Although, it
is important for the mining company to determine if their vision or policy includes
environmental responsibility.
10.1 Further recommendations
In this study, simplifications of important variables, such as how drill hole deviation
influences dilution, ore recovery, and the overall success of the blast, have been
necessary. How severe the described simplifications needs to be will vary from mine to
mine depending on available data, but I still believe that research in this field could
minimize some of these simplifications and uncertainties and would be valuable for
most underground mines that mine adjacent to ore boundaries. The research could be
completed by larger mining companies with comprehensive studies of how the drill hole
deviation influences other variables. For example, the delimitation regarding how drill
hole deviation effects the fragmentation could be eliminated if sufficient data on how
drill hole deviation effects the fragmentation existed. Such data would be valuable for
decision makers. The lack of such research may be explained by a lack of knowledge,
an underestimation by the mining industry of the importance of how straight a hole
needs to be, for example, that drilling a blast hole with 5% deviation may be straight
enough. Perhaps deviation influences dilution and ore loss less than what the values of
the factors used in these calculations present. From my own experience, calculating how
drill hole deviation influences dilution and ore control in such way is quite accurate.
Standardizing the production (such as lean principles) will further improve
circumstances for decision makers to make a meaningful decision model. As described,
the challenge is with processes that influence subsequent processes. I believe a
comprehensive decision model could be advantageous with input variables for all
processes included. Significant amounts of resources would be needed to accomplish
40
this. It would be meaningful if the policy of a company stated that all of important
decisions regarding production process were to be taken with decision analysis
methodology.
For mining companies that want to analyze a specific decision, like the decision
problem in this thesis, an experienced decision analysis consultant within the field
would be a good alternative. Even if the decision analysis consultant does not have
proper mining knowledge, this should not be a limitation because mining engineers can
provide the necessary information for the consultant. Complex decisions usually have
many stakeholders and it is important that all are involved in the decision analysis
process.
The mining industry would benefit greatly from decision analysis, just as in other
industries, as it increases the chance that decision makers make decisions with the
greatest confidence. Perhaps a “political commission” could enhance this development
even further. An example of a similar initiative is the innovation partnership
commenced (European commission, 2014) on raw materials with the overall objective
of joining efforts with other stakeholders to make Europe an even more competitive and
sustainable society. The mining industry is an important supplier of efficient and
sustainable solutions to meet the needs of modern society for metals and minerals. Safe,
lean, and green technology, and an innovative organization should attract talented young
men and women to meet the sizable, future challenges and opportunities of mineral
supply. The specific objective in this partnership is to review existing research and
projects regarding sustainable mining and prepare a roadmap for a future research
program. The pre-study completed in 2014 demonstrated a coherent and effective
programme that can support sustainable development in the mining sector. The future
programme will focus on the core of sustainable development in the mining sector and
be useful for mining companies that wish to integrate sustainability issues into their
operations and strategies. It will not be targeted directly to leaders of mining
corporations. Moreover, policy leaders on national, regional, and local levels will be an
important target group.
11 Conclusion
Many variables with uncertain values are included in the decision analysis presented
and they affect subsequent processes, resulting in indirect costs. The variables with
uncertain values presented in this study are likely to be uncertain in most cases regarding
this decision problem. The indirect costs are not easily available for reflection when the
prices of drilling equipment are presented. Hence, the use of decision analysis
methodology for this decision problem is favorable since it enables decision makers to
structure decisions and focus on variables that had the highest effect on the results given
the variation in each variable. For example, if the grade of the ore variable had the
highest effect on the results given the variation in each variable, the decision maker
should prioritize to reduce the uncertainty of this variable. By doing that, the variation
of the variable will be decreased, hence decreasing the effect it had on the result.
This thesis was completed to demonstrate how drill hole deviation affects indirect
costs, such as cost of handling dilution, cost of ore loss, cost of having an unsuccessful
blast, and how large indirect costs can be in relation to direct costs of drilling, often
presented when drilling methods are compared (see chapter 7 for the indirect and direct
costs). The results, based on a method presented for determining how drill hole
deviation influences indirect costs with input values from existing mining operations,
show that indirect costs are much higher than direct costs. Like the results presented by
Olsen (2009, p 89) for open pit mining, drilling straighter holes is economical profitable.
In this case, the top-hammer drilling method, which has the highest drill hole deviation,
results in the largest cost per ton, even if the actual direct drill cost per ton was the
lowest. As explained, it would be too generalized to make such conclusions as they will
vary from mine to mine for underground mining.

41
As discussed in section 1.2, a specific drill hole length (associated with a deviation)
can often act as a rule of thumb for which drilling method to use. For example, for a 25
m drill hole, it is likely that top-hammer drilling would be recommended because it is
explained by manufacturers as the cheapest drilling method in terms of drill
consumables, the quickest drilling method in terms of ROP, and has a drill hole
deviation less than 5% (see chapter 4 for drill hole deviation among drilling methods).
This likely sounds like a good alternative for the decision maker. However, the
simulation results presented in this thesis, based on the input values and simplifications,
shows that drilling methods with low deviation at an higher consumable cost and
decreased ROP can be more favorable in terms of total cost/ton. Although it is unlikely
that a general conclusion can be reached and many of simplifications and uncertainties
should be reduced. For example, for any drill hole that is under 15 m in length, the
difference in drill hole deviation between drilling methods would likely be so small that
the top-hammer drilling method would be most cost efficient. However, if the ore mined
is an ore of an exceptionally high grade and price, the most appropriate drilling method
could again differ. Each decision will be unique.

42
References
Aalizad, S.A., Rashidenejad, F. (2015). Prediction of penetration rate of rotary non-
percussive drilling using artificial neural networks. Arch. Min. Sci. 57(3), 715-728
Atlas Copco (2014). Underground mining: A global review of methods and practices.
Brundtland (1987). Our Common Future: Report of the 1987 World Commission on
Environment and Development, Oxford, Oxford University Press
Clemen, R. T., Reilly, T. (2001). Making hard decisions. 2nd edition. Duxbury Thomson
Learning
Coleman, P. J., Kerkering, J. C. (2007) Measuring mining safety with injury statistics:
Lost workdays as indicators of risk. National institute for occupational Safety and
health, Spokane research Laboratory 38(5), 523-533.
Durbach, I. N., Stewart, T. J. (2012). Modeling uncertainty in multi-criteria decision
analysis. European Journal of operational research 223(1), 1-14
EHS Data (2016). Managing environmental impacts can create a significant burden for
mining companies
http://ehsdata.com/articles/managing-environmental-impacts [2016-06-21]
European Commission (2014). Sustainable mining
https://ec.europa.eu/growth/tools-databases/eip-raw-materials/en/content/sustainable-
mining [2016-02-12]
Hammond, J. S., Keeney, R. L., Raiffa. H. (2002). Smart choices: A practical guide to
making better decisions. Harvard Business School Press
Hoek, E. (2006). Practical rock engineer. Bawden
Hustrulid, W. A. (2001). Underground mining methods: Engineering fundamentals and
international case studies. SME
Kumar, P. N. (2014). Review on sustainable mining practices. International Research
Journal of Earth Science, 2(10), 26-29
Lundberg, J., AL-Chalabi, H., Hoseinie, S. H. (2016). Monte Carlo reliability simulation
of underground drill rig. Springer. Lecture Notes in Mechanical Engineering, 633-643
Lunenburg, F.C (2003). The power of intuition: how to use your gut feeling to make
better managerial decisions, Sam Houston State University
Mattsson, B. (2003). Att värdera risker. In B. Grimwall, G., Jacabsson, P., Thedeen, T
Risker I tekniska system, (p 339-363). Studentlitteratur AB

43
Mining global. (2014). Interview with CEO of Rio Tinto, Sam Walsh, Lean production
http://www.miningglobal.com/operations/522/How-to-Implement-Lean-Principles-in-
the-Mining-Industry [2016-05-16]
Morelli, J. (2011). Environmental Sustainability: A Definition for Environmental
Professionals, Journal of Environmental Sustainability -Volume 1, 2
Olsen, V. (2009). Rock Quarrying Prediction models and Blasting safety, Norwegian
University of Science and technology
Palisade. (2016). Presentation of the software @Risk
http://www.palisade.com/risk/ [2016-05-16]
Parmodh, A. (2009). A handbook of minerals crystals, Rocks and ore. NIPA
Singh, P.K., Sinha, A.A. (2012). Rock fragmentation by blasting: Fragblast 10. CRC
Press
Spathis, A., Gupta, R.N. (2012). Tunneling in rock by drilling and blasting. CRC Press
Tatiya, R. R. (2013). Surface and underground excavations: Methods, Techniques and
Equipment. CRC Press
The Oxford dictionary. (2016). Definition of a Monte Carlo simulation
http://www.oxforddictionaries.com/definition/english/monte-carlo-method [2016-05-
16
Thompson, M.J (2010). M.Sc. thesis: Hydraulic hammer drilling technology to replace
air hammer drilling in deep BHE design, The school of renewable energy science
Vargas, J. P., Koppe, J. C., Pérez, S., Juan, P. (2015). Planning tunnel construction using
Markov Chain Monte Carlo. Mathematical Problems in Engineering. Volume 2015, 1-
8
Wassara (2016a). Case study San Geromino mine.
http://www.wassara.com/en/Applications/Case-studies/San-Geromino-mine-Chile/
[2016-06-20]
Wassara (2016b). The risk of a high pressure hose fail.
http://www.wassara.com/en/Technology/Key-benefits/Safe-and-benign-drilling-
explained/ [2016-05-16]
Wassara (2014). Water powered drilling: The water hydraulic DTH Technology
brochure.