Embed Size (px)
Citation preview
w a t e r r e s e a r c h 4 4 ( 2 0 1 0 ) 3 3 1 – 3 3 9
Avai lab le a t www.sc iencedi rec t .com
journa l homepage : www.e lsev ie r . com/ loca te /wat res
Dechlorination kinetics of TCE at toxic TCE concentrations:Assessment of different models
P.J. Haest, D. Springael, E. Smolders*
Division Soil and Water Management, Katholieke Universiteit Leuven, Kasteelpark Arenberg 20, 3001 Heverlee, Belgium
a r t i c l e i n f o
Article history:
Received 3 March 2009
Received in revised form
15 July 2009
Accepted 13 September 2009
Published online 17 September 2009
Keywords:
Dehalococcoides
Monod kinetics
Optimization
Reductive dechlorination
Self-inhibition
Trichloroethene
* Corresponding author. Tel.: þ32 16329677;E-mail address: [email protected]
0043-1354/$ – see front matter ª 2009 Elsevidoi:10.1016/j.watres.2009.09.033
a b s t r a c t
The reductive dechlorination of trichloroethene (TCE) in a TCE source zone can be self-
inhibited by TCE toxicity. A study was set up to examine the toxicity of TCE in terms of
species specific degradation kinetics and microbial growth and to evaluate models that
describe this self-inhibition. A batch experiment was performed using the TCE dechlori-
nating KB-1 culture at initial TCE concentrations ranging from 0.04 mM to saturation
(8.4 mM). Biodegradation activity was highest at 0.3 mM TCE and no activity was found at
concentrations from 4 to 8 mM. Species specific TCE and cis-DCE (cis-dichloroethene)
degradation rates and Dehalococcoides numbers were modeled with Monod kinetics
combined with either Haldane inhibition or a log-logistic dose-response inhibition on these
rates. The log-logistic toxicity model appeared the most appropriate model and predicts
that the species specific degradation activities are reduced by a factor 2 at about 1 mM TCE,
respectively cis-DCE. However, the model showed that the inhibitive effects on the time for
TCE to ethene degradation are a complex function of degradation kinetics and the initial
cell densities of the dechlorinating species. Our analysis suggests that the self-inhibition
on biodegradation cannot be predicted by a single concentration threshold without
information on the cell densities.
ª 2009 Elsevier Ltd. All rights reserved.
1. Introduction final step from VC to ETH. Batch degradation experiments in
Groundwater contamination by Chlorinated Aliphatic Hydro-
carbons (CAHs), such as trichloroethene (TCE), is often found
near dry cleaning facilities or metal processing plants. The
sanitation of such a site is a difficult and time consuming
process when the TCE is present as a free phase. Clean-up is
therefore evolving to a phased treatment where bioremedia-
tion is considered a valuable polishing step (Christ et al., 2005).
TCE can be biodegraded to cis-dichloroethene (cis-DCE),
vinylchloride (VC) and eventually to the harmless ethene
(ETH) through sequential reductive dechlorination reactions
which occur under anaerobic conditions. Several bacterial
species are able to metabolically convert TCE to cis-DCE but up
to now only Dehalococcoides has been found to perform the
fax: þ32 16321997.ven.be (E. Smolders).er Ltd. All rights reserved
which chlorinated ethene concentrations were applied up to
the aqueous saturation revealed a self-inhibition of the
dechlorination reaction (Yu and Semprini, 2004). Yang and
McCarty (2000) showed that the lag-phase associated with the
TCE degradation reaction increased above 1 mM TCE and that
the degradation is inhibited at the TCE saturation of 8.4 mM.
A stronger inhibition was observed by Duhamel et al. (2002)
and Haest et al. (2006) using the KB-1 culture, a culture able to
dechlorinate TCE to ethene. A complete inhibition was
observed at TCE concentrations >w2 mM. A similar abrupt
stop of the dechlorination reaction was observed by Amos
et al. (2007) in a batch experiment where all pure cultures
tested ceased dechlorinating at w0.54 mM perchloroethene
(PCE).
.
Nomenclature
b describes the slope of the dose-response curve [–]
Ci aqueous concentration of compound i [mM]
EC50 the concentration at which kmax is half of the
uninhibited level [mM]
Hc dimensionless Henry constant [–]
KCI Competitive inhibition constant [mM]
kd decay coefficient [d�1]
KHI Haldane inhibition constant [mM]
kmax maximal degradation rate [mmol cell�1 d�1]
Ks half velocity constant [mM]
RATE Degradation rate [mM d�1]
Vaq liquid volume [L]
Vg gaseous volume [L]
Xm cell number of species m [cell# L�1]
Ym yield coefficient of species m [cell# mmol�1]
w a t e r r e s e a r c h 4 4 ( 2 0 1 0 ) 3 3 1 – 3 3 9332
A model describing the kinetics of TCE degradation
including the observed self-inhibition is required to describe
near-source bioremediation. Initially, Michaelis-Menten type
kinetics were used to describe the reductive dechlorination
reaction at low to moderate chlorinated ethene concentra-
tions (Fennell and Gossett, 1998; Garant and Lynd, 1998; Has-
ton and McCarty, 1999; Tandoi et al., 1994). Competitive
inhibition terms were included following enzyme kinetics to
account for the observed inhibition by chlorinated ethenes on
the dechlorination of daughter compounds and microbial
growth was described using Monod kinetics (Cupples et al.,
2004; Yu and Semprini, 2004). However, no model has yet been
calibrated to the dechlorination kinetics at a TCE concentra-
tion range up to the aqueous saturation. Yu and Semprini
(2004) could describe the TCE dechlorination kinetics at 4 mM
TCE by means of a model developed for PCE self-inhibition
applying Haldane inhibition. A Haldane inhibition term
cannot describe an abrupt stop of the dechlorination activity
as observed in other studies (Amos et al., 2007; Duhamel et al.,
2002; Haest et al., 2006). In addition, the parameters describing
microbial growth in the model presented by Yu and Semprini
(2004) were selected from literature (Fennell and Gossett, 1998;
Maymo-Gatell et al., 1997) and are based on a general biomass
indicator, i.e. total protein content. The effect of a high TCE
concentration on the yield of the dechlorinating species was
not examined. Moreover, the general biomass indicator
precludes a comparison of the dechlorination kinetics deter-
mined in different studies as the degradation activity in
a mixed culture relates to the number of dechlorinators.
The objective of this study was to assess the self-inhibition
of TCE in terms of species specific growth and degradation
activity. Two different equations were compared to empiri-
cally describe the dose-response relationship. Real-time
quantitative PCR (qPCR) enabled a determination of species
specific activity and growth rates. Advanced approaches are
required to fit the growth and degradation in all treatments
with one model. A novel multi-objective global optimization
algorithm allowed the identification of species specific
parameters describing the TCE degradation at high TCE
concentrations by the KB-1 culture.
2. Material and methods
2.1. Culture and medium preparation
The KB-1 culture was kindly provided by SiREM (Ontario,
Canada). This culture has been intensively studied and contains
Dehalococcoides spp., among a wide variety of other microor-
ganisms (Duhamel et al., 2002; Duhamel and Edwards, 2006,
2007). The culture reductively dechlorinates TCE to ethene
(Duhamel et al., 2004). The inoculum for the batch degradation
experiment was grown on 1 mM TCE and 1.5 mM butyrate
at 20 �C in an anaerobic mineral medium containing: 2.88 g/L
(NH4)H2PO4, 0.1 g/L MgSO4$7H2O, 0.05 g/L Ca(NO3)2$H2O,
0.1 g/L yeast extract, 1% resazurin, 1 g/L KOH, 2.4 g/ L NaHCO3,
0.25 g/L Na2S.9H2O, 1 ml/L trace elements (stock solution: 0.5 g/L
EDTA, 0.1 g/L ZnSO4$7H2O, 0.3 g/L H3BO3, 0.01 g/L CuCl2$2H2O,
0.03 g/L Na2MoO4, 0.033 g/L Na2WO4$2H2O, 0.2 g/L CoCl2.6H2O,
0.01 g/L AlCl3$6H2O, 1 ml HClc (37 %)) and 1 ml vitamin solution
(stock solution: 100 mg/L p-aminobenzoic acid, 50 mg/L folic
acid, 100 mg/L lipoic acid, 100 mg/L riboflavic acid, 200 mg/L
thiamine, 200 mg/L nicotic acid, 500 mg/L pyridoxamine,
100 mg/L pantotheic acid, 100 mg/L cobalamine, 20 mg/L bio-
tine). The presence of Dehalococcoides spp. in the inoculum was
confirmed by a nested 16S rDNA PCR-DGGE analysis with
Dehalococcoides specific primers DeF (50-gca att aag ata gtg
gc-30)�DER (50-act tcg tcc caa tta cc-30) (Cupples et al., 2003) and
semi-specific primers 968-GC-F (50-cgc ccg ggg cgc gcc ccg ggc ggg
gcg ggg gca cgg ggg gaa cgc gaa gaa cct tac-30)�DHC 1350-R
(50-cac ctt gct gat atg cgg-30) (He et al., 2003). Triplicate batches for
the degradation experiment were set-up in 120 mL vials with an
N2/CO2 80/20 atmosphere. The vials were inoculated with
6.5 vol% of the culture grown on 1 mM TCE (see above) in a total
volume of 80 mL. TCE was added using a gastight glass syringe
from an anaerobic pure stock solution at final concentrations of
0.04–0.3–0.9–1.3–1.8–4–6–8 mM TCE. Butyrate was provided
as carbon and electron donor because butyrate fermentation
yields low H2-concentrations promoting Dehalococcoides over
competitors (Aulenta et al., 2005; Fennell et al., 1997; Yang
and McCarty, 1998). It was provided in a 5-fold electron
equivalents (eeq) excess taking into account a complete
fermentation of butyrate to CO2 and dechlorination of TCE to
ethene. The vials were sealed with Viton stoppers and
aluminum crimp caps and incubated in darkness on a hori-
zontal shaker at 100 rpm at 20 �C.
Duhamel and Edwards (2006) recently found that a Geo-
bacter strain degraded up to 80% of the TCE in the KB-1 culture.
Unfortunately, this information was not yet available during
the time that this experiment was performed. As such, Geo-
bacter was not monitored in this experiment. Our recent data
in other batches confirmed the observations made by Duha-
mel and Edwards (2006) by showing an increase in Geobacter
numbers during TCE degradation and an increase in Dehalo-
coccoides numbers during cis-DCE and VC degradation in the
KB-1 culture (see Fig. S1, supporting information).
w a t e r r e s e a r c h 4 4 ( 2 0 1 0 ) 3 3 1 – 3 3 9 333
2.2. Analytical methods
TCE, cis-DCE, VC, ETH and methane were measured in 1 mL
aqueous samples taken from the vials at each sampling time.
The extracted liquid volume was replenished with sterile N2
gas. The aqueous sample was analyzed by means of head-
space analysis using a TriPlus autosampler and a Focus
GC-FID (Thermo-Electron Corporation) equipped with an
Rt-QPLOT column (0.53 mm� 30 m). The samples were heated
RATEi ¼kmax;iXmCi�
Ks;i
�1þ Ciþ1
KCI;iþ1þ Ciþ2
KCI;iþ2
�þ Ci
���
1þ exp
�bilog
�Ci
EC50;i
��� (2)
at 75 �C for 30 min before a headspace sample was injected in
the GC. Helium was used as carrier gas at 5 mL/min. The oven
temperature program started at 50 �C with a ramp of 20 �C/
min to 180 �C and a final ramp of 30 �C/min to 220 �C for
5.5 min. Calibration curves were obtained from external
standards.
DNA was extracted from 400 mL of aqueous sample as
described by Uyttebroek et al. (2006). Numbers of Dehalo-
coccoides spp. 16S rRNA gene copies were quantified by real-
time PCR (qPCR) as described by Dijk et al. (2008) using the
Dehalococcoides specific primers Dco728F (50-aag gcg gtt ttc tag
gtt gtc ac-30) and Dco944R (50-ctt cat gca tgt caa at-30) (Smits
et al., 2004). The cycling program consisted of 15 min of initial
denaturation at 95 �C, followed by 40 cycles of 10 s of dena-
turation at 95 �C, 20 s of annealing at 50 �C and 20 s of exten-
sion at 72 �C with a final extension step at 72 �C for 5 min. One
16Sr RNA gene copy was assumed per Dehalococcoides cell
(Klappenbach et al., 2001).
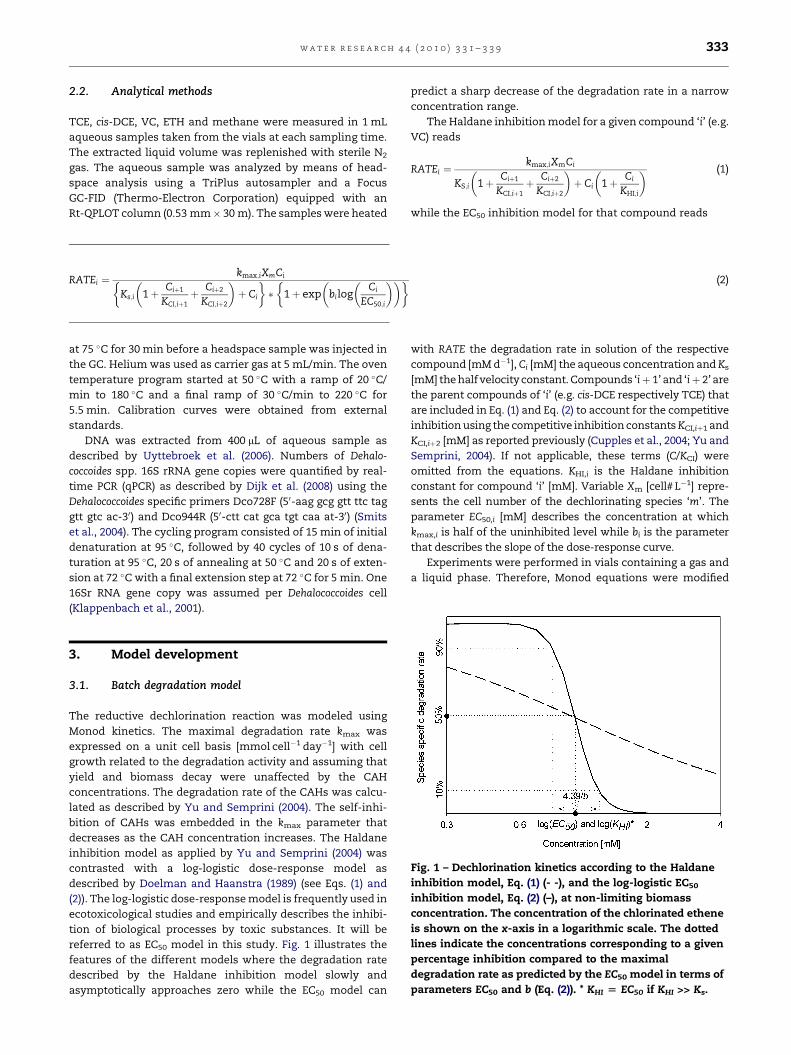
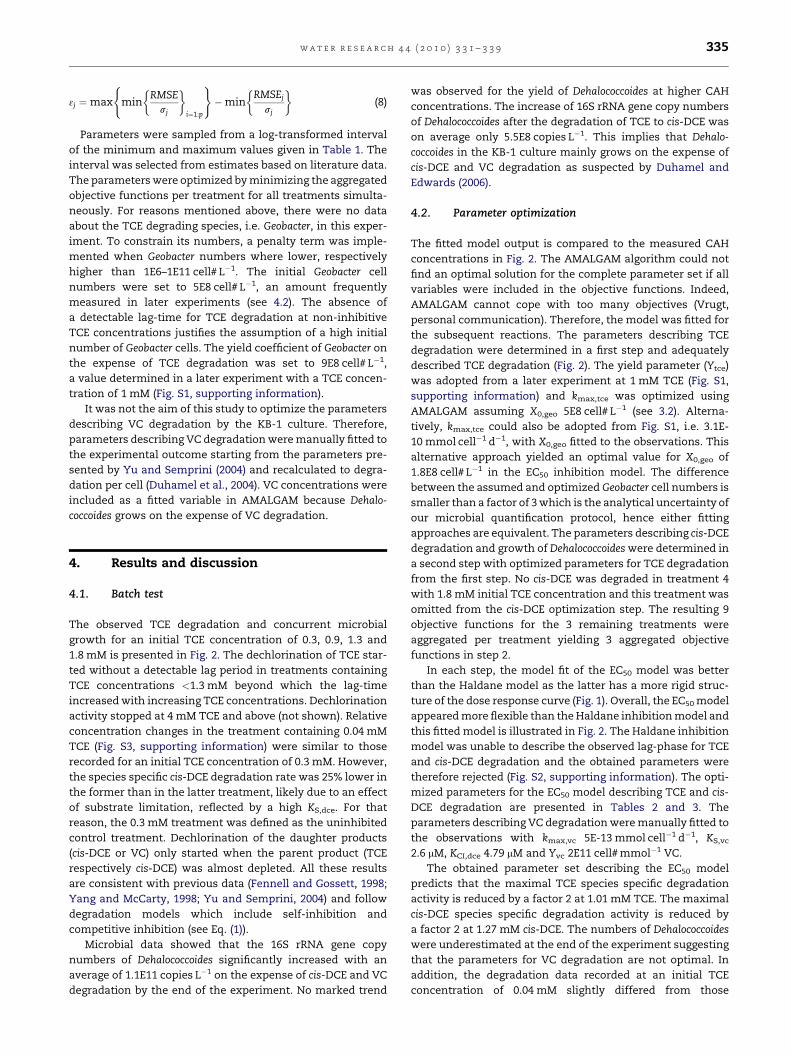
Fig. 1 – Dechlorination kinetics according to the Haldane
inhibition model, Eq. (1) (- -), and the log-logistic EC50
inhibition model, Eq. (2) (–), at non-limiting biomass
concentration. The concentration of the chlorinated ethene
is shown on the x-axis in a logarithmic scale. The dotted
lines indicate the concentrations corresponding to a given
percentage inhibition compared to the maximal
degradation rate as predicted by the EC50 model in terms of
parameters EC50 and b (Eq. (2)). * KHI [ EC50 if KHI >> Ks.
3. Model development
3.1. Batch degradation model
The reductive dechlorination reaction was modeled using
Monod kinetics. The maximal degradation rate kmax was
expressed on a unit cell basis [mmol cell�1 day�1] with cell
growth related to the degradation activity and assuming that
yield and biomass decay were unaffected by the CAH
concentrations. The degradation rate of the CAHs was calcu-
lated as described by Yu and Semprini (2004). The self-inhi-
bition of CAHs was embedded in the kmax parameter that
decreases as the CAH concentration increases. The Haldane
inhibition model as applied by Yu and Semprini (2004) was
contrasted with a log-logistic dose-response model as
described by Doelman and Haanstra (1989) (see Eqs. (1) and
(2)). The log-logistic dose-response model is frequently used in
ecotoxicological studies and empirically describes the inhibi-
tion of biological processes by toxic substances. It will be
referred to as EC50 model in this study. Fig. 1 illustrates the
features of the different models where the degradation rate
described by the Haldane inhibition model slowly and
asymptotically approaches zero while the EC50 model can
predict a sharp decrease of the degradation rate in a narrow
concentration range.
The Haldane inhibition model for a given compound ‘i’ (e.g.
VC) reads
RATEi ¼kmax;iXmCi
KS;i
�1þ Ciþ1
KCI;iþ1þ Ciþ2
KCI;iþ2
�þ Ci
�1þ Ci
KHI;i
� (1)
while the EC50 inhibition model for that compound reads
with RATE the degradation rate in solution of the respective
compound [mM d�1], Ci [mM] the aqueous concentration and Ks
[mM] the half velocity constant. Compounds ‘iþ 1’ and ‘iþ 2’ are
the parent compounds of ‘i’ (e.g. cis-DCE respectively TCE) that
are included in Eq. (1) and Eq. (2) to account for the competitive
inhibition using the competitive inhibition constants KCI,iþ1 and
KCI,iþ2 [mM] as reported previously (Cupples et al., 2004; Yu and
Semprini, 2004). If not applicable, these terms (C/KCI) were
omitted from the equations. KHI,i is the Haldane inhibition
constant for compound ‘i’ [mM]. Variable Xm [cell# L�1] repre-
sents the cell number of the dechlorinating species ‘m’. The
parameter EC50,i [mM] describes the concentration at which
kmax,i is half of the uninhibited level while bi is the parameter
that describes the slope of the dose-response curve.
Experiments were performed in vials containing a gas and
a liquid phase. Therefore, Monod equations were modified
w a t e r r e s e a r c h 4 4 ( 2 0 1 0 ) 3 3 1 – 3 3 9334
assuming degradation only takes place in solution. Vg and Vl
[L] are the gaseous, respectively liquid volume and Hc the
dimensionless Henry’s constant (Gossett, 1987). The total
molar degradation rates in the vials were determined using
the mass balance equation with Mi the total mass of
compound ‘i’ in the vial and Ci,l the concentration of i in the
aqueous phase: Mi ¼ Ci;lðVl þ VgHc;iÞ. The Monod equations
hence read:
dXm
dt¼X
YmRATEi
1þ Vg
VlHc;i
!� kd;mXm (3)
with Ym [cell# mmol1] the yield coefficient of species m and
kd,m [d�1] the decay coefficient, with the mass balance:
dCi
dt¼ ð � RATEi þ RATEiþ1Þ �
1
1þ Vg
VlHc;i
!(4)
The findings of Duhamel and Edwards (2006) suggested
a split of the biomass into 2 different actors for the KB-1
culture. Geobacter was found to degrade 80% of the TCE to cis-
DCE while Dehalococcoides converted cis-DCE to ethene. Both
species couple dechlorination to growth. We confirmed this
observation in a later experiment (Fig. S1, supporting infor-
mation). Dechlorination kinetics were therefore adjusted for
microbial growth of both species: Geobacter was assumed to
grow on the expense of TCE degradation while Dehalococcoides
was assumed to grow only on the expense of cis-DCE and VC
degradation. Experimental observations largely confirmed
this assumption (see further). The obtained set of differential
equations was solved in Matlab using a variable order solver
based on numerical differentiation formulas.
3.2. Optimization algorithm
The Monod model describing either TCE or cis-DCE degrada-
tion kinetics (Eqs. (1) and (2)) shows 11 or 13 adjustable
parameters for the Haldane, respectively EC50 approach (see
Table 1). These model parameters are correlated (Liu and
Zachara, 2001; Robinson and Tiedje, 1983). As such, the indi-
rect parameter determination of these equations using data
from a degradation experiment is not straightforward. An
evolutionary optimization algorithm, i.e. AMALGAM (Vrugt
and Robinson, 2007) was used in this study. The algorithm
Table 1 – The tested parameter intervals for the Haldane and talgorithm.
kmax,tce
[mmol cell�1 d�1]KS,tce
[mM]KCI,tce
[mM]KH
[m
Min 6.57E�13 1.40E�3 1.40E�3 0
Max 6.57E�09 4.39E�2 1.00 5
kmax,dce
[mmol cell�1 d�1]
KS,dce
[mM]
KCI,dceb
[mM]
KH
[m
Min 1.00E�14 1.00E�3 – 1
Max 1.00E�10 1.00E�1 – 8
a The yield parameter for the TCE degrading species was determined in
b The reductive dechlorination kinetics describing VC degradation were n
average from the literature values presented in Table 3.
described by Vrugt and Robinson (2007) is a multialgorithm,
genetically adaptive multiobjective method (AMALGAM). It
incorporates multiple objectives by looking for the globally
optimal solution of the trade-off problem between different
objectives, the so-called Pareto optimal solution. It could be
especially useful in environmental research where difficulties
exist in determining a specific microbial activity from the
large amount of microbial processes taking place. AMALGAM
was kindly provided by Dr. Vrugt as a Matlab code.
Only treatments where degradation was observed were
included in the parameter optimization, i.e. treatments con-
taining initial TCE concentrations of 0.3, 0.9, 1.3 and 1.8 mM.
The treatment containing 0.04 mM was not included for
reasons given below. For each of these treatments 4 different
observations, termed variables, were fitted at each sampling
occasion, i.e. concentrations of TCE, cis-DCE, VC and the
growth of Dehalococcoides. In total, there were 4� 4 RMSE
values, each one defined as
RMSEj ¼
ffiffiffiffiffiffiffiffiffiffiffiffiffiffiffiffiffiffiffiffiffiffiffiffiffiffiffiffiffiffiffiffiffiffiffiffiffiffiffiffiffiffiffiPni¼1
�qi;obs � qi;sim
�2
n
s(5)
with qi,obs the observed and qi,sim the simulated variable at
time i from a total of n observations. The model equations
were solved simultaneously for all 4 treatments. This allows
AMALGAM to search for one globally optimal solution,
including the inhibitive effect of a high TCE concentration on
the degradation activity and on the concurrent growth of the
dechlorinating species. For each treatment, the 4 (m) calcu-
lated RMSEs were aggregated in one objective function (OF)
yielding a total of 4 OFs (Madsen, 2003).
OF ¼Pm
j¼1 gj
�RMSEj
�m
(6)
with gj a weight factor to compensate for differences in
absolute values of RMSE terms of CAH concentrations and
Dehalococcoides spp. numbers, defined as
gj
�RMSEj
�¼ RMSEj
sjþ ej; j ¼ 1 : m (7)
with sj the standard deviation of variable RMSEj for the p
model solutions from a preliminary model evaluation and ej
a transformation constant given by
he EC50 inhibition models in the AMALGAM optimization
I,tce
M]EC50,tce
[mM]btce
[–]Ytce
a
[cell# mmol�1]kd
[d�1]
.5 1 4.39 – 0.024
4 13.17 – 0.050
I,dce
M]
EC50,dce
[mM]
bdce
[–]
Ydce
[cell# mmol�1]
kd
[d�1]
1 4.39 7.00Eþ08 0.024
8 13.17 7.00Eþ12 0.050
a later experiment with the KB-1 culture at 1 mM TCE.
ot optimized using AMALGAM. KCI,dce was set to 4.79E�3 mM, i.e. the
w a t e r r e s e a r c h 4 4 ( 2 0 1 0 ) 3 3 1 – 3 3 9 335
3j ¼max
(min
�RMSE
� )�min
�RMSEj
�(8)
sj i¼1:psj
Parameters were sampled from a log-transformed interval
of the minimum and maximum values given in Table 1. The
interval was selected from estimates based on literature data.
The parameters were optimized by minimizing the aggregated
objective functions per treatment for all treatments simulta-
neously. For reasons mentioned above, there were no data
about the TCE degrading species, i.e. Geobacter, in this exper-
iment. To constrain its numbers, a penalty term was imple-
mented when Geobacter numbers where lower, respectively
higher than 1E6–1E11 cell# L�1. The initial Geobacter cell
numbers were set to 5E8 cell# L�1, an amount frequently
measured in later experiments (see 4.2). The absence of
a detectable lag-time for TCE degradation at non-inhibitive
TCE concentrations justifies the assumption of a high initial
number of Geobacter cells. The yield coefficient of Geobacter on
the expense of TCE degradation was set to 9E8 cell# L�1,
a value determined in a later experiment with a TCE concen-
tration of 1 mM (Fig. S1, supporting information).
It was not the aim of this study to optimize the parameters
describing VC degradation by the KB-1 culture. Therefore,
parameters describing VC degradation were manually fitted to
the experimental outcome starting from the parameters pre-
sented by Yu and Semprini (2004) and recalculated to degra-
dation per cell (Duhamel et al., 2004). VC concentrations were
included as a fitted variable in AMALGAM because Dehalo-
coccoides grows on the expense of VC degradation.
4. Results and discussion
4.1. Batch test
The observed TCE degradation and concurrent microbial
growth for an initial TCE concentration of 0.3, 0.9, 1.3 and
1.8 mM is presented in Fig. 2. The dechlorination of TCE star-
ted without a detectable lag period in treatments containing
TCE concentrations <1.3 mM beyond which the lag-time
increased with increasing TCE concentrations. Dechlorination
activity stopped at 4 mM TCE and above (not shown). Relative
concentration changes in the treatment containing 0.04 mM
TCE (Fig. S3, supporting information) were similar to those
recorded for an initial TCE concentration of 0.3 mM. However,
the species specific cis-DCE degradation rate was 25% lower in
the former than in the latter treatment, likely due to an effect
of substrate limitation, reflected by a high KS,dce. For that
reason, the 0.3 mM treatment was defined as the uninhibited
control treatment. Dechlorination of the daughter products
(cis-DCE or VC) only started when the parent product (TCE
respectively cis-DCE) was almost depleted. All these results
are consistent with previous data (Fennell and Gossett, 1998;
Yang and McCarty, 1998; Yu and Semprini, 2004) and follow
degradation models which include self-inhibition and
competitive inhibition (see Eq. (1)).
Microbial data showed that the 16S rRNA gene copy
numbers of Dehalococcoides significantly increased with an
average of 1.1E11 copies L�1 on the expense of cis-DCE and VC
degradation by the end of the experiment. No marked trend
was observed for the yield of Dehalococcoides at higher CAH
concentrations. The increase of 16S rRNA gene copy numbers
of Dehalococcoides after the degradation of TCE to cis-DCE was
on average only 5.5E8 copies L�1. This implies that Dehalo-
coccoides in the KB-1 culture mainly grows on the expense of
cis-DCE and VC degradation as suspected by Duhamel and
Edwards (2006).
4.2. Parameter optimization
The fitted model output is compared to the measured CAH
concentrations in Fig. 2. The AMALGAM algorithm could not
find an optimal solution for the complete parameter set if all
variables were included in the objective functions. Indeed,
AMALGAM cannot cope with too many objectives (Vrugt,
personal communication). Therefore, the model was fitted for
the subsequent reactions. The parameters describing TCE
degradation were determined in a first step and adequately
described TCE degradation (Fig. 2). The yield parameter (Ytce)
was adopted from a later experiment at 1 mM TCE (Fig. S1,
supporting information) and kmax,tce was optimized using
AMALGAM assuming X0,geo 5E8 cell# L�1 (see 3.2). Alterna-
tively, kmax,tce could also be adopted from Fig. S1, i.e. 3.1E-
10 mmol cell�1 d�1, with X0,geo fitted to the observations. This
alternative approach yielded an optimal value for X0,geo of
1.8E8 cell# L�1 in the EC50 inhibition model. The difference
between the assumed and optimized Geobacter cell numbers is
smaller than a factor of 3 which is the analytical uncertainty of
our microbial quantification protocol, hence either fitting
approaches are equivalent. The parameters describing cis-DCE
degradation and growth of Dehalococcoides were determined in
a second step with optimized parameters for TCE degradation
from the first step. No cis-DCE was degraded in treatment 4
with 1.8 mM initial TCE concentration and this treatment was
omitted from the cis-DCE optimization step. The resulting 9
objective functions for the 3 remaining treatments were
aggregated per treatment yielding 3 aggregated objective
functions in step 2.
In each step, the model fit of the EC50 model was better
than the Haldane model as the latter has a more rigid struc-
ture of the dose response curve (Fig. 1). Overall, the EC50 model
appeared more flexible than the Haldane inhibition model and
this fitted model is illustrated in Fig. 2. The Haldane inhibition
model was unable to describe the observed lag-phase for TCE
and cis-DCE degradation and the obtained parameters were
therefore rejected (Fig. S2, supporting information). The opti-
mized parameters for the EC50 model describing TCE and cis-
DCE degradation are presented in Tables 2 and 3. The
parameters describing VC degradation were manually fitted to
the observations with kmax,vc 5E-13 mmol cell�1 d�1, KS,vc
2.6 mM, KCI,dce 4.79 mM and Yvc 2E11 cell# mmol�1 VC.
The obtained parameter set describing the EC50 model
predicts that the maximal TCE species specific degradation
activity is reduced by a factor 2 at 1.01 mM TCE. The maximal
cis-DCE species specific degradation activity is reduced by
a factor 2 at 1.27 mM cis-DCE. The numbers of Dehalococcoides
were underestimated at the end of the experiment suggesting
that the parameters for VC degradation are not optimal. In
addition, the degradation data recorded at an initial TCE
concentration of 0.04 mM slightly differed from those
Fig. 2 – Experimental and fitted data of the EC50 inhibition model for the 4 batch treatments with increasing initial TCE
concentrations from 0.3, 0.9, 1.3 to 1.8 mM. The upper graph per treatment shows in dots the measured amount of CAHs with
error bars indicating the variation between replicate treatments (C TCE; V cis-DCE; - VC; > ETH). If error bars are not visible
the variation between the replicate treatments was negligible. The lines represent the model output (– TCE; . cis-DCE; – – VC;
(–.. ETH). The lower graph per treatment shows the measured numbers of Dehalococcoides (V) and the lines represent the model
species for the degradation of TCE (–) and cis-DCE (.). Microbial numbers were only determined for one of the triplicate tests.
w a t e r r e s e a r c h 4 4 ( 2 0 1 0 ) 3 3 1 – 3 3 9336
recorded at 0.3 mM (Fig. S3, supporting information).
Surprisingly, if the EC50 model was fitted to all data 0.04–
1.8 mM, it could not adequately approximate the observations
at the larger initial TCE concentrations. Along the same lines,
we note that the EC50 model was able to describe the long lag-
time at 1.8 mM TCE but failed to predict that TCE degradation
finally started after day 100. It illustrates that even a param-
eter rich model as presented here is not sufficiently flexible to
describe all data over that large concentration interval.
The underlying idea of the EC50 model is that self inhibition
affects activity but not yield. An alternative approach would
be to incorporate the self-inhibition in the yield coefficient.
Toxicity could not only inhibit the species specific activity but
could also reduce yield by diverting gained energy to survival
instead of growth. However, yields of Dehalococcoides on the
expense of cis-DCE and VC degradation differed by less than
a factor 3 among treatments with no significant effect of initial
concentrations. The combined concept with inhibitive effects
on growth and activity is probably most realistic, however
requires additional parameter fitting. The absence of data on
the growth of Geobacter at other TCE concentrations than
1 mM did not allow to verify if yield varies with TCE
concentrations.
4.3. Monod model implications
The EC50 model incorporates a self-inhibition of the species
specific degradation activity and, hence, inhibition on total
degradation rate cannot be described by a single concentration
threshold without information about the number of dechlori-
nating cells. In addition, when considering the entire degrada-
tion pathway of TCE to ethene the self-inhibition is a complex
function of initial cell numbers for each degradation step
and the inhibition of the species specific degradation activity.
For example, in case of a low initial cell density (X0,geo¼5E6 cell# L�1 and X0,dcoc¼ 1.5E7 cell# L�1) the predicted reaction
Table 2 – The optimized parameters of the EC50 model describing TCE degradation versus parameters published inliterature. Literature data were recalculated to identical units.
Reference kmax,tce
[mmol cell�1 d�1]Ks,tce
[mM]KCI,tce
[mM]KHI,tce
[mM]EC50,tce
[mM]btce
[–]Ytce
[cell# mmol�1]kd
[d�1]
EC50 modela 1.56E�10 4.19E�3 37E�2 – 1.01 8.83 9.00Eþ8d 0.029
Duhamel and Edwards (2007) – – – – – – 1.00Eþ11 –
He et al. (2005) – – – – – – 7.80Eþ10 –
Maymo-Gatell et al. (1995)b,c 2.09E�13 – – – – – 22.9Eþ11 –
Yu and Semprini (2004) b 2.60E�13 2.76E�3 0.28E�2 0.9 – – 28.6Eþ11 0.024
Yu and Semprini (2004) b 2.63E�13 1.80E�3 0.18E�2 0.9 – – 28.6Eþ11 0.024
Cupples et al. (2004) 7.45E�13 12.4E�3 0.68E�2 – – – 4.70Eþ11 0.050
Garant and Lynd (1998) b 0.39E�13 17.4E�3 1.74E�2 – – – – –
Haston and McCarty (1999) b 0.07E�13 1.4E�3 – – – – – –
a Parameters obtained through inverse optimization with AMALGAM.
b Recalculated values according to Duhamel et al. (2004) assuming a conversion factor of 4.2E–15 g dry weight of cell material per 16S rRNA gene
copy and a protein content of 50%.
c One yield constant was reported for the complete degradation of PCE to VC and ethene.
d The yield parameter for the TCE degrading species was determined in a later experiment with the KB-1 culture at 1 mM TCE (Fig. S1, sup-
porting information).
w a t e r r e s e a r c h 4 4 ( 2 0 1 0 ) 3 3 1 – 3 3 9 337
time for TCE degradation to cis-DCE increases by a factor 2 at an
initial TCE concentration of 1 mM compared to the reaction
time for the uninhibited control (0.3 mM). However, the time
required for the degradation of 1 mM TCE to VC is less than 2
times the reaction time in the uninhibited control. The increase
in reaction time due to the self-inhibition of TCE is not linearly
passed on to the next steps of the sequential degradation
reaction as those are mediated by a different species, i.e.
Dehalococcoides, with its own growth kinetics.
The determination of species specific degradation kinetics
allows to compare data between different studies and exper-
imental scales. For example: Azizian et al. (2008) performed
a continuous-flow study and used an inoculum described by
Yu et al. (2005). They measured species specific dechlorination
rates that were orders of magnitude higher than those pre-
sented by Yu et al. (2005) rescaled to degradation per cell using
a conversion factor of 4.2E�15 g dry weight of cell material per
Table 3 – The optimized parameters of the EC50 model describliterature. Literature data were recalculated to identical units.
Reference kmax,dce
[mmol cell�1 d�1]KS,dce
[mM]KC
[m
EC50 modela 2.08E�11 99.7E�3 4.7
Schaefer et al. (2009) 1.25E�11 2.00E�3 5.2
Duhamel and Edwards (2007) – – –
He et al. (2005) – – –
Maymo-Gatell et al. (1995) b,e 2.09E�13 – –
Yu and Semprini (2004) b 0.46E�13 1.90E�3 1.9
Yu and Semprini (2004) b 0.29E�13 1.76E�3 1.7
Cupples et al. (2004) c,d 8.85E�13 3.30E�3 3.6
Garant and Lynd (1998) b 0.25E�13 11.9E�3 11.
Haston and McCarty (1999) b 0.002E�13 3.30E�3 –
a Parameters obtained through inverse optimization with AMALGAM. KCI,
b Recalculated values according to Duhamel et al. (2004) assuming a con
gene copy and a protein content of 50%.
c Values for the enriched culture were adopted from the non-enriched s
d The yield constant for cis-DCE degradation was adopted from the repo
e One yield constant was reported for the complete degradation of PCE t
16S rRNA gene copy, assuming 1 copy per cell and a protein
content of 50% (Duhamel et al., 2004). However, the average
species specific VC degradation rate derived from the results
presented by Azizian et al. (2008), 3E�13 mmol cell�1 d�1, is in
line with the optimized kmax,vc that we obtained in this study
(5E�13 mmol cell�1 d�1). It shows how the normalization of
the degradation parameters strongly determines a correct
comparison of the dechlorination kinetics. In addition, if yield
constants from a mixed culture are expressed on a total
protein content basis, the actual yield of the dechlorinating
species cannot be estimated, especially at low CAH concen-
trations where other reactions are not yet inhibited (<0.3 mM
(Yang and McCarty, 2000)).
The determination of species specific degradation kinetics
is not straightforward. Sung et al. (2006) found that growth
yield estimates obtained by qPCR can vary by up to 1 order of
magnitude with differing DNA extraction protocols. The qPCR
ing cis-DCE degradation versus parameters published in
I,dce
M]KHI,dce
[mM]EC50,dce
[mM]bdce
[–]Ydce
[cell# mmol�1]kd
[d�1]
9E�3 – 1.27 10.4 1.56Eþ10 0.050
0E�3 – – – 0.44Eþ10 –
– – – 1.80Eþ11 –
– – – 8.40Eþ10 –
– – – 22.9Eþ11 –
0E�3 6 – – 28.6Eþ11 0.024
6E�3 0.75 – – 28.6Eþ11 0.024
0E�3 – – – 5.20Eþ11 0.050
9E�3 – – – – –
– – – – –
dce was arbitrarily set to the average of reported constants in this table.
version factor of 4.2E�15 g dry weight of cell material per 16S rRNA
ource culture.
rted yield constant on VC degradation.
o VC and ethene.
w a t e r r e s e a r c h 4 4 ( 2 0 1 0 ) 3 3 1 – 3 3 9338
quantification protocol in this experiment was compared to
another quantification technique, i.e. Catalyzed Reporter
Deposition-Fluorescent In Situ Hybridization (CARD-FISH) in
a previous study (Dijk et al., 2008). The quantification of
Dehalococcoides was found to differ by less than a factor 4
between both methods. As such, the obtained yield estimates
for Dehalococcoides in the current study were assumed to be
sufficiently accurate. The yield values in this study were at the
lower limit of the values reported in literature (Table 2 and 3).
However, most yield coefficients reported in other studies
were obtained from highly enriched lab-cultures under
optimal conditions at non-inhibitive chlorinated ethene
concentrations or had to be rescaled to represent cellular
growth. A standardized microbial quantification would be
beneficial for a comparison of yield coefficients between
different studies (Cupples, 2008).
5. Conclusion
Batch results showed a self-inhibition of TCE at concentra-
tions above 1 mM and a complete inhibition at 4 mM and
more. This strong inhibition could limit the potential benefits
of bioremediation in a TCE source zone. Microbial data indi-
cated that cis-dichloroethene (cis-DCE) was dechlorinated by
Dehalococcoides spp. while another organism dechlorinated
TCE in the KB-1 culture. The EC50 model rather than the Hal-
dane inhibition model most accurately simulated the obser-
vations. Although the parameter determination of and
modeling with species specific Monod kinetics is a demanding
process, its use allows a better prediction of reactions taking
place in a CAH source zone. First order or Michaelis-Menten
models cannot incorporate observed lag-times and inhibitive
effects as found and fitted in this study.
Acknowledgements
We thank Dr. R. Richardson of Cornell University (USA), the
SiREM company, M. Duhamel of the University of Toronto
(Canada) and H. Smidt and M. Sturme of Wageningen
University (The Netherlands) for providing their cultures and
clones. We also thank J. Dijk, J. Mertens, J.A. Vrugt and
S. Ruymen for their advice and kind assistance in the experi-
mental work and in the model development, and the 2
anonymous reviewers for their helpful comments. This
research was funded by a Ph.D. grant of the Institute for the
Promotion of Innovation through Science and Technology in
Flanders (IWT-Vlaanderen).
Appendix.Supplementary information
Supplementary information associated with this article can
be found, in the online version, at doi:10.1016/j.watres.2009.
09.033
r e f e r e n c e s
Amos, B.K., Christ, J.A., Abriola, L.M., Pennell, K.D., Loffler, F.E.,2007. Experimental evaluation and mathematical modelingof microbially enhanced tetrachloroethene (PCE)dissolution. Environmental Science & Technology 41 (3),963–970.
Aulenta, F., Gossett, J.M., Papini, M.P., Rossetti, S., Majone, M.,2005. Comparative study of methanol, butyrate, and hydrogenas electron donors for long-term dechlorination oftetrachloroethene in mixed anaerobic cultures. Biotechnologyand Bioengineering 91 (6), 743–753.
Azizian, M.F., Behrens, S., Sabalowsky, A., Dolan, M.E.,Spormann, A.M., Semprini, L., 2008. Continuous-flow columnstudy of reductive dehalogenation of PCE uponbioaugmentation with the Evanite enrichment culture. Journalof Contaminant Hydrology 100 (1–2), 11–21.
Christ, J.A., Ramsburg, C.A., Abriola, L.M., Pennell, K.D., Loffler, F.E.,2005. Coupling aggressive mass removal with microbialreductive dechlorination for remediation of DNAPL sourcezones: a review and assessment. Environmental HealthPerspectives 113 (4), 465–477.
Cupples, A.M., Spormann, A.M., McCarty, P.L., 2003. Growth ofa Dehalococcoides-like microorganism on vinyl chloride and cis-dichloroethene as electron acceptors as determined bycompetitive PCR. Applied and Environmental Microbiology 69(2), 953–959.
Cupples, A.M., Spormann, A.M., McCarty, P.L., 2004. Comparativeevaluation of chloroethene dechlorination to ethene byDehalococcoides-like microorganisms. Environmental Science &Technology 38 (18), 4768–4774.
Cupples, A.M., 2008. Real-time PCR quantification ofDehalococcoides populations: methods and applications.Journal of Microbiological Methods 72 (1), 1–11.
Dijk, J.A., Breugelmans, P., Philips, J., Haest, P.J., Smolders, E.,Springael, D., 2008. Catalyzed reporter deposition-fluorescentin situ hybridization (card-fish) detection of Dehalococcoides.Journal of Microbiological Methods 73 (2), 142–147.
Doelman, P., Haanstra, L., 1989. Short-term and long-term effectsof heavy-metals on phosphatase-activity in soils – anecological dose-response model approach. Biology andFertility of Soils 8 (3), 235–241.
Duhamel, M., Wehr, S.D., Yu, L., Rizvi, H., Seepersad, D.,Dworatzek, S., Cox, E.E., Edwards, E.A., 2002. Comparison ofanaerobic dechlorinating enrichment cultures maintained ontetrachloroethene, trichloroethene, cis-dichloroethene andvinyl chloride. Water Research 36 (17), 4193–4202.
Duhamel, M., Mo, K., Edwards, E.A., 2004. Characterization ofa highly enriched Dehalococcoides-containing culture thatgrows on vinyl chloride and trichloroethene. Applied andEnvironmental Microbiology 70, 5538–5545.
Duhamel, M., Edwards, E.A., 2006. Microbial composition ofchlorinated ethene-degrading cultures dominated byDehalococcoides. FEMS Microbiol Ecology 58 (3), 538–549.
Duhamel, M., Edwards, E.A., 2007. Growth and yields ofdechlorinators, acetogens, and methanogens during reductivedechlorination of chlorinated ethenes and dihaloeliminationof 1,2-dichloroethane. Environmental Science & Technology41 (7), 2303–2310.
Fennell, D.E., Gossett, J.M., Zinder, S.H., 1997. Comparison ofbutyric kid, ethanol, lactic acid, and propionic acid ashydrogen donors for the reductive dechlorination oftetrachloroethene. Environmental Science & Technology 31(3), 918–926.
Fennell, D.E., Gossett, J.M., 1998. Modeling the production of andcompetition for hydrogen in a dechlorinating culture.Environmental Science & Technology 32 (16), 2450–2460.
w a t e r r e s e a r c h 4 4 ( 2 0 1 0 ) 3 3 1 – 3 3 9 339
Garant, H., Lynd, L., 1998. Applicability of competitive andnoncompetitive kinetics to the reductive dechlorination ofchlorinated ethenes. Biotechnology and Bioengineering 57 (6),751–755.
Gossett, J.M., 1987. Measurement of Henrys law constants for C1and C2 chlorinated hydrocarbons. Environmental Science &Technology 21 (2), 202–208.
Haest, P.J., Ruymen, S., Springael, D., Smolders, E., 2006. Reductivedechlorination at high aqueous TCE concentrations.Communications in Applied and Biological Sciences 71 (1),165–169.
Haston, Z.C., McCarty, P.L., 1999. Chlorinated ethene half-velocitycoefficients (K–S) for reductive dehalogenation.Environmental Science & Technology 33 (2), 223–226.
He, J., Ritalahti, K.M., Aiello, M.R., Loffler, F.E., 2003. Completedetoxification of vinyl chloride by an anaerobic enrichmentculture and identification of the reductively dechlorinatingpopulation as a Dehalococcoides species. Applied andEnvironmental Microbiology 69 (2), 996–1003.
He, J., Sung, Y., Krajmalnik-Brown, R., Ritalahti, K.M., Loffler, F.E.,2005. Isolation and characterization of Dehalococcoides sp.strain FL2, a trichloroethene (TCE)- and 1,2-dichloroethene-respiring anaerobe. Environmental Microbiology 7 (9),1442–1450.
Klappenbach, J.A., Saxman, P.R., Cole, J.R., Schmidt, T.M., 2001.rrndb: The ribosomal RNA operon copy number database.Nucleic Acids Research 29 (1), 181–184.
Liu, C.X., Zachara, J.M., 2001. Uncertainties of Monod kineticparameters nonlinearly estimated from batch experiments.Environmental Science & Technology 35 (1), 133–141.
Madsen, H., 2003. Parameter estimation in distributedhydrological catchment modelling using automatic calibrationwith multiple objectives. Advances in Water Resources 26 (2),205–216.
Maymo-Gatell, X., Tandol, V., Gossett, J.M., Zinder, S.H., 1995.Characterization of an H2-utilizing enrichment culture thatreductively dechlorinates tetrachloroethene to vinyl chlorideand ethene in the absence of methanogenesis andacetogenesis. Applied and Environmental Microbiology 61 (11),3928–3933.
Maymo-Gatell, X., Chien, Y., Gossett, J.M., Zinder, S.H., 1997.Isolation of a bacterium that reductively dechlorinatestetrachloroethene to ethene. Science 276 (5318), 1568–1571.
Robinson, J.A., Tiedje, J.M., 1983. Non-linear estimation of Monodgrowth kinetic-parameters from a single substrate depletion
curve. Applied and Environmental Microbiology 45 (5), 1453–1458.
Schaefer, C.E., Condee, C.W., Vainberg, S., Steffan, R.J., 2009.Bioaugmentation for chlorinated ethenes using Dehalococcoidessp.: Comparison between batch and column experiments.Chemosphere 57 (2), 141–148.
Smits, T.H.M., Devenoges, C., Szynalski, K., Maillard, J., Holliger, C.,2004. Development of a real-time PCR method for quantificationof the three genera dehalobacter, dehalococcoides, anddesulfitobacterium in microbial communities. Journal ofMicrobiological Methods 57 (3), 369–378.
Sung, Y., Ritalahti, K.M., Apkarian, R.P., Loffler, F.E., 2006.Quantitative PCR confirms purity of strain GT, a noveltrichloroethene-to-ethene-respiring Dehalococcoides isolate.Applied and Environmental Microbiology 72 (3), 1980–1987.
Tandoi, V., Distefano, T.D., Bowser, P.A., Gossett, J.M., Zinder, S.H., 1994. Reductive dehalogenation of chlorinated ethenesand halogenated ethanes by a high-rate anaerobicenrichment culture. Environmental Science & Technology 28(5), 973–979.
Uyttebroek, M., Breugelmans, P., Janssen, M., Wattiau, P., Joffe, B.,Karlson, U., Ortega-Calvo, J.J., Bastiaens, L., Ryngaert, A.,Hausner, M., Springael, D., 2006. Distribution of theMycobacterium community and polycyclic aromatichydrocarbons (PAHs) among different size fractions of a long-term PAH-contaminated soil. Environmental Microbiology 8(5), 836–847.
Vrugt, J.A., Robinson, B.A., 2007. Improved evolutionaryoptimization from genetically adaptive multimethod search.Proceedings of the National Academy of Sciences of theUnited States of America 104 (3), 708–711.
Yang, Y.R., McCarty, P.L., 1998. Competition for hydrogenwithin a chlorinated solvent dehalogenating anaerobicmixed culture. Environmental Science & Technology 32,3591–3597.
Yang, Y.R., McCarty, P.L., 2000. Biologically enhanced dissolutionof tetrachloroethene DNAPL. Environmental Science &Technology 34 (14), 2979–2984.
Yu, S., Semprini, L., 2004. Kinetics and modeling of reductivedechlorination at high PCE and TCE concentrations.Biotechnology and Bioengineering 88 (4), 451–464.
Yu, S., Dolan, M.E., Semprini, L., 2005. Kinetics and inhibition ofreductive dechlorination of chlorinated ethylenes by twodifferent mixed cultures. Environmental Science &Technology 39 (1), 195–205.