Embed Size (px)
Citation preview
Louisiana State UniversityLSU Digital Commons
LSU Master's Theses Graduate School
2003
Dechlorination of 1,2,3,4-Tetrachlorobenzene inorganic matter- and mineral-dominated soils andeffects of Typha latifolia rootsLizhu LinLouisiana State University and Agricultural and Mechanical College
Follow this and additional works at: https://digitalcommons.lsu.edu/gradschool_theses
Part of the Civil and Environmental Engineering Commons
This Thesis is brought to you for free and open access by the Graduate School at LSU Digital Commons. It has been accepted for inclusion in LSUMaster's Theses by an authorized graduate school editor of LSU Digital Commons. For more information, please contact [email protected].
Recommended CitationLin, Lizhu, "Dechlorination of 1,2,3,4-Tetrachlorobenzene in organic matter- and mineral-dominated soils and effects of Typha latifoliaroots" (2003). LSU Master's Theses. 3054.https://digitalcommons.lsu.edu/gradschool_theses/3054
DECHLORINATION OF 1,2,3,4-TETRACHLOROBENZENE IN ORGANIC MATTER- AND MINERAL-DOMINATED SOILS AND EFFECTS OF TYPHA
LATIFOLIA ROOTS
A Thesis
Submitted to the Graduate Faculty of the Louisiana State University and
Agricultural and Mechanical College in partial fulfillment of the
requirements for the degree of Master of Science in Civil Engineering
in
The Department of Civil and Environmental Engineering
by Lizhu Lin
B. S., Xiamen University, China, 2000 May 2003
ACKNOWLEDGMENTS
The author would like to express her profound thanks to her major professor, Dr.
John H. Pardue, for his constructive guidance, grateful help and support throughout the
course of this thesis. Special thanks are also due to Dr. William M. Moe and Dr. Clinton
S. Willson for their sincere advice, suggestion and help during the course of the research.
The author wants to extend her grateful appreciation to colleagues, Dr. Gabriel R.
Kassenga, Ms. Kimberly Bowman and Ms. Congna Li, for their sincere assistance in
conducting the experiments. The author would also like to thank other colleagues of the
Wetland Research Group, Dr. Cesar Gomez, Dr. Sangjin Lee, Julius Enock, Ms Eun-Ju
Lee, Jason House, Stephen Mbuligwe, and Jeff Maynor, for their help in various ways
and sharing experience.
Grateful support of the Hazardous Substance Research Centers/South &
Southwest Center (HSRC) for this research project is also highly acknowledged.
Most importantly, the author wishes to express special thanks to her husband,
Yunzhou Chai, for his endless love and encouragement; to her parents, Yinmou Lin and
Fengyu Lin, and her brother and sister for their constant encouragement and support.
ii
TABLE OF CONTENTS ACKNOWLEDGMENTS .................................................................................................. ii LIST OF TABLES.............................................................................................................. v LIST OF FIGURES ........................................................................................................... vi ABSTRACT..................................................................................................................... viii CHAPTER 1. INTRODUCTION ....................................................................................... 1
1.1 Justification of the Study ...................................................................... 1 1.2 Objectives ............................................................................................. 5 1.3 Organization of the Thesis .................................................................... 6
CHAPTER 2. LITERATURE REVIEW ............................................................................ 7
2.1 Chlorobenzenes Degradation Pathways and Kinetics........................... 7 2.2 Role of Organic Carbon Content in Dechlorination ............................. 8 2.3 Electron Donors .................................................................................... 9 2.4 Role of Methanogens in Dechlorination ............................................. 10 2.5 Effects of Rhizosphere on Dechlorination.......................................... 12 2.6 Dechlorinating Organisms .................................................................. 13
CHAPTER 3. DECHLORINATION OF 1,2,3,4-TETRACHLOROBENZENE IN ORGANIC MATTER- AND MINERAL-DOMINATED SOILS................................... 16
3.1 Introduction......................................................................................... 16 3.2 Materials and Methods........................................................................ 17
3.2.1 Chemicals................................................................................... 17 3.2.2 Soils............................................................................................ 17 3.2.3 Microcosm Experiment.............................................................. 18 3.2.4 Analytical Procedures ................................................................ 20 3.2.5 Molecular Analysis .................................................................... 23 3.2.6 Data Analysis ............................................................................. 26
3.3 Results and Discussion ....................................................................... 28 3.3.1 Fate of 1,2,3,4-Tetrachlorobenzene in Microcosms .................. 28 3.3.2 Dechlorination Pathways and Kinetics ...................................... 32 3.3.3 Hydrogen and Methane Concentrations..................................... 47 3.3.4 Diversities of Microbial Communities....................................... 59
3.4 Conclusions......................................................................................... 64 CHAPTER 4. EFFECTS OF TYPHA LATIFOLIA ROOTS ON DECHLORINATION OF 1,2,3,4-TETRACHLOROBENZENE............................................................................... 67
4.1 Introduction......................................................................................... 67 4.2 Materials and Methods........................................................................ 69
4.2.1 Chemicals................................................................................... 69
iii
4.2.2 Soil Collection and Root Preparation ........................................ 70 4.2.3 Microcosm Experiment.............................................................. 70 4.2.4 Analytical Procedures ................................................................ 72 4.2.5 Molecular Analysis .................................................................... 75 4.2.6 Data Analysis ............................................................................. 78
4.3 Results and Discussion ....................................................................... 79 4.3.1 Dechlorination Pathways and Kinetics ...................................... 79 4.3.2 Organic Acids, Hydrogen and Methane Concentrations ........... 87 4.3.3 Diversities of Microbial Communities....................................... 90
4.4 Conclusions......................................................................................... 92 CHAPTER 5. CONCLUSIONS AND RECOMMENDATIONS.................................... 94 REFERENCES ................................................................................................................. 98 APPENDIX..................................................................................................................... 106
I: DECHLORINATION PROFILES AND METHANE AND HYDROGEN CONCENTRATION TRENDS IN NATURAL WETLAND SOIL................................................................................... 106
II: DECHLORINATION PROFILES AND METHANE AND HYDROGEN CONCENTRATION TRENDS IN RIVER SEDIMENT112
III: DECHLORINATION PROFILES AND METHANE AND HYDROGEN CONCENTRATION TRENDS IN PPI SOIL................. 118
VITA............................................................................................................................... 124
iv
LIST OF TABLES 3.1: List of daughter products in the 1st, 2nd and 3rd Generation cultures of all test soils. 33 3.2: Dechlorination statuses of intermediate daughter products. ...................................... 37 3.3: Dechlorination rate constants, half-life times and associated lag periods for each
generation culture in each type of soil........................................................................ 39 3.4: Total organic carbon contents of the test soils........................................................... 42 4.1: List of treatments based on the amounts of Typha roots. .......................................... 70 4.2: List of daughter products in all treatments. ............................................................... 80 4.3: Dechlorination kinetic rate constants, half-life times and lag periods....................... 86 4.4: Fermentation reactions of fatty acids......................................................................... 89
v
LIST OF FIGURES 3.1: 1,2,3,4-TeCB dechlorination profile in the 1st Generation cultures of abiotic and
active control microcosms of natural wetland soil. .................................................. 29 3.2: 1,2,3,4-TeCB dechlorination profile in the 1st Generation cultures of abiotic and
active control microcosms of constructed wetland soil. ........................................... 29 3.3: 1,2,3,4-TeCB dechlorination profile in the 1st Generation cultures of abiotic and
active control microcosms of river sediment. ........................................................... 30 3.4: 1,2,3,4-TeCB dechlorination profile in the 1st Generation cultures of abiotic and
active control microcosms of PPI soil. ..................................................................... 30 3.5: 1,2,3,4-TeCB dechlorination profiles in the 1st, 2nd and 3rd Generation cultures of
active control constructed wetland soil microcosms. ............................................... 40 3.6: Dechlorination profiles and methane and hydrogen concentration trends in
constructed wetland soil microcosms. ...................................................................... 48 3.7: DGGE band profile using bacteria primers for active control microcosms of the test
soils. .......................................................................................................................... 61 3.8: DGGE fingerprints of PCR products of bacteria and archaea for comparison of
microbial diversities in active control and BES-amended microcosms of the test soils. .......................................................................................................................... 62
4.1: Dechlorination profile of 1,2,3,4-TeCB in RCLR treatment..................................... 81 4.2: Methane and hydrogen concentrations in RCLR treatment....................................... 81 4.3: Dechlorination profile of 1,2,3,4-TeCB in RCMR treatment.................................... 82 4.4: Methane and hydrogen concentrations in RCMR treatment. .................................... 82 4.5: Dechlorination profile of 1,2,3,4-TeCB in RCSR treatment. .................................... 83 4.6: Methane and hydrogen concentrations in RCSR treatment....................................... 83 4.7: Dechlorination profile of 1,2,3,4-TeCB in RCNR treatment. ................................... 84 4.8: Methane and hydrogen concentrations in RCNR treatment. ..................................... 84 4.9: Dechlorination of 1,2,3,4-TeCB in treatments with different amounts of roots........ 86
vi
4.10: Acetic acid concentrations in all treatments. ........................................................... 88 4.11: Propionic acid concentrations in all treatments. ...................................................... 88 4.12: DGGE fingerprints for investigation of the effects of Typha roots on microbial
diversity..................................................................................................................... 91
vii
ABSTRACT
A variety of environments are contaminated with chlorinated benzenes.
Therefore, investigating the biodegradation of chlorobenzenes in different types of soils
is useful in assessing the feasibility of bioremediation. One mineral-dominated soil: PPI
(Petro Processors Inc. site) soil, and three organic matter-dominated soils (natural
wetland soil, constructed wetland soil (a mixture of peat, compost and sand), and river
sediment) were used to investigate anaerobic biodegradation of 1,2,3,4-
Tetrachlorobenzene (1,2,3,4-TeCB) using laboratory microcosms. To determine whether
methanogens were directly responsible for dechlorination, a comparative study using 2-
bromoethanesulfonic acid (BES) for inhibition of methanogenesis was conducted.
Hydrogen and methane concentrations, and microbial diversities were analyzed. The
results of the present study showed that 1,2,3,4-TeCB was completely biodegraded in all
test soils with different microbial communities. The most dominant dechlorination
pathway was: 1,2,3,4-TeCB 1,2,3-TCB 1,2-DCB + 1,4-DCB + 1,3-DCB
monochlorobenezene + benzene. The test chemical was biodegraded at rates ranging
from 0.023 day-1 (half-life time of 30.5 days) to 1.108 day-1 (half-life time of 0.6 days),
with lag periods varied between 1 and 72 days. Dechlorination kinetics of chlorobenzenes
was found to depend on many factors other than organic carbon content. DGGE banding
profile, methane concentration and dechlorination activities suggest that BES probably
changed the compositions of bacteria consortia, and partly inhibited methanogenesis and
chlorobenzene dechlorination. Moreover, methanogens were probably not directly
responsible for dechlorination of chlorobenzenes.
viii
Rhizosphere of some plants can enhance rhizodegradation of organic
contaminants. Thus, the present study also investigated the effects of Typha latifolia L.
roots on anaerobic degradation of 1,2,3,4-TeCB. Biodegradation rate constant of 1,2,3,4-
TeCB was observed to increase with increasing amounts of roots, indicating that Typha, a
native wetland plant, could be a very promising vegetation for application in
phytoremediation. Due to root matter, higher concentrations of organic acids and
hydrogen were observed in treatments with roots compared with the treatment without
roots, which probably caused higher dechlorination activities in root-amended
microcosms.
ix
CHAPTER 1. INTRODUCTION 1.1 Justification of the Study
Chlorinated benzenes constitute one of the major classes of pollutants in the
environment because of their extensive application by industry, which ranges from
solvents, odorizers, insect repellents, and fungicides to intermediates in the
manufacturing of various chemicals such as the synthesis of some dyes and pesticides
(Oliver et al., 1982; Middeldorp et al., 1997). Chlorobenzenes have been introduced into
the environment through accidental spillage, leakage of storage facilities, indiscriminate
usages and poor disposal practices. Due to their hydrophobic nature and strong
persistence, chlorobenzenes have been found in surface waters, groundwater, sediments,
soils, sewage sludge, and in the subsurface environment (Schwarzenbach, et al., 1979;
Oliver et al., 1982; Bailey, 1983; Pesticide Residue Monitoring Database Users' Manual,
FDA website, 2002). Furthermore, chlorobenzenes have the tendency of bioaccumulating
in the food chain and, thus, have been found in animals and plant tissues (Adrian et al.,
1998; Pavlostathis and Prytula, 2000). According to the US National Primary Drinking
Water Regulations, the maximum contaminant level (MCL) for protection of human
health and the environment for benzene, 1,2-dichlorobenzene (1,2-DCB), 1,4-
dichlorobenzene (1,4-DCB), 1,2,4-trichlorobenzene (1,2,4-TCB) and hexachlorobenzene
(HCB) are 0.0, 0.6, 0.075, 0.07, 0.001 mg/L, respectively (EPA, 2002a).
Due to the toxicity and bioaccumulative properties of chlorobenzenes, appropriate
methods for remediation of sites contaminated with these pollutants have been
investigated by many researchers. A variety of technologies for remediation of
chlorinated contaminants are available, including ex-situ physical/chemical treatment
1
such as pump and treat systems, where treatment is provided by air stripping, air
sparging, catalytic oxidation, among others; and biological treatment methods such as
intrinsic natural attenuation, biostimulation and ex-situ bioremediation, e.g. constructed
wetland systems (Fetter, 1993). Biological treatment methods are especially suitable for
effective renovation of soil and groundwater contaminated with low concentrations of
dissolved chlorinated organics, since they involve destruction of contaminants and thus,
little to no residual treatment is required, unlike the physical/chemical treatment methods
(Fetter, 1993). Furthermore, biological treatment methods are typically implemented at
low cost. Therefore, biological methods are more attractive and promising alternatives to
traditional physical/chemical methods in remediation of sites contaminated with
chlorobenzenes. For these reasons, many laboratory and field studies on biological
transformation of chlorobenzenes under aerobic and anaerobic conditions have been
conducted to investigate the feasibility of bioremediation in cleaning-up of contaminated
sites (Beurskens et al., 1994; Masunaga et al., 1996; Potrawfke et al., 1998).
Chlorobenzenes may be transformed under aerobic and anaerobic conditions. The
lower chlorinated benzenes are highly reduced and thus more amenable to oxidative
degradation than anaerobic degradation. Organisms that catalyze aerobic degradation
have been isolated and studied in pure cultures (Reineke et al., 1984; Debont et al., 1986;
Schraa, et al. 1986; Spain, et al., 1987; Sander, et al., 1991; Potrawfke et al., 1998). On
the other hand, the more highly chlorinated benzenes are highly oxidized and, therefore,
tend to resist aerobic degradation. Highly chlorinated benzenes are susceptible to
anaerobic reductive dechlorination to less toxic, lower chlorinated benzenes which may
be readily aerobically biodegraded (Fathepure et al., 1988; Pardue, 1992; Holliger et al.,
2
1992; Pardue et al., 1993; Ramand et al., 1993; Masunaga et al., 1996; Chang et al., 1997;
Jackson and Pardue, 1998; Pavlostathis and Prytula, 2000; Wu et al., 2002; Chen et al.,
2002). Benzene, one of the final products of anaerobic dechlorination of chlorobenzenes
is a known human carcinogen (EPA, 2002b). However, it can be effectively degraded
aerobically and can also biodegrade under anaerobic conditions (Burland and Edwards,
1999; Deeb and Alvarez-Cohen; 1999).
The degree of anaerobic dechlorination of chlorobenzenes varies depending on
dechlorinating microbial consortia as affected by incubation conditions. Isolation of
microbes capable of complete dechlorination of chlorobenzenes has therefore been a
subject of intensive research recently. However, obtaining pure chlorobenzenes
dechlorinating microbial culture has been difficult because of the high toxicity and the
low solubility of chlorobenzenes in water (Adrian et al., 1998; Chang et al., 2002). Strain
CBDB1, a strict anaerobe, is the only known pure culture capable of reductively
dechlorinating 1,2,3-trichlorobezene (1,2,3-TCB), 1,2,4-TCB and all three
tetrachlorobenzene isomers (Adrian et al., 2000). Microbial consortia which are capable
of anaerobic reductive dechlorination of chlorinated benzenes have a potential for
bioremediation of polluted sites, either in-situ (e.g., in-situ natural attenuation) or ex-situ
(e.g., in bioreactors). A subsequent aerobic treatment may then lead to the final
mineralization of the lower chlorinated benzenes and benzene. A two-stage process
combining initial anaerobic reductive dechlorination to less chlorinated benzenes with
further aerobic treatment for complete degradation may be the method of choice
(Middeldorp et al., 1997). However, it is also possible that chlorobenzenes can be
completely biodegraded to nontoxic compounds such as CO2 under anaerobic conditions
3

since benzene can be biodegraded anaerobically (Burland and Edwards, 1999; Deeb and
Alvarez-Cohen; 1999).
Few studies have been reported on the potential of dechlorination of
chlorobenzenes in different types of soils without external addition of electron donors or
nutrients. In the present study, 1,2,3,4- tetrachlorobenzene (1,2,3,4-TeCB) was selected
as a test chemical, since it is the most hydrophobic chlorobenzene that could be degraded
by certain halorespiring organisms such as Strain CBDB1 (Adrian et al., 2000).
Therefore, reductive anaerobic dechlorination of 1,2,3,4-TeCB in three different types of
organic matter-dominated soils, i.e., natural wetland soil, constructed wetland soil (a
synthetic mixture of peat, sand and compost), and river sediment; and one mineral-
dominated soil collected from a Superfund site in Baton Rouge, Louisiana (Petro
Processors Inc. (PPI)) were investigated. The purpose of this study was to investigate the
potential of these soils for dechlorination of 1,2,3,4-TeCB to provide important
information for the feasibility assessment of bioremediation of contaminated sediments.
Methane, hydrogen and volatile fatty acids associated with dechlorination reactions were
also investigated. Since the role of methanogens in dechlorination is not clear, this study
also included the comparison of dechlorination activities and microbial populations under
non-inhibited and 2-bromoethanesulfonic acid (BES) inhibited conditions.
Rapid microbial degradation rates of organic chemical residues have been
observed in vegetated sediments due to the reaction of the plant roots and associated
microbial communities (Anderson et al., 1993; Anderson and Walton, 1995; Narayanan
et al., 1995; Pardue et al., 1996; EPA, 2000). However, few studies have investigated the
role of the rhizosphere of wetland plants in anaerobic degradation of highly chlorinated
4
benzenes. To evaluate the role of plants in bioremediation of chlorobenzenes
contaminated sites, the effects of the root matter on dechlorination activity and microbial
community were also covered in this study.
1.2 Objectives
The overall objective of this study was to develop an understanding of the
biodegradation kinetics and pathways of 1,2,3,4-TeCB under active and BES-inhibited
methanogenesis in organic matter- and mineral-dominated soils. In addition, the role of
the rhizosphere of a wetland plant (Typha latifolia L.) in dechlorination of 1,2,3,4-TeCB
and its effects on the microbial populations were also investigated. The specific
objectives were as follows:
(i)
(ii)
(iii)
(iv)
(v)
To determine the dechlorination kinetics and pathways of 1,2,3,4-TeCB in three
different types of organic matter-dominated soils, i.e., natural wetland soil,
constructed wetland soil (a synthetic mixture of peat, sand and compost), and
river sediment; and in one mineral-dominated soil: PPI soil;
To establish and compare the diversity of 1,2,3,4-TeCB dechlorination microbial
communities in the test soils under uninhibited and BES-inhibited conditions;
To investigate the effects of acclimation on degradation kinetics and pathways of
the test chemical;
To correlate dechlorination kinetics of 1,2,3,4-TeCB with concentrations of
methane and hydrogen in different types of soils; and
To investigate the effects of wetland plant roots on dechlorination kinetics,
biodegradation pathways of 1,2,3,4-TeCB, and the diversity of biodegrading
microbial populations.
5
1.3 Organization of the Thesis
In this thesis, Chapter 1 gives a general background of the research including the
justification for conducting this study and research objectives. Chapter 2 is a literature
review of anaerobic biodegradation of chlorobenzenes. Chapter 3 presents the results of
1,2,3,4-TeCB biodegradation studies in organic matter- and mineral-dominated soils,
including degradation kinetics and pathways, and the diversity of microbial populations.
The correlation of biodegradation of the test chemical with methane and hydrogen
concentrations is also covered in Chapter 3. The effects of the root matter of a wetland
plant, Typha latifolia L., on dechlorination of 1,2,3,4-TeCB and microbial consortia in
river sediment are addressed in Chapter 4. Finally, Chapter 5 summarizes the major
findings and the implications of the study. Some recommendations for future research are
also given.
6
CHAPTER 2. LITERATURE REVIEW 2.1 Chlorobenzenes Degradation Pathways and Kinetics
In many cases, chlorinated benzenes are present in environments where oxygen is
not available (e.g., sediments and deep aquifers). Under these circumstances, many
studies have shown that anaerobic reductive dechlorination yields lower chlorinated
benzenes (Fathepure et al., 1988; Pardue, 1992; Beurskens et al., 1994; Masunaga et al.,
1996; Middeldorp et al., 1997; Pavlostathis and Prytula, 2000). Most of the
biodegradation studies of chlorobenzenes have been done using HCB; whereas some of
the studies were conducted using 1,2,3-TCB or 1,2,4-TCB, and 1,2,3,5-
tetrachlorobenzene (1,2,3,5-TeCB) or 1,2,4,5-tetrachlorobenzene (1,2,4,5-TeCB).
However, few studies have been reported on anaerobic transformation of 1,2,3,4-TeCB.
In addition, at the time of preparation of this thesis, no study has been reported on the
effects of wetland plant roots on anaerobic degradation of 1,2,3,4-TeCB. Degradation
pathways and kinetics of the most commonly studied chlorobenzene are discussed below.
The most predominant pathway reported for HCB reductive dechlorination is:
HCB pentachlorobenzene (PentaCB) 1,2,3,5-TeCB 1,3,5-TCB (Fathepure et al.,
1988; Pardue, 1992; Holliger et al., 1992; Beurskens et al., 1994; Masunaga et al., 1996;
Middeldorp et al., 1997; Chang et al., 1997; Pavlostathis and Prytula, 2000). However,
1,2,3,5-TeCB and 1,3,5-TCB were not observed during the dechlorination of HCB and
PentaCB in a study conducted by Ramanand et al. (1993). Instead, the pathway observed
in that study was as follows: HCB and PentaCB 1,2,3,4-TeCB 1,2,3-TCB + 1,2,4-
TCB 1,2-DCB + 1,4-DCB Chlorobenzene; and 1,2,3,5-TeCB was not
dechlorinated when added as a single isomer (Ramanand et al., 1993). A similar
7
dechlorination pathway of HCB was also reported by Nowak et al. (1996) for
enrichments from Saale river sediment. Another possible dechlorinating pathway for
HCB is: HCB PentaCB 1,2,4,5-TeCB 1,2,4-TCB 1,3-DCB + 1,4-DCB + 1,2-
DCB (Pardue, 1992; Holliger et al., 1992).
The reported lag periods for dechlorination of chlorobenzenes vary significantly,
from no lag time or only a few days to up to 3 months due to the differences in
experimental conditions (Holliger et al., 1992; Rammand et al., 1993; Nowak et al., 1996;
Chang et al., 1997; Adrian et al., 1998; Chen et al., 2002). A wide range of dechlorination
rate constants has also been reported. For example, the first order rate constants for HCB
and 1,2,3,4-TeCB reported by Masunaga et al. (1996) are 0.0256 d-1 and 0.0382 d-1
respectively, while those observed by Pavlostathis and Prytula (2000) are 0.282 d-1 and
1.455 d-1 respectively. These correspond to half lives of HCB and 1,2,3,4-TeCB ranging
from 2.5 to 27.1 days and from 0.5 to 18.1 days, respectively.
2.2 Role of Organic Carbon Content in Dechlorination
Since chlorinated compounds are used as electron acceptors during reductive
dechlorination, there must be an appropriate source of carbon for microbial growth in
order for reductive dehalogenation to occur (Wiedermeir et al., 1999). Naturally
occurring organic matter is one of the potential carbon sources of energy for anaerobic
microorganisms. Different groups of microorganisms participate in the degradation of
dead organic matter to produce volatile fatty acids (such as propionate and formate) and
hydrogen (Conrad, 1999), which may serve as electron donors necessary for driving
anaerobic reductive dechlorination reactions. Therefore, the rate and perhaps the extent of
dechlorination are expected to depend on the organic carbon fraction of soil if other
8
factors remain constant. A number of studies have demonstrated that dechlorination
kinetics are faster in organic carbon rich soils than in soils poor in organic carbon content
because microbial activity depends on the availability of organic carbon (Klečka et al.,
1990; Lorah et al., 1997; Lorah and Olsen, 1999; Kassenga et al., 2003). Lorah et al.
(1997) observed higher dechlorination rates of TCE in freshwater wetland soils rich in
organic carbon (foc = 0.18) than in sand aquifer materials, which could have organic
carbon content as low as 0.0001 (Pardue et. al., 1999). Few, if any, study has been
reported on the effects of organic carbon content on dechlorination kinetics of
chlorobenzenes.
2.3 Electron Donors
Molecular hydrogen and a number of volatile fatty acids (e.g. lactate, propionate
and acetate) and alcohols such as ethanol and methanol have been observed to serve as
electron donors during dechlorination reactions of chlorobenzenes (Holliger et al., 1992;
Nowak et al., 1996; Adrian et al., 1998; Adrian et al., 2000). To determine the effect of
electron donors for chlorobenzene dechlorination, a number of studies have been
conducted by adding some potential electron donors to the mixed culture (Holliger et al.,
1992; Chang et al., 1997; Middeldorp et al., 1997; Adrian et al., 1998; Chen et al., 2002).
In a defined, synthetic mineral medium without any complex additions and with
pyruvate as the carbon and energy source, Adrian et al. (1998) found that formate was
used as a direct electron donor, but not hydrogen, because the addition of hydrogen did
not increase the extent of dechlorination. However, in the pure dechlorinating culture,
Strain CBDB1, chlorobenzenes served as electron acceptors and hydrogen was used as an
electron donor in the dehalorespiratory process (Adrain et al., 2000). Middeldorp et al.
9
(1997) reported that 1,2,4-TCB was able to be degraded with hydrogen, lactate, glucose,
propionate, ethanol, methanol or acetate added separately as an electron donor in a
methanogenic consortium prepared from a mixture of polluted sediments. However,
addition of formate as an electron donor did not support dechlorination of 1,2,4-TCB
(Middeldorp et al., 1997). On the other hand, Holliger et al. (1992) reported that
hydrogen or lactate enhanced 1,2,3-TCB dechlorination to a greater extent than pyruvate
or acetate in enrichment cultures originating from percolation columns filled with Rhine
River sediment, in which dechlorination of trichlorobenzenes and dichlorobenzenes
(TCBs and DCBs) occurred.
From the preceding discussion, it can be inferred that dechlorination activities of
chlorobenzenes vary depending on the type of microbial culture involved as affected by
both the type of electron donor and the type of medium used during the study. It is
obvious that factors that may influence dechlorination reactions of chlorobenzenes are
varied and complex. In most cases it is difficult to ascertain whether a given factor
directly affects the specific dechlorinating organism or works against other organisms in
the dechlorinating consortium as Chen et al. (2002) also observed.
2.4 Role of Methanogens in Dechlorination
BES, a potent methanogenesis inhibitor, has traditionally been used for evaluation
of the role of methanogenesis in dechlorination reactions (Nowak et al., 1996;
Middeldorp et al., 1997; Adrian et al., 1998; Pavlostathis and Prytula, 2000). Middeldorp
et al. (1997) found that methanogenesis was completely inhibited when 5 mM BES was
added, but dechlorination was not inhibited. However, in another methanogenic
dechlorinating consortium, BES completely inhibited the dechlorination of
10
chlorobenzenes, which indicates that BES is not a specific inhibitor for methanogenesis
as has been proposed, but may also directly inhibit dechlorination (Middeldorp et al.,
1997). It was, therefore, hypothesized that the addition of BES probably excluded
methanogens or a methanogen-dependent group of bacteria, which indicated that the
dechlorinating population probably consisted of BES-sensitive and BES-insensitive
bacteria. Those two different dechlorinating groups of bacteria probably performed
different dechlorination patterns (Middeldorp et al., 1997). Pavlostathis and Prytula
(2000) also reported that methane production was inhibited in BES-amended culture
prepared from contaminated estuarine sediment, but sequential reductive dechlorination
of HCB occurred at a comparable rate and a pattern similar to that observed in the non-
amended culture, which indicated that methanogens were probably not directly
responsible for the reductive dechlorination. Adrian et al. (1998) also consistently
observed that methanogenesis was successfully eliminated by the addition of 4 mM BES,
and the presence of BES resulted in a significant increase in the extent of
trichlorobenzene dechlorination. Therefore, the stimulating effect of BES on
dechlorination may have partly been due to the elimination of methanogenic bacteria,
which compete with dechlorinating bacteria for electron donors (Adrian et al. 1998).
However, Nowak et al. (1996) found that dechlorination of three isomers of
trichlorobenzenes in BES-amended culture occurred at a significantly slower rate
compared to the un-amended culture, although dechlorination of trichlorobenzenes was
observed in BES-adapted culture. These results indicated that methanogens are important
for the syntrophic associations within the anaerobic food chain (Nowak et al., 1996).
11
From the above discussion, it can be concluded that the potency of BES on
dechlorinating activities varies significantly depending on the type of methanogenic-
dechlorinating consortium involved, among other factors.
2.5 Effects of Rhizosphere on Dechlorination
Enhancement of degradation of organic compounds in the root zone is termed
“rhizodegradation”, or plant-assisted degradation (EPA, 2000). Rapid degradation of
chlorinated organics has been observed in the rhizosphere, the region immediately
adjacent to plant roots (Anderson and Walton, 1995; Pardue et al., 1996; Jordahl et al.,
1997; Lorah et al., 1999). Anderson and Walton (1995) found that degradation of TCE
was accelerated in slurries of rhizosphere soils compared to non-vegetated soil. Jordahl et
al. (1997) observed higher populations of benzene-, toluene-, and o-xylene-degrading
bacteria in the rhizosphere of poplar trees than in the non-rhizosphere soil.
Enhancement of biodegradation in the rhizosphere could be obtained from the
mutual benefit of the interaction between plant roots and microbial communities in the
rhizosphere (Anderson et al., 1993). Plants sustain large microbial populations in the
rhizosphere by secreting substances such as carbohydrates and amino acids through the
root cells and by sloughing root epidermal cells (Anderson et al., 1993). Mucigel (a
gelatinous substance secreted by the root cells as a lubricant for root penetration) along
with other cell secretions such as organic acids, fatty acids, and amino acids, constitutes
root exudates. In the rhizosphere, microbial populations may be nourished from root
exudation and decaying plant matter (Anderson et al., 1993). Therefore, the presence of
root exudates could contribute to the increase of microbial populations and activities in
the rhizosphere (Anderson et al., 1993; and EPA, 2000). Higher microbial counts were
12
found in the rhizospheres of pesticide-treated plants, which implied that the increase in
microbial biomass caused the decrease in persistence of certain toxicants in the
rhizosphere (Anderson et al., 1993).
Increased biodegradation rates observed in the rhizosphere may also be the result
of greater O2 concentration provided by the roots (Anderson et al., 1993; Pardue et al.,
1999). A zone of aeration is provided when plant roots penetrate the soil (Susarla et al.,
2002). Plants transfer oxygen through the leaves and stems to the roots, forming an
oxygen layer adjacent to the roots, which may reach a thickness of 0.5 mm (Christensen
et al., 1994). Since the rhizosphere has an extremely large surface area, it brings
anaerobic (the bulk soil) and aerobic zones in close contact, which may enhance
degradation (Pardue et al., 2000).
Another possible factor that could cause accelerated biodegradation in the
rhizosphere is that the rhizosphere may provide a habitat in which the microbial consortia
capable of growth on organic contaminants may flourish (Anderson et al., 1993). Lappin
et al. (1985) found that an individual specie of microorganism isolated from the
degrading microbial communities was not capable of growing on or degrading the same
herbicide mecoprop used in the same study. However, two or more species together could
degrade and grow on mecoprop. Therefore, microbial consortia, rather than individual
microbial species, are likely to be involved in the degradation of numerous toxicants in
the rhizosphere (Anderson et al., 1993).
2.6 Dechlorinating Organisms
Except for Strain CBDB1 (Adrian et al., 2000), no other bacteria in pure culture
capable of dechlorinating chlorobenzenes have been isolated so far. The major limitation
13
in isolation of chlorobenzene-dechlorinating bacteria is to provide enough chlorobenzene
in aqueous phase to sustain growth without the chemical reaching toxic levels (Adrian et
al., 1998; Chang et al., 2002). Strain CBDB1 is capable of coupling growth to
dechlorination of several CBs including 1,2,3,4-TeCB or 1,2,4,5-TeCB which are
degraded to 1,2,4-TCB, and finally 1,3-DCB plus 1,4-DCB; and 1,2,3,5-TeCB which is
transformed to 1,3,5-TCB. The isolate does not dechlorinate PentaCB or HCB (Adrian et
al., 2000). Recently, Wu et al. (2002) reported the first organism, bacterium DF-1, a
polychlorinated biphenyls (PCBs) dechlorinating bacterium, which can dechlorinate
chlorobenzenes with more than four chlorines and PCBs.
A number of factors may affect the composition of the dechlorinating population.
Temperature is an important factor that may directly affect dechlorinating activities. For
example, the optimum temperature for dechlorination found by Chang et al. (1997) was
approximately 5°C higher than that reported by Holliger et al. (1992). The differences in
the optimum dechlorinating temperature were probably due to the existence of different
microbial communities in the two studies among other factors (Chang et al., 1997).
Therefore, it is important to correlate dechlorination activities with microbial community,
which can be accomplished by using Polymerase Chain Reaction (PCR) based
Denaturing Gradient Gel Electrophoresis (DGGE) technique.
It is commonly accepted that PCR-DGGE is a suitable technique to assess the
differences in diversities of microbial communities and to monitor changes in microbial
consortia (Kozdrόj and Elsas, 2000; Casamayor et al., 2000). Using DGGE technique,
Chiu and Lee (2001) showed alteration of the bacterial community of an anaerobic
enrichment culture that dechlorinated TCE due to long-term exposure to BES.
14
Macnaughton et al. (1999) were also able to monitor changes in the structure and
diversity of the bacterial community during crude oil biodegradation using PCR-DGGE
technique. However, the species richness or total microbial diversity in the system can
not be accurately estimated with this method (Casamayor et al., 2000). This limitation is
due to biases on PCR amplification of DNA (Wintzingerode et al., 1997). In addition,
DGGE can not show all populations (Casamayor et al., 2000). Casamayor et al. (2000)
reported that populations accounting for less than 1% of the total cell count can not be
retrieved by DGGE. Therefore, the image of DGGE fingerprinting patterns provides
more information on the structure of the main microbial populations than accurate
richness of specific species in the sample.
15
CHAPTER 3. DECHLORINATION OF 1,2,3,4-TETRACHLOROBENZENE IN ORGANIC MATTER- AND MINERAL-DOMINATED SOILS
3.1 Introduction
Chlorinated benzenes are widespread pollutants and have been found in different
environments (Schwarzenbach, et al., 1979; Oliver et al., 1982; Bailey, 1983). Numerous
studies have been conducted on the anaerobic reductive dechlorination of chlorobenzenes
(Holliger et al., 1992; Pavlostathis and Prytula, 2000), however, few studies have been
done on the potential of dechlorination of chlorobenzenes in different types of soils
without any addition of electron donors or nutrients. In order to assess the feasibility of
natural attenuation and ex-situ bioremediation for remediation of chlorinated benzene-
contaminated sites, studies on biodegradation of 1,2,3,4-TeCB in different types of soils
were conducted. Organic matter-dominated soils (natural wetland soil, constructed
wetland soil and river sediment) and mineral-dominated soil (PPI soil) were used to
investigate the effects of organic carbon on dechlorination. Since the role of methanogens
in dechlorination is yet to be clear, a comparative study using BES as an inhibitor of
methanogenesis was conducted. Diversities of microbial communities in the soils were
also investigated using DGGE on DNA extracted and amplified from each soil during
active dechlorination. Concentrations of methane and hydrogen were measured to
establish the correlation between these parameters and dechlorination.
The objectives of the present study were: (i) to determine the dechlorination
kinetics and pathways of 1,2,3,4-TeCB in three different types of organic matter-
dominated soils, i.e., natural wetland soil, constructed wetland soil, and river sediment;
16
and in one type of mineral-dominated soil: PPI soil; (ii) to establish and compare the
diversities of 1,2,3,4-TeCB dechlorination microbial populations in the test soils and
under uninhibited and BES-inhibited conditions; (iii) to investigate the effects of
acclimation on degradation kinetics and pathways of the test chemical; and, (iv) to
correlate dechlorination kinetics of 1,2,3,4-TeCB with concentrations of methane and
hydrogen in the test soils.
3.2 Materials and Methods
3.2.1 Chemicals
Neat 1,2,3,4-TeCB from Supelco (Bellefonte, PA) was used as the test chemical
in this study. 1,2,3-TCB, 1,2,4-TCB, 1,3,5-TCB, 1,2-DCB, 1,3-DCB and 1,4-DCB used
for calibration were analytical grade from Sigma-Aldrich. Standards for benzene and
monochlorobenzene, internal standards and surrogates for EPA Method 8260 were
procured from Supelco. Methane used for calibration was also obtained from Supelco
Inc. (Supelco, Bellefonte, PA). Hydrogen standards were obtained from BOC Group Inc.
(Baton Rouge, LA). HPLC grade hexane and methanol were used as solvents.
3.2.2 Soils
Natural wetland soil was collected from a pristine freshwater wetland in
Madisonville, Louisiana. The wetland soil used for microcosm study was a mixture of
soils collected from the ground surface to a depth of 30 cm. River sediment was obtained
from Bayou Duplantier, Baton Rouge, Louisiana. Constructed wetland soil was a mixture
of Bion soil (Dream Maker Dairy, Cowlesville, NY), Latimer peat (Latimer’s Peat Moss
Farm, West Liberty, OH), and fine to medium sand mixed at a ratio of 1.3: 1.1: 1 (Bion
Soil: Latimer peat: Sand) by weight, which was found to be potentially a promising soil
17
mixture for construction of a treatment wetland for attenuation of chlorinated volatile
organic compounds (Kassenga et al., 2003). PPI soil was collected from a former organic
wastes disposal site (Petro-Processors Inc. site) in Baton Rouge, Louisiana. The primary
organic waste components of the disposal site were hexachlorobutadiene (HCBD) and
HCB, halogenated solvents, and polynuclear aromatic hydrocarbons. Trace amounts of
chlorobenzenes were detected in the PPI soil used for the present study (data not shown).
Total organic matter (OM) of the test soils was estimated by weighing oven-dried
soils before (103 °C for 24 hours) and after combustion at 550 °C for 24 hours (Nyman et
al., 1997). Total organic carbon content (TOC) was calculated from total organic matter
(OM) using a division factor of 1.7, i.e., TOC = OM /1.7 (Allison, 1965).
3.2.3 Microcosm Experiment
Triplicate anaerobic microcosms were set up in a glove bag (I2R, Cheltenham,
PA) under a nitrogen atmosphere. Four types of test soils, namely, natural wetland soil,
constructed wetland soil, river sediment and PPI soil, were homogenized and packed in
160 mL serum bottles leaving 20 mL headspace. A volumetric ratio of water to sediment
of 1.5: 1 was used (Lorah et al., 1997). Pore water collected from the freshwater wetland
was used for preparation of natural wetland soil microcosms. All other microcosms were
prepared using deionized water. All bottles were sealed with Teflon-lined rubber septa
and aluminum crimp seals and incubated in an inverted position under static and dark
conditions at 25 °C. Microcosms were neither amended with electron donors nor
nutritional supplements to support microbial growth.
1,2,3,4-TeCB was dissolved in methanol (Pavlostathis and Prytula, 2000) and
then spiked into microcosms to a final concentration of about 150 mg/kg dry weight of
18
soil. A relatively small volume of methanol of between 0.5 mL and 1 mL (in a total of
140 mL slurry) was used for spiking the test chemical in order to limit the effects of
methanol on dechlorination. To minimize the amount of methanol, the bottles were
purged with nitrogen at 1 atm using a syringe needle for about 1 min and immediately
sealed inside the glove bag. The microbial consortia developed from the first spike of the
test chemical into the fresh soil is referred to as the 1st Generation culture. When the
concentration of the parent compound dropped below the detection limit (5 ng/µL in
hexane extract), 25 mL of slurry from the 1st Generation culture was inoculated into
microcosms prepared from fresh soil to develop the 2nd Generation culture. The 3rd
Generation culture was developed by inoculating 25 mL of slurry from the 2nd Generation
culture. The same experimental conditions were maintained for developing all microbial
cultures. Two identical sets of microcosms were set up for each generation culture. One
set was used for gas analysis and the other set was used for chlorobenzene analysis and
molecular analysis.
To understand the possible role of methanogens in dechlorination of 1,2,3,4-
TeCB, treatment using the methanogenesis inhibitor BES was conducted. To account for
abiotic losses and to confirm that the disappearance of chlorobenzenes was due to
microbial activities, another treatment was prepared using 1% formaldehyde as a biocide.
No inoculation was done for abiotic control microcosms. Therefore, three treatments
were involved in all test soils, i.e., active control, BES-amended and abiotic control.
For each spike, concentrations of the parent compound and degradation daughter
products were monitored until the concentration of the parent compound had dropped
below the detection limit of the analytical methods. Sampling of slurry for analysis of
19
chlorobenzenes was done inside the glove bag (I2R, Cheltenham, PA) in order to
maintain anaerobic conditions in the microcosms. Four mL of soil slurry was withdrawn
from microcosms after shaking the bottle to homogenize the contents, the bottle was
flushed with nitrogen at 1 atm for about 1 min and resealed. The soil slurry was then
transferred into Teflon centrifuge tube to minimize the adsorption of chlorinated
benzenes. An equal volume of hexane (i.e., 4 mL) was immediately added into the Teflon
centrifuge tubes (Holliger et al., 1992; Chang et al., 1997; Chen et al., 2002). The mixture
of slurry and hexane was then tumbled for 24 hours to facilitate the extraction of
chlorobenzenes. The suspension was centrifuged at 3,000 rpm for about 15 minutes at
room temperature and 1 mL of supernatant was transferred into an amber GC-MS vial.
Aqueous samples for analysis of benzene and monochlorobenzene were directly
withdrawn from microcosms using a gas tight syringe and transferred to autosampler
vials as well. Gas samples for analysis of methane and hydrogen were analyzed without
storage.
3.2.4 Analytical Procedures
The hexane extract was analyzed following EPA Method 8270 for the
measurement of semivolatile chlorinated benzenes (i.e., tetrachlorobenzenes,
trichlorobenzenes and dichlorobenzenes). Ten µL of semivolatile internal standards mix
(2000 µg/mL in methylene chloride, containing 1,4-dichlorobenzene-d4, naphthalene-d8,
acenaphthalene-d10, phenanthrene-d10, chrysene-d12, and perylene-d12) (Supelco Chemical
Co.) was injected into 1 mL hexane extract. The sample was then analyzed by GC-MS
(Agilent 6890 series gas chromatograph-5972A mass selective detector). The GC was
equipped with a capillary column (DB-5, 30 m × 0.25 mm i.d., 0.25 µm film thickness)
20
which was directly interfaced to the mass spectrometer. High purity helium was used as a
carrier gas at a flow rate of 1.8 mL/min. The injector temperature was 250 °C. The GC
column was initially held at 37 °C for 2 min, then ramped to 260 °C at 8 °C/min, and
finally ramped to 300 °C at 40 °C /min and held for 10 min. The detector temperature
was maintained at 280 °C.
Analysis of benzene and chlorobenzene were performed by EPA Method 8260B
using a purge and trap apparatus attached to a Agilent 6890 Series Gas Chromatograph
equipped with a 5972A mass selective detector. A thermal desorption trap (VOCARB
3000; Supelco, Bellefonte, PA) was employed in the purge and trap apparatus. The
hexane extract along with 10 µL internal standard and 2.5 µL surrogate (Supelco,
Bellefonte, PA) was manually injected into the purge and trap autosampler (Tekmar
2016) (Tekmar Dohrmann, Mason, OH), and purged for 11 min with high purity helium
at a flow rate of 35 mL/min, then desorbed for 0.5 min and baked for 13 min at 225 °C.
The samples were then introduced onto the GC equipped with a 30 m × 0.25 mm × 0.25
µm film thickness, Agilent 5MS (5% Phenyl Methyl Siloxane) capillary column (Palo
Alto, CA). High purity helium gas was used as a carrier at a flow rate of 2.1 mL/min. The
GC column temperature program was -80 °C for 1 min, ramped to 20 °C at 15 °C/min,
then ramped to 80 °C at 10 °C/min and finally ramped to 220 °C at 20 °C/min. The
temperatures of injector and detector were 250 °C and 280 °C, respectively. Aqueous
samples were directly taken from the bottle for the measurement of benzene and
chlorobenzene instead of using hexane extraction method. The analytical conditions of
GC-MS were the same except that a capillary column with 60 m × 0.32 mm × 3.00 µm
film thickness, Agilent 5MS (Palo Alto, CA) was used; and that the GC column
21
temperature program was 35 °C held for 5 min, then ramped at 4 °C/min to a final
temperature of 200 °C.
Prior to sample analysis, six-point calibration curves were established for both
methods to determine the relative response factors for the individual compound. Tune,
daily blank and calibration check were conducted to assure that the machine and the
analytical methods were in control.
Methane was measured by GC-FID. One mL of gas was withdrawn from the
headspace of the bottle using a gas tight syringe, and then injected into GC-FID (Agilent
5890 series II) equipped with a 2.4 m × 0.32 mm i. d. column packed with Carbopack b/l
% SP-1000 (Supelco, Bellefonte, PA). If methane concentration was found to be higher
than the upper range of the linear calibration, the gas sample was diluted using high
purity nitrogen at 1 atm. The injector and detector temperatures were 375 °C and 325 °C,
respectively. The column temperature was held constant at 50 °C for 6.50 min. High
purity nitrogen (BOC Gases, Baton Rouge, LA) was used as a carrier gas at a flow rate of
12 mL/min. All methane data are reported as aqueous concentrations in µM (µmol/L).
Headspace methane concentrations were converted to aqueous phase concentrations
using Henry’s Law (Henry’s constant for methane at 25 °C is 0.6364 atm/mol/m3).
Hydrogen was analyzed using reduction gas analyzer (Trace Analytical, Menlo
Park, CA) equipped with a reduction gas detector. Gas samples taken from the headspace
were manually injected into a 1-mL gas sampling loop, and then separated with a
molecular sieve analytical column (Trace Analytical, Menlo Park, CA) at an oven
temperature of 40 °C. The sample was then passed through a catalytical combustion
converter (Trace Analytical, Menlo Park, CA) to remove traces of H2. High purity
22
nitrogen (BOC Gases, Baton Rouge, LA) was used as a carrier gas. The detection limit
under these conditions was 1 ppb. All hydrogen data are reported as aqueous
concentration.
Aqueous concentration of H2 was calculated following the equation adopted from
Löffler et al. (1999):
[ ] RTLPH aq =.,2
where H2,aq. is the aqueous concentration of H2 (moles/L);
L is the Ostwald coefficient for H2 solubility (0.01913 at 25 °C);
P is the partial pressure of H2 (atm);
R is the universal gas constant (0.0821 liter·atm·K-1·mol-1);
and T is the temperature (K).
P = C/106
where P is the partial pressure of H2 (atm);
C is the gas phase concentration of H2 (ppm);
3.2.5 Molecular Analysis
• DNA Extraction
Slurry samples were collected from the microcosms, and then immediately stored
in sterile cryogenic vials at -20 °C prior to DNA extraction. Extraction of DNA from
slurry samples was done following the protocol of Mo Bio Ultraclean Soil DNA Isolation
Kit (Mo Bio Laboratories, Inc.) with some modifications. Because of the large amount of
humic acids in the soil samples which can inhibit PCR amplification, samples were
treated with polyvinylpolypyrrolidone (PVPP) (Agros Organics, Geel, Belgium) (about
0.1 g per 1 g of sample) as a humic acid-binding agent prior to DNA extraction (Holben,
23
et al., 1988). In order to further remove traces of humic acids, two additional washes
using S4 solution (a component of Ultraclean Soil DNA Isolation Kit) were performed.
Another modification of the kit protocol was that a Biospec Mini-Beadbeater 3110BX
(Biospec products Inc., Bartlesville, OK) was utilized for cell disruption instead of Mo
Bio Vortex Adapter (Mo Bio Laboratories, Inc.). The beadbeater was operated at 4,800
rpm for 3.0 min. Extracted DNA was stored at –20 °C until further analysis.
• PCR Amplification
Extracted DNA was amplified through Polymerase Chain Reaction (PCR) using
an Eppendorf MasterTaq Kit (Brinkmann Instruments, Inc., Westbury, NY). The
Eppendorf MasterTaq Kit includes Taq DNA Polymerase (5 U/ µL), 10 × Taq Buffer
with Mg2+, and 5 × TaqMaster PCR Enhancer. The 5 × TaqMaster PCR Enhancer often
required heating at 60 °C to dissolve the components completely. The master mix was
made of 63.5 µL 18 Mega Ohm water, 15 µL of 5 × TaqMaster PCR Enhancer, 10 µL of
10 × Taq Buffer with Mg+, 8 µL of the 10 mM dNTP mix (Applied Biosystems, Forster
City, CA), 0.5 µL of the Taq DNA polymerase and 1 µL of each primer (forward and
reverse) per sample. For each sample to be amplified, 99 µL of the master mix was
placed in a 500-µL sterile PCR reaction tube, and then 1 µL of the extracted DNA was
added. This mixture was vortexed and then centrifuged for 1 min at 13,000 rpm. PCR
amplification was finally performed by an Eppendorf Thermocycler (Eppendorf GmbH,
Hamburg, Germany).
Two different types of primers were applied. One was 341f (5’-
CCTACGGGAGGCAGCAG-3’) and 907r (5’-CCGTCAATTCMTTTRAGTTT-3’)
(Casamayor et al., 2000) for the bacteria group; the other set of primers for the archaea
24
group (i.e., methanogens) was archaeon-specific primers 340f (5’-
CCTACGGGGCGCASCAGGSGC-3’) and 915r (5’-GTGCTCCCCCGCCAATTCCT-
3’) (Löffler et al., 1997). An additional 40-nucleotide GC-rich sequence (GC-clamp)
attached to the 5’ end of both forward primers was:
CGCCCGCCGCGCCCCGCGCCCGTCCCGCCGCCCCCGCCCG (Muyzer et al.,
1995). All these primers were obtained from Alpha DNA (Quebec, CA). For the bacteria
group, PCR conditions were (Hendrickson et al., 2002): denaturation, 95 °C (2 min); 40
cycles of 94 °C (1 min), 55 °C (1 min), 72 °C (1 min) and finally cooling at 4 °C. For the
archaea group, the PCR conditions (Löffler et al., 1997) were: denaturation, 94 °C (2 min
10 s); 30 cycles of 94 °C (30 s), 60 °C (45 s), 72 °C (2 min 10 s); final elongation, 72 °C
(6 min). PCR products were immediately analyzed or stored at 0 – 4 °C until analysis.
• Detection of PCR Products
PCR products were analyzed by the Agilent 2100 Bioanalyzer and corresponding
DNA Labchip Kits (Agilent Technology, Willington, DE) to obtain the concentration of
DNA and to determine whether the DNA extraction and PCR amplification were
successful. One µL of PCR product was used for analysis following the manufacturer’s
instructions.
• Denaturing Gradient Gel Electrophoresis (DGGE)
DGGE was performed using a D-CodeTM Universal Mutation Detection System
(Bio-Rad, Hercules, CA) as described by Myers et al. (1987) with the following
modifications. The 24 mL denaturing gradient gel (6% (wt/vol) acrylamide solution) was
covered by a 5 mL acrylamide stacking gel without denaturant. Polymerization was
catalyzed with addition of 0.0381% of TEMED (vol/vol) and 0.914% of the 10%
25
ammonium persulfate (vol/vol) to both denaturant solutions. 0.85% of the 10%
ammonium persulfate (vol/vol) and 0.057% of TEMED was added to the 0% stacking gel
solution. Gels were cast using a BioRad Model 475 Gradient Delivery System. Samples
containing approximately equal amounts of PCR amplicons (with loading dye) were
loaded into individual gel lanes. The polyacrylamide gels were made with a denaturing
gradient ranging from 40% to 70%, where 100% denaturant contained 42% (wt/vol) urea
and 40% (vol/vol) formamide (Bio-Rad, Hercules, CA). Electrophoresis was performed
in 1× TAE buffer at 60 °C for 15 hours at 65 V. Following electrophoresis, the gel was
stained with ethidium bromide for 10 min. The gel was then destained using 1x TAE
buffer for 12 min. Finally, the gel was visualized with a UV transilluminator,
photographed and digitized using an Alpha DigiDoc system (Alpha Innotech Co., San
Leandro, CA).
3.2.6 Data Analysis
• Kinetic Data Modeling
Pseudo first-order kinetic model was applied for modeling kinetic data. To
account for abiotic losses of the parent compound in the sterile control, experimental data
would be adjusted before the first-order kinetic constant was calculated (Lorah et al.,
1997). In the present study, if the percentage recovery rate of the parent compound was
higher than 80%, the kinetic data were directly used for modeling. Otherwise, the kinetic
data in active control and BES-amended microcosms were modified by comparing with
abiotic control microcosms. This kinetic data modification approach assumed that abiotic
losses were equal in all treatments for the same type of soil since the experimental
26
procedures and conditions were the same. Each sampling data was adjusted using the
following equation:
−×+=
−−
11
' 1Fi
Fiiii C
CCCC
where is the adjusted concentration for the ith sampling point in the active
control or BES-amended treatment in a given type of soil (mM/kg dry
weight of soil);
'iC
iC is the measured concentration for the ith sampling point in the active
control or BES-amended treatment in the same type of soil as above
(mM/kg dry weight of soil);
1−iC is the measured concentration for the (i-1)th sampling point in the
active control or BES-amended treatment in the same type of soil as above
(mM/kg dry weight of soil);
FiC is the measured concentration for the ith sampling point in the killed
control in the same type of soil as above (mM/kg dry weight of soil);
1−FiC is the measured concentration for the (i-1)th sampling point in the
killed control in the same type of soil as above (mM/kg dry weight of
soil);
First-order reaction rate constant was finally calculated from the first-order kinetic
equation shown below by optimization of degradation kinetic data using non-linear
regression techniques. When the amount of daughter products detected at the ith
sampling point was at least 5% of the parent compound after adjustment at the (i-1)th
27
sampling point, the onset of dechlorination was assumed and the lag period was
considered to be the time between the ith and the (i-1)th sampling points.
eCC ktot
−=
where t is the time (day);
Ct is the concentration at any time t (mM/kg dry soil);
Co is the initial concentration (mM/kg dry soil);
and k is the pseudo first-order reaction rate constant (day-1).
The characteristic half-life period (2
1t ) was calculated from the first-order
reaction rate constant (k) using the following equation:
kkt 693.0)2(ln
21 =−=
where 2
1t is the half-life time (days);
k is the pseudo first-order reaction rate constant (day-1).
• Statistical Analysis
Kinetic data were modeled using SigmaPlot 2001. First-order kinetic value and
associated standard error were obtained from the non-linear regression analysis. A two-
sample t-test was used to compare the differences in first-order kinetic values in different
treatments using a significance level of 5%.
3.3 Results and Discussion
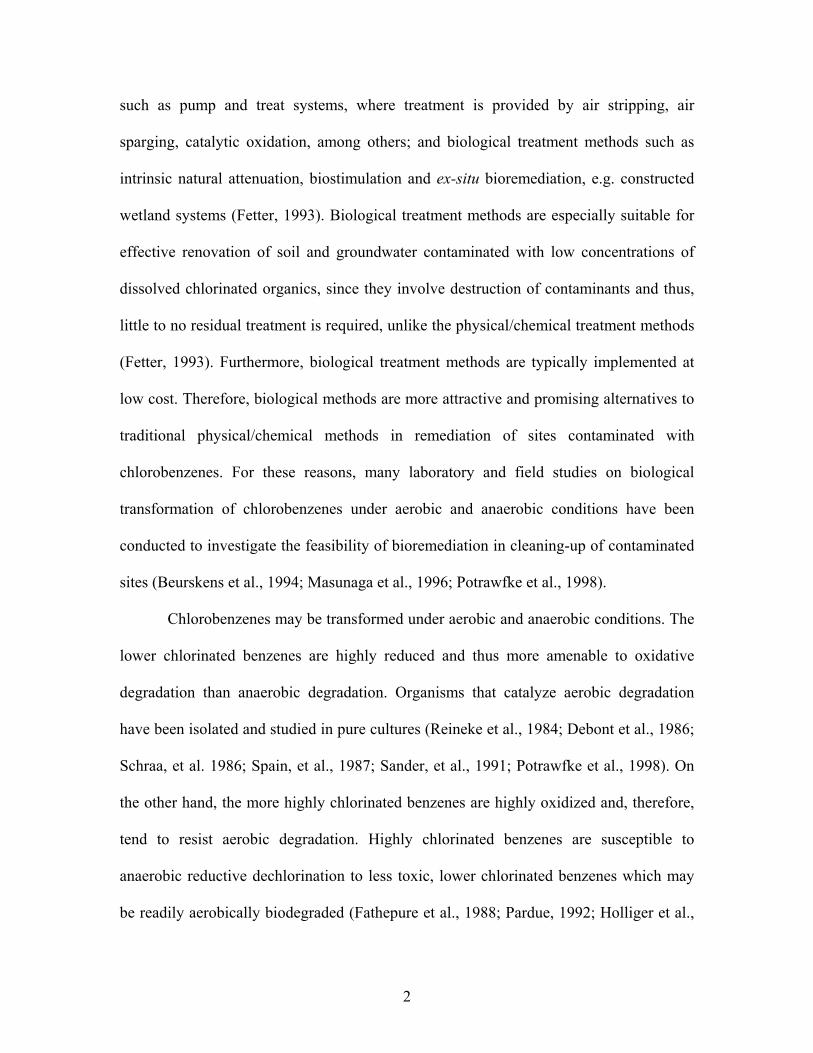
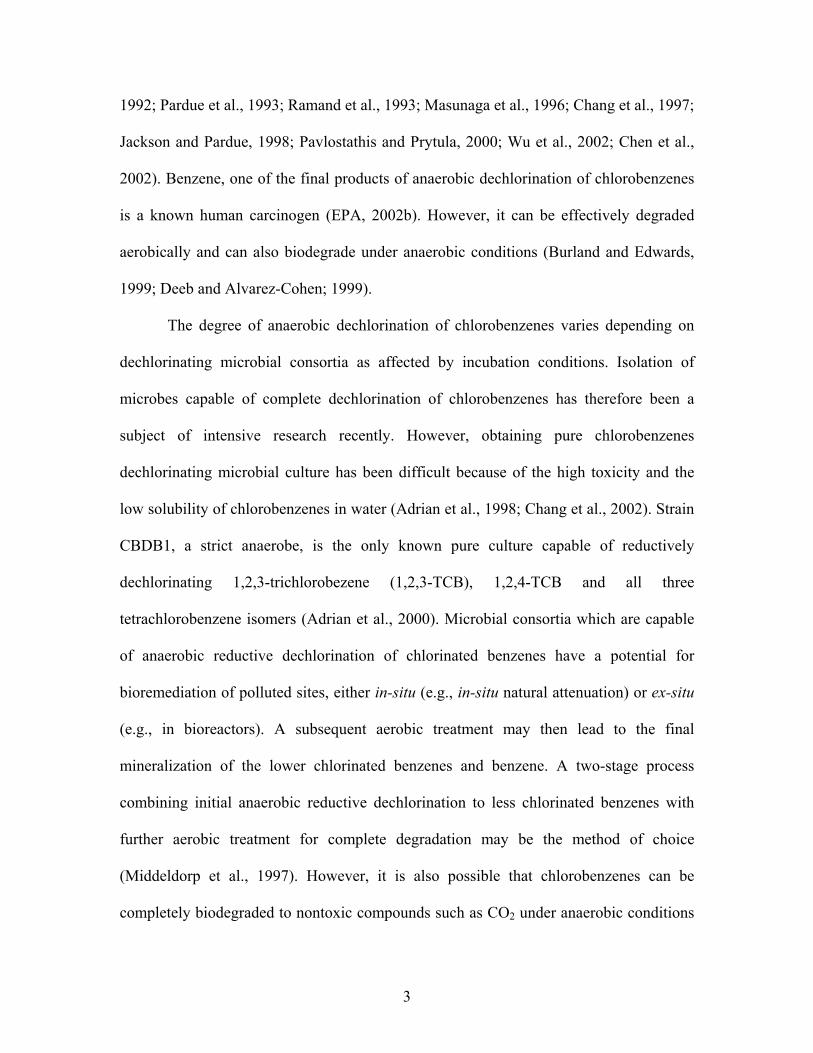
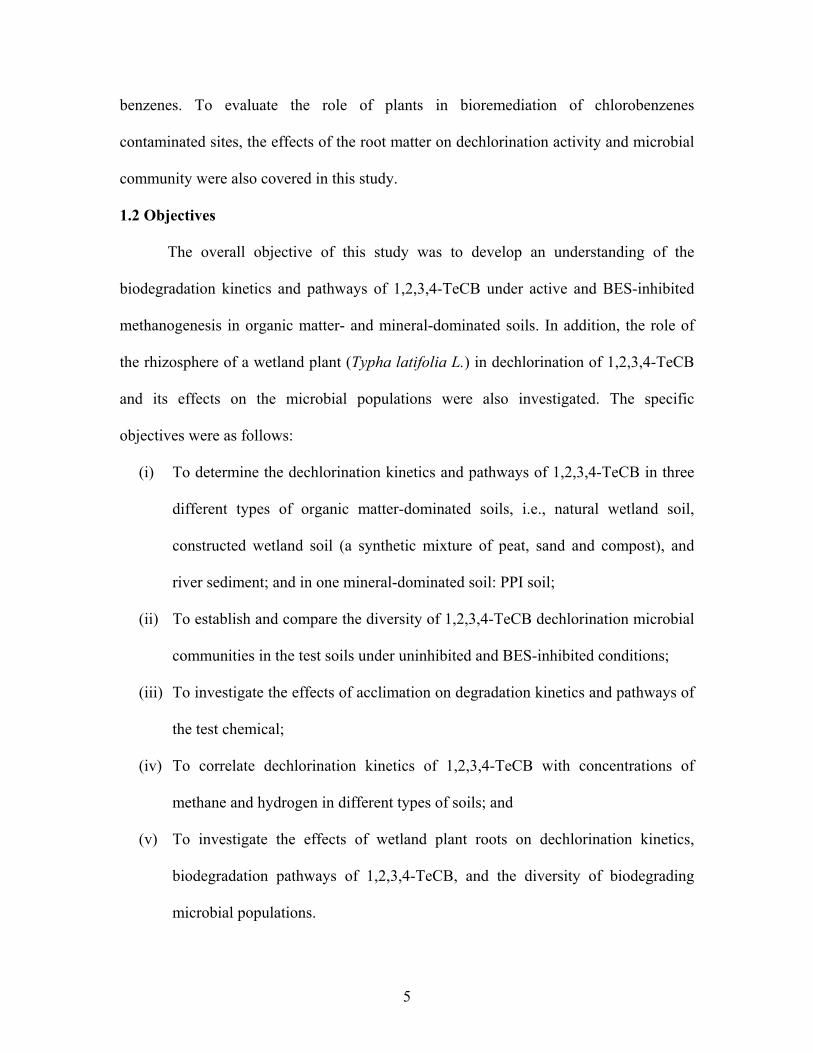
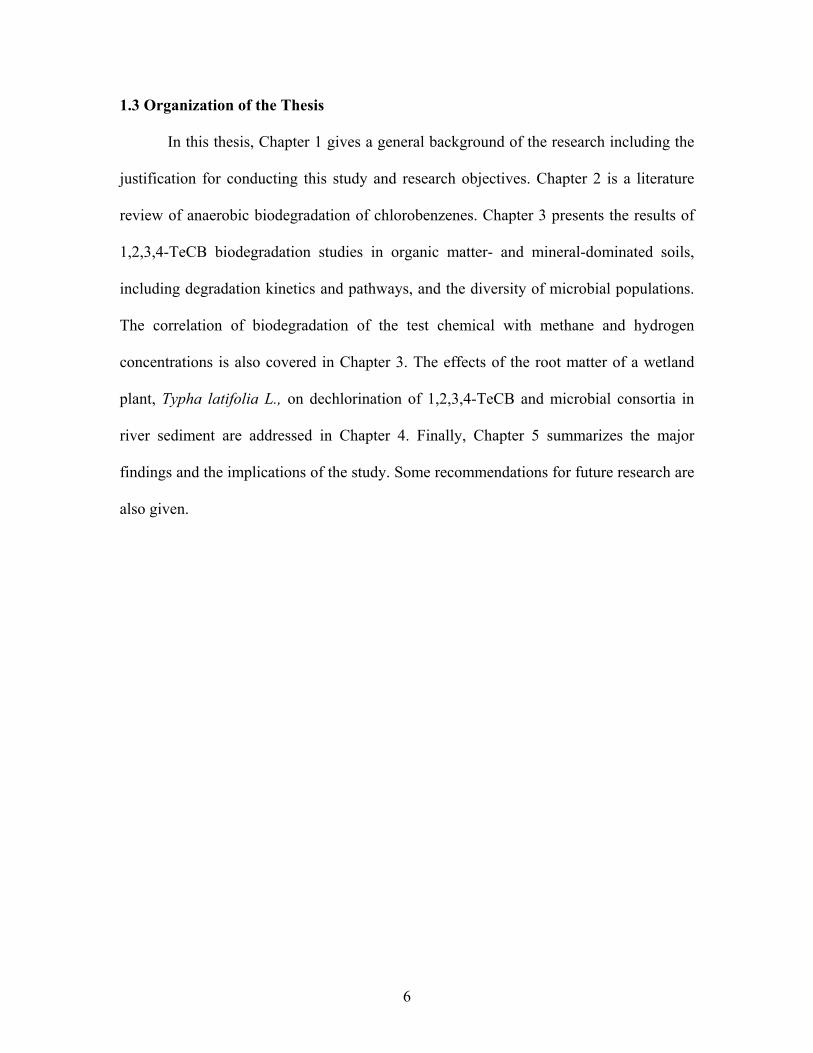
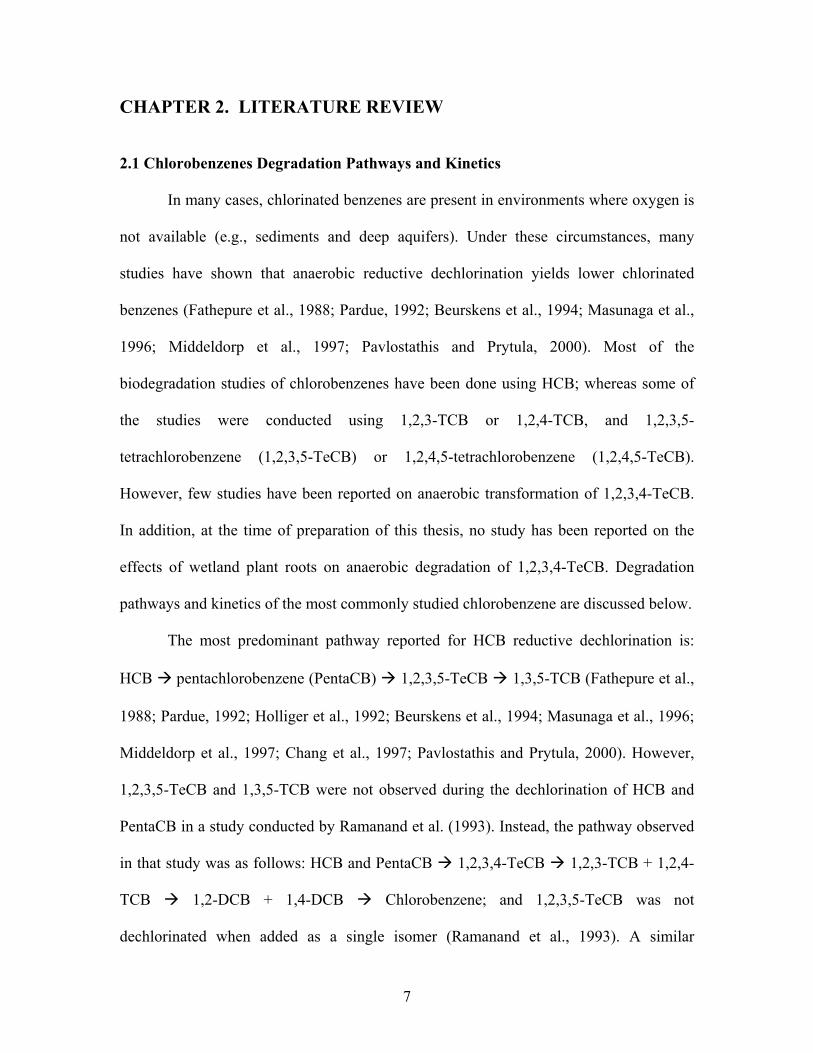
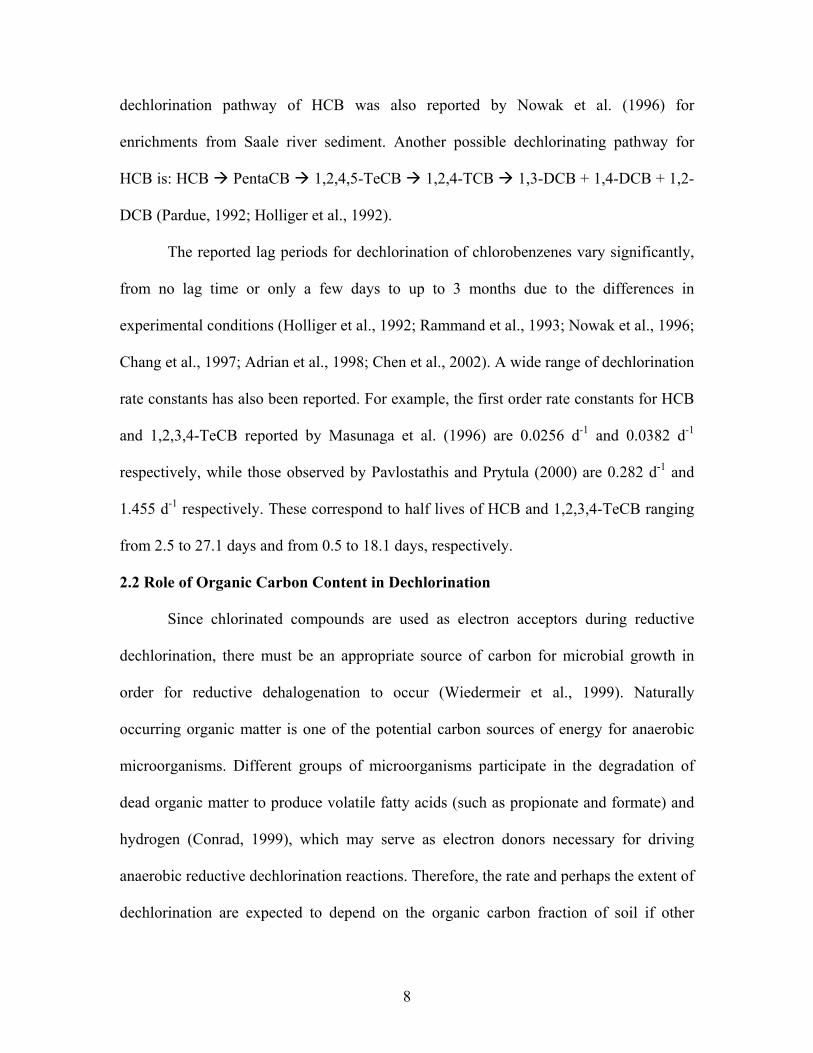
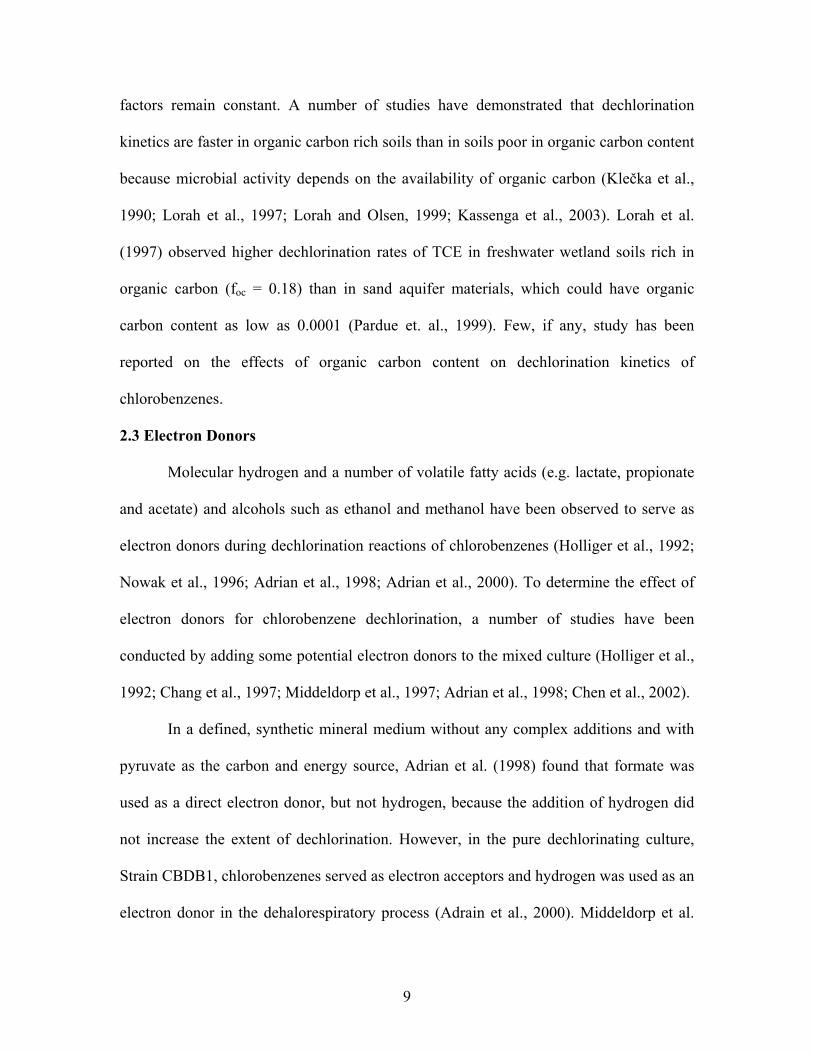
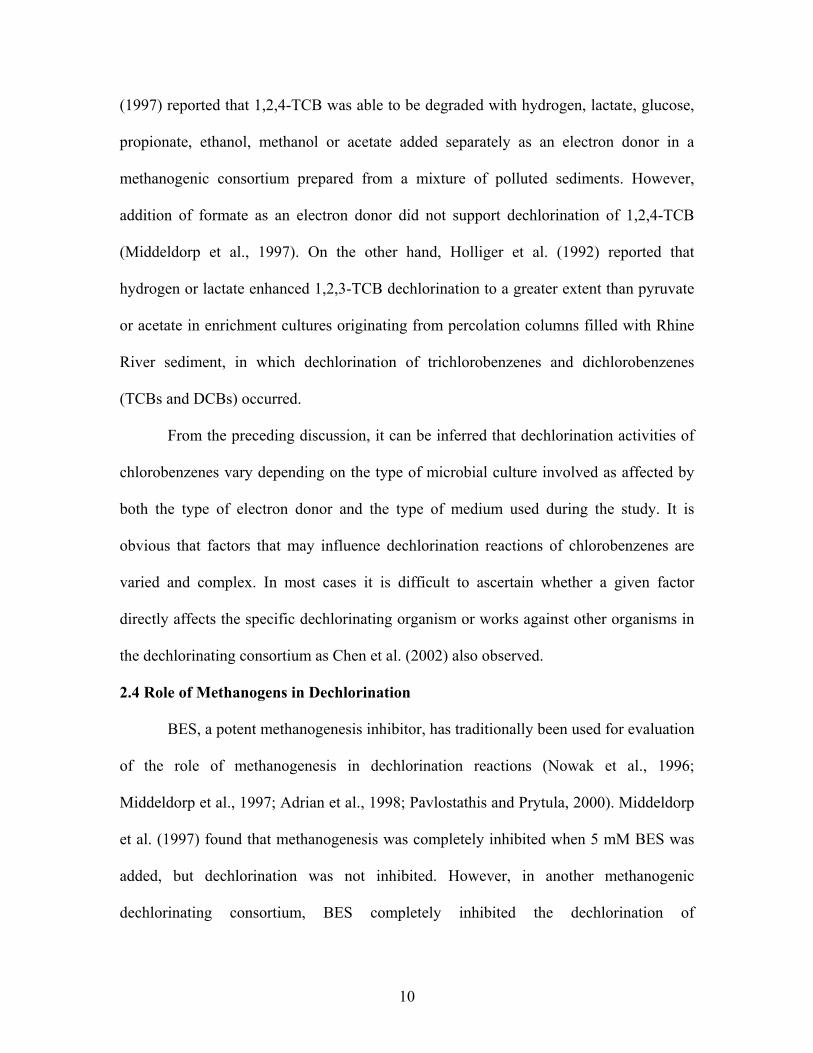
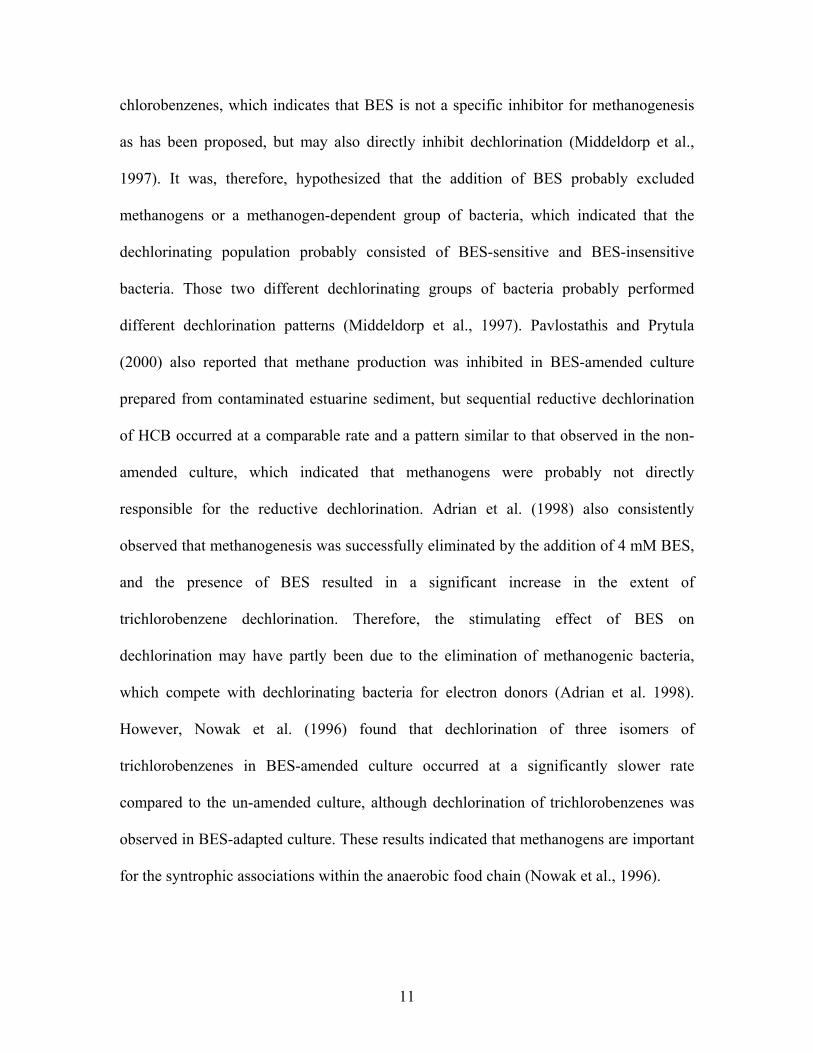
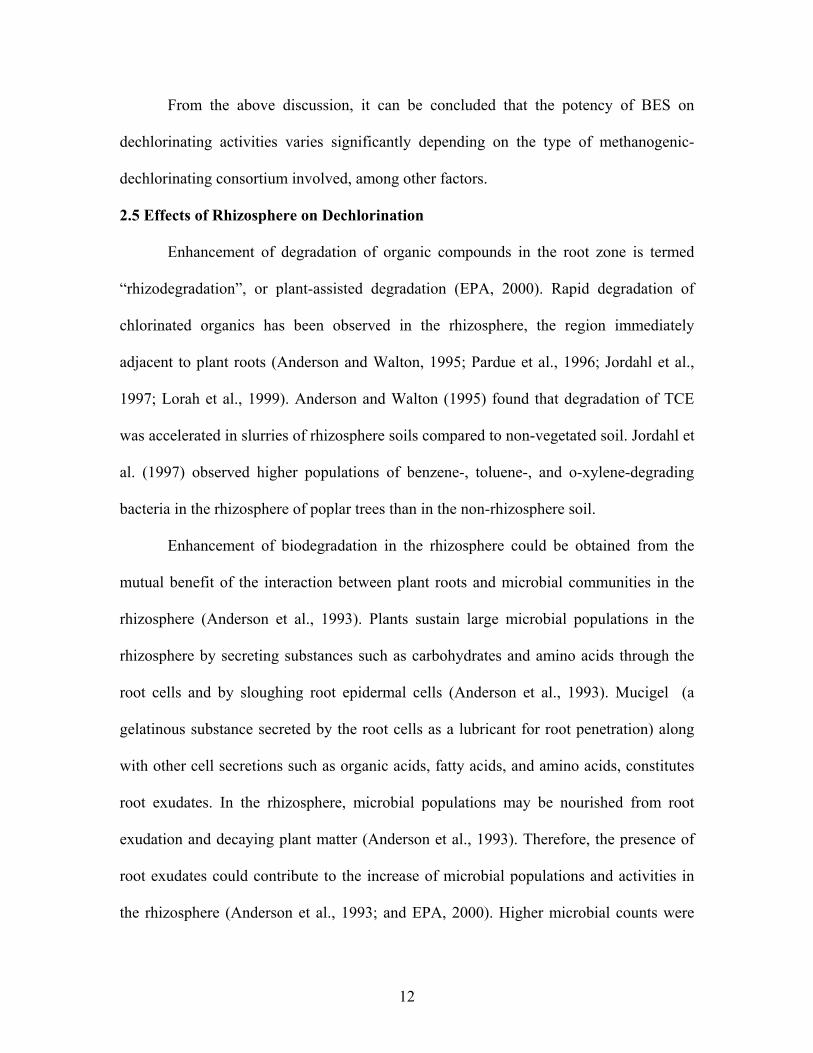
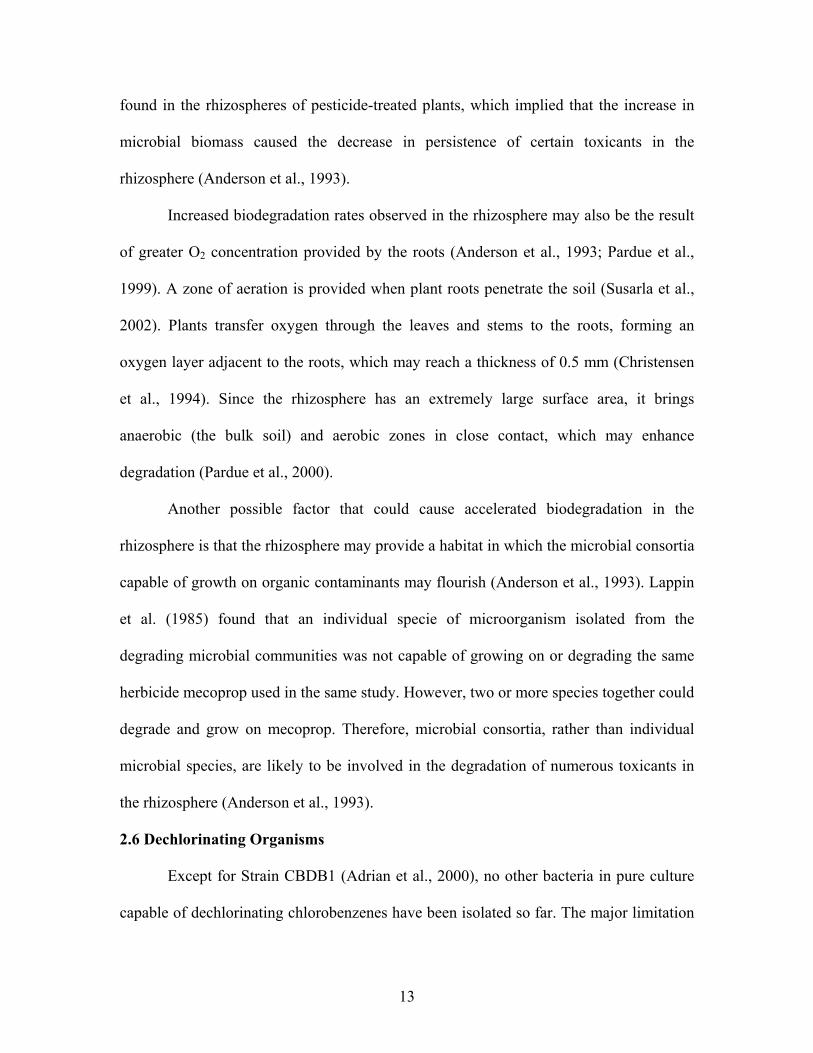
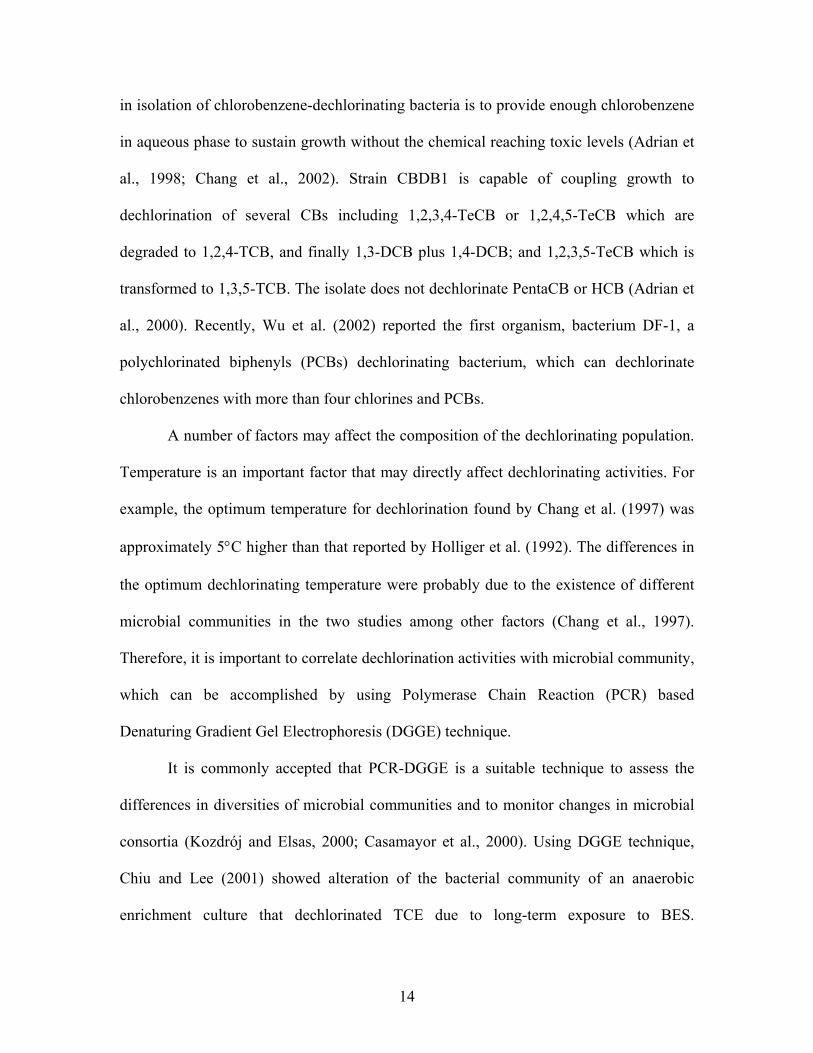
3.3.1 Fate of 1,2,3,4-Tetrachlorobenzene in Microcosms
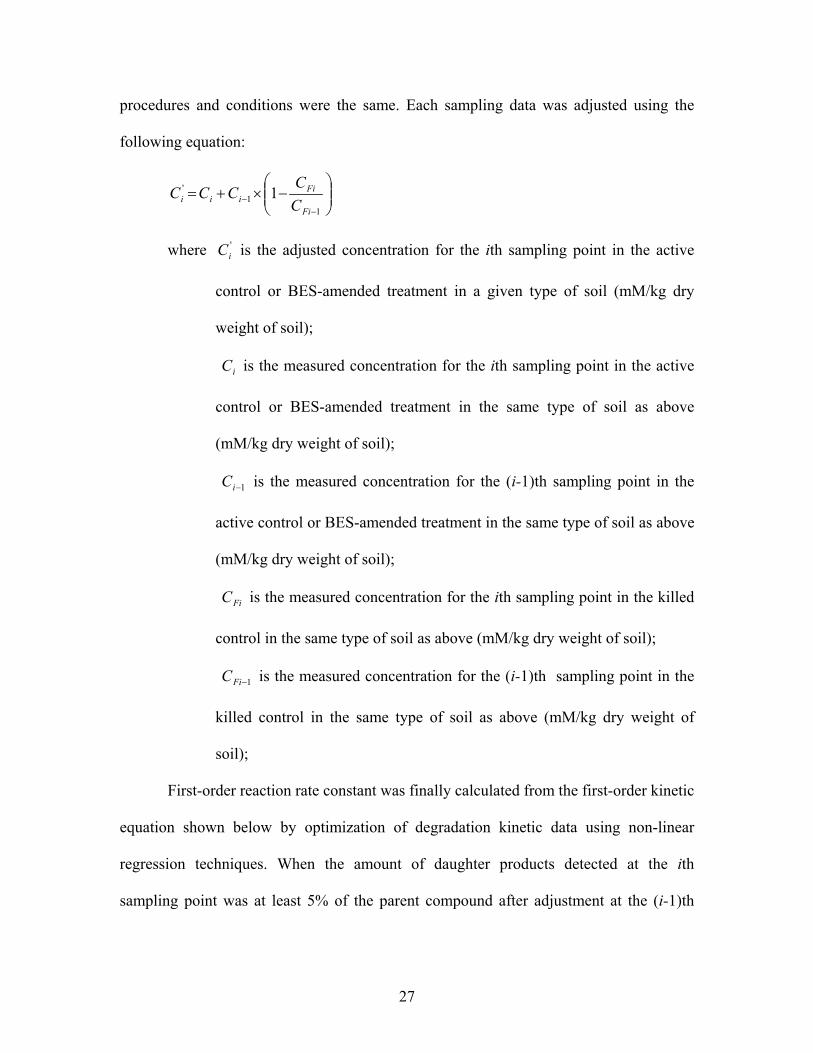
Dechlorination profiles of the 1st Generation cultures of abiotic control and active
control microcosms in the four test soils are shown in Figure 3.1 through Figure 3.4. In
abiotic control microcosms, the percentage recovery rates of 1,2,3,4-TeCB in the 1st
28
N a tu ra l W e tla n d S o il
T im e (d a y )
0 1 0 2 0 3 0 4 0 5 0 6 0 7 0
1,2,
3,4-
TeC
B, m
M/k
g dr
y so
il
0
1 0 0
2 0 0
3 0 0
4 0 0
5 0 0
Dau
ghte
r pro
duct
, mM
/kg
dry
soil
0
5 0
1 0 0
1 5 0
2 0 0
1 2 3 4 -T e C B 1 2 3 -T C B 1 2 4 -T C B 1 2 -D C B 1 4 -D C B 1 3 -D C B 1 2 3 4 -T e C B in a b io t ic c o n tro l
Figure 3.1: 1,2,3,4-TeCB dechlorination profile in the 1st Generation cultures of abiotic and active control microcosms of natural wetland soil.
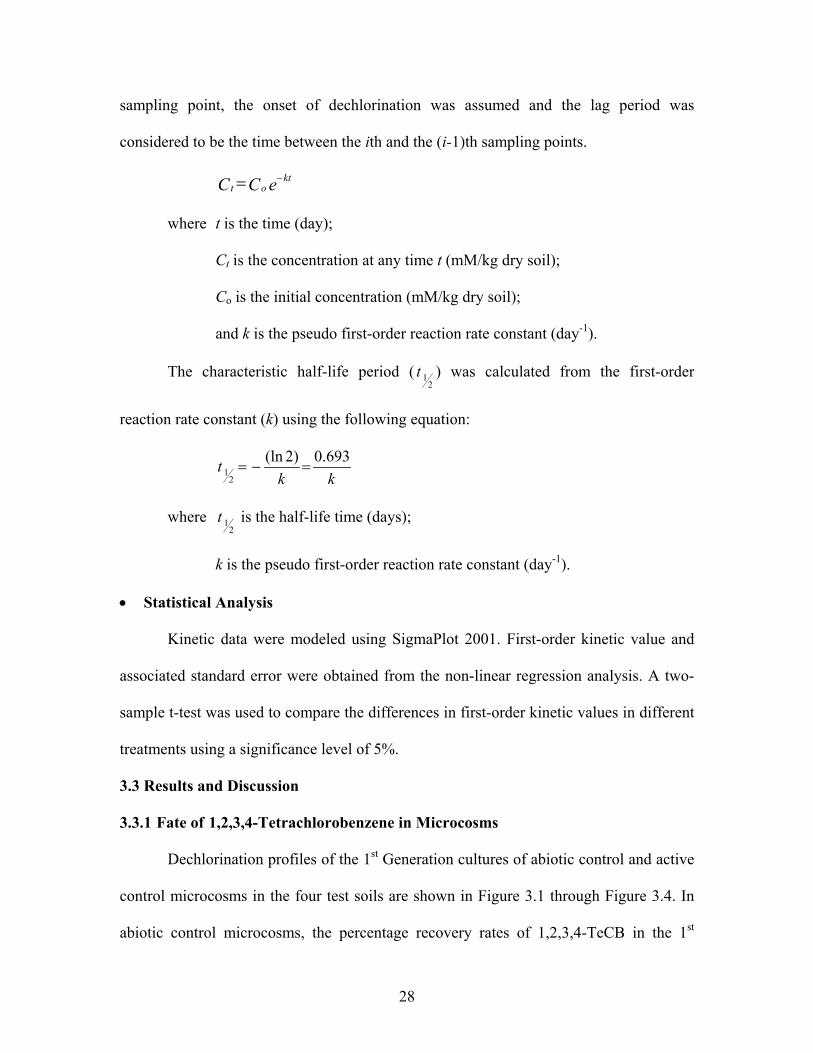
C o n s t r u c te d W e t la n d S o i l
T im e ( d a y )
0 2 0 4 0 6 0 8 0 1 0 0
1,2,
3,4-
TCB,
mM
/kg
dry
soil
0
5 0 0
1 0 0 0
1 5 0 0
Dau
ghte
r pro
duct
, mM
/kg
dry
soil
0
2 0 0
4 0 0
6 0 0
8 0 0
1 0 0 0
1 2 3 4 - T e C B 1 2 3 - T C B 1 2 4 - T C B 1 2 - D C B 1 4 - D C B 1 3 - D C B 1 2 3 4 - T e C Bin a b io t ic c o n t r o l
Figure 3.2: 1,2,3,4-TeCB dechlorination profile in the 1st Generation cultures of abiotic and active control microcosms of constructed wetland soil.
29
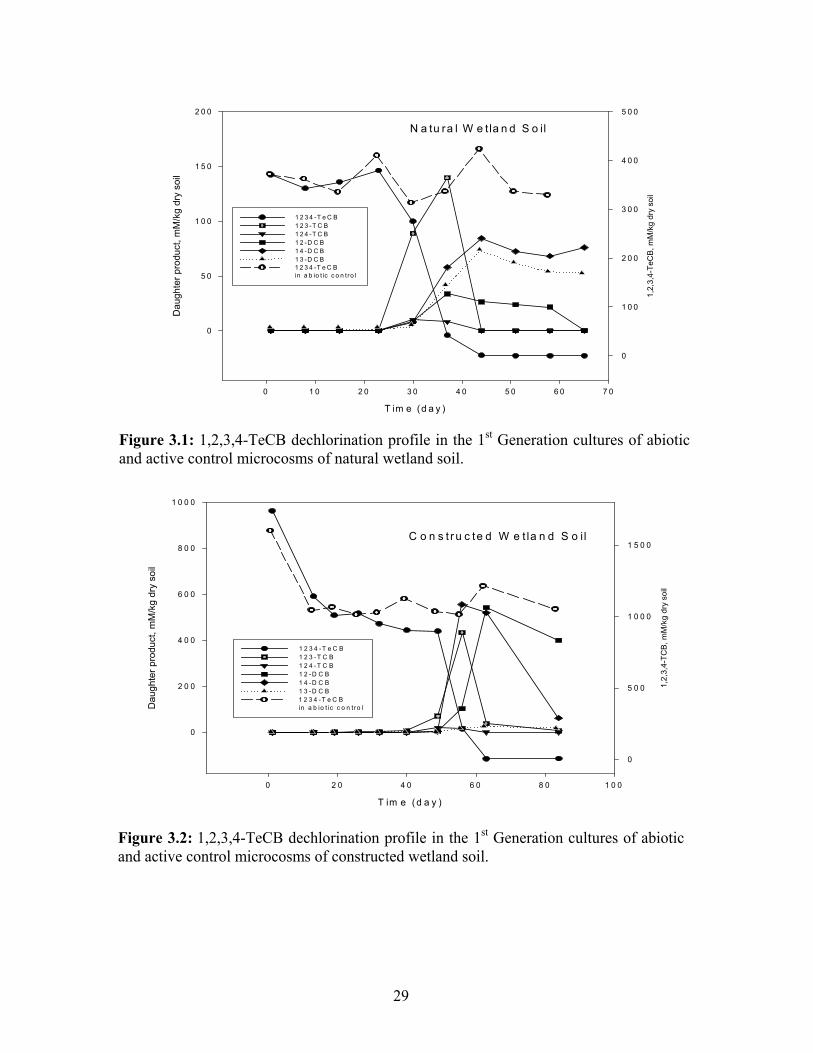
R ive r S e d im e n t
T im e (d a y )
0 2 0 4 0 6 0 8 0
1,2,
3,4-
TCB,
mM
/kg
dry
soil
0
2 0 0
4 0 0
6 0 0
8 0 0D
augh
ter p
rodu
ct, m
M/k
g dr
y so
il
0
5 0
1 0 0
1 5 0
2 0 0
2 5 0
3 0 0
1 2 3 4 -T e C B 1 2 3 -T C B 1 2 4 -T C B 1 2 -D C B 1 4 -D C B 1 3 -D C B 1 2 3 4 -T e C Bin a b io tic co n tro l
Figure 3.3: 1,2,3,4-TeCB dechlorination profile in the 1st Generation cultures of abiotic and active control microcosms of river sediment.
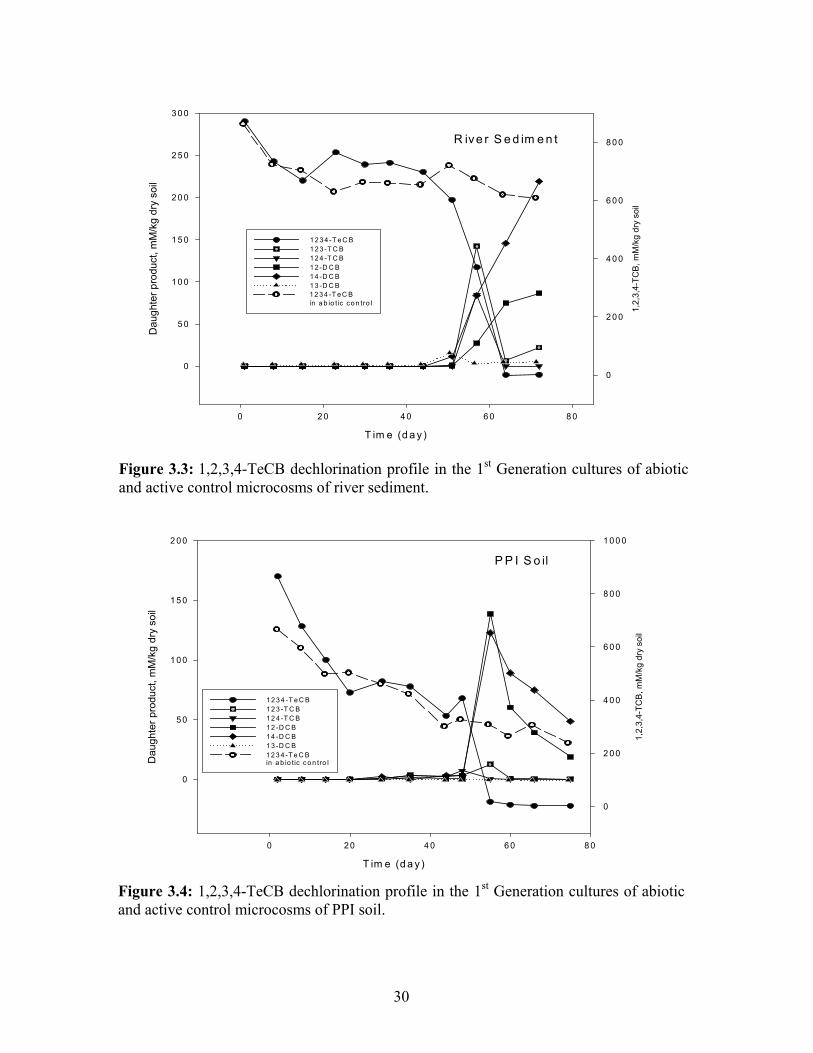
P P I S o il
T im e (d a y )
0 2 0 4 0 6 0 8 0
1,2,
3,4-
TCB
, mM
/kg
dry
soil
0
2 0 0
4 0 0
6 0 0
8 0 0
1 0 0 0
Dau
ghte
r pro
duct
, mM
/kg
dry
soil
0
5 0
1 0 0
1 5 0
2 0 0
1 2 3 4 -T e C B 1 2 3 -T C B 1 2 4 -T C B 1 2 -D C B 1 4 -D C B 1 3 -D C B 1 2 3 4 -T e C Bin a b io tic c o n tro l
Figure 3.4: 1,2,3,4-TeCB dechlorination profile in the 1st Generation cultures of abiotic and active control microcosms of PPI soil.
30
Generation cultures of natural wetland soil, constructed wetland soil, river sediment and
PPI soil were 87.0 – 107.5%, 92.7 – 111.1%, 70.3 – 100%, and 36.3 – 100%,
respectively. Differences in mass balance could be due to experimental errors such as
those associated with sampling and analytical procedures. The test compound declined by
between 7.3% and 13.0% in abiotic control microcosms of natural wetland soil and
constructed wetland soil. This range of losses of the parent compound is very similar to
that reported by Ramanand et al. (1993), which ranged from 13.4 to 16.6% for HCB in
sodium azide-treated sterile control serum bottles. However, losses of 1,2,3,4-TeCB in
abiotic control microcosms of river sediment and PPI soil (up to 63.7%) were higher than
those in abiotic control microcosms of natural wetland soil and constructed wetland soil.
Similarly, Clover (1998) also observed poor recovery rate as low as 32.2% of the parent
compound, monochlorobenzene, in microcosms of PPI soil. The significant differences in
the percentage recovery rates of the parent compound could be due to the variations in
the extraction efficiencies in different types of soils. In addition, some components acting
as strong sorbent such as soot were probably present in the PPI soil, which resulted in
low extraction efficiency. Since none of the possible daughter products was detected in
all abiotic control microcosms, the low recovery rates of the test chemical were probably
caused by abiotic processes rather than microbial activities. On the contrary, significant
amounts of daughter products such as trichlorobenzenes and dichlorobenzenes were
detected in all active control and BES-amended microcosms as shown in Figure 3.1
through Figure 3.4. Therefore, it can be concluded that the disappearance of 1,2,3,4-
TeCB in active control and BES-amended microcosms was due to biodegradation rather
than abiotic losses.
31
3.3.2 Dechlorination Pathways and Kinetics
It was observed that 1,2,3,4-TeCB was completely removed in all microcosms.
However, 1,2,3,4-TeCB was biodegraded at different kinetic rates with different lag
periods in the test soils. In addition, the kinetic constants and delay times of parent
compound dechlorination were significantly different in the 1st, 2nd and 3rd Generation
cultures for the same type of soil.
• Dechlorination Pathways
Generally, 1,2,3,4-TeCB was biodegraded to 1,2,3-TCB and 1,2,4-TCB; 1,2-
DCB, 1,4-DCB and 1,3-DCB; and finally to monochlorobenzene and/or benzene. 1,2,4-
TCB and benzene were, however, detected in trace amounts. Dechlorination daughter
products in each generation culture for all test soils are listed in Table 3.1. Dechlorination
profiles for the 1st, 2nd and 3rd Generation cultures of constructed wetland soil are
illustrated in Figure 3.6 (Figure 3.6 A1 through Figure 3.6 A6) as shown later.
Dechlorination profiles for natural wetland soil, river sediment and PPI soil are shown in
Appendix I, II and III, respectively.
1,2,3-TCB, 1,2-DCB and 1,4-DCB were the major daughter products detected in
all test soils (Table 3.1). 1,3-DCB was detected in significant amounts in all generation
cultures of active control and BES-amended natural wetland soil microcosms, and the 3rd
Generation culture of BES-amended constructed wetland soil microcosms. Otherwise,
1,3-DCB was an insignificant intermediate daughter product in all other microcosms. The
degradation pathway observed in the present study is very similar to that reported by
Nowak et al. (1996). In the study conducted by Nowak et al. (1996), 1,2,3,4-TeCB was
biodegraded to 1,2,3-TCB and all isomers of dichlorobenzenes in 1,3,5-TCB adapted
32
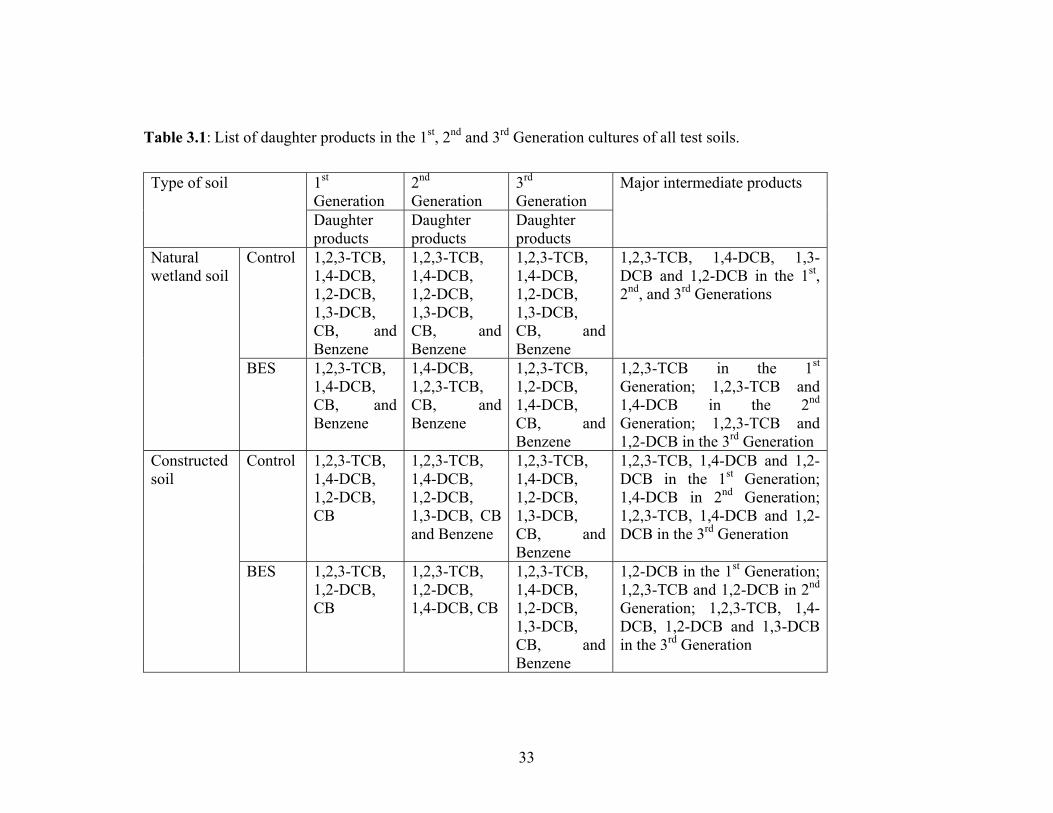
Table 3.1: List of daughter products in the 1st, 2nd and 3rd Generation cultures of all test soils.
1st Generation
2nd Generation
3rd Generation
Type of soil
Daughter products
Daughter products
Daughter products
Major intermediate products
Control 1,2,3-TCB,1,4-DCB, 1,2-DCB, 1,3-DCB, CB, andBenzene
1,2,3-TCB, 1,4-DCB, 1,2-DCB, 1,3-DCB, CB, andBenzene
1,2,3-TCB, 1,4-DCB, 1,2-DCB, 1,3-DCB, CB, and Benzene
1,2,3-TCB, 1,4-DCB, 1,3-DCB and 1,2-DCB in the 1st, 2nd, and 3rd Generations
Natural wetland soil
BES 1,2,3-TCB,1,4-DCB, CB, andBenzene
1,4-DCB, 1,2,3-TCB, CB, andBenzene
1,2,3-TCB, 1,2-DCB, 1,4-DCB, CB, andBenzene
1,2,3-TCB in the 1st Generation; 1,2,3-TCB and 1,4-DCB in the 2nd Generation; 1,2,3-TCB and 1,2-DCB in the 3rd Generation
Control 1,2,3-TCB,1,4-DCB, 1,2-DCB, CB
1,2,3-TCB, 1,4-DCB, 1,2-DCB, 1,3-DCB, CB and Benzene
1,2,3-TCB, 1,4-DCB, 1,2-DCB, 1,3-DCB, CB, andBenzene
1,2,3-TCB, 1,4-DCB and 1,2-DCB in the 1st Generation; 1,4-DCB in 2nd Generation; 1,2,3-TCB, 1,4-DCB and 1,2-DCB in the 3rd Generation
Constructed soil
BES 1,2,3-TCB,1,2-DCB, CB
1,2,3-TCB, 1,2-DCB, 1,4-DCB, CB
1,2,3-TCB, 1,4-DCB, 1,2-DCB, 1,3-DCB, CB, andBenzene
1,2-DCB in the 1st Generation; 1,2,3-TCB and 1,2-DCB in 2nd Generation; 1,2,3-TCB, 1,4-DCB, 1,2-DCB and 1,3-DCB in the 3rd Generation
33
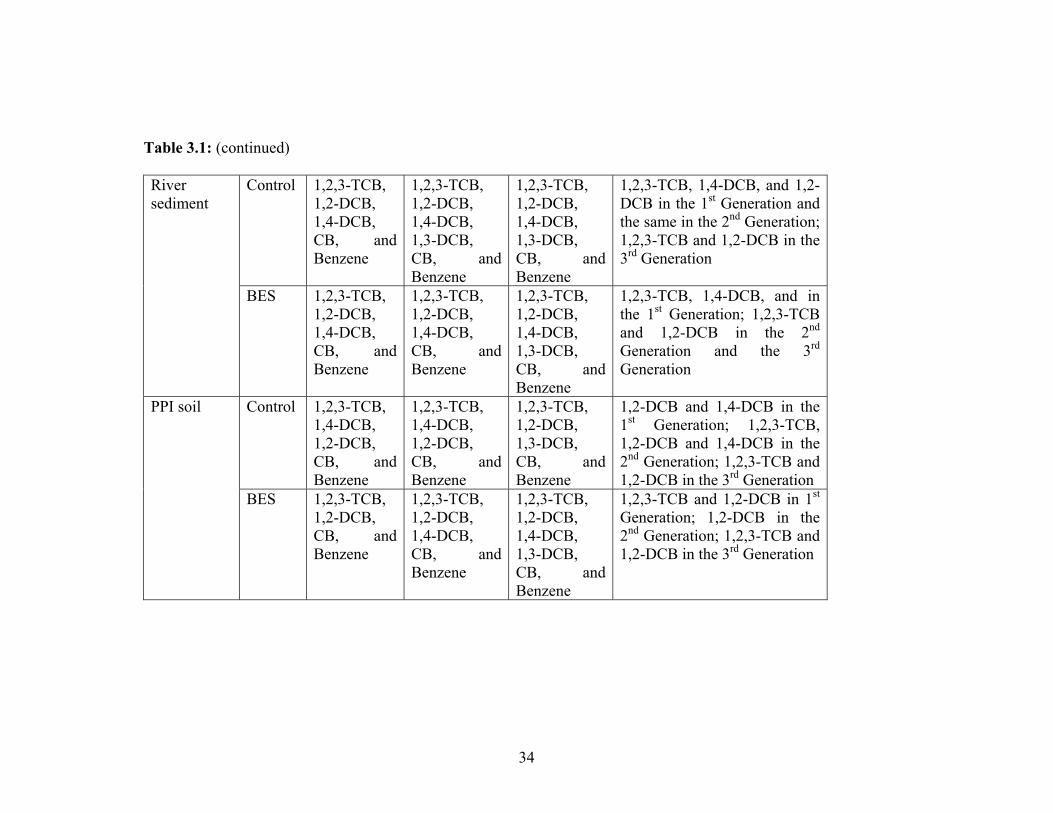
Table 3.1: (continued)
Control 1,2,3-TCB,
1,2-DCB, 1,4-DCB, CB, andBenzene
1,2,3-TCB, 1,2-DCB, 1,4-DCB, 1,3-DCB, CB, andBenzene
1,2,3-TCB, 1,2-DCB, 1,4-DCB, 1,3-DCB, CB, andBenzene
1,2,3-TCB, 1,4-DCB, and 1,2-DCB in the 1st Generation and the same in the 2nd Generation; 1,2,3-TCB and 1,2-DCB in the 3rd Generation
River sediment
BES 1,2,3-TCB,1,2-DCB, 1,4-DCB, CB, andBenzene
1,2,3-TCB, 1,2-DCB, 1,4-DCB, CB, andBenzene
1,2,3-TCB, 1,2-DCB, 1,4-DCB, 1,3-DCB, CB, andBenzene
1,2,3-TCB, 1,4-DCB, and in the 1st Generation; 1,2,3-TCB and 1,2-DCB in the 2nd Generation and the 3rd Generation
Control 1,2,3-TCB,1,4-DCB, 1,2-DCB, CB, andBenzene
1,2,3-TCB, 1,4-DCB, 1,2-DCB, CB, andBenzene
1,2,3-TCB, 1,2-DCB, 1,3-DCB, CB, andBenzene
1,2-DCB and 1,4-DCB in the 1st Generation; 1,2,3-TCB, 1,2-DCB and 1,4-DCB in the 2nd Generation; 1,2,3-TCB and 1,2-DCB in the 3rd Generation
PPI soil
BES 1,2,3-TCB,1,2-DCB, CB, andBenzene
1,2,3-TCB, 1,2-DCB, 1,4-DCB, CB, andBenzene
1,2,3-TCB, 1,2-DCB, 1,4-DCB, 1,3-DCB, CB, and Benzene
1,2,3-TCB and 1,2-DCB in 1st Generation; 1,2-DCB in the 2nd Generation; 1,2,3-TCB and 1,2-DCB in the 3rd Generation
34
methanogenic consortia. Ramanand et al. (1993) also observed dechlorination of 1,2,3,4-
TeCB to 1,2,3-TCB, which was further converted to chlorobenzene via 1,2-DCB.
However, the most dominant pathway observed in the present study is significantly
different from those reported by Masunaga et al. (1996) and Pavlostathis and Prytula
(2000). The authors found that 1,2,3,4-TeCB was mainly dechlorinated to 1,2,4-TCB, and
small amounts of 1,2,3-TCB; and 1,4-DCB, 1,3-DCB and 1,2-DCB. Differences in
dechlorination patterns of 1,2,3,4-TeCB were probably caused by differences in the
compositions of dechlorinating microbial consortia involved in the studies.
Mass balances were calculated to verify that disappearance of the parent
compound was due to biodegradation. Since the 2nd and 3rd Generation cultures were
developed by inoculating the slurry from the immediate previous generation culture,
which contained some daughter products, therefore, mass balance calculations for these
generation cultures would not be easily compared. Mass balances for the 1st Generation
cultures of active control natural wetland soil and BES-amended river sediment
microcosms were found to be 86.3 – 130.2% and 58.7 – 105.2%, respectively. The mass
balances obtained in the present study are comparable to the range of 40 – 90% found in
the dechlorination study conducted by Masunaga et al. (1996).
Degradation pathways in active control and BES-amended microcosms were
slightly different in the same generation for the same type of soil as shown in Table 3.1.
In general, the types of major daughter products in those two treatments were different.
Moreover, the number of species of the daughter products in BES-amended microcosms
was smaller than that in active control microcosms. Middeldorp et al. (1997) also
observed different types of daughter products from 1,2,3,4-TeCB dechlorination in BES-
35
amended and non-amended cultures. These observations indicate that BES most likely
changed the microbial community compositions of the test soils and consequently
dechlorination pathways of the test chemical.
In the present study, 1,2,3,4-TeCB was observed to be completely transformed in
all generation cultures. On the other hand, intermediate degradation daughter products
(i.e., 1,2,3-TCB and dichlorobenzenes) were observed to accumulate in all microcosms of
the 1st Generation cultures within the incubation periods (Table 3.2). However, complete
dechlorination of those intermediate daughter products was observed in all active control
microcosms of the 2nd and 3rd Generation cultures, except for the 2nd Generation culture
of natural wetland soil. On the other hand, accumulation of the intermediate daughter
products (i.e., 1,2,3-TCB and dichlorobenzenes) was found in 50% of BES-amended
microcosms of the 2nd and 3rd Generation cultures (Table 3.2). These findings suggest
that BES might not inhibit 1,2,3,4-TeCB dechlorination, but rather it may have partially
inhibited dechlorination of trichlorobenzenes and dichlorobenzenes. These results are
analogous to the observations made by Löffler et al. (1997), who found that
dechlorination of tetrachloroethene (PCE) to trichloroethene (TCE) or cis-dechloroethene
(cis-DCE) was not inhibited by BES, whereas dechlorination of DCE isomers and vinyl
chloride (VC) was inhibited.
In addition, complete dechlorination of the parent compound and intermediate
daughter products (i.e., 1,2,3-TCB and dichlorobenzenes) in all active control
microcosms of the 3rd Generation cultures (Table 3.2) indicates that dechlorinating
microorganisms were adapted to chlorobenzenes in all organic matter- and mineral-
dominated soils. These observations further imply that it is feasible to apply in-situ or ex-
36
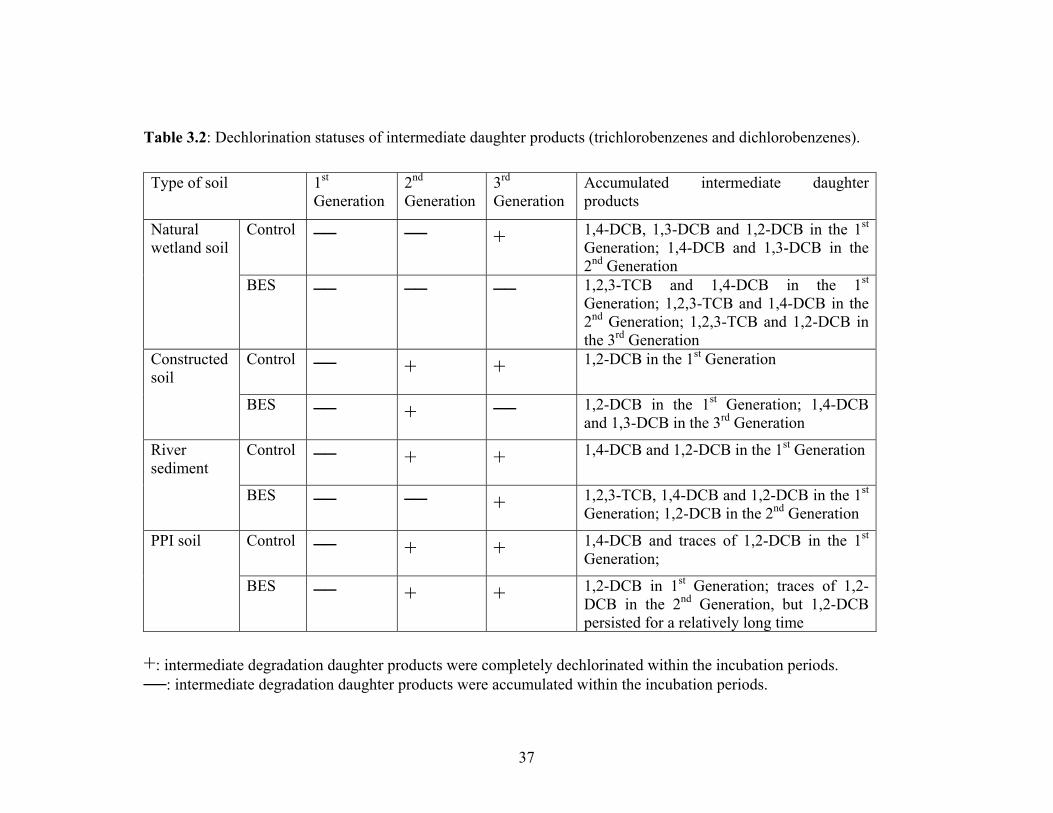
Table 3.2: Dechlorination statuses of intermediate daughter products (trichlorobenzenes and dichlorobenzenes).
Type of soil 1st
Generation 2nd Generation
3rd Generation
Accumulated intermediate daughter products
Control ──
── + 1,4-DCB, 1,3-DCB and 1,2-DCB in the 1st Generation; 1,4-DCB and 1,3-DCB in the 2nd Generation
Natural wetland soil
BES ──
──
── 1,2,3-TCB and 1,4-DCB in the 1st Generation; 1,2,3-TCB and 1,4-DCB in the 2nd Generation; 1,2,3-TCB and 1,2-DCB in the 3rd Generation
Control ──
+ + 1,2-DCB in the 1st Generation Constructed soil
BES ──
+ ──
1,2-DCB in the 1st Generation; 1,4-DCB and 1,3-DCB in the 3rd Generation
Control ──
+ + 1,4-DCB and 1,2-DCB in the 1st Generation River sediment
BES ──
──
+ 1,2,3-TCB, 1,4-DCB and 1,2-DCB in the 1st Generation; 1,2-DCB in the 2nd Generation
Control ──
+ + 1,4-DCB and traces of 1,2-DCB in the 1st Generation;
PPI soil
BES ──
+
+ 1,2-DCB in 1st Generation; traces of 1,2-DCB in the 2nd Generation, but 1,2-DCB persisted for a relatively long time
+: intermediate degradation daughter products were completely dechlorinated within the incubation periods. ──: intermediate degradation daughter products were accumulated within the incubation periods.
37
situ bioremediation for cleaning up chlorinated compounds contaminated sites with soils
similar in characteristics to the test soils since no accumulation of trichlorobenzenes and
dichlorobenzenes is anticipated.
• Dechlorination Kinetics
The percentage recovery rates of the parent compound in river sediment and PPI
soil were lower than 80%, indicating that abiotic losses of the test chemical were
significant. Therefore, pseudo first-order rate constants in river sediment and PPI soil
were calculated after adjusting the observed kinetic data to account for the abiotic losses
of the test chemical (Lorah et al., 1997). Otherwise, pseudo first-order kinetic constants
in natural wetland soil and constructed wetland soil were directly calculated from the
measured data since the percentage recovery rates of the parent compound in abiotic
control microcosms were higher than 80%.
Kinetic rate constants, half-life times and associated lag periods of dechlorination
for all generation cultures in the test soils are shown in Table 3.3. The first-order kinetic
model was able to describe degradation kinetics in most microcosms reasonably well as
coefficient of determination (R2) values show (Table 3.3). 1,2,3,4-TeCB was observed to
be dechlorinated at significantly different rates in different types of test soils as shown in
Table 3.3. Lag periods were also observed to be significantly different in the test soils
(Table 3.3).
First-order rate constants ranged between 1.108 day-1 and 0.0227 day-1.
Corresponding half-life times varied from less than one day to up to 30 days. As for
kinetic constants, lag periods also showed a strong variation. In general, lag phases of
dechlorination in the 2nd and 3rd Generation cultures were remarkably shorter than those
38
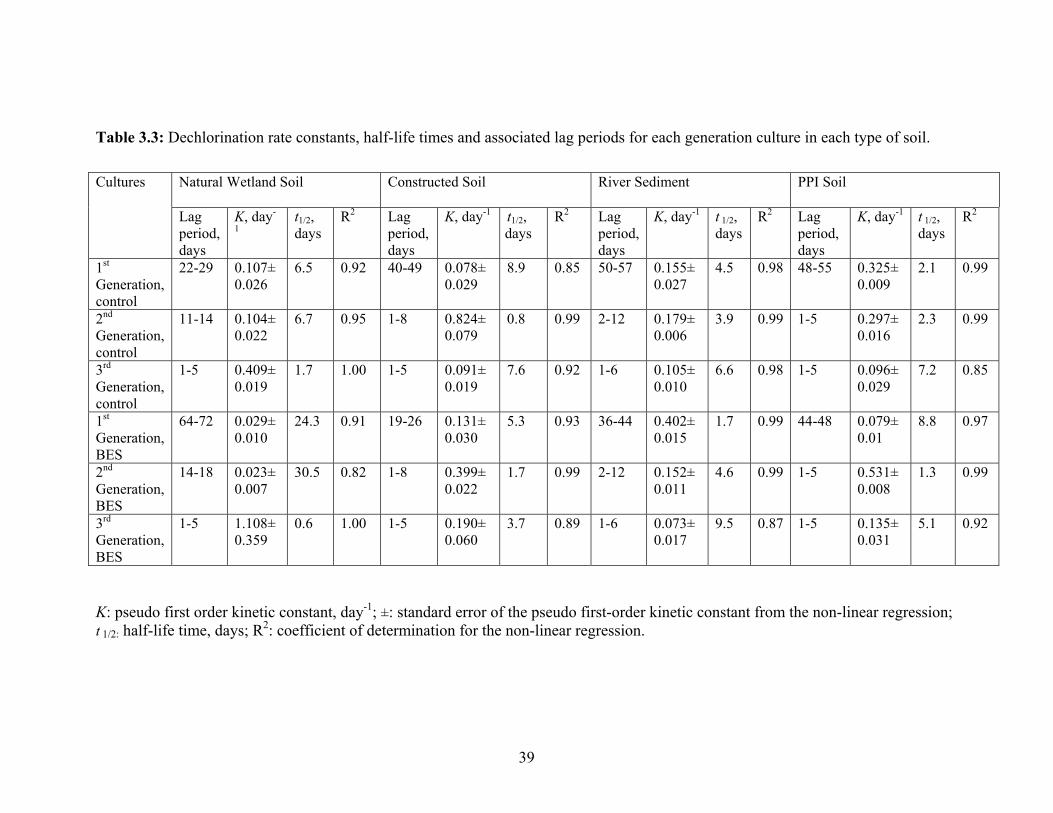
39
Table 3.3: Dechlorination rate constants, half-life times and associated lag periods for each generation culture in each type of soil.
Natural Wetland Soil Constructed Soil River Sediment PPI Soil Cultures
Lag period, days
K, day-
1 t1/2, days
R2 Lagperiod, days
K, day-1 t1/2, days
R2 Lagperiod, days
K, day-1 t 1/2, days
R2 Lagperiod, days
K, day-1 t 1/2, days
R2
1st Generation, control
22-29 0.107±0.026
6.5 0.92 40-49 0.078±0.029
8.9 0.85 50-57 0.155±0.027
4.5 0.98 48-55 0.325±0.009
2.1 0.99
2nd Generation, control
11-14 0.104±0.022
6.7 0.95 1-8 0.824±0.079
0.8 0.99 2-12 0.179±0.006
3.9 0.99 1-5 0.297±0.016
2.3 0.99
3rd Generation, control
1-5 0.409±0.019
1.7 1.00 1-5 0.091±0.019
7.6 0.92 1-6 0.105±0.010
6.6 0.98 1-5 0.096±0.029
7.2 0.85
1st Generation, BES
64-72 0.029±0.010
24.3 0.91 19-26 0.131±0.030
5.3 0.93 36-44 0.402±0.015
1.7 0.99 44-48 0.079±0.01
8.8 0.97
2nd Generation, BES
14-18 0.023±0.007
30.5 0.82 1-8 0.399±0.022
1.7 0.99 2-12 0.152±0.011
4.6 0.99 1-5 0.531±0.008
1.3 0.99
3rd Generation, BES
1-5 1.108±0.359
0.6 1.00 1-5 0.190±0.060
3.7 0.89 1-6 0.073±0.017
9.5 0.87 1-5 0.135±0.031
5.1 0.92
K: pseudo first order kinetic constant, day-1; ±: standard error of the pseudo first-order kinetic constant from the non-linear regression; t 1/2: half-life time, days; R2: coefficient of determination for the non-linear regression.
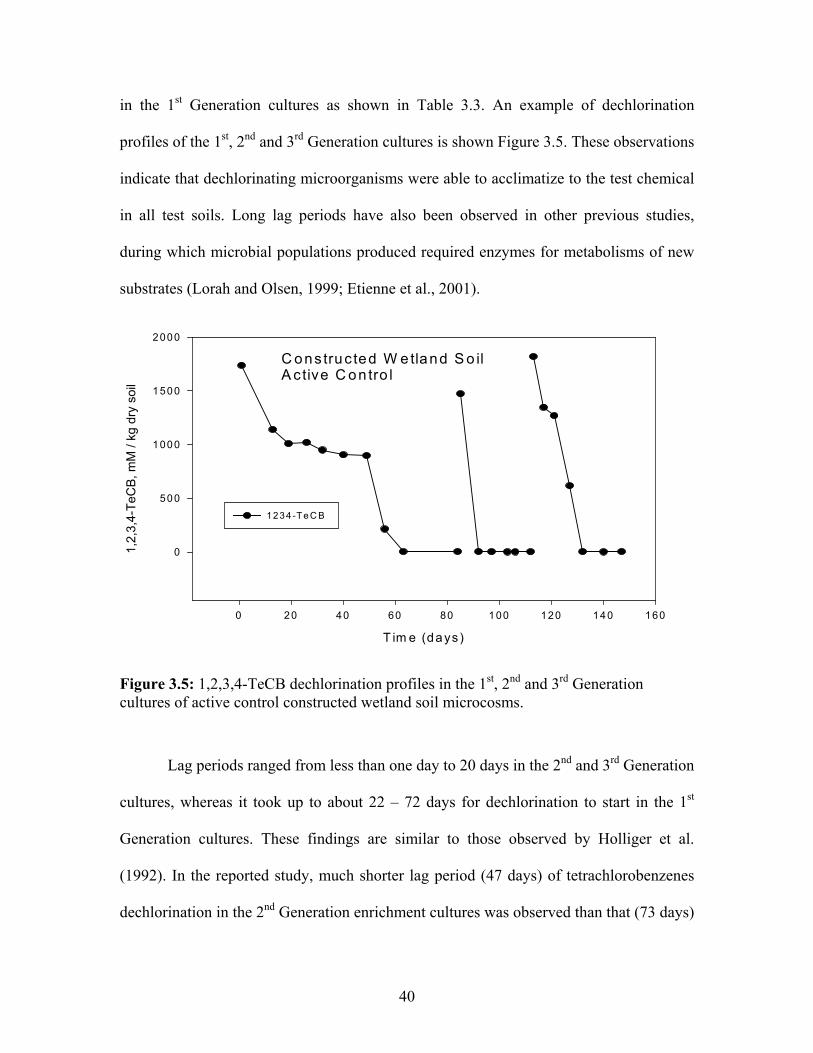
C onstructed W etland S o ilA ctive C on tro l
in the 1st Generation cultures as shown in Table 3.3. An example of dechlorination
profiles of the 1st, 2nd and 3rd Generation cultures is shown Figure 3.5. These observations
indicate that dechlorinating microorganisms were able to acclimatize to the test chemical
in all test soils. Long lag periods have also been observed in other previous studies,
during which microbial populations produced required enzymes for metabolisms of new
substrates (Lorah and Olsen, 1999; Etienne et al., 2001).
Figure 3.5: 1,2,3,4-TeCB dechlorination profiles in the 1st, 2nd and 3rd Generation cultures of active control constructed wetland soil microcosms.
Lag periods ranged from less than one day to 20 days in the 2nd and 3rd Generation
cultures, whereas it took up to about 22 – 72 days for dechlorination to start in the 1st
Generation cultures. These findings are similar to those observed by Holliger et al.
(1992). In the reported study, much shorter lag period (47 days) of tetrachlorobenzenes
dechlorination in the 2nd Generation enrichment cultures was observed than that (73 days)
40
T im e (days)
40 60 80 100 120 140
12 34-Te C B
0 20 160
1,2,
3,4-
TeC
B, m
M /
kg d
ry s
oil
0
500
1000
1500
2000
in the 1st Generation enrichment cultures inoculated with column material, in which
dechlorination occurred. Moreover, it can be observed that the 1st Generation culture in
the present study had shorter or similar lag phases even without inoculation compared
with that in the inoculated 1st Generation enrichment culture in the study conducted by
Holliger et al. (1992). Higher dechlorination activities were observed in the current study
compared with the findings of Holliger et al. (1992). These results show that natural
attenuation for treatment of chlorinated benzenes is feasible even without biostimulation
in the test soils.
It was also observed in the present study that longer lag periods were not always
associated with lower kinetic constants, which suggests that long delay time of
dechlorination does not necessarily indicate a low degradation kinetic rate. For example,
the second longest lag period for active control microcosms was between 48 – 55 days in
the 1st Generation culture of PPI soil, however, the corresponding first-order kinetic
constant (k = 0.325 day-1, t1/2 = 2.1 days) was the highest in the 1st Generation cultures of
active control microcosms (Table 3.3). On the other hand, the 1st Generation culture of
active control natural wetland soil had the shortest lag period (22-29 days) but had the
second lowest kinetic constant (0.107 day-1, t1/2 = 6.5 days). Therefore, dechlorination
kinetic constant and associated lag period are both very important parameters in
describing and comparing biodegradation kinetics. Degradation kinetics of the test
chemical in different generation cultures are discussed below.
1st Generation Cultures
In the 1st Generation cultures of active control microcosms, the dechlorination
rate constant in PPI soil was significantly higher than that in the other three test soils (P >
41
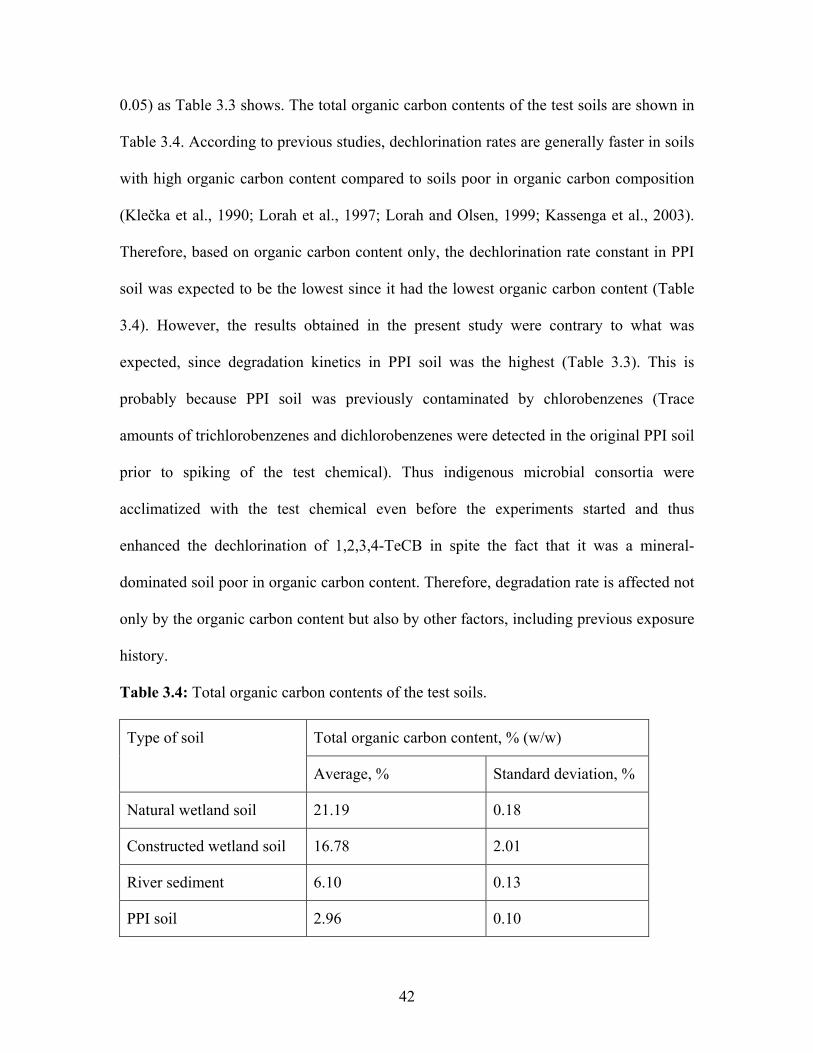
0.05) as Table 3.3 shows. The total organic carbon contents of the test soils are shown in
Table 3.4. According to previous studies, dechlorination rates are generally faster in soils
with high organic carbon content compared to soils poor in organic carbon composition
(Klečka et al., 1990; Lorah et al., 1997; Lorah and Olsen, 1999; Kassenga et al., 2003).
Therefore, based on organic carbon content only, the dechlorination rate constant in PPI
soil was expected to be the lowest since it had the lowest organic carbon content (Table
3.4). However, the results obtained in the present study were contrary to what was
expected, since degradation kinetics in PPI soil was the highest (Table 3.3). This is
probably because PPI soil was previously contaminated by chlorobenzenes (Trace
amounts of trichlorobenzenes and dichlorobenzenes were detected in the original PPI soil
prior to spiking of the test chemical). Thus indigenous microbial consortia were
acclimatized with the test chemical even before the experiments started and thus
enhanced the dechlorination of 1,2,3,4-TeCB in spite the fact that it was a mineral-
dominated soil poor in organic carbon content. Therefore, degradation rate is affected not
only by the organic carbon content but also by other factors, including previous exposure
history.
Table 3.4: Total organic carbon contents of the test soils.
Total organic carbon content, % (w/w) Type of soil
Average, % Standard deviation, %
Natural wetland soil 21.19 0.18
Constructed wetland soil 16.78 2.01
River sediment 6.10 0.13
PPI soil 2.96 0.10
42
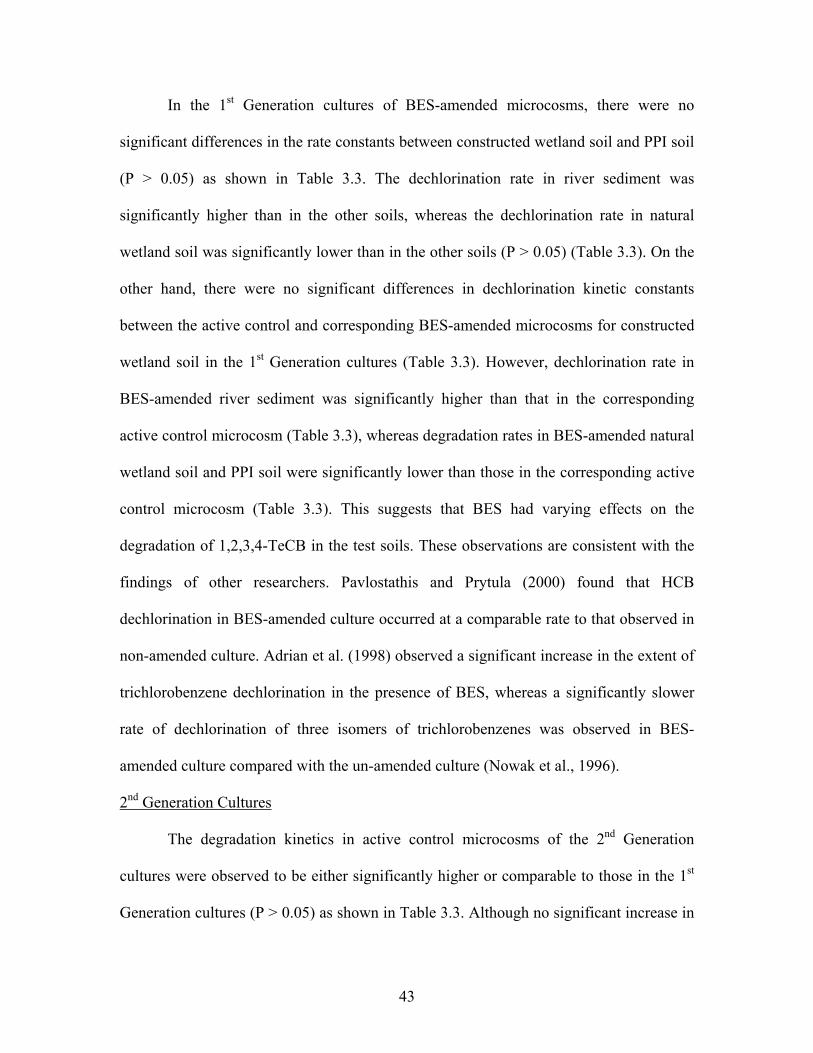
In the 1st Generation cultures of BES-amended microcosms, there were no
significant differences in the rate constants between constructed wetland soil and PPI soil
(P > 0.05) as shown in Table 3.3. The dechlorination rate in river sediment was
significantly higher than in the other soils, whereas the dechlorination rate in natural
wetland soil was significantly lower than in the other soils (P > 0.05) (Table 3.3). On the
other hand, there were no significant differences in dechlorination kinetic constants
between the active control and corresponding BES-amended microcosms for constructed
wetland soil in the 1st Generation cultures (Table 3.3). However, dechlorination rate in
BES-amended river sediment was significantly higher than that in the corresponding
active control microcosm (Table 3.3), whereas degradation rates in BES-amended natural
wetland soil and PPI soil were significantly lower than those in the corresponding active
control microcosm (Table 3.3). This suggests that BES had varying effects on the
degradation of 1,2,3,4-TeCB in the test soils. These observations are consistent with the
findings of other researchers. Pavlostathis and Prytula (2000) found that HCB
dechlorination in BES-amended culture occurred at a comparable rate to that observed in
non-amended culture. Adrian et al. (1998) observed a significant increase in the extent of
trichlorobenzene dechlorination in the presence of BES, whereas a significantly slower
rate of dechlorination of three isomers of trichlorobenzenes was observed in BES-
amended culture compared with the un-amended culture (Nowak et al., 1996).
2nd Generation Cultures
The degradation kinetics in active control microcosms of the 2nd Generation
cultures were observed to be either significantly higher or comparable to those in the 1st
Generation cultures (P > 0.05) as shown in Table 3.3. Although no significant increase in
43
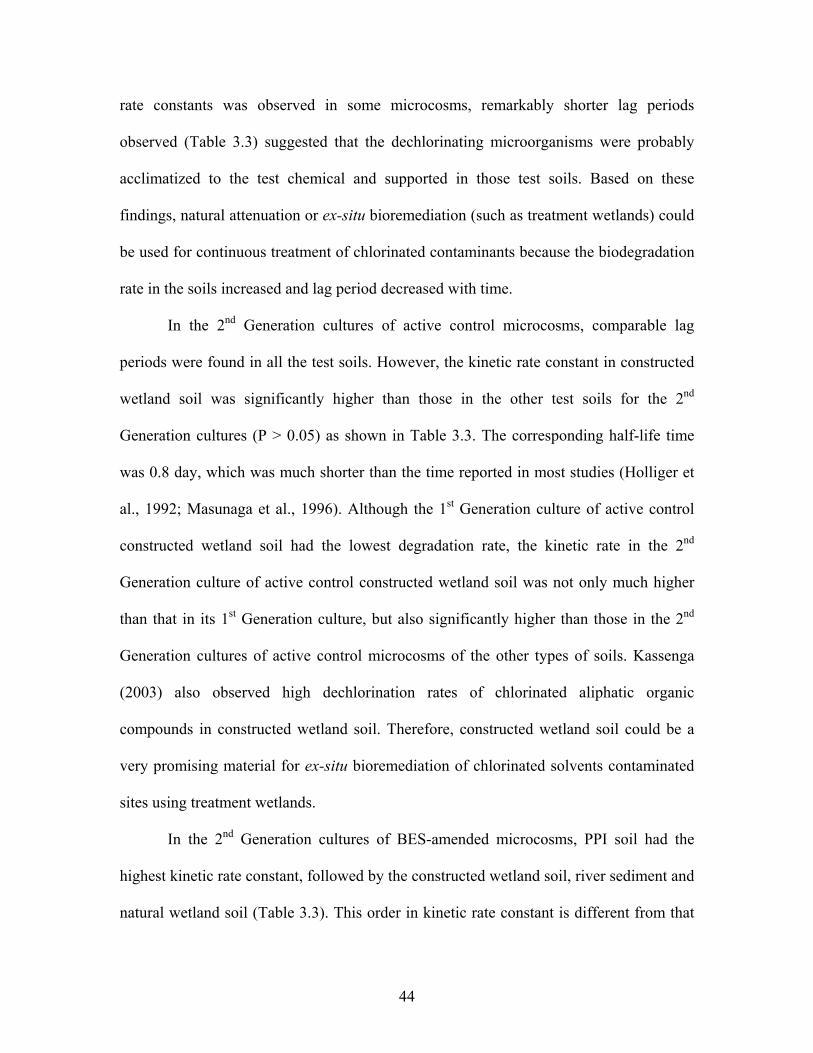
rate constants was observed in some microcosms, remarkably shorter lag periods
observed (Table 3.3) suggested that the dechlorinating microorganisms were probably
acclimatized to the test chemical and supported in those test soils. Based on these
findings, natural attenuation or ex-situ bioremediation (such as treatment wetlands) could
be used for continuous treatment of chlorinated contaminants because the biodegradation
rate in the soils increased and lag period decreased with time.
In the 2nd Generation cultures of active control microcosms, comparable lag
periods were found in all the test soils. However, the kinetic rate constant in constructed
wetland soil was significantly higher than those in the other test soils for the 2nd
Generation cultures (P > 0.05) as shown in Table 3.3. The corresponding half-life time
was 0.8 day, which was much shorter than the time reported in most studies (Holliger et
al., 1992; Masunaga et al., 1996). Although the 1st Generation culture of active control
constructed wetland soil had the lowest degradation rate, the kinetic rate in the 2nd
Generation culture of active control constructed wetland soil was not only much higher
than that in its 1st Generation culture, but also significantly higher than those in the 2nd
Generation cultures of active control microcosms of the other types of soils. Kassenga
(2003) also observed high dechlorination rates of chlorinated aliphatic organic
compounds in constructed wetland soil. Therefore, constructed wetland soil could be a
very promising material for ex-situ bioremediation of chlorinated solvents contaminated
sites using treatment wetlands.
In the 2nd Generation cultures of BES-amended microcosms, PPI soil had the
highest kinetic rate constant, followed by the constructed wetland soil, river sediment and
natural wetland soil (Table 3.3). This order in kinetic rate constant is different from that
44
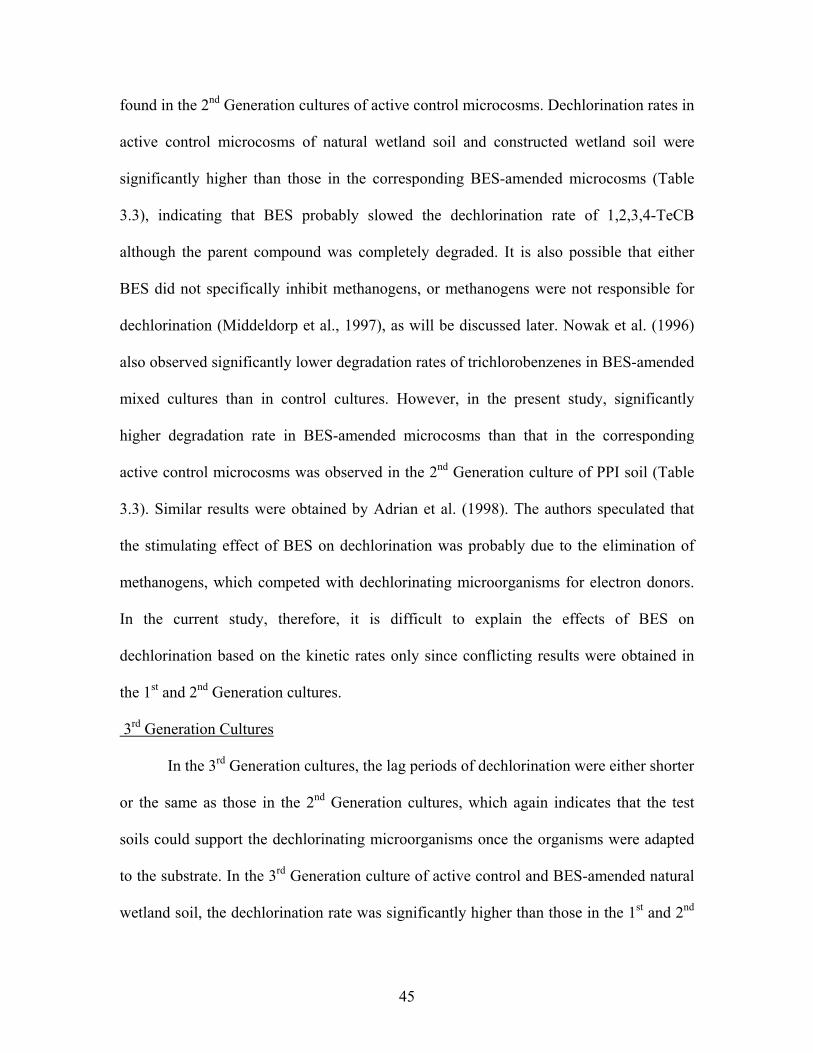
found in the 2nd Generation cultures of active control microcosms. Dechlorination rates in
active control microcosms of natural wetland soil and constructed wetland soil were
significantly higher than those in the corresponding BES-amended microcosms (Table
3.3), indicating that BES probably slowed the dechlorination rate of 1,2,3,4-TeCB
although the parent compound was completely degraded. It is also possible that either
BES did not specifically inhibit methanogens, or methanogens were not responsible for
dechlorination (Middeldorp et al., 1997), as will be discussed later. Nowak et al. (1996)
also observed significantly lower degradation rates of trichlorobenzenes in BES-amended
mixed cultures than in control cultures. However, in the present study, significantly
higher degradation rate in BES-amended microcosms than that in the corresponding
active control microcosms was observed in the 2nd Generation culture of PPI soil (Table
3.3). Similar results were obtained by Adrian et al. (1998). The authors speculated that
the stimulating effect of BES on dechlorination was probably due to the elimination of
methanogens, which competed with dechlorinating microorganisms for electron donors.
In the current study, therefore, it is difficult to explain the effects of BES on
dechlorination based on the kinetic rates only since conflicting results were obtained in
the 1st and 2nd Generation cultures.
3rd Generation Cultures
In the 3rd Generation cultures, the lag periods of dechlorination were either shorter
or the same as those in the 2nd Generation cultures, which again indicates that the test
soils could support the dechlorinating microorganisms once the organisms were adapted
to the substrate. In the 3rd Generation culture of active control and BES-amended natural
wetland soil, the dechlorination rate was significantly higher than those in the 1st and 2nd
45
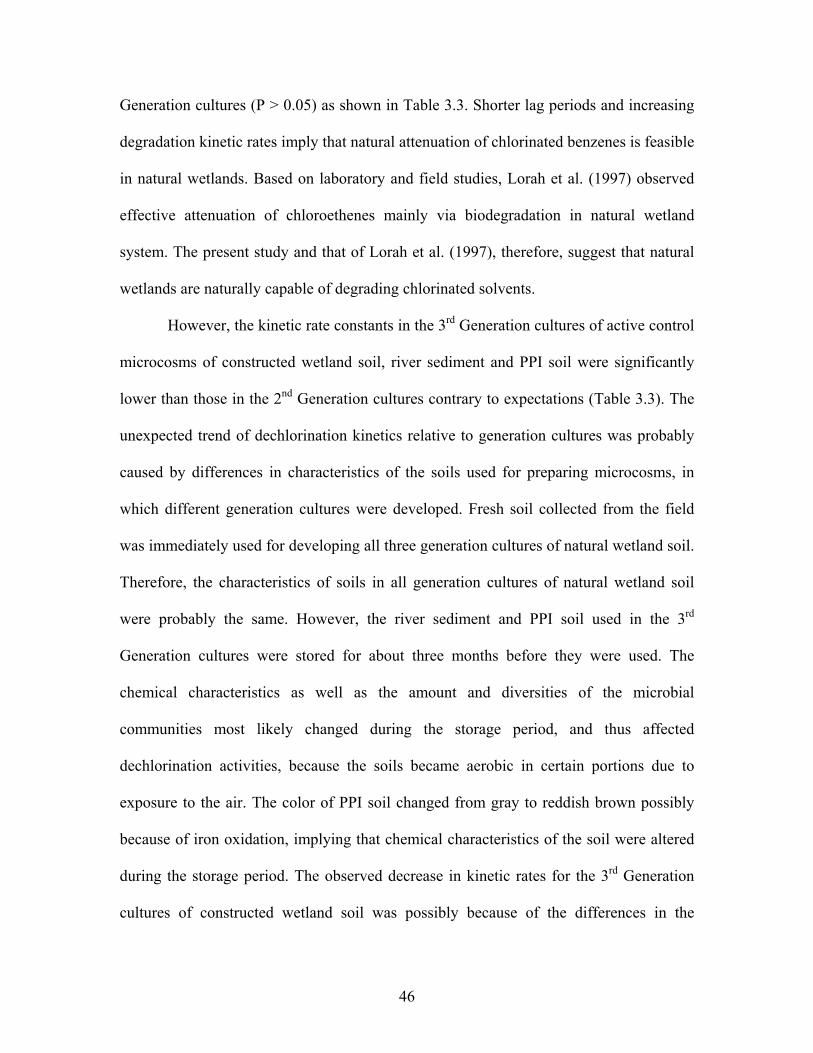
Generation cultures (P > 0.05) as shown in Table 3.3. Shorter lag periods and increasing
degradation kinetic rates imply that natural attenuation of chlorinated benzenes is feasible
in natural wetlands. Based on laboratory and field studies, Lorah et al. (1997) observed
effective attenuation of chloroethenes mainly via biodegradation in natural wetland
system. The present study and that of Lorah et al. (1997), therefore, suggest that natural
wetlands are naturally capable of degrading chlorinated solvents.
However, the kinetic rate constants in the 3rd Generation cultures of active control
microcosms of constructed wetland soil, river sediment and PPI soil were significantly
lower than those in the 2nd Generation cultures contrary to expectations (Table 3.3). The
unexpected trend of dechlorination kinetics relative to generation cultures was probably
caused by differences in characteristics of the soils used for preparing microcosms, in
which different generation cultures were developed. Fresh soil collected from the field
was immediately used for developing all three generation cultures of natural wetland soil.
Therefore, the characteristics of soils in all generation cultures of natural wetland soil
were probably the same. However, the river sediment and PPI soil used in the 3rd
Generation cultures were stored for about three months before they were used. The
chemical characteristics as well as the amount and diversities of the microbial
communities most likely changed during the storage period, and thus affected
dechlorination activities, because the soils became aerobic in certain portions due to
exposure to the air. The color of PPI soil changed from gray to reddish brown possibly
because of iron oxidation, implying that chemical characteristics of the soil were altered
during the storage period. The observed decrease in kinetic rates for the 3rd Generation
cultures of constructed wetland soil was possibly because of the differences in the
46
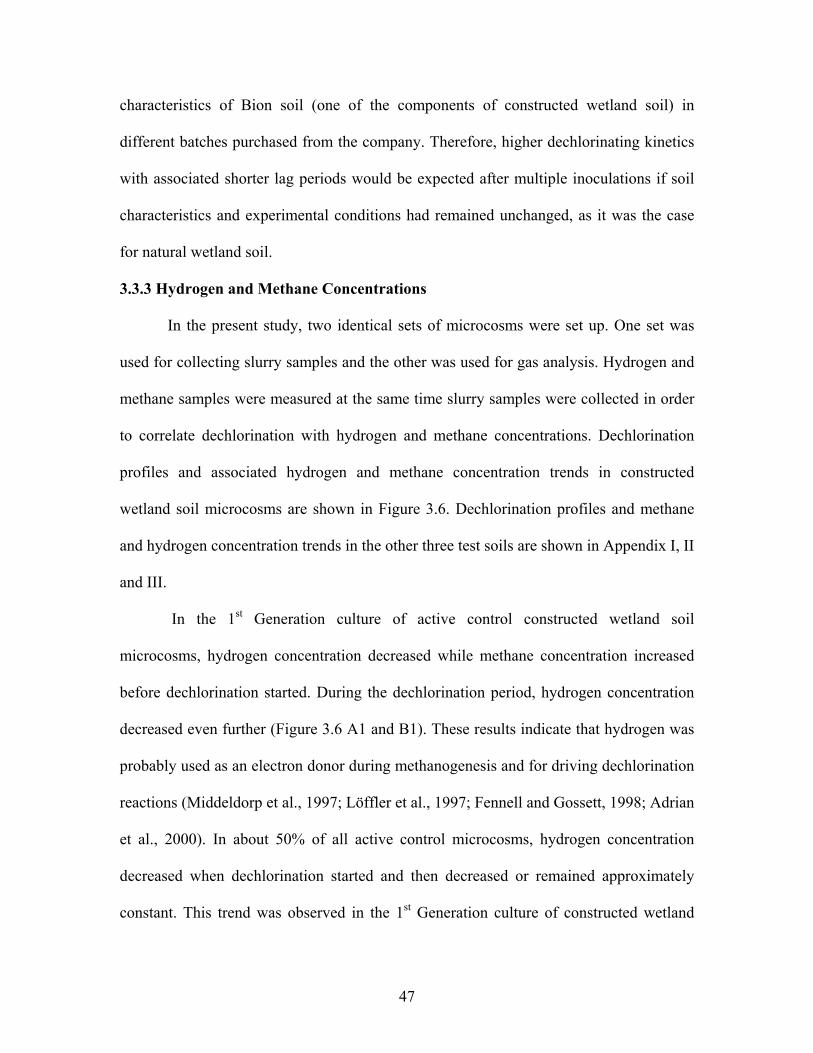
characteristics of Bion soil (one of the components of constructed wetland soil) in
different batches purchased from the company. Therefore, higher dechlorinating kinetics
with associated shorter lag periods would be expected after multiple inoculations if soil
characteristics and experimental conditions had remained unchanged, as it was the case
for natural wetland soil.
3.3.3 Hydrogen and Methane Concentrations
In the present study, two identical sets of microcosms were set up. One set was
used for collecting slurry samples and the other was used for gas analysis. Hydrogen and
methane samples were measured at the same time slurry samples were collected in order
to correlate dechlorination with hydrogen and methane concentrations. Dechlorination
profiles and associated hydrogen and methane concentration trends in constructed
wetland soil microcosms are shown in Figure 3.6. Dechlorination profiles and methane
and hydrogen concentration trends in the other three test soils are shown in Appendix I, II
and III.
In the 1st Generation culture of active control constructed wetland soil
microcosms, hydrogen concentration decreased while methane concentration increased
before dechlorination started. During the dechlorination period, hydrogen concentration
decreased even further (Figure 3.6 A1 and B1). These results indicate that hydrogen was
probably used as an electron donor during methanogenesis and for driving dechlorination
reactions (Middeldorp et al., 1997; Löffler et al., 1997; Fennell and Gossett, 1998; Adrian
et al., 2000). In about 50% of all active control microcosms, hydrogen concentration
decreased when dechlorination started and then decreased or remained approximately
constant. This trend was observed in the 1st Generation culture of constructed wetland
47
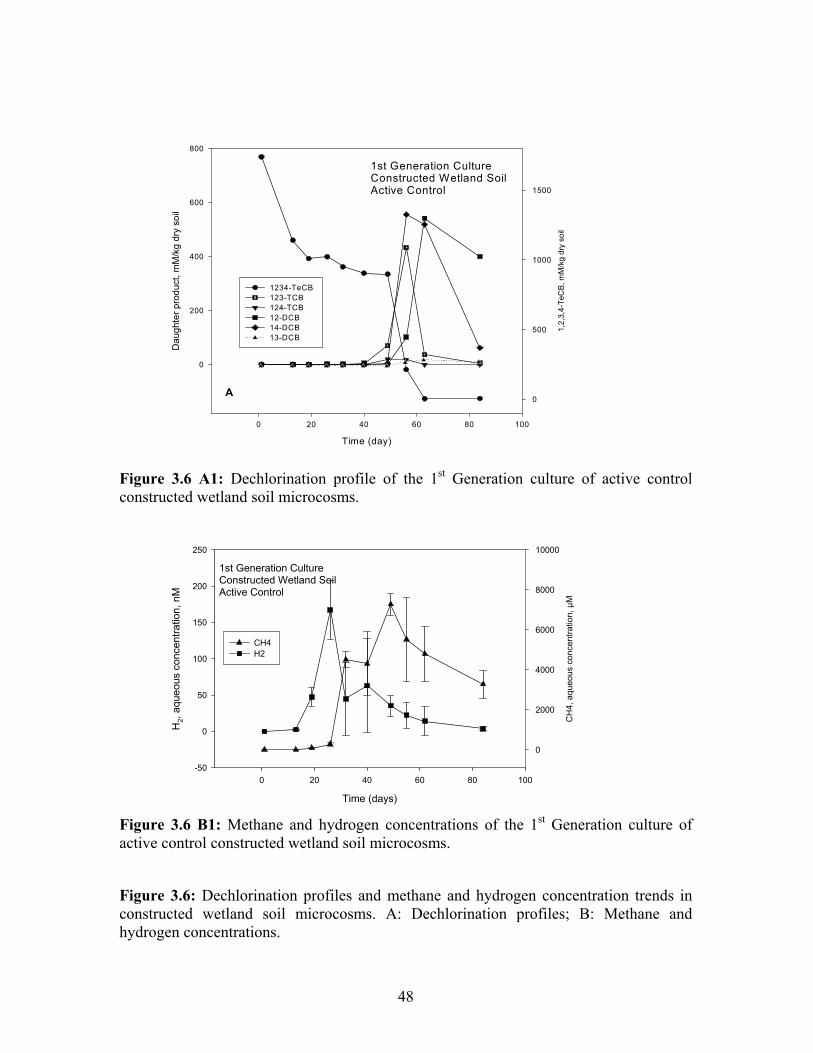
1st Generation CultureConstructed Wetland SoilActive Control
Time (day)
0 20 40 60 80 100
1,2,
3,4-
TeC
B, m
M/k
g dr
y so
il
0
500
1000
1500
Dau
ghte
r pro
duct
, mM
/kg
dry
soil
0
200
400
600
800
1234-TeCB 123-TCB 124-TCB 12-DCB 14-DCB 13-DCB
A
Figure 3.6 A1: Dechlorination profile of the 1st Generation culture of active control constructed wetland soil microcosms.
1st Generation CultureConstructed Wetland Soil Active Control
Time (days)
0 20 40 60 80 100
CH
4, a
queo
us c
once
ntra
tion,
µM
0
2000
4000
6000
8000
10000
H2,
aque
ous
conc
entra
tion,
nM
-50
0
50
100
150
200
250
CH4 H2
Figure 3.6 B1: Methane and hydrogen concentrations of the 1st Generation culture of active control constructed wetland soil microcosms.
Figure 3.6: Dechlorination profiles and methane and hydrogen concentration trends in constructed wetland soil microcosms. A: Dechlorination profiles; B: Methane and hydrogen concentrations.
48
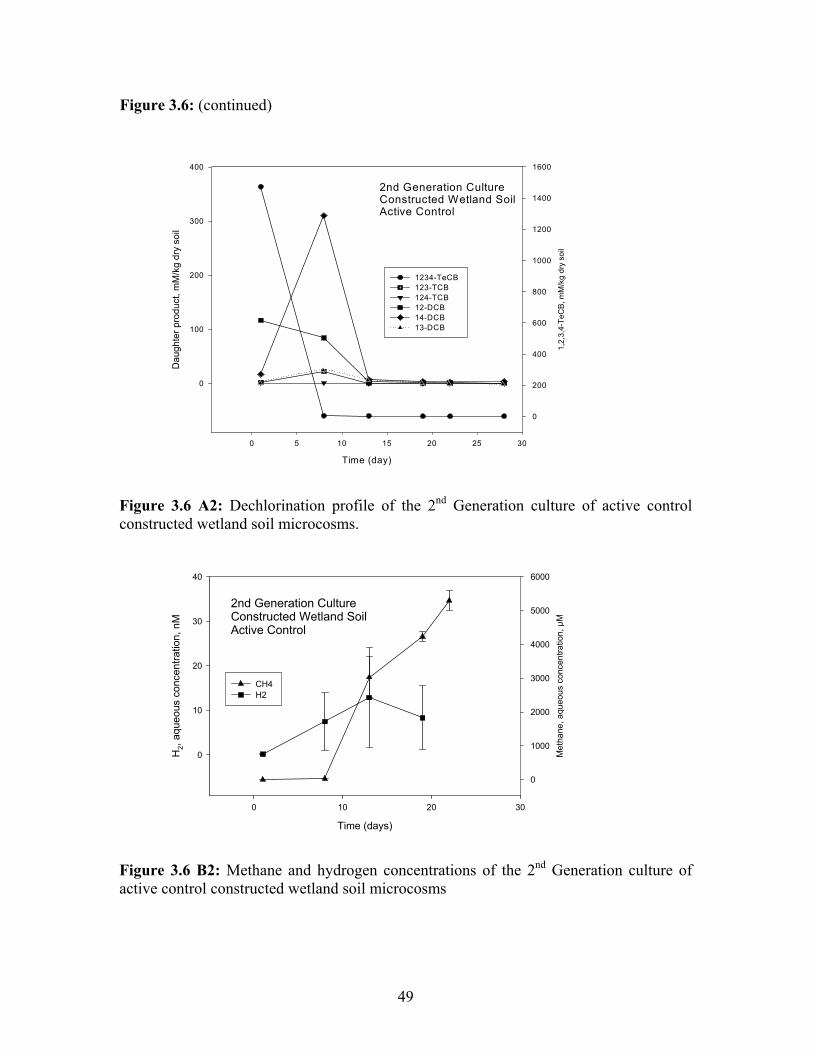
Figure 3.6: (continued)
2nd Generation CultureConstructed Wetland SoilActive Control
Time (day)
0 5 10 15 20 25 30
1,2,
3,4-
TeC
B, m
M/k
g dr
y so
il
0
200
400
600
800
1000
1200
1400
1600D
augh
ter p
rodu
ct, m
M/k
g dr
y so
il
0
100
200
300
400
1234-TeCB 123-TCB 124-TCB 12-DCB 14-DCB 13-DCB
Figure 3.6 A2: Dechlorination profile of the 2nd Generation culture of active control constructed wetland soil microcosms.
2nd Generation CultureConstructed Wetland SoilActive Control
Time (days)
0 10 20 30
Met
hane
, aqu
eous
con
cent
ratio
n, µ
M
0
1000
2000
3000
4000
5000
6000
H2,
aque
ous
conc
entra
tion,
nM
0
10
20
30
40
CH4 H2
Figure 3.6 B2: Methane and hydrogen concentrations of the 2nd Generation culture of active control constructed wetland soil microcosms
49
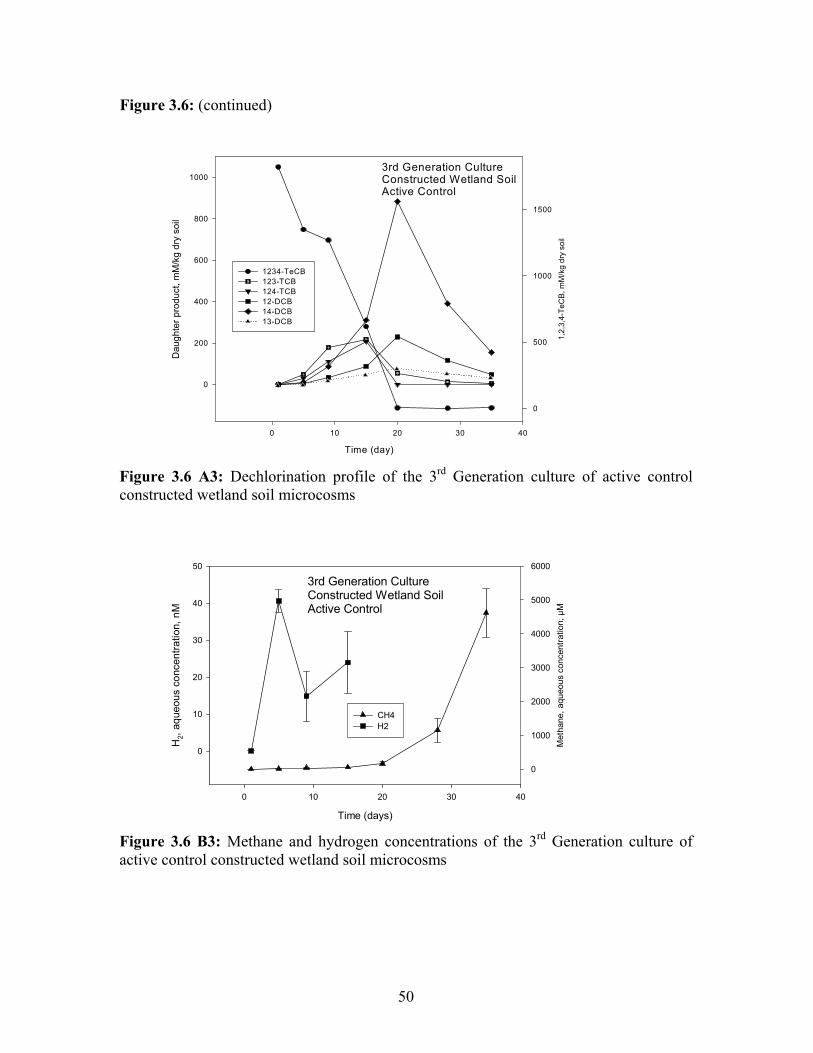
Figure 3.6: (continued)
3rd Generation CultureConstructed Wetland SoilActive Control
Time (day)
0 10 20 30 40
1,2,
3,4-
TeC
B, m
M/k
g dr
y so
il
0
500
1000
1500
Dau
ghte
r pro
duct
, mM
/kg
dry
soil
0
200
400
600
800
1000
1234-TeCB 123-TCB 124-TCB 12-DCB 14-DCB 13-DCB
Figure 3.6 A3: Dechlorination profile of the 3rd Generation culture of active control constructed wetland soil microcosms
3rd Generation CultureConstructed Wetland SoilActive Control
Time (days)
0 10 20 30 40
Met
hane
, aqu
eous
con
cent
ratio
n, µ
M
0
1000
2000
3000
4000
5000
6000
H2,
aque
ous
conc
entra
tion,
nM
0
10
20
30
40
50
CH4 H2
Figure 3.6 B3: Methane and hydrogen concentrations of the 3rd Generation culture of active control constructed wetland soil microcosms
50
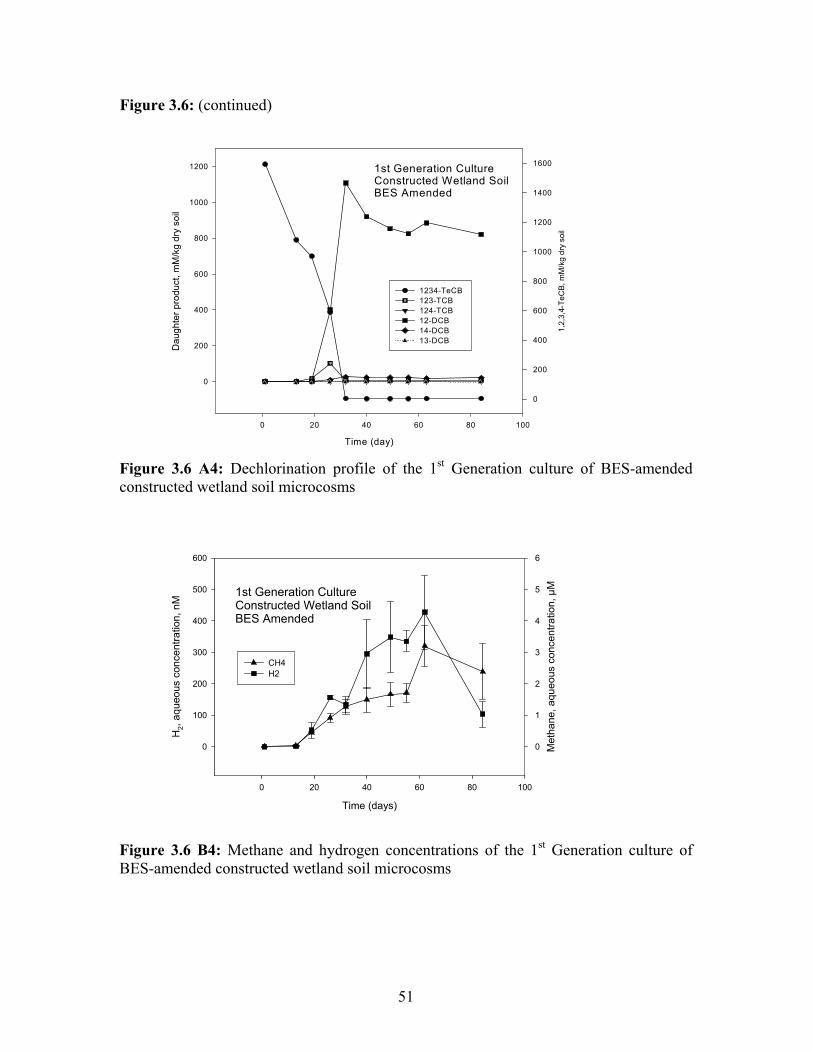
Figure 3.6: (continued)
1st Generation CultureConstructed Wetland SoilBES Amended
Time (day)
0 20 40 60 80 100
1,2,
3,4-
TeC
B, m
M/k
g dr
y so
il
0
200
400
600
800
1000
1200
1400
1600D
augh
ter p
rodu
ct, m
M/k
g dr
y so
il
0
200
400
600
800
1000
1200
1234-TeCB 123-TCB 124-TCB 12-DCB 14-DCB 13-DCB
Figure 3.6 A4: Dechlorination profile of the 1st Generation culture of BES-amended constructed wetland soil microcosms
1st Generation CultureConstructed Wetland Soil BES Amended
Time (days)
0 20 40 60 80 100
Met
hane
, aqu
eous
con
cent
ratio
n, µ
M
0
1
2
3
4
5
6
H2,
aque
ous
conc
entra
tion,
nM
0
100
200
300
400
500
600
CH4 H2
Figure 3.6 B4: Methane and hydrogen concentrations of the 1st Generation culture of BES-amended constructed wetland soil microcosms
51
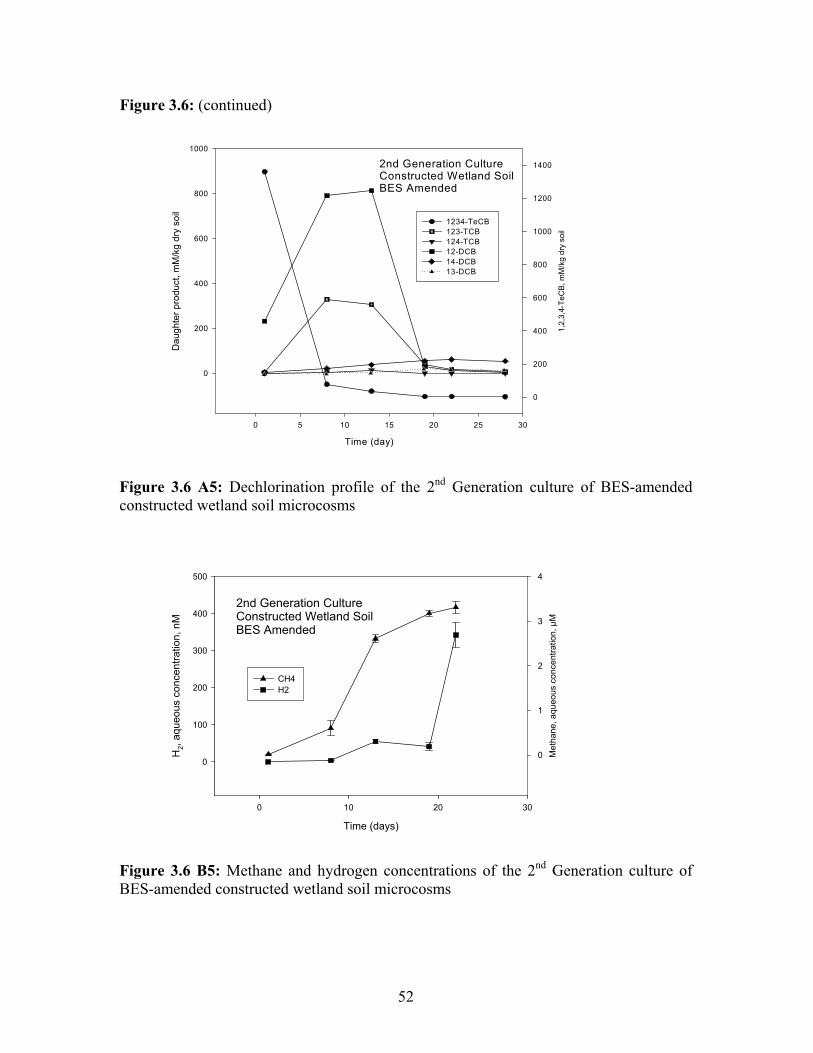
Figure 3.6: (continued)
2nd Generation CultureConstructed Wetland SoilBES Amended
Time (day)
0 5 10 15 20 25 30
1,2,
3,4-
TeC
B, m
M/k
g dr
y so
il
0
200
400
600
800
1000
1200
1400D
augh
ter p
rodu
ct, m
M/k
g dr
y so
il
0
200
400
600
800
1000
1234-TeCB 123-TCB 124-TCB 12-DCB 14-DCB 13-DCB
Figure 3.6 A5: Dechlorination profile of the 2nd Generation culture of BES-amended constructed wetland soil microcosms
2nd Generation CultureConstructed Wetland SoilBES Amended
Time (days)
0 10 20 30
Met
hane
, aqu
eous
con
cent
ratio
n, µ
M
0
1
2
3
4
H2,
aque
ous
conc
entra
tion,
nM
0
100
200
300
400
500
CH4 H2
Figure 3.6 B5: Methane and hydrogen concentrations of the 2nd Generation culture of BES-amended constructed wetland soil microcosms
52
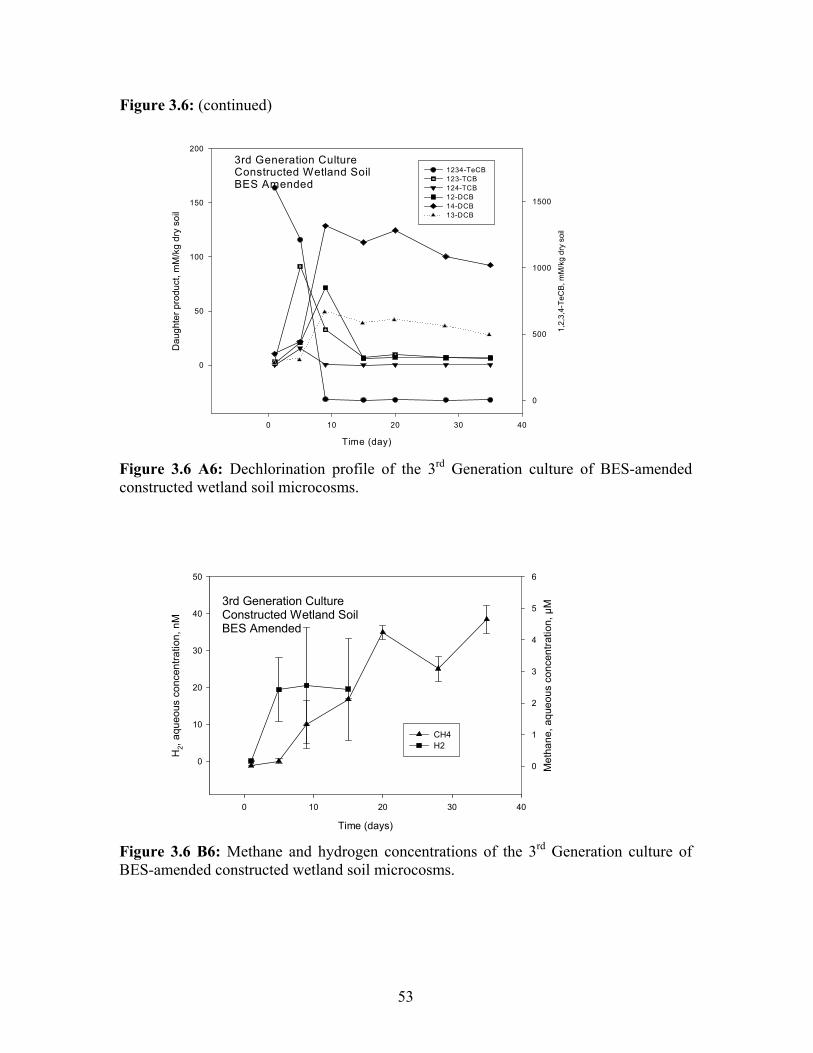
Figure 3.6: (continued)
3rd Generation CultureConstructed Wetland SoilBES Amended
Time (day)
0 10 20 30 40
1,2,
3,4-
TeC
B, m
M/k
g dr
y so
il
0
500
1000
1500
Dau
ghte
r pro
duct
, mM
/kg
dry
soil
0
50
100
150
200
1234-TeCB 123-TCB 124-TCB 12-DCB 14-DCB 13-DCB
Figure 3.6 A6: Dechlorination profile of the 3rd Generation culture of BES-amended constructed wetland soil microcosms.
3rd Generation CultureConstructed Wetland SoilBES Amended
Time (days)
0 10 20 30 40
Met
hane
, aqu
eous
con
cent
ratio
n, µ
M
0
1
2
3
4
5
6
H2,
aque
ous
conc
entra
tion,
nM
0
10
20
30
40
50
CH4 H2
Figure 3.6 B6: Methane and hydrogen concentrations of the 3rd Generation culture of BES-amended constructed wetland soil microcosms.
53
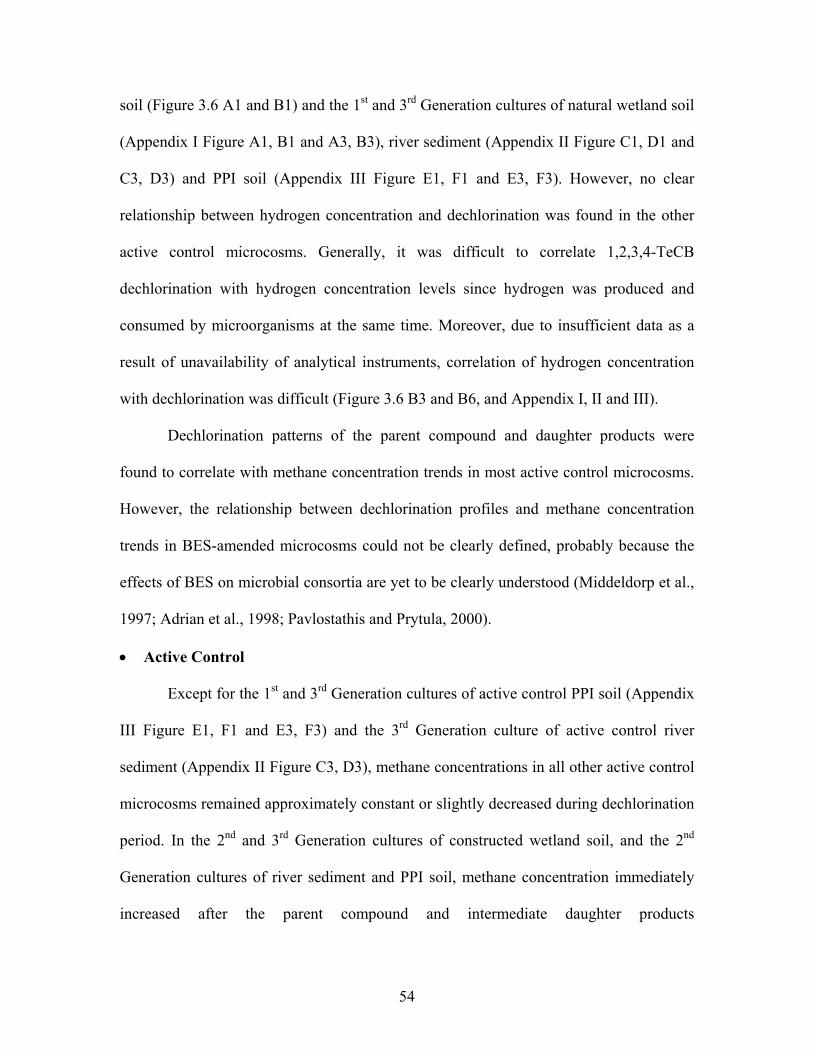
soil (Figure 3.6 A1 and B1) and the 1st and 3rd Generation cultures of natural wetland soil
(Appendix I Figure A1, B1 and A3, B3), river sediment (Appendix II Figure C1, D1 and
C3, D3) and PPI soil (Appendix III Figure E1, F1 and E3, F3). However, no clear
relationship between hydrogen concentration and dechlorination was found in the other
active control microcosms. Generally, it was difficult to correlate 1,2,3,4-TeCB
dechlorination with hydrogen concentration levels since hydrogen was produced and
consumed by microorganisms at the same time. Moreover, due to insufficient data as a
result of unavailability of analytical instruments, correlation of hydrogen concentration
with dechlorination was difficult (Figure 3.6 B3 and B6, and Appendix I, II and III).
Dechlorination patterns of the parent compound and daughter products were
found to correlate with methane concentration trends in most active control microcosms.
However, the relationship between dechlorination profiles and methane concentration
trends in BES-amended microcosms could not be clearly defined, probably because the
effects of BES on microbial consortia are yet to be clearly understood (Middeldorp et al.,
1997; Adrian et al., 1998; Pavlostathis and Prytula, 2000).
• Active Control
Except for the 1st and 3rd Generation cultures of active control PPI soil (Appendix
III Figure E1, F1 and E3, F3) and the 3rd Generation culture of active control river
sediment (Appendix II Figure C3, D3), methane concentrations in all other active control
microcosms remained approximately constant or slightly decreased during dechlorination
period. In the 2nd and 3rd Generation cultures of constructed wetland soil, and the 2nd
Generation cultures of river sediment and PPI soil, methane concentration immediately
increased after the parent compound and intermediate daughter products
54
(trichlorobenzenes and dichlorobenzenes) were completely biodegraded as illustrated in
Figure 3.6 A2, B2 and A3, B3, Appendix II (Figure C2 and D2), and Appendix III
(Figure E2 and F2). Similar pattern was observed in the 3rd Generation culture of natural
wetland soil (Appendix I Figure A3 and B3). Although no clear trends of methane
concentration were observed in the 1st Generation culture of PPI soil and the 3rd
Generation cultures of river sediment and PPI soil, it can generally be observed that
methanogenesis was inhibited during dechlorination periods and methane concentration
increased after the parent compound and intermediate daughter products
(trichlorobenzenes and dichlorobenzenes) were completely dechlorinated.
There are two possible explanations to the phenomena observed above. The first
possibility is that dechlorination of chlorobenzenes was probably mediated by
methanogens, which were able to use both chlorobenzenes and carbon dioxide as electron
acceptors. Methanogens have been reported to be able to use other chlorinated solvents
such as tetrachloroethene and 1,2-dichloroethane as electron acceptors (Tandol et al.,
1994; Fantroussi et al., 1998; Klečka et al., 1998). Significantly higher free energy is
produced per mole of hydrogen consumed during 1,2,3,4-TeCB dechlorination (-155.2
kJ/mole H2) (Dolfing and Harrison, 1992) compared to the energy released during CO2
reduction (-32.7 kJ/mole H2) (Conrad and Klose, 2000). Since higher energy is yielded
when chlorobenzenes are used as electron acceptors compared to carbon dioxide (Dolfing
and Harrison, 1992; Conrad and Klose, 2000), methanogens would most likely prefer to
use chlorobenzenes to carbon dioxide as energy source when both substrates are present.
Therefore, it is possible that methanogens started to use carbon dioxide as an electron
acceptor to produce methane after all chlorobenzenes were completely dechlorinated. The
55
second possibility is that dechlorinating microorganisms out-competed methanogens for
hydrogen as an electron donor. During the dechlorination period, the dechlorinating
microorganisms probably prevented methanogens from using hydrogen even though the
population of potentially active methanogens was relatively higher than that of
dechlorinators in the soils. Thus, methanogens were not able to use hydrogen as an
electron donor until dechlorination was complete.
In the 1st and 2nd Generation cultures of active control microcosms of natural
wetland soil (Appendix I Figure A1 through B2) and the 1st Generation culture of active
control constructed wetland soil (Figure 3.6 A1 and B1), methane concentration
increased before dechlorination started, probably because of the abundance of indigenous
methanogens existing in the original soils as found in another microcosm study
conducted in our lab. In that study, methane concentration was observed to start
accumulating immediately after incubation in uncontaminated natural and constructed
wetland soils microcosms (data not shown). The observed decrease in methane
concentration after dechlorination started was probably due to the removal of methane
from the headspace during sampling coupled with ceasing of methane production.
Another possible reason is that the total headspace pressure increased due to the
production of other gases such as CO2, resulting in the decrease in the methane partial
pressure and consequently its headspace concentration. These indicate that dechlorinators
were more competitive for hydrogen than methanogens, although initially methanogens
were probably the main microbial group in the microcosms. These observations support
the second hypothesis stated above. However, it is also possible that methanogens were
responsible for dechlorination since the methanogens, which were used to carbon dioxide
56
as an electron acceptor, needed some time to get acclimatized to chlorobenzenes as
substrates. Once methanogens were adapted to chlorobenzenes, methanogenesis ceased
since chlorobenzenes are more attractive electron acceptors than CO2 by virtue of their
high energy yield.
• BES
In BES-amended microcosms, aqueous concentrations of methane were all less
than 12 µM (µMol/L). However, aqueous concentrations of methane reached a value as
high as about 7000 µM (µMol/L) (a mean of triplicates) in active control microcosms
during the incubation period. It is worth noting that the solubility of methane in water
under 100 psi (6.7 atm) at 25 °C is about 9500 µM (µMol/L) (Carroll et al., 1998),
showing that methane concentration and pressure in some of the active control
microcosms were substantially high. Lower methane concentration in BES-amended
microcosm compared with active control microcosms indicates that methanogenesis was
probably partially inhibited by BES as Middeldorp et al. (1997) speculated. Therefore,
BES is probably not a very effective complete inhibitor of methanogenesis. In a study
conducted by Belay and Daniels (1987), it was found that BES could completely inhibit
two Methanococcus species, but it only partly inhibited two Methanobacterium strains. In
addition, they found that several methanogenic bacteria could use BES to produce
ethylene when exposed to the coenzyme M analog (Belay and Daniels, 1987). In the
current study, ethylene was observed in some of BES-amended microcosms (data not
shown), in agreement with the findings of Belay and Daniels (1987). Therefore, the
potency of BES differs depending on the types of methanogenic organisms involved. It is
capable of supporting the growth of some methanogens and inhibiting others.
57
In BES-amended microcosms, the relationships between dechlorination and
methane concentration levels were slightly different from that observed in active control
microcosms. In some BES-amended microcosms, similar relationship between
dechlorination profile and methane concentration pattern as that established in the active
control microcosms was found. However, significantly different correlation was observed
in the other BES-amended microcosms as discussed below.
During the dechlorination period, methane concentration continued to increase
while significant amounts of intermediate daughter products (trichlorobenzenes and
dichlorobenzenes) were detected, contrary to the trend observed in the active control
microcosms. This phenomenon was observed in the 1st, 2nd and 3rd Generation cultures of
BES-amended constructed wetland soil (Figure 3.6 A4 through B6), the 3rd Generation
culture of BES-amended natural wetland soil (Appendix I (Figure A6 and B6)) and the 1st
Generation culture of BES-amended PPI soil (Appendix III (Figure E6 and F6)). These
results indicate that BES could not effectively inhibit methanogens (Belay and Daniels,
1987; Middeldorp et al., 1997; Löffler et al., 1997). In the 3rd Generation cultures of
BES-amended constructed wetland soil and natural wetland soil, the parent compound
and intermediate daughter products (trichlorobenzenes and dichlorobenzenes) were
completely dechlorinated. However, significant amounts of those intermediate daughter
products were observed in those BES-amended microcosms, although methane
concentration increased continuously during the dechlorination period. These findings,
therefore, suggest that dechlorination of chlorobenzenes was probably not mediated by
methanogens. Moreover, it is most likely that BES inhibited chlorobenzene
dechlorination to a limited extent since trichlorobenzenes and dichlorobenzenes
58
accumulated. These observations are consistent with the findings by Löffler et al. (1997).
In the reported study, it was suggested that dechlorination reactions were catalyzed by
bacterial processes rather than methanogenic cometabolism, and that BES had an
inhibitory effect on chloroethene dechlorination in the cultures not containing
methanogens (Löffler et al., 1997). Middeldorp et al. (1997) also observed complete
inhibition of dechlorination of chlorinated benzenes and polychlorinated biphenyls
(PCBs) by the addition of BES.
3.3.4 Diversities of Microbial Communities
Soil slurry samples from active control and BES-amended microcosms of all the
test soils were collected and analyzed to compare the diversities of microbial
communities and to investigate the effects of BES on microbial consortia. Samples from
the 3rd Generation cultures of natural wetland soil and river sediment, and the 2nd
Generation cultures of constructed wetland soil and PPI soil were taken for DNA
extraction and amplification. However, DNA extraction and purification, and PCR
amplification of PPI soil slurry sample failed and thus DGGE analysis of microbial
community diversity could not be conducted for PPI soil. The failure of DNA extraction
and amplification for PPI soil was possibly due to inhibition.
PCR amplification products from two different sets of primers were tested for the
presence of bacteria and archaea, and the concentration of amplified PCR products prior
to DGGE analysis. Bacteria DNA with the anticipated size of 625 base pair (bp) and
archaea DNA with the expected size of 615 bp were detected by the Bioanalyzer for all
samples.
59
• Bacteria Group
DGGE band profiles of the PCR amplification products obtained with target DNA
of bacteria extracted from active control microcosms of the test soils are shown in Figure
3.7. Comparing the banding patterns (Figure 3.7), the dechlorinating cultures in different
test soils contained different microbial composition and diversity. For example, band d
existed in constructed wetland soil (Figure 3.7, Lane 1) but probably was not manifested
in river sediment (Figure 3.7, Lane 3). In addition, band a was discernable in Lane 1 and
Lane 3, but not in Lane 2 (Figure 3.7); whereas band c was visible in Lane 1 and Lane 2
but not in Lane 3 (Figure 3.7). These observations suggest that different microbial
communities were able to completely dechlorinate 1,2,3,4-TeCB in active control
treatments of all test soils.
Comparison of numbers and distribution patterns of DGGE bands revealed that
diversities of the microbial populations in active control and BES-amended microcosms
were different for the same type of soil as Figure 3.8 shows. In constructed wetland soil,
band A was probably visible in BES-amended treatment but not in active control
treatment (Figure 3.8, Lane 1 and 2); whereas band D was intensive in active control
treatment but very faint in BES-amended treatment (Figure 3.8, Lane 1 and 2). These
differences in the DGGE banding patterns indicate that BES probably altered the
microbial compositions. In active control and BES-amended river sediment, bands B, C,
E, and F in BES-amended treatment were very faint or probably did not exist in active
control treatment (Figure 3.8, Lane 5 and 6), indicating that BES changed the microbial
composition and diversity. Chiu and Lee (2001) also observed a DGGE band, which
represented a bacterium in the stock culture capable of dechlorinating TCE, whereas the
60
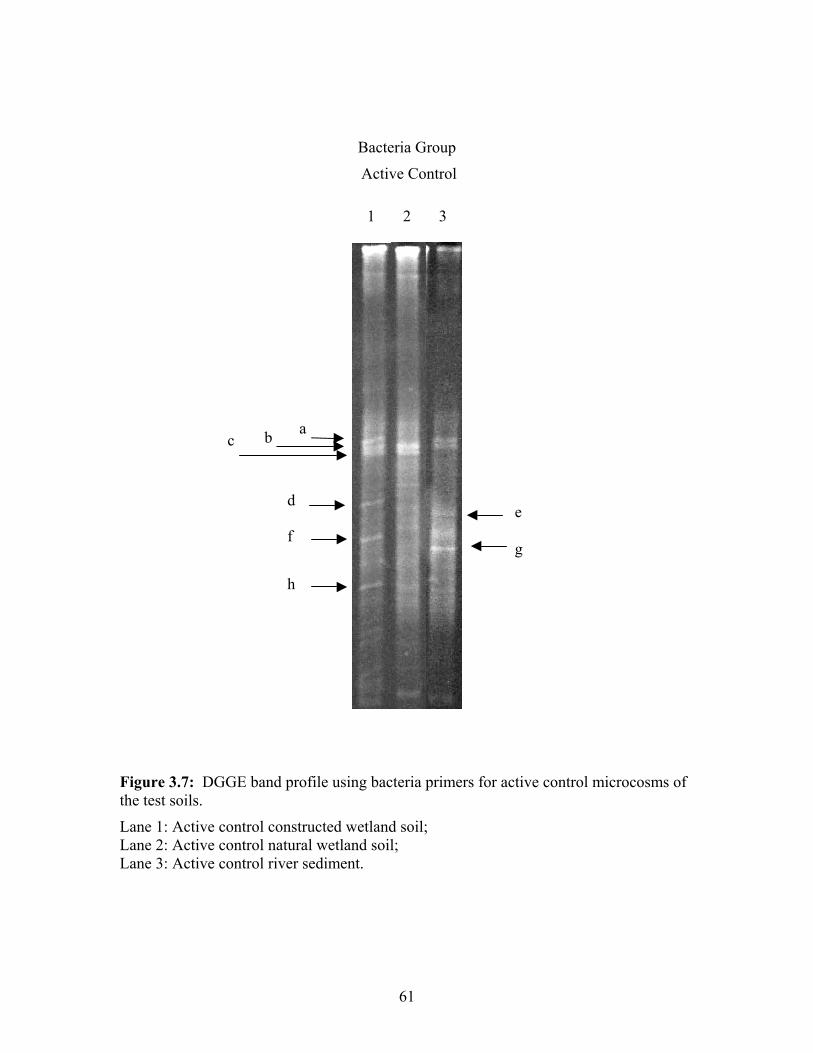
Bacteria Group
Active Control
1 2 3
f
d
h
c b a
e g
Figure 3.7: DGGE band profile using bacteria primers for active control microcosms of the test soils.
Lane 1: Active control constructed wetland soil; Lane 2: Active control natural wetland soil; Lane 3: Active control river sediment.
61
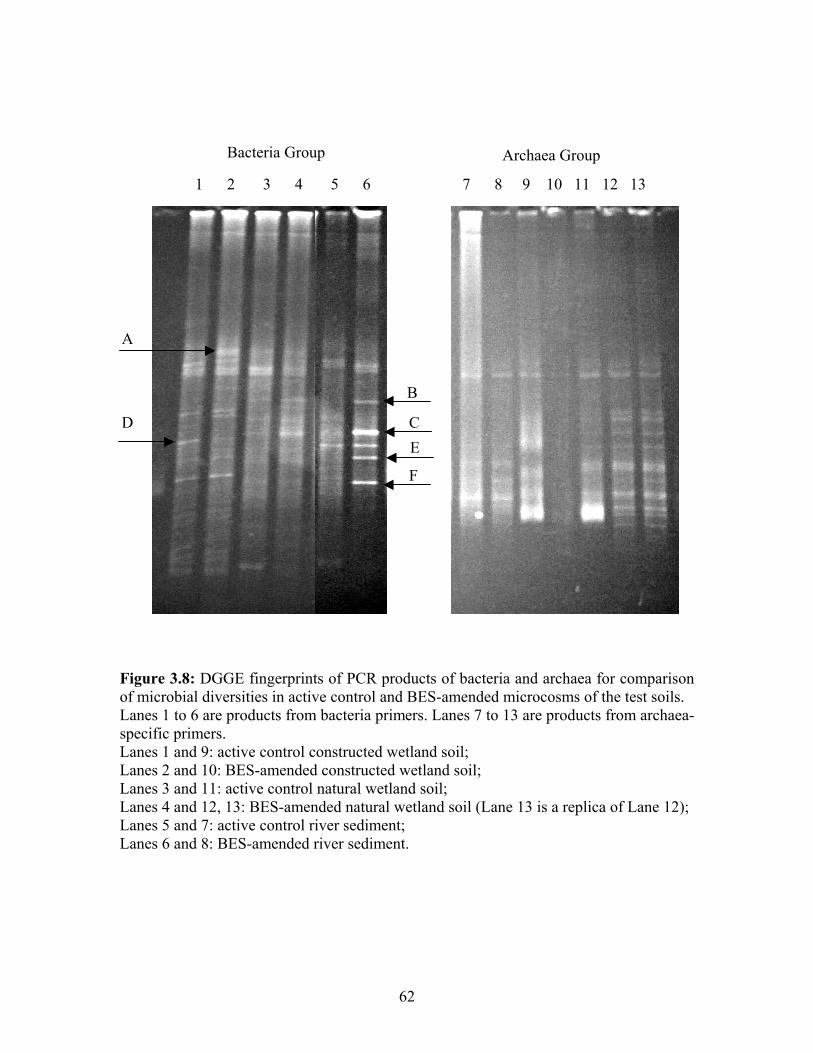
F
EC
B
A
Archaea Group Bacteria Group
1 2 3 4 5 6 7 8 9 10 11 12 13
D
Figure 3.8: DGGE fingerprints of PCR products of bacteria and archaea for comparison of microbial diversities in active control and BES-amended microcosms of the test soils. Lanes 1 to 6 are products from bacteria primers. Lanes 7 to 13 are products from archaea-specific primers. Lanes 1 and 9: active control constructed wetland soil; Lanes 2 and 10: BES-amended constructed wetland soil; Lanes 3 and 11: active control natural wetland soil; Lanes 4 and 12, 13: BES-amended natural wetland soil (Lane 13 is a replica of Lane 12); Lanes 5 and 7: active control river sediment; Lanes 6 and 8: BES-amended river sediment.
62
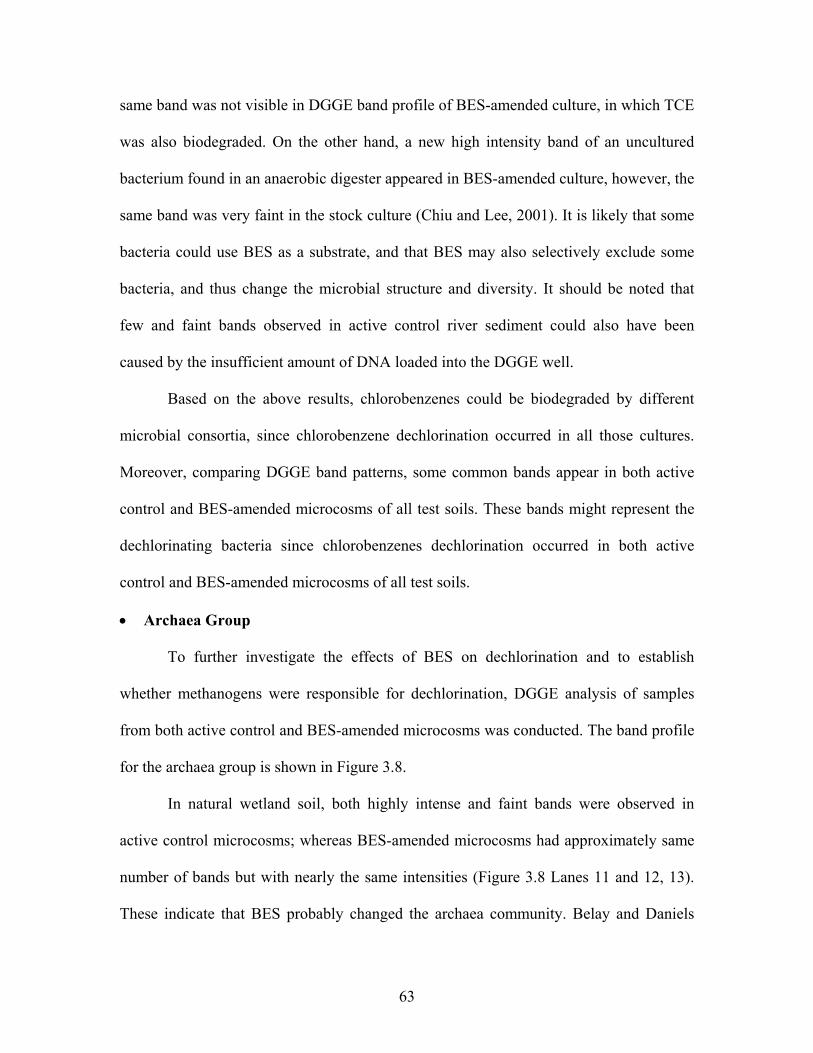
same band was not visible in DGGE band profile of BES-amended culture, in which TCE
was also biodegraded. On the other hand, a new high intensity band of an uncultured
bacterium found in an anaerobic digester appeared in BES-amended culture, however, the
same band was very faint in the stock culture (Chiu and Lee, 2001). It is likely that some
bacteria could use BES as a substrate, and that BES may also selectively exclude some
bacteria, and thus change the microbial structure and diversity. It should be noted that
few and faint bands observed in active control river sediment could also have been
caused by the insufficient amount of DNA loaded into the DGGE well.
Based on the above results, chlorobenzenes could be biodegraded by different
microbial consortia, since chlorobenzene dechlorination occurred in all those cultures.
Moreover, comparing DGGE band patterns, some common bands appear in both active
control and BES-amended microcosms of all test soils. These bands might represent the
dechlorinating bacteria since chlorobenzenes dechlorination occurred in both active
control and BES-amended microcosms of all test soils.
• Archaea Group
To further investigate the effects of BES on dechlorination and to establish
whether methanogens were responsible for dechlorination, DGGE analysis of samples
from both active control and BES-amended microcosms was conducted. The band profile
for the archaea group is shown in Figure 3.8.
In natural wetland soil, both highly intense and faint bands were observed in
active control microcosms; whereas BES-amended microcosms had approximately same
number of bands but with nearly the same intensities (Figure 3.8 Lanes 11 and 12, 13).
These indicate that BES probably changed the archaea community. Belay and Daniels
63
(1987) found that BES could completely inhibit two Methanococcus species, but it partly
inhibited two Methanobacterium strains.
In constructed wetland soil, although intense bands are clearly seen in the active
control microcosms, no visible bands are found in BES-amended microcosms (Figure 3.8
Lanes 9 and 10). However, a trace amount of the archaea DNA was detected by the
Bioanalyzer in the PCR product from BES-amended microcosm of constructed wetland
soil, which resulted in an insufficient amount of DNA for band detection in DGGE. A
trace amount of DNA obtained could be due to the inefficient DNA extraction and
amplification. However, the detection of DNA amplified using bacteria primers suggests
that inefficient DNA extraction may not be the cause. Instead, inefficient DNA
amplification or insufficient loading into the gel could be the reason. Otherwise, this
result suggests that BES significantly inhibited archaea and thus methanogens in
constructed wetland soil. Löffler et al. (1997) also did not detect methanogens by agarose
gel electrophoresis in BES treatment after four serial transfers.
Therefore, BES probably changed the archaea community. The inhibitory effects
of BES appear to depend on the type of archaea including methanogens and the
characteristics of the soils containing these microorganisms.
3.4 Conclusions
1,2,3,4-TeCB was able to be completely biodegraded in all organic matter- and
mineral-dominated soils under anaerobic conditions. The dominant pathway of 1,2,3,4-
TeCB dechlorination was: 1,2,3,4-TeCB 1,2,3-TCB 1,2-DCB + 1,4-DCB + 1,3-
DCB monochlorobenezene + benzene. The results of DGGE analysis showed that
different microbial communities with different microbial compositions and diversities
64
were able to biodegrade 1,2,3,4-TeCB under anaerobic condition. Dechlorination kinetics
of chlorobenzenes depends on other factors besides the organic carbon content.
Based on the results of DGGE analysis, it can be observed that BES probably
changed the compositions of bacteria and archaea consortia. Moreover, from the results
of dechlorination kinetics, hydrogen and methane concentrations, it can be concluded that
methanogens were not directly responsible for dechlorination of chlorobenzenes and that
BES probably inhibited chlorobenzenes dechlorination to a limited extent and that BES is
not an effective complete inhibitor of methanogenesis.
Generally, there was no clear relationship between hydrogen concentrations and
methanogenesis or dechlorination. However, hydrogen concentration trends in some
treatments suggested that hydrogen was probably used as an electron donor during
methanogenesis and for driving dechlorination reactions. Methane started to accumulate
after 1,2,3,4-TeCB and its intermediate daughter products (trichlorobenzenes and
dichlorobenzenes) were completely degraded in most active control microcosms,
indicating that dechlorinators may have out-competed methanogens for electron donors.
Higher dechlorination kinetic constant and shorter lag period can be expected
with multiple inoculations, if soil characteristics and experimental conditions remain
unchanged. Dechlorinating microorganisms could most likely be adapted to
chlorobenzenes. Moreover, complete dechlorination of the parent compound and
intermediate daughter products (trichlorobenzenes and dichlorobenzenes) were observed
in the 3rd Generation cultures of active control microcosms of all test soils. These
observations provide strong evidence for the application of bioremediation (e.g., natural
attenuation or ex-situ bioremediation). In addition, constructed wetland soil was found to
65
be a very promising material for ex-situ bioremediation of chlorinated solvents
contaminated sites using treatment wetland systems. Moreover, natural wetland soil is
capable of intrinsic attenuation of chlorinated benzenes.
66
CHAPTER 4. EFFECTS OF TYPHA LATIFOLIA ROOTS ON DECHLORINATION OF 1,2,3,4-TETRACHLOROBENZENE
4.1 Introduction
Uses of plants and associated rhizosphere microorganisms to remove, transform,
or contain toxic chemicals is known as phytoremediation (Susarla et al., 2002).
Phytoremediation, a relatively new technology, shows great promise as an effective and
inexpensive strategy for in-situ and ex-situ bioremediation (Anderson et al., 1993;
Erickson et al., 1994; Cunningham and Ow, 1996; Wiltse et al., 1998; Susarla et al.,
2002). Biodegradation of many organic pollutants such as polycyclic aromatic
hydrocarbons (PAHs) and TCE has been shown to be enhanced in the presence of plant
roots (Anderson and Walton, 1995; Pardue et al., 1996; Nichols et al., 1997; Banks et al.,
1999; Siciliano et al., 2003).
A recent study conducted by Siciliano et al. (2003) has revealed that the
effectiveness of phytoremediation is plant species dependent. In that study, it was
observed that Tall Fescue enhanced the degradation of naphthalene; whereas Rose Clover
depressed it (Siciliano et al., 2003). Wiltse et al. (1998) also found variability in
degradation of crude oil among genotypes of Alfalfa. Based on these findings, it is,
therefore, important to select appropriate types of plants for bioremediation of chlorinated
benzenes contaminated sites.
Phytoremediation of contaminated sites involves a number of mechanisms
including phytoaccumulation/phytoextraction, phytopumping, phytostabilization and
rhizodegradation (Pardue et al., 1996; Susarla et al., 2002; Siciliano et al., 2003). Schnoor
et al. (1995) reported that hydrophobic chemicals (Log Kow > 3.0) are bounded to the
67
surface of roots so strongly that they can not be translocated within the plant. Since
chlorobenzenes (i.e., tetrachlorobenzenes, trichlorobenzenes and dichlorobenzenes) have
low water solubilities (Log Kow > 3.0) (EPA, 1966; Site, 2001), plant uptake of
chlorinated benzenes from contaminated soils through phytopumping or
phytoaccumulation/phytoextraction is limited. In addition, there is little data available on
plant-induced sequestration (phytostabilization) of organic contaminants in soils
(Siciliano et al., 2003). Therefore, the most important mechanism involved for
enhancement of chlorobenzenes biodegradation is probably rhizodegradation, a
biological treatment by enhanced microbial activity in the rhizosphere.
The rhizosphere, the area around plant roots, has generally greater microbial
activities as a result of energy and carbon sources provided by rhizodeposition (Pardue et
al., 1996; Haby and Crowley, 1996). A significant part of organic matter released from
living roots comprises water-insoluble materials such as freed cap cells and lysates, and
water-soluble exudates such as organic acids and sugars, and other root secretions such as
enzymes (Whipps, 1990; Anderson et al., 1993; Brimecombe, et al., 2001). These
materials can not only serve as substrates to nearby microorganisms, but they will also
induce changes in the physicochemical characteristics of the surrounding soil, and thus,
change the microbial diversity (Marilley et al., 1998; Brimecombe, et al., 2001). The
rhizosphere has been reported to contain higher populations and greater diversities of
microbial consortia (Anderson et al., 1993; Nichols et al., 1997; Siciliano et al., 2003),
which may increase biodegradation activities. Moreover, some organic acids, as
components of root exudates, could serve as electron donors for dechlorination (Holliger
68
et al., 1992; Middeldorp et al., 1997), which may also contribute to the enhanced
biodegradation in the rhizosphere.
Few, if any study has been undertaken on the effects of wetland plants on
biodegradation of chlorinated benzenes. Typha latifolia L. is a native wetland plant that
can grow prolifically from thick underground rhizomes. Therefore, the present study was
conducted to investigate the effects of Typha roots on dechlorination of 1,2,3,4-TeCB,
organic acids production and microbial population diversities in soil. Anaerobic
microcosm studies on dechlorination of 1,2,3,4-TeCB in river sediment amended with
different amounts of Typha roots were conducted. The objectives of the study were (i) to
determine the effects of Typha roots on dechlorination kinetics and pathways; (ii) to
investigate the effects of Typha roots on the diversities of microbial consortia in soil; and
(iii) to correlate the amount of roots with hydrogen, methane and organic acids
concentrations. The results of the present study may be useful in assessing the feasibility
of using Typha for in-situ and ex-situ bioremediation of sites contaminated with
chlorobenzenes.
4.2 Materials and Methods
4.2.1 Chemicals
Neat 1,2,3,4-TeCB from Supelco (Bellefonte, PA) was used as the test chemical
in this study. 1,2,3-TCB, 1,2,4-TCB, 1,3,5-TCB, 1,2-DCB, 1,3-DCB and 1,4-DCB used
for calibration were analytical grade from Sigma-Aldrich. Standards for benzene and
monochlorobenzene, internal standards and surrogates for EPA Method 8260 were
procured from Supelco. Methane used for calibration was also obtained from Supelco
69
Inc. (Supelco, Bellefonte, PA). Hydrogen standards were obtained from BOC Group Inc.
(Baton Rouge, LA). HPLC grade hexane and methanol were used as solvents.
4.2.2 Soil Collection and Root Preparation
River sediment was obtained from Bayou Duplantier, Baton Rouge, Louisiana.
Live Typha plants were collected from a freshwater wetland in Madisonville, Louisiana,
and then transplanted in greenhouse for about one month. Live roots of Typha were
washed several times with tap water followed by deionized water. Fresh roots were
finally cut by sterile razor and immediately used for preparing microcosms.
4.2.3 Microcosm Experiment
Anaerobic microcosms were set up in a glove bag (I2R, Cheltenham, PA) under
nitrogen atmosphere. Homogenized river sediment and different amounts of roots were
packed in 160 mL serum bottles leaving 80 mL headspace. River sediment was mixed
with 1, 2 and 5g of roots for a total of 43 g in each serum bottle. One set of microcosm
was prepared without roots as a control. Therefore, the experiment involved the following
four treatments as tabulated in Table 4.1. All treatments were prepared in triplicate.
Table 4.1: List of treatments based on the amounts of Typha roots.
Treatments Mass of roots, g
Mass of sediment, g
Ratio of roots to sediment, R/S (g/g), %
No roots (RCNR) 0 43 0
Small amount of roots (RCSR) 1 42 2.4
Medium amount of roots (RCMR) 2 41 4.9
Large amount of roots (RCLR) 5 38 13.2
A volumetric ratio of water to sediment of 1.5: 1 was used (Lorah et al., 1997).
Microcosms were prepared using deionized water. All bottles were sealed with Teflon-
70
lined rubber septa and aluminum crimp seals and incubated under static and dark
conditions at 25 °C. Microcosms were neither amended with electron donors nor
nutritional supplements to support microbial growth.
1,2,3,4-TeCB was dissolved in methanol (Pavlostathis and Prytula, 2000) and
then spiked into microcosms to a final concentration of about 150 mg/kg dry weight of
soil. A relatively small volume of methanol of between 0.5 mL and 1 mL (in a total of
140 mL slurry) was used for spiking the test chemical in order to limit the effects of
methanol on dechlorination. To minimize the amount of methanol, the bottles were
purged with nitrogen at 1 atm using a syringe needle for about 1 min and immediately
sealed inside the glove bag. Two identical sets of microcosms were set up for each
treatment. One set was used for gas analysis and the other set was used for
chlorobenzenes analysis and molecular analysis.
Concentrations of the parent compound and degradation daughter products were
monitored until the concentration of the parent compound had dropped below the
detection limit of the analytical methods (5 ng/µL in the hexane extract). Slurry sampling
for analysis of chlorobenzenes was done inside the glove bag (I2R, Cheltenham, PA) in
order to maintain anaerobic conditions in the microcosms. Four mL of soil slurry was
withdrawn from microcosms after shaking the bottle to homogenize the contents, the
bottle was flushed with nitrogen at 1 atm for about 1 min and resealed. The soil slurry
was then transferred into Teflon centrifuge tube to minimize the adsorption of chlorinated
benzenes. An equal volume of hexane (i.e., 4 mL) was immediately added into the Teflon
centrifuge tubes (Holliger et al., 1992; Chang et al., 1997; Chen et al., 2002). The mixture
of slurry and hexane was then tumbled for 24 hours to facilitate the extraction of
71
chlorobenzenes. The suspension was centrifuged at 3,000 rpm for about 15 minutes at
room temperature and 1 mL of supernatant was transferred into an amber GC-MS vial for
analysis of semivolatile chlorobenzenes (i.e., tetrachlorobenzenes, trichlorobenzenes and
dichlorobenzenes).
Aqueous samples for analysis of benzene and chlorobenzenes were directly
withdrawn from microcosms using a gas tight syringe and transferred into autosampler
vials. Aqueous samples for analysis of organic acids were withdrawn from the serum
bottles using a sterile syringe, filtered through a 0.2 µm syringe filter, and finally
preserved with 8 N phosphoric acid (5 µL per 1 mL sample) in autosampler vials (Pardue,
et al., 2001). Gas samples for analysis of methane and hydrogen were analyzed without
storage.
4.2.4 Analytical Procedures
The hexane extract was analyzed following EPA Method 8270 for the
measurement of semivolatile chlorinated benzenes (i.e., tetrachlorobenzenes,
trichlorobenzenes and dichlorobenzenes). Ten µL of semivolatile internal standards mix
(2000 µg/mL in methylene chloride, containing 1,4-dichlorobenzene-d4, naphthalene-d8,
acenaphthalene-d10, phenanthrene-d10, chrysene-d12, and perylene-d12) (Supelco Chemical
Co.) was injected into 1 mL hexane extract. The sample was then analyzed by GC-MS
(Agilent 6890 series gas chromatograph-5972A mass selective detector). The GC was
equipped with a capillary column (DB-5, 30 m × 0.25 mm i.d., 0.25 µm film thickness)
which was directly interfaced to the mass spectrometer. High pure helium was used as a
carrier gas at a flow rate of 1.8 mL/min. The injector temperature was 250 °C. The GC
column was initially held at 37 °C for 2 min, then ramped to 260 °C at 8 °C/min, and
72
finally ramped to 300 °C at 40 °C /min and held for 10 min. The detector temperature
was maintained at 280 °C.
Analysis of benzene and chlorobenzene were performed by EPA Method 8260B
using a purge and trap apparatus attached to a Agilent 6890 Series Gas Chromatograph
equipped with a 5972A mass selective detector. A thermal desorption trap (VOCARB
3000; Supelco, Bellefonte, PA) was employed in the purge and trap apparatus. The
hexane extract along with 10 µL internal standard and 2.5 µL surrogate (Supelco,
Bellefonte, PA) was manually injected into the purge and trap autosampler (Tekmar
2016) (Tekmar Dohrmann, Mason, OH), and purged for 11 min with ultra-high-pure
helium at a flow rate of 35 mL/min, then desorbed for 0.5 min and baked for 13 min at
225 °C. The samples were then introduced onto the GC equipped with a 60 m × 0.32 mm
× 3.00 µm film thickness, Agilent 5MS (Palo Alto, CA) capillary column (Palo Alto,
CA). High purity helium gas was used as a carrier at a flow rate of 2.1 mL/min. The GC
column temperature program was 35 °C for 5 min, and ramped at 4 °C/min to a final
temperature of 200 °C. The temperatures of injector and detector were 250 °C and 280
°C, respectively.
Prior to sample analysis, six-point calibration curves were established for both
methods to determine the relative response factors for the individual compound. Tune,
daily blank and calibration check were conducted to assure that the machine and the
analytical methods were in control.
Organic acids were analyzed by High Performance Liquid Chromatograph
(HPLC) (Dionex LC-20, Dionex Corp., Sunnyvale, CA). Methane was measured by GC-
FID. One mL of gas was withdrawn from the headspace of the bottle using a gas tight
73
syringe, and then injected into GC-FID (Agilent 5890 series II) equipped with a 2.4 m ×
0.32 mm i. d. column packed with Carbopack b/l % SP-1000 (Supelco, Bellefonte, PA).
The injector and detector temperatures were 375 °C and 325 °C, respectively. The
column temperature was held constant at 50 °C for 6.50 min. Ultra high pure nitrogen
(BOC Gases, Baton Rouge, LA) was used as a carrier gas at a flow rate of 12 mL/min.
All methane data are reported as aqueous concentrations in µM (µmol/L). Headspace
methane concentrations were converted to aqueous phase concentrations using Henry’s
Law (Henry’s constant for methane at 25 °C is 0.6364 atm/mol/m3).
Hydrogen was analyzed using a reduction gas analyzer (Trace Analytical, Menlo
Park, CA) equipped with a reduction gas detector. Gas samples taken from the headspace
were manually injected into a 1-mL gas sampling loop, and then separated with a
molecular sieve analytical column (Trace Analytical, Menlo Park, CA) at an oven
temperature of 40 °C. Ultra high pure nitrogen (BOC Gases, Baton Rouge, LA) was used
as a carrier gas. The detection limit under these conditions was 1 ppb. All hydrogen data
are reported as aqueous concentration.
Aqueous concentration of H2 was calculated following the equation adopted from
Löffler et al. (1999):
[ ] RTLPH aq =.,2
where H2,aq. is the aqueous concentration of H2 (moles/L);
L is the Ostwald coefficient for H2 solubility (0.01913 at 25 °C);
P is the partial pressure of H2 (atm);
R is the universal gas constant (0.0821 liter·atm·K-1·mol-1);
and T is the temperature (K).
74
P = C/106
where C is the gas phase concentration of H2 (ppm);
4.2.5 Molecular Analysis
• DNA Extraction
At the end of incubation period, slurry samples were taken from RCLR and
RCNR microcosms after shaking the bottles for homogenization, and then immediately
stored in sterile cryogenic vials at -20 °C prior to DNA extraction. An appropriate
amount of slurry was extracted following the protocol of Mo Bio Ultraclean Soil DNA
Isolation Kit (Mo Bio Laboratories, Inc., Salona Beach, CA) with some modifications.
Because of the large amount of humic acids in the soil samples which can inhibit PCR
amplification, samples were treated with polyvinylpolypyrrolidone (PVPP) (Agros
Organics, Geel, Belgium) (about 0.1 g per 1 g of sample) as a humic acid-binding agent
prior to extraction (Holben, et al., 1988). In order to further remove traces of humic acids,
two additional washes using S4 solution (a component of Ultraclean Soil DNA Isolation
Kit) were performed. Another modification of the kit protocol was that a Biospec Mini-
Beadbeater 3110BX (Biospec products Inc., Bartlesville, OK) was utilized for cell
disruption instead of Mo Bio Vortex Adapter (Mo Bio Laboratories, Inc.). The
beadbeater was operated at 4,800 rpm for 3.0 min. Extracted DNA was stored at –20 °C
until further analysis.
• PCR Amplification
Extracted DNA was amplified by Polymerase Chain Reaction (PCR) using an
Eppendorf MasterTaq Kit (Brinkmann Instruments, Inc., Westbury, NY). The Eppendorf
MasterTaq Kit includes Taq DNA Polymerase (5 U/ µL), 10 × Taq Buffer with Mg2+, and
75
5 × TaqMaster PCR Enhancer. The 5 × TaqMaster PCR Enhancer often required heating
at 60 °C to dissolve the components completely. The master mix was made of 63.5 µL 18
Mega Ohm water, 15 µL of 5 × TaqMaster PCR Enhancer, 10 µL of 10 × Taq Buffer
with Mg+, 8 µL of the 10 mM dNTP mix (Applied Biosystems, Forster City, CA), 0.5 µL
of the Taq DNA polymerase and 1 µL of each primer (forward and reverse) per sample.
For each sample to be amplified, 99 µL of the master mix was placed in a 500-µL sterile
PCR reaction tube, and then 1 µL of the extracted DNA was added. This mixture was
vortexed and then centrifuged for 1 min at 13,000 rpm. PCR amplification was finally
performed by an Eppendorf Thermocycler (Eppendorf GmbH, Hamburg, Germany).
Two different types of primers were applied. One was 341f (5’-
CCTACGGGAGGCAGCAG-3’) and 907r (5’-CCGTCAATTCMTTTRAGTTT-3’)
(Casamayor et al., 2000) for the bacteria group; the other set of primers for the archaea
group (i.e., methanogens) was archaeon-specific primers 340f (5’-
CCTACGGGGCGCASCAGGSGC-3’) and 915r (5’-GTGCTCCCCCGCCAATTCCT-
3’) (Löffler et al., 1997). An additional 40-nucleotide GC-rich sequence (GC-clamp)
attached to the 5’ end of both forward primers was:
CGCCCGCCGCGCCCCGCGCCCGTCCCGCCGCCCCCGCCCG (Muyzer et al.,
1995). All these primers were obtained from Alpha DNA (Quebec, CA). For the bacteria
group, PCR conditions were (Hendrickson et al., 2002): denaturation, 95 °C (2 min); 40
cycles of 94 °C (1 min), 55 °C (1 min), 72 °C (1 min) and finally cooling at 4 °C. For the
archaea group, the PCR conditions (Löffler et al., 1997) were: denaturation, 94 °C (2 min
10 s); 30 cycles of 94 °C (30 s), 60 °C (45 s), 72 °C (2 min 10 s); final elongation, 72 °C
(6 min). PCR products were immediately analyzed or stored at 0 – 4 °C until analysis.
76
• Detection of PCR Products
PCR products were analyzed by the Agilent 2100 Bioanalyzer and corresponding
DNA Labchip Kits (Agilent Technology, Willington, DE) to obtain the concentration of
DNA and to determine whether the DNA extraction and PCR amplification were
successful. One µL of PCR product was used for analysis following the manufacturer’s
instruction.
• Denaturing Gradient Gel Electrophoresis (DGGE)
DGGE was performed using a D-CodeTM Universal Mutation Detection System
(Bio-Rad, Hercules, CA) as described by Myers et al. (1987) with the following
modifications. The 24 mL denaturing gradient gel (6% (wt/vol) acrylamide solution) was
covered by a 5 mL acrylamide stacking gel without denaturant. Polymerization was
catalyzed with addition of 0.0381% of TEMED (vol/vol) and 0.914% of the 10%
ammonium persulfate (vol/vol) to both denaturant solutions. 0.85% of the 10%
ammonium persulfate (vol/vol) and 0.057% of TEMED was added to the 0% stacking gel
solution. Gels were cast using a BioRad Model 475 Gradient Delivery System. Samples
containing approximately equal amounts of PCR amplicons (with loading dye) were
loaded into individual gel lanes. The polyacrylamide gels were made with a denaturing
gradient ranging from 30% to 80% and from 40% to 70% for bacteria group and archaea
group, respectively (100% denaturant contained 42% (wt/vol) urea and 40% (vol/vol)
formamide (Bio-Rad, Hercules, CA)). Electrophoresis was performed in 1× TAE buffer
at 60 °C for 15 hours at 65 V. Following electrophoresis, the gel was stained with
ethidium bromide for 10 min. The gel was then destained using 1x TAE buffer for 12
77
min. Finally, the gel was visualized with a UV transilluminator, photographed and
digitized using an Alpha DigiDoc system (Alpha Innotech Co., San Leandro, CA).
4.2.6 Data Analysis
• Kinetic Data Modeling
First-order reaction rate constant was calculated from the first-order kinetic
equation as shown below by optimization of degradation kinetic data using non-linear
regression techniques. When the amount of daughter products detected at the ith
sampling point was at least 5% of the parent compound after adjustment at the (i-1)th
sampling point, the onset of dechlorination was assumed and the lag period was
considered to be the time between the ith and the (i-1)th sampling points.
eCC ktot
−=
where t is the time (day);
Ct is the concentration at any time t (mM/kg dry soil);
Co is the initial concentration (mM/kg dry soil);
and k is the pseudo first-order reaction rate constant (day-1).
The characteristic half-life period (2
1t ) was calculated from the first-order
reaction rate constant (k) using the following equation:
kkt 693.0)2(ln
21 =−=
where 2
1t is the half-life time (days);
k is the pseudo first-order reaction rate constant (day-1).
78
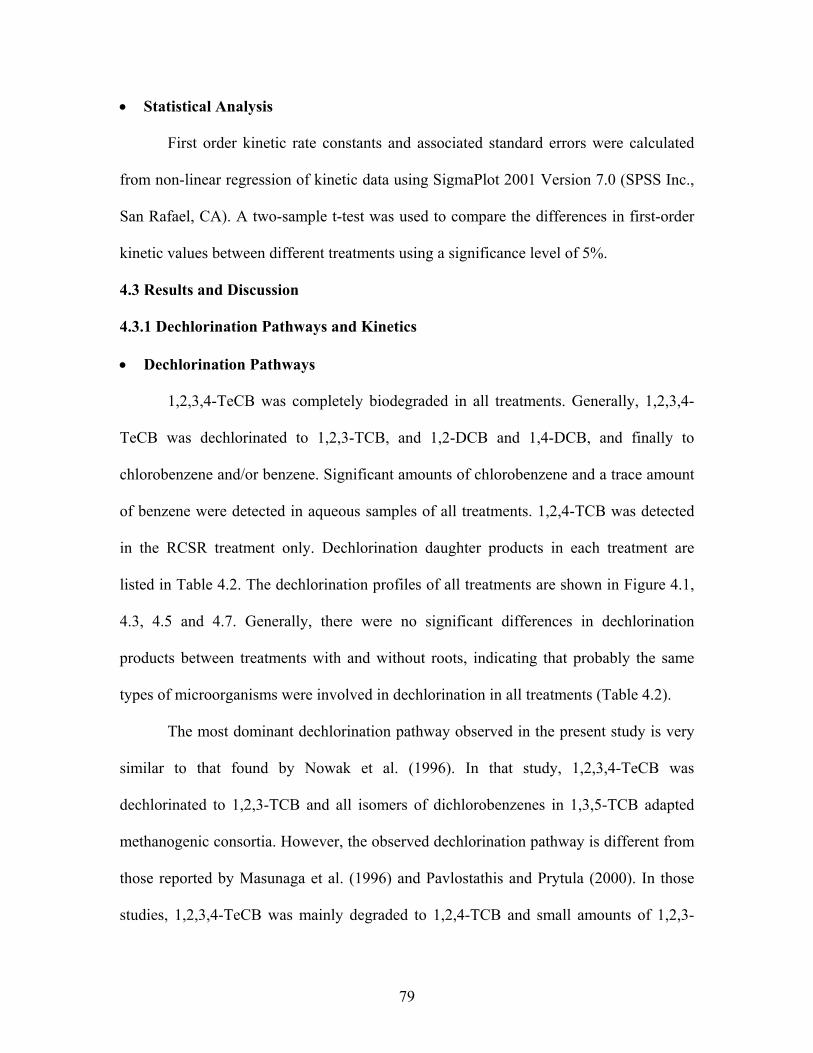
• Statistical Analysis
First order kinetic rate constants and associated standard errors were calculated
from non-linear regression of kinetic data using SigmaPlot 2001 Version 7.0 (SPSS Inc.,
San Rafael, CA). A two-sample t-test was used to compare the differences in first-order
kinetic values between different treatments using a significance level of 5%.
4.3 Results and Discussion
4.3.1 Dechlorination Pathways and Kinetics
• Dechlorination Pathways
1,2,3,4-TeCB was completely biodegraded in all treatments. Generally, 1,2,3,4-
TeCB was dechlorinated to 1,2,3-TCB, and 1,2-DCB and 1,4-DCB, and finally to
chlorobenzene and/or benzene. Significant amounts of chlorobenzene and a trace amount
of benzene were detected in aqueous samples of all treatments. 1,2,4-TCB was detected
in the RCSR treatment only. Dechlorination daughter products in each treatment are
listed in Table 4.2. The dechlorination profiles of all treatments are shown in Figure 4.1,
4.3, 4.5 and 4.7. Generally, there were no significant differences in dechlorination
products between treatments with and without roots, indicating that probably the same
types of microorganisms were involved in dechlorination in all treatments (Table 4.2).
The most dominant dechlorination pathway observed in the present study is very
similar to that found by Nowak et al. (1996). In that study, 1,2,3,4-TeCB was
dechlorinated to 1,2,3-TCB and all isomers of dichlorobenzenes in 1,3,5-TCB adapted
methanogenic consortia. However, the observed dechlorination pathway is different from
those reported by Masunaga et al. (1996) and Pavlostathis and Prytula (2000). In those
studies, 1,2,3,4-TeCB was mainly degraded to 1,2,4-TCB and small amounts of 1,2,3-
79
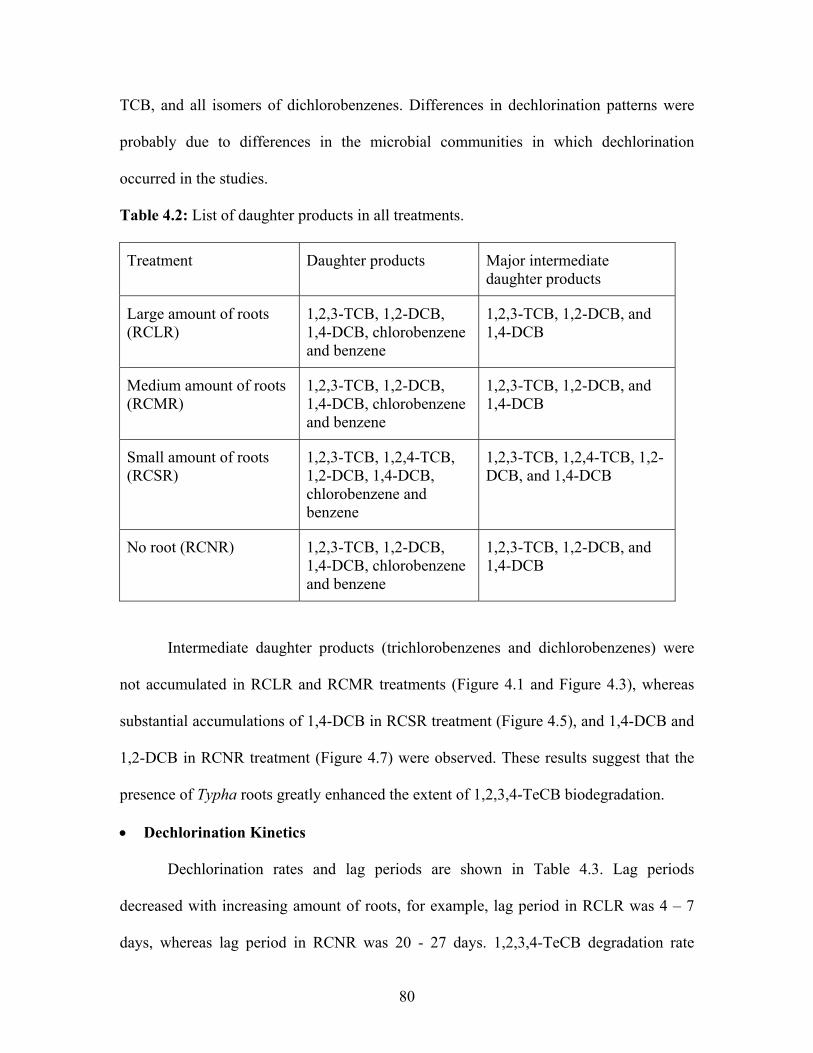
TCB, and all isomers of dichlorobenzenes. Differences in dechlorination patterns were
probably due to differences in the microbial communities in which dechlorination
occurred in the studies.
Table 4.2: List of daughter products in all treatments.
Treatment Daughter products Major intermediate daughter products
Large amount of roots (RCLR)
1,2,3-TCB, 1,2-DCB, 1,4-DCB, chlorobenzene and benzene
1,2,3-TCB, 1,2-DCB, and 1,4-DCB
Medium amount of roots (RCMR)
1,2,3-TCB, 1,2-DCB, 1,4-DCB, chlorobenzene and benzene
1,2,3-TCB, 1,2-DCB, and 1,4-DCB
Small amount of roots (RCSR)
1,2,3-TCB, 1,2,4-TCB, 1,2-DCB, 1,4-DCB, chlorobenzene and benzene
1,2,3-TCB, 1,2,4-TCB, 1,2-DCB, and 1,4-DCB
No root (RCNR) 1,2,3-TCB, 1,2-DCB, 1,4-DCB, chlorobenzene and benzene
1,2,3-TCB, 1,2-DCB, and 1,4-DCB
Intermediate daughter products (trichlorobenzenes and dichlorobenzenes) were
not accumulated in RCLR and RCMR treatments (Figure 4.1 and Figure 4.3), whereas
substantial accumulations of 1,4-DCB in RCSR treatment (Figure 4.5), and 1,4-DCB and
1,2-DCB in RCNR treatment (Figure 4.7) were observed. These results suggest that the
presence of Typha roots greatly enhanced the extent of 1,2,3,4-TeCB biodegradation.
• Dechlorination Kinetics
Dechlorination rates and lag periods are shown in Table 4.3. Lag periods
decreased with increasing amount of roots, for example, lag period in RCLR was 4 – 7
days, whereas lag period in RCNR was 20 - 27 days. 1,2,3,4-TeCB degradation rate
80
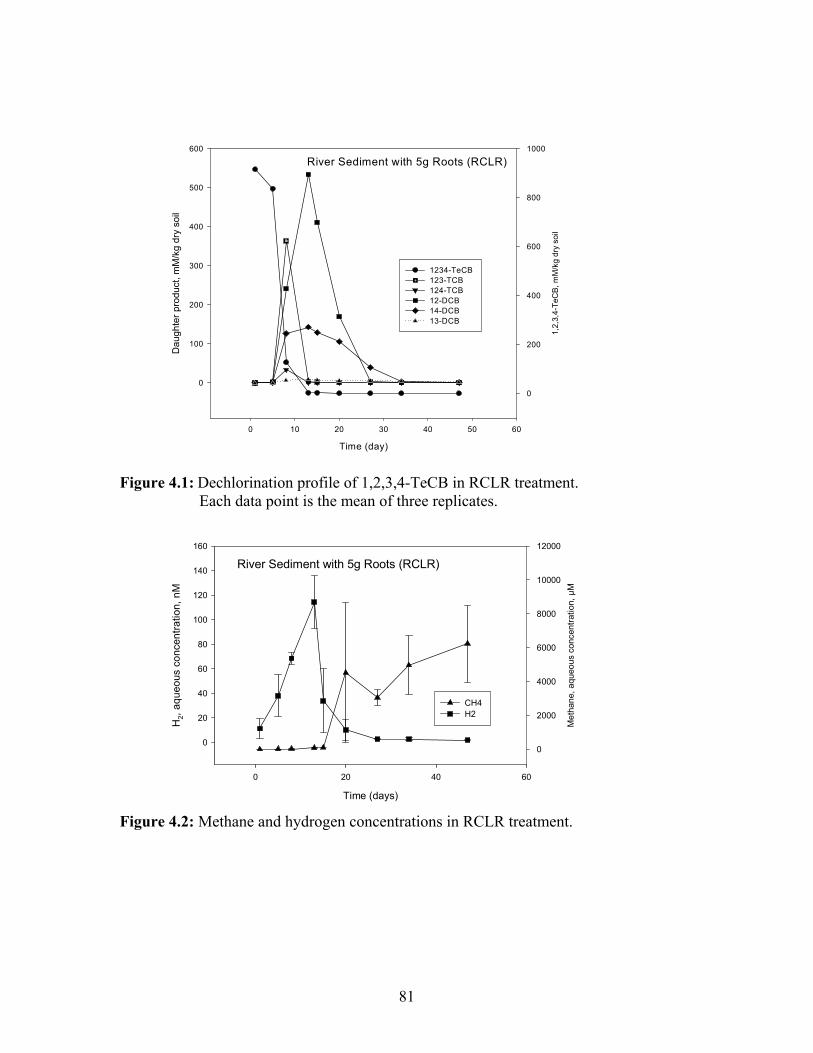
River Sediment with 5g Roots (RCLR)
Time (day)
0 10 20 30 40 50 60
1,2,
3,4-
TeC
B, m
M/k
g dr
y so
il
0
200
400
600
800
1000
Dau
ghte
r pro
duct
, mM
/kg
dry
soil
0
100
200
300
400
500
600
1234-TeCB 123-TCB 124-TCB 12-DCB 14-DCB 13-DCB
Figure 4.1: Dechlorination profile of 1,2,3,4-TeCB in RCLR treatment. Each data point is the mean of three replicates.
River Sediment with 5g Roots (RCLR)
Time (days)
0 20 40 60
Met
hane
, aqu
eous
con
cent
ratio
n, µ
M
0
2000
4000
6000
8000
10000
12000
H2,
aque
ous
conc
entra
tion,
nM
0
20
40
60
80
100
120
140
160
CH4 H2
Figure 4.2: Methane and hydrogen concentrations in RCLR treatment.
81
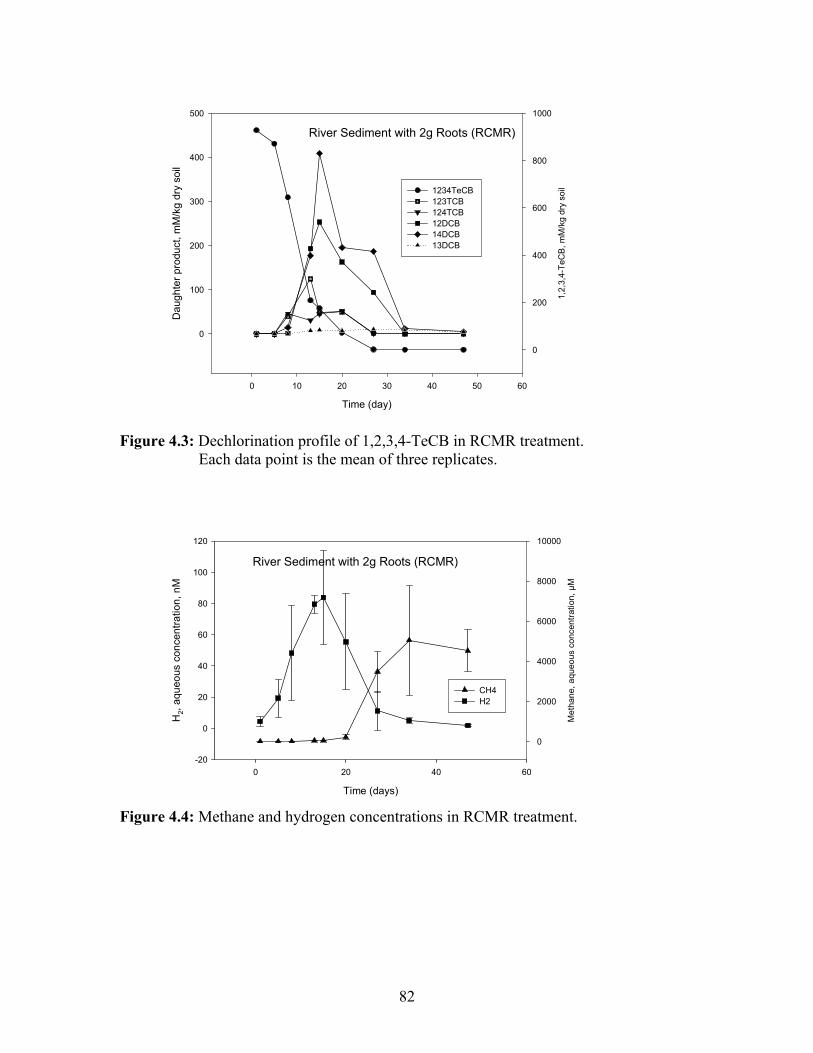
River Sediment with 2g Roots (RCMR)
Time (day)
0 10 20 30 40 50 60
1,2,
3,4-
TeC
B, m
M/k
g dr
y so
il
0
200
400
600
800
1000
Dau
ghte
r pro
duct
, mM
/kg
dry
soil
0
100
200
300
400
500
1234TeCB 123TCB 124TCB 12DCB 14DCB 13DCB
Figure 4.3: Dechlorination profile of 1,2,3,4-TeCB in RCMR treatment. Each data point is the mean of three replicates.
River Sediment with 2g Roots (RCMR)
Time (days)
0 20 40 60
Met
hane
, aqu
eous
con
cent
ratio
n, µ
M
0
2000
4000
6000
8000
10000
H2,
aque
ous
conc
entra
tion,
nM
-20
0
20
40
60
80
100
120
CH4 H2
Figure 4.4: Methane and hydrogen concentrations in RCMR treatment.
82
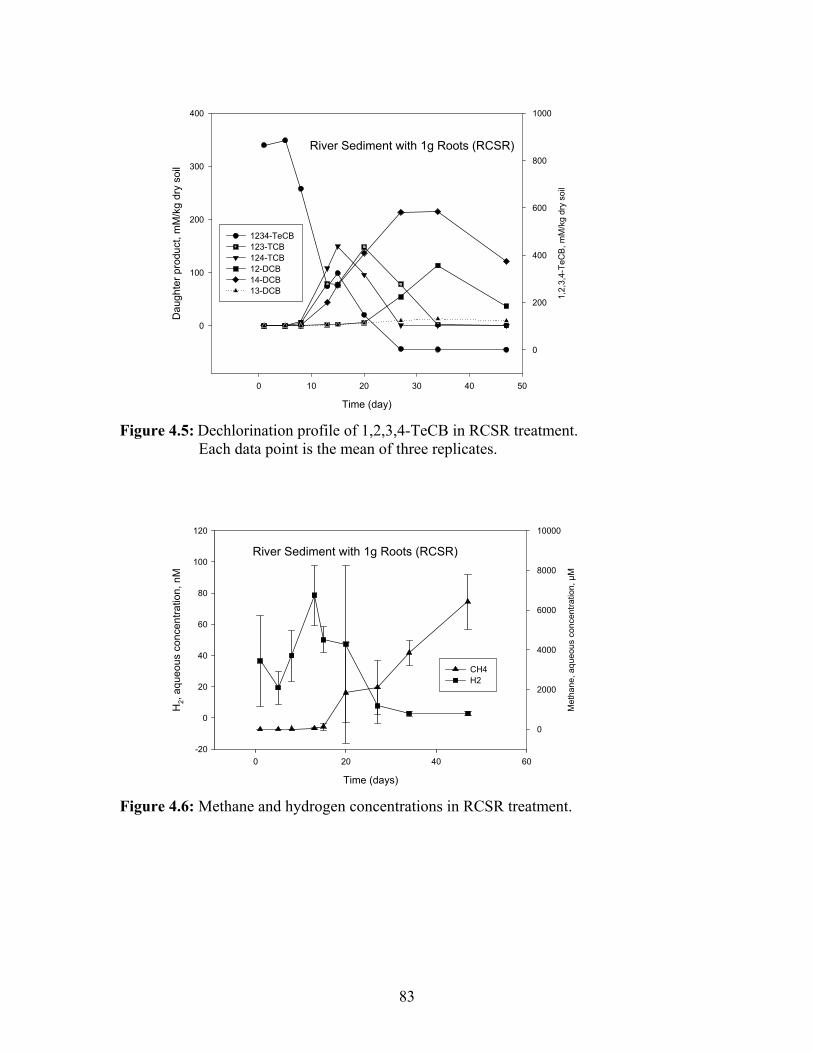
River Sediment with 1g Roots (RCSR)
Time (day)
0 10 20 30 40 50
1,2,
3,4-
TeC
B, m
M/k
g dr
y so
il
0
200
400
600
800
1000
Dau
ghte
r pro
duct
, mM
/kg
dry
soil
0
100
200
300
400
1234-TeCB 123-TCB 124-TCB 12-DCB 14-DCB 13-DCB
Figure 4.5: Dechlorination profile of 1,2,3,4-TeCB in RCSR treatment.
Each data point is the mean of three replicates.
River Sediment with 1g Roots (RCSR)
Time (days)
0 20 40 60
Met
hane
, aqu
eous
con
cent
ratio
n, µ
M
0
2000
4000
6000
8000
10000
H2,
aque
ous
conc
entra
tion,
nM
-20
0
20
40
60
80
100
120
CH4 H2
Figure 4.6: Methane and hydrogen concentrations in RCSR treatment.
83
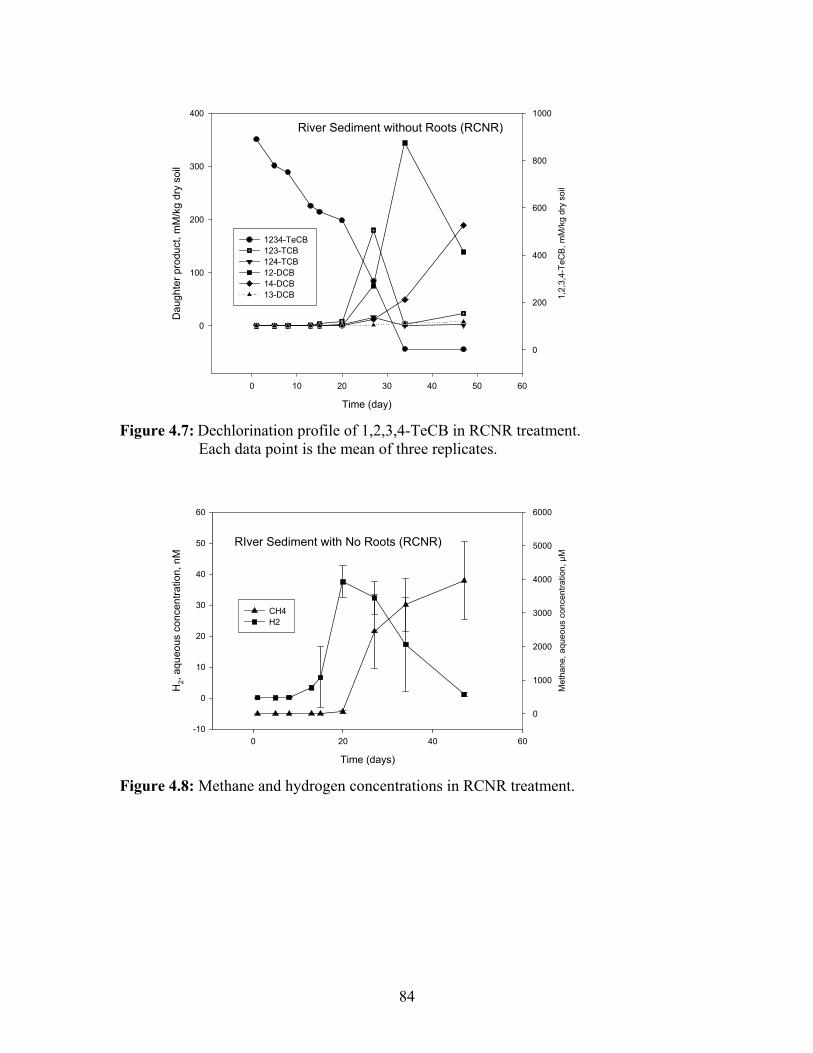
River Sediment without Roots (RCNR)
Time (day)
0 10 20 30 40 50 60
1,2,
3,4-
TeC
B, m
M/k
g dr
y so
il
0
200
400
600
800
1000
Dau
ghte
r pro
duct
, mM
/kg
dry
soil
0
100
200
300
400
1234-TeCB 123-TCB 124-TCB 12-DCB 14-DCB 13-DCB
Figure 4.7: Dechlorination profile of 1,2,3,4-TeCB in RCNR treatment.
Each data point is the mean of three replicates.
RIver Sediment with No Roots (RCNR)
Time (days)
0 20 40 60
Met
hane
, aqu
eous
con
cent
ratio
n, µ
M
0
1000
2000
3000
4000
5000
6000
H2,
aque
ous
conc
entra
tion,
nM
-10
0
10
20
30
40
50
60
CH4 H2
Figure 4.8: Methane and hydrogen concentrations in RCNR treatment.
84
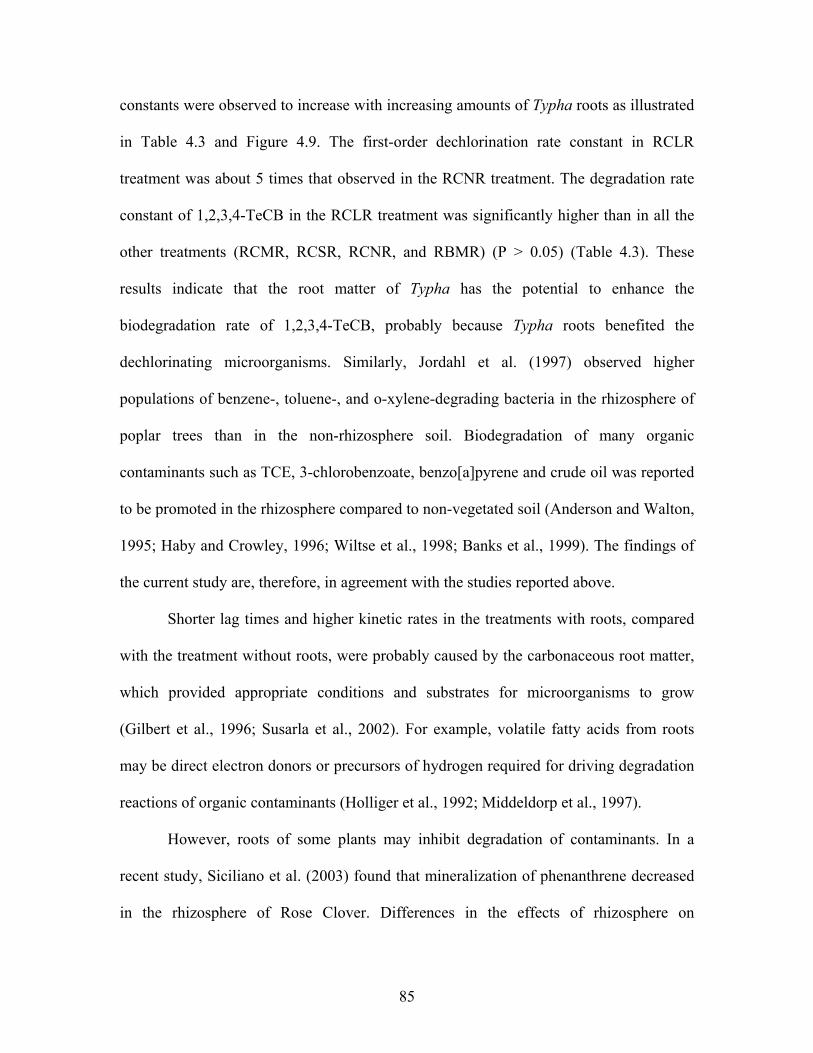
constants were observed to increase with increasing amounts of Typha roots as illustrated
in Table 4.3 and Figure 4.9. The first-order dechlorination rate constant in RCLR
treatment was about 5 times that observed in the RCNR treatment. The degradation rate
constant of 1,2,3,4-TeCB in the RCLR treatment was significantly higher than in all the
other treatments (RCMR, RCSR, RCNR, and RBMR) (P > 0.05) (Table 4.3). These
results indicate that the root matter of Typha has the potential to enhance the
biodegradation rate of 1,2,3,4-TeCB, probably because Typha roots benefited the
dechlorinating microorganisms. Similarly, Jordahl et al. (1997) observed higher
populations of benzene-, toluene-, and o-xylene-degrading bacteria in the rhizosphere of
poplar trees than in the non-rhizosphere soil. Biodegradation of many organic
contaminants such as TCE, 3-chlorobenzoate, benzo[a]pyrene and crude oil was reported
to be promoted in the rhizosphere compared to non-vegetated soil (Anderson and Walton,
1995; Haby and Crowley, 1996; Wiltse et al., 1998; Banks et al., 1999). The findings of
the current study are, therefore, in agreement with the studies reported above.
Shorter lag times and higher kinetic rates in the treatments with roots, compared
with the treatment without roots, were probably caused by the carbonaceous root matter,
which provided appropriate conditions and substrates for microorganisms to grow
(Gilbert et al., 1996; Susarla et al., 2002). For example, volatile fatty acids from roots
may be direct electron donors or precursors of hydrogen required for driving degradation
reactions of organic contaminants (Holliger et al., 1992; Middeldorp et al., 1997).
However, roots of some plants may inhibit degradation of contaminants. In a
recent study, Siciliano et al. (2003) found that mineralization of phenanthrene decreased
in the rhizosphere of Rose Clover. Differences in the effects of rhizosphere on
85
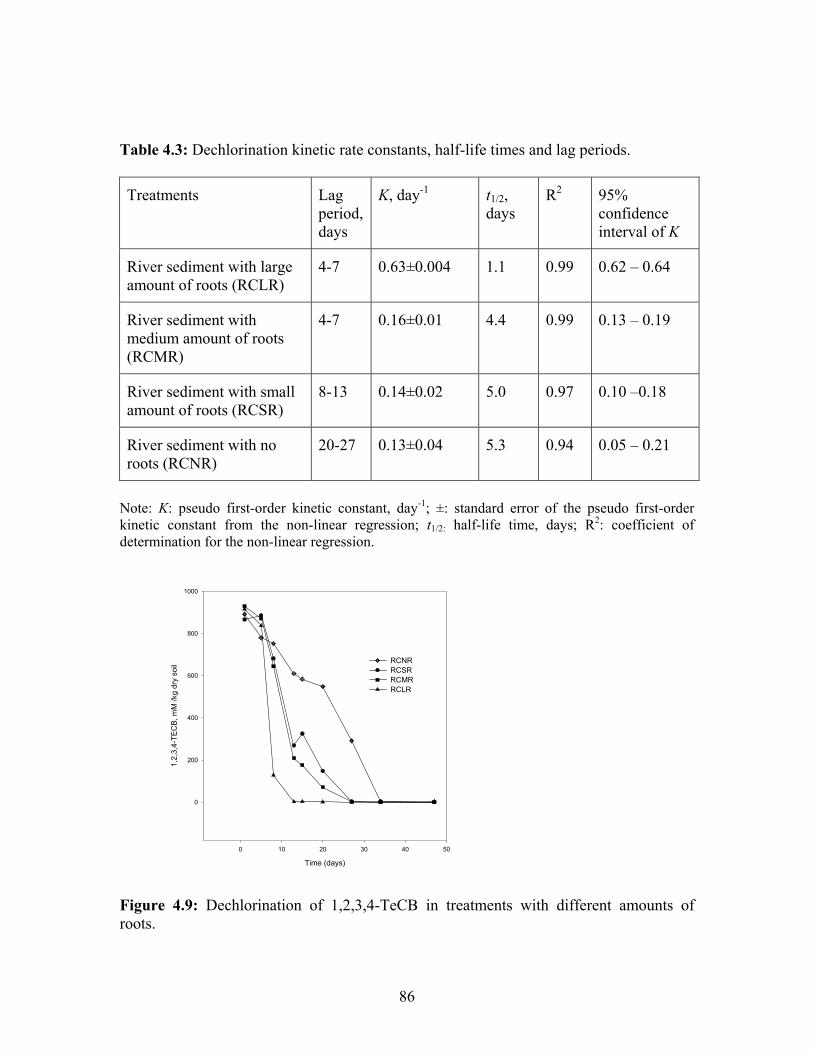
Table 4.3: Dechlorination kinetic rate constants, half-life times and lag periods.
Treatments Lag period, days
K, day-1 t1/2, days
R2 95% confidence interval of K
River sediment with large amount of roots (RCLR)
4-7 0.63±0.004 1.1 0.99 0.62 – 0.64
River sediment with medium amount of roots (RCMR)
4-7 0.16±0.01 4.4 0.99 0.13 – 0.19
River sediment with small amount of roots (RCSR)
8-13 0.14±0.02 5.0 0.97 0.10 –0.18
River sediment with no roots (RCNR)
20-27 0.13±0.04 5.3 0.94 0.05 – 0.21
Note: K: pseudo first-order kinetic constant, day-1; ±: standard error of the pseudo first-order kinetic constant from the non-linear regression; t1/2: half-life time, days; R2: coefficient of determination for the non-linear regression.
Time (days)
0 10 20 30 40 50
1,2,
3,4-
TEC
B, m
M /k
g dr
y so
il
0
200
400
600
800
1000
RCNRRCSRRCMRRCLR
Figure 4.9: Dechlorination of 1,2,3,4-TeCB in treatments with different amounts of roots.
86
biodegradation of organic pollutants are speculated to be due to the differences in the
interaction of plant roots exudates and microorganisms, probably caused by the
differences in the characteristics of plant roots such as alterations in root exudate patterns
and root architecture (Marilley et al., 1998; Siciliano and Germida, 1999; Siciliano et al.,
2003). Cieslinski et al. (1997) found that exudation of low molecular mass organic acids
in the rhizosphere of wheat and flax differed significantly between cultivars. Soil acidity,
redox potential, oxygen availability and other parameters in the rhizosphere may be
altered by the root exudates, which in turn may influence the microbial diversity in the
soil and thus affect rhizodegradation (Marilley et al., 1998). Moreover, varied
performances of rhizodegradation may also be caused by differences in root morphology
such as root density and abundance (Siciliano et al., 2003). Based on the above
discussion, selection of the appropriate type of plant for application in bioremediation is
very important. Since dechlorination of the test chemical was enhanced by Typha, the
plant could be a very promising vegetation for phytoremediation of chlorobenzene
contaminated sites.
4.3.2 Organic Acids, Hydrogen and Methane Concentrations
Generally, acetic and propionic acids were the most abundant organic acids
detected. Concentrations of these organic acids were observed to increase with increasing
amount of Typha roots as Figure 4.10 and 4.11 illustrate. This observation indicates that
Typha root matter increased the production of organic acids. Higher concentrations of
organic acids in root-amended microcosms compared to non-amended soil could be due
to fermentation of root organic matter and root exudates. Conrad and Klose (2000) also
87
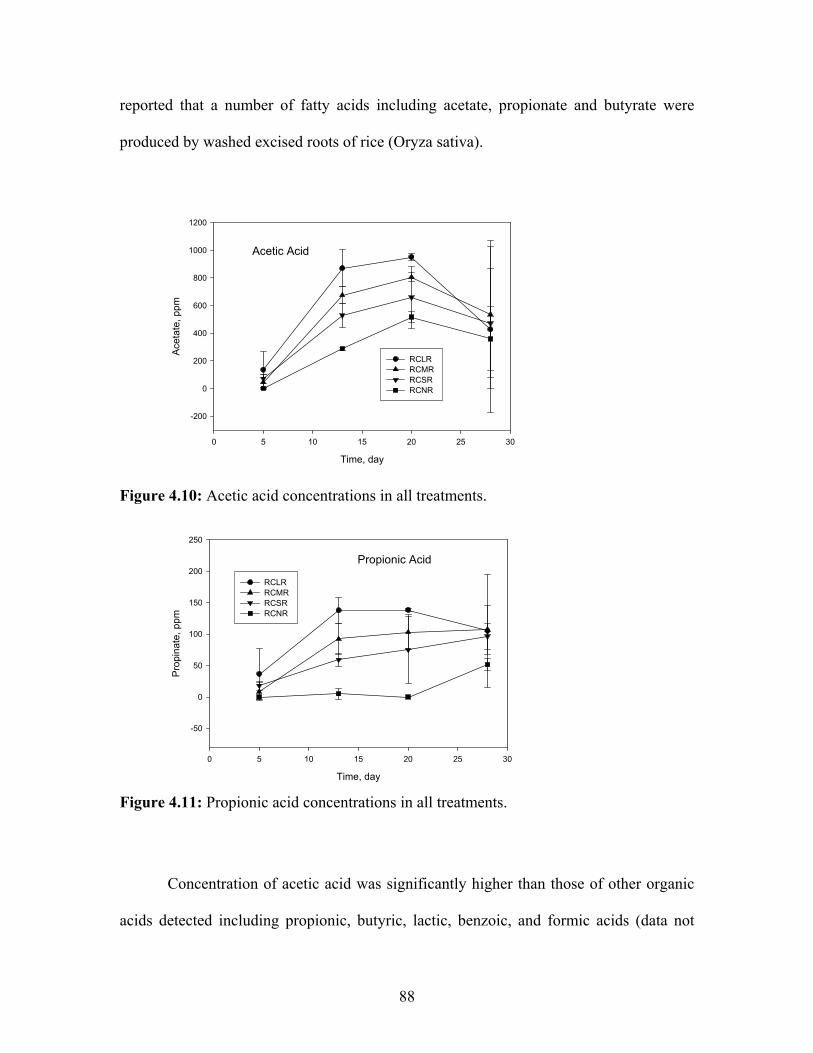
reported that a number of fatty acids including acetate, propionate and butyrate were
produced by washed excised roots of rice (Oryza sativa).
Acetic Acid
Time, day
0 5 10 15 20 25 30
Acet
ate,
ppm
-200
0
200
400
600
800
1000
1200
RCLR RCMR RCSR RCNR
Figure 4.10: Acetic acid concentrations in all treatments.
Propionic Acid
Time, day
0 5 10 15 20 25 30
Prop
inat
e, p
pm
-50
0
50
100
150
200
250
RCLR RCMR RCSR RCNR
Figure 4.11: Propionic acid concentrations in all treatments.
Concentration of acetic acid was significantly higher than those of other organic
acids detected including propionic, butyric, lactic, benzoic, and formic acids (data not
88
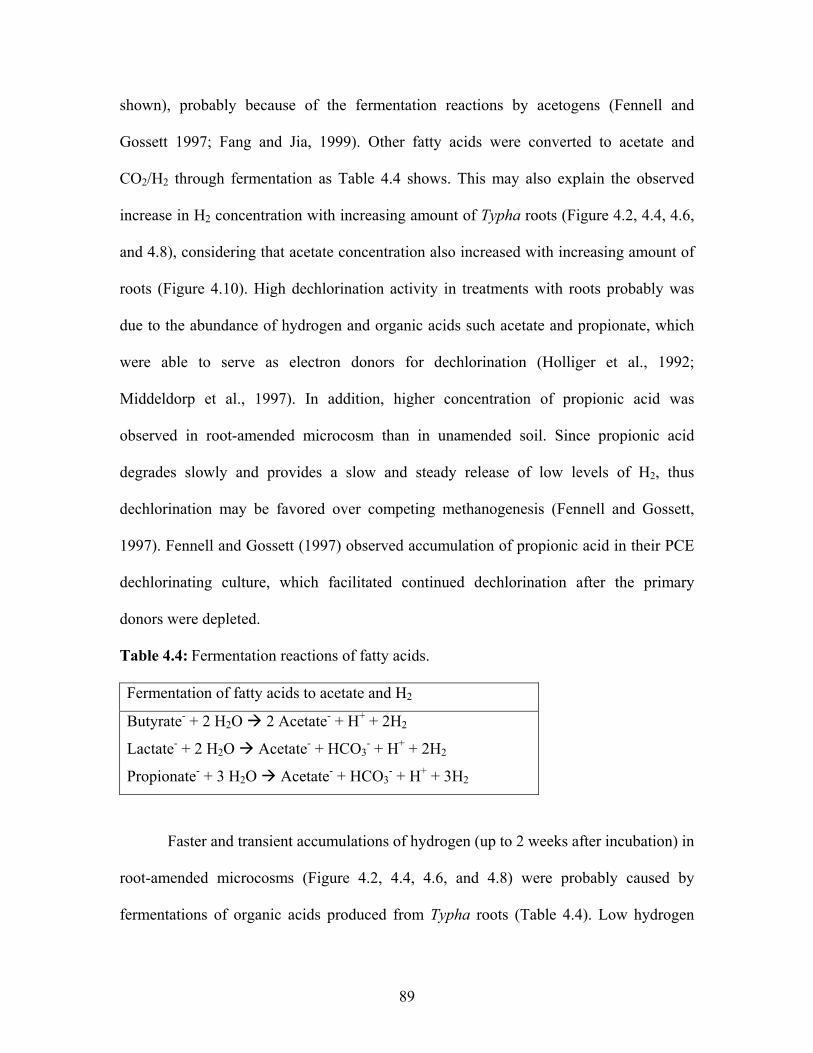
shown), probably because of the fermentation reactions by acetogens (Fennell and
Gossett 1997; Fang and Jia, 1999). Other fatty acids were converted to acetate and
CO2/H2 through fermentation as Table 4.4 shows. This may also explain the observed
increase in H2 concentration with increasing amount of Typha roots (Figure 4.2, 4.4, 4.6,
and 4.8), considering that acetate concentration also increased with increasing amount of
roots (Figure 4.10). High dechlorination activity in treatments with roots probably was
due to the abundance of hydrogen and organic acids such acetate and propionate, which
were able to serve as electron donors for dechlorination (Holliger et al., 1992;
Middeldorp et al., 1997). In addition, higher concentration of propionic acid was
observed in root-amended microcosm than in unamended soil. Since propionic acid
degrades slowly and provides a slow and steady release of low levels of H2, thus
dechlorination may be favored over competing methanogenesis (Fennell and Gossett,
1997). Fennell and Gossett (1997) observed accumulation of propionic acid in their PCE
dechlorinating culture, which facilitated continued dechlorination after the primary
donors were depleted.
Table 4.4: Fermentation reactions of fatty acids.
Fermentation of fatty acids to acetate and H2
Butyrate- + 2 H2O 2 Acetate- + H+ + 2H2
Lactate- + 2 H2O Acetate- + HCO3- + H+ + 2H2
Propionate- + 3 H2O Acetate- + HCO3- + H+ + 3H2
Faster and transient accumulations of hydrogen (up to 2 weeks after incubation) in
root-amended microcosms (Figure 4.2, 4.4, 4.6, and 4.8) were probably caused by
fermentations of organic acids produced from Typha roots (Table 4.4). Low hydrogen
89
(Figure 4.8) and organic acids concentrations (Figure 4.10 and 4.11) in RCNR treatment
in the first 2 weeks of the incubation compared with root-amended treatments (Figure
4.2, 4.4, and 4.6) may explain the significantly lower dechlorination activity in the
absence of roots (Figure 4.7) (i.e., 1,2,3,4-TeCB dechlorination delayed for about 2
weeks in RCNR treatment). Decreases in hydrogen concentration after 2 or 3 weeks of
incubation were probably because consumption of hydrogen was much higher than its
production. Since hydrogen can be used as an electron donor for both dechlorination and
methanogenesis, and production of hydrogen probably decreased due to the decrease in
secretion of root exudates with time considering that the roots were not as fresh as they
were at the beginning, therefore, hydrogen concentration started to drop. Accumulation of
methane coincided with decrease in hydrogen concentration (Figure 4.2, 4.4, and 4.6),
supporting the above reasons.
Moreover, faster methane accumulation was observed in root-amended
microcosms than in microcosm with soil alone, probably due to the initial faster
accumulations of hydrogen and acetate in root-amended microcosms, since both
hydrogen and acetate could be converted to methane by methanogens (Fang and Jia,
1999). Fennell and Gossett (1997) also observed a simultaneous increase in methane
production and decrease in acetic acid concentration, which was due to significant
acetotrophic activity.
4.3.3 Diversities of Microbial Communities
Soil slurry samples from one of the triplicate microcosms of RCLR and RCNR
were collected and analyzed using DGGE technique. The DGGE banding profiles are
shown in Figure 4.12.
90
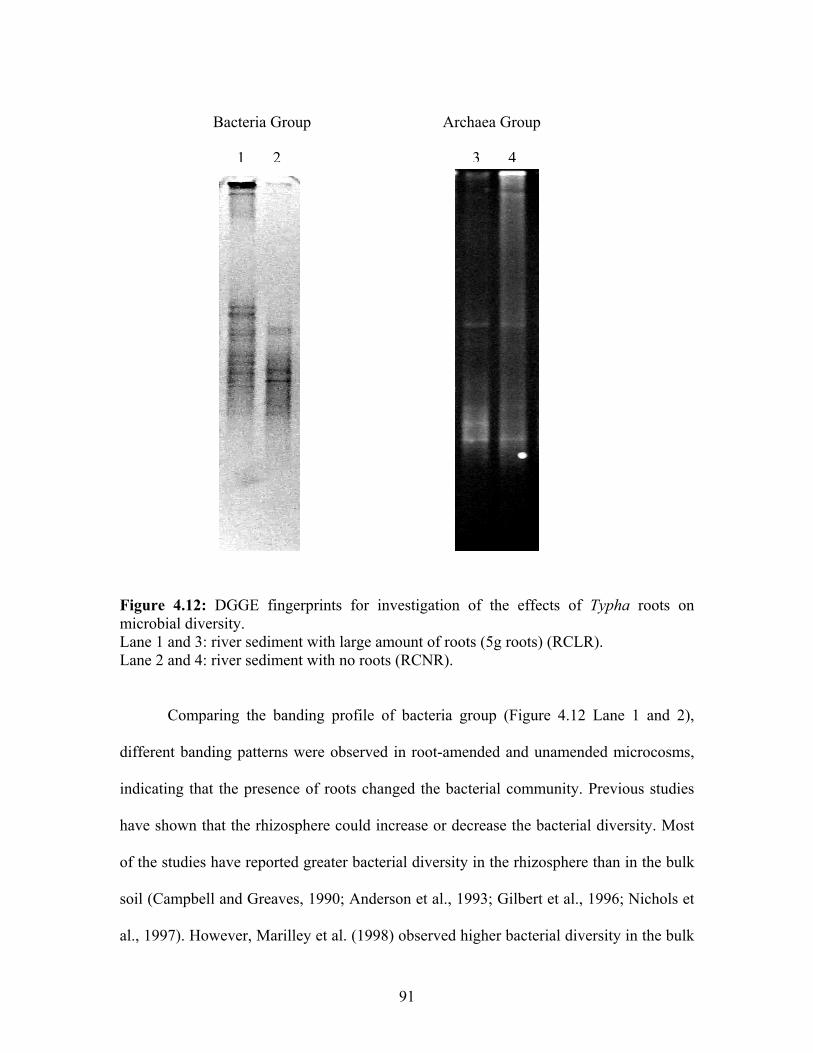
Bacteria Group Archaea Group
1 2 3 4
Figure 4.12: DGGE fingerprints for investigation of the effects of Typha roots on microbial diversity. Lane 1 and 3: river sediment with large amount of roots (5g roots) (RCLR). Lane 2 and 4: river sediment with no roots (RCNR).
Comparing the banding profile of bacteria group (Figure 4.12 Lane 1 and 2),
different banding patterns were observed in root-amended and unamended microcosms,
indicating that the presence of roots changed the bacterial community. Previous studies
have shown that the rhizosphere could increase or decrease the bacterial diversity. Most
of the studies have reported greater bacterial diversity in the rhizosphere than in the bulk
soil (Campbell and Greaves, 1990; Anderson et al., 1993; Gilbert et al., 1996; Nichols et
al., 1997). However, Marilley et al. (1998) observed higher bacterial diversity in the bulk
91
soil than in the rhizosphere. Siciliano and Germida (1999) also observed cultivar-
dependent differences in the root interior microbial community. The differences in these
findings were possibly caused by the differences in interactions between root exudates
and microorganisms, indicating that the type of plant may derive different alteration in
the microbial consortia. The change in the composition and diversity of the bacterial
community in the rhizosphere is, therefore, strongly influenced by the characteristics of
the plant root such as root exudates and root density, and the diversity of organisms
already present in the soil (Siciliano and Germida, 1999; Siciliano et al., 2003). Pinton et
al. (2001) and Brimecombe, et al. (2001) also summarized that root exudates could
change the composition of rhizosphere, and were able to stimulate or inhibit microbial
populations and their activities.
However, in the present study, it was difficult to establish if the presence of roots
increased or decreased the bacterial diversity because of the poor DGGE image. Use of a
higher resolution CCD camera to capture images of the DGGE gels would likely produce
higher quality images and thereby allow a more meaningful comparison of the banding
patterns and therefore, the microbial populations. As for bacteria group, poor DGGE
image of archaea group (Figure 4.12 Lane 3 and 4) made it difficult to draw strong
conclusions about the effects of roots on archaea community.
4.4 Conclusions
Enhanced biodegradation of 1,2,3,4-TeCB was observed in the presence of Typha
roots. Although there were no significant differences in dechlorination pathway between
treatments with roots and without roots, dechlorination kinetics increased with increasing
amounts of roots, indicating that Typha root matter strongly benefited biodegradation of
92
chlorobenzenes. These results indicate that Typha, a native wetland plant with abundant
rhizomes, could be a very promising vegetation for application in bioremediation of
chlorinated solvents contaminated sites.
Abundance of organic acids, especially acetic acid and propionic acid, and
hydrogen were observed in treatments with roots compared to the treatment without
roots, which probably caused higher dechlorination activities in root-amended
microcosms. Although it is difficult to ascertain the effects of roots on the microbial
community from DGGE band profiles, it is most likely that root matter benefited the
dechlorinating microorganisms based on the dechlorination kinetics.
93
CHAPTER 5. CONCLUSIONS AND RECOMMENDATIONS
Widespread contamination of soil and groundwater by chlorinated benzenes has
impacted the environment and public health. Compared to traditional physical/chemical
treatments, bioremediation is a promising and cost-effective method, which can prevent
the damage of ecological systems since it involves destruction of pollutants by natural
mechanisms. Therefore, it is important to investigate the mechanisms involved in
attenuation of pollutants and the factors affecting them before a decision of applying
bioremediation for cleaning up a contaminated site is reached. Microcosm studies were,
therefore, undertaken to investigate the potential of 1,2,3,4-Tetrachlorobenzene (1,2,3,4-
TeCB) biodegradation in one mineral-dominated soil: PPI (Petro Processors Inc. site)
soil, and three organic matter-dominated soils (natural wetland soil, constructed wetland
soil (a mixture of peat, compost and sand), and river sediment). Concentrations of
hydrogen and methane associated with dechlorination activities were also measured. To
determine whether methanogens were directly responsible for dechlorination, 2-
bromoethanesulfonic acid (BES) was used for inhibition of methanogenesis. Microbial
diversity of dechlorinating populations was also analyzed by using the PCR-DGGE
technique. To better understand the factors affecting dechlorination activities, the present
study involved three generation cultures. The 1st Generation culture was developed from
the first spike of the test chemical into the fresh soil, whereas the 2nd and 3rd generation
cultures were prepared by inoculating 25 mL of slurries from the immediately previous
culture.
Phytoremediation, a relatively new bioremediation technology using plants and
associated rhizosphere microorganisms, has shown great potential of enhancing
94
biodegradation. Organic acids from carbonaceous root matter may serve as direct electron
donors or precursors of hydrogen, necessary for driving dechlorination reactions, and
thus enhance the biodegradation activities. Increased microbial population and diversity
due to the presence of plant roots may also contribute to the enhanced biodegradation
activities. To investigate the effects of wetland plant roots on anaerobic dechlorination of
1,2,3,4-TeCB, comparative studies on degradation kinetics in the presence and absence of
Typha latifolia L. roots were conducted. Microbial diversity using PCR based DGGE
technique, organic acids, hydrogen and methane were also measured to better understand
the effects of Typha roots on dechlorination of chlorobenzenes.
Results of the present study have shown that 1,2,3,4-TeCB was able to be
completely degraded in all organic matter- and mineral-dominated soils under anaerobic
conditions. The most dominant dechlorination pathway of 1,2,3,4-TeCB was: 1,2,3,4-
TeCB 1,2,3-TCB 1,2-DCB + 1,4-DCB + 1,3-DCB monochlorobenezene +
benzene. The test chemical was biodegraded at rates ranging from 0.023 day-1 (half-life
time of 30.5 days) to 1.108 day-1 (half-life time of 0.6 days), with lag periods varied
between 1 and 72 days. There was no apparent relationship between dechlorination rate
of the test chemical and organic carbon content of the test soils. Besides organic carbon
content, dechlorination kinetics of chlorobenzenes depends on other factors such as
previous exposure history. DGGE banding profiles suggested that different microbial
communities were involved in biodegradation of 1,2,3,4-TeCB. Higher dechlorination
kinetic rate and shorter lag period can be expected with increasing number of
inoculations, if soil characteristics and experimental conditions remain unchanged.
Moreover, complete dechlorination of the parent compound and intermediate daughter
95
products (trichlorobenzenes and dichlorobenzenes) were observed in the 3rd Generation
cultures of active control microcosms of all test soils. In addition, constructed wetland
soil was found to be a very promising material for ex-situ bioremediation of chlorinated
solvents-contaminated sites using treatment wetland systems. Moreover, natural wetland
soil was found to have intrinsic capability of attenuating chlorinated benzenes.
Generally, there was no clear relationship between hydrogen concentrations and
methanogenesis or dechlorination. However, hydrogen concentration trends in some
treatments suggested that hydrogen was probably used as an electron donor during
methanogenesis and for driving dechlorination reactions. Methane started to accumulate
after 1,2,3,4-TeCB and its intermediate daughter products (trichlorobenzenes and
dichlorobenzenes) were completely degraded in most active control microcosms,
indicating that dechlorinators may have out-competed methanogens for electron donors.
Enhanced biodegradation of 1,2,3,4-TeCB was observed in the presence of Typha
latifolia L. roots, and biodegradation rate increased with increasing ratio of roots to soil.
Therefore, Typha, a native wetland plant with abundant rhizomes, could be a very
promising vegetation for application in bioremediation of chlorinated solvents-
contaminated sites. Higher dechlorination activities in root-amended microcosms were
probably caused by higher concentrations of organic acids especially acetic acid and
propionic acid, and consequently hydrogen in treatments with roots compared to the
treatment without roots due to carbonaceous root matter. DGGE banding profiles
revealed that the presence of roots changed the bacterial community, but it is difficult to
ascertain whether the bacteria diversity increased due to the root matter because of the
poor image. In view of this, improvement of the DGGE imaging system is recommended.
96
It was difficult to assure that bacteria but not methanogens were directly
responsible for dechlorination by using BES for inhibition of methanogenesis. It may be
clearer by tracking the changes in microbial composition and diversity of both bacteria
and archaea with time in both active control and BES-amended treatments. In addition,
specific primers for methanogens are recommended instead of using archaea-specific
primers. Similarly, to understand more about the effects of roots on microbial community
and thus on dechlorination, temporal monitoring of microbial population and diversity in
treatments with different amount of roots and without roots is recommended.
The limitation of using excised roots is that it was difficult to determine the
relative contribution of root exudates and decomposition of roots themselves in organic
acids production and consequently hydrogen concentrations, since organic acids can be
produced from both root secretions and decomposition of the roots themselves. To
ascertain that it was root exudates but not decomposition of roots that enhanced
dechlorination of chlorobenzenes, it is recommended to collect root exudates from the
live plant and use them for microcosm study to investigate their effects on dechlorination.
Before field application, further investigations, such as mesocosm and pilot scale
studies using live plants, on the potential of Typha to enhance reductive dechlorination of
chlorobenzenes are recommended.
97
REFERENCES
Adrain, L., U. Szewzyk, J. Wecke, and H. Gorisch. 2000. Bacterial dehalorespiration with chlorinated benzenes. Nature 408 (6812): 580 – 3.
Adrian, L., W. Manz, U. Szewzyk, and H. Görisch. 1998. Physiological characterization of a bacterial consortium reductively dechlorinating 1,2,3- and 1,2,4-trichlorobenzene. Appl. Environ. Microbiol. 64 (2): 496 – 503.
Allison, L. E. 1965. In Methods of soil analysis, edited by Black, C. A., D. D. Evans, J. L. White, L. E. Ensminger, F. E. Clark. No. 9 in the Series of Agronomy, Part 2 (ASA, Madison, WI, 1965), pp. 1367 – 1378.
Anderson, T. A., and B. T. Walton. 1995. Comparative fate of [14C]trichloroethylene in the root zone of plants from a former solvent disposal site. Environ. Toxicol. Chem. 14: 2041 – 2047.
Anderson, T. A., E. A. Guthrie, and B. T. Walton. 1993. Bioremediation. ES&S Critical review. Environ. Sci. Technol. 27: 2630 – 2636.
Bailey, R. E. 1983. Comment on “Chlorobenzenes in sediments, water and selected fish from lakes Superior, Huron, Erie and Ontario.”. Environ. Sci. Technol. 17: 504 – 505.
Banks, M. K., E. Lee, and A. P. Schwab. 1999. Evaluation of dissipation mechanisms for benzo[a]pyrene in the rhizosphere of Tall Fescue. J. Environ. Qual.. 28: 294 – 298.
Belay, N. and L. Daniels. 1987. Production of ethane, ethylene, and acetylene from halogenated hydrocarbons by methanogenic bacteria. Appl. Environ. Microbiol., 53 (7): 1604 – 1610.
Beurskens, J. E. M., C. G. C. Dekker, H. van den Heavel, M. Swart, J. de Wolf, and J. Dolfing. 1994. Dechlorination of chlorinated benzenes by an anaerobic microbial consortium that selectively mediates the thermodynamic most favorable reactions. Environ. Sci. Technol. 28: 701 – 706.
Brimecombe, M. J., F. A. De Leij, and J. M. Lynch. 2001. The effects of root exudates on rhizosphere microbial populations. In: The Rhizosphere. Ed. Pinton, R., Z. Varanini, and P. Nannipieri. pp 95-140. Marcel Dekker, Inc., New York.
Burland, S. M. and E. A. Edwards. 1999. Anaerobic benzene biodegradation linked to nitrate reduction. Appl. Environ. Microbiol., 65 (2): 529 – 533.
98
Campbell, R. and M. P. Greaves. 1990. Anatomy and community structure of the rhizosphere. In: The Rhizosphere. Ed. Lynch, J. M.. pp11-34. John Wiley & Sons Ltd., Essex.
Carroll, J. J., J. Maddocks and A. E. Mather. 1998. The solubility of hydrocarbons in amine solutions. Laurance Reid Gas Conditioning Conference, Norman, Oklahoma.
Casamayor, E. O., H. Schafer, and G. Muyzer. 2000. Identification of and spatio-temporal differences between microbial assemblages from two neighboring sulfurous lakes: comparison by microscopy and denaturing gradient gel electrophoresis. Appl. Environ. Microbiol. 66(2), 499-508.
Chang, B-V., Y-M. Chen, S-Y. Yuan, and Y-S. Wang. 1997. Reductive dechlorination of hexachlorobenzene by an anaerobic mixed culture. Water, Air, and Soil Pollution 100: 25 – 32.
Chen, M., B-V. Chang, S-Y. Yuan, and Y-S. Wang. 2002. Reductive dechlorination of hexachlorobenzene under various additions. Water, Air, and Soil Pollution 139: 61 – 74.
Chiu, P. C. and M. Lee. 2001. 2-Bromoethanesulfonate affects bacteria in a trichloroethene-dechlorinating culture. Appl. Environ. Microbiol., 67: 2371 – 2374.
Christensen, P., N. Revsbech and K. Sand-Jensen. 1994. Microsensor analysis of oxygen in the rhizosphere of the aquatic macrophyte Littorella uniflora (L.) Ascherson. Plant Physiology. 105: 847-852.
Cieslinski,G., K. C. J. Van-Rees, A. M. Szmigielska and P. M. Huang. 1997. Low molecular weight organic acids released from roots of durum wheat and flax into sterile nutrient solutions. J. Plant Nutr., 20: 753 – 764.
Clover, C. C. 1998. Natural attenuation of mono- and dichlorobenzenes in anaerobic surface sediments at the Petro Processor’s, Inc. site. Master’s thesis. Louisiana State University, Baton Rouge.
Conrad, R. 1999. Contribution of hydrogen to methane production and control of hydrogen concentrations in methanogenic soils and sediments. FEMS Microbiol. Ecol., 28: 193 – 202.
Conrad, R. and M. Klose. 2000. Selective inhibition of reactions involved in methanogenesis and fatty acid production on rice roots. FEMS Microbiol. Ecol., 34: 27 – 34.
Cunningham, S. D. and D. W. Ow. 1996. Promises and prospects of phytoremediation. Plant Physiol., 110 (3): 715 – 719.
99
DeBont, J. A. M., M. J. A. W. Vorage, S. Hartmans, W. J. J. Van Den Tweel. 1986. Microbial degradation of 1,3-dichlorobenzene. Appl. Environ. Microbiol. 52 (4): 677 - 680.
Deeb, R. A., and L. Alvarez-Cohen. 1999. Temperature effects and substrate interactions during the aerobic biotransformation of BTEX mixtures by toluene-enriched consortia and Rhodococcus rhodochrous. Biotechnol. Bioeng., 62: 526 – 536.
Dolfing, J. and B, K. Harrison. 1992. Gibbs free energy of formation of halogenated aromatic compounds and their potential role as electron acceptors in anaerobic environments. Environ. Sci. Technol., 26(11): 2213 – 2218.
EPA, 1996. Product properties test guidelines.OPPTS 830.7560 Partition coefficient (n-octanol/water) generator column method. Prevention, pesticides and toxic substances (7101). EPA712-C-96-039.
EPA, 2000. Introduction to phytoremediation. National Risk Management Research Laboratory, Office of Research and Development, U. S. Environmental Protection Agency, Cincinnati, Ohio 45268. EPA/600/R-99/107.
EPA, 2002a. National Primary Drinking Water Regulations. United States Environmental Protection Agency (EPA). Office of Water (4606), EPA 816-F-02-013, July 2002. Washington, DC. (http://www.epa.gov/safewater/mcl.html).
EPA, 2002b. Integrated Risk Information System. United States Environmental Protection Agency (EPA). Sept. 2002. Washington. DC. (http://www.epa.gov/iris/).
Erickson, L. E., M. K. Banks, L. C. Davis, A. P. Schwab and J. C. Tracy. 1994. Using vegetation to enhance in situ bioremediation. Environ. Progr., 13: 226 – 231.
Fang, H. H. P. and X. S. Jia. 1999. Formation of interim byproducts in methanogenic degradation of butyrate. Wat. Res., 33 (8): 1791 – 1798.
Fantroussi, S. E., H. Naveau, and S. N. Agathos. 1998. Review: Anaerobic dechlorinating bacteria. Biotechnol. Prog., 14: 167 – 188.
Fathepure, B. Z., Tiedje, J. M. and S. A. Boyd. 1988. Reductive dechlorination of hexachlorobenzene to tri- and di-chlorobenzenes in anaerobic sewage sludge. Appl. Environ. Microbiol. 54: 327 – 330.
Fennell, D. and J. M. Gossett. 1997. Comparison of butyric acid, ethanol, lactic acid, and propionic acid as hydrogen donors for the reductive dechlorination of tetrachloroethene. Environ. Sci. Technol., 31 (3): 918 – 926.
100
Fennell, D. and J. M. Gossett. 1998. Modeling the production of and competition for hydrogen in a dechlorinating culture. Environ. Sci. Technol., 32 (16): 2450 – 2460.
Fetter, C. W. 1993.Contaminant Hydrogeology, Second edition, Prentice Hall, Inc.
Haby, P. A. and D. E. Crowley. 1996. Biodegradation of 3-chlorobenzoate as affected by rhizodeposition and selected carbon substrates. J. Environ. Qual., 25: 304 – 310.
Hendrickson, E. R., J. A. Payne, R. M. Young, M. G. Starr, M. P. Perry, S. Fahnestock, D. E. Ellis, and R. C. Ebersole. Molecular analysis of Dehalococcoides 16S Ribosomal DNA from chloroethene –contaminated sites throughout North America and Europe. Appl. Environ. Microbiol., 68 (2): 485 – 495.
Holben, W. E., J. K. Jansson, B. K. Chelm, and J. M. Tiedje. 1988. DNA probe method for the detection of specific microorganisms in the soil bacterial community. Appl. Environ. Microbiol., 54: 703 – 711.
Holliger C., G. Schraa, A. J. M. Stams, and A. J. B. Zehnder. 1992. Enrichment and properities of an anaerobic mixed culture reductively dechlorinating 1,2,3-trichlorobenzene to 1,3-dichlorobenzene. Appl. Environ. Microbiol. 58 (5): 1636 – 1644.
Jackson, W.A. and J.H. Pardue. 1998. Assessment of Metal Inhibition of Reductive Dechlorination of Hexachlorobenzene at a Superfund site. Environ. Toxicol. Chem. 17: 1441-1446.
Jordahl, J. L., L. Foster, J. L. Schnoor, and P. J. J. Alvarez. 1997. Effect of hybrid poplar trees on microbial populations important to hazardous waste bioremediation. Environ. Toxicol. Chem. 16 (6): 1318 – 1321.
Kassenga, G. R. 2003. Treatment of chlorinated volatile organic compounds using wetland systems. Ph. D. Dissertation, Louisiana State University, Baton Rouge.
Kassenga, G. R., J. H. Pardue, S. Blair, and T. Ferraro. 2003. Treatment of chlorinated volatile organic compounds in upflow wetland mesocosms. Ecol. Eng., 19: 305 – 323.
Klečka, G. M., S. J. Gonsior, and D. A. Markham. 1990. Biological transformations of 1,1,1-trichloroethane in subsurface soils and ground water. Environ. Sci. Technol., 9: 1437 – 1451.
Kozdrόj, J. and J.D. van Elsas. 2000. Application of polymerase chain reaction-denaturing gradient gel electrophoresis for comparison of direct and indirect extraction methods of soil DNA used for microbial community fingerprinting. Biol. Fertil. Soils, 31: 372 – 378.
101
Lappin, H. M., M. P. Greaves, and J. H. Slater. 1985. Degradation of the herbicide mecoprop [2-(2-methyl-4-chlorophenoxy) propionic acid] by a synergistic microbial community. Appl. Environ. Microbiol. 49: 429 – 33.
Lee, S. 2001. Biodegradation of desorption-resistant organic contaminants in wetland soils. Ph. D. Dissertation, Louisiana State University, Baton Rouge.
Löffler, F. E., K. M. Ritalahti, and J. M. Tiedje. 1997. Dechlorination of chloroethenes is inhibited by 2-bromoethanesulfate in the absence of mehanogens. Appl. Environ. Microbiol., 63: 4982-4985.
Lorah, M. M. and L. D. Olsen. 1999. Degradation of 1,1,2,2-tetrachloroethane in a freshwater tidal wetland: Field and laboratory evidence. Environ. Sci. Technol., 33 (2): 227 – 234.
Lorah, M. M. and L. D. Olsen. 1999. Natural attenuation of chlorinated volatile organic compounds in a freshwater tidal wetland: field evidence of anaerobic biodegradation. Water Resour. Res., 35 (12): 3811 – 3827.
Lorah, M. M., L. D. Olsen, B. L. Smith, M. A. Johnson, and W. B. Fleck. 1997. Natural attenuation of chlorinated volatile organic compounds in a freshwater tidal wetland, Aberdeen Proving Ground, Maryland. US Geological Survey Water Resources Investigations Report 97 – 4171.
Macnaughton, S. J., J. R. Stephen, A. D. Venosa, G. A. Davis, Y-J Chang, D. C. White. 1999. Microbial population changes during bioremediation of an experimental oil spill. Appl. Environ. Microbiol., 65 (8): 3566 – 3574.
Marilley, L., G. Vogt, M. Blanc and M. Aragno. 1998. Bacterial diversity in the bulk soil and rhizosphere fractions of Lolium perenne and Trifolium repens as revealed by PCR restriction analysis of 16S rDNA. Plant and Soil, 198: 219 – 224.
Masunaga, S., S. Susarla, and Y. Yonezawa. 1996. Dechlorination of chlorobenzenes in anaerobic estuarine sediment. Wat. Sci. Tech. 33 (6): 173 – 180.
Middeldorp, P. J. M., J. De Wolf, A. J. B. Zehnder, and G. Schraa. 1997. Enrichment and properties of a 1,2,4-trichlorobenzene dechlorinating methanogenic microbial consortium. Appl. Environ. Microbiol. 63 (4): 1225 – 1229.
Muyzer, G., A. Teske, C. O. Wirson and H. W. Jannasch. 1995. Phylogenetic relationships of Thiomicrospira species and their identification in deep-sea hydrothermal vent samples by denaturing gradient gel electrophoresis of 16S rDNA fragments. Arch. Microbiol., 164: 165 – 172.
Myers, R. M., T. zmsnisyis, L. S. Lerman. 1987. Detection and localization of single base changes by denaturing gradient gel electrophoresis. Method Enzymol, 155: 501 – 527.
102
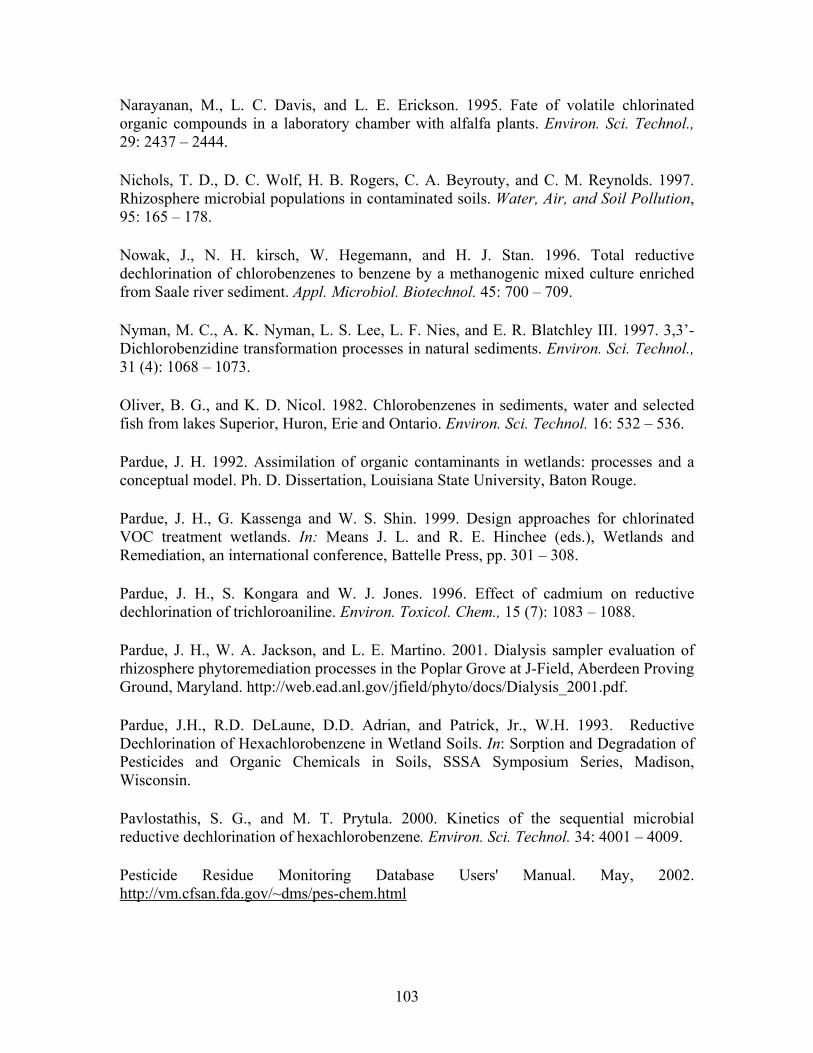
Narayanan, M., L. C. Davis, and L. E. Erickson. 1995. Fate of volatile chlorinated organic compounds in a laboratory chamber with alfalfa plants. Environ. Sci. Technol., 29: 2437 – 2444.
Nichols, T. D., D. C. Wolf, H. B. Rogers, C. A. Beyrouty, and C. M. Reynolds. 1997. Rhizosphere microbial populations in contaminated soils. Water, Air, and Soil Pollution, 95: 165 – 178.
Nowak, J., N. H. kirsch, W. Hegemann, and H. J. Stan. 1996. Total reductive dechlorination of chlorobenzenes to benzene by a methanogenic mixed culture enriched from Saale river sediment. Appl. Microbiol. Biotechnol. 45: 700 – 709.
Nyman, M. C., A. K. Nyman, L. S. Lee, L. F. Nies, and E. R. Blatchley III. 1997. 3,3’-Dichlorobenzidine transformation processes in natural sediments. Environ. Sci. Technol., 31 (4): 1068 – 1073.
Oliver, B. G., and K. D. Nicol. 1982. Chlorobenzenes in sediments, water and selected fish from lakes Superior, Huron, Erie and Ontario. Environ. Sci. Technol. 16: 532 – 536.
Pardue, J. H. 1992. Assimilation of organic contaminants in wetlands: processes and a conceptual model. Ph. D. Dissertation, Louisiana State University, Baton Rouge.
Pardue, J. H., G. Kassenga and W. S. Shin. 1999. Design approaches for chlorinated VOC treatment wetlands. In: Means J. L. and R. E. Hinchee (eds.), Wetlands and Remediation, an international conference, Battelle Press, pp. 301 – 308.
Pardue, J. H., S. Kongara and W. J. Jones. 1996. Effect of cadmium on reductive dechlorination of trichloroaniline. Environ. Toxicol. Chem., 15 (7): 1083 – 1088.
Pardue, J. H., W. A. Jackson, and L. E. Martino. 2001. Dialysis sampler evaluation of rhizosphere phytoremediation processes in the Poplar Grove at J-Field, Aberdeen Proving Ground, Maryland. http://web.ead.anl.gov/jfield/phyto/docs/Dialysis_2001.pdf.
Pardue, J.H., R.D. DeLaune, D.D. Adrian, and Patrick, Jr., W.H. 1993. Reductive Dechlorination of Hexachlorobenzene in Wetland Soils. In: Sorption and Degradation of Pesticides and Organic Chemicals in Soils, SSSA Symposium Series, Madison, Wisconsin.
Pavlostathis, S. G., and M. T. Prytula. 2000. Kinetics of the sequential microbial reductive dechlorination of hexachlorobenzene. Environ. Sci. Technol. 34: 4001 – 4009.
Pesticide Residue Monitoring Database Users' Manual. May, 2002. http://vm.cfsan.fda.gov/~dms/pes-chem.html
103
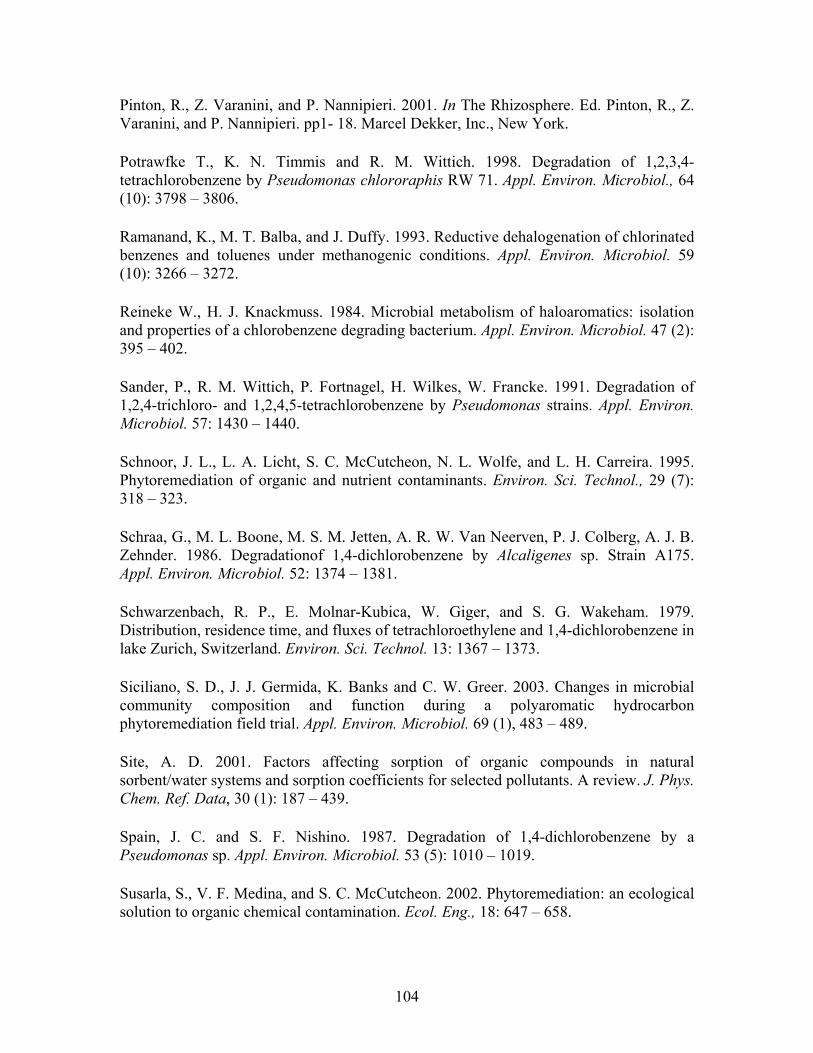
Pinton, R., Z. Varanini, and P. Nannipieri. 2001. In The Rhizosphere. Ed. Pinton, R., Z. Varanini, and P. Nannipieri. pp1- 18. Marcel Dekker, Inc., New York.
Potrawfke T., K. N. Timmis and R. M. Wittich. 1998. Degradation of 1,2,3,4-tetrachlorobenzene by Pseudomonas chlororaphis RW 71. Appl. Environ. Microbiol., 64 (10): 3798 – 3806.
Ramanand, K., M. T. Balba, and J. Duffy. 1993. Reductive dehalogenation of chlorinated benzenes and toluenes under methanogenic conditions. Appl. Environ. Microbiol. 59 (10): 3266 – 3272.
Reineke W., H. J. Knackmuss. 1984. Microbial metabolism of haloaromatics: isolation and properties of a chlorobenzene degrading bacterium. Appl. Environ. Microbiol. 47 (2): 395 – 402.
Sander, P., R. M. Wittich, P. Fortnagel, H. Wilkes, W. Francke. 1991. Degradation of 1,2,4-trichloro- and 1,2,4,5-tetrachlorobenzene by Pseudomonas strains. Appl. Environ. Microbiol. 57: 1430 – 1440.
Schnoor, J. L., L. A. Licht, S. C. McCutcheon, N. L. Wolfe, and L. H. Carreira. 1995. Phytoremediation of organic and nutrient contaminants. Environ. Sci. Technol., 29 (7): 318 – 323.
Schraa, G., M. L. Boone, M. S. M. Jetten, A. R. W. Van Neerven, P. J. Colberg, A. J. B. Zehnder. 1986. Degradationof 1,4-dichlorobenzene by Alcaligenes sp. Strain A175. Appl. Environ. Microbiol. 52: 1374 – 1381.
Schwarzenbach, R. P., E. Molnar-Kubica, W. Giger, and S. G. Wakeham. 1979. Distribution, residence time, and fluxes of tetrachloroethylene and 1,4-dichlorobenzene in lake Zurich, Switzerland. Environ. Sci. Technol. 13: 1367 – 1373.
Siciliano, S. D., J. J. Germida, K. Banks and C. W. Greer. 2003. Changes in microbial community composition and function during a polyaromatic hydrocarbon phytoremediation field trial. Appl. Environ. Microbiol. 69 (1), 483 – 489.
Site, A. D. 2001. Factors affecting sorption of organic compounds in natural sorbent/water systems and sorption coefficients for selected pollutants. A review. J. Phys. Chem. Ref. Data, 30 (1): 187 – 439.
Spain, J. C. and S. F. Nishino. 1987. Degradation of 1,4-dichlorobenzene by a Pseudomonas sp. Appl. Environ. Microbiol. 53 (5): 1010 – 1019.
Susarla, S., V. F. Medina, and S. C. McCutcheon. 2002. Phytoremediation: an ecological solution to organic chemical contamination. Ecol. Eng., 18: 647 – 658.
104
Tandoi. V., T. D. DiStefano, P. A. Bowser, J. M. Gossett, and S. H. Zinder. 1994. Reductive dehalogenation of chlorinated ethenes and halogenated ethanes by a high-rate anaerobic enrichment culture. Environ. Sci. Technol., 28(5): 973 – 979.
Whipps, J. M.. 1990. Carbon economy. In: The Rhizosphere. Ed. Lynch, J. M.. pp59-97. John Wiley &Sons Ltd., Essex.
Wiedemeier, T. H., M. A. Swanson, D. E. Moutoux, and E. K. Gordon. 1999. Technical protocol for evaluating attenuation of chlorinated solvents in groundwater. Air Force Center for Environmental Excellence, Technology Transfer Division, San Antonio.
Wiltse, C. C., W. L. Rooney, Z. Chen, A. P. Schwab, and M. K. Banks. 1998. Greenhouse evaluation of agronomic and crude oil-phytoremediation potential among alfalfa genotypes. J. Environ. Qual., 27: 169 – 173.
Wintzingerode, F. V., U. B. Goebel, and E. Stackebrandt. 1997. Detection of microbial diversity in environmental samples: pitfalls of PCR-based rRNA analysis. FEMS Microbiol. Rev., 21: 213 – 229.
Wu, Q., C. E. Milliken, G. P. Meier, J. E. M. Watts, K. R. Sowers, and H. D. May. 2002. Dechlorination of chlorobenzenes by a culture containing bacterium DF-1, a PCB dechlorinating microorganism. Environ. Sci. Technol. 36: 3290 – 3294.
105
APPENDIX
APPENDIX I: DECHLORINATION PROFILES AND METHANE AND HYDROGEN CONCENTRATION TRENDS IN NATURAL WETLAND SOIL
1 s t G e n e r a t io n C u ltu r eN a tu r a l W e t la n d S o i lA c t iv e C o n t r o l
T im e ( d a y )
0 1 0 2 0 3 0 4 0 5 0 6 0 7 0
1,2,
3,4-
TeC
B, m
M/k
g dr
y so
il
- 1 0 0
0
1 0 0
2 0 0
3 0 0
4 0 0
5 0 0
Dau
ghte
r pro
duct
, mM
/kg
dry
soil
0
5 0
1 0 0
1 5 0
2 0 0
1 2 3 4 - T e C B 1 2 3 - T C B 1 2 4 - T C B 1 2 - D C B 1 4 - D C B 1 3 - D C B
Figure A1: Dechlorination profile of the 1st Generation culture of active control natural wetland soil microcosms.
1st Generation CultureNatural Wetland SoilActive Control
Time (days)
0 10 20 30 40 50 60
Met
hane
, aqu
eous
con
cent
ratio
n, µ
M
0
200
400
600
800
1000
1200
1400
H2,
aque
ous
conc
entra
tion,
nM
0
5
10
15
20
25
30
CH4 H2
Figure B1: Methane and hydrogen concentrations of the 1st Generation culture of active control natural wetland soil microcosms.
106
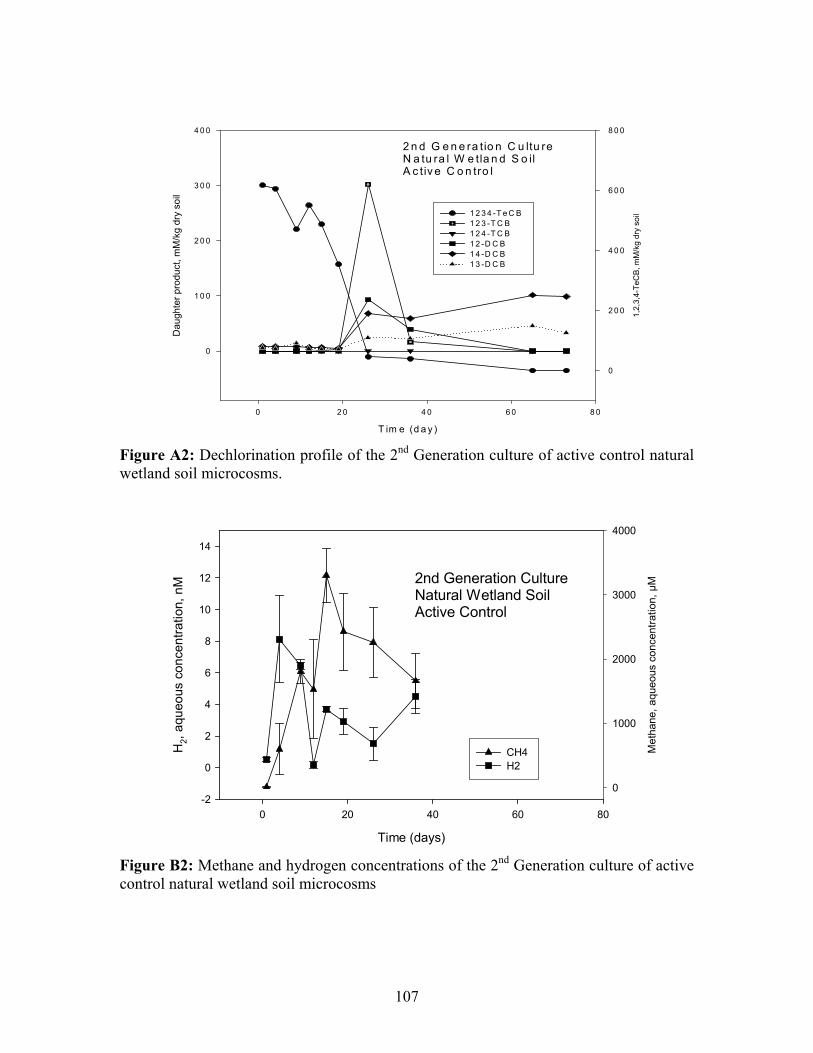
2 n d G e n e ra tio n C u ltu reN a tu ra l W e tla n d S o il A c tiv e C o n tro l
T im e (d a y )
0 2 0 4 0 6 0 8 0
1,2,
3,4-
TeC
B, m
M/k
g dr
y so
il
0
2 0 0
4 0 0
6 0 0
8 0 0
Dau
ghte
r pro
duct
, mM
/kg
dry
soil
0
1 0 0
2 0 0
3 0 0
4 0 0
1 2 3 4 -T e C B 1 2 3 -T C B 1 2 4 -T C B 1 2 -D C B 1 4 -D C B 1 3 -D C B
Figure A2: Dechlorination profile of the 2nd Generation culture of active control natural wetland soil microcosms.
2nd Generation CultureNatural Wetland SoilActive Control
Time (days)
0 20 40 60 80
Met
hane
, aqu
eous
con
cent
ratio
n, µ
M
0
1000
2000
3000
4000
H2,
aque
ous
conc
entra
tion,
nM
-2
0
2
4
6
8
10
12
14
CH4 H2
Figure B2: Methane and hydrogen concentrations of the 2nd Generation culture of active control natural wetland soil microcosms
107
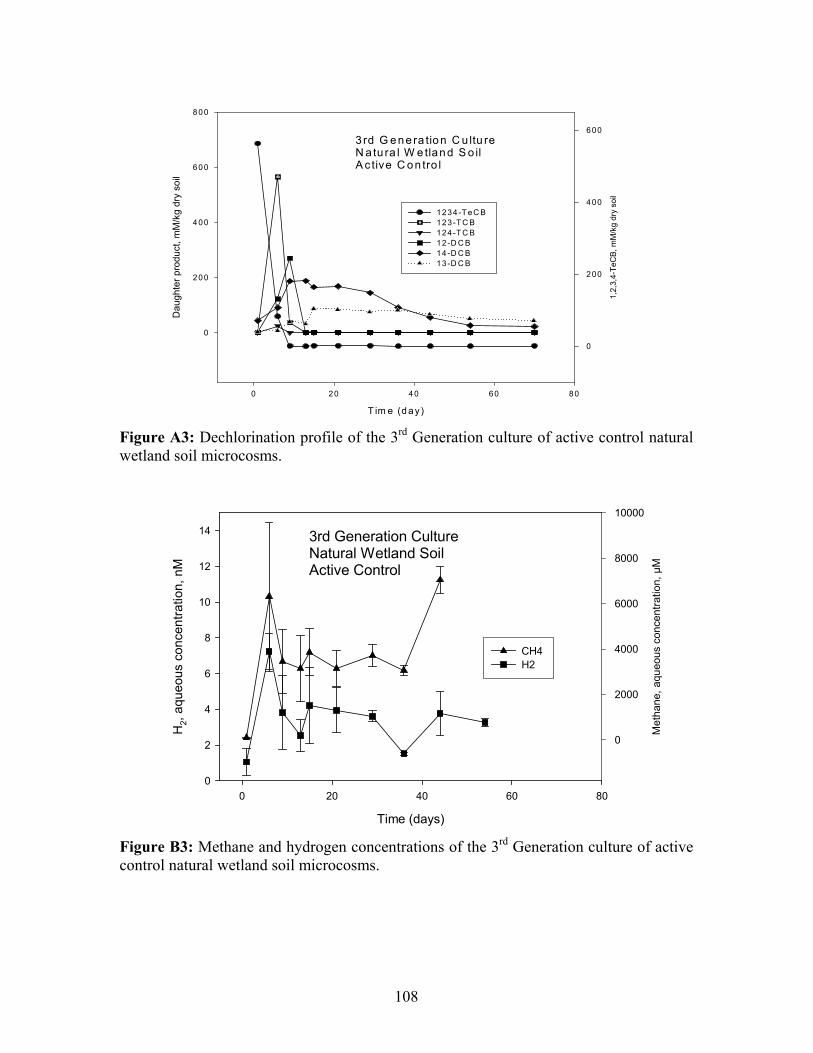
3rd G ene ra tion C u ltu reN a tu ra l W e tland S o ilA c tive C on tro l
T im e (d ay)
0 20 40 60 80
1,2,
3,4-
TeC
B, m
M/k
g dr
y so
il
0
200
400
600
Dau
ghte
r pro
duct
, mM
/kg
dry
soil
0
200
400
600
800
1234-T eC B 123-T C B 124-T C B 12 -D C B 14 -D C B 13 -D C B
Figure A3: Dechlorination profile of the 3rd Generation culture of active control natural wetland soil microcosms.
3rd Generation CultureNatural Wetland SoilActive Control
Time (days)
0 20 40 60 80
Met
hane
, aqu
eous
con
cent
ratio
n, µ
M
0
2000
4000
6000
8000
10000
H2,
aque
ous
conc
entra
tion,
nM
0
2
4
6
8
10
12
14
CH4 H2
Figure B3: Methane and hydrogen concentrations of the 3rd Generation culture of active control natural wetland soil microcosms.
108
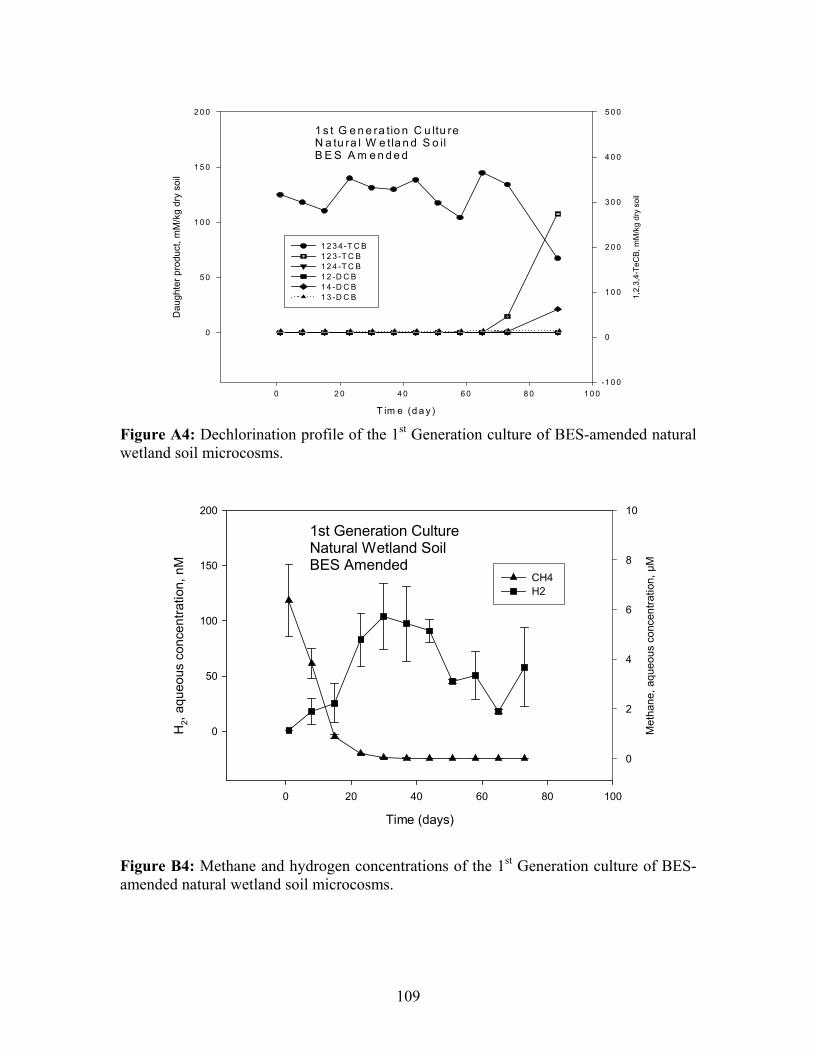
1 s t G e n e ra tio n C u ltu reN a tu ra l W e tla n d S o ilB E S A m e n d e d
T im e (d a y )
0 2 0 4 0 6 0 8 0 1 0 0
1,2,
3,4-
TeC
B, m
M/k
g dr
y so
il
-1 0 0
0
1 0 0
2 0 0
3 0 0
4 0 0
5 0 0
Dau
ghte
r pro
duct
, mM
/kg
dry
soil
0
5 0
1 0 0
1 5 0
2 0 0
1 2 3 4 -T C B 1 2 3 -T C B 1 2 4 -T C B 1 2 -D C B 1 4 -D C B 1 3 -D C B
Figure A4: Dechlorination profile of the 1st Generation culture of BES-amended natural wetland soil microcosms.
1st Generation CultureNatural Wetland SoilBES Amended
Time (days)
0 20 40 60 80 100
Met
hane
, aqu
eous
con
cent
ratio
n, µ
M
0
2
4
6
8
10
H2,
aque
ous
conc
entra
tion,
nM
0
50
100
150
200
CH4 H2
Figure B4: Methane and hydrogen concentrations of the 1st Generation culture of BES- amended natural wetland soil microcosms.
109
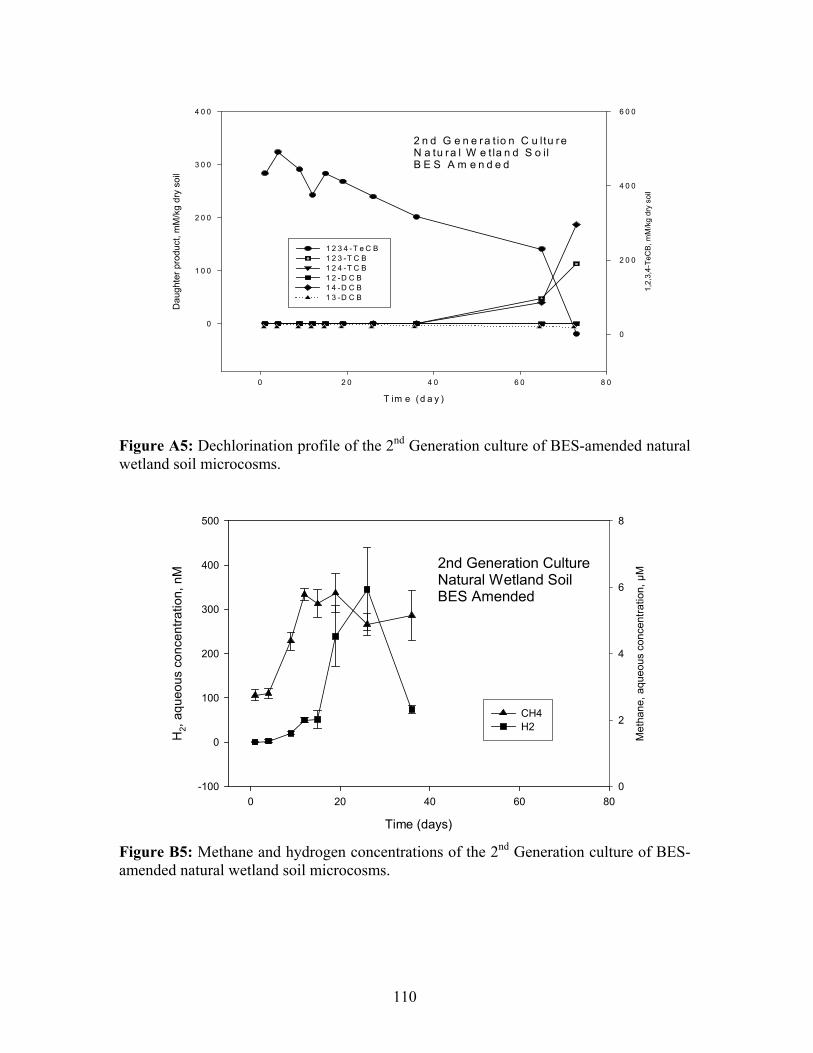
2 n d G e n e ra t io n C u ltu reN a tu ra l W e t la n d S o ilB E S A m e n d e d
T im e (d a y )
0 2 0 4 0 6 0 8 0
1,2,
3,4-
TeC
B, m
M/k
g dr
y so
il
0
2 0 0
4 0 0
6 0 0
Dau
ghte
r pro
duct
, mM
/kg
dry
soil
0
1 0 0
2 0 0
3 0 0
4 0 0
1 2 3 4 -T e C B 1 2 3 -T C B 1 2 4 -T C B 1 2 -D C B 1 4 -D C B 1 3 -D C B
Figure A5: Dechlorination profile of the 2nd Generation culture of BES-amended natural wetland soil microcosms.
2nd Generation CultureNatural Wetland SoilBES Amended
Time (days)
0 20 40 60 80
Met
hane
, aqu
eous
con
cent
ratio
n, µ
M
0
2
4
6
8
H2,
aque
ous
conc
entra
tion,
nM
-100
0
100
200
300
400
500
CH4 H2
Figure B5: Methane and hydrogen concentrations of the 2nd Generation culture of BES- amended natural wetland soil microcosms.
110
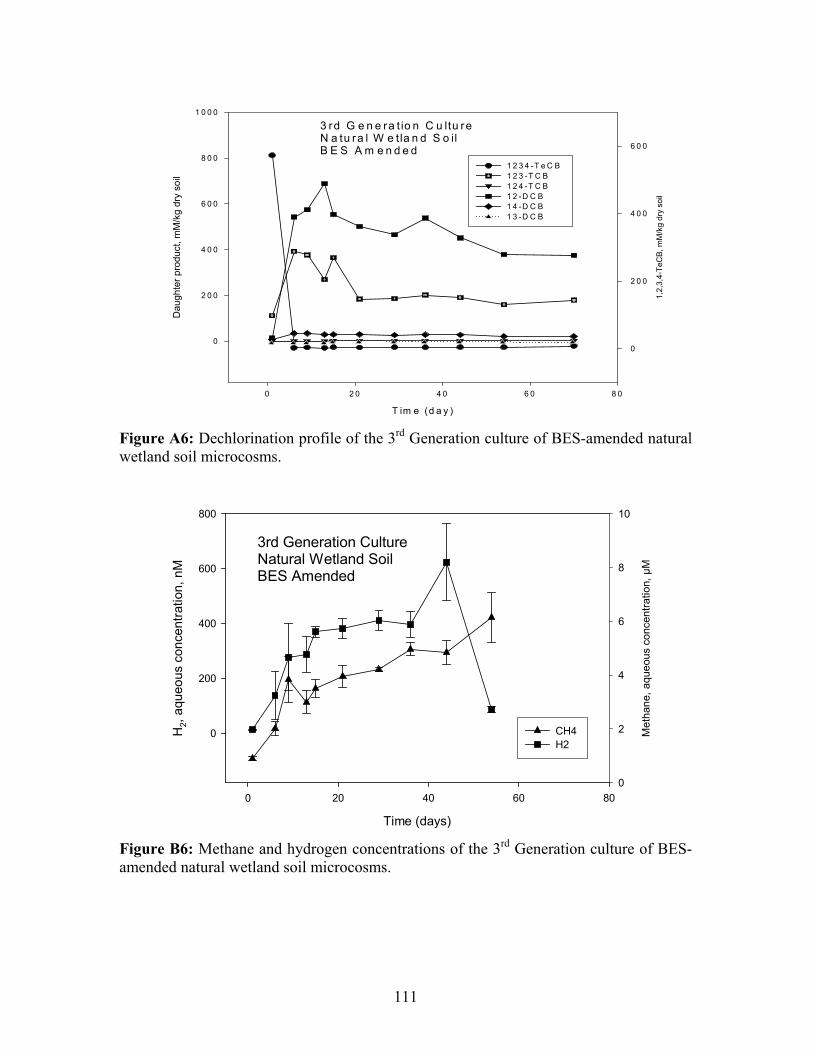
3 rd G e n e ra t io n C u ltu reN a tu ra l W e tla n d S o ilB E S A m e n d e d
T im e (d a y )
0 2 0 4 0 6 0 8 0
1,2,
3,4-
TeC
B, m
M/k
g dr
y so
il
0
2 0 0
4 0 0
6 0 0
Dau
ghte
r pro
duct
, mM
/kg
dry
soil
0
2 0 0
4 0 0
6 0 0
8 0 0
1 0 0 0
1 2 3 4 -T e C B 1 2 3 -T C B 1 2 4 -T C B 1 2 -D C B 1 4 -D C B 1 3 -D C B
Figure A6: Dechlorination profile of the 3rd Generation culture of BES-amended natural wetland soil microcosms.
3rd Generation CultureNatural Wetland Soil BES Amended
Time (days)
0 20 40 60 80
Met
hane
, aqu
eous
con
cent
ratio
n, µ
M
0
2
4
6
8
10
H2,
aque
ous
conc
entra
tion,
nM
0
200
400
600
800
CH4 H2
Figure B6: Methane and hydrogen concentrations of the 3rd Generation culture of BES-amended natural wetland soil microcosms.
111
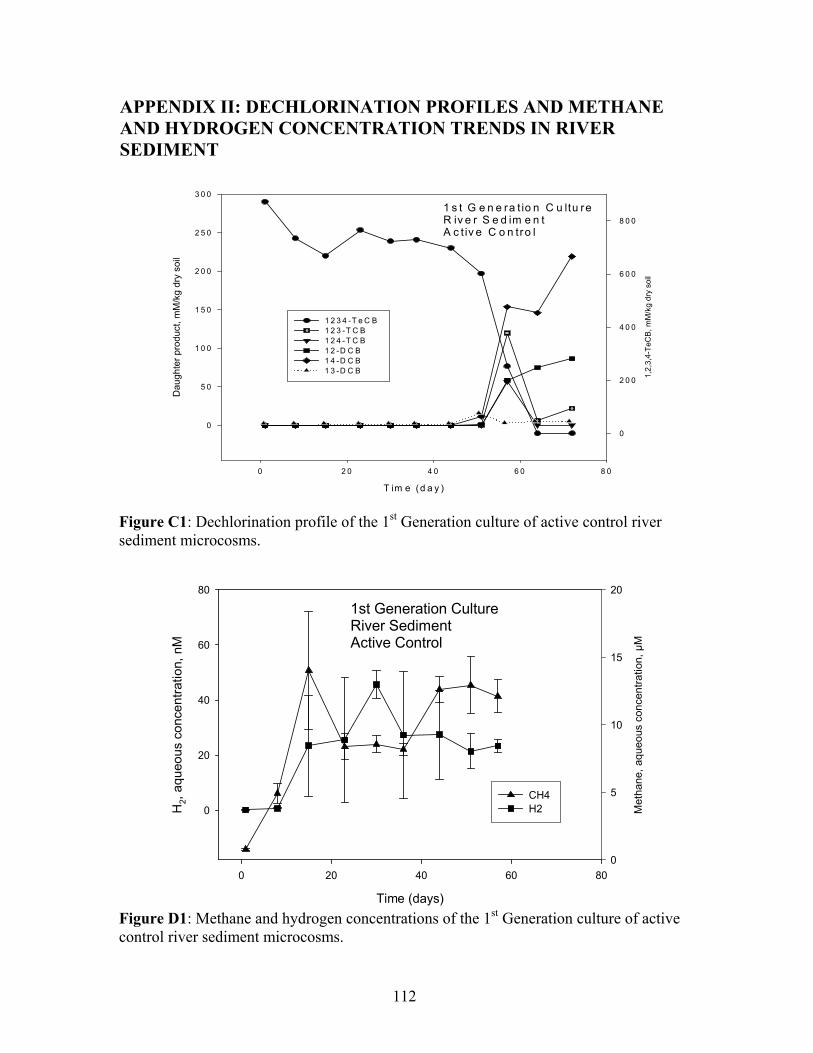
APPENDIX II: DECHLORINATION PROFILES AND METHANE AND HYDROGEN CONCENTRATION TRENDS IN RIVER SEDIMENT
1 s t G e n e ra t io n C u ltu reR iv e r S e d im e n t A c t iv e C o n tro l
T im e (d a y )
0 2 0 4 0 6 0 8 0
1,2,
3,4-
TeC
B, m
M/k
g dr
y so
il
0
2 0 0
4 0 0
6 0 0
8 0 0
Dau
ghte
r pro
duct
, mM
/kg
dry
soil
0
5 0
1 0 0
1 5 0
2 0 0
2 5 0
3 0 0
1 2 3 4 -T e C B 1 2 3 -T C B 1 2 4 -T C B 1 2 -D C B 1 4 -D C B 1 3 -D C B
Figure C1: Dechlorination profile of the 1st Generation culture of active control river sediment microcosms.
1st Generation CultureRiver Sediment Active Control
Time (days)
0 20 40 60 80
Met
hane
, aqu
eous
con
cent
ratio
n, µ
M
0
5
10
15
20
H2,
aque
ous
conc
entra
tion,
nM
0
20
40
60
80
CH4 H2
Figure D1: Methane and hydrogen concentrations of the 1st Generation culture of active control river sediment microcosms.
112
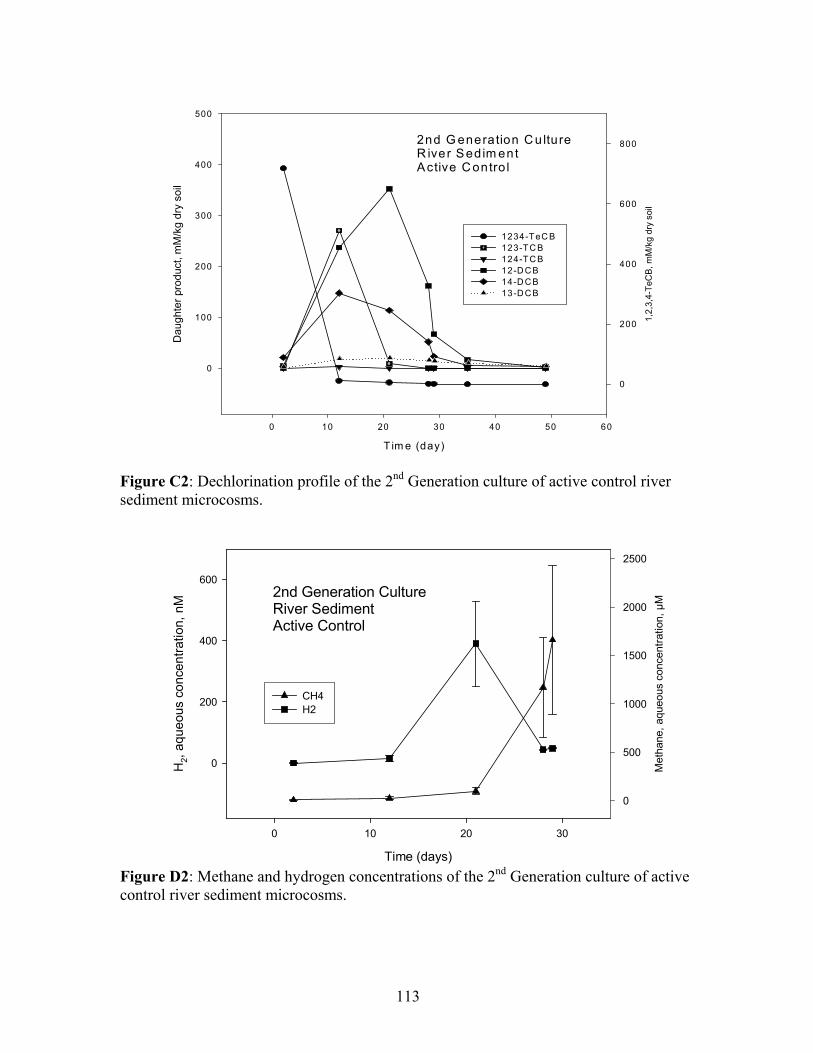
2nd G eneration C u ltureR iver Sedim ent Active C ontro l
T im e (day)
0 10 20 30 40 50 60
1,2,
3,4-
TeC
B, m
M/k
g dr
y so
il
0
200
400
600
800
Dau
ghte
r pro
duct
, mM
/kg
dry
soil
0
100
200
300
400
500
1234-TeC B 123-TC B 124-TC B 12-D CB 14-D CB 13-D CB
Figure C2: Dechlorination profile of the 2nd Generation culture of active control river sediment microcosms.
2nd Generation CultureRiver SedimentActive Control
Time (days)
0 10 20 30
Met
hane
, aqu
eous
con
cent
ratio
n, µ
M
0
500
1000
1500
2000
2500
H2,
aque
ous
conc
entra
tion,
nM
0
200
400
600
CH4 H2
Figure D2: Methane and hydrogen concentrations of the 2nd Generation culture of active control river sediment microcosms.
113
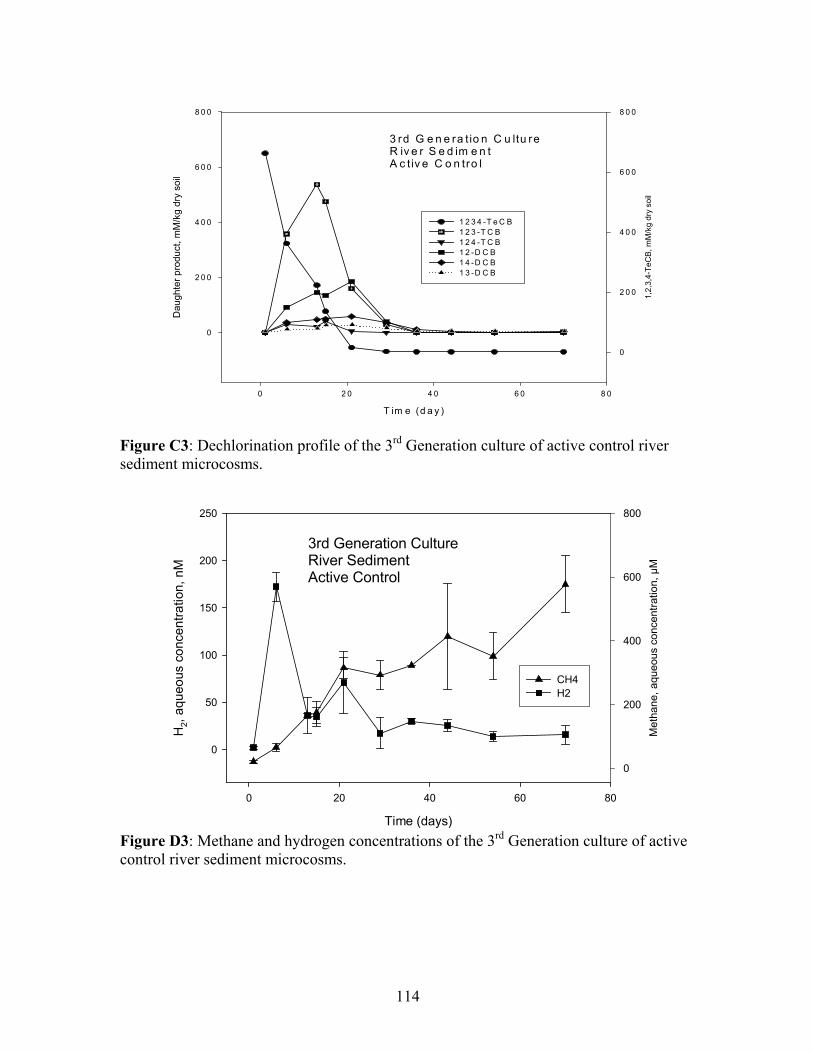
3 rd G e n e ra t io n C u ltu reR iv e r S e d im e n tA c tiv e C o n tro l
T im e (d a y )
0 2 0 4 0 6 0 8 0
1,2,
3,4-
TeC
B, m
M/k
g dr
y so
il
0
2 0 0
4 0 0
6 0 0
8 0 0
Dau
ghte
r pro
duct
, mM
/kg
dry
soil
0
2 0 0
4 0 0
6 0 0
8 0 0
1 2 3 4 -T e C B 1 2 3 -T C B 1 2 4 -T C B 1 2 -D C B 1 4 -D C B 1 3 -D C B
Figure C3: Dechlorination profile of the 3rd Generation culture of active control river sediment microcosms.
3rd Generation CultureRiver Sediment Active Control
Time (days)
0 20 40 60 80
Met
hane
, aqu
eous
con
cent
ratio
n, µ
M
0
200
400
600
800
H2,
aque
ous
conc
entra
tion,
nM
0
50
100
150
200
250
CH4 H2
Figure D3: Methane and hydrogen concentrations of the 3rd Generation culture of active control river sediment microcosms.
114
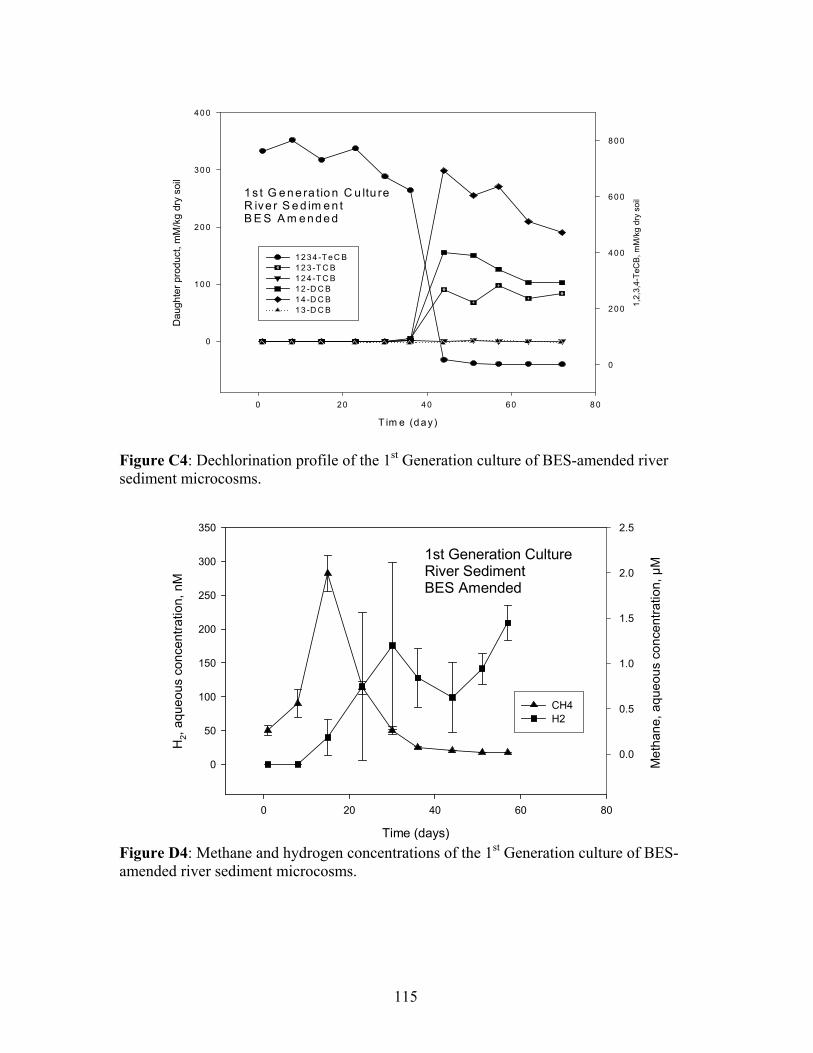
1 s t G e n e ra tio n C u ltu reR ive r S e d im e n t B E S A m e n d e d
T im e (d a y)
0 20 4 0 60 8 0
1,2,
3,4-
TeC
B, m
M/k
g dr
y so
il
0
20 0
40 0
60 0
80 0
Dau
ghte
r pro
duct
, mM
/kg
dry
soil
0
10 0
20 0
30 0
40 0
12 34 -T eC B 12 3 -T C B 12 4 -T C B 12 -D C B 14 -D C B 13 -D C B
Figure C4: Dechlorination profile of the 1st Generation culture of BES-amended river sediment microcosms.
1st Generation CultureRiver Sediment BES Amended
Time (days)
0 20 40 60 80
Met
hane
, aqu
eous
con
cent
ratio
n, µ
M
0.0
0.5
1.0
1.5
2.0
2.5
H2,
aque
ous
conc
entra
tion,
nM
0
50
100
150
200
250
300
350
CH4 H2
Figure D4: Methane and hydrogen concentrations of the 1st Generation culture of BES-amended river sediment microcosms.
115
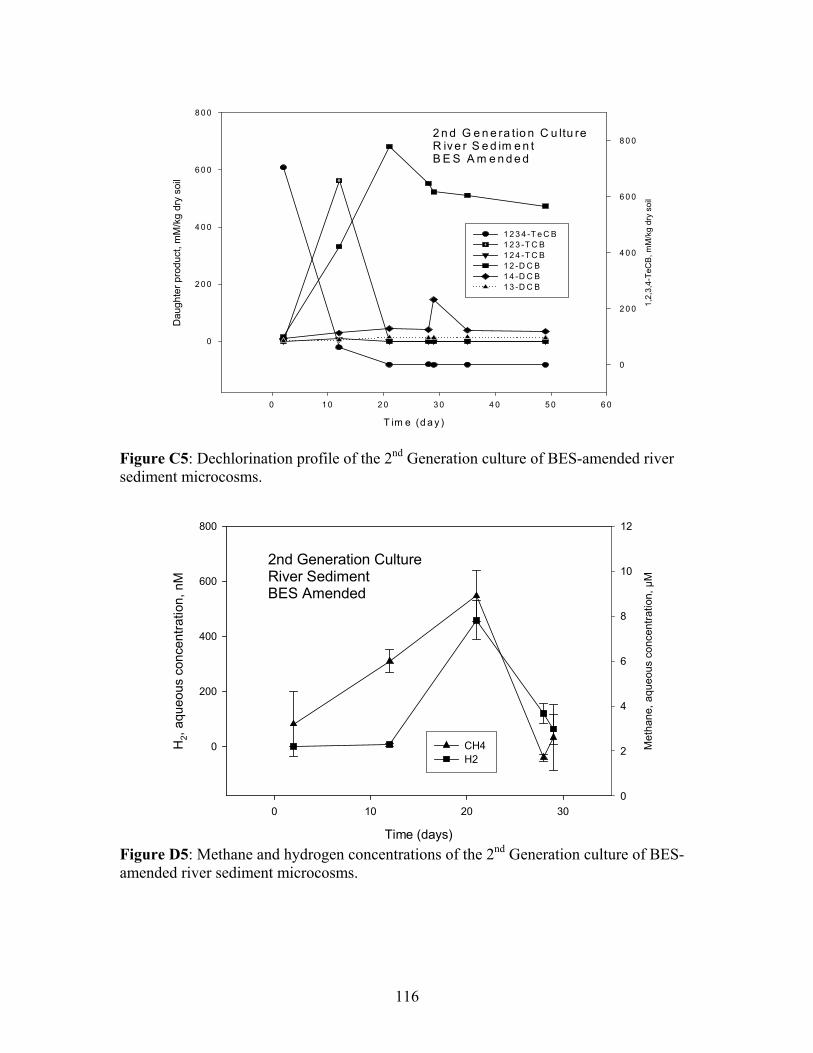
2 n d G e n e ra tio n C u ltu reR iv e r S e d im e n tB E S A m e n d e d
T im e (d a y )
0 1 0 2 0 3 0 4 0 5 0 6 0
1,2,
3,4-
TeC
B, m
M/k
g dr
y so
il
0
2 0 0
4 0 0
6 0 0
8 0 0
Dau
ghte
r pro
duct
, mM
/kg
dry
soil
0
2 0 0
4 0 0
6 0 0
8 0 0
1 2 3 4 -T e C B 1 2 3 -T C B 1 2 4 -T C B 1 2 -D C B 1 4 -D C B 1 3 -D C B
Figure C5: Dechlorination profile of the 2nd Generation culture of BES-amended river sediment microcosms.
2nd Generation CultureRiver Sediment BES Amended
Time (days)
0 10 20 30
Met
hane
, aqu
eous
con
cent
ratio
n, µ
M
0
2
4
6
8
10
12
H2,
aque
ous
conc
entra
tion,
nM
0
200
400
600
800
CH4 H2
Figure D5: Methane and hydrogen concentrations of the 2nd Generation culture of BES-amended river sediment microcosms.
116
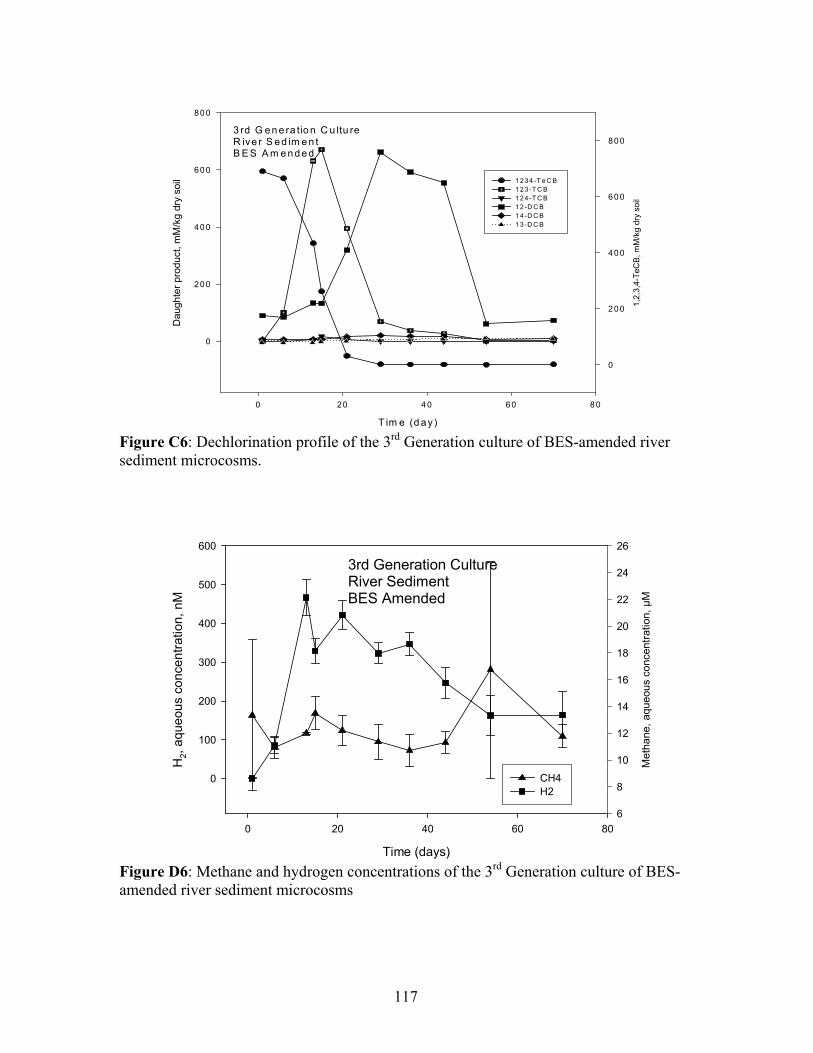
3 rd G e n e ra tio n C u ltu reR ive r S e d im e n t B E S A m e n d e d
T im e (d a y)
0 20 4 0 60 8 0
1,2,
3,4-
TeC
B, m
M/k
g dr
y so
il
0
20 0
40 0
60 0
80 0
Dau
ghte
r pro
duct
, mM
/kg
dry
soil
0
20 0
40 0
60 0
80 0
1 2 3 4 -T e C B 1 2 3 -T C B 1 2 4 -T C B 1 2 -D C B 1 4 -D C B 1 3 -D C B
Figure C6: Dechlorination profile of the 3rd Generation culture of BES-amended river sediment microcosms.
3rd Generation CultureRiver SedimentBES Amended
Time (days)
0 20 40 60 80
Met
hane
, aqu
eous
con
cent
ratio
n, µ
M
6
8
10
12
14
16
18
20
22
24
26
H2,
aque
ous
conc
entra
tion,
nM
0
100
200
300
400
500
600
CH4 H2
Figure D6: Methane and hydrogen concentrations of the 3rd Generation culture of BES-amended river sediment microcosms
117
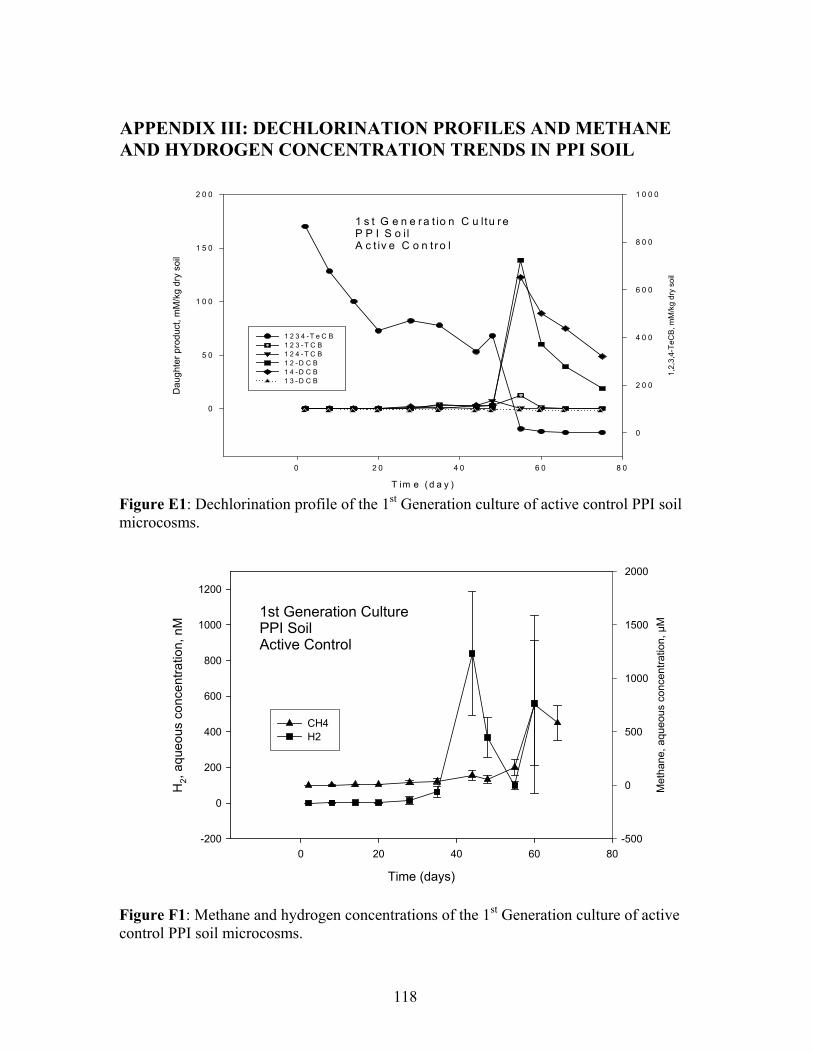
APPENDIX III: DECHLORINATION PROFILES AND METHANE AND HYDROGEN CONCENTRATION TRENDS IN PPI SOIL
1 s t G e n e r a t io n C u ltu r eP P I S o i l A c t iv e C o n t r o l
T im e ( d a y )
0 2 0 4 0 6 0 8 0
1,2,
3,4-
TeC
B, m
M/k
g dr
y so
il
0
2 0 0
4 0 0
6 0 0
8 0 0
1 0 0 0
Dau
ghte
r pro
duct
, mM
/kg
dry
soil
0
5 0
1 0 0
1 5 0
2 0 0
1 2 3 4 -T e C B 1 2 3 - T C B 1 2 4 - T C B 1 2 - D C B 1 4 - D C B 1 3 - D C B
Figure E1: Dechlorination profile of the 1st Generation culture of active control PPI soil microcosms.
1st Generation CulturePPI SoilActive Control
Time (days)
0 20 40 60 80
Met
hane
, aqu
eous
con
cent
ratio
n, µ
M
-500
0
500
1000
1500
2000
H2,
aque
ous
conc
entra
tion,
nM
-200
0
200
400
600
800
1000
1200
CH4 H2
Figure F1: Methane and hydrogen concentrations of the 1st Generation culture of active control PPI soil microcosms.
118
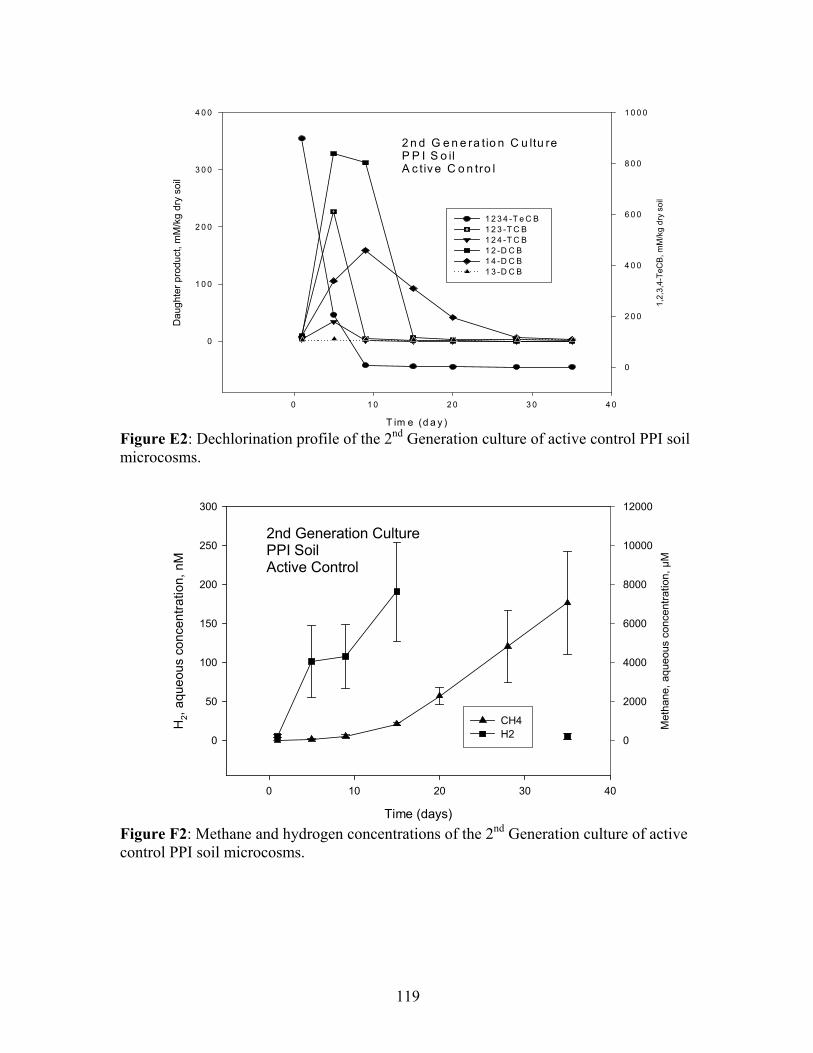
2 n d G e n e ra tio n C u ltu reP P I S o il A c tiv e C o n tro l
T im e (d a y )
0 1 0 2 0 3 0 4 0
1,2,
3,4-
TeC
B, m
M/k
g dr
y so
il
0
2 0 0
4 0 0
6 0 0
8 0 0
1 0 0 0
Dau
ghte
r pro
duct
, mM
/kg
dry
soil
0
1 0 0
2 0 0
3 0 0
4 0 0
1 2 3 4 -T e C B 1 2 3 -T C B 1 2 4 -T C B 1 2 -D C B 1 4 -D C B 1 3 -D C B
Figure E2: Dechlorination profile of the 2nd Generation culture of active control PPI soil microcosms.
2nd Generation CulturePPI SoilActive Control
Time (days)
0 10 20 30 40
Met
hane
, aqu
eous
con
cent
ratio
n, µ
M
0
2000
4000
6000
8000
10000
12000
H2,
aque
ous
conc
entra
tion,
nM
0
50
100
150
200
250
300
CH4 H2
Figure F2: Methane and hydrogen concentrations of the 2nd Generation culture of active control PPI soil microcosms.
119
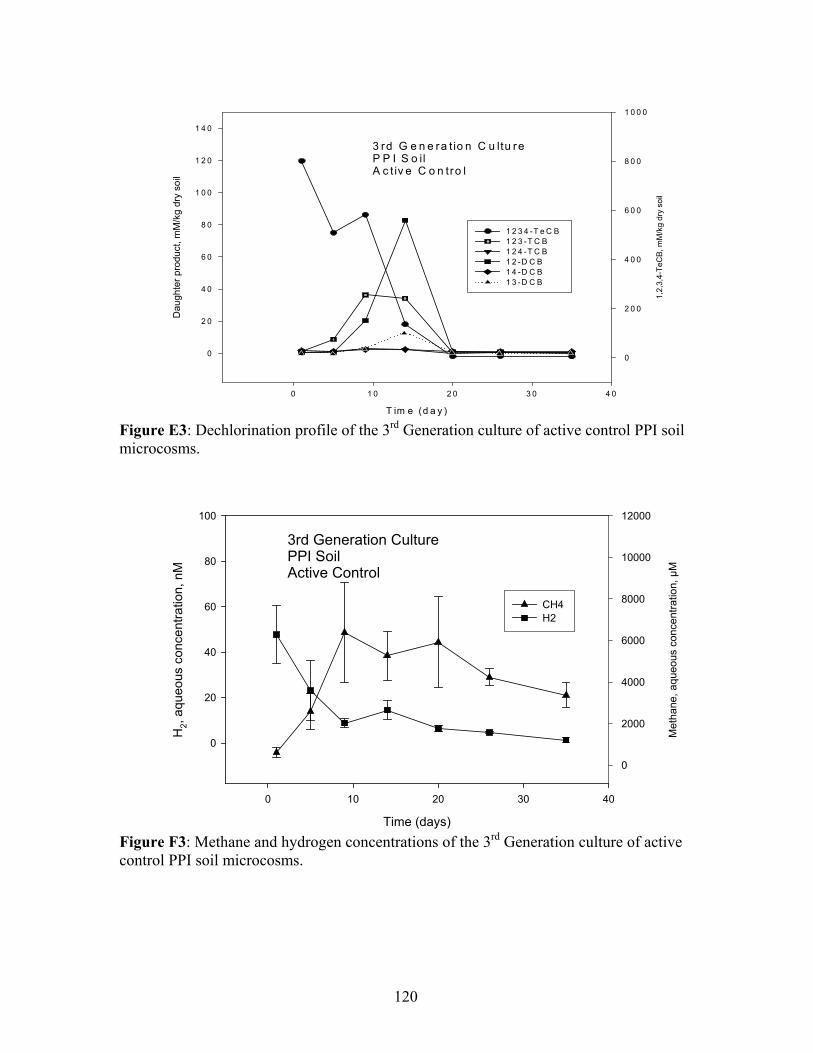
3 rd G e n e ra t io n C u ltu reP P I S o ilA c t iv e C o n tro l
T im e (d a y )
0 1 0 2 0 3 0 4 0
1,2,
3,4-
TeC
B, m
M/k
g dr
y so
il
0
2 0 0
4 0 0
6 0 0
8 0 0
1 0 0 0
Dau
ghte
r pro
duct
, mM
/kg
dry
soil
0
2 0
4 0
6 0
8 0
1 0 0
1 2 0
1 4 0
1 2 3 4 -T e C B 1 2 3 -T C B 1 2 4 -T C B 1 2 -D C B 1 4 -D C B 1 3 -D C B
Figure E3: Dechlorination profile of the 3rd Generation culture of active control PPI soil microcosms.
3rd Generation CulturePPI SoilActive Control
Time (days)
0 10 20 30 40
Met
hane
, aqu
eous
con
cent
ratio
n, µ
M
0
2000
4000
6000
8000
10000
12000
H2,
aque
ous
conc
entra
tion,
nM
0
20
40
60
80
100
CH4 H2
Figure F3: Methane and hydrogen concentrations of the 3rd Generation culture of active control PPI soil microcosms.
120
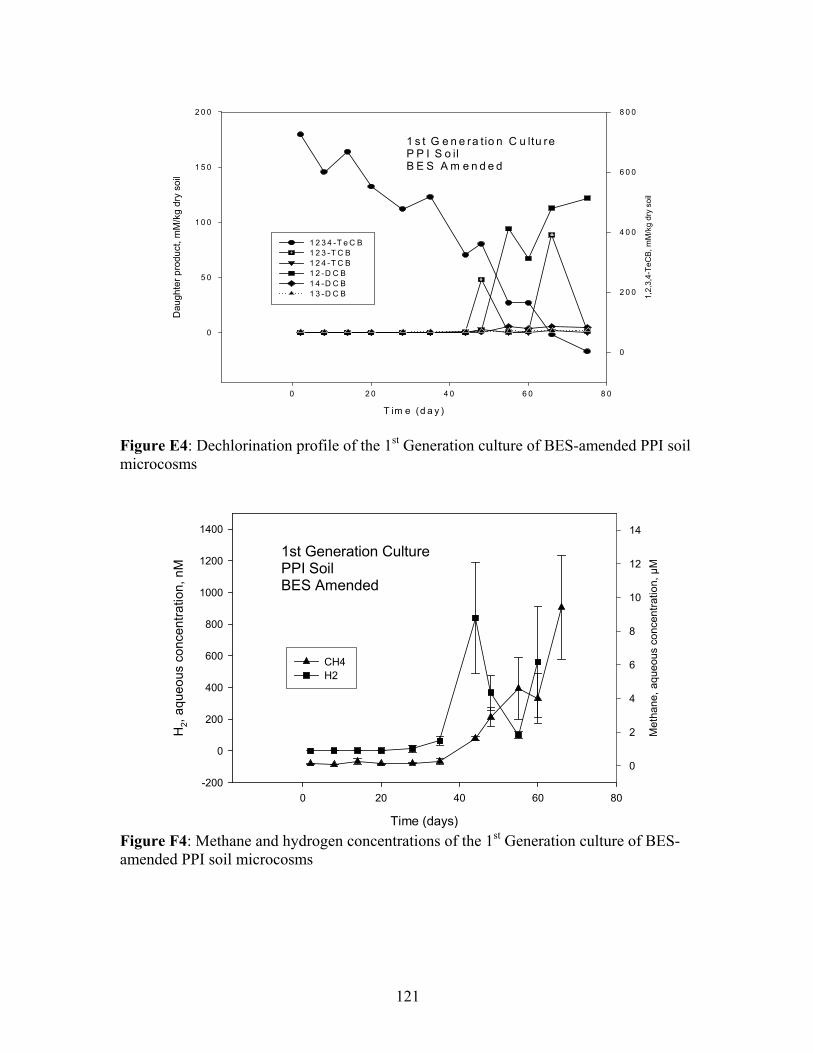
1 s t G e n e ra t io n C u ltu reP P I S o ilB E S A m e n d e d
T im e (d a y )
0 2 0 4 0 6 0 8 0
1,2,
3,4-
TeC
B, m
M/k
g dr
y so
il
0
2 0 0
4 0 0
6 0 0
8 0 0
Dau
ghte
r pro
duct
, mM
/kg
dry
soil
0
5 0
1 0 0
1 5 0
2 0 0
1 2 3 4 -T e C B 1 2 3 -T C B 1 2 4 -T C B 1 2 -D C B 1 4 -D C B 1 3 -D C B
Figure E4: Dechlorination profile of the 1st Generation culture of BES-amended PPI soil microcosms
1st Generation CulturePPI Soil BES Amended
Time (days)
0 20 40 60 80
Met
hane
, aqu
eous
con
cent
ratio
n, µ
M
0
2
4
6
8
10
12
14
H2,
aque
ous
conc
entra
tion,
nM
-200
0
200
400
600
800
1000
1200
1400
CH4 H2
Figure F4: Methane and hydrogen concentrations of the 1st Generation culture of BES-amended PPI soil microcosms
121
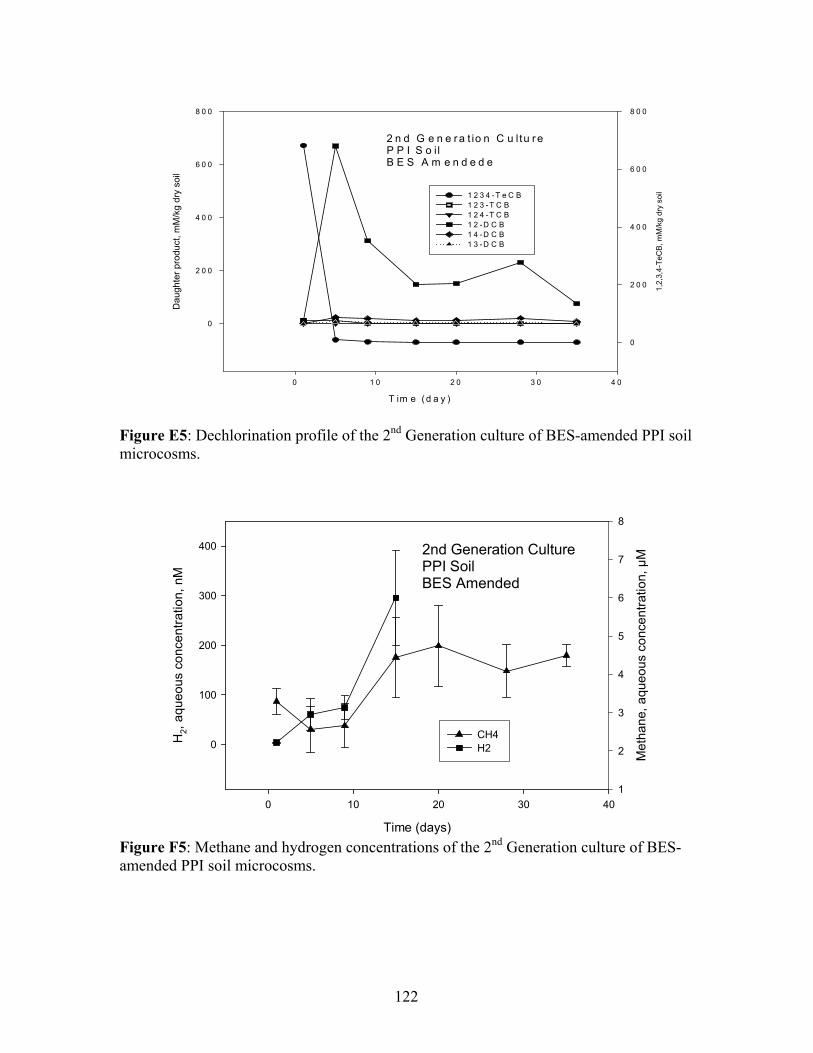
2 n d G e n e r a t io n C u ltu r eP P I S o i l B E S A m e n d e d e
T im e ( d a y )
0 1 0 2 0 3 0 4 0
1,2,
3,4-
TeC
B, m
M/k
g dr
y so
il
0
2 0 0
4 0 0
6 0 0
8 0 0
Dau
ghte
r pro
duct
, mM
/kg
dry
soil
0
2 0 0
4 0 0
6 0 0
8 0 0
1 2 3 4 -T e C B 1 2 3 -T C B 1 2 4 -T C B 1 2 -D C B 1 4 -D C B 1 3 -D C B
Figure E5: Dechlorination profile of the 2nd Generation culture of BES-amended PPI soil microcosms.
2nd Generation CulturePPI Soil BES Amended
Time (days)
0 10 20 30 40
Met
hane
, aqu
eous
con
cent
ratio
n, µ
M
1
2
3
4
5
6
7
8
H2,
aque
ous
conc
entra
tion,
nM
0
100
200
300
400
CH4 H2
Figure F5: Methane and hydrogen concentrations of the 2nd Generation culture of BES-amended PPI soil microcosms.
122
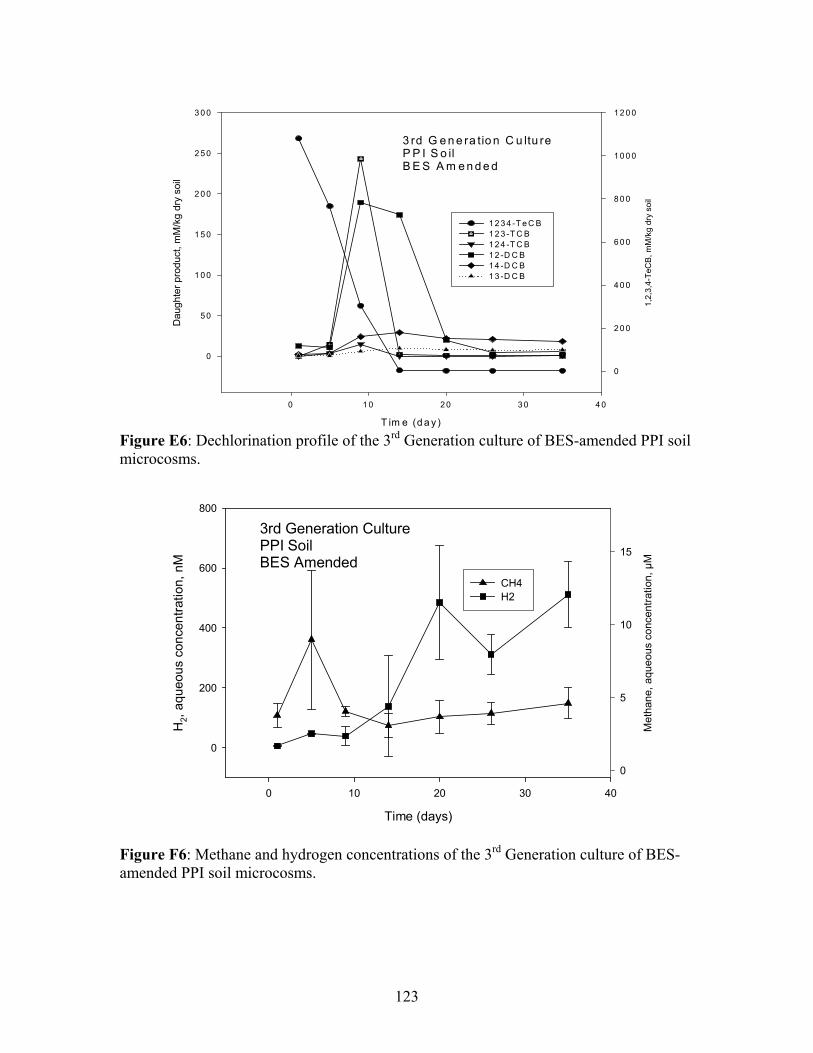
3 rd G e n e ra tio n C u ltu reP P I S o il B E S A m e n d e d
T im e (d a y )
0 1 0 2 0 3 0 4 0
1,2,
3,4-
TeC
B, m
M/k
g dr
y so
il
0
2 0 0
4 0 0
6 0 0
8 0 0
1 0 0 0
1 2 0 0
Dau
ghte
r pro
duct
, mM
/kg
dry
soil
0
5 0
1 0 0
1 5 0
2 0 0
2 5 0
3 0 0
1 2 3 4 -T e C B 1 2 3 -T C B 1 2 4 -T C B 1 2 -D C B 1 4 -D C B 1 3 -D C B
Figure E6: Dechlorination profile of the 3rd Generation culture of BES-amended PPI soil microcosms.
3rd Generation CulturePPI SoilBES Amended
Time (days)
0 10 20 30 40
Met
hane
, aqu
eous
con
cent
ratio
n, µ
M
0
5
10
15
H2,
aque
ous
conc
entra
tion,
nM
0
200
400
600
800
CH4 H2
Figure F6: Methane and hydrogen concentrations of the 3rd Generation culture of BES-amended PPI soil microcosms.
123
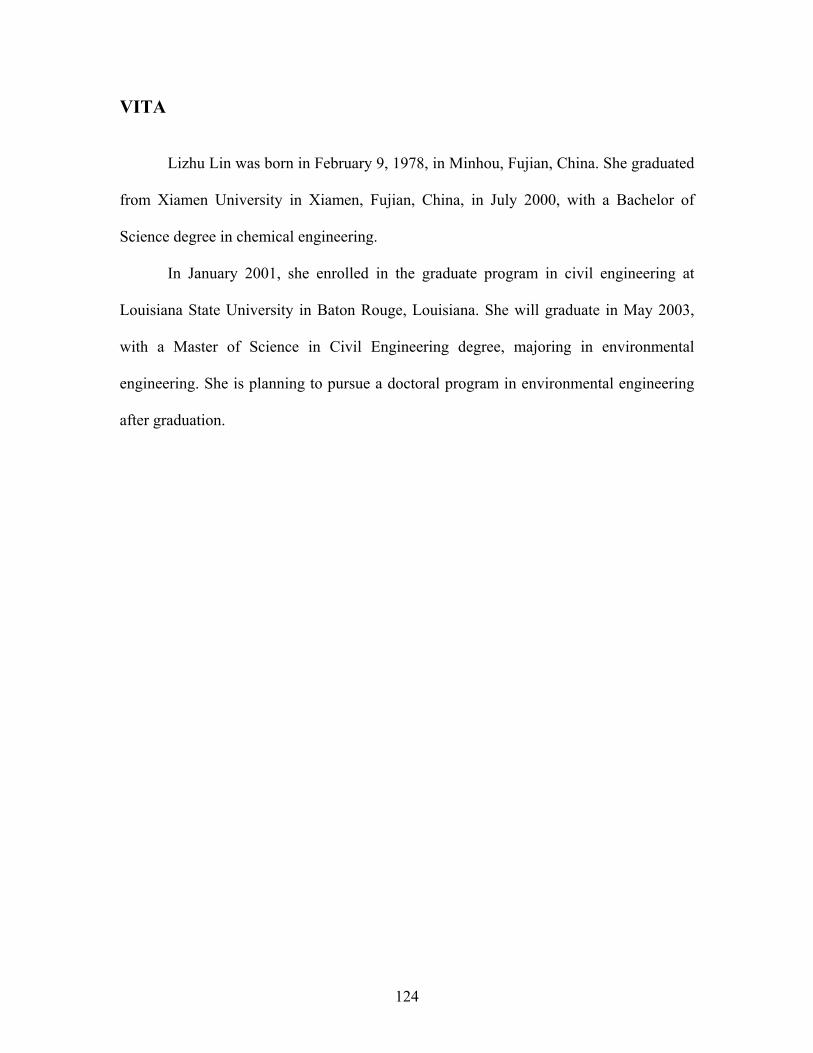
124
VITA
Lizhu Lin was born in February 9, 1978, in Minhou, Fujian, China. She graduated
from Xiamen University in Xiamen, Fujian, China, in July 2000, with a Bachelor of
Science degree in chemical engineering.
In January 2001, she enrolled in the graduate program in civil engineering at
Louisiana State University in Baton Rouge, Louisiana. She will graduate in May 2003,
with a Master of Science in Civil Engineering degree, majoring in environmental
engineering. She is planning to pursue a doctoral program in environmental engineering
after graduation.