Embed Size (px)
Citation preview

Decentralised Wastewater Treatment Systems: System Monitoring and Validation Ashok Sharma, Meng Nan Chong, Peter Schouten, Stephen Cook, Angel Ho, Ted Gardner, Shiv Umapathi, Tim Sullivan Andrew Palmer and Geoff Carlin
July 2012
Urban Water Security Research Alliance Technical Report No. 70
Urban Water Security Research Alliance Technical Report ISSN 1836-5566 (Online)
Urban Water Security Research Alliance Technical Report ISSN 1836-5558 (Print)
The Urban Water Security Research Alliance (UWSRA) is a $50 million partnership over five years between the
Queensland Government, CSIRO’s Water for a Healthy Country Flagship, Griffith University and The
University of Queensland. The Alliance has been formed to address South East Queensland's emerging urban
water issues with a focus on water security and recycling. The program will bring new research capacity to South
East Queensland tailored to tackling existing and anticipated future issues to inform the implementation of the
Water Strategy.
For more information about the:
UWSRA - visit http://www.urbanwateralliance.org.au/
Queensland Government - visit http://www.qld.gov.au/
Water for a Healthy Country Flagship - visit www.csiro.au/org/HealthyCountry.html
The University of Queensland - visit http://www.uq.edu.au/
Griffith University - visit http://www.griffith.edu.au/
Enquiries should be addressed to:
The Urban Water Security Research Alliance Project Leader – Ashok Sharma
PO Box 15087 CSIRO Land and Water
CITY EAST QLD 4002 HIGHETT VIC 3190
Ph: 07-3247 3005 Ph: 03- 9252 6151
Email: [email protected] Email: [email protected]
Authors: CSIRO
Sharma, A., Chong, M.N., Schouten, P., Cook, S., Ho, A., Gardner, T., Umapathi, S., Sullivan, T., Palmer, A.
and Carlin, G. (2012). Decentralised Wastewater Treatment Systems: System Monitoring and Validation. Urban
Water Security Research Alliance Technical Report No. 70.
Copyright
© 2012 CSIRO. To the extent permitted by law, all rights are reserved and no part of this publication covered by
copyright may be reproduced or copied in any form or by any means except with the written permission of
CSIRO.
Disclaimer
The partners in the UWSRA advise that the information contained in this publication comprises general
statements based on scientific research and does not warrant or represent the accuracy, currency and
completeness of any information or material in this publication. The reader is advised and needs to be aware that
such information may be incomplete or unable to be used in any specific situation. No action shall be made in
reliance on that information without seeking prior expert professional, scientific and technical advice. To the
extent permitted by law, UWSRA (including its Partner’s employees and consultants) excludes all liability to
any person for any consequences, including but not limited to all losses, damages, costs, expenses and any other
compensation, arising directly or indirectly from using this publication (in part or in whole) and any information
or material contained in it.
Cover Photograph:
Description: Decentralised wastewater treatment systems - Aerobic bio-filter (left); Membrane bioreactor (right)
Photographer: Meng Nan Chong
© CSIRO

Decentralised Wastewater Treatment Systems: System Monitoring and Validation Page i
ACKNOWLEDGEMENTS
This research was undertaken as part of the South East Queensland Urban Water Security Research
Alliance, a scientific collaboration between the Queensland Government, CSIRO, The University of
Queensland and Griffith University.
Particular thanks go to the members of the Project Reference Group for SEQ Decentralised Project for
their always accessible and valuable inputs, advice and assistance to this work. Special thanks are
dedicated to Gary McOmish (Body Corporate Capo di Monte) and Chris Walton (Body Corporate
Currumbin Ecovillage) for their help in seeking the access to the decentralised water and wastewater
systems as well as sharing valuable data and information. Similar gratitude also goes to Jeff Foley
(University of Queensland), David de Haas (GHD Engineering), Ben Kele (University of Central
Queensland), Damien Stiler (Bligh Tanner), Dominic Xavier (SSI), Eric van Driel (Aquatec Maxcon)
and Barry Hood (ex DERM) for their valuable contributions.

Decentralised Wastewater Treatment Systems: System Monitoring and Validation Page ii
FOREWORD
Water is fundamental to our quality of life, to economic growth and to the environment. With its
booming economy and growing population, Australia's South East Queensland (SEQ) region faces
increasing pressure on its water resources. These pressures are compounded by the impact of climate
variability and accelerating climate change.
The Urban Water Security Research Alliance, through targeted, multidisciplinary research initiatives,
has been formed to address the region’s emerging urban water issues.
As the largest regionally focused urban water research program in Australia, the Alliance is focused on
water security and recycling, but will align research where appropriate with other water research
programs such as those of other SEQ water agencies, CSIRO’s Water for a Healthy Country National
Research Flagship, Water Quality Research Australia, eWater CRC and the Water Services
Association of Australia (WSAA).
The Alliance is a partnership between the Queensland Government, CSIRO’s Water for a Healthy
Country National Research Flagship, The University of Queensland and Griffith University. It brings
new research capacity to SEQ, tailored to tackling existing and anticipated future risks, assumptions
and uncertainties facing water supply strategy. It is a $50 million partnership over five years.
Alliance research is examining fundamental issues necessary to deliver the region's water needs,
including:
ensuring the reliability and safety of recycled water systems.
advising on infrastructure and technology for the recycling of wastewater and stormwater.
building scientific knowledge into the management of health and safety risks in the water supply
system.
increasing community confidence in the future of water supply.
This report is part of a series summarising the output from the Urban Water Security Research
Alliance. All reports and additional information about the Alliance can be found at
http://www.urbanwateralliance.org.au/about.html.
Chris Davis
Chair, Urban Water Security Research Alliance

Decentralised Wastewater Treatment Systems: System Monitoring and Validation Page iii
CONTENTS
Acknowledgements .............................................................................................................. i
Foreword .............................................................................................................................. ii
Executive Summary ............................................................................................................. 1
1. Introduction ................................................................................................................. 3
2. Methodology ............................................................................................................... 5
2.1. Decentralised Wastewater Treatment Systems .................................................................. 5
2.2. Research Methodology Overview ........................................................................................ 5
2.3. Process Details of the Case Study Cluster Scale Wastewater Treatment and Recycling Plants .................................................................................................................. 6 2.3.1 Capo Di Monte Case Study .............................................................................................. 7 2.3.2 The Currumbin Ecovillage Case Study ............................................................................. 9
2.4 Instrumentation, Sample Collection and Analysis ............................................................. 11
2.5 Data Analysis Period.......................................................................................................... 14
2.6 Process Modelling .............................................................................................................. 14
2.7 Investigating Total Carbon Footprint of Treatment Plants ................................................. 14
2.8 Feasibility Study on using Advanced Oxidation Technologies for Decentralised Wastewater Treatment....................................................................................................... 14
2.9 Assessment of Spatial Suitability for Decentralised Wastewater Reuse Systems in South East Queensland ..................................................................................................... 15 2.9.1 Background .................................................................................................................... 15 2.9.2 Suitability Factors for Decentralised Wastewater Systems ............................................. 15 2.9.3 Methodology Summary ................................................................................................... 17
3. Results and Discussion ........................................................................................... 19
3.1. Water Balance and Self-Sufficiency Analysis .................................................................... 19 3.1.1. Capo Di Monte ................................................................................................................ 19 3.1.2. Currumbin Ecovillage ..................................................................................................... 22
3.2. Modelling of the System Reliability and Robustness ......................................................... 22 3.2.1. Wastewater Characteristics - Capo di Monte.................................................................. 22 3.2.2. @RISK Modelling – Capo di Monte ................................................................................ 23 3.2.3. BioWin® Modelling – Capo di Monte .............................................................................. 25
3.3. Monitoring the Energy Consumption of Decentralised Wastewater Systems ................... 27 3.3.1. Capo di Monte ................................................................................................................ 27 3.3.2. Currumbin Ecovillage ..................................................................................................... 30
3.4 Environmental Impact - Carbon Footprint .......................................................................... 33 3.4.1 Capo di Monte Total Carbon Footprint ........................................................................... 33 3.4.2 Currumbin Ecovillage Total Carbon Footprint ................................................................. 33 3.4.3 Fugitive Greenhouse Gas Total Carbon Footprint Component - Measured Direct
Emissions ....................................................................................................................... 34
4. Conclusion ................................................................................................................ 39
Appendix 1. Discharge Licences of Capo Di Monte and the Currumbin Ecovillage Treatment Plants ....................................................................................................... 41
Appendix 2: Feasibility Study on Using Advanced Oxidation Technologies for Decentralised Wastewater Treatment ..................................................................... 42
Appendix 3: Spatial Suitability for Decentralised Reuse Systems – Literature Review, Land Suitability, Multi Criteria Evaluation and Data ................................. 53
Appendix 4: Presentation and Publication in Urban Water Security Research Alliance Science Forum ........................................................................................... 58
References ......................................................................................................................... 65

Decentralised Wastewater Treatment Systems: System Monitoring and Validation Page iv
LIST OF FIGURES
Figure 1: Schematic of the methodology applied to evaluate the factors for wastewater treatment and
recycling system selection. ................................................................................................................ 6 Figure 2: Schematic of the Capo Di Monte hydraulic circuit (courtesy Bligh Tanner P/L). ................................ 7 Figure 3: Schematic of the Capo Di Monte wastewater treatment and recycling plant. .................................... 8 Figure 4: Capo Di Monte wastewater treatment and recycling plant building (external view). .......................... 9 Figure 5: Schematic of the Currumbin Ecovillage hydraulic circuit (courtesy Bligh Tanner P/L). ...................... 9 Figure 6: Schematic of the Currumbin Ecovillage wastewater treatment plant. .............................................. 10 Figure 7: Photos of the textile filters in the Currumbin Ecovillage wastewater treatment and recycling
plant. ................................................................................................................................................ 11 Figure 8: Sampling locations in the Capo Di Monte wastewater treatment and recycling plant. Yellow
dots are sampling locations. ............................................................................................................ 12 Figure 9: Framework for spatial suitability assessment for decentralised wastewater systems at the
regional scale. ................................................................................................................................. 18 Figure 10: The overall water balance and self-sufficiency analysis at Capo di Monte over the period
March 2010 to March 2012. ............................................................................................................. 19 Figure 11: The breakdown of potable (harvested rainwater) and non-potable (treated sewage effluent)
demand at Capo di Monte. .............................................................................................................. 19 Figure 12: Breakdown of potable and non-potable water demands for different end-uses. .............................. 20 Figure 13: Average daily per capita water usage at Capo di Monte and a breakdown of its sources. .............. 20 Figure 14: The influence of seasonal variation on the demand of treated sewage effluent at Capo di
Monte. ............................................................................................................................................. 21 Figure 15: Diurnal water demand pattern for the decentralised system at Capo di Monte. .............................. 21 Figure 16: The overall recycled water balance and self-sufficiency analysis at Currumbin Ecovillage. ............ 22 Figure 17: Probability of exceedance against the EPA approved treated effluent quality limits. (a) Total
nitrogen (TN); (b) Total phosphorus (TP). Both Y-axes refer to the probability density
function; whole X-axes refer to the nutrient concentrations. The grey bars refer to the
experimental values; and blue line refers to the fitting with log-normal function. ............................. 24 Figure 18: Simplified process schematic in BioWin® simulation model. WAS represents the waste
activated sludge stream. .................................................................................................................. 26 Figure 19: Daily energy consumption of the decentralised wastewater system at Capo di Monte from
March 2010 to March 2012. ............................................................................................................. 27 Figure 20: Breakdown of specific energy requirement by the decentralised wastewater system at Capo
di Monte. (a) Before optimisation. (b) After optimisation. ................................................................. 28 Figure 21: The time variation in specific energy requirement for the chlorine mixing pump and the
residual chlorine concentration measured in the holding tank at Capo di Monte. ............................ 29 Figure 22: Seasonal variation in the daily energy requirement for treating wastewater at Capo di Monte
(before the optimisation of the chlorine mixing system). .................................................................. 30 Figure 23: Seasonal variation in the specific energy requirement for treating wastewater at Capo di
Monte (before the optimisation of the chlorine mixing system). ....................................................... 30 Figure 24: Daily energy usage by the decentralised wastewater system at Currumbin Ecovillage over a
12-month period. ............................................................................................................................. 31 Figure 25: Breakdown of specific energy requirement for the decentralised wastewater system at
Currumbin Ecovillage. The UV disinfection unit was not operational during the 12 month
monitoring period. ............................................................................................................................ 31 Figure 26: Seasonal variation in the daily energy requirement for treating wastewater at Currumbin
Ecovillage. ....................................................................................................................................... 32 Figure 27: Seasonal variation in the specific energy requirement for treating wastewater at Currumbin
Ecovillage. ....................................................................................................................................... 32 Figure 28: A) The CDM MBR aeration tank (the MBR is submerged in the sewage on the left hand side
of the photograph); B) The CDM MBR anoxic tank with the sludge stirrer in operation. .................. 34 Figure 29: Example deployment of the gas analysis system in the field – A) The flux hood on top of the
CDM MBR aeration tank; B) The gas analysis and data collection workstation. ............................. 35 Figure 30: A) Average daily CH4 emission (converted to its CO2 equivalent value) from the CDM MBR
during normal operation, after a shutdown period (~ 2 hours) and following surface watering
with recycled effluent. B) Average daily N2O emission (converted to its CO2 equivalent
value). .............................................................................................................................................. 38

Decentralised Wastewater Treatment Systems: System Monitoring and Validation Page v
LIST OF TABLES
Table 1: Parameters measured at the seven sampling locations at the Capo Di Monte wastewater
treatment and recycling plant. ......................................................................................................... 13 Table 2: Summary of license requirements, measured influent wastewater qualities at CDM-STP and
its comparison with common values from centralised WWTPs. ...................................................... 23 Table 3: A summary of the EPA approved treated effluent quality limits, mean and standard deviation
of sampled effluent quality and the probability of exceedance for the decentralised
wastewater system at CDM. ............................................................................................................ 25 Table 4: Treatment process peripheral water quality metadata and average raw fugitive emissions for
the MBR system. ............................................................................................................................. 34

Decentralised Wastewater Treatment Systems: System Monitoring and Validation Page 1
EXECUTIVE SUMMARY
Decentralised water reuse systems can potentially provide a sustainable and continuous source of high
quality non-potable water for urban and suburban communities. Due to their relatively small spatial
and carbon footprints, these systems have a greatly reduced environmental impact as they do not
discharge effluent into waterways. In addition, each decentralised system can be tailor-made to suit
local climatic conditions, aesthetic requirements, water quality objectives and end uses. There is also a
potential to reduce the costs associated with water and wastewater transportation, which otherwise
would be necessary for connection to distant centralised treatment plants.
However, there is a significant lack of scientific knowledge on decentralised water recycling systems
in relation to their technology efficiency, operational robustness, performance, reliability, operating
costs and greenhouse gas footprint. This study enhanced knowledge on these aspects through the
monitoring of two operating full-scale decentralised wastewater treatment plants, Capo di Monte and
the Currumbin Ecovillage, located in South East Queensland (SEQ). These plants use a range of
different advanced technologies including membrane bioreactors (MBR), membrane filtration
(microfiltration) and biofilm textile filters. They service urban developments ranging from small (50
lots) to medium-scale (172 lots). Although different treatment technologies have been employed at the
facilities, both plants produce an effluent meeting Class A+ recycled water standards. Gas, liquid and
solid samples were obtained to assess water quality during the treatment processes, to calibrate the
treatment models used in this study, and to evaluate fugitive greenhouse gas emissions. Meters were
also installed to measure water flows and energy consumption. In addition, a treatment analysis model
(BioWin) and risk model (@Risk) were used to identify the effect of changes to daily operational
parameters on system performance, robustness, and overall environmental impact using virtual
experimentation. These outcomes should assist decision-makers in the selection of appropriate
decentralised technologies for water recycling in greenfield urban developments.
The suitability of decentralised water reuse schemes for greenfield developments depends upon many
site specific factors. A GIS-based assessment methodology was therefore developed using criteria that
included: 1) existing and planned water and wastewater service infrastructure and capacity; 2) spatial
suitability; 3) soil and hydrogeological suitability; and 4) potential system self-sufficiency.
Over a monitoring period of 24 months, it was determined that the decentralised systems at Capo di
Monte and the Currumbin Ecovillage operated under a continuous high-level of water self-sufficiency
of over 90%. This figure represents the percentage of the community’s (potable and non potable)
water demand that was met by rainwater harvesting and wastewater recycling. The remaining shortfall
of 7% was supplied by a local groundwater bore.
Monitoring of electricity consumption was conducted over a 24-month period and the specific energy
use at Capo di Monte and the Currumbin Ecovillage wastewater treatment and recycling plants were
17.1 and 1.67 kilowatt hours per kilolitre (kWh/kL) respectively.
In the case of Capo di Monte, the initial high specific energy consumption of 17.1 kWh/kL was
primarily due to the energy intensive chlorine mixing pump in the recycled water tank, with a specific
energy consumption of around 9.5 kWh/kL. During the monitoring period at Capo di Monte, changes
were made to the system to increase the sustainability of the treatment process. This centrifugal pump
was considered to be oversized, and it was suggested that operating the pump through an automated
timer running over staggered intervals should prove to be a more energy- and cost-effective option. As
a result, action was taken by the scheme owners and an automated timing device was introduced to
better manage electricity consumption. Subsequent monitoring of the system showed a significant
reduction in energy consumption, with a specific energy use of 11 kWh/kL.
Operation of Capo di Monte and Currumbin Ecovillage wastewater treatment and recycling plants
contributes to global greenhouse gas (GHG) emissions. This study has calculated the energy related
emissions of Capo di Monte to be 16.4 kg CO2-e/kL prior to modifications to the operation of the

Decentralised Wastewater Treatment Systems: System Monitoring and Validation Page 2
chlorine mixing pump. After modification, the emission levels reduced to 9.6 kg CO2-e/kL. The
Currumbin Ecovillage plant emitted far less equivalent energy related GHG emissions, releasing an
estimated 2.0 kg CO2-e/kL. This was due to the contrasting treatment processes involved at these
treatment plants. The treatment plant at Capo di Monte included a membrane bioreactor and UV
disinfection, while Currumbin Ecovillage plant included septic tank, recirculation tank, biofiltration,
microfiltration and UV disinfection. Energy consumption in the membrane biorector was significantly
high. However, when fugitive gas emissions in the two treatment systems were estimated, based on
theoretical calculations using first principle approaches, the overall ecological footprint was not too
different for the Capo di Monte and Currumbin Ecovillage plants. In comparison, centralised sewage
treatment plants studied by de Haas (2009) show an average emission level of 0.23 and
0.82 kg CO2-e/kL for plant capacities of >100 ML/d and <10 ML/d, respectively, based on primary
energy consumption.
In order to gain an insight into the total GHG emission footprint, direct measurements of fugitive
methane and nitrous oxide emissions from the anoxic and aerobic sections of the Capo di Monte MBR
system were performed using infrared gas analysis. We found that peak levels of methane
(0.188 t CO2-e/year) were emitted after a 2-hour site shutdown period, and peak levels of nitrous oxide
(0.06 t CO2-e/year) were emitted when the MBR system was working under normal aerated
conditions. These measured results differed substantially from modelled estimations made for the site.
As such, we recommend that GHG emission models originally developed for large-scale wastewater
treatment plants should be calibrated using in situ measurements to ensure their accuracy and
applicability when used for decentralised systems.
Decentralised Wastewater Treatment Systems: System Monitoring and Validation Page 3
1. INTRODUCTION
The World Commission on Water (2000), using various projection methods, estimated that by 2025,
the four billion people living in urban areas, approximately half the world’s population, will lack
sustainable water resources. The study also raised the issues that significant financial cost would be
required to supply additional water resources through the implementation of new water infrastructures
such as seawater desalination plants. The demand on urban water supply off the grid in Australia is
also escalating due to rapid urbanisation, industrialisation, increased commercial activities and likely
impacts of climate change. This is further exacerbated by rapid population growth, which would have
a direct impact on meeting the drinking water supply demand, wastewater treatment and disposal. For
South East Queensland (SEQ), Australia, alone, a population growth of 1.5 million by 2031 has been
projected, which will be a major challenge to the local water utilities to provide urban water services.
To accommodate the increasing water demand, it has been highlighted that additional water supply
infrastructure will be constructed by 2020 (Queensland Government, 2005). In the traditional “end-of-
pipe” solutions for water servicing, additional clean water sources from drinking water catchments and
wastewater handling would be required. The existing centralised water and wastewater system
capacities would also be expanded to meet the increase in flows. However, these options will incur
high capital costs to construct new infrastructure and/or upgrade existing systems.
To help resolve these issues, recycling of wastewater at a local scale, treated to Class A+ water quality
standards, is a viable solution to augment non-potable uses at the household scale. Previous studies
have shown that water recycling could accommodate a significant amount of non-potable water
demand (ie. toilet flushing, washing machines, irrigation and other external uses) and thus, provide a
fit-for-purpose solution for wastewater handling. Peter-Varbanets et al. (2009) reported that only a
small fraction of mains water is used for potable consumption (ie. drinking and cooking), with the
majority used for non-potable applications. While the centralised water recycling infrastructures could
provide a well understood, traditional solution to the water resources problem, it will involve large
capital investment that, in turn, requires objective decision-making by the water management
authorities. In view of this, decentralised water and wastewater systems have been reconsidered due to
their technological advancement, and are regarded as an important element in the urban water cycle
where they can provide a transitional solution to accommodate urban population growth
(Tjandraatmadja et al. 2009). In the Integrated Urban Water Management (IUWM) concept,
decentralised systems can be deployed either as standalone systems or integrated with the current
centralised systems to provide a sustainable water and wastewater servicing in the urban environment
(Sharma et al. 2010). Potentially, decentralisation of water and wastewater servicing could also help in
saving the huge capital investment required for the expansion of large conveyance infrastructure and
the upgrade of new centralised pipe networks. Decentralisation also helps in reducing the
environmental impact of wastewater discharge into natural waterways.
In the past, decentralised systems were largely being viewed as an alternative to centralised systems
for remote or peri urban developments. With the emergence of various advanced treatment
technologies, a greater flexibility in process selection and intended end-uses allows increased adoption
of decentralised systems for urbanised applications. However, the selection of treatment technologies
for decentralised applications will depend on the intended end-use water quality for production of a fit-
for-purpose alternative water source. For instance, the removal of organic pollutants can be achieved
using conventional activated sludge processes, membrane bioreactor (MBR) or biofilm processes.
Anoxic reactors can be positioned before, after, or merged with aerobic tanks for denitrification
processes. Chemical disinfection can be performed using hypochlorite solution or chlorine dioxide
which has to be generated on-site. At present, the major limitations to the wider uptake of
decentralised systems are the lack of knowledge and information on technology selection and its
stable, cost-effective and sustainable operation. These knowledge limitations include issues such as
self-sufficiency in water supply, treatment efficiency, system reliability and robustness, capital and
operating costs, specific energy for treatment technologies, and overall carbon sustainability.
Decentralised Wastewater Treatment Systems: System Monitoring and Validation Page 4
In this report, five different objectives were addressed systematically through the research activities at
two decentralised systems located in SEQ. The two systems were: (1) Capo di Monte (North
Tamborine, in the Gold Coast hinterland); and (2) Currumbin Ecovillage (Currumbin Valley, Gold
Coast). These objectives were:
1. Evaluating the water self-sufficiency practices of the current operation at the decentralised
systems through the long-term monitoring of major water fluxes;
2. Conducting a feasibility study, in terms of technical, economical and environmental constraints,
on the potential use advanced oxidation technologies (AOTs) to ensuing high quality of treated
sewage effluent at the decentralised systems without violating the EPA approved limits;
3. Performing uncertainty analysis using the @RISK model to determine the treatment reliability
of the decentralised systems, as well as employing the BioWin® model to simulate system
robustness in response to varying hydraulic and nutrient shock loadings during treatment
operation;
4. Estimating the current energy efficiency of decentralised systems through long-term monitoring
to inform and develop improvements to the current energy efficiency of the operation;
5. Optimising the energy efficiency of decentralised systems through system redesign and cost
benefit analysis to demonstrate the potential reduction in overall system energy consumption,
capital and operational costs and carbon footprints; and
6. Estimating and directly measuring fugitive gas emissions occurring from Capo di Monte’s
membrane bioreactor (MBR) treatment technology.
In addition, a GIS based methodology to assess the spatial suitability of decentralised wastewater
systems was developed and has been described in this report.

Decentralised Wastewater Treatment Systems: System Monitoring and Validation Page 5
2. METHODOLOGY
2.1. Decentralised Wastewater Treatment Systems
This study has investigated cluster-scale recycled water systems, with a focus on emerging
technologies such as MBR, membrane filtration and biofilm filters. The objective of this component of
the study was to identify:
1. The significant differences in treatment technologies, performance, robustness to shock loads,
energy consumption and greenhouse gas (GHG) emissions; and
2. How the scale and processes for wastewater treatment and recycling are appropriately selected
for any given greenfield development.
2.2. Research Methodology Overview
A wastewater treatment and recycling system can have many feasible design options depending on a
large number of factors. Tchobanoglous et al. (2003) identified 23 important factors to be considered
when selecting processes for municipal wastewater treatment. Compared to a centralised municipal
treatment plant, decentralised systems are subject to specific constraints. In particular, decentralised
sewer networks have less buffering capacity and residence time, and therefore the process design must
be sufficiently robust to cope with a wide variation of influent flows and qualities. In addition, unlike
centralised WWTPs, decentralised WWTPs can often be left unattended for days and, as such, the
construction and design of decentralised systems must take into account this operational and
maintenance regime.
It is often the preference of developers to choose a decentralised package plant that is simple to install,
due to the installation being performed by contractors specialising in civil works, rather than by a
group of engineers specialising in different disciplines such as civil, mechanical and process
engineering. Taking into consideration the specific features of decentralised systems and the emerging
issues being faced by the water industry such as climate change and energy shortage, we identified key
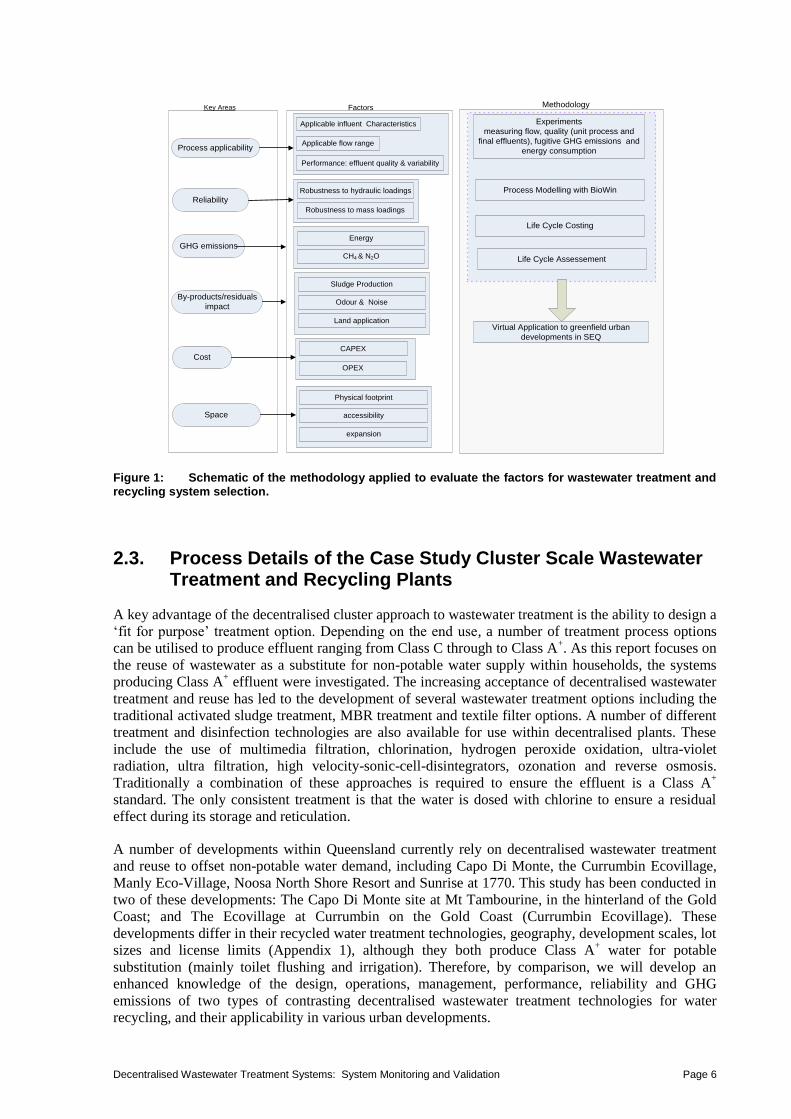
criteria for selecting decentralised wastewater treatment and recycling processes (Figure 1). From
Figure 1, the key criteria for the assessment of decentralised WWTPs included: process applicability
for the intended end uses of the treated effluent; process reliability; greenhouse gas (GHG) emissions
for environmental impact; treatment process residuals; life cycle costing covering capital and
operating costs; and the physical footprint of the system. Process modelling and fugitive gas
assessment are a primary focus in this study, and will be evaluated by means of system monitoring and
modelling.
Decentralised Wastewater Treatment Systems: System Monitoring and Validation Page 6
MethodologyFactorsKey Areas
Process applicability
Reliability
Space
Cost
By-products/residuals
impact
CAPEX
OPEX
Sludge Production
Odour & Noise
Land application
Applicable influent Characteristics
Applicable flow range
Performance: effluent quality & variability
Robustness to hydraulic loadings
Robustness to mass loadings
Virtual Application to greenfield urban
developments in SEQ
Experiments
measuring flow, quality (unit process and
final effluents), fugitive GHG emissions and
energy consumption
Process Modelling with BioWin
Life Cycle Costing
Life Cycle Assessement
GHG emissionsEnergy
CH4 & N2O
Physical footprint
accessibility
expansion
Figure 1: Schematic of the methodology applied to evaluate the factors for wastewater treatment and recycling system selection.
2.3. Process Details of the Case Study Cluster Scale Wastewater Treatment and Recycling Plants
A key advantage of the decentralised cluster approach to wastewater treatment is the ability to design a
‘fit for purpose’ treatment option. Depending on the end use, a number of treatment process options
can be utilised to produce effluent ranging from Class C through to Class A+. As this report focuses on
the reuse of wastewater as a substitute for non-potable water supply within households, the systems
producing Class A+ effluent were investigated. The increasing acceptance of decentralised wastewater
treatment and reuse has led to the development of several wastewater treatment options including the
traditional activated sludge treatment, MBR treatment and textile filter options. A number of different
treatment and disinfection technologies are also available for use within decentralised plants. These
include the use of multimedia filtration, chlorination, hydrogen peroxide oxidation, ultra-violet
radiation, ultra filtration, high velocity-sonic-cell-disintegrators, ozonation and reverse osmosis.
Traditionally a combination of these approaches is required to ensure the effluent is a Class A+
standard. The only consistent treatment is that the water is dosed with chlorine to ensure a residual
effect during its storage and reticulation.
A number of developments within Queensland currently rely on decentralised wastewater treatment
and reuse to offset non-potable water demand, including Capo Di Monte, the Currumbin Ecovillage,
Manly Eco-Village, Noosa North Shore Resort and Sunrise at 1770. This study has been conducted in
two of these developments: The Capo Di Monte site at Mt Tambourine, in the hinterland of the Gold
Coast; and The Ecovillage at Currumbin on the Gold Coast (Currumbin Ecovillage). These
developments differ in their recycled water treatment technologies, geography, development scales, lot
sizes and license limits (Appendix 1), although they both produce Class A+ water for potable
substitution (mainly toilet flushing and irrigation). Therefore, by comparison, we will develop an
enhanced knowledge of the design, operations, management, performance, reliability and GHG
emissions of two types of contrasting decentralised wastewater treatment technologies for water
recycling, and their applicability in various urban developments.
Decentralised Wastewater Treatment Systems: System Monitoring and Validation Page 7
2.3.1 Capo Di Monte Case Study
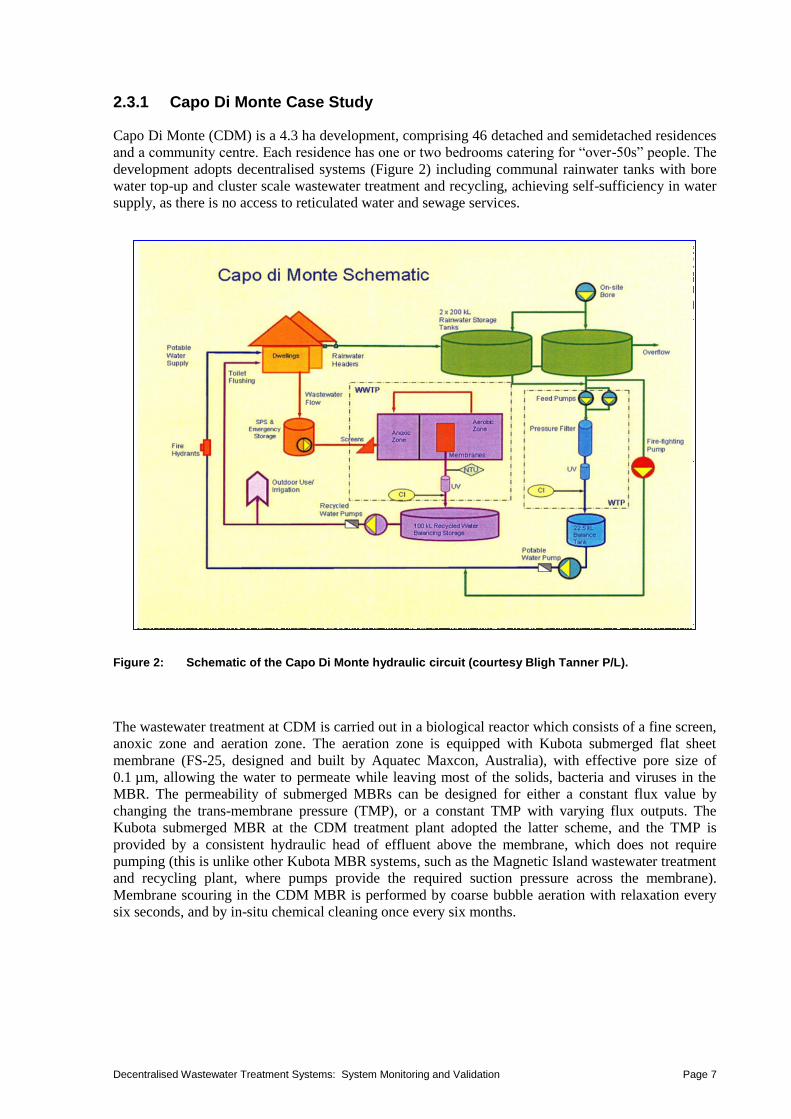
Capo Di Monte (CDM) is a 4.3 ha development, comprising 46 detached and semidetached residences
and a community centre. Each residence has one or two bedrooms catering for “over-50s” people. The
development adopts decentralised systems (Figure 2) including communal rainwater tanks with bore
water top-up and cluster scale wastewater treatment and recycling, achieving self-sufficiency in water
supply, as there is no access to reticulated water and sewage services.
Figure 2: Schematic of the Capo Di Monte hydraulic circuit (courtesy Bligh Tanner P/L).
The wastewater treatment at CDM is carried out in a biological reactor which consists of a fine screen,
anoxic zone and aeration zone. The aeration zone is equipped with Kubota submerged flat sheet
membrane (FS-25, designed and built by Aquatec Maxcon, Australia), with effective pore size of
0.1 µm, allowing the water to permeate while leaving most of the solids, bacteria and viruses in the
MBR. The permeability of submerged MBRs can be designed for either a constant flux value by
changing the trans-membrane pressure (TMP), or a constant TMP with varying flux outputs. The
Kubota submerged MBR at the CDM treatment plant adopted the latter scheme, and the TMP is
provided by a consistent hydraulic head of effluent above the membrane, which does not require
pumping (this is unlike other Kubota MBR systems, such as the Magnetic Island wastewater treatment
and recycling plant, where pumps provide the required suction pressure across the membrane).
Membrane scouring in the CDM MBR is performed by coarse bubble aeration with relaxation every
six seconds, and by in-situ chemical cleaning once every six months.

Decentralised Wastewater Treatment Systems: System Monitoring and Validation Page 8
The CDM plant is designed to treat 11 kL/day of sewage (peak flow) from the village (110 L/EP/day).
A schematic of the plant is shown in Figure 3. The plant has a 24-hour balance tank in which all
sewage is collected by gravity. The activated sludge system consists of a fine screen with a 2 mm
screening size, anoxic zone, aerating zone and the MBR. The screened wastewater firstly undergoes
carbon substrate degradation and nitrification processes in the aeration zone, followed by recycling to
the anoxic zone where denitrification takes place. Alum is added for phosphorus precipitation. Sludge
generated in the biological reactor is removed from the reaction vessel and transported on a fortnightly
basis to a Gold Coast City Council sewage treatment plant for biosolids treatment. Advanced
treatment of the effluent is performed using an ultraviolet (UV) system (Trojan system) and a sodium
hypochlorite chlorination unit. The Class A+ effluent is stored in a 100 kL storage tank and reticulated
to each house via dual pipe systems for toilet flushing and outdoor uses. A 6,000 m2 vegetated buffer
zone is used for land application on the rare occasions that of excess treated wastewater is produced.
This avoids its direct discharge into the local waterway.
WW Storage
UV
Balance
Tank
Bar Screen
Submerged
Membrane
Anoxic Zone Aerobic Zone
pH
DO
blower
Alum dosing
Chlorination
Power Meter installed by CSIRO
Flow meter installed by CSIRO
Wastewater
Recycled Water
Pump
Flow meter installed by Capo
NTU sensor
Figure 3: Schematic of the Capo Di Monte wastewater treatment and recycling plant.
For aesthetic reasons, the treatment plant is located indoors (Figure 4) and the odour emitted from raw
sewage in the wet well and fine screen is extracted via air ducts to the compressed air blowers. The
combined compressed air is then released through fine and coarse air diffusers into the aeration zone
of the bioreactor to provide oxygen for biological oxidation and air for scouring the membrane.

Decentralised Wastewater Treatment Systems: System Monitoring and Validation Page 9
Figure 4: Capo Di Monte wastewater treatment and recycling plant building (external view).
2.3.2 The Currumbin Ecovillage Case Study
The Ecovillage at Currumbin (CEV) comprises 110 lots, ranging from 400 to 1600 m2, and extensive
communal open areas (80% open space). The development adopts integrated water management
systems to obtain self-sufficiency in the water supply. This includes rainwater tanks at each house for
potable uses, and reuse of the wastewater which is treated in a communal scale plant for toilet-
flushing, garden watering, car washing, communal irrigation and fire fighting. Bore water is available
when the village requires extra water. Figure 5 shows the hydraulic circuit of the CEV.
Figure 5: Schematic of the Currumbin Ecovillage hydraulic circuit (courtesy Bligh Tanner P/L).

Decentralised Wastewater Treatment Systems: System Monitoring and Validation Page 10
The wastewater treatment and recycling plant at the CEV is designed to treat 51 kL/day average dry
weather flow (ADWF) of sewage. The plant layout has been designed to allow for the future addition
of a primary septic tank, extra Orenco filter pods, and recycled water storage volume so that the plant
can accommodate up to a 25% increase in flow and/or strength. During extreme wet weather
conditions, secondary treated effluent is retained in the recycled water storage. If the storage is full,
the excess water, after being treated to Class A+ standard, is discharged onto an open area via
irrigation or to Currumbin Creek via on-site swales and bioretention filters.
Figure 6 shows a schematic of the treatment plant at the CEV. The wastewater is collected at each
home and pumped via pressure sewers to the wastewater plant, where it is treated to a secondary
standard by incorporating anaerobic primary treatment, a denitrification system and a Textile Filter
system (Orenco Advantex - AdvanTex AX100). The anaerobic treatment is performed in three septic
treatment tanks in series with a filter (Biotube) installed in the last tank to remove solids from the
effluent. Following this are an anoxic tank and a recirculation tank, which provides denitrification
treatment and retention for reticulation of the primary treated effluent through the textile filters. A
screened pump vault is installed at the end of the anoxic/recirculation tank to screen out solids larger
than 3 mm from the effluent and pumps to distribute the wastewater to the textile filter. The pumps are
activated via a timer controller.
Power Meters installed by CSIRO
Pressure Transducer installed by CSIROP
Flow meters installed by CSIRPF
Flow meters by CEVF
45kLTransfer tank
uv
45 kL Septic tank #1
Emergency storage
Pump station
Biotube filters
MF feed tank
f50
MF (0.2mm)f50
NTU
sewers
45 kL Septic tank #2
45 kL Septic tank #3
P
F
F
F
The
restToillet
laundryoptional
Garden
Nursery
Greenways
Food crops Parks
Other irrigation
areas
Other
outdoor use
High Land Reservoir
70 m Head
f100 1ML Covered Recycled
Water Balancing Storage
bore
F
f63 (PE)
200mm filter
31.5 kL Recycled Water Balance Tank
Wastewater
Cl2x2
12.6kL Anoxic tank
50.4kL Recirculation tank
Biotube filters
Textile filters
F50F5
0F F
F1
00
F
Backwash to sewers
P
F
f100
Normally closed
pH Cl2 pH Cl2
pump
Recycled water
Manual bypass line
Flow splitter
Figure 6: Schematic of the Currumbin Ecovillage wastewater treatment plant.
The Orenco Advantex
textile filter system contains six filter pods, whereby three pods are dosed
through a sequencing valve, with one pod being dosed at a time. The filter effluent flows via a gravity
underdrain system into the anoxic/recirculation tank, where the flow is split 20% to the anoxic zone
(Figure 6). A splitter valve in the recirculation zone further splits the remaining 80% flow with a ratio
varying between 80% and 100% to the recirculation zone. The balance of the flow is directed to the
downstream transfer tank for advanced wastewater treatment. The splitting ratio depends on the
incoming flow rates into the plant. During low flow periods, 100% (of the 80% flow) is distributed to

Decentralised Wastewater Treatment Systems: System Monitoring and Validation Page 11
the recirculation zone. When the flow level in the recirculation zone increases, a ball in the splitter
valve is automatically adjusted to divert only a portion of the flow to the recirculation tank. However,
a minimum of 80% of the flow returns to the recirculation zone at all times. At present, the recycled
ratio of the plant is operated at 5 to 1. The design of Orenco Advantex
textile filter system allows a
maximum 7-day peak design hydraulic load of 975 L/m2/day, which is a constraint of the filter design.
The organic loading to the filter is designed to allow microorganisms in the system to complete a
whole life cycle including a complete endogenous process (the energy for microbial expenditure is
sourced within cells), generating only a small amount of excess sludge, requiring no desludging under
normal operating conditions.
The secondary treated water is stored in a covered storage basin and is then treated to a Class A+
standard through microfiltration (effective pore size of 0.2 mm), UV disinfection and chlorination
before being stored in recycled water balance tanks for reuse. Backwash from the microfiltration
system is diverted to the sewer.
As a strategy to manage potential odour impact on the environment, the pump station, primary and
secondary treatment units of the plant are located underground, and the recycled water storage is
covered. Exhaust gases pass through an activated carbon filter before being released from each septic
tank and the textile filters into the atmosphere (Figure 7).
Figure 7: Photos of the textile filters in the Currumbin Ecovillage wastewater treatment and recycling plant.
2.4 Instrumentation, Sample Collection and Analysis
A range of meters were installed at key treatment components of the two treatment plants to measure
flow and energy consumption. In addition, grab samples including gas, liquid and solids were taken
from various locations of the plants for physical, chemical and microbiological analyses. The meter
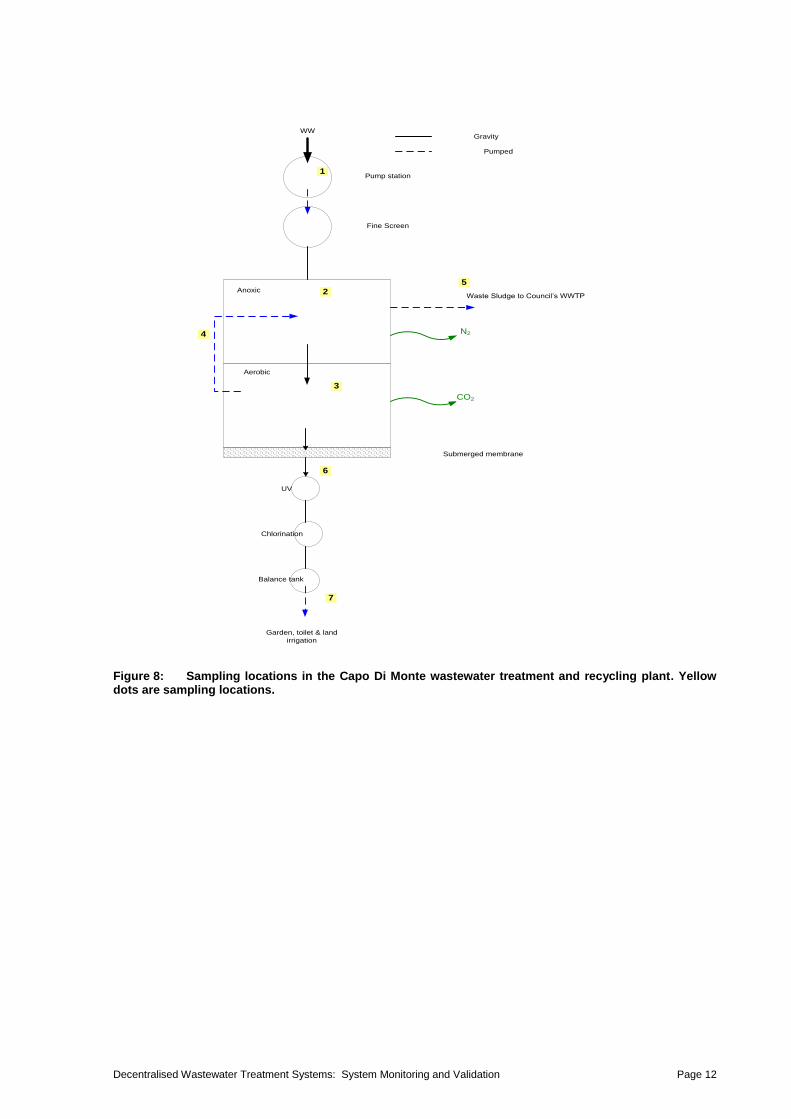
locations are shown in Figure 3 and Figure 6. The sampling points and analysis items are depicted in
Figure 8 and Table 1.
Decentralised Wastewater Treatment Systems: System Monitoring and Validation Page 12
Submerged membrane
Anoxic
Aerobic
Pump station
Fine Screen
UV
Chlorination
Balance tank
WW
Garden, toilet & land
irrigation
Gravity
Pumped
Waste Sludge to Council’s WWTP
N2
CO2
1
2
3
5
4
6
7
Figure 8: Sampling locations in the Capo Di Monte wastewater treatment and recycling plant. Yellow dots are sampling locations.
Decentralised Wastewater Treatment Systems: System Monitoring and Validation Page 13
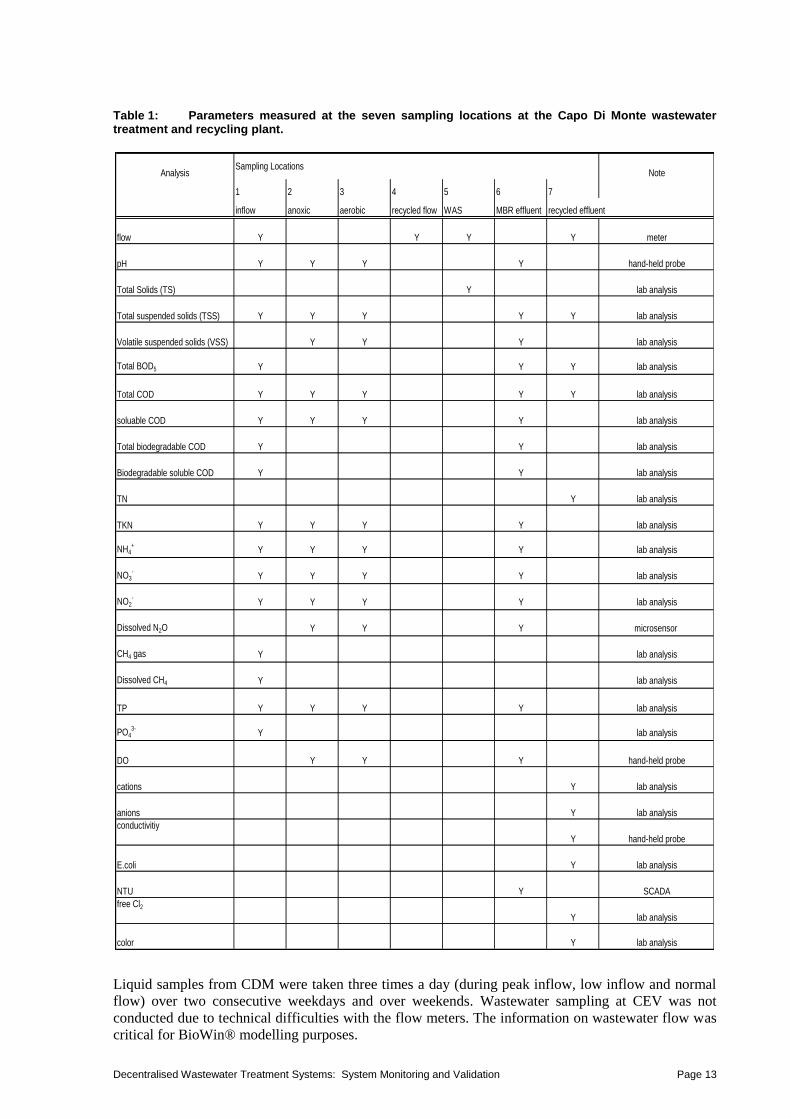
Table 1: Parameters measured at the seven sampling locations at the Capo Di Monte wastewater treatment and recycling plant.
Liquid samples from CDM were taken three times a day (during peak inflow, low inflow and normal
flow) over two consecutive weekdays and over weekends. Wastewater sampling at CEV was not
conducted due to technical difficulties with the flow meters. The information on wastewater flow was
critical for BioWin® modelling purposes.
AnalysisSampling Locations
Note
1 2 3 4 5 6 7
inflow anoxic aerobic recycled flow WAS MBR effluent recycled effluent
flow Y Y Y Y meter
pH Y Y Y Y hand-held probe
Total Solids (TS) Y lab analysis
Total suspended solids (TSS) Y Y Y Y Y lab analysis
Volatile suspended solids (VSS) Y Y Y lab analysis
Total BOD5 Y Y Y lab analysis
Total COD Y Y Y Y Y lab analysis
soluable COD Y Y Y Y lab analysis
Total biodegradable COD Y Y lab analysis
Biodegradable soluble COD Y Y lab analysis
TN Y lab analysis
TKN Y Y Y Y lab analysis
NH4+
Y Y Y Y lab analysis
NO3-
Y Y Y Y lab analysis
NO2-
Y Y Y Y lab analysis
Dissolved N2O Y Y Y microsensor
CH4 gas Y lab analysis
Dissolved CH4 Y lab analysis
TP Y Y Y Y lab analysis
PO43-
Y lab analysis
DO Y Y Y hand-held probe
cations Y lab analysis
anions Y lab analysis
conductivitiy
Y hand-held probe
E.coli Y lab analysis
NTU Y SCADA
free Cl2Y lab analysis
color Y lab analysis

Decentralised Wastewater Treatment Systems: System Monitoring and Validation Page 14
2.5 Data Analysis Period
To understand the wastewater treatment/redistribution facilities at CDM and CEV, both the energy
consumption and water flow values were recorded and analysed. As previously outlined, the facility at
CDM was fitted with a number of energy and water flow monitoring devices. All flow meters at the
CDM plant automatically uploaded their data to an electronic database each day. The energy
consumption data was updated more frequently at a five minute interval. The period of analysis used
to model the energy consumption at CDM was two years; from 01/03/2010 to 01/03/2012. Manually
recorded water flow data had been logged from 15/03/2010, but daily automated recordings did not
commence until 23/03/2011. Due to the improved data quality gained from the automated data,
analysis of the water flow at CDM commenced from the 01/04/2011 until 01/03/2012; a total period of
11 months which corresponds exactly with the second half of energy consumption records.
At CEV, manually recorded data was collected on various site visits across the monitoring period. The
frequency of visits ranged from weekly to three-monthly. Initial monitoring began on 11/12/2009,
although this did not record all the possible water flow and energy parameters. Consistent data entries
that included all water flow and energy parameters began on 15/10/2010. Data was then analysed from
this time through to the 16/11/2011.
2.6 Process Modelling
@Risk modelling of the effluent quality data is proposed to investigate system robustness and the
probability of exceedance for TN and TP against the EPA approved limits. This is commercial
software, which performs Monte Carlo simulations.
To gain an insight into key operational variables and performance of the treatment systems, process
simulation using a commercially available model (BioWin 3.1, EnvioSim Associates Ltd) was
conducted. The use of a mathematical model is a time- and cost-effective way to explore and test a
wide range of possibilities, such as various combinations of key system components, hydraulic
conditions, organic loadings, and estimation of sludge production and oxygen requirements.
BioWin 3.1 is a Microsoft Windows-based simulator and includes a number of process units,
anaerobic digesters, aeration bioreactors, MBRs and sedimentation tanks, which can be built
specifically to mimic the studied treatment process. BioWin simulates the treatment processes in
anaerobic digesters and in aerobic systems based on the IWA’s Anaerobic Digestion Model (ADM)
(Boston 2002) and Activated Sludge Models (ASM, including model 1, 2 and 3) (Henze et al. 1987),
respectively.
2.7 Investigating Total Carbon Footprint of Treatment Plants
The aim of this activity was to determine the total carbon footprint for both CDM and CEV. CDM and
CEV use energy for various activities to treat wastewater to a desired quality. In addition, CDM and
CEV also release fugitive emissions of nitrous oxide (N2O) from biological nutrient removal processes
and methane (CH4) from anaerobic and facultative processes. There is a wide variation in fugitive
GHG emissions across different scale treatment technologies and designs. Thus, it is necessary to
investigate fugitive GHG emissions from decentralised systems in order to assess their total carbon
footprint. In this study the energy consumption used by the various wastewater treatment technologies
at each site was evaluated and the resultant fugitive gas emissions from these treatment processes were
modelled and measured directly using an online gas monitoring system (where possible).
2.8 Feasibility Study on using Advanced Oxidation Technologies for Decentralised Wastewater Treatment
A separate study was conducted to investigate the feasibility of using Advanced Oxidation
Technologies (AOTs) in decentralised wastewater treatment systems. AOTs are considered as an

Decentralised Wastewater Treatment Systems: System Monitoring and Validation Page 15
attractive green technology for wastewater treatment, considering their reported high destruction
efficiency for toxic pollutants that are usually resistant to conventional biological wastewater
treatment processes. The benefits of using AOTs for advanced wastewater treatment include: (1)
reduction in the formation potential of disinfection by-products (DBPs); (2) operating at ambient
temperature and pressure; and (3) complete oxidation of organics to carbon dioxide, water or other
harmless by-products, rather than just their removal from solution using conventional adsorption,
absorption or stripping treatment options. A brief report on the feasibility study is attached as
Appendix 2. The study covers various AOTs applied in wastewater treatment, process selection and
assessment framework, comparison between different AOTs, technical feasibility, economic and
environmental feasibility.
2.9 Assessment of Spatial Suitability for Decentralised Wastewater Reuse Systems in South East Queensland
2.9.1 Background
The relative suitability of different locations for decentralised water reuse systems in SEQ is
dependent upon a range of location specific characteristics. Spatial analysis using Geographic
Information Systems (GIS) provides a tool to identify the relative suitability of areas for the
application of decentralised systems. The outputs from a regional assessment study of relative
suitability for decentralised water recycling systems can be used to filter out locations not suitable, and
to focus on potentially suitably locations for more detailed field assessment.
A review of the applications of GIS for suitability assessment of decentralised water reuse systems
was conducted. The literature review identified examples where GIS approaches have been applied in
the assessment of suitability for alternative water systems. A selection of papers was reviewed in more
detail to highlight common approaches used in assessing spatial suitability of alternative water
systems. The literature review then highlighted approaches that can be used to assess the spatial
suitability for decentralised water reuse systems in the SEQ region. The review concludes by
highlighting potential issues that may lead to bias, distortions or errors in the output. Consideration of
these issues is important in communicating to decision makers the confidence that can be placed in the
output. This literature review has been provided in Appendix 3 of the report, which also includes land
suitability assessment, multi criteria evaluation for suitability assessment and data limitations A
methodology was developed that can be applied to assess suitability in the SEQ context, which is
described in the following sections.
2.9.2 Suitability Factors for Decentralised Wastewater Systems
When considering the adoption of decentralised systems to meet current and future development
needs, it is necessary to firstly assess the suitability of the development to incorporate a wastewater
reuse scheme. The assessment criteria can be grouped into the following categories:
1. Bio-physical constraints and suitability factors;
2. Existing and planned water and wastewater service infrastructure and capacity; and
3. Demand for non-potable water.
2.9.2.1. Biophysical Constraints and Suitability Factors
The following factors should be considered first in constraining the potential areas based on where a
water reuse scheme is not feasible, with the remaining areas then being classified for relative
suitability. The following briefly describes these factors, with a justification of why they should be
considered. The final suitability factors used will be guided by an expert panel, as described in the
following section.
Terrain (slope and drainage patterns): Site topography can significantly influence the layout of
decentralised systems. Low lying-sites can be used to collect flows from the service area by gravity
and minimise the number of pumping stations in the collection systems. However, such a site may

Decentralised Wastewater Treatment Systems: System Monitoring and Validation Page 16
require flood protection and there may be a cost trade-off for pumping. When developments are
located in elevated land areas, with long pumping distances to existing centralised wastewater
treatment plants, decentralised systems can be a sustainable option compared to centralised systems.
Soil type: Soil characteristics of the development site are an important factor in evaluating suitability
of decentralised systems, particularly for schemes that adopt land application or disposal, such as
onsite wastewater disposal to household gardens and public landscape irrigation after appropriate
treatment. Physical and mechanical properties of the soil, including degree of dispersion of the soil
particles, stability of aggregates, soil structure and permeability, are sensitive to the types of
exchangeable ions present in irrigation water and therefore influence the reclaimed water quality
standard applied for irrigation. Similarly, very fine-textured soils retain water for long periods of time
and therefore can limit the loading rate for water that can be assimilated and transported away from
the site. Coarse textured soils, on the other hand, drain water rapidly and may not provide sufficient
retention time for effective filtration and biological treatment mechanisms for the disposed water
before it reaches aquifers. Soil profiles also significantly affect the construction cost of decentralised
systems. For example, corrosive soils may require the more expensive coatings or non-metallic
substitutes or cathodic protection systems.
Hydrogeological characteristics: Hydrogeology can affect the feasibility of onsite reclaimed
wastewater disposal as it influences groundwater vulnerability and aquifer properties. The potential
risk of groundwater contamination is of concern for sites with a permanent shallow groundwater table
with unconfined aquifers that might require high quality effluent when land disposal is applied. On the
other hand, the presence of accessible aquifers can also create opportunities for aquifer storage and
recharge.
Flood risk: Areas located on or near floodplains need to consider the impact of potential water reuse
schemes on the floodplain, and also more importantly the impact of potential flooding on wastewater
treatment and disposal systems.
Environmentally Sensitive Areas: Decentralised system should be developed without unnecessarily
stressing the environment. Issues include:
Surface water bodies and catchments;
Proximity to wetlands;
Proximity to coastal areas;
Proximity to ecologically sensitive habitats; and
Areas of heritage or recognised landscape value.
When developments are close to environmentally sensitive areas, such as waterways, coasts and flood-
prone areas, regulatory bodies often impose stringent effluent quality standards, or even a requirement
of zero discharge to sensitive water bodies. This can encourage the adoption of reuse schemes, as well
as influencing the degree of treatment required.
Land availability: The amount of available land for accommodating treatment facilities also
determines the potential to adopt decentralised systems. The size of the land required depends on the
size of the plant, and the buffer area between the plant and the surrounding community. In many
reclaimed water reuse schemes, storage facilities for reclaimed water are an important part of the
system to even out mismatch in diurnal and seasonal supply and demand.
Urban form and density: The size of the catchment area, house density and house size can have
significant economic impact on the decentralised water reuse schemes. Cluster-scale systems are
generally the ideal scale to take advantage of trade-offs between treatment and sewer reticulation
economics and diseconomies (Gurung et al. 2012). Cluster scale systems are more feasible for
developments with small lot size and high density, due to their smaller spatial footprint for wastewater
collection and treatment systems including recycled water storage options.
2.9.2.2. Infrastructure (Existing and Planned) Suitability Factors
Developers will generally consider using the services of the local Council if the wastewater systems
are nearby, and have capacity to accommodate the additional demand, since they are required to pay
Decentralised Wastewater Treatment Systems: System Monitoring and Validation Page 17
the Council service fees regardless the services being used. However, where the existing centralised
systems are already at, or close to their design capacity, decentralised systems are an attractive option
to reduce the pressure on the existing services, thus deferring the immediate needs to upgrade the
infrastructure. There is also a potential to adopt decentralised systems when the cost for upgrading the
existing systems is comparable to the cost of building decentralised systems.
One example to illustrate these points is the development area in the Nambour region on the Sunshine
Coast. The existing sewage treatment plant is already operating beyond its design capacity. Therefore
a major upgrade is required to meet the anticipated population growth in the region, with population
projected to grow from 750,000 in 2012 to more than one million in 2031. A decentralised approach to
providing wastewater services may provide an economically feasible alternative to providing
wastewater services that defers or removes the need to upgrade existing sewer mains and pumps
stations that are also operating close to the design capacity.
2.9.2.3. Demand Suitability Factors
Demographics: Household structure is important in determining likely water demand profiles that can
inform expected wastewater flows and demand for recycled water. In areas where there is low per
household demand for recycled water, such as those with low household occupancy and no gardens,
the cost-effectiveness of recycled water is likely to be relatively poor due to the low uptake of the
system.
Land use and urban form: Demand for non-potable applications, will vary with the land use and
urban form. For example, residential land use characterised by low density development is likely to
have higher but more seasonal non-potable demand for outdoor water use, when compared to a
medium or high density residential development that have smaller irrigation areas. However, the cost
of servicing per customer increases as density decreases.
Projected population and land use changes: Consideration of the dynamics of population and land
use change, along with the capacity of sewerage systems, enables the identification of opportunities
where localised water recycling schemes may be able to alleviate capacity constraints in the system.
This can help to defer or downsize future upgrades of the sewerage system (as cited in the example
above near Nambour).
Climate: Demand for irrigation (a non potable water application) is climate dependent. Therefore
climate conditions are another important factor in evaluating the appropriateness of developing
decentralised systems for the utilisation of recycled water. Meteorological conditions can be separated
into a number of different sub-categories, but the most important of these in regard to implementation
of decentralised systems is the expected yearly rainfall and its seasonal distribution. Rainfall has a
high dependency on local environmental conditions such as proximity to coastal environments, land
formations and wind conditions. Due to the risks associated with too little or too much rainfall, it is
important that accurate historical data be used to justify the system.
2.9.3 Methodology Summary
The proposed methodology for assessing the spatial suitability for decentralised water reuse schemes
in SEQ at the regional scale is summarised in Figure 9. A key component of the method is the
involvement of an expert panel which would ideally be composed of a mix of technical experts and
representatives of key stakeholders. The panel would provide input to the selection of key suitability
criteria, classifying suitability factors, and the overall weighting of these factors. The final map would
be reviewed by the expert panel to ensure that it reflects their understanding of relative spatial
suitability for decentralised water reuse systems in the SEQ region. If necessary, the classification and
weighting of suitability factors can be iteratively adjusted until it aligns with their expectations.

Decentralised Wastewater Treatment Systems: System Monitoring and Validation Page 18
Figure 9: Framework for spatial suitability assessment for decentralised wastewater systems at the regional scale.
The key steps in the methodology to assess spatial suitability for decentralised water reuse systems
are:
1. Collect relevant spatial data;
2. Select suitability factors for analysis based on data availability;
3. Produce suitability surfaces for each factor in a GIS format;
4. Identify areas that are not feasible for decentralised water reuse system;
5. Produce a constraint layer where any area with value 0 is removed from further consideration;
6. Classify suitability of each factor into discrete classes (1 to 5, with 1 being not at all suitable and
5 being very suitable);
7. Develop weightings for factors based on expert panel input using the Analytic Hierarchy
Process (AHP);
8. Use weighted linear combination to combine maps; and
9. Engage the expert panel to review map output and input assumption used.

Decentralised Wastewater Treatment Systems: System Monitoring and Validation Page 19
Non-Potable
Demand, 7.82
kL/day, 55.8%Potable Demand,
6.21 kL/day,
44.2%
3. RESULTS AND DISCUSSION
3.1. Water Balance and Self-Sufficiency Analysis
3.1.1. Capo Di Monte
The decentralised wastewater treatment and reuse supply system at CDM was constructed in response
to the absence of a centralised sewerage facility in the area. This has been one of the major drivers for
the adoption of decentralised wastewater system, and a push toward further adoption is being proposed
and supported in previous studies (Ho et al. 2010; Nelson 2008; Tchobanoglous 2003). As per the
methodology (Section 2.4 and Section 2.5), smart water meters were installed across the decentralised
system at CDM to measure important water fluxes, which would allow for water balance and self-
sufficiency analysis.
Figure 10 shows the overall water balance and self-sufficiency analysis for CDM over the 2-year
monitoring period. It is clear that the decentralised system, comprising of a communal rainwater tank
and wastewater system, was operating at 90% water self-sufficiency with the remaining 10% top-up
sourced from the bore water system.
Figure 10: The overall water balance and self-sufficiency analysis at Capo di Monte over the period March 2010 to March 2012.
Figure 11 shows the breakdown of harvested rainwater and treated sewage effluent for potable and
non-potable demands at CDM. It can be seen that 6.21 kL/day (44%) and 7.82 kL/day (56%) were
required to meet potable and non-potable demands, respectively. The decentralised wastewater system
was able to provide over 7.82 kL/day of treated sewage effluent to meet the non-potable source water
requirement for toilet flushing, external garden irrigation and open space irrigation for this
development. It would be anticipated that if a similar level of non-potable water demand could be
assumed across different scales of integrated water systems then it would certainly bring benefits for
mains water conservation.
Figure 11: The breakdown of potable (harvested rainwater) and non-potable (treated sewage effluent) demand at Capo di Monte.

Decentralised Wastewater Treatment Systems: System Monitoring and Validation Page 20
The potable and non-potable water sources were further examined to verify the water origin and end-
uses for the harvested rainwater and treated sewage effluent. Figure 12 shows that rainwater supplied
up to 30.7% of the total water demand, with a further 9.7% coming from the bore water. Together,
these sources supplied the potable water demand at CDM. The treated sewage effluent reticulated back
to local households for toilet flushing and external garden irrigation, supplied almost 55% of the total
water demand, with the non-potable water used for public open space irrigation meeting a further 5%
of total water demand. Further detailed water balance analysis of CDM rainwater and recycled water
supply for a longer period can be seen in Cook et al. (2012).
Figure 12: Breakdown of potable and non-potable water demands for different end-uses.
Further to this, the average water consumption by the residents was also examined. The average water
consumption for the entire retirement village development was 13.4 kL/day. At present, there are 68
residents, giving a per capita usage of 197 L/p/day. A further breakdown of per capita water usage is
shown in Figure 13, where 70.1 L/p/day was used for potable water consumption, 116.2 L/p/day for
treated sewage effluent consumption, and 10.9 L/p/day for public open space irrigation.
Figure 13: Average daily per capita water usage at Capo di Monte and a breakdown of its sources.
In addition, the influence of seasonal variation on the demand of treated sewage effluent (ie. the non-
potable water source) was also studied. A related study by Rockaway et al. (2011) has shown that
seasonal variation might not have a big impact on water demands in different communities. The study
concluded that communities living in a warmer climate consumed on average 16% more water than
communities living in a cooler setting, provided that outdoor irrigation was minimised and remained
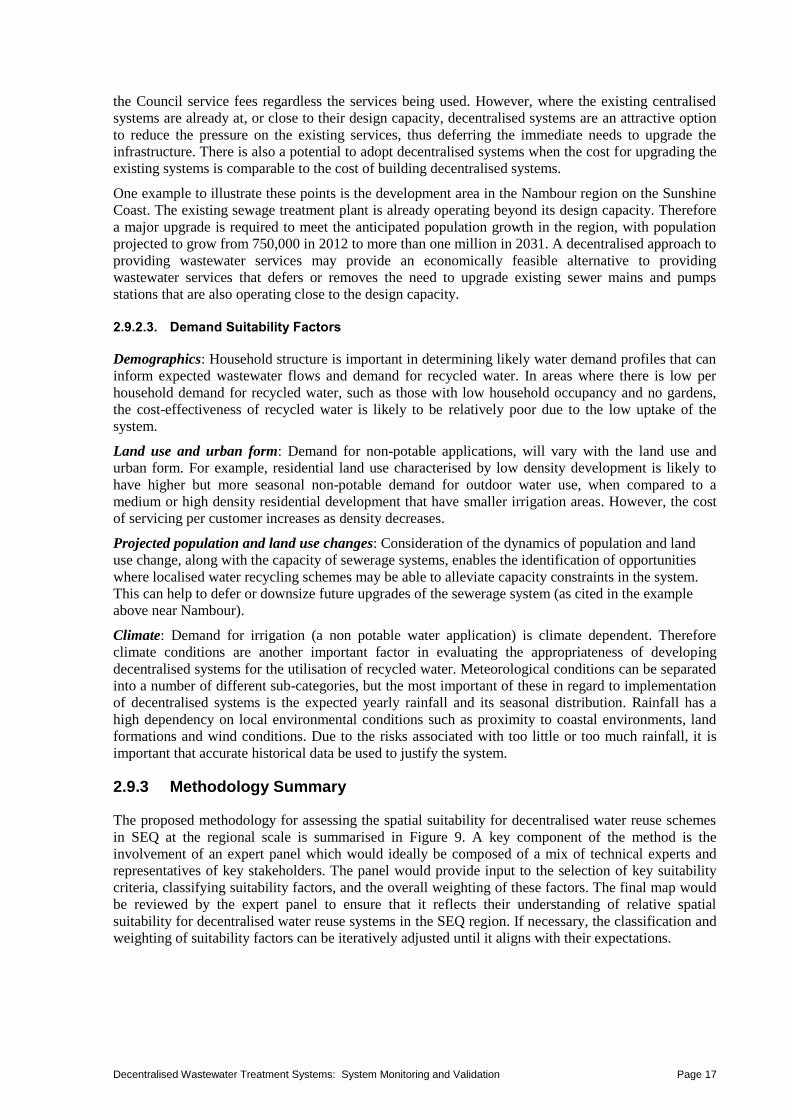
relatively constant. Figure 14 shows the influence of seasonal variation on the demand of treated
Decentralised Wastewater Treatment Systems: System Monitoring and Validation Page 21
sewage effluent at CDM. It can be seen that the overall demand on treated sewage effluent was higher
in summer compared to winter, with a relatively constant demand for irrigation occurring throughout
each particular season. This observation is in close agreement to the outcomes reported in Rockaway
et al. (2011). Around 25% of the treated effluent not consumed for residential usage (garden watering
and toilet supply) is used for open space irrigation.
Figure 14: The influence of seasonal variation on the demand of treated sewage effluent at Capo di Monte.
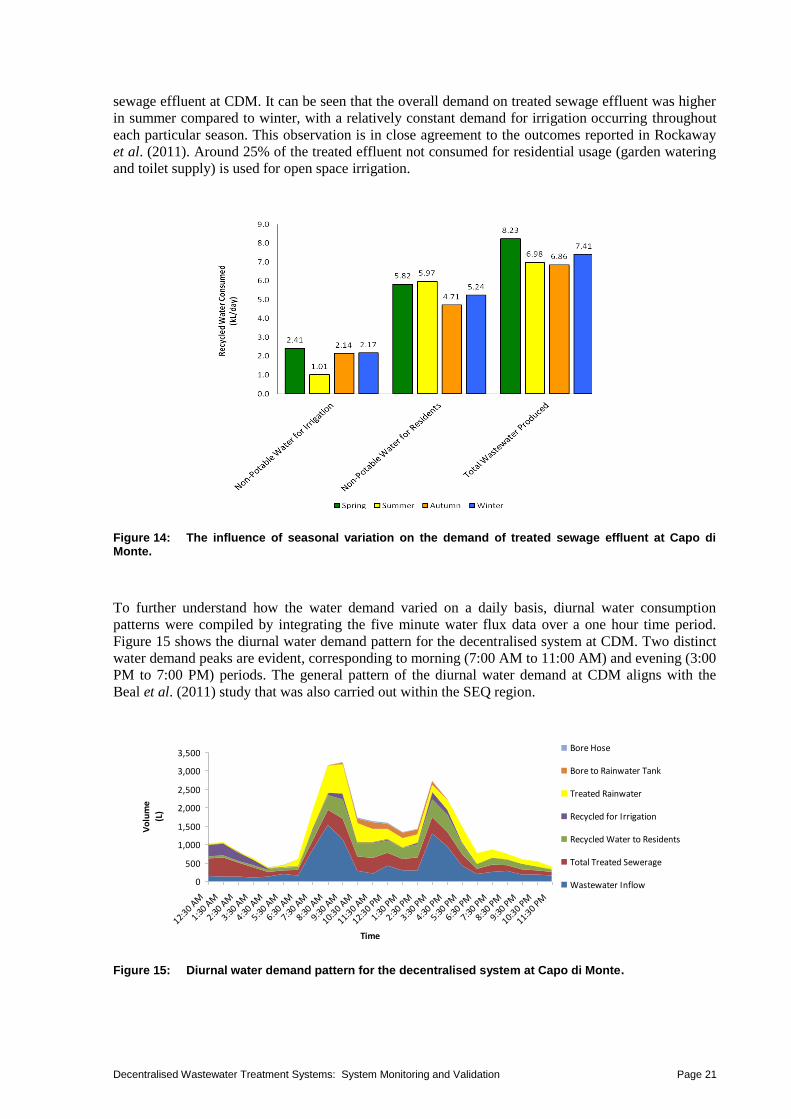
To further understand how the water demand varied on a daily basis, diurnal water consumption
patterns were compiled by integrating the five minute water flux data over a one hour time period.
Figure 15 shows the diurnal water demand pattern for the decentralised system at CDM. Two distinct
water demand peaks are evident, corresponding to morning (7:00 AM to 11:00 AM) and evening (3:00
PM to 7:00 PM) periods. The general pattern of the diurnal water demand at CDM aligns with the
Beal et al. (2011) study that was also carried out within the SEQ region.
0
500
1,000
1,500
2,000
2,500
3,000
3,500
12:30 A
M
1:30 A
M
2:30 A
M
3:30 A
M
4:30 A
M
5:30 A
M
6:30 A
M
7:30 A
M
8:30 A
M
9:30 A
M
10:30 A
M
11:30 A
M
12:30 P
M
1:30 P
M
2:30 P
M
3:30 P
M
4:30 P
M
5:30 P
M
6:30 P
M
7:30 P
M
8:30 P
M
9:30 P
M
10:30 P
M
11:30 P
M
Time
Vo
lum
e
(L)
Bore Hose
Bore to Rainwater Tank
Treated Rainwater
Recycled for Irrigation
Recycled Water to Residents
Total Treated Sewerage
Wastewater Inflow
Figure 15: Diurnal water demand pattern for the decentralised system at Capo di Monte.

Decentralised Wastewater Treatment Systems: System Monitoring and Validation Page 22
Bore Water Supply, 2.36 kL/day, 8.9%
Recylced Water Supply,24.32 kL/day, 91.1%
3.1.2. Currumbin Ecovillage
One of the major drivers for the uptake of the decentralised wastewater system at the CEV was the
absence of a local centralised sewage facility. Smart water meters were installed at the treatment plant
to measure water fluxes, so that water balance and self-sufficiency analysis could be performed. As
with CDM, the water flux data was collected over a two year time period.
Figure 16 shows the overall recycled water balance and self-sufficiency analysis for CEV and it can be
seen that the decentralised wastewater system operated at 91% water self-sufficiency with the
remaining 9% supplied from the bore water system. This was similar to the self-sufficiency achieved
at the CDM decentralised wastewater system. The average treated sewage effluent produced by the
system was 24.32 kL/day, supplemented with 2.36 kL/day of top-up from the bore water system. All
the treated sewage effluent was reticulated back to the local households for non-potable applications as
well as public open space irrigation. As the community in the CEV has its own household rainwater
tanks, no further breakdown analysis for potable and non-potable demands was conducted.
Figure 16: The overall recycled water balance and self-sufficiency analysis at Currumbin Ecovillage.
3.2. Modelling of the System Reliability and Robustness
3.2.1. Wastewater Characteristics - Capo di Monte
Table 2 shows the summary of licence requirements, measured influent wastewater quality at CDM-
STP, and its comparison with the common values from centralised WWTPs. It is evident that the
wastewater composition for the decentralised systems exhibited wide variations in COD, BOD and
total nitrogen concentrations compared to those of the centralised treatment plants. This is almost
certainty due to the small connected population where variations from individual households are not
well buffered compared with the large connected population in a centralised sewage system.

Decentralised Wastewater Treatment Systems: System Monitoring and Validation Page 23
Table 2: Summary of license requirements, measured influent wastewater qualities at CDM-STP and its comparison with common values from centralised WWTPs.
Wastewater Parameters Units CDM-STP License Limits
CDM-STP Influent Values
Range
CDM-STP Average Values
Common Values Range at
centralised WWTPs
CODtotal mg/L - 590 - 1060 825 314 - 438*
BODtotal mg/L 10 240 - 430 335 120 - 190#
Ntotal mg/L 10 69 - 140 105 87 - 94*
Ptotal mg/L 5 14 - 27 21 -
Suspended solids (TSS) mg/L 10 120 - 260 190 144 - 207*
Volatile Suspended solids (VSS) mg/L - 120 - 180 150 125 - 168*
From *Pollice et al. (2004) and #Freeman et al. (2009)
3.2.2. @RISK Modelling – Capo di Monte
To investigate the robustness of the CMD membrane bio-reactor in terms of its treatment capacity and
the probability of exceedance for TN and TP against the EPA approved limits, long term sampling
data was analysed using @Risk model. The model performs risk analysis using Monte Carlo
simulation highlighting many possible outcomes and their likely occurrence. It mathematically and
objectively computes and tracks scenarios, indicating their associated probabilities and risks.
Figures 17 (a) and (b) show the outcomes from the quantitative risk models on the sampled effluent
qualities of total nitrogen (TN) and total phosphorus (TP) from CDM. The sampling was conducted
from April 2008 to September 2010 on a weekly basis, so it should provide a good basis for the
quantitative risk modelling in terms of the reliability of its mean and standard deviation values. Results
show that the decentralised wastewater system at CDM is relatively robust in terms of its treatment
capacity, where the probabilities of exceedance for TN and TP against the EPA approved limits were
only 2% and 3%, respectively. Table 3 also shows the probability of exceedance for other treated
effluent qualities from the CDM system. It seems that the system is relatively stable for other treated
effluent qualities of BOD, total suspended solids (TSS) and Escherichia coli (E. coli) where zero
probability of exceedance were noted against the EPA approved limits.

Decentralised Wastewater Treatment Systems: System Monitoring and Validation Page 24
Pro
ba
bili
ty d
en
sity fu
nctio
n
Nutrient concentrations
(a)
Pro
ba
bili
ty d
en
sity fu
nctio
n
Nutrient concentrations
(b)
Figure 17: Probability of exceedance against the EPA approved treated effluent quality limits. (a) Total nitrogen (TN); (b) Total phosphorus (TP). Both Y-axes refer to the probability density function; whole X-axes refer to the nutrient concentrations. The grey bars refer to the experimental values; and blue line refers to the fitting with log-normal function.
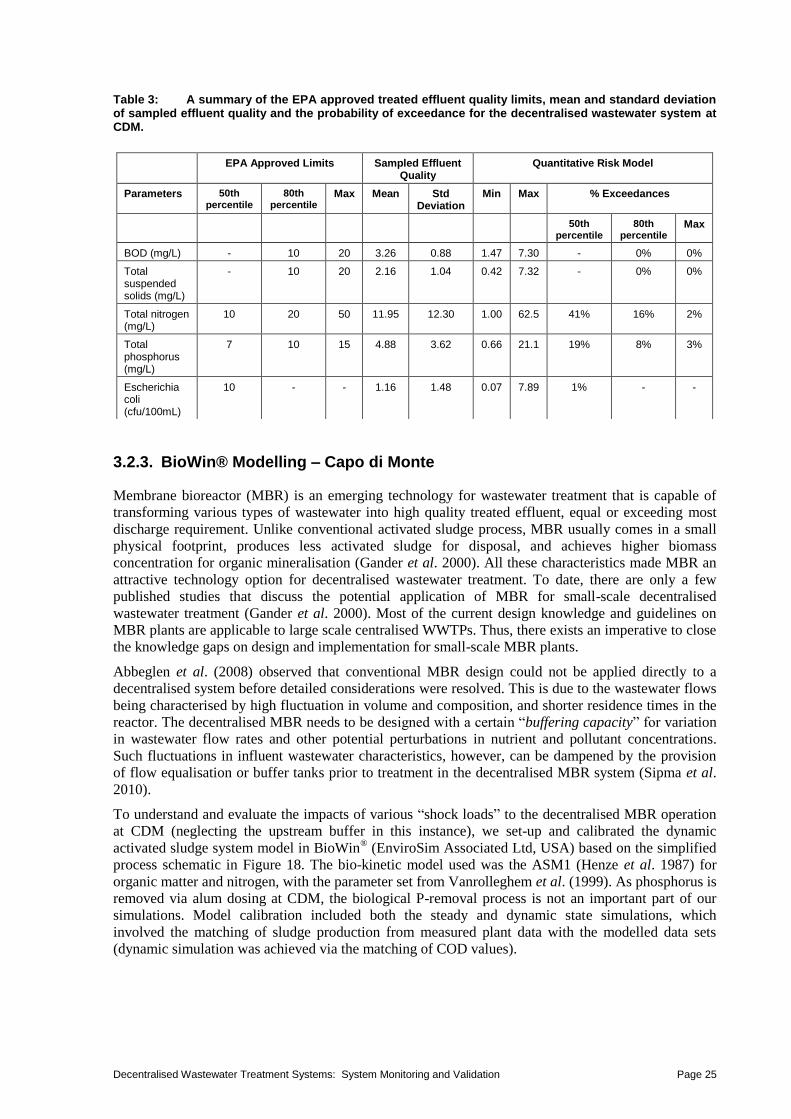
Decentralised Wastewater Treatment Systems: System Monitoring and Validation Page 25
Table 3: A summary of the EPA approved treated effluent quality limits, mean and standard deviation of sampled effluent quality and the probability of exceedance for the decentralised wastewater system at CDM.
3.2.3. BioWin® Modelling – Capo di Monte
Membrane bioreactor (MBR) is an emerging technology for wastewater treatment that is capable of
transforming various types of wastewater into high quality treated effluent, equal or exceeding most
discharge requirement. Unlike conventional activated sludge process, MBR usually comes in a small
physical footprint, produces less activated sludge for disposal, and achieves higher biomass
concentration for organic mineralisation (Gander et al. 2000). All these characteristics made MBR an
attractive technology option for decentralised wastewater treatment. To date, there are only a few
published studies that discuss the potential application of MBR for small-scale decentralised
wastewater treatment (Gander et al. 2000). Most of the current design knowledge and guidelines on
MBR plants are applicable to large scale centralised WWTPs. Thus, there exists an imperative to close
the knowledge gaps on design and implementation for small-scale MBR plants.
Abbeglen et al. (2008) observed that conventional MBR design could not be applied directly to a
decentralised system before detailed considerations were resolved. This is due to the wastewater flows
being characterised by high fluctuation in volume and composition, and shorter residence times in the
reactor. The decentralised MBR needs to be designed with a certain “buffering capacity” for variation
in wastewater flow rates and other potential perturbations in nutrient and pollutant concentrations.
Such fluctuations in influent wastewater characteristics, however, can be dampened by the provision
of flow equalisation or buffer tanks prior to treatment in the decentralised MBR system (Sipma et al.
2010).
To understand and evaluate the impacts of various “shock loads” to the decentralised MBR operation
at CDM (neglecting the upstream buffer in this instance), we set-up and calibrated the dynamic
activated sludge system model in BioWin® (EnviroSim Associated Ltd, USA) based on the simplified
process schematic in Figure 18. The bio-kinetic model used was the ASM1 (Henze et al. 1987) for
organic matter and nitrogen, with the parameter set from Vanrolleghem et al. (1999). As phosphorus is
removed via alum dosing at CDM, the biological P-removal process is not an important part of our
simulations. Model calibration included both the steady and dynamic state simulations, which
involved the matching of sludge production from measured plant data with the modelled data sets
(dynamic simulation was achieved via the matching of COD values).
EPA Approved Limits Sampled Effluent Quality
Quantitative Risk Model
Parameters 50th percentile
80th percentile
Max Mean Std Deviation
Min Max % Exceedances
50th percentile
80th percentile
Max
BOD (mg/L) - 10 20 3.26 0.88 1.47 7.30 - 0% 0%
Total suspended solids (mg/L)
- 10 20 2.16 1.04 0.42 7.32 - 0% 0%
Total nitrogen (mg/L)
10 20 50 11.95 12.30 1.00 62.5 41% 16% 2%
Total phosphorus (mg/L)
7 10 15 4.88 3.62 0.66 21.1 19% 8% 3%
Escherichia coli (cfu/100mL)
10 - - 1.16 1.48 0.07 7.89 1% - -

Decentralised Wastewater Treatment Systems: System Monitoring and Validation Page 26
Figure 18: Simplified process schematic in BioWin® simulation model. WAS represents the waste activated sludge stream.
From the BioWin® simulation result, it was found that the MBR system was relatively robust to
hydraulic shock loads with tolerance of up to 1.5 times the design dry weather daily flow without
violating the licence requirements at CDM. The susceptibility of the MBR to different hydraulic
shock loads at CDM was found to be highly dependent on its effective “working” volume, hydraulic
retention time (HRT) and solid biomass concentration (a function of sludge retention time, SRT).
Since the “working” volume for the MBR volume is constant, the MBR robustness was found to be
highly dependent on both the HRT (1-2 hour) and SRT (approximately 200 days) used. Fluctuations in
wastewater flows of more than 50% are uncommon (as observed from the measured diurnal flow
patterns) and thus the dynamic simulations were constrained to this threshold limit.
When a stepwise increase in nitrogen shock loadings was applied to the model, we found the MBR
operational stability was impacted at N-loads greater than 30% from the average value listed in
Table 2. This was simulated assuming the inlet wastewater flows remained within normal operational
range. From the model simulation, it was found the high susceptibility to increasing N-loads is due to
the low biomass concentration, and the substrate utilisation rate as estimated using the default ASM1
bio-kinetic parameters that affects both the autotrophic and heterotrophic growth processes. Further
work is needed to determine whether the default bio-kinetic parameters can be validly applied to the
MBR system at CDM. Once the nitrification process was upset, the overall MBR system took
approximately 12 hours to re-establish steady-state operation.
In contrast, we found there were no net impacts of carbonaceous COD shock loads (590 –
1060 mg/L) on the MBR operation. This is probably due to the high concentration of mixed liquor
suspended solids (MLSS) of 24,000 mg/L within the current MBR system that could cope with the
COD load variations. However, high concentrations of non-biodegradable COD can accumulate
within the MBR and subsequently impair its operation. Hence, a detailed analysis of the COD
fractionation (dissolved, particulate and non-biodegradable components) in the local wastewater needs
to be carried out in order to understand its likely effects on decentralised MBR operation.
The CEV-STP presents a challenge to BioWin® modelling. As the treatment plant contains septic tank
and fabric bio-filters, which are difficult to model using BioWin®.

Decentralised Wastewater Treatment Systems: System Monitoring and Validation Page 27
3.3. Monitoring the Energy Consumption of Decentralised Wastewater Systems
3.3.1. Capo di Monte
3.3.1.1 Energy Estimation
Similar to the water flux monitoring, the energy efficiency for the wastewater system at CDM was
monitored using smart energy meters and data loggers. Figure 19 shows the measured energy
consumption of CDM on a daily basis, over a total monitoring period of two years, starting from
March 2010 through to March 2012. It can be seen that the wastewater system required an average of
134.4 kilowatt-hours per day (kWh/day) for the first 16 months of the monitoring period. During this
period, a high consumption of energy in the chlorine mixing pump responsible for the homogeneous
dispersion of chlorine in the holding tank was noticed. The pump capacity and operational schedule
was modified to reduce the energy consumption. Following this, a significant reduction in energy use
for the system was observed from mid July 2011 (depicted in Figure 19). Specifically, an energy
saving of 63.3 kWh/day was achieved soon after the modification of chlorine mixing pump. The
average energy consumption dropped to 71.1 kWh/day thereafter. Further fine-tuning on the operation
of the chlorine mixing pump, by using an automated timer to regulate the on and off cycles of the
pump, helped to reduce the energy requirements down to 52.7 kWh/day. Initially the chlorine mixing
pump operated with timer having schedule 1hr on and 1/2 hr off, which was further fine tuned to 2
hours on and 3 hours off resulting in further reduction in energy consumption. The total reduction in
energy requirements was equivalent to 81.7 kWh/day, which was close to a total of 60% reduction in
energy use in comparison to the initial 16-month monitoring period.
Figure 19: Daily energy consumption of the decentralised wastewater system at Capo di Monte from March 2010 to March 2012.
In addition to monitoring the overall energy use of the wastewater system at CDM, each treatment
technology within the system was also monitored for their energy efficiency. Figure 20 shows the
specific energy requirements for each treatment process, expressed in kWh/kL of treated wastewater.
The specific energy requirement for the whole system was relatively high at 15.6 kWh/kL (Figure 20
a), with 61% of the total energy being used for the chlorine mixing pump. The chlorine mixing pump
was continuously mixing water with added chlorine solution using a 5.5 kW pump operating 24 hours
a day. Following modifications to the operational cycle of chlorine mixing pump, the overall specific
energy requirement for the system was reduced to 11.0 kWh/kL (Figure 20 b). The CMD body
corporate in November 2012 decided to install a lower capacity chlorine mixing pump (1.1kW), which
will save significant energy in the overall operation of recycling system (personal communication with
plant operator on 21st Jan 2013). In comparison, Gil et al. (2010) has reported that a wastewater
treatment plant operating at a similar scale (ie, kL/day) and using a similar membrane to that at CDM
(a Kubota submerged membrane), had a specific energy requirement of between 4.9 to 6.1 kWh/kL.

Decentralised Wastewater Treatment Systems: System Monitoring and Validation Page 28
The next highest specific energy requirement at CDM was the aerators in the MBR, using
3.81 kWh/kL (24% of the total system specific energy requirement). Both fine and coarse aerators
were used for enhancing the oxygen mass transfer for biological oxidation and for scouring to remove
the fouling film build-up over the membrane surface. In comparison, Gil et al (2010) reported a
specific energy requirement for the aerator unit of between 1.80 to 2.40 kWh/kL, substantially lower
than the requirement for the aerators in the CDM system. This was followed by the specific energy
requirements from the returned activated sludge (RAS) pump (0.89 kWh/kL, 6%); anoxic mixer
(0.55 kWh/kL, 4%); treated effluent distribution pump (0.51 kWh/kL, 3%); ultraviolet (UV)
disinfection unit (0.33 kWh/kL, 2%) and the sewer pump (0.06 kWh/kL, 0.4%). The process with least
specific energy requirement was the moving screen (0.004 kWh/kL, 0.03%), which was used to filter
out the coarse particles from the influent wastewater pumped into the MBR.
Aerobic/MBR
Areation, 3.81
kWh/kL, 24%
Screen, 0.004
kWh/kL, 0.03%
Sewer Pump, 0.06
kWh/kL, 0.4%
Ras Pumps, 0.89
kWh/kL, 6%
Anoxic Mixing, 0.55
kWh/kL, 4%
UV, 0.33 kWh/kL,
2%
Distribution Pump,
0.51 kWh/kL, 3%
Recycled tank
mixing, 9.43 kWh/kL,
61%
(a)
RAS Pumps, 1.16
kWh/kL, 10.6%Anoxic Mixing, 0.71
kWh/kL, 6.5%
Distribution Pump, 0.50
kWh/kL, 4.6%
Sewer Pump, 0.08
kWh/kL, 0.7%Screen, 0.01 kWh/kL,
0.1%Aerobic/MBR Aeration,
4.12 kWh/kL, 37.5%
UV, 0.46 kWh/kL, 4.2%
Recycled Tank, 3.93
kWh/kL, 35.9%
(b)
Figure 20: Breakdown of specific energy requirement by the decentralised wastewater system at Capo di Monte. (a) Before optimisation. (b) After optimisation.

Decentralised Wastewater Treatment Systems: System Monitoring and Validation Page 29
Figure 20 (b) shows the breakdown of specific energy requirement after modifications to the chlorine
mixing pump. There was a significant change in the specific energy requirement for the chlorine
mixing pump, dropping from 9.4 kWh/kL (61%) to 3.9 kWh/kL (36%), resulting in a specific energy
decrease of approximately 5.50 kWh/kL. As a result, the specific energy requirement for the whole
system reduced by 66%.
The highest specific energy requirement was observed for the aerator units at 4.12 kWh/kL (37.5%). A
greater degree of aeration was required to scour the membrane from fouling film build-up, and this
resulted in an increase in the specific energy requirement. This was followed by the energy
requirements associated with the recycled tank chlorine mixing pump (3.93 kWh/kL, 35.9%); RAS
pump (1.16 kWh/kL, 10.6%); anoxic mixer (0.71 kWh/kL, 6.5%); treated effluent distribution pump
(0.50 kWh/kL, 4.6%); ultraviolet (UV) disinfection unit (0.46 kWh/kL, 4.2%) and the sewer pump
(0.08 kWh/kL, 0.7%). The item with the lowest specific energy requirement was the moving screen
(0.01 kWh/kL, 0.1%).
Apart from optimising the operation of chlorine mixing pump to reduce its specific energy
requirement, a significant effort was also taken to ensure that the point chlorination was still optimal at
the residual chlorine concentration of 1 ppm. This is important as the chlorination step in the holding
tank constitutes the last disinfection process before the final reticulation of treated effluent to local
households for non-potable uses, and as such, a suboptimal concentration level of chlorine presents a
potential health risk. Continual monitoring of the system for both the specific energy requirement and
residual chlorine concentration levels showed that the pump operated most efficiently when it was run
for one hour, followed by a 2-hour shutdown. Figure 21 shows the relationship between the specific
energy requirement for the chlorine mixing pump and the residual chlorine concentration level
measured in the holding tank. It can be seen that when the chlorine mixing pump was operated in a
cyclical manner from September 2011 the minimum chorine residual concentration was maintained
and the specific energy for mixing was reduced.
Figure 21: The time variation in specific energy requirement for the chlorine mixing pump and the residual chlorine concentration measured in the holding tank at Capo di Monte.
Further analysis was conducted to investigate the effect of seasonal variations on the energy
requirement of the treated effluent supply. It was expected that seasonal variations would have a
minimal effect on the energy requirement of the system owing to the constant water demand for toilet
flushing and limited demand for outdoor irrigation. Figure 22 shows the effect of seasonal variation on
the overall energy requirement on treated effluent demand in CDM. This analysis is based on the data
on energy consumption before the modifications in chlorine mixing pump operations. Overall, the
specific energy requirements over each season were relatively similar (except winter), with a mean
around 137 kWh/day. The winter value was a much lower at 121.9 kWh/day.

Decentralised Wastewater Treatment Systems: System Monitoring and Validation Page 30
The effect of seasonal variation on the specific energy requirement on treated effluent demand at
CDM was also investigated. This gave a better indication of how efficiently the decentralised
wastewater system at CDM operated throughout each season. Figure 23 shows that summer had the
highest specific energy requirement of 19.90 kWh/kL, followed by autumn (19.71 kWh/kL) and spring
(16.74 kWh/kL). The least specific energy requirement was measured during winter (16.45 kWh/kL).
There is nearly 10% difference in specific energy consumption during summer and winter period.
Further assessment would be required to understand the reasons for this difference.
137.7 138.9135.2
121.9
45.00
55.00
65.00
75.00
85.00
95.00
105.00
115.00
125.00
135.00
145.00
Spring Summer Autumn Winter
En
erg
y C
on
su
mp
tio
n
(kW
h/d
ay)
Figure 22: Seasonal variation in the daily energy requirement for treating wastewater at Capo di Monte (before the optimisation of the chlorine mixing system).
16.74
19.90 19.71
16.45
0.00
5.00
10.00
15.00
20.00
25.00
Spring Summer Autumn Winter
Sp
ecif
ic e
nerg
y
(kW
h/k
L)
Figure 23: Seasonal variation in the specific energy requirement for treating wastewater at Capo di Monte (before the optimisation of the chlorine mixing system).
3.3.2. Currumbin Ecovillage
The energy efficiency of the decentralised wastewater system at the CEV was assessed using the
monitored data as described in Section 2.4.1. Figure 24 shows the monitored energy consumption
(kWh/day) of the wastewater system at the CEV over a one-year time period, from December 2010 to
December 2011. It can be seen the average energy requirement was 38.5 kWh/day and remained
relatively steady, with a minor increase occurring toward the latter part of the monitoring period. This
increase may have been due to a small increase in the amount of treated effluent produced.

Decentralised Wastewater Treatment Systems: System Monitoring and Validation Page 31
Figure 24: Daily energy usage by the decentralised wastewater system at Currumbin Ecovillage over a 12-month period.
The overall specific energy requirement for the decentralised wastewater system at the CEV was
1.67 kWh/kL based on one year of monitoring data. Figure 25 shows the breakdown of this specific
energy requirement among various components. The specific energy requirement for the textile
filtration pump was the highest at 0.92 kWh/kL, which comprised 69% of the overall specific energy
requirement. This was followed by the sewer pumping (0.22 kWh/kL 16%); bore water pumping
(0.07 kWh/kL, 5%); recycled water distribution and pumping (0.06 kWh/kL, 4%); pumping water
from transfer tank (0.05 kWh/kL, 3%) and the microfiltration unit (0.03 kWh/kL, 2%). The least
specific energy requirement was for pumping water from the covered storage tank (0.02 kWh/kL, 1%).
It should be noted that the UV disinfection unit was not working over the monitoring period, and as a
result its specific energy requirement could not be measured.
Pumping Water From
Transfer Tank, 0.05, 3%
Textile Filtration Pump,
0.92, 69%
Pumping Bore Water,
0.07, 5%
Pumping Sewerage,
0.22, 16%
Pumping Water From
Covered Storage Tank,
0.02, 1%
Microfiltration, 0.03, 2%
UV, 0.00, 0%
Distributing Recycled
Water, 0.06, 4%
Figure 25: Breakdown of specific energy requirement for the decentralised wastewater system at Currumbin Ecovillage. The UV disinfection unit was not operational during the 12 month monitoring period.

Decentralised Wastewater Treatment Systems: System Monitoring and Validation Page 32
An analysis was also conducted to investigate the effect of seasonal variation on the daily energy
requirement on treated effluent demand in the CEV. Figure 26 shows the average daily energy
requirements ranged from 35.04 kWh/day in autumn to 45.84 kWh/day in spring. This variation was
similar to that found at CDM (see Figure 22). The overall energy required to operate the wastewater
treatment and reticulation system at the CEV remained relatively constant, except during spring,
where energy consumption was about 17% higher.
37.8735.04
37.86
45.84
0.00
5.00
10.00
15.00
20.00
25.00
30.00
35.00
40.00
45.00
50.00
Summer Autumn Winter Spring
En
erg
y C
on
su
mp
tio
n
(kW
h/d
ay)
Figure 26: Seasonal variation in the daily energy requirement for treating wastewater at Currumbin Ecovillage.
Figure 27 shows the effect of seasonal variation on the specific energy requirement for treated effluent
at CEV. The highest specific energy requirement of 2.00 kWh/kL occurred in summer, with autumn
(1.85 kWh/kL) and winter (1.51 kWh/kL) recording the second and third highest energy requirements
respectively. The lowest specific energy requirement was measured during spring (1.41 kWh/kL).
Further investigation is required to identify the factors for the specific energy differences in winter and
spring versus summer and autumn seasons.
2.001.85
1.511.41
0
0.5
1
1.5
2
2.5
Summer Autumn Winter Spring
Sp
ecif
ic e
nerg
y
(kW
h/k
L)
Figure 27: Seasonal variation in the specific energy requirement for treating wastewater at Currumbin Ecovillage.
Decentralised Wastewater Treatment Systems: System Monitoring and Validation Page 33
3.4 Environmental Impact - Carbon Footprint
3.4.1 Capo di Monte Total Carbon Footprint
As is the case with all sewage treatment plants, decentralised systems require a supply of electricity to
adequately complete the necessary processes involved in transporting and treating wastewater. Due to
the economies of scale, decentralised systems often have a higher specific energy requirement in
comparison to their larger centralised counterparts. This initial increased demand for energy is
exacerbated by the continuous operation of specialised treatment systems with a high daily energy
requirement, such as aerated MBRs. This study has revealed that the MBR treatment system at CDM
consumed as much as 134.4 kWh/day before alterations were made to the chlorine mixing tank pump.
Following these alterations, energy consumption decreased to 71.1 kWh/day. From this total energy
consumption, an emission factor can be applied to determine the carbon dioxide (CO2) equivalent
emissions directly occurring from day to day operations performed by the CDM MBR. The National
Greenhouse Accounts (2008) states that the emission factor for coal electrical power in Queensland is
0.91 kg CO2-e/kWh. Therefore, the wastewater treatment process at CDM was responsible for direct
emissions 122.3 kg CO2-e/day before the tank pump alterations were made, reducing to
64.7 kg CO2-e/day under the current operating regime.
In addition to the CO2 emissions released due to the electrical energy consumed onsite, fugitive gas
emissions are also released during the breakdown of organic matter by microorganisms living in the
wastewater. The three primary fugitive gases are CO2 and nitrous oxide (N2O) (generally released
during aerobic treatment processes) and methane (CH4) (usually released during anaerobic treatment
processes). In order to estimate these emissions, the US EPA/RTI (2010) draft approach on GHG
emissions from wastewater treatment was used. Using this theoretical framework, the estimated
fugitive emissions generated by CDM was 8.79 kg CO2-e/day, which is equivalent to
1.14 kg CO2-e/kL. As such, at CDM the direct emissions footprint generated by daily energy
requirements outweighed the fugitive emissions footprint by a contribution factor of 14 to 1 (or by 7 to
1 following the modifications to the tank pump).
Therefore, the total combined direct (electrical) and fugitive daily emissions from the CDM
wastewater treatment plant was 131.1 kg CO2-e/day (47.85 t CO2-e/yr). Following the alteration to the
tank pump, the combined emission footprint reduced to 73.5 kg CO2-e/day (26.82 t CO2-e/yr). These
modelled fugitive gas estimates have been directly compared to online fugitive gas measurements
made using a flux hood combined with an infrared gas analyser as described in Section 3.5.3.
3.4.2 Currumbin Ecovillage Total Carbon Footprint
As outlined in previous sections, typical values for the specific energy used by the CEV site remained
around 2.00 kWh/kL throughout the year. Therefore, as a result of this low specific energy
requirement, the direct emissions impact on the environment is relatively low for the CEV site. After
allowing for volumes of treated wastewater, the site consumes approximately 38.5 kWh/day, which is
equivalent to 35.1 kg CO2-e/day or 12.8 t CO2-e/year. However, the environmental impact resulting
from fugitive emissions must also be taken into account. The treatment regime at CEV is based on
anaerobic digestion, and as a result, the fugitive emissions are expected to be greater than the
emissions related to daily energy consumption. Limited water quality data was been recorded for daily
operations at the CEV, therefore we used the US Federal GHG Accounting Draft (2010) equations to
estimate the fugitive emissions. From this, it was determined that the septic system emits
approximately 5.85 kg CH4/day or 2.14 t CH4-e/year. When applying the IPCC GWP this equates to
134.6 kg CO2-e/day or 49.15 t CO2-e/year, which is around 5.35 kg CO2-e/kL, compared to only
1.14 kg CO2-e/kL for CDM (see Section 3.5.1). The total combined direct and fugitive emissions
measured from the CEV were equal to 61.95 t CO2-e/year (6.82 kg CO2-e/kL), which is 35.13 t CO2-
e/year higher than the total combined direct and fugitive emissions from CDM (following the
modifications to the tank pump).

Decentralised Wastewater Treatment Systems: System Monitoring and Validation Page 34
3.4.3 Fugitive Greenhouse Gas Total Carbon Footprint Component - Measured Direct Emissions
3.4.3.1 Measured Direct Fugitive Emissions
In order to determine the accuracy of the modelling techniques for fugitive emissions calculated for
CDM in Section 3.5.1, fugitive N2O and CH4 emissions (measured as a daily flux value) were
measured in real-time on the surface of the aerobic and anaerobic tanks of the CDM MBR system over
a three-day interval during late winter. N2O and CH4 emissions were specifically measured from the
aerobic and anoxic tanks as these had the largest physical footprint and were most atmospherically
exposed (ie. largest uncovered surface area) of all the treatment processes and stages at the CDM site.
Hence they had the greatest potential to emit the highest cumulative emissions over time.
N2O and CH4 fluxes were sampled at a single position on the surface area of each tank. Figure 28 (a)
and Figure 37 (b) displays a top down view of the aerobic and anoxic tanks of the MBR system
respectively. Table 4 details the average values for water quality parameters measured in these two
systems during the measurement campaign, along with the average N2O and CH4 flux measured over
the sampling period. Standard deviation calculations for each of the measured parameters and flux
values are also presented in this table. N2O and CH4 emissions were not measured from the CEV site
as the septic tanks and the other connected treatment systems did not have sufficient physical space to
fit the flux hoods. As such, in order to perform future gas flux measurements at the CEV site, novel
miniaturised gas collection devices will have to be designed and built.
Figure 28: A) The CDM MBR aeration tank (the MBR is submerged in the sewage on the left hand side of the photograph); B) The CDM MBR anoxic tank with the sludge stirrer in operation.
Table 4: Treatment process peripheral water quality metadata and average raw fugitive emissions for the MBR system.
System Type
Dissolved Oxygen (mg/L)
(Mean, ± Std. Dev)
pH (Mean, ± Std. Dev)
Conduct.
(mS/cm) (Mean, ± Std. Dev)
Sewage Temperature (oC) (Mean, ±
Std. Dev)
CH4 Emission (g CH4/m
2/d) (Mean, ± Std.
Dev)
N2O Emission (g N2O/m2/d) (Mean, ± Std.
Dev)
No. of Meas. (n)
MBR System Aerobic Section
Winter
0.5 (±0.2)
6.88 (±0.1)
520.92 (±255.23)
21.34 (±0.11)
0.001 (±0.005)
0 (NA)
24
MBR System Anoxic Section
Winter
NA (sludge
too thick to measure)
6.84 (±0.16)
284.46 (±282.9)
20.97 (±0.5) 1.36 (±2.43)
0.035 (±0.038)
48
B) A)
Flux Hood

Decentralised Wastewater Treatment Systems: System Monitoring and Validation Page 35
The gas analysis followed a methodology similar to that originally used by Tremblay et al. (2004)
based on the original technique presented by Carignan (1998). In-situ gas collection was made on the
sewage surfaces with a buoyant airtight flux hood (Ac’Scent Flux Hood, St Croix Sensory Inc., United
States) connected to a primary standard calibrated (traceable to the National Institute of Standards and
Technology) non-dispersive infrared (NDIR) gas analysis unit (VA-3000 Series, Horiba Ltd., Japan)..
The particular flux hood and NDIR gas analysis unit combination was chosen primarily due to its ease
of use, portability, ruggedness and rapid flux calculation capability, which facilitated the real-time
measurement of gas fluxes within the time frame of a single day.
During a single flux measurement, surface off-gases were collected in the flux hood and sent through
to a gas conditioning system (VS-3000 Series, Horiba Ltd., Japan) via a pump operating at a constant
flow rate. This gas conditioning system extracted all water vapour and other particulates (such as
acids) from the gas stream before it entered the NDIR gas analysis unit. After the CH4 and N2O
constituent gas concentrations had been evaluated by the NDIR gas analysis unit, the sampled gases
were sent back into the flux hood so that they could be mixed continuously, allowing for a much more
accurate measure of gas concentration to be obtained over time (Lambert and Frechette 2005;
Tremblay et al. 2009). Gas concentrations were recorded over 10 (± 5) minutes at set intervals in order
to reduce the overall influence of the “chamber effect” (Venterea et al. 2009). The flux hood was held
in place with a tightened rope to minimise the effect of oscillations on the sewage surface (most
especially on the surface of the aeration tank) and to hold the flux hood in the same position over the
sampling period. After each recording, the flux hood was lifted from the sewage surface so that gas
concentrations within the hood could return to ambient levels before the next measurement. The gas
concentration data was logged continuously to a laptop computer starting at 0900 (± 100) hours until
1430 (± 100) hours during each day of sampling. From this sampling regime, diurnal gas flux patterns
could be readily determined. Figure 29 (a) shows the deployment of the flux hood on top of the CDM
MBR aeration tank whilst Figure 29 (b) shows the NDIR gas analyser, the gas conditioner and the
laptop computer used as a data logger.
Figure 29: Example deployment of the gas analysis system in the field – A) The flux hood on top of the CDM MBR aeration tank; B) The gas analysis and data collection workstation.
Continuous measurement of various water quality parameters were made simultaneously to the gas
flux measurements using a water quality sonde (Aquameter, Aquaread Ltd., United Kingdom), with
the sonde positioned no more than 0.5 m away from the flux hood. The sonde was lowered
approximately 0.5 to 1 m under the sewage surface during sampling. The water quality parameters that
were measured included: temperature, pH, dissolved oxygen and conductivity. At the beginning of the
measurement series, the water quality sonde was calibrated using standard calibration solutions
provided by the sonde manufacturers (RC-600 RapidCal, Aquaread Ltd., United Kingdom).
A) B)

Decentralised Wastewater Treatment Systems: System Monitoring and Validation Page 36
Additional water quality data and plant operational data, such as influent flow rate, influent total N
mass load, influent total COD and BOD mass load, dissolved oxygen delivery profiles and inflow
pump timings were obtained from the routine measurement campaign (specified in Section 2.5) and
from the CDM site supervisor as required.
In order to calculate CH4 and N2O gas flux, a linear regression was applied to the gas concentration
data (in parts per million (ppm) (y-axis)) versus the sampling time (in seconds (x-axis)). Only data sets
with a high R2 were used for flux calculations. Over the entire measurement campaign, close to 90%
of all 49 valid CH4 emission concentration data sets had an R2 of over 0.5, and 34% of all 32 valid
N2O emission concentration data sets had an R2 of 0.5 or greater. The lower proportion of N2O gas
concentration data sets having an R2 > 0.5 in comparison to the CH4 gas concentration data sets was
due to the raw peak N2O emissions being much lower in magnitude (at times only slightly higher than
the ambient N2O, which was usually no greater than 2 ppm) compared to the raw peak emitted CH4
emissions (that were often as high as 323 ppm, almost 100 times greater than the ambient CH4). Gas
flux was calculated directly using the following Equation 2 (Tremblay et al. 2004):
A
VmFlux
(2)
Where: m is the slope from the linear regression set to the gas concentration data over the sampling
time (ppm second-1
); V is the volume under the flux hood (m3); is a gas concentration conversion
factor (for CH4: 655.47 mg/m3/ppm; for N2O: 1798.56 mg/m
3/ppm); is a temporal conversion factor
(86400 seconds/day); A is the area under the flux hood (m2) and is a magnitude conversion factor
(106 mg/g). Flux is given in g/m
2/d.
All CH4 and N2O flux measurements were weighted to their respective IPCC GWP ratings (25 for CH4
and 298 for N2O) and converted to a CO2 flux equivalent.
In order to make a basic emission factor (EF) estimation, the mean N2O emission measured over the
three day measurement campaign was normalised to the total annual NINFLUENT, and the mean CH4
emission recorded over the three day measurement campaign was normalised to the total annual
CODINFLUENT for the CDM MBR system. The total annual NINFLUENT and the total annual CODINFLUENT
values were extrapolated from average NINFLUENT and CODINFLUENT values determined from daily grab
samples obtained during the measurement campaign as detailed in Section 2.5. The EFs were
calculated (during the three different operational conditions) using Equations 3 and 4:
%1002
2
TOTALANNUALINFLUENT
MEAN
N
ONOEFN
(3)
%1004
4
TOTALANNUALINFLUENT
MEAN
COD
CHEFCH
(4)
Where: N2OEF and CH4EF are the annual emission factors for N2O and CH4 respectively; (N2O)MEAN
is the mean of the N2O flux measurements (metric tonnes) made over the measurement campaign
integrated over the entire tank surface area (both aerobic and anoxic sections); (NINFLUENT)ANNUALTOTAL is
the annual total N (metric tonnes) arriving in the influent at the CDM site from the retirement village;
(CH4)MEAN is the mean of the CH4 flux measurements (metric tonnes) made over the measurement
campaign integrated over the tank surface area (both aerobic and anoxic sections) and
(CODINFLUENT)ANNUALTOTAL (metric tonnes) is the annual total COD arriving in the influent at the CDM
site from the retirement village.
The averaged daily CO2 equivalent CH4 flux and N2O fluxes measured from the aerobic and anoxic
tanks from mid morning to mid afternoon in winter is shown in Figure 30 a) and Figure 30 b)
respectively. Emissions were measured from the aerobic and anaerobic tanks during normal operating

Decentralised Wastewater Treatment Systems: System Monitoring and Validation Page 37
conditions; after a two-hour complete system shutdown; and after a tank cleaning and surface hose
down (surface watering) in the early morning (at approximately 0800 hours).
It was found that the aerobic tank did not emit any fugitive gases, apart from a very small amount of
CH4 released after surface watering. This small amount of CH4 may have been released from sludge
deposited via water spray from the anoxic tank. The anoxic tank emitted highly variable amounts of
both CH4 and N2O during all three operational conditions, with the highest level of CH4
(53 g CO2-e/m2/d) being emitted after a 2-hour site shutdown period, whilst the most N2O
(17 g CO2-e/m2/d) was emitted when the MBR system was working under normal conditions.
The measured results directly contradict the modelled data presented in Section 3.5.1 and estimates
from Chong et al. (2011) (who employed the Sasse (1998) model), which predicted that a net total of
zero direct CH4 emissions should take place from the CDM MBR system over a single year. In
addition, the gross N2O emissions estimation of 0.9 tonnes of CO2-e/year from Section 3.5.1 and the
estimation of 0.23 kg CO2-e/kL made by Chong et al. (2011) (using the modelling method specified
by Foley and Lant (2009)) was found to significantly overestimate the actual measured total N2O
emissions from both the aerobic and anoxic tanks by an approximate factor of 15. This result suggests
that the application of fugitive gas modelling assumptions based on large treatment plants to smaller
scale decentralised systems may not be reliable. The data used in semi-empirical emission models for
large-scale WWTPs is often obtained from real-world measurements made using water quality
measurement instrumentation, from grab samples analysed in a laboratory or from inferences or
extrapolations from previously published data. Before insertion into a model, this data is usually
averaged out over an extended time interval (generally over the space of one year), and as a result,
events such peaks, troughs and shock loads in the daily data stream are smoothed out or are
completely removed. In addition, empirical emission factors and organic load conversion factors are
also used in models, which generally have been derived from measurements taken from WWTPs using
entirely different treatment and management practices to the WWTP under analysis. Also, numerous
basic assumptions about end use practices and influent quality within the catchment area can also be
made in the modelling, which can lead to further inaccuracies in the synthetic emissions data. As a
result, it is recommended that all modelled emissions data for decentralised systems should be
calibrated and validated against online measurements made with appropriate gas analysis equipment
over an extended operational period.
Interestingly, the lowest emissions of both CH4 and N2O were measured over the anoxic tank after
cleaning and surface watering was performed. This reduction may have been due to the sprayed and
deposited water forming a microlayer membrane or a thicker film as a protective barrier over the
sewage surface, which may have prevented a large proportion of gases from being released into the
atmosphere. During all operational conditions, CO2 emissions were also found to be released from
both the aerobic and anoxic sections of the MBR system. However, this CO2 is widely regarded as
being a short-term biogenic gas readily produced by the breakdown of organic matter. As it is not
generated by fossil fuel burning and does not measurably contribute to the greenhouse effect, it is not
included in the total GHG emissions footprint and, as such, this CO2 emissions data is not being
presented here.
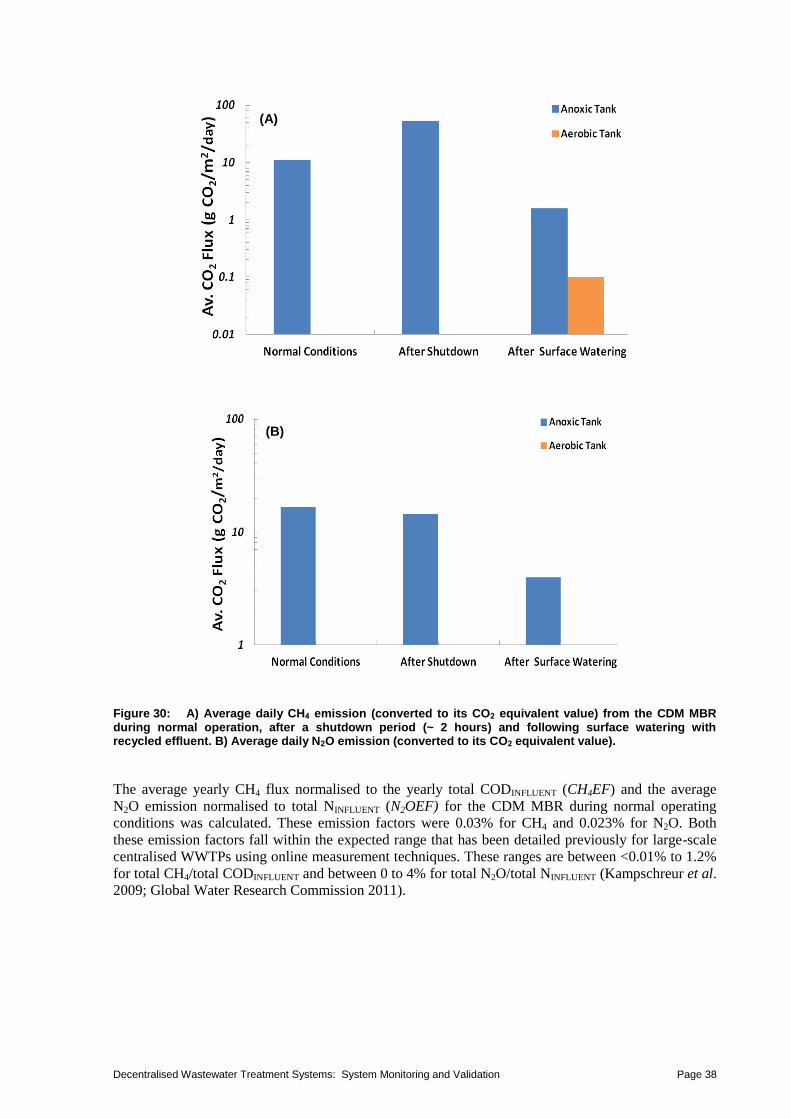
Decentralised Wastewater Treatment Systems: System Monitoring and Validation Page 38
Figure 30: A) Average daily CH4 emission (converted to its CO2 equivalent value) from the CDM MBR during normal operation, after a shutdown period (~ 2 hours) and following surface watering with recycled effluent. B) Average daily N2O emission (converted to its CO2 equivalent value).
The average yearly CH4 flux normalised to the yearly total CODINFLUENT (CH4EF) and the average
N2O emission normalised to total NINFLUENT (N2OEF) for the CDM MBR during normal operating
conditions was calculated. These emission factors were 0.03% for CH4 and 0.023% for N2O. Both
these emission factors fall within the expected range that has been detailed previously for large-scale
centralised WWTPs using online measurement techniques. These ranges are between <0.01% to 1.2%
for total CH4/total CODINFLUENT and between 0 to 4% for total N2O/total NINFLUENT (Kampschreur et al.
2009; Global Water Research Commission 2011).
(A)
(B)

Decentralised Wastewater Treatment Systems: System Monitoring and Validation Page 39
4. CONCLUSION
Decentralised wastewater treatment and reuse can supplement potable water significantly to reduce
load on freshwater resources. This also has reduced environmental impact from the discharge of
pollutant loads on receiving waters. In addition, decentralisation of urban water systems can bring
much flexibility to suit local climatic conditions, water demand, water quality objectives and end uses.
As the decentralised wastewater treatment and reuse require local reticulation systems, the long
distance wastewater transportation to distant centralised treatment plants can be avoided. These
systems can provide wastewater services where servicing through centralised systems are not possible
due to economic and environmental conditions.
This report has addressed some of the knowledge gaps on decentralised wastewater recycling systems,
in terms of technologies, design, operation, performance, reliability, and GHG emissions. The study
has explored the ability of two very different design systems, servicing different populations and
utilising a range of technologies to operate effectively and produce effluent meeting Class A+ recycled
water standards.
The suitability for greenfield developments to adopt decentralised water reuse schemes and the
selection of scale and treatment technologies depend on many site specific factors. A GIS
methodology for assessing the spatial suitability of decentralised wastewater treatment systems has
also been developed and described. The assessment criteria used for the GIS analysis essentially
included: 1) existing and planned infrastructure and capacity for wastewater servicing; 2) biophysical
conditions of the development; and 3) local demographics, urban form, and wastewater demand for
reuse.
Wastewater samples were analysed for the CDM case study system and found that the COD, BOD and
TN water quality values were higher than for centralised systems. The specific energy requirement
was found to be significantly different across the two different treatment technologies employed at
CDM and CEV. In addition, a treatment analysis model (BioWin) highlighted that the MBR plants are
quite robust and can take shock loads to a significant level (30%). A risk assessment performed using
long-term water quality data from the CDM MBR technology indicated that the probability of
exceedance against EPA approved effluent quality is very low. Manual and electronic recording of
water flow throughout CDM and CEV systems delivered two data sets spanning from 11 to 24
months. This data provided the basis for a quantitative comparison of the self-reliance and operational
efficiencies of the two facilities. The decentralised water recycling systems at CDM and the CEV were
both found to operate under a continually high self-reliance of nearly 90%. This figure represents the
percentage of the community’s water demand that was met by onsite rainwater harvesting and
wastewater recycling. The remaining shortfall of approximately 10% was supplied by an onsite bore.
Similarly to the flow data, manual and electronic recording of the energy consumption of each facility
was carried out across a period of 24 months. Analysis of the systems has illustrated that the specific
energy requirements of the CDM and CEV wastewater treatment and recycling were in the order of
17.1 kWh/kL and 1.67 kWh/kL respectively. The higher specific energy requirement observed at
CDM was primarily caused by a 5.5 kW chlorine mixing pump positioned in the recycled water tank.
The pump contributed 61% of the energy demand, which was excessive as its only function was to
ensure the homogenous mixing of chlorine. This pump was considered to be oversized, and as such it
was suggested that running the pump via an automated timer in an alternating work schedule would be
a more cost-effective option. Action was taken, and an automated timing device was introduced to
better manage pump operation. Subsequent monitoring of the system showed the overall energy
consumption reduced to around 11.0 kWh/kL. The body corporate has now replaced the existing
5.5kWh chlorine mixing pump with 1.1kWh capacity pump.
Diurnal modelling of the CDM system, when operating under ‘normal’, ‘extremely wet’ and
‘extremely dry’ conditions was completed. Regardless of the daily conditions, the flow regime across
a 24-hour period remained similar with a morning peak occurring at approximately 7:30 am to 9:30
am and an evening peak taking place at 4:30 pm to 6:30 pm. Again, these results reflect the outcomes
delivered by previous studies.

Decentralised Wastewater Treatment Systems: System Monitoring and Validation Page 40
The operation of the CDM and CEV wastewater treatment and recycling plants contribute to global
GHG emissions. This study has calculated the direct energy emissions of CDM to be
16.44 kg CO2-e/kL prior to modification of the chlorine mixing pump installation. Following
modification of the tank pump, emission levels dropped to 9.55 kg CO2-e/kL. The direct energy
emissions at CEV were estimated as 1.46 kg CO2-e/kL. With the aid of the US EPA estimation
equations, it was estimated that the fugitive emissions from wastewater treatment at CDM were
1.14 kg CO2-e/kL. The CEV plant was found to emit significantly higher fugitive gas emissions,
releasing an estimated 5.36 kg CO2-e/kL. In comparison, the centralised wastewater treatment plants
studied by de Haas (2009) had average direct emissions ranging from 0.23 to 0.82 kg CO2-e/kL for
plant capacities between >100 ML/d and <10 ML/d.
In order to obtain an improved understanding on the total GHG emission footprint produced by a
decentralised WWTP, direct measurements of fugitive methane and nitrous oxide emissions from the
anoxic and aerobic sections of the CDM MBR system were carried out using infrared gas analyser in
combination with a gas capture flux hood. These measurements revealed that maximum levels of
methane (0.188 t CO2-e/year) were emitted after a 2-hour site shutdown period, and maximum levels
of nitrous oxide (0.06 t CO2-e/year) were emitted when the MBR system was working under normal
conditions. These measured emissions conflicted directly with modelled estimations made previously
for the CDM MBR. As a result, it is recommended that the application of wastewater treatment carbon
footprint estimation models designed for large-scale systems may not be suitable for decentralised
systems and should be calibrated against online measurements in order to evaluate their accuracy and
applicability.

Decentralised Wastewater Treatment Systems: System Monitoring and Validation Page 41
APPENDIX 1. Discharge Licences of Capo Di Monte and the Currumbin Ecovillage Treatment Plants
Indicators Unit
Capo Ecovillage Capo Ecovillage Capo Ecovillage Capo Ecovillage Capo Ecovillage Capo Ecovillage
BOD5 mg/L 10 10 20 30 weekly monthly
TSS mg/L 10 10 20 30 weekly monthly
DO mg/L 2.0 2.0 weekly weekly
Turbidity NTU 2.0 2.0 continuous continuous
pH 6.0 6.0 8.5 8.5 weekly weekly
TN mg/L 10.0 15.0 20.0 50.0 45.0 monthly monthly
NH4+-N
TP mg/L 7.0 10.0 10.0 15.0 30.0 monthly monthly
free Cl2 mg/L 1.0 1.0 daily daily
E.coli colony units/100 mL 10.0 10.0 weekly weekly
Viruses/
protoza colony units/100 mL 10.0 10.0 weekly weekly
Note
Issued Date Capo - 28/05/2008
Ecovillage - 17/09/2007
Maximum FrequencyMinimum Median 50th Percentile 80th Percentile

Decentralised Wastewater Treatment Systems: System Monitoring and Validation Page 42
APPENDIX 2: Feasibility Study on Using Advanced Oxidation Technologies for Decentralised Wastewater Treatment
Background on Advanced Oxidation Technologies (AOTs)
With the increased awareness of environmental protection coupled with strong wastewater discharge
legislations, the need for green wastewater treatment technologies is growing. AOTs are considered as
an attractive green technology for wastewater treatment, considering their reported high destruction
efficiency for toxic pollutants that are usually resistant to conventional biological wastewater
treatment processes (Laera et al. 2011) All AOTs are characterised by a common chemical mechanism
which exploit the highly reactive nature of OH. radicals to unselectively denature reactive organic
pollutants found in wastewater. The benefits of utilising AOTs for advanced wastewater treatment
include: (1) reduction in the formation potential of disinfection by-products (DBPs); (2) operating at
ambient temperature and pressure; (3) complete oxidation of organics to carbon dioxide, water or
other harmless by-products, rather than just their removal from solution using conventional
adsorption, absorption or stripping treatment options (Chong et al. 2010a). Previous studies have
reported that pollutants that are not amenable to biological treatments, can be oxidised by integrating
a post-treatment AOT stage (Fedorak and Hrudey, 1984; Barreiro and Pratt, 1992; Reemtsma and
Jekel, 1997).
Although, the mechanism of all AOTs relies on the formation of OH. radicals, the formation pathways
can be different, and this may have important implication on operating and maintenance issues.
Table 1 shows the different AOTs which are commonly used for wastewater treatment, along with
their dominant chemicals or equipment used.
Table 1: Different types of AOTs used in wastewater treatment, along with the dominant chemicals or equipment used.
Process Chemicals or Equipment Used
Ozonation O3
Fenton and photo-Fenton processes Fe2+
+H2O2, Fe2+
+H2O2+UV
UV-based photolysis & chemical oxidation processes UV+O3, UV+H2O2, UV+O3+H2O2
Photocatalytic processes Semiconductor (TiO2 ZnO) +UV
Process Selection and Assessment Framework
In order to assess the feasibility of using AOTs as an advanced treatment option in a decentralised
wastewater treatment plant, a comprehensive process selection and assessment framework was
developed. Figure 1 shows the assessment framework (similar to Figure 1 in the main section), which
contains 6 major process selection criteria: (1) technical suitability, (2) system robustness,
(3) economic costing, (4) environmental impacts, (5) sustainability and (6) space requirements. This
framework was developed based on the scenario that AOTs will be retrofitted as an advanced
treatment option to existing wastewater treatment plants.
In this feasibility study, only the three main process selection criteria of technical, economic and
environmental feasibility were targeted to give a preliminary review on the AOTs considered for the
CDM case study. For the technical suitability criterion, the AOTs were assessed based on their
compatibility to the wastewater characteristics and operating conditions if applied downstream of the
wastewater treatment processes. These technical assessments include the evaluation of whether (1) the
AOTs can handle the wastewater characteristics (i.e. chemical oxygen demand (COD), biological
oxygen demand (BOD), nitrogen, phosphorus and total suspended solids) after the MBR treatment;

Decentralised Wastewater Treatment Systems: System Monitoring and Validation Page 43
(2) cope with the use of additive chemicals (i.e. pH correction, alum dosing, chlorination and other
oxidants) and (3) meet the process needs for different operating conditions (i.e. temperature and
pressure).
The economic feasibility was assessed by using first principle engineering cost estimation methods
based on the literature data available for the reaction rate constant (k, min-1
), base reactor volume (L),
unit treatment cost ($/1000 gallon) and specific energy (kWh/kL) (Mahamuni and Adewuyi, 2010). In
this instance, the rate constants for degradation of COD by different AOTs were assumed to have
average value comprised of three common pollutants of phenol, trichloroethylene (TCE) and reactive
azo dyes.
3
)(min)(min)(min)(min
111
1
DyeTCEPhenol
COD
kkkk (1)
By assuming a first-order rate equation, the total reaction time required to achieve the anticipated final
COD concentration was taken as the hydraulic retention time to size the AOT reactors for this
feasibility study.
tkC
CCOD
A
AO
ln (2)
COD
A
AO
k
C
C
t
)ln(
(min) (3)
where k is the first order rate constant (min-1
), CAO is the initial COD concentration (mg/L) and CA is
the final COD concentration (mg/L), and t is the total reaction time or residence time (min).
Subsequently, the AOT reactor size was estimated applying on Eq. (4):
min]/)[()[min](Re])[( LrateflowHydraulictimesidenceLvolumeAOTV (4)
where τ is the residence time (min), V is the AOT reactor volume (L) and ν is the hydraulic flow rate
(L/min). The unit treatment cost ($/L) was estimated by using available literature data for the capital,
operating and maintenance (O&M) costs. The total treatment cost for the AOTs was amortized at a
rate of 7% over an effective plant life of 30 years. In this instance, the power relationship known as the
six-tenths factor rule was used to estimate the unit treatment costs for each AOT assessed in this study
(Peters et al. 2004). This is to make use of the literature available data on the base reactor volume and
the corresponding unit treatment cost ($/1000 US galloon) (Mahamuni and Adewuyi, 2010).
0.6
cos ($) 1000cos ($ / )
1000 3785.412
estimated
base
V Base treatment t US gallonUnit treatment t L
V US galloon L
(5)
It should be stressed that the treatment costs estimated and used to assess the economic feasibility of
AOTs serves as a preliminary guide towards the selection of the most appropriate AOTs. The
treatment cost data should be obtained once the most feasible AOTs are selected from vendors. Such
information can be used to develop a cost function to accurately predict the economic feasibility for
the application of AOTs in decentralised wastewater systems. Unfortunately at the moment the cost
database for such systems is scarce and incomplete.

Decentralised Wastewater Treatment Systems: System Monitoring and Validation Page 44
The specific energy usage for different AOTs was assessed using Eq. (6). The available energy
intensity data (kWh/kL) from the literature was used for this estimation (Mahamuni and Adewuyi,
2010).
kL
kWhintensityEnergy
V
VkLkWhenergySpecific
base
estimated ][)/(
6.0
(6)
Comparison between different AOTs
As discussed, the integration or retrofitting of AOTs as an advanced wastewater treatment option for
existing WWTPs requires the development of proper assessment method, such as the one shown in
Figure 1. In this instance, the suggested technical assessments such as the evaluation of whether: 1) the
AOTs can handle the wastewater characteristics (i.e. COD, BOD, nitrogen, phosphorus and total
suspended solids); (2) can cope with the use of additive chemicals (i.e. pH correction, alum dosing,
chlorination and other oxidants) and (3) meet the process needs for different operating conditions (i.e.
temperature and pressure), should be considered and assessed thoroughly.
On the other hand, the basic understanding of the reaction mechanisms, operating conditions and
requirements, and any other process application constraints for the four AOTs of interest was reviewed
prior to the technical assessments. Table 2 shows a brief overview summary and comparison of the
formation mechanisms of OH- radicals in common AOTs, as well as a comparison of their operating
conditions, requirements and constraints. From Table 2, it can be observed that ozonation processes
operating at ambient temperature and pressure require strict pH control at alkaline conditions to avoid
the formation of conjugate base HO2- which can strongly affect the concentration of reactive radicals
formed (Hoigné, 1998). The presence of such conjugate bases might affect the short life time of ozone
in alkaline solution (Hoigné, 1998). Although the side formation of H2O2 can also play an
enhancement role during the decomposition of O3 to form OH., the detrimental effect of pH on its
formation has yet to be ascertained, as H2O2 in nature is a weak acid. The pH for pure H2O2 was
reported to be 6.2, but this pH can go as low as 4.5 when diluted at approximately 60% (i.e.
volume/volume %) (US Peroxide, 2011). Also, if the ozonation is to be retrofitted as an advanced
wastewater treatment option for the case study WWTP, additional equipment such as a reactor vessel
and special gas-liquid contactor for ozone sparging and distribution needs to be taken into account
(Gogate and Pandit, 2004).
As for the Fenton or photo–Fenton processes which include the UV/Fe3+
-Oxalate/H2O2 process in this
instance, their basic mechanism relies strongly upon the formation of OH. radicals via the reaction
with the iron species found in wastewater (Neyens and Baeyens, 2003). The benefits of the Fenton
based process are that iron is usually present in abundance in wastewater and the H2O2 is easy to
handle and is environmental friendly (Andreozzi et al. 1999). The only difference between the three
Fenton based processes is that the UV/Fe3+
-Oxalate/H2O2 system has the highest quantum efficiency of
1.0 – 1.2, followed by the photo–Fenton process with a low quantum yield of 0.14 (at 313 nm) to
0.017 (at 360 nm) and lastly, the Fenton process (Andreozzi et al. 1999). Other distinction between the
Fenton based processes and other AOTs is that the mechanism for the formation of reactive hydroxyl
radicals is preferred at a low acidic pH of 2.6 – 2.8. Andreozzi et al. (1999) reported that the use of the
UV/Fe3+
-Oxalate/H2O2 process provides a higher quantum efficiency due to accessibility to the wider
UV spectrum of 200-400 nm, which can generate a continuous Fenton’s reagent at only about 20% of
the energy required by typical photo-Fenton system. Similarly to other AOTs, the downside for the
Fenton based processes might be due to competition between the different hydroxyl derivatives,
organic and inorganic substrates found in wastewater.

Decentralised Wastewater Treatment Systems: System Monitoring and Validation Page 45
Figure 1: A comprehensive process selection and assessment framework for the application of AOTs in decentralised wastewater system for water recycling and reuse purposes.
System
Robustness
Hydraulic loadings perturbation
Wastewater qualities perturbation
Economic
Costing
Capital expenditures Operating and
Maintenance (O&M)
Environmental
Impacts
Sludge production Disinfection by-products
(DBPs) Odour and Noise End-uses and Receiving
environments
Sustainability
Energy efficiency Indirect GHG emission
(fossil fuel combustion) Direct GHG emission
(fugitive GHG)
Space
Requirements
Physical footprint Accessibility Plant expansion
Technical
Suitability
Wastewater characteristics Operating conditions
Process Selection
Criteria
Key Influencing
Factors
Wastewater samplings
In-situ sensory measurements
Reaction kinetics estimation
Wastewater calibration, validation and modelling
Dynamic model simulation and optimisation
Engineering cost estimation using percentage of delivered equipment approach
Detailed costing (if data available)
Life cycle costing
System and environmental monitoring
Survey on end-users’ satisfaction
Energy metering and monitoring
Mass and energy balances
Field measurements on fugitive GHG
Wastewater treatment process design
Land and site assessments
Assessment Methodology
and Approaches

Decentralised Wastewater Treatment Systems: System Monitoring and Validation Page 46
The UV–based photolysis and chemical oxidation processes utilise similar reactions but enhance the
formation of OH. radicals via the presence of a UV irradiation source. The presence of UV source
induces cleavage and formation of OH. radicals from its precursors (i.e. H2O2 or O3). A few examples
for AOTs that belong to this class are shown in Table 2. Among the different processes shown, it was
interesting to note that the reactivity for O3 decomposition under UV irradiation is much higher than
H2O2, where the molar extinction coefficient for O3 is 3600 M-1
cm-1
(254 nm) and that of H2O2 is 240
M-1
cm-1
(Andreozzi et al. 1999). Moreover, it should be noted that the O3/UV process possesses the
combined chemical behaviour of H2O2/UV and O3/UV as H2O2 is produced during the reaction. Other
than this, the AOTs were found to follow the standard operating conditions and requirements except
for the additional UV irradiation needs. Similarly, the UV–based photolysis and chemical oxidation
processes might get competition from other organic substrates, which might act as inner filters to
attenuate the intensity of UV lights used.
Among the AOTs detailed in Table 2, photocatalysis is an emerging type of heterogeneous AOT
process where the mechanism for OH. radicals generation occurs on the solid-liquid interface of the
semiconductor particles (Chong et al. 2010a). Usually the solid semiconductor particles such as TiO2
are suspended in the targeted effluent for treatment with the co-presence of UV irradiation with
wavelengths below 385 nm. The operating conditions are at ambient temperature and pressure.
However, the current application of TiO2 photocatalytic technology still faces the challenges of (1)
post-separation of semiconductor after water treatment; (2) rapid electron-hole recombination that
warrants low quantum efficiency; (3) mass transfer problems with oxygen, light and water pollutants
at the solid-liquid interface and (4) the semiconductor catalytic surface might get fouled by different
organic pollutants and inorganic ions in wastewater (Chong et al. 2010a & 2010b). A comprehensive
review of these issues was discussed previously in Chong et al. (2010a). After considering all these
operating conditions, requirements and constraints for the different AOTs of interest, it is necessary to
assess their technical suitability and applicability to decentralised wastewater systems in SEQ.

Decentralised Wastewater Treatment Systems: System Monitoring and Validation Page 47
Table 2: A brief overview summary and comparison on the formation mechanisms of HO radicals for common AOTs, as well as their common operating conditions, requirements and constraints.
Process Reaction Mechanism Operating Conditions and Requirements
Remarks Constraints
Ozonation [16] Ozonation
HO- + O3 → O2 + HO2
- ↔ H2O2 (7)
HO2- + O3 → HO2. + O3.
- (8)
HO2. ↔ H
+ + O2
.- (9)
O2.- + O3 → O2 + O3
.- (10)
O3.- + H
+ → HO3 (11)
HO3. → HO
. + O2 (12)
HO. + O3 → HO2
. + O2 (13)
Requires high pH conditions (alkaline solutions).
Requires special contactor for ozone sparging and distribution.
Ambient temperature and pressure.
The reaction fundamentals are based on the ozone chemistry in aqueous alkaline solutions. The side H2O2 formed during ozonation also plays a role in the treatment process. Addition of H2O2 will enhance O3 decomposition with formation of OH
..
Usually the reaction extent is limited by the short life time of ozone in alkaline solutions. Influence of pH is evident as the active species from ozonation is the conjugate base HO2
- whose
concentration is strictly dependent upon pH.
Fenton and photo-Fenton processes [20]
Fenton
Fe2+
+ H2O2 → Fe3+
+ OH- + OH (14)
Fe(OH)2+
hv ↔ H+ + FeOOH
2+ (15)
FeOOH2+
→ HO2. + Fe
2+ (16)
Photo-Fenton
Fe(OH)2+
+ hv → Fe2+
+ OH (17)
UV/Fe3+
-Oxalate/H2O2
[FeIII
(C2O4)3]3-
+ hv → [Fe
II(C2O4)
2]2-
+ C2O4.- (18)
C2O4.- + [Fe
III(C2O4)3]
3- → [Fe
II(C2O4)2]
2- + C2O4
2- + 2CO2 (19)
C2O4.- + O2 → O2
.- + 2CO2 (20)
Fenton process: Low pH (pH 2.7 – 2.8).
Photo-Fenton process: Low pH, UV-Vis wavelength of higher than 300 nm.
UV/Fe3+
-Oxalate/H2O2: Low pH, UV-Vis wavelength of higher than 200-400 nm and addition of H2O2.
Fenton process: Iron is very abundant in wastewater and hydrogen peroxide is easy to handle and environmentally safe. Photo-Fenton process: Allows the photolysis of Fe
3+ complexes allows Fe
2+
regeneration. Low quantum of 0.14 (at 313 nm) to 0.017 (at 360 nm). UV/Fe
3+-Oxalate/H2O2: Can provide a
continuous source of Fenton’s reagent and uses about only 20% of the energy required by typical photo-Fenton system. Quantum yield is 1.0-1.2.
Requires strict pH control and sludge can be formed with related disposal problems.
Might compete with hydroxyl derivatives of aromatic pollutants as these absorb the same UV range as H2O2 and Fe
3+.
UV-based photolysis and chemical oxidation processes [20]
Mn2+
/Oxalic acid/Ozone
Mn(III) (AO2-
)n + O3 + H+ Mn(II) + (n-1)(AO
2-) + 2SO2 + O2 +OH (21)
H2O2/UV
H2O2 + hv → 2OH (22)
O3/UV
O3 + hv → O1 (D) + O2 (23)
O1 (D) + H2O → H2O2 (24)
H2O2 + hv → 2OH (25)
Mn2+
/Oxalic acid/Ozone: The radical formation mechanism is at pH 4.0.
H2O2/UV:
Requires UV wavelength of smaller than 280 nm to induce the homolytic cleavage of H2O2.
Requires alkaline pH.
O3/UV:
Requires UV light of 254 nm.
Operates efficiently under alkaline pH.
Mn2+
/Oxalic acid/Ozone:
Is usually used to enhance decomposition of ozone to produce HO radicals. H2O2/UV:
The cage effect of water molecules might lower the primary quantum yield to 0.5. The reaction is pH dependent, where the molar extinction coefficient increases with an increase in pH. This might due to the higher molar absorption coefficient of HO2
-
at 254 nm, which is 240 M-1
cm-1
O3/UV:
The extinction coefficient of O3 at 254 nm is 3600 M
-1 cm
-1, which is much higher than
H2O2. Posses the combined chemical behaviour of H2O2/UV and O3/UV, as H2O2 was produced during the reaction.
H2O2/UV:
Small molar extinction of H2O2 of 18.6 M
-1cm
-1 at 254 nm, and
thus only a relatively small fraction of light is exploited.
Might get competition from other organic substrates, which might act as inner filters to attenuate the UV light.
Photocatalytic processes [7]
TiO2 Photocatalysis TiO2 + hv e
- + h
+ (26)
e-CB e
-TR (27)
h+
VB h+
TR (28)
e-TR + h
+VB(h
+ TR) e
-CB + heat (29)
(O2)ads + e- O2
.- (30)
OH- + h
+ OH
. (31)
R-H + OH. R’
. + H2O (32)
R + h+ R
+. Intermediate(s)/ Final Degradation Products (33)
O2.- + OH
. HOO
. (34)
HOO. + e
- HO2
- (35)
HOO- + H
+ H2O2 (36)
UV irradiation in the wavelength <385nm.
Continuous irradiation and aeration to provide agitation for catalysts suspension and electron scavengers (for slurry reactor) and electron scavengers only (for fixed bed reactor).
Ambient temperature and pressure.
Operates well at pH > PZC (semiconductor).
Can be used to recover some noble metals found in wastewater.
Low quantum efficiency as caused by the rapid electron-hole recombination.
Treatment efficiency usually limited by mass transfer problems between the catalyst particles and pollutants found in wastewater.
Difficulty in post-separation of catalyst particles after wastewater treatment.
Catalytic surfaces might get fouled from different organic pollutants and inorganic ions.

Decentralised Wastewater Treatment Systems: System Monitoring and Validation Page 48
Technical Feasibility of AOTs
To assess the technical feasibility of retrofitting AOTs as an advanced wastewater treatment option for
the case study, it is important to understand the quality of treated sewage effluent that is supplied to
the AOT. This ensures that the AOTs can be retrofitted with minimal modification of both the effluent
characteristics and process operating conditions. Figure 2 shows the quality characteristics of the
treated sewage effluent from a decentralised wastewater treatment plant in SEQ, obtained by using
grab sampling methodology (from N = 6 events). From Figure 2, it can be observed that the statistics
presented for five common wastewater parameters of suspended solids (SS), total nitrogen (TN), pH,
biological oxygen demand (BOD) and chemical oxygen demand (COD) are quite constant. For each
wastewater parameter, the relevant mean, median, 25th and 90
th percentile concentrations are given.
The corresponding concentrations (± S.D.) for the measured wastewater parameters are; suspended
solids: 4.5 ±0.5 mg/L; total nitrogen: 11.68 ±1.70 mg/L; pH: 7.78 ±0.17; BOD: 5.83 ±2.04 mg/L and
COD: 21.50 ±3.27 mg/L). According to the Australian guidelines for water recycling (NRMMC-
EPHC-AHMC, 2006), all of the measured concentrations for these common wastewater parameters
are deemed safe, acceptable and are within the current threshold limits for both public health and
environmental risks. However, in the guidelines no limit was recommended for COD concentrations.
In this instance, the presence of a relatively high COD concentration might present public health and
environmental risks owing to the potential presence of effluent organic matters, recalcitrant organic
compounds, un-degraded reactive azo dye compounds, pharmaceutical parent compounds or
metabolites which are hazardous and might further react with chlorine to form DBPs (Chong et al.
2010c). A detailed monitoring of the individual chemical compounds should be undertaken to
determine the DBPs formation potential. The real public health risks of using treated sewage effluent
to augment mains water demand from a decentralised wastewater plant comes from the potential cross
connection of piping between the mains water supply and the third pipe supplying treated sewage
effluent. Thus, a final COD concentration limit of 10 mg/L was set in this instance to minimise the
potential risks, as well as serving as a treatment target for the subsequent economic evaluation of the
different AOTs under consideration.
Figure 2: Characteristics of the treated sewage effluent from the decentralised wastewater treatment plant in SEQ.

Decentralised Wastewater Treatment Systems: System Monitoring and Validation Page 49
From the measured pH values, it was easy to assess which AOTs can be retrofitted without the vast
use of additive chemical reagents (for pH correction) as well as alteration of the operating conditions
for the existing wastewater treatment train. Since the measured pH values are marginally alkaline, it
would be more appropriate to retrofit AOTs that operate well within this alkaline pH regime. From
Table 2 of the reviewed AOTs, it can be observed that only ozonation (O3), ozonation/ultraviolet
irradiation (O3/UV), hydrogen peroxide/ultraviolet irradiation (H2O2/UV) and TiO2 photocatalysis
would be suitable. Although the Fenton–based treatment processes have been shown to be relatively
superior in treatment efficacy, especially for the UV/Fe3+
-Oxalate/H2O2 process with high quantum
yield and lower operational energy, their application in this case study might be hampered by their low
acidity operating requirements. Thus, only the assessed AOTs of ozonation (O3), ozonation/ultraviolet
irradiation (O3/UV), hydrogen peroxide/ultraviolet irradiation (H2O2/UV) and TiO2 photocatalysis are
considered technically feasible and their treatment cost are estimated in the following section.
Although the results shown in Figure 2 indicted that as the other parameters (i.e. SS, TN and BOD) are
close to the threshold limit of 10 mg/L, there might be some chance of exceeding this licensed
concentration. Figure 3 shows the probability of exceedance for the respective wastewater parameters,
which was estimated using the measured average (± S.D.) in Monte Carlo simulations. Results showed
that there is an 84% chance for the TN to exceed the 10 mg/L concentration limit, with a maximum
simulated concentration of 17.36 mg/L. This is followed by a 4% chance for BOD to exceed the
license concentration of 10 mg/L, with a maximum simulated concentration of 12.60 mg/L. It was
found that the decentralised wastewater system is quite efficient in the removal of suspended solids,
with little chance of the wastewater parameter exceeding the 10 mg/L concentration threshold.
Previously, it has been shown that apart from the removal of organic carbon compounds (i.e. TOC and
COD), AOTs are also capable of simultaneously degrading BOD and other nitrogenous compounds
(Gogate and Pandit, 2004). Thus, given the stochastic variations in the treated sewage effluent, it is
anticipated that the integration of the proposed AOTs can not only minimise the public health and
environmental risks but also improve the stability of the system to produce treated sewage effluent
with the quality needed by the license requirements.
Figure 3: Monte Carlo simulations on the probability of exceedance for the respective measured treated wastewater parameters.

Decentralised Wastewater Treatment Systems: System Monitoring and Validation Page 50
Economic and Environmental Feasibility of AOTs
The treatment economics of AOTs using O3, O3/UV, H2O2/UV and TiO2 photocatalytic processes was
assessed based on the methodology described in Section 2. The design hydraulic flow rate considered
for this study was 11,000 L/day (i.e. the current flow rate of the decentralised wastewater treatment
plant). Table 3 shows the summary of estimated treatment cost ($/L) of various AOTs assessed for the
current decentralised wastewater treatment plant case study in SEQ. From the estimated treatment
costs, it is evident that the O3 treatment process was the most economically feasible AOT ($ 0.03/L)
for minimising the potential health and environmental risks and in ensuring the quality of the treated
sewage effluent for reuse purposes. This was followed by the AOTs of H2O2/UV and O3/UV treatment
with estimated treatment costs of $ 0.14/L and $ 0.21/L, respectively. From the economic analysis, the
TiO2 photocatalytic treatment appeared to be most expensive AOT option. Similarly, Mahamuni and
Adewuyi (2010) also estimated the AOTs treatment costs for O3, O3/UV, H2O2/UV and TiO2
photocatalytic treatment processes based on a much higher design hydraulic flow rate of 1000 L/min
(i.e. 1,440,000 L/day). They also found a similar trend of treatment costs in the order of O3 < O3/UV <
H2O2/UV < TiO2 photocatalytic processes.
The O3 treatment process was the more economical AOT treatment option for similar level of COD
reduction from 21.5 mg/L to 10.0 mg/L compared with the O3/UV and H2O2/UV treatment options, as
the later require higher O&M costs for the UV system. This includes higher energy intensity and
constant bulb replacement for the UV systems involved (Mahamuni and Adewuyi, 2010). It has been
reported that the part replacement costs for UV systems are as high as 45% of the annual electrical
power consumption costs (USEPA, 2006). Although the O3 treatment process also involves parts
replacement costs for the ozone generator, the total O&M costs is still relatively lower than the AOTs
which combine chemical and UV photolysis systems. For example, the H2O2/UV treatment process
requires a metering pump, reservoir storage, the use of H2O2 and part replacement for the UV system.
For the TiO2 photocatalytic treatment process, the relatively high treatment costs are incurred because
of the cost of TiO2 particles used, parts replacement costs for the UV system, catalyst holder
replacements for the catalytic system, as well as issues with the post-separation of semiconductor TiO2
particles after wastewater treatment (Mahamuni and Adewuyi, 2010).
The specific energy requirement (in kWh/kL) for each AOT was also estimated. This was assessed in
accordance with the sustainability criterion detailed in Figure 1. This information is important as it
allows the determination of the energy efficiency of the AOTs, as well as their indirect GHG
emissions from fossil fuel combustion. Figure 4 shows the estimated specific energy for the different
AOTs considered in this study. Results showed that the H2O2/UV treatment process is the most
efficient technology with a specific energy of 0.23 kWh/kL, owing to the OH. radicals generation via
the use of chemical reagents. This was followed by the specific energy for O3/UV and TiO2
photocatalytic treatment processes of 6.15 kWh/kL and 7.09 kWh/kL, respectively. The O3 treatment
process was the most energy intensive process with a specific energy of 11.93 kWh/kL. The reason for
the lower specific energy in O3/UV treatment process compared to the O3 treatment process is due to
the higher turnover rate or shorter residence time in the former required to achieve the final COD
concentration requirement. When the estimated specific energy was converted to an indirect carbon
footprint (i.e.0.9 kg CO2-e/kWh), the indirect GHG emission was estimated to be in the range of 0.20
kg CO2-e/kL (H2O2/UV treatment process) to 10.74 kg CO2-e/kL (O3 treatment process) (Hall et al.
2009). It is apparent, from Figure 4 that a comprehensive sustainability assessment cannot be made as
these estimations were not validated through energy system monitoring, nor did they include fugitive
GHG emissions which add to the overall carbon footprint for different AOTs. Further inventory data
sets from different pilot or full scale AOTs are needed to allow for a more accurate and comprehensive
sustainability assessment of AOTs for decentralised wastewater applications. However, the costs
estimated in this study still present a useful guide on the selection of AOTs based on the technical,
economical and environmental criteria. Based on this, the H2O2/UV treatment process was considered
to be the best AOTs treatment option that can be retrofitted to the current decentralised wastewater
case study plant in an effort to improve the quality of treated sewage effluent for non-potable reuse.
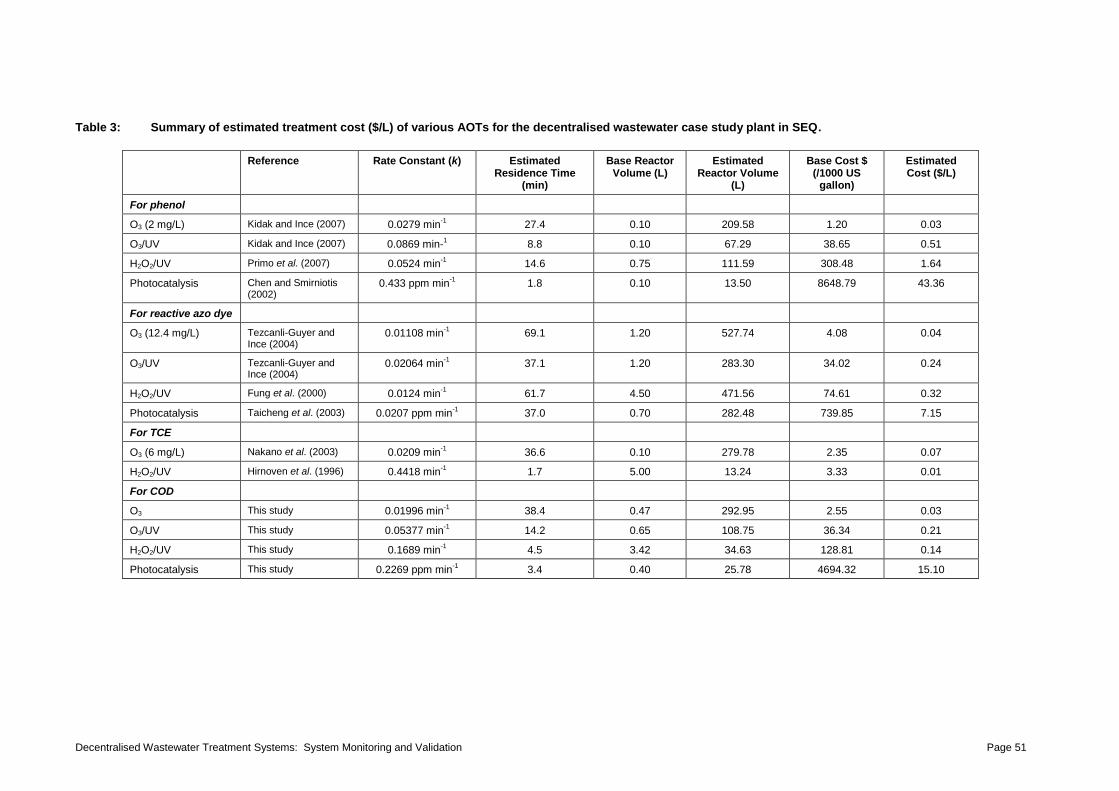
Decentralised Wastewater Treatment Systems: System Monitoring and Validation Page 51
Table 3: Summary of estimated treatment cost ($/L) of various AOTs for the decentralised wastewater case study plant in SEQ.
Reference Rate Constant (k) Estimated Residence Time
(min)
Base Reactor Volume (L)
Estimated Reactor Volume
(L)
Base Cost $ (/1000 US
gallon)
Estimated Cost ($/L)
For phenol
O3 (2 mg/L) Kidak and Ince (2007) 0.0279 min-1 27.4 0.10 209.58 1.20 0.03
O3/UV Kidak and Ince (2007) 0.0869 min-1 8.8 0.10 67.29 38.65 0.51
H2O2/UV Primo et al. (2007) 0.0524 min-1 14.6 0.75 111.59 308.48 1.64
Photocatalysis Chen and Smirniotis (2002)
0.433 ppm min-1 1.8 0.10 13.50 8648.79 43.36
For reactive azo dye
O3 (12.4 mg/L) Tezcanli-Guyer and Ince (2004)
0.01108 min-1 69.1 1.20 527.74 4.08 0.04
O3/UV Tezcanli-Guyer and Ince (2004)
0.02064 min-1 37.1 1.20 283.30 34.02 0.24
H2O2/UV Fung et al. (2000) 0.0124 min-1 61.7 4.50 471.56 74.61 0.32
Photocatalysis Taicheng et al. (2003) 0.0207 ppm min-1 37.0 0.70 282.48 739.85 7.15
For TCE
O3 (6 mg/L) Nakano et al. (2003) 0.0209 min-1 36.6 0.10 279.78 2.35 0.07
H2O2/UV Hirnoven et al. (1996) 0.4418 min-1 1.7 5.00 13.24 3.33 0.01
For COD
O3 This study 0.01996 min-1 38.4 0.47 292.95 2.55 0.03
O3/UV This study 0.05377 min-1 14.2 0.65 108.75 36.34 0.21
H2O2/UV This study 0.1689 min-1 4.5 3.42 34.63 128.81 0.14
Photocatalysis This study 0.2269 ppm min-1 3.4 0.40 25.78 4694.32 15.10
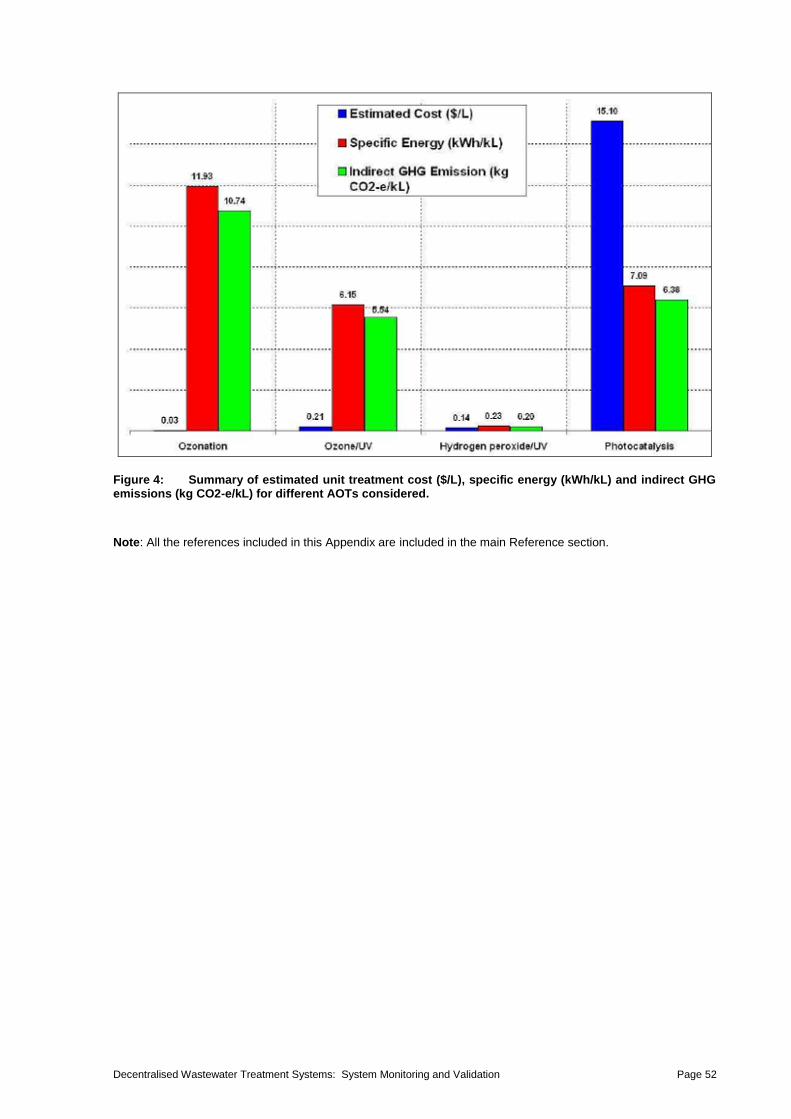
Decentralised Wastewater Treatment Systems: System Monitoring and Validation Page 52
Figure 4: Summary of estimated unit treatment cost ($/L), specific energy (kWh/kL) and indirect GHG emissions (kg CO2-e/kL) for different AOTs considered.
Note: All the references included in this Appendix are included in the main Reference section.

Decentralised Wastewater Treatment Systems: System Monitoring and Validation Page 53
APPENDIX 3: Spatial Suitability for Decentralised Reuse Systems – Literature Review, Land Suitability, Multi Criteria Evaluation and Data
Literature Review – Previous GIS Applications
There has been extensive reporting in the literature of the use of GIS for assessing suitability of
alternative water systems. In India, potential sites for water harvesting structures were identified using
a spatial expert support system (Rao and Bhaumik 2003; Kumar et al. 2008; Singh et al. 2009). In
South Africa, a GIS based decision support system was developed that identified suitable locations for
water harvesting (De Winnaar et al. 2007; Mbilinyi et al. 2007; Mwenge Kahinda et al. 2009). In
another example, a watershed-scale harvesting framework was developed, where GIS was used to
evaluate the costs and potential benefits of water harvesting (Sekar and Randhir 2007). In the
Australian urban context, Shipton and Somenahalli (2010) used GIS to identify potentially suitable
stormwater harvesting locations in Adelaide.
Mbilinyi et al. (2007) presented a GIS-based decision support system for identifying potential sites for
what they referred to as rainwater harvesting – we would refer to this as stormwater harvesting in the
Australian context. The conceptual framework for the tool was based on three main steps: data input
and pre-processing, main processing, and output maps identifying relative suitability of locations for
rainwater harvesting (Figure 1). The input data sets included maps of rainfall, slope, soil type and land
use. The factors used for assessing relative suitability for stormwater harvesting were: rainfall; slope;
soil texture; soil depth; drainage; and land cover.
Mbilinyi et al. (2007) used literature to determine the suitability classifications for each factor, and
also the weightings that reflected relative importance. Table 1 depicts the classification of factors into
suitability classes. The approach was found to be useful for supporting the identification of rainwater
harvesting potential in remote locations, but the exclusion of socio-economic criteria limited the
usefulness of the approach. It was recommended that future applications include socio-economic
factors.
Table 1: Suitability factors used for identifying potential rainwater harvesting sites (Mbilinyi et al. 2007).

Decentralised Wastewater Treatment Systems: System Monitoring and Validation Page 54
Figure 1: Flow chart for identification of potential sites for rainwater harvesting (Mbilinyi et al. 2007).
De Winnear et al. (2007) used a GIS-based approach for identifying potential stormwater runoff
harvesting sites in South Africa based on soil, land use, slope and rainfall. The framework developed
is depicted in Figure 2. GIS was used to provide the integration of various spatial criteria that
determine suitability for rainwater harvesting at the catchment scale, which can then be verified by
field assessment. The authors identified some limitations of the approach which included the
availability of sufficient data and the expert knowledge required to assess the relative suitability of
different criteria. Also, the analysis focussed on the spatial suitability and did not incorporate temporal
variability, such as variability in rainfall, which can influence suitability for rainwater harvesting.
Figure 2: Conceptual framework for generating runoff potential and suitable stormwater harvesting
sites (De Winnear et al. 2007).
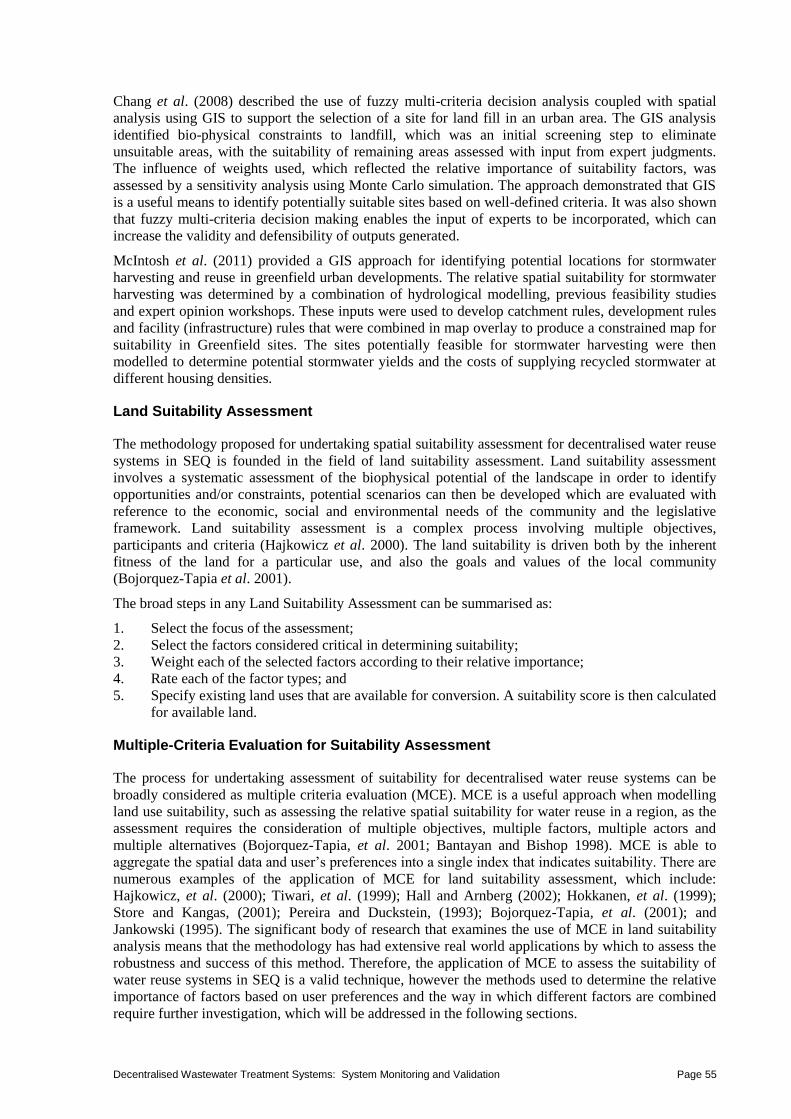
Decentralised Wastewater Treatment Systems: System Monitoring and Validation Page 55
Chang et al. (2008) described the use of fuzzy multi-criteria decision analysis coupled with spatial
analysis using GIS to support the selection of a site for land fill in an urban area. The GIS analysis
identified bio-physical constraints to landfill, which was an initial screening step to eliminate
unsuitable areas, with the suitability of remaining areas assessed with input from expert judgments.
The influence of weights used, which reflected the relative importance of suitability factors, was
assessed by a sensitivity analysis using Monte Carlo simulation. The approach demonstrated that GIS
is a useful means to identify potentially suitable sites based on well-defined criteria. It was also shown
that fuzzy multi-criteria decision making enables the input of experts to be incorporated, which can
increase the validity and defensibility of outputs generated.
McIntosh et al. (2011) provided a GIS approach for identifying potential locations for stormwater
harvesting and reuse in greenfield urban developments. The relative spatial suitability for stormwater
harvesting was determined by a combination of hydrological modelling, previous feasibility studies
and expert opinion workshops. These inputs were used to develop catchment rules, development rules
and facility (infrastructure) rules that were combined in map overlay to produce a constrained map for
suitability in Greenfield sites. The sites potentially feasible for stormwater harvesting were then
modelled to determine potential stormwater yields and the costs of supplying recycled stormwater at
different housing densities.
Land Suitability Assessment
The methodology proposed for undertaking spatial suitability assessment for decentralised water reuse
systems in SEQ is founded in the field of land suitability assessment. Land suitability assessment
involves a systematic assessment of the biophysical potential of the landscape in order to identify
opportunities and/or constraints, potential scenarios can then be developed which are evaluated with
reference to the economic, social and environmental needs of the community and the legislative
framework. Land suitability assessment is a complex process involving multiple objectives,
participants and criteria (Hajkowicz et al. 2000). The land suitability is driven both by the inherent
fitness of the land for a particular use, and also the goals and values of the local community
(Bojorquez-Tapia et al. 2001).
The broad steps in any Land Suitability Assessment can be summarised as:
1. Select the focus of the assessment;
2. Select the factors considered critical in determining suitability;
3. Weight each of the selected factors according to their relative importance;
4. Rate each of the factor types; and
5. Specify existing land uses that are available for conversion. A suitability score is then calculated
for available land.
Multiple-Criteria Evaluation for Suitability Assessment
The process for undertaking assessment of suitability for decentralised water reuse systems can be
broadly considered as multiple criteria evaluation (MCE). MCE is a useful approach when modelling
land use suitability, such as assessing the relative spatial suitability for water reuse in a region, as the
assessment requires the consideration of multiple objectives, multiple factors, multiple actors and
multiple alternatives (Bojorquez-Tapia, et al. 2001; Bantayan and Bishop 1998). MCE is able to
aggregate the spatial data and user’s preferences into a single index that indicates suitability. There are
numerous examples of the application of MCE for land suitability assessment, which include:
Hajkowicz, et al. (2000); Tiwari, et al. (1999); Hall and Arnberg (2002); Hokkanen, et al. (1999);
Store and Kangas, (2001); Pereira and Duckstein, (1993); Bojorquez-Tapia, et al. (2001); and
Jankowski (1995). The significant body of research that examines the use of MCE in land suitability
analysis means that the methodology has had extensive real world applications by which to assess the
robustness and success of this method. Therefore, the application of MCE to assess the suitability of
water reuse systems in SEQ is a valid technique, however the methods used to determine the relative
importance of factors based on user preferences and the way in which different factors are combined
require further investigation, which will be addressed in the following sections.

Decentralised Wastewater Treatment Systems: System Monitoring and Validation Page 56
Weighted Linear Combination
The algorithm proposed for combining suitability factors in the assessment of water reuse systems is
weighted linear combination (WLC). WLC is used to aggregate the scores for individual factors into
one index, in which the relative importance of each factor is considered.
Pettit et al. (2001) used Equation 1 to express land suitability assessment using WLC:
S = ∑ (wi xi). ∏cj (1)
where: S = suitability, ∑ = the sum, i = a decision factor, j = a constraint, cj = the criterion score of the
constraint, wi = weight, xi = criterion score of factor; and ∏ = the product.
WLC has been widely applied for the land suitability analysis in a GIS environment. Examples of the
application of WLC for land suitability assessment include: Sposito (2001); Petitt et al. (2002); and
Bojorquez-Tapia, et al. (2001). The basis for the use of WLC in land suitability assessment is that all
factors are not of equal importance. For example, when considering spatial suitability of a region for
water reuse systems the following criteria may be considered: slope, proximity to existing urban water
infrastructure, proximity to environmentally sensitive areas, and urban density. The importance of
each factor will depend on the characteristics of the region and also more importantly on the bias of
the decision-maker. WLC allows for factors to be combined so that the most important factor has the
biggest influence in determining suitability, as a result the highest suitability scores are allocated to the
areas that are considered optimal for the important factors (Xiang, 2001).
It is proposed to develop a constraint layer prior to application of WLC for assessing suitability of a
region for water reuse. A constraint can be applied when an area is to be considered unsuitable
regardless of the performance of other suitability factors. For example, an area with slope in excess of
20 degrees may be removed from consideration when determining suitability for a water reuse system
due to the increased pumping and construction costs associated with steep terrain. The application of a
constraint layer for critical factors can be considered a Boolean operation where all factors that are
TRUE for the constraint are removed from further consideration for suitability, with the remaining
areas assessed for relative spatial suitability. Therefore, it is proposed to use both Boolean and fuzzy
logic in evaluating suitability for water reuse schemes.
WLC utilises a fuzzy logic approach when considering suitability as it allows for trade-off between
factors and also enables suitability to be represented on a continuous scale, which reflects the degree
of suitability. Trade-offs are important, as they enable a compensatory approach in which poor
conditions for one criterion can be compensated for by good performance in other criteria.
Weighting with the Analytic Hierarchy Process
The weighting of factors can be complicated when there are more than 3 factors to consider relative
importance. As the number of factors that a decision-maker has to consider grows, it becomes
increasingly more difficult to ensure that judgements of are consistent. The Analytic Hierarchy
Process (AHP) has been used to address this issue by breaking down the consideration of relative
importance to pair wise comparisons. Examples of the application of the AHP be found in the
following: Bantayan and Bishop, (1999); Hajkowicz, (2000); and Tiwari, et al. (1999). This method
developed by Saaty (1995) organises the factors being considered into a hierarchy, then the factors at
each level of the hierarchy are structured into a square matrix, where all factors are compared with
each other on the basis of a 9 point scale, where 1 indicates the factors are of equal importance and 9
indicates the factor is absolutely more important (Saaty, 1995). This process can be used in a
workshop setting to derive weights for reflecting relative importance of factors in assessing spatial
suitability for decentralised water reuse systems in SEQ. Weightings developed using AHP are
considered on a ratio scale of measurement, and so they reflect the magnitude of preference between
different factors. To ensure consistent weighting judgements by the user, the AHP calculates a
consistency ratio from the eigenvector of the matrix; this ratio identifies judgements that are not
consistent across the matrix. To paraphrase the example given by Saaty (1995), if slope is more
important than soil drainage and soil drainage is more important than flood risk then slope must be
more important than flood risk. Furthermore, if slope is twice as important as soil drainage and soil

Decentralised Wastewater Treatment Systems: System Monitoring and Validation Page 57
drainage is three times more important than flood risk then slope must be six times more important
than flood risk. Although, AHP employs complex mathematical techniques such as matrices, linear
algebra and eigenvectors in order to determine the relative importance the application is
straightforward and user friendly, and provides an intuitive process for a group of experts to develop
weightings.
Data Types and Limitations
The limitations of the approaches used and the validity of the data inputs must be made clear to ensure
that decision-makers have an understanding of the confidence they can have in an output map
depicting relative suitability for a decentralised water reuse system in the SEQ region. The potential
issues that can be associated with spatial analysis, such as combining different data sources to evaluate
suitability for decentralised water reuse schemes, were described by Openshaw (1984) as the
modifiable areal unit problem (MAUP). This can occur when point based measures are aggregated
into coverage, or where data collected at different spatial scales or representing different data types is
combined. These problems can result from the fact that spatial representation of phenomena into a real
unit is arbitrary, modifiable, and dependent upon the person doing the aggregating. The potential
problem arises when these biases or inappropriate combination of data types are not communicated to
decision-makers using the final map output.
A significant issue when assessing the validity of applying WLC is the type of input data. Klosterman
(2002) makes the point that a suitability factor rating could be viewed as ordinal numbers, in that they
may be a statement of preference and might not indicate a magnitude of difference in suitability. This
operation can only be considered mathematically valid if the input values are either interval or ratio
measurement scales. Another limitation with WLC is that it can ignore the interdependence between
factors. It is important to consider the data type, and original scale, so that output maps generated
through WLC are valid representations of relative spatial suitability for decentralised water reuse
systems.
Note: All the references included in this Appendix are included in the main Reference section.
Decentralised Wastewater Treatment Systems: System Monitoring and Validation Page 58
APPENDIX 4: Presentation and Publication in Urban Water Security Research Alliance Science Forum
Chong, M.N., Umapathi, S. and Sharma, A. (2012) Decentralised Wastewater Systems: Robustness and Carbon Footprint, in Science Forum and Stakeholder Engagement: Building Linkages, Collaboration and Science Quality, (eds) D.K., Begbie, S.J., Kenway, S.M., Biermann and S.L., Wakem, Urban Water Security
Research Alliance, June 2012, Brisbane, Queensland, pp 210.
Decentralised Wastewater Systems: Robustness and Carbon Footprint
Chong, M.N.1, Umapathi, S.1 and Sharma, A.2 1 CSIRO Land and Water, Ecosciences Precinct, Dutton Park, Queensland 2 CSIRO Land and Water, Highett, Victoria
Summary
In Australia, the demand on the traditional water supply from the water grid is escalating in conjunction with
issues of climate change, rapid industrialisation and booming commercial activities in most densely urbanised
regions. This is further exacerbated by rapid population growth, which could have a direct impact on reliable
water supply, wastewater disposal and treatment. In South East Queensland (SEQ) alone, it has been projected
that a population growth of 1.5 million is possible by 2031, which might be a challenge to the local water
utilities. In order to provide water and wastewater services, a number of water recycling infrastructure and reuse
schemes have been implemented. This study investigates the potential of small decentralised wastewater
treatment systems to deliver a solution to address: (1) the robustness of the small treatment systems in handling
the daily variations in water flow and pollutant loads; and (2) the carbon footprint of such systems. Two
contrasting decentralised wastewater systems - one with a predominant membrane bioreactor (MBR) technology
and one with an aerobic bio-filtration system - were monitored and modelled in this study.
Modelling results show that the decentralised MBR wastewater system at Capo de Monte was relatively robust
in terms of its treatment capacity where the probability of exceedances on Total Nitrogen and Total Phosphorus
concentrations against the limits approved by the Environmental Protection Agency was only 2% and 3%,
respectively. Subsequently, through the validated BioWin® model (with periodical wastewater sampling), it was
found that the decentralised MBR system is quite robust and can withstand up to 50% of additional wastewater
flow rate and 30% of nitrogen loading. As for the carbon impacts, the direct carbon footprint (energy
consumption) of the MBR system was significantly higher than the aerobic bio-filtration system. However, when
the overall carbon footprint of the systems (direct and fugitive emissions) was accounted for, both systems are
quite comparable. With the water balance and robustness modelling, decentralised wastewater systems certainly
provide a “fit-for-purpose” solution to accommodate the population growth issue. However, more research needs
to be done to optimize the energy efficiency of the systems, together with validation of fugitive greenhouse gas
emissions, which might affect the sustainable selection criteria for these systems.
Keywords Water recycling and reuse, energy efficiency, water-energy nexus, greenhouse gas emissions.
Introduction
Demands on traditional water supply from the water grid in Australia are escalating in conjunction with issues of
climate change, rapid industrialisation and booming commercial activities in most of the densely urbanised
regions. This is further exacerbated by rapid population growth, which has a direct impact on reliable water
supply, wastewater disposal and treatment. In South East Queensland (SEQ) alone, it was projected that a
population growth of 1.5 million is possible by 2031, which might be a challenge for the local water utilities
(DIP, 2009). In the traditional “end-of-pipe” paradigm for water servicing, such an increase in urban water
supply and sewage handling could be easily resolved by expanding the existing centralised water and wastewater
collection, conveyance and treatment systems. This might, however, incur high capital costs to upgrade or
construct new water and wastewater infrastructures and associated recurring pumping energy cost for
transportation over long distances.

Decentralised Wastewater Treatment Systems: System Monitoring and Validation Page 59
Decentralised water and wastewater systems are regarded as important elements in the urban water cycle where
they can act as transitional solutions to accommodate urban population growth by providing location specific
water servicing (Tjandraatmadja et al., 2009). The wastewater systems can collect and treat the wastewaters
from local sources to Class A+ recycled water quality that can be utilised for non-potable applications
surrounding the urban households. It was reported by Peter-Varbanets et al. (2009) that only a small fraction of
mains water is used for domestic consumption (i.e., drinking and cooking), whereas the majority is used for non-
potable applications (i.e., toilet flushing, washing machine, irrigation and other end uses). In the past,
decentralised wastewater systems were largely viewed as an alternative to centralised systems for remote or rural
developments. However, with the emergence of various advanced suites of treatment technologies, a greater
flexibility in process selection and matching end uses allows the increased adoption of decentralised wastewater
systems in urban contexts. At present, the major technical limitations to the wider uptake of decentralised
systems are the lack of knowledge and information on technology selection and its effective design to enable
stable, cost effective and sustainable operation.
In this paper, two different contrasting decentralised wastewater systems are compared in terms of their
robustness and carbon footprints. In this context, robustness refers to ability to handle daily variations in water
flow and pollutant loads while carbon footprint refers to the water-energy nexus and system specific fugitive gas
emissions. The membrane bioreactor (MBR) and textile bio-filter decentralised systems are located at Capo di
Monte (CDM, Mount Tamborine) and Currumbin Ecovillage (CEV, Currumbin Valley) respectively and were
designed to produce Class A+ recycled water for toilet flushing and external irrigation use. A quantitative risk
model was used to measure the potential risk associated with the treated effluent quality against the approved
Environmental Protection Agency (EPA) limits. Diurnal wastewater quality sampling was conducted for the
MBR at CDM in order to calibrate a commercially available activated sludge BioWin® model. Subsequently,
the robustness of the MBR plant was tested in terms of varying hydraulic and nitrogen shock loads. In addition,
the water-energy nexus was also monitored via smart meters. Finally, the total carbon impact was estimated via a
combined monitoring and first principle mass balance approach.
Monitoring Sites and Systems Description
Capo di Monte
Capo di Monte (CDM) decentralised wastewater treatment system was built as part of a 4.3 ha urban residential
development to provide wastewater servicing of 46 detached and semi-detached residential dwellings and a large
community centre. The predominant reason for the adoption of this system was the absence of a centralised
sewer system. The decentralised system was designed for an estimated peak hydraulic flow of 11,000 L/day.
Figure 1 shows a schematic for the decentralised wastewater system at CDM. The system is made up of a raw
sewage holding wet-well followed by a submerged flat sheet MBR (Kubota) that incorporates a raked screen,
anoxic/aerobic treatment zones, alum dosing in aerobic zones (for phosphorus removal), UV disinfection and
chlorination. The flat sheet membrane is positioned within the aerobic zone of the MBR. A submersible pump in
the aerobic MBR zone allows for the return of the activated sludge (RAS) stream back to the anoxic zone.
Excess activated sludge from the anoxic zone is pumped out on a fortnightly basis to a Gold Coast regional
sewage treatment plant for further treatment. Class A+ recycled water is produced from this system and used for
household toilet flushing and external irrigation via a dual reticulation system. A 6,000 m2
vegetated buffer zone
is available for land application of excess treated wastewater to prevent direct discharge into the local waterway.
Figure 1. Schematic of decentralised wastewater system at Capo di Monte. RAS flow is the return activated sludge stream.

Decentralised Wastewater Treatment Systems: System Monitoring and Validation Page 60
Currumbin Ecovillage
The Currumbin Ecovillage (CEV) is situated in the Currumbin Valley, Gold Coast, and comprises 110
residential lots that range from 400 to 1,600 m2 with extensive proportions allocated for communal open areas
(80:20 of open-to-living space). The main reason for the uptake of decentralised wastewater technologies was
due to the inaccessibility to a centralised sewer network. The CEV sewage treatment plant (STP) has a design
capacity of 51,000 L/day for raw sewage treatment. Figure 2 shows the schematic for the treatment processes, as
well as its wastewater flow lines. The wastewater is collected at each household and conveyed to the STP using a
combination of gravity and sewer pumping. The initial anaerobic treatment is performed by three in-series septic
tanks with a BioTube® filter installed in the last tank to remove carry-over solids. The sewage effluent is then
treated in a secondary process of aerobic bio-filtration and denitrification. An Orenco Advantex® Textile Filter
(AdvanTex AX100) is used for the simultaneous aerobic degradation and nitrification of carbonaceous and
nitrogen compounds in the primary treated effluent. A proportion of the treated effluent from the textile bio-
filters is recycled back to an anoxic/recirculation tank to allow a denitrification process to occur. This recycling
ratio is a crucial process parameter and is currently set at a 5:1 ratio (Xavier, 2008). This recycling ratio means
that only one sixth of the wastewater flow in a full pumping cycle is diverted for subsequent downstream
treatment, whilst the remaining flow fraction is recycled continuously to ensure sufficient biological oxygen
demand (BOD) reduction is achieved. The diverted effluent is treated to a Class A+ recycled water via
microfiltration (with an effective pore size of 0.2 μm) followed by UV disinfection and chlorination. The Class
A+ recycled water produced from the STP is stored in a large storage tank before being reticulated to the
households for toilet flushing and external irrigation use.
Figure 2. Schematic of the Currumbin Ecovillage decentralised wastewater system.
Results
Figures 3 (a) and (b) show the outcomes from the quantitative risk models of the sampled effluent qualities of
total nitrogen (TN) and total phosphorus (TP) from CDM. The sampling was conducted from April 2008 to
September 2010 on a weekly basis, so should provide a good basis for the quantitative risk modelling in terms of
the reliability of its mean and standard deviation values. Results show that the decentralised wastewater system
at CDM is relatively robust in terms of its treatment capacity where the probabilities of exceedances for TN and
TP against the EPA approved limits of a maximum of 50 mg/L and 15 mg/L were only 2% and 3%, respectively.
Table 1 also shows the probability of exceedances for other treated effluent qualities from the CDM system. It
seems that the system is relatively stable for other treated effluent qualities of BOD, total suspended solids (TSS)
and Escherichia coli (E. coli) where zero probability of exceedances were noted against the EPA approved
limits.

Decentralised Wastewater Treatment Systems: System Monitoring and Validation Page 61
(a)
(b)
Figure 3. Probability of exceedances against the EPA approved treated effluent quality limits. (a) Total nitrogen (TN); (b) Total phosphorus (TP). Both Y-axes refer to the probability density function; whole X-axes refer to the nutrient concentrations. The grey bars refer to the experimental values; and blue line refers to the fitting with log-normal function.
Further to the quantitative risk models which reinstated the system stability at CDM in the current condition, a
commercial activated sludge model, BioWin®, was used to simulate the system robustness to varying shock
loads of TN and TP. The model inputs were obtained from a combination of grab and composite sampling at
CDM. Figure 4 shows the simplified process schematic setup in the BioWin® model. Simulation results
reaffirmed that the MBR system can tolerate up to 1.5 times the design hydraulic flow. As for TN, when the
nitrogen shock loads were increased stepwise up to 30% (~ 140 mg/L), it was found that the system was
unbalanced and it took 12 hour to regain a steady-state condition (Chong et al., 2011). The variation in TP was
highly dependent on the alum dosage and thus, can be adjusted accordingly.

Decentralised Wastewater Treatment Systems: System Monitoring and Validation Page 62
Figure 4. Simplified process schematic in BioWin
® simulation model. WAS represents the waste activated sludge stream.
Table 1. A summary of the EPA approved treated effluent quality limits, mean and standard deviation of sampled effluent quality and the probability of exceedances for the decentralised wastewater system at CDM.
Traditionally, centralised water servicing is preferred because of “economies-of-scale” and operational ease,
whereas cost and operating issues may be encountered with decentralised systems. Previously, a number of
studies identified the drivers for decentralised systems and discussed that a direct comparison should not be
made as the decentralised option is able to be tailored for location specific solutions, avoid costly augmentations
to centralised systems and avoid the inherent financial risks for new large wastewater infrastructure
(Tjandraatmadja et al., 2009; Fane et al., 2006). In addition, it is important to understand the implications and
extent of the water-energy nexus for decentralised systems in comparison to other major water and wastewater
servicing options.
EPA Approved Limits Sampled Effluent
Quality Quantitative Risk Model
Parameters 50th
percentile 80th
percentile Max Mean Std
Deviation Min Max % Exceedances
50th
percentile 80th
percentile Max
BOD (mg/L) - 10 20 3.26 0.88 1.47 7.30 - 0% 0%
Total suspended solids (mg/L) - 10 20 2.16 1.04 0.42 7.32 - 0% 0%
Total nitrogen (mg/L) 10 20 50 11.95 12.30 1.00 62.50 41% 16% 2%
Total
phosphorus (mg/L) 7 10 15 4.88 3.62 0.66 21.08 19% 8% 3%
Escherichia coli (cfu/100mL) 10 - - 1.16 1.48 0.07 7.89 1% - -

Decentralised Wastewater Treatment Systems: System Monitoring and Validation Page 63
Figure 5. Comparison of specific energy use for wastewater pumping and treatment at our studied sites to other recycled water schemes in Australia.
Figure 5 shows the specific energy (in kilowatt-hours per kilolitre of treated effluent) for the two monitored
decentralised wastewater systems. The CDM-STP was found to consume 6.1 kWh/kL whereas; the CEV-STP
has a much lower total specific energy requirement of 1.9 kWh/kL. Results in Figure 5 also show the specific
energy requirement for CDM is the highest of all the considered recycled water schemes, higher even than the
two desalination plants considered. The energy requirements for the CEV-STP is similar to the centralised
wastewater treatment facilities in Pimpama-Coomera (Gold Coast) and the Western Corridor purified recycled
water (PRW) scheme (Hall et al., 2009; Kenway et al., 2008; Australia Institute Ltd., 2005). Such a comparison
suggests that decentralised systems (i.e. CEV-STP) have some potential to deliver alternative urban water
resources at a better energy cost, if the systems can be properly selected, configured and operated.
When the fugitive greenhouse gases (GHG) were estimated using the first principle approach, the total carbon
footprint from the two decentralised systems studied provides a different perspective (Table 2). In this instance,
the fugitive GHG emissions of methane (CH4) and nitrous oxide (N2O) were estimated based on the Sasse (1998)
and Foley (2009) models, respectively.
Table 2: Overall GHG emissions from the decentralised wastewater systems.
Components Estimated GHG Emissions (kg CO2-e per kL)
CDM CEV
Current average daily wastewater flows (kL/d) 9.3 50.5
Energy related GHG emissions from imported electrical power 5.59 1.81
CH4 emissions from identified decentralised process 0 4.92
N2O emissions from identified decentralised process 0.23 0.22
Landfill disposal of screens, grit and bio-solids 0.01 0
Effluent disposal for irrigation 0.02 0.03
Dissolved CH4 in raw sewage 0.08 0.08
Chemical and fuel consumption 0.03 0
Total GHG emissions 5.96 7.06
Table 2 shows the overall GHG emissions from the two decentralised wastewater systems, including the
measured energy-related GHG and the estimated fugitive GHG emission values from theoretical approaches.
Results indicated that the CH4 emission from the communal septic tanks in the CEV system significantly exceed
the high energy-related GHG emissions measured for CDM. The overall GHG emissions from CEV are
estimated at 7.06 kg CO2-e per kL of treated wastewater compared with 5.96 kg CO2-e per kL for CDM (i.e. a
reversal of magnitude when only energy-related GHG was considered).

Decentralised Wastewater Treatment Systems: System Monitoring and Validation Page 64
Conclusion
This research has provided insight into the operational stability, energy use and estimated GHG impacts of two
decentralised wastewater technologies. From the outcomes of this study, it can be concluded that MBR operated
at a decentralised scale offers a good treatment option in terms of final treated effluent qualities (i.e. meeting the
license requirements), system robustness, and resistance to shock loadings. However, the utilisation of MBR at
CDM comes at the expense of high specific energy use (kWh per kL of treated sewage), which disadvantages the
MBR in terms of energy-related GHG emissions. In comparison, the decentralised CEV system provides an
effective solution to treat the sewage effluent to Class A+ recycled water with much lower specific energy-related
GHG emissions. However, when the fugitive GHG emissions from the communal septic tanks at CEV are
included, the high CH4 emission potential along with its uncertainties makes the CEV system operation
relatively unattractive based on the theoretical estimation of fugitive gas emissions. Further field investigations
are required to substantiate the above estimations. Overall, our findings have provided some useful technical
insights into the selection of decentralised technologies to achieve sustainable operations in future urban
developments.
References Abegglen, C., Ospelt, M., Siegrist, H. (2008). Biological nutrient removal in a small-scale MBR treating household wastewater Wat. Res. 42,
pp.338-346.
Australia Institute Limited (2005). Greenhouse implications of the proposed Sydney desalination plant. Australia Institute Webpaper July
2005. Chong, M.N., Ho, A., Gardner, T., Sharma, A., Hood, B. (2011) Assessing decentralised wastewater treatment technologies: Correlating
technology selection to system robustness, energy consumption and fugitive GHG emission. International Conference on Integrated
Water Management, Pert, Western Australia, 2-5 February 2011. Department of Infrastructure and Planning (2009). Broadhectare Study, South East Queensland: Executive Summary:
http://www.dip.qld.gov.au/resources/factsheet/PIFU/seq-executive-summary.pdf
Fane, S. and Mitchell, C. (2006). Appropriate cost analysis for decentralised water systems. Enviro ’06 Conference and Exhibition, May 9-11 2006, Melbourne.
Foley, J., Lant, P. (2009). Direct methane and nitrous oxide emissions from full-scale wastewater treatment systems, The University of
Queensland, Australia. Water Services Association of Australia (WSAA) Occasional Paper, No.24. Hall, M., West, J., Lane, J., de Haas, D., Sherman, B. (2009). Energy and greenhouse gas emissions for the SEQ water strategy. Urban Water
Security Research Alliance Technical Report No.14.
Kenway, S.J., Priestley, A., Cook, A., Seo, S., Inman, M., Gregory, A., Hall, M. (2008). Energy use in the provision and consumption of urban water in Australia and New Zealand. A national flagships report CSIRO.
Peter-Varbanets, M., Zurbrugg, C., Swartz, C., Pronk, W. (2009). Review: decentralized systems for potable water and the potential
membrane technology. Wat. Res. 43(2), 245-265. Sasse, L. (1998). DEWATS, Decentralized wastewater treatment in developing countries, Borda, Delho, India.
Tjandraatmadja, G., Cook, S., Ho, A., Sharma, A., Gardner, T. (2009). Drivers for decentralised systems in South East Queensland. Urban Water Security Research Alliance Technical Report No. 13.
Xavier, D (2008). Personal communication to authors. Sustainable Solutions International P/L, Brisbane Australia.

Decentralised Wastewater Treatment Systems: System Monitoring and Validation Page 65
REFERENCES
Alberto, M., Arah, M., Neue, H. Wassmann, R., Lantin, R., Aduna, J. and Bonson, K. (2000) A sampling
technique for the determination of dissolved methane in soil solution. Chemosphere: Global Change Science. 2(1), 57-63.
AWWA (2005) Standard Methods for the Examination of Water and Wastewater. American Water and
Wastewater Association. American Public Health Association.
Batstone, D.J., Keller, J., Angelidaki, I.., Kalyuzhnyi, S., Pavlostathis, S.G., Rozzi, A., Sanders, W.,
Siegrist, H. and Vavilin, V. (2002) Anaerobic Digestion Model No. 1 (ADM1). IWA Publishing, London, United Kingdom.
Beal, C., Stewart, R., Huang, T., and Rey, E. (2011) SEQ residential end use study. Water. 80-84.
Blight-Tanner (2005) The Ecovillage at Currumbin Site Based Management Plan (Water and Wastewater)
Draft Report. Blight Tanner P/L.
Carignan, R (1998). Automated determination of carbon dioxide, oxygen, and nitrogen partial pressures in
surface waters. Limnology and Oceanography. 43, 969-975.
Chong, M.N., Jin, B., Chow, C.W.K. and Saint, C. (2010a) Recent developments in photocatalytic water
technology: A review. Water Research. 44, 2997-3027.
Chong, M.N., Zhu, H.Y. and Jin, B. (2010b) Response surface optimization of photocatalytic process for
degradation of Congo red using H- titanate nanofiber catalyst. Chemical Engineering Journal. 156,
278-285.
Chong, M.N., Jin, B., Zhu, H. and Saint, C. (2010c) Bacterial inactivation kinetics, regrowth and
synergistic competition in a photocatalytic disinfection system using anatase titanate nanofiber
catalyst. Journal of Photochemistry and Photobiology. A:Chemistry. 214, 1-9.
Chong, M. N., Angel, H., Gardner, T., Sharma, A. and Hood, B. (2011) Assessing decentralised wastewater
treatment technologies: Correlating technology selection to system robustness, energy consumption
and fugitive GHG emission. International Conference on Integrated Water Management, 2-5
February 2011, Murdoch University, Perth, Australia.
Cook, S., Sharma, A., Gurung, T.R., Chong, M.N., Umapathi, S, Gardner, T., Carlin, G. and Palmer, A.
(2012) Validating the performance of rainwater harvesting at the cluster scale: analysis based on the
monitoring of residential and commercial development case studies, Urban Water Security Research
Alliance.
Department of Infrastructure and Planning (2009) Broad hectare Study, South East Queensland: Executive
Summary: http://www.dip.qld.gov.au/resources/factsheet/PIFU/seq-executive-summary.pdf.
De Haas, D. (2009) Personal communication.
De Haas, D., Foley, J. and Lant P. (2009) Energy and greenhouse footprints of wastewater treatment plants
in South East Queensland. OZ Water 2009.
Ekama, G.A. (2009) Using bioprocess stoichiometry to build a plant-wide mass balance based steady-state
WWTP model. Water Research. 43, 2101-2120.
Foley, J. and Lant P. (2007) Fugitive Greenhouse Gas Emissions from Wastewater Systems. Water Service
Association Australia Report.
Foley, J. and Lant, P. (2009) Direct methane and nitrous oxide emissions from full-scale wastewater
treatment systems, The University of Queensland, Australia. Water Services Association of Australia
(WSAA) Occasional Paper No.24.
Foley, J (2009) Personal communication.
Gil, J.A., Tua, L.. Rueda, A., Montano, B., Rodriguez, M. and Prats, D. (2010) Monitoring and analysis of
the energy cost of an MBR. Desalination. 250, 997-1001.
Global Water Research Commission (2011). N2O and CH4 emission from wastewater collection and
treatment systems. Technical Report. Report of the GWRC research strategy workshop. Global
Water Research Coalition. London, United Kingdom.
Gurung, T. R., Sharma, A., Umapathi, S. (2012) Economics of scale analysis of communal rainwater tanks,
Urban Water Security Research Alliance Technical Report No. 67 Urban Water Security Research
Alliance Technical Report ISSN 1836-5566.
Henze, M., Grady, C., Gujer, W. Marais, G. and Matsuo, T (1987) Activated sludge Model No. 1.
IAWPRC Scientific and Technical Reports, No. 1. IAWPRC, London.
Hunter, N. (2007) Water reuse: Making use of wastewater. Filtration and Separation. 44(7), 24-27.
Kele, B. (2009) Personal communication.

Decentralised Wastewater Treatment Systems: System Monitoring and Validation Page 66
Lambert, M. and Frechette, J-.L. (2005) Analytical techniques for measuring fluxes of CO2 and CH4 from
hydroelectric reservoirs and natural water bodies. In Greenhouse gas emissions – fluxes and
processes: Hydroelectric reservoirs and natural environments. Tremblay, A., Varfalvy, L., Roehm,
C. and Garneau, M. (eds.), Springer Publishing, Germany.
Lucas, S., Coombes, P. and Sharma, A. (2010) The impact of diurnal water use patterns, demand
management and rainwater tanks on water supply network design. Water Science and Technology:
Water Supply. 10(1), 69-80.
National Water Commission (2007) Australian Water Uses – 2005. Available at: http://www.water.gov.au/
KeyMessages/WaterUse200405/ index.aspx? Menu=Level1_1_7 [accessed 3/12/2012].
Pauss, A., Andre, G., Perrier, M. and Guiot, SR. (1990) Liquid-to-gas mass transfer in anaerobic processes:
Inevitable transfer limitations of methane and hydrogen in the biomethanation process. Applied and
Environmental Microbiology. 56(6), 1636-1643.
Rockaway, T., Coomes, P., Rivard, J. and Kornstein, B. (2011) Residential water use trends in North
America. American Water Works Association Journal. 103(2), 76-89.
Sasse, L. (1998) DEWATS, Decentralized wastewater treatment in developing countries. Borda, Delho,
India.
Sharma, A., Burn, S., Gardner, T. and Gregory, A. (2010) Role of decentralized system in the transition of
urban water systems” Water Science and Technology: Water Supply. 10(4), 577-583.
Tremblay, A., Lambert, M. and Gagnon, L. (2004). Do hydroelectric reservoirs emit greenhouse gases?
Environmental Management. 33(1), S509-S517.
Tremblay, A., Bastien, J., Demarty, M. and Demers, C. (2009) Eastmain-1 net GHG emissions project –
The use of automated systems to measure greenhouse gas emissions from reservoirs. Proceedings of
Waterpower XVI, 27 to 30 July, Spokane, Washington.
Tchobanoglous G., Burton F.L. and Stensel H.D. (2003) Wastewater engineering: Treatment and reuse.
Metcalf and Eddy Inc. Mc Graw-Hill Higher Education. New York, United States.
US EPA. (2010) Greenhouse Gas Emissions Estimation Methodologies for Biogenic Emissions from
Selected Source Categories: Solid Waste Disposal, Wastewater Treatment, Ethanol Fermentation.
Available at: http://www.epa.gov/ttn/chief/efpac/ghg/GHG_Biogenic_Report_ draft_Dec1410.pdf
[accessed 07/03/2012]
US Federal Government. (2010) DRAFT Federal Greenhouse Gas Accounting and Reporting Guidance.
Technical Support Document. Available at: http://www.whitehouse.gov/ sites/default/files/microsites/ceq/Draft-GHG-
Technical-Support-Document.pdf [accessed 08/03/2012]
Venterea, R.T., Spokas, K.A. and Baker, J.M. (2009) Accuracy and precision analysis of chamber-based
nitrous oxide gas flux estimates. Soil Science Society of America Journal. 73, 1087-1093.

Urban Water Security Research Alliance
www.urbanwateralliance.org.au