Embed Size (px)
Citation preview
© COPYRIGHT INTELLIGENCE PRESS 2017 | NATGASINTEL.COM | NATURAL GAS INTEL | FOR A FREE TRIAL VISIT NATGASINTEL.COM
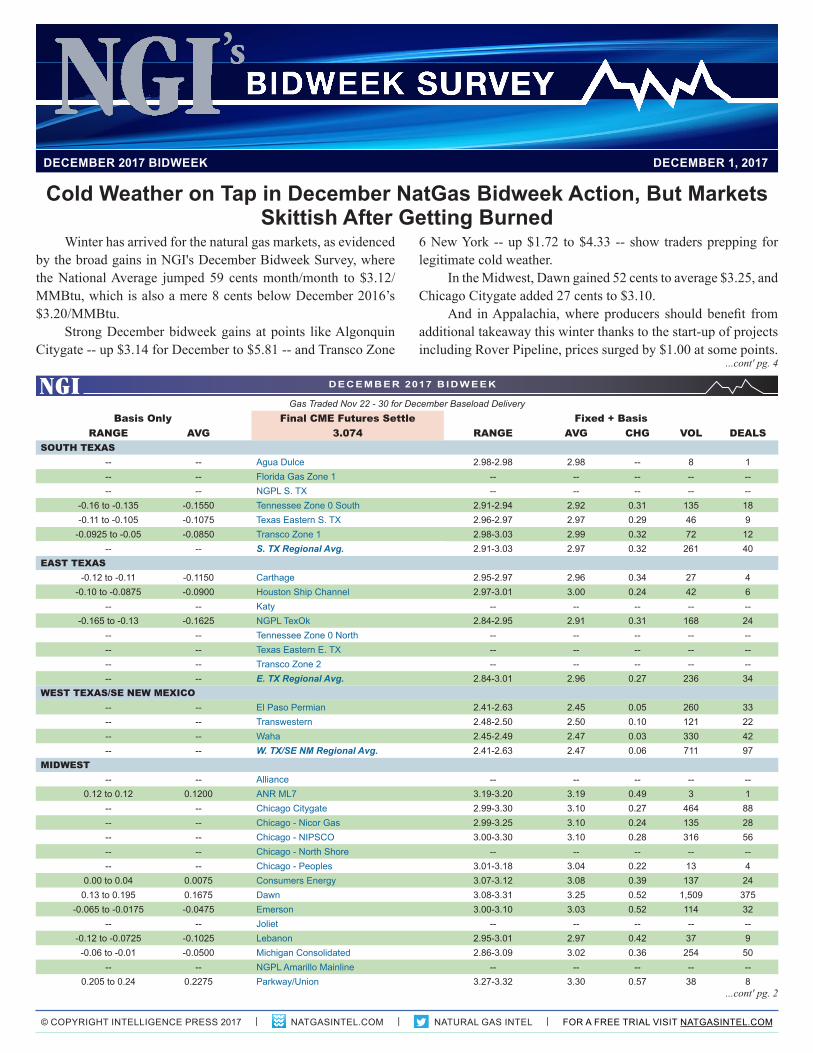
6 New York -- up $1.72 to $4.33 -- show traders prepping for legitimate cold weather.
In the Midwest, Dawn gained 52 cents to average $3.25, and Chicago Citygate added 27 cents to $3.10.
And in Appalachia, where producers should benefit from additional takeaway this winter thanks to the start-up of projects including Rover Pipeline, prices surged by $1.00 at some points.
Gas Traded Nov 22 - 30 for December Baseload DeliveryBasis Only Final CME Futures Settle Fixed + Basis
RANGE AVG 3.074 RANGE AVG CHG VOL DEALSSOUTH TEXAS
-- -- Agua Dulce 2.98-2.98 2.98 -- 8 1-- -- Florida Gas Zone 1 -- -- -- -- ---- -- NGPL S. TX -- -- -- -- --
-0.16 to -0.135 -0.1550 Tennessee Zone 0 South 2.91-2.94 2.92 0.31 135 18-0.11 to -0.105 -0.1075 Texas Eastern S. TX 2.96-2.97 2.97 0.29 46 9
-0.0925 to -0.05 -0.0850 Transco Zone 1 2.98-3.03 2.99 0.32 72 12-- -- S. TX Regional Avg. 2.91-3.03 2.97 0.32 261 40
EAST TEXAS-0.12 to -0.11 -0.1150 Carthage 2.95-2.97 2.96 0.34 27 4
-0.10 to -0.0875 -0.0900 Houston Ship Channel 2.97-3.01 3.00 0.24 42 6-- -- Katy -- -- -- -- --
-0.165 to -0.13 -0.1625 NGPL TexOk 2.84-2.95 2.91 0.31 168 24-- -- Tennessee Zone 0 North -- -- -- -- ---- -- Texas Eastern E. TX -- -- -- -- ---- -- Transco Zone 2 -- -- -- -- ---- -- E. TX Regional Avg. 2.84-3.01 2.96 0.27 236 34
WEST TEXAS/SE NEW MEXICO-- -- El Paso Permian 2.41-2.63 2.45 0.05 260 33-- -- Transwestern 2.48-2.50 2.50 0.10 121 22-- -- Waha 2.45-2.49 2.47 0.03 330 42-- -- W. TX/SE NM Regional Avg. 2.41-2.63 2.47 0.06 711 97
MIDWEST-- -- Alliance -- -- -- -- --
0.12 to 0.12 0.1200 ANR ML7 3.19-3.20 3.19 0.49 3 1-- -- Chicago Citygate 2.99-3.30 3.10 0.27 464 88-- -- Chicago - Nicor Gas 2.99-3.25 3.10 0.24 135 28-- -- Chicago - NIPSCO 3.00-3.30 3.10 0.28 316 56-- -- Chicago - North Shore -- -- -- -- ---- -- Chicago - Peoples 3.01-3.18 3.04 0.22 13 4
0.00 to 0.04 0.0075 Consumers Energy 3.07-3.12 3.08 0.39 137 240.13 to 0.195 0.1675 Dawn 3.08-3.31 3.25 0.52 1,509 375
-0.065 to -0.0175 -0.0475 Emerson 3.00-3.10 3.03 0.52 114 32-- -- Joliet -- -- -- -- --
-0.12 to -0.0725 -0.1025 Lebanon 2.95-3.01 2.97 0.42 37 9-0.06 to -0.01 -0.0500 Michigan Consolidated 2.86-3.09 3.02 0.36 254 50
-- -- NGPL Amarillo Mainline -- -- -- -- --0.205 to 0.24 0.2275 Parkway/Union 3.27-3.32 3.30 0.57 38 8
Winter has arrived for the natural gas markets, as evidenced by the broad gains in NGI's December Bidweek Survey, where the National Average jumped 59 cents month/month to $3.12/MMBtu, which is also a mere 8 cents below December 2016’s $3.20/MMBtu.
Strong December bidweek gains at points like Algonquin Citygate -- up $3.14 for December to $5.81 -- and Transco Zone
DECEMBER 2017 BIDWEEK DECEMBER 1, 2017
Cold Weather on Tap in December NatGas Bidweek Action, But Markets Skittish After Getting Burned
...cont' pg. 4
DECEMBER 2017 B IDWEEK
...cont' pg. 2
NGI's BIDWEEK SURVEY December 1, 2017
NATGASINTEL.COM | NATURAL GAS INTEL | © COPYRIGHT INTELLIGENCE PRESS 2017 | FOR A FREE TRIAL VISIT NATGASINTEL.COM2
DECEMBER 2017 B IDWEEK
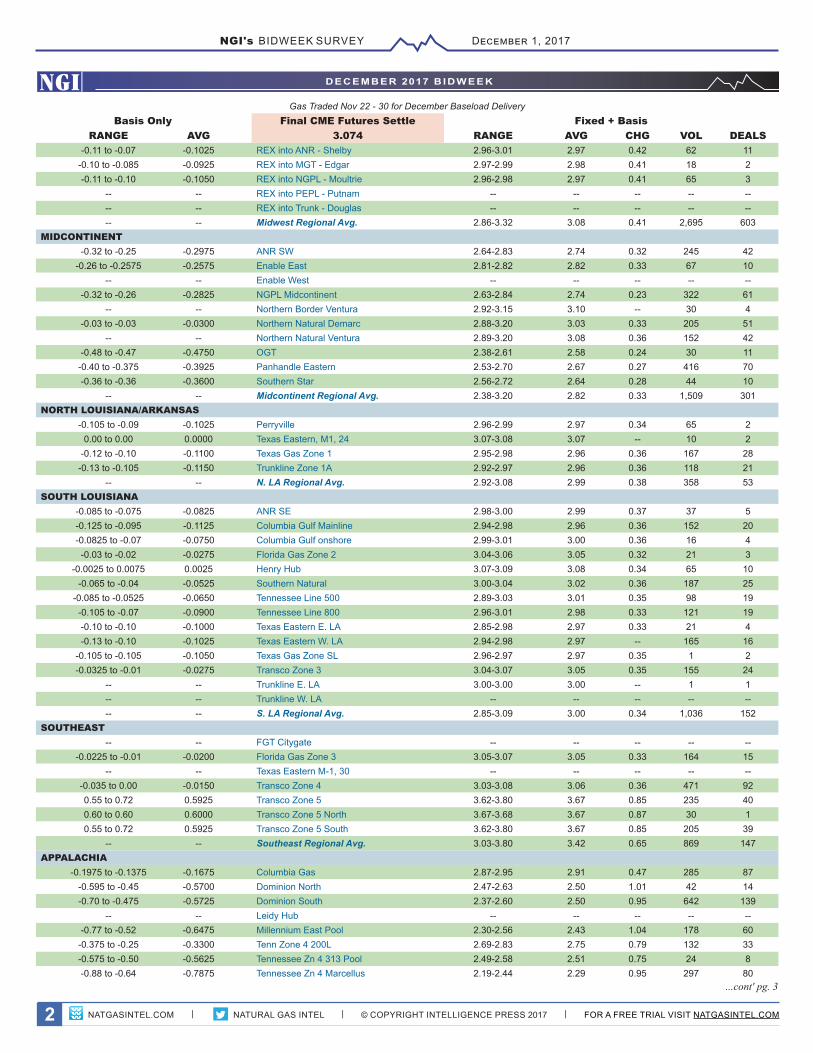
Gas Traded Nov 22 - 30 for December Baseload DeliveryBasis Only Final CME Futures Settle Fixed + Basis
RANGE AVG 3.074 RANGE AVG CHG VOL DEALS-0.11 to -0.07 -0.1025 REX into ANR - Shelby 2.96-3.01 2.97 0.42 62 11
-0.10 to -0.085 -0.0925 REX into MGT - Edgar 2.97-2.99 2.98 0.41 18 2-0.11 to -0.10 -0.1050 REX into NGPL - Moultrie 2.96-2.98 2.97 0.41 65 3
-- -- REX into PEPL - Putnam -- -- -- -- ---- -- REX into Trunk - Douglas -- -- -- -- ---- -- Midwest Regional Avg. 2.86-3.32 3.08 0.41 2,695 603
MIDCONTINENT-0.32 to -0.25 -0.2975 ANR SW 2.64-2.83 2.74 0.32 245 42
-0.26 to -0.2575 -0.2575 Enable East 2.81-2.82 2.82 0.33 67 10-- -- Enable West -- -- -- -- --
-0.32 to -0.26 -0.2825 NGPL Midcontinent 2.63-2.84 2.74 0.23 322 61-- -- Northern Border Ventura 2.92-3.15 3.10 -- 30 4
-0.03 to -0.03 -0.0300 Northern Natural Demarc 2.88-3.20 3.03 0.33 205 51-- -- Northern Natural Ventura 2.89-3.20 3.08 0.36 152 42
-0.48 to -0.47 -0.4750 OGT 2.38-2.61 2.58 0.24 30 11-0.40 to -0.375 -0.3925 Panhandle Eastern 2.53-2.70 2.67 0.27 416 70-0.36 to -0.36 -0.3600 Southern Star 2.56-2.72 2.64 0.28 44 10
-- -- Midcontinent Regional Avg. 2.38-3.20 2.82 0.33 1,509 301NORTH LOUISIANA/ARKANSAS
-0.105 to -0.09 -0.1025 Perryville 2.96-2.99 2.97 0.34 65 20.00 to 0.00 0.0000 Texas Eastern, M1, 24 3.07-3.08 3.07 -- 10 2
-0.12 to -0.10 -0.1100 Texas Gas Zone 1 2.95-2.98 2.96 0.36 167 28-0.13 to -0.105 -0.1150 Trunkline Zone 1A 2.92-2.97 2.96 0.36 118 21
-- -- N. LA Regional Avg. 2.92-3.08 2.99 0.38 358 53SOUTH LOUISIANA
-0.085 to -0.075 -0.0825 ANR SE 2.98-3.00 2.99 0.37 37 5-0.125 to -0.095 -0.1125 Columbia Gulf Mainline 2.94-2.98 2.96 0.36 152 20-0.0825 to -0.07 -0.0750 Columbia Gulf onshore 2.99-3.01 3.00 0.36 16 4-0.03 to -0.02 -0.0275 Florida Gas Zone 2 3.04-3.06 3.05 0.32 21 3
-0.0025 to 0.0075 0.0025 Henry Hub 3.07-3.09 3.08 0.34 65 10-0.065 to -0.04 -0.0525 Southern Natural 3.00-3.04 3.02 0.36 187 25
-0.085 to -0.0525 -0.0650 Tennessee Line 500 2.89-3.03 3.01 0.35 98 19-0.105 to -0.07 -0.0900 Tennessee Line 800 2.96-3.01 2.98 0.33 121 19-0.10 to -0.10 -0.1000 Texas Eastern E. LA 2.85-2.98 2.97 0.33 21 4-0.13 to -0.10 -0.1025 Texas Eastern W. LA 2.94-2.98 2.97 -- 165 16
-0.105 to -0.105 -0.1050 Texas Gas Zone SL 2.96-2.97 2.97 0.35 1 2-0.0325 to -0.01 -0.0275 Transco Zone 3 3.04-3.07 3.05 0.35 155 24
-- -- Trunkline E. LA 3.00-3.00 3.00 -- 1 1-- -- Trunkline W. LA -- -- -- -- ---- -- S. LA Regional Avg. 2.85-3.09 3.00 0.34 1,036 152
SOUTHEAST-- -- FGT Citygate -- -- -- -- --
-0.0225 to -0.01 -0.0200 Florida Gas Zone 3 3.05-3.07 3.05 0.33 164 15-- -- Texas Eastern M-1, 30 -- -- -- -- --
-0.035 to 0.00 -0.0150 Transco Zone 4 3.03-3.08 3.06 0.36 471 920.55 to 0.72 0.5925 Transco Zone 5 3.62-3.80 3.67 0.85 235 400.60 to 0.60 0.6000 Transco Zone 5 North 3.67-3.68 3.67 0.87 30 10.55 to 0.72 0.5925 Transco Zone 5 South 3.62-3.80 3.67 0.85 205 39
-- -- Southeast Regional Avg. 3.03-3.80 3.42 0.65 869 147APPALACHIA
-0.1975 to -0.1375 -0.1675 Columbia Gas 2.87-2.95 2.91 0.47 285 87-0.595 to -0.45 -0.5700 Dominion North 2.47-2.63 2.50 1.01 42 14-0.70 to -0.475 -0.5725 Dominion South 2.37-2.60 2.50 0.95 642 139
-- -- Leidy Hub -- -- -- -- ---0.77 to -0.52 -0.6475 Millennium East Pool 2.30-2.56 2.43 1.04 178 60
-0.375 to -0.25 -0.3300 Tenn Zone 4 200L 2.69-2.83 2.75 0.79 132 33-0.575 to -0.50 -0.5625 Tennessee Zn 4 313 Pool 2.49-2.58 2.51 0.75 24 8-0.88 to -0.64 -0.7875 Tennessee Zn 4 Marcellus 2.19-2.44 2.29 0.95 297 80
...cont' pg. 3
NGI's BIDWEEK SURVEY December 1, 2017
NATGASINTEL.COM | NATURAL GAS INTEL | © COPYRIGHT INTELLIGENCE PRESS 2017 | FOR A FREE TRIAL VISIT NATGASINTEL.COM 3
DECEMBER 2017 B IDWEEK
Prices are in US$/MMBtu except for prices in the Canada section, which are expressed in Cdn$/GJ. The deals column represents the number of transaction reports used by NGI in the calculation of the price and the volume column represents the sum of the volume of those deals, expressed in thousand MMBtus/day. Volumes may not total because of rounding. The data upon which we derive our indexes include both data provided to NGI from the ICE trading platform as well as submitted directly from companies who are principals to the trade. For more information, please see NGI's Price Methodology.
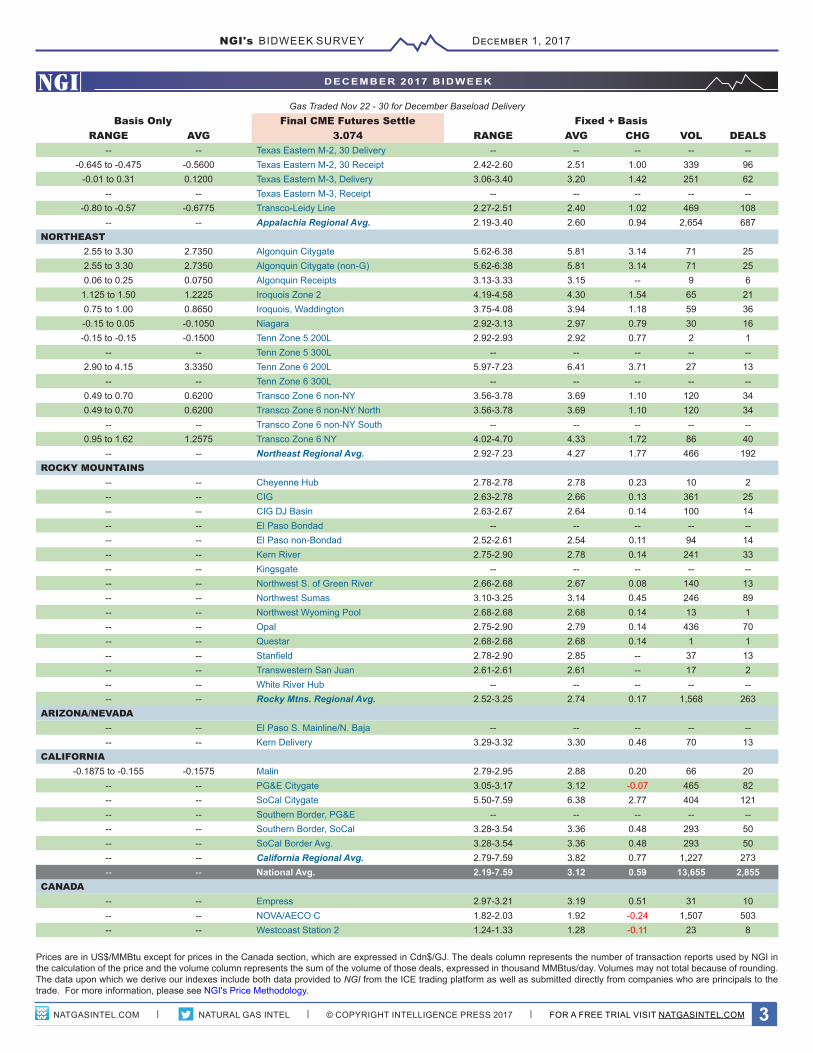
Gas Traded Nov 22 - 30 for December Baseload DeliveryBasis Only Final CME Futures Settle Fixed + Basis
RANGE AVG 3.074 RANGE AVG CHG VOL DEALS-- -- Texas Eastern M-2, 30 Delivery -- -- -- -- --
-0.645 to -0.475 -0.5600 Texas Eastern M-2, 30 Receipt 2.42-2.60 2.51 1.00 339 96-0.01 to 0.31 0.1200 Texas Eastern M-3, Delivery 3.06-3.40 3.20 1.42 251 62
-- -- Texas Eastern M-3, Receipt -- -- -- -- ---0.80 to -0.57 -0.6775 Transco-Leidy Line 2.27-2.51 2.40 1.02 469 108
-- -- Appalachia Regional Avg. 2.19-3.40 2.60 0.94 2,654 687NORTHEAST
2.55 to 3.30 2.7350 Algonquin Citygate 5.62-6.38 5.81 3.14 71 252.55 to 3.30 2.7350 Algonquin Citygate (non-G) 5.62-6.38 5.81 3.14 71 250.06 to 0.25 0.0750 Algonquin Receipts 3.13-3.33 3.15 -- 9 6
1.125 to 1.50 1.2225 Iroquois Zone 2 4.19-4.58 4.30 1.54 65 210.75 to 1.00 0.8650 Iroquois, Waddington 3.75-4.08 3.94 1.18 59 36-0.15 to 0.05 -0.1050 Niagara 2.92-3.13 2.97 0.79 30 16-0.15 to -0.15 -0.1500 Tenn Zone 5 200L 2.92-2.93 2.92 0.77 2 1
-- -- Tenn Zone 5 300L -- -- -- -- --2.90 to 4.15 3.3350 Tenn Zone 6 200L 5.97-7.23 6.41 3.71 27 13
-- -- Tenn Zone 6 300L -- -- -- -- --0.49 to 0.70 0.6200 Transco Zone 6 non-NY 3.56-3.78 3.69 1.10 120 340.49 to 0.70 0.6200 Transco Zone 6 non-NY North 3.56-3.78 3.69 1.10 120 34
-- -- Transco Zone 6 non-NY South -- -- -- -- --0.95 to 1.62 1.2575 Transco Zone 6 NY 4.02-4.70 4.33 1.72 86 40
-- -- Northeast Regional Avg. 2.92-7.23 4.27 1.77 466 192ROCKY MOUNTAINS
-- -- Cheyenne Hub 2.78-2.78 2.78 0.23 10 2-- -- CIG 2.63-2.78 2.66 0.13 361 25-- -- CIG DJ Basin 2.63-2.67 2.64 0.14 100 14-- -- El Paso Bondad -- -- -- -- ---- -- El Paso non-Bondad 2.52-2.61 2.54 0.11 94 14-- -- Kern River 2.75-2.90 2.78 0.14 241 33-- -- Kingsgate -- -- -- -- ---- -- Northwest S. of Green River 2.66-2.68 2.67 0.08 140 13-- -- Northwest Sumas 3.10-3.25 3.14 0.45 246 89-- -- Northwest Wyoming Pool 2.68-2.68 2.68 0.14 13 1-- -- Opal 2.75-2.90 2.79 0.14 436 70-- -- Questar 2.68-2.68 2.68 0.14 1 1-- -- Stanfield 2.78-2.90 2.85 -- 37 13-- -- Transwestern San Juan 2.61-2.61 2.61 -- 17 2-- -- White River Hub -- -- -- -- ---- -- Rocky Mtns. Regional Avg. 2.52-3.25 2.74 0.17 1,568 263
ARIZONA/NEVADA-- -- El Paso S. Mainline/N. Baja -- -- -- -- ---- -- Kern Delivery 3.29-3.32 3.30 0.46 70 13
CALIFORNIA-0.1875 to -0.155 -0.1575 Malin 2.79-2.95 2.88 0.20 66 20
-- -- PG&E Citygate 3.05-3.17 3.12 -0.07 465 82-- -- SoCal Citygate 5.50-7.59 6.38 2.77 404 121-- -- Southern Border, PG&E -- -- -- -- ---- -- Southern Border, SoCal 3.28-3.54 3.36 0.48 293 50-- -- SoCal Border Avg. 3.28-3.54 3.36 0.48 293 50-- -- California Regional Avg. 2.79-7.59 3.82 0.77 1,227 273-- -- National Avg. 2.19-7.59 3.12 0.59 13,655 2,855
CANADA-- -- Empress 2.97-3.21 3.19 0.51 31 10-- -- NOVA/AECO C 1.82-2.03 1.92 -0.24 1,507 503-- -- Westcoast Station 2 1.24-1.33 1.28 -0.11 23 8
NGI's BIDWEEK SURVEY December 1, 2017
NATGASINTEL.COM | NATURAL GAS INTEL | © COPYRIGHT INTELLIGENCE PRESS 2017 | FOR A FREE TRIAL VISIT NATGASINTEL.COM4
Dominion South jumped 95 cents to average $2.50 in December Bidweek, while Tetco M2 30 Receipt jumped $1.00 to $2.51.
However, coming off two warm winters in a row, the market has its doubts. Futures have been quick to flinch at any sign of a let-off in projected heating demand, even with overall confidence that significant cold will arrive by the end of the first week of December.
The December contract finished strong, coming off the board at $3.074, but it took an early-week surge to get there after trading as low as $2.797 just two sessions prior.
As for January, after gaining for three straight trading days on calls for a cold weather pattern to develop in the coming week, some overnight model runs that suggested that same cold pattern might not be as strong as previously thought prompted a 15.4 cent sell-off to test the $3.00 area Thursday.
The cold pattern that had excited the bulls a few days ago didn't disappear, but it trended a little warmer, and that's all it took, Commodity Weather Group President Matt Rogers told NGI.
"Every model came in warmer overnight" Wednesday to Thursday, Rogers said. "Basically, they didn't get rid of the cold pattern, they just weakened it. But I'll tell you, this market is so skittish because of how warm it's been the past two winters that any sign of warming is an exit risk."
And it wasn't long before yet another overnight change -- this time with some heating demand returning to the outlook -- had January rebounding back to around $3.090 during the first trading day of December.
The swings have been larger with weather arriving, but gas continues to trade within a long-standing range, Powerhouse LLC President Elaine Levin told NGI Thursday.
"It's also month-end, and natural gas had a heck of a run up the previous few days,” she said. "Maybe there was some profit-taking as well" in Thursday's sell-off. "This has been a long-established range in prices. It's been going for months. When you have a range-bound market, that's what you do until it breaks out of the range. In a trendless market, you buy the low of the range and sell the top of the range, and we saw both in five sessions.
"If you start to move above $3.25, then you might be onto something."
The fundamentals heading into the winter offer plenty for traders to mull. One the one hand, a year-on-year and year-on-five-year storage deficit, exports to Mexico and via liquefied natural gas (LNG). One the other, production above 76 Bcf/d, surging on the strength of output from the seemingly unleashed Northeast.
For the week ended Nov. 24, EIA reported a net 33 Bcf with-drawal from U.S. gas stocks. Last year 43 Bcf was withdrawn, and the five-year average for the period is a withdrawal of 47 Bcf.
The market had been anticipating a slightly larger withdrawal than the final number. A Reuters survey of traders and analysts had predicted on average a 37 Bcf withdrawal for the week,
with responses ranging from -28 Bcf to -54 Bcf. Kyle Cooper of ION Energy expected a 33 Bcf withdrawal, while Stephen Smith Energy Associates was calling for a withdrawal of 41 Bcf, lower than an original estimate for a 45 Bcf withdrawal. PointLogic Energy models were predicting a 35 Bcf withdrawal.
Total working gas in storage now stands at 3,693 Bcf, versus year-ago stocks of 4,002 Bcf and a five-year average of 3,800 Bcf. The year-on-five-year deficit shrank week/week by 14 Bcf to -107 Bcf, the EIA data show.
Bespoke Weather Services judged the -33 Bcf figure as "slightly bearish," coming in "a bit looser than last week's print but on a 10-week basis is about flat.
"The market appears unimpressed, barely moving off the print as focus is instead on forward weather expectations and increasing production levels," Bespoke said. "We see this number as confirming our concerns about elevated production being able to absorb additional demand as we move through the winter, and see current market balance as one key reason we have pulled back so significantly from highs despite only limited gas-weighted degree day losses."
Analysts with Tudor Pickering Holt & Co. (TPH) said in a note to clients Friday that based on the -33 Bcf figure "weather adjusted supply and demand looks to be relatively
. . . from Cold Weather on Tap in December NatGas Bidweek Action, pg. 1
...cont' pg. 5
NGI's BIDWEEK SURVEY December 1, 2017
NATGASINTEL.COM | NATURAL GAS INTEL | © COPYRIGHT INTELLIGENCE PRESS 2017 | FOR A FREE TRIAL VISIT NATGASINTEL.COM 5
...cont' pg. 6
balanced, consistent with the previous week." Noting the poten-tial for noise in the data from the Thanksgiving holiday, analysts said there's been "significant change in year-to-date trends in the supply/demand dynamic" for gas recently versus what looked to be an undersupplied market previously. This is likely because of "a combination of rapid growth in northeast supply over the last three months (about 2-3 Bcf/d based on flow data) and slowing sequential demand growth."
Production has pushed above 76 Bcf/d as the market waits for colder weather to lift demand, according to PointLogic's Jack Weixel, vice president of the analytics firm. With nationwide temperatures expected to fall from Dec. 6-Dec. 12, "the first two weeks of December could show significantly higher storage withdrawals than currently modeled, should the referenced cold troughs hold over the Midwest and Eastern regions longer than predicted,” he said in a note to clients Thursday.
"As of Thursday, total demand will average 72.6 Bcf/d for the week ending Dec. 7, with demand peaking on Dec. 7 at 81.2 Bcf/d, or over 11.6 Bcf/d higher than Thursday's estimated demand of 69.6 Bcf/d," he said. "The week ending Dec. 14 will likely come in even higher at an average near 83.4 Bcf/d. For reference, winter 2016/2017 saw only six weeks when domestic demand averaged over 82 Bcf/d and only one of those weeks was in December."
As for production, Thursday's "evening cycle nominations mark the ninth straight day that Lower 48 dry gas production has exceed the 76 Bcf/d mark,” he said.
Genscape Inc. has also recorded estimated production levels exceeding 76 Bcf/d. Genscape’s estimates from Tuesday and Wednesday came in "more than 2.1 Bcf/d higher than the start of the month," it said in a note to clients Thursday. "In that span, Northeast production is close to 1.3 Bcf/d higher, led primarily by Northeast Pennsylvania gains in excess of 0.65 Bcf/d. Within the Northeast, pipe samples show the systems with the largest gains include" Tennessee Gas Pipeline, Dominion, Stagecoach and Transco.
"Southwest Pennsylvania is showing more than 0.35 Bcf/d of growth along with about 0.15 Bcf/d of growth in Ohio and West Virginia,” Genscape said.
Rafferty Commodities Group’s Steve Blair, vice president, told NGI he thinks the rise in production may be serving to offset concerns about additional tightness because of Mexico and LNG exports.
"That may be one of the reasons the market is looking more toward weather," he said.
Said Powerhouse's Levin, "It seems to me like the market's feeling that we're closer to an equilibrium than not." Hence the range. "One day, something will happen, and we'll break out of that range. What it will be, your guess is as good as mine."
Then there's SoCal Citygate.Sempra Energy’s gas utility Southern California Gas (So-
CalGas) continues to report zero scheduled volumes through
key import points at Topock, AZ, and Needles, CA, and more recently imports across the Mexico border at Otay Mesa have also been restricted. This is on top of limited availability of stor-age withdrawals from Aliso Canyon in the aftermath of the leak discovered in 2015.
Anxiety over potential supply shortages manifested during bidweek, with potential supply shortages in play as December demand increases loom on the horizon.
December bidweek prices at SoCal Citygate surged as high as $7.59 and averaged $6.38, up $2.77 month/month. That means SoCal Citygate bidweek prices for December surpassed the winter-constrained Algonquin Citygate ($5.81).
The restrictions on imports into the SoCalGas system have been severe enough that state regulators are concerned. A report issued last Tuesday by California energy agencies and the Los Angeles Department of Water and Power highlighted the uncer-tainty of gas supply availability this winter.
California officials predict that supplies from Aliso Canyon, the state's largest gas storage facility, would be needed this winter. "Under extreme cold weather events, there may be insufficient gas supplies to meet demand even relying on withdrawals from all of the other storage fields," the report noted.
A little bit of relief could soon be on the way to the Golden State, according to Genscape.
NGI's BIDWEEK SURVEY December 1, 2017
NATGASINTEL.COM | NATURAL GAS INTEL | © COPYRIGHT INTELLIGENCE PRESS 2017 | FOR A FREE TRIAL VISIT NATGASINTEL.COM6
NOVEMBER 2017 CUMULATIVE PRICES
Gas Traded Oct 31 - Nov 29 for Nov Incremental Delivery
...cont' pg. 7
RANGE AVGSouth Texas
Agua Dulce 2.85-2.98 2.95Florida Gas Zone 1 -- --NGPL S. TX 2.60-3.08 2.89Tennessee Zone 0 South 2.60-3.03 2.84Texas Eastern S. TX 2.66-3.10 2.92Transco Zone 1 2.64-3.12 2.93Tres Palacios 2.65-3.14 2.91S. TX Regional Avg. 2.60-3.14 2.90
East TexasAtmos Zone 3 2.70-2.90 2.80Carthage 2.55-3.13 2.87Golden Triangle Storage -- --Houston Ship Channel 2.66-3.11 2.94HPL - East Texas Pool 2.70-2.98 2.91Katy 2.65-3.12 2.93Maypearl 2.45-2.90 2.77Moss Bluff 2.75-3.14 2.96NGPL TexOk 2.55-3.08 2.85Tennessee Zone 0 North 2.60-2.99 2.74Texas Eastern E. TX 2.60-3.07 2.88Tolar Hub 2.55-2.99 2.77Transco Zone 2 2.60-3.17 2.93E. TX Regional Avg. 2.45-3.17 2.89
West Texas/SE New MexicoEl Paso Permian 2.10-2.89 2.55Northern Natural Gas 1-7 2.35-2.90 2.60Oneok WesTex 2.29-2.92 2.60Transwestern 2.23-2.87 2.57Waha 2.35-2.93 2.62W. TX/SE NM Regional Avg. 2.10-2.93 2.58
MidwestAlliance 2.63-3.30 2.96ANR ML7 2.68-3.30 2.98Bluewater Hub -- --Chicago Citygate 2.63-3.39 2.98Chicago - Nicor Gas 2.63-3.38 2.98Chicago - NIPSCO 2.63-3.38 2.99Chicago - North Shore -- --Chicago - Peoples 2.64-3.39 2.98Consumers Energy 2.67-3.25 2.97Dawn 2.72-3.43 3.12Emerson 2.56-3.25 2.90Joliet 2.62-3.30 2.96
RANGE AVGLebanon 2.60-3.15 2.88Michigan Consolidated 2.67-3.24 2.97NGPL Amarillo Mainline 2.54-3.16 2.85NGPL Iowa-Illinois 2.65-3.28 3.03NGPL MidAmerican 2.65-3.32 3.01Parkway/Union 2.72-3.51 3.14REX into ANR - Shelby 2.61-3.16 2.89REX into MGT - Edgar 2.61-3.17 2.90REX into NGPL - Moultrie 2.60-3.16 2.89REX into PEPL - Putnam 2.62-3.16 2.89REX into Trunk - Douglas 2.60-3.15 2.89St. Clair 2.80-3.42 3.12Midwest Regional Avg. 2.54-3.51 2.96
MidcontinentANR SW 2.30-2.96 2.68Enable East 2.29-2.95 2.71Enable West 2.25-2.61 2.47NGPL Midcontinent 2.28-2.95 2.68Northern Border Ventura 2.58-3.30 2.91Northern Natural Demarc 2.60-3.31 2.91Northern Natural Gas 8-12 -- --Northern Natural Gas 13-16A -- --Northern Natural Ventura 2.58-3.30 2.91OGT 2.26-2.86 2.57Panhandle Eastern 2.25-2.94 2.59Southern Star 2.35-2.98 2.63Transwestern Panhandle Pool -- --Midcontinent Regional Avg. 2.25-3.31 2.73
North Louisiana/ArkansasEnable South 2.55-3.05 2.83NGPL Gulf Coast Mainline 2.55-3.15 2.87Perryville 2.66-3.13 2.91Texas Eastern, M1, 24 2.53-3.15 2.88Texas Gas Zone 1 2.56-3.13 2.89Trunkline Zone 1A 2.60-3.13 2.89N. LA Regional Avg. 2.53-3.15 2.89
South LouisianaANR SE 2.62-3.16 2.92Bobcat Storage 2.68-3.04 2.88Columbia Gulf Mainline 2.54-3.15 2.89Columbia Gulf onshore 2.64-3.12 2.91Egan Hub 2.75-3.11 2.96Florida Gas Zone 2 2.65-3.15 2.96Henry Hub 2.60-3.20 2.98
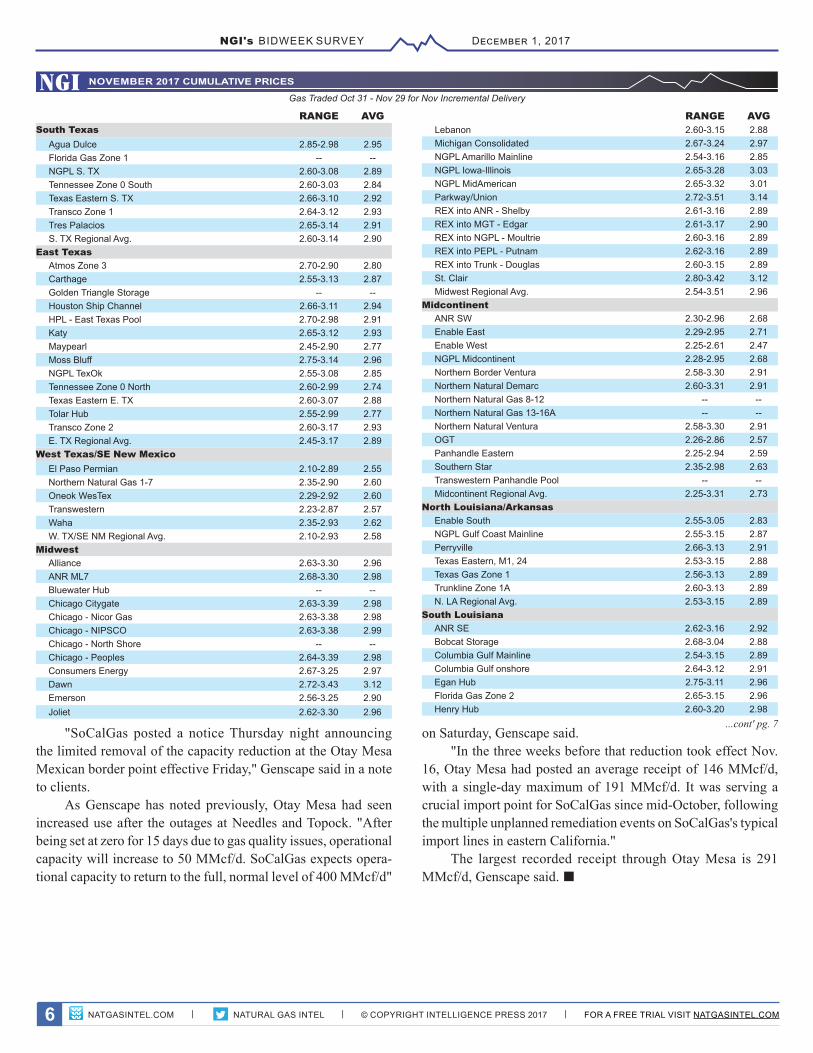
"SoCalGas posted a notice Thursday night announcing the limited removal of the capacity reduction at the Otay Mesa Mexican border point effective Friday," Genscape said in a note to clients.
As Genscape has noted previously, Otay Mesa had seen increased use after the outages at Needles and Topock. "After being set at zero for 15 days due to gas quality issues, operational capacity will increase to 50 MMcf/d. SoCalGas expects opera-tional capacity to return to the full, normal level of 400 MMcf/d"
on Saturday, Genscape said."In the three weeks before that reduction took effect Nov.
16, Otay Mesa had posted an average receipt of 146 MMcf/d, with a single-day maximum of 191 MMcf/d. It was serving a crucial import point for SoCalGas since mid-October, following the multiple unplanned remediation events on SoCalGas's typical import lines in eastern California."
The largest recorded receipt through Otay Mesa is 291 MMcf/d, Genscape said. n
NGI's BIDWEEK SURVEY December 1, 2017
NATGASINTEL.COM | NATURAL GAS INTEL | © COPYRIGHT INTELLIGENCE PRESS 2017 | FOR A FREE TRIAL VISIT NATGASINTEL.COM7
NGI's Bidweek Survey is published by close of business on the first business day of each month by Intelligence Press, Inc. (800) 427-5747.For breaking natural gas and shale news and more detailed pricing data, please visit us at: http://naturalgasintel.com For a listing of all our our premium newsletters and data services, please visit: http://naturalgasintel.com/premiumservices Editor/Publisher Emeritus: Ellen Beswick; Executive Publisher: Dexter Steis; Editor-In-Chief: Alex Steis; Managing Editor: Carolyn L. Davis (Houston) e-mail -- [email protected]; Senior Editors: David Bradley, Jamison Cocklin (Pittsburgh). Analysts: Patrick Rau, CFA (NYC) and Nathan Harrison. Associate Editor: Charlie Passut; Markets Editor: Jeremiah Shelor; Correspondents: Richard Nemec (Los Angeles), Gordon Jaremko (Calgary), Ronald Buchanan (Mexico City), Peter de Montmollin (Montevideo, UY).Contact us: EDITORIAL: [email protected]; PRICING: [email protected]; SUPPORT/SALES: [email protected]; ADVERTISE: [email protected] Press, Inc. © Copyright 2017. Contents may not be reproduced, stored in a retrieval system, accessed by computer, or transmitted by any means without a site license or prior written permission of the publisher.
NGI's Bidweek Survey
December 1, 2017
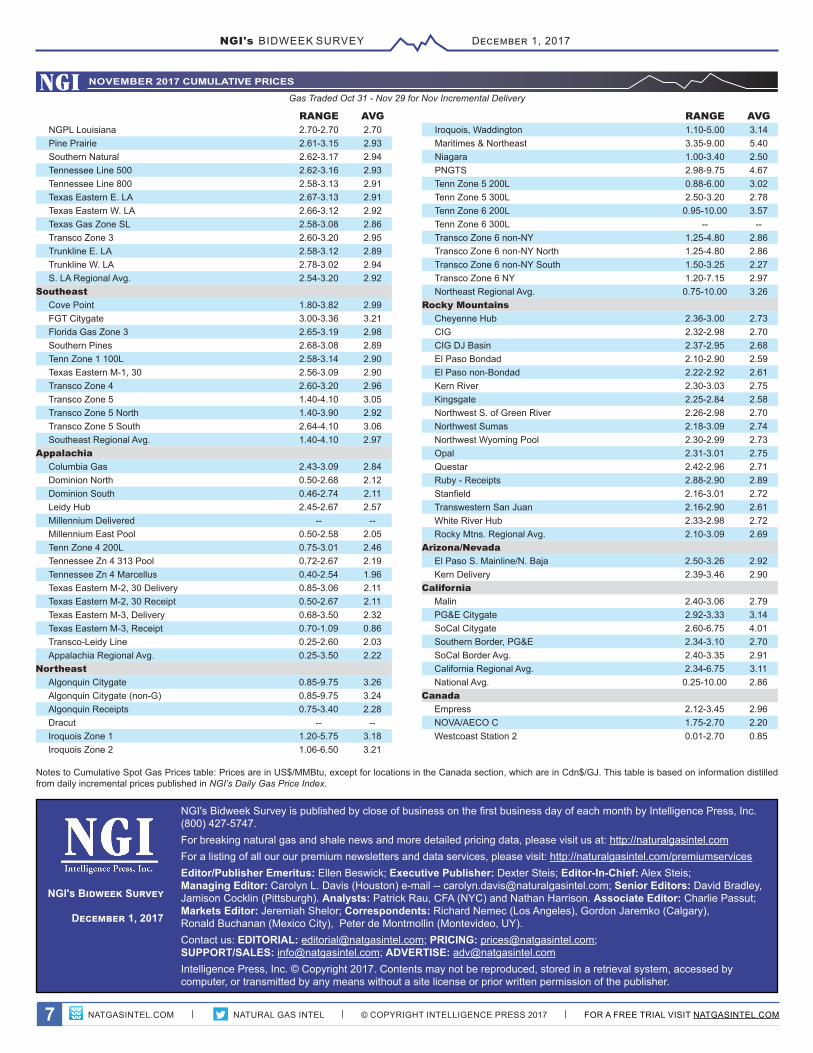
Notes to Cumulative Spot Gas Prices table: Prices are in US$/MMBtu, except for locations in the Canada section, which are in Cdn$/GJ. This table is based on information distilled from daily incremental prices published in NGI’s Daily Gas Price Index.
NOVEMBER 2017 CUMULATIVE PRICES
Gas Traded Oct 31 - Nov 29 for Nov Incremental Delivery
RANGE AVGNGPL Louisiana 2.70-2.70 2.70Pine Prairie 2.61-3.15 2.93Southern Natural 2.62-3.17 2.94Tennessee Line 500 2.62-3.16 2.93Tennessee Line 800 2.58-3.13 2.91Texas Eastern E. LA 2.67-3.13 2.91Texas Eastern W. LA 2.66-3.12 2.92Texas Gas Zone SL 2.58-3.08 2.86Transco Zone 3 2.60-3.20 2.95Trunkline E. LA 2.58-3.12 2.89Trunkline W. LA 2.78-3.02 2.94S. LA Regional Avg. 2.54-3.20 2.92
SoutheastCove Point 1.80-3.82 2.99FGT Citygate 3.00-3.36 3.21Florida Gas Zone 3 2.65-3.19 2.98Southern Pines 2.68-3.08 2.89Tenn Zone 1 100L 2.58-3.14 2.90Texas Eastern M-1, 30 2.56-3.09 2.90Transco Zone 4 2.60-3.20 2.96Transco Zone 5 1.40-4.10 3.05Transco Zone 5 North 1.40-3.90 2.92Transco Zone 5 South 2.64-4.10 3.06Southeast Regional Avg. 1.40-4.10 2.97
AppalachiaColumbia Gas 2.43-3.09 2.84Dominion North 0.50-2.68 2.12Dominion South 0.46-2.74 2.11Leidy Hub 2.45-2.67 2.57Millennium Delivered -- --Millennium East Pool 0.50-2.58 2.05Tenn Zone 4 200L 0.75-3.01 2.46Tennessee Zn 4 313 Pool 0.72-2.67 2.19Tennessee Zn 4 Marcellus 0.40-2.54 1.96Texas Eastern M-2, 30 Delivery 0.85-3.06 2.11Texas Eastern M-2, 30 Receipt 0.50-2.67 2.11Texas Eastern M-3, Delivery 0.68-3.50 2.32Texas Eastern M-3, Receipt 0.70-1.09 0.86Transco-Leidy Line 0.25-2.60 2.03Appalachia Regional Avg. 0.25-3.50 2.22
NortheastAlgonquin Citygate 0.85-9.75 3.26Algonquin Citygate (non-G) 0.85-9.75 3.24Algonquin Receipts 0.75-3.40 2.28Dracut -- --Iroquois Zone 1 1.20-5.75 3.18Iroquois Zone 2 1.06-6.50 3.21
RANGE AVGIroquois, Waddington 1.10-5.00 3.14Maritimes & Northeast 3.35-9.00 5.40Niagara 1.00-3.40 2.50PNGTS 2.98-9.75 4.67Tenn Zone 5 200L 0.88-6.00 3.02Tenn Zone 5 300L 2.50-3.20 2.78Tenn Zone 6 200L 0.95-10.00 3.57Tenn Zone 6 300L -- --Transco Zone 6 non-NY 1.25-4.80 2.86Transco Zone 6 non-NY North 1.25-4.80 2.86Transco Zone 6 non-NY South 1.50-3.25 2.27Transco Zone 6 NY 1.20-7.15 2.97Northeast Regional Avg. 0.75-10.00 3.26
Rocky MountainsCheyenne Hub 2.36-3.00 2.73CIG 2.32-2.98 2.70CIG DJ Basin 2.37-2.95 2.68El Paso Bondad 2.10-2.90 2.59El Paso non-Bondad 2.22-2.92 2.61Kern River 2.30-3.03 2.75Kingsgate 2.25-2.84 2.58Northwest S. of Green River 2.26-2.98 2.70Northwest Sumas 2.18-3.09 2.74Northwest Wyoming Pool 2.30-2.99 2.73Opal 2.31-3.01 2.75Questar 2.42-2.96 2.71Ruby - Receipts 2.88-2.90 2.89Stanfield 2.16-3.01 2.72Transwestern San Juan 2.16-2.90 2.61White River Hub 2.33-2.98 2.72Rocky Mtns. Regional Avg. 2.10-3.09 2.69
Arizona/NevadaEl Paso S. Mainline/N. Baja 2.50-3.26 2.92Kern Delivery 2.39-3.46 2.90
CaliforniaMalin 2.40-3.06 2.79PG&E Citygate 2.92-3.33 3.14SoCal Citygate 2.60-6.75 4.01Southern Border, PG&E 2.34-3.10 2.70SoCal Border Avg. 2.40-3.35 2.91California Regional Avg. 2.34-6.75 3.11National Avg. 0.25-10.00 2.86
CanadaEmpress 2.12-3.45 2.96NOVA/AECO C 1.75-2.70 2.20Westcoast Station 2 0.01-2.70 0.85


![View full document [PDF 2.97 MB] - PreventionWeb](https://img.pdfslide.us/doc/110x75/62073ef949d709492c2f725a/view-full-document-pdf-297-mb-preventionweb.jpg)