Embed Size (px)
Citation preview
Welsh Government
M4 Corridor around Newport
December 2016 Environmental Statement Supplement Appendix SS16.1 Revised Water Treatment Area DMRB Risk Assessment
M4CaN-DJV-EWE-ZG_GEN-AX-EN-0003
At Issue | December 2016
.
CVJV/AAR
3rd
Floor
Longross Court,
47 Newport Road,
Cardiff
CF24 0AD

Welsh Government M4 Corridor around Newport
December 2016 Environmental Statement Supplement
Appendix SS16.1 Revised Water Treatment Area DMRB Risk Assessment
Contents
Page
1 Introduction 1
2 Revised HAWRAT Assessment 6
3 Proposed Contingency Measures 11
5 References 15

Welsh Government M4 Corridor around Newport
December 2016 Environmental Statement Supplement
Appendix SS16.1 Revised Water Treatment Area DMRB Risk Assessment
M4CaN-DJV-EWE-ZG_GEN-AX-EN-0003 | At Issue | December 2016
Page 1
1 Introduction
1.1 Background
1.1.1 An assessment of the potential impact of the proposed Water Treatment Area
(WTA) discharges on surface water quality was undertaken and reported in the
Water Treatment Area Design Manual for Roads and Bridges (DMRB) Risk
Assessments (Appendix 16.3 of the March 2016 Environmental Statement (ES)).
1.1.2 Following comments from NRW on the March 2016 ES and a subsequent
meeting held with their water quality and conservation experts, it was agreed to
reassess the proposed Water Treatment Area water environment risk
assessments. This was principally in light of updated NRW water quality trigger
levels for the Gwent Levels SSSI but also to take account of any limitations of the
HAWRAT methodology due to very low or non-flow within reens proposed to
receive WTA discharges.
1.1.3 It was agreed that the risk assessment would be reappraised to increase the
conservatism of the original work by identifying areas where the dependence on
reen flow in the prediction of worst case impacts on water quality could be further
constrained.
1.1.4 NRW stated given the very high sensitivity of the Gwent Levels SSSI, high
confidence was required that reen water quality would be preserved following
discharge of the proposed treated motorway drainage.
1.2 Methodology
1.2.1 As previously undertaken, this assessment was undertaken to DMRB
methodology including use of the bespoke Highways Agency Water Risk
Assessment Tool (HAWRAT). HAWRAT is approved by the Highways Agency
and Environment Agency for the assessment of pollution impacts from routine
runoff to surface waters to inform Environmental Impact Assessment (EIA).
1.2.2 Part of the DMRB assessment methodology requires delineation of mitigation
measures present within the proposed road drainage design to reduce impact
from pollution to within scientifically judged acceptable limits. As described in the
Drainage Strategy Report and Supplementary Drainage Strategy Report
(Appendices 2.2 and S2.2 to the March 2016 ES and September 2016 ES
Supplement respectively), such mitigation measures included:
extensive roadside grass lined channels totalling approximately 14km,
including 80% of the motorway within the Gwent Levels SSSI;
a pollution control lagoon (also known as a bypass interceptor or forebay);
a permanently wet attenuation lagoon (also known as a wet sedimentation
pond) ; and
a reed bed (also known as a wetland) (averaging approximately 800 m2 for
every hectare of drained motorway).
1.2.3 For clarity of terminology the following terms will be adopted for describing the
above pollution attenuation features individually referred to stages of a treatment
train.

Welsh Government M4 Corridor around Newport
December 2016 Environmental Statement Supplement
Appendix SS16.1 Revised Water Treatment Area DMRB Risk Assessment
M4CaN-DJV-EWE-ZG_GEN-AX-EN-0003 | At Issue | December 2016
Page 2
Stage 1: Grass Lined Channels.
Stage 2: Pollution Control Lagoon.
Stage 3: Attenuation Lagoon .
Stage 4: Reed Bed
1.2.4 Due to road drainage design requirements, it is not possible to include road side
grass lined channels for a section of the proposed new section of motorway
within the Gwent Levels Site of Special Scientific Interest (SSSI). Concrete
channels have therefore been proposed. This section drains to WTA10 and
consequently, WTA10 comprises a three-stage rather than four-stage treatment
train.
1.2.5 Additionally, WTAs located outside of the Gwent Levels SSSI where lower
elevation embankments are not possible due to vertical alignment considerations,
grass lined channels are also not proposed. Accordingly WTA1, WTA2, WTA8a,
WTA11b, WTC11c, WTA12a and WTA12b comprise three stage treatment trains.
1.2.6 Annex 2 summarises the WTA drainage design parameters and chainage within
the Gwent Levels SSSI and grass lined channel provisions.
1.3 Previous Assessment
Quantitative Assessment of Proposed Mitigation Measures
1.3.1 An assessment of the pollution reduction potential of three and four stage
treatment trains was undertaken within Appendix 16.3 to the March 2016 ES.
This approach utilised guidance within CIRIA C609 Sustainable Drainage
Systems. This guidance provides approaches to conservatively judge expected
combined pollution reduction efficiencies for multi train treatment systems for
chemically similar groups of contaminants.
1.3.2 For clarity the combined pollution reduction efficiencies calculated following
CIRIA guidance are summarised in Table 1.1.
Table 1.1: Cumulative Treatment Efficiencies of Proposed 4 and 3 Stage
Treatment Train
Pollutant Group 4 Stage 3 stage
TSS / suspended heavy metals 95.6% 91.9%
Heavy metals - dissolved 94.8% 82.2%
Hydrocarbons / PAH 93.7% 83.7%
Nutrients 57.2% 50.3%
TSS = Total Suspended Solids. PAH = Polynuclear Aromatic Hydrocarbons.
Results of HAWRAT Assessment
1.3.3 The results of the HAWRAT assessment reported in Appendix 16.3 found that all
proposed attenuated WTA discharges at the proposed maximum design
discharge rates as defined within the Drainage Strategy Report (Appendix 2.2 of
the March 2016 ES) did not exceed strict HAWRAT water quality and sediment
compliance criteria for both 6 and 24 hour periods for dissolved copper and zinc -
termed Run-off Specific Thresholds (RST) and annual accumulation potential of
Welsh Government M4 Corridor around Newport
December 2016 Environmental Statement Supplement
Appendix SS16.1 Revised Water Treatment Area DMRB Risk Assessment
M4CaN-DJV-EWE-ZG_GEN-AX-EN-0003 | At Issue | December 2016
Page 3
sediment bound copper, zinc, cadmium and PAH - termed Threshold Effect
Levels (TEL) and Probable Effect Levels (PEL).
1.3.4 The HAWRAT criteria RST, TEL and PEL concentrations were developed by
collaborative research undertaken by the Environment Agency and the Highways
Agency. This utilised short term toxicity studies for 13 algal, invertebrate and fish
species along with literature data for other relevant species all chosen as
representative of UK resident species with a representative range of sensitivities
to significant pollutants found in road run-off. In this way the concentrations are
protective against possible short term effects on tested and untested but sensitive
species. Higher standards of compliance are required for discharges within 1km
of protected sites including SSSI and Special Areas of Conservation (SAC).
1.3.5 This approach is consistent with that adopted for the derivation of Environmental
Quality Standards (EQS) under the Water Framework Directive (WFD). The
HAWRAT user guide provides a complete description of the methodology and
underlying science and principals of operation of the assessment.
1.3.6 A further assessment was undertaken in Appendix 16.3 to the March 2016 ES to
determine the likelihood that baseline water quality as measured over 4 quarterly
monitoring rounds at or near proposed locations of WTA discharges to reens,
could be preserved.
1.3.7 This assessment defined current representative Ambient Background
Concentrations (ABC) for the contaminants of concern within reens at the
location of each proposed WTA discharge and calculated the attenuation factors
required to reduce HAWRAT predicted discharge concentration - post treatment -
back to these ambient concentrations.
1.3.8 This assessment found that owing to the very low levels of pollutants at some
locations within the Gwent Levels SSSI, not all discharged water would be at a
reen ABC prior to entry into the watercourse for all ruin-off events predicted by
HAWRAT over a ten year period.
1.3.9 However, it was found that for both 3 and 4 treatment train WTAs, treated
discharges prior to entry into a reen were below the appropriate WFD EQS for
every contaminant of concern with the exception of fluoranthene owing to its
extremely low EQS concentration and chloride during winter thaws following salt
treatment of the carriageway. Many of the contaminants prior to discharge to a
reen were below half the WFD EQS.
Quantitative Approach to Reed Bed Sizing
1.3.10 The preliminary design of reed bed sizes is based on literature guidance (Ellis et
al., 2003) on critical performance criteria to ensure these features are capable of
operating at expected pollutant removal efficiencies. This guidance was
produced for use by the Environment Agency operational staff and others
involved in the control and management of surface water runoff from
development, and those who are seeking advice on the construction and
operation of constructed wetlands (reed beds) to treat road runoff.
1.3.11 Such performance criteria optimised for the individual reed bed areas within WTA
include the recommended residence time for water within the wetland prior to
discharge and the recommended hydraulic loading rates; that is the ratio of the
flow through a wetland to its total area.

Welsh Government M4 Corridor around Newport
December 2016 Environmental Statement Supplement
Appendix SS16.1 Revised Water Treatment Area DMRB Risk Assessment
M4CaN-DJV-EWE-ZG_GEN-AX-EN-0003 | At Issue | December 2016
Page 4
1.3.12 Such a design approach is considered a robust methodology from which to size
reed beds to deliver the optimum performance for the removal of residual
pollutants within water emerging from the attenuation lagoon of the WTA, prior to
discharge to a receiving watercourse.
1.3.13 Reed bed sizing has been approached solely from the standpoint of providing
high confidence of water quality protection. No other sizing constraints have
been considered, i.e. reducing land take and associated impacts.
1.3.14 Annex 2 presents the reed bed sizing parameters and calculations.
NRW Response to the Environmental Statement
1.3.15 With respect to the proposed motorway drainage discharges to tidal waters of the
Rivers Usk and Ebbw, in their comments of 4th May 2016 on Chapter 16 Road
Drainage and the Water Environment of the March 2016 ES, NRW stated that:
"we are satisfied that discharges to the Rivers Usk and Ebbw have lesser
requirements for attenuation and treatment and, provided these requirements are
adequately covered to our satisfaction within the Statement of Commitments, we
advise that that the proposals presented into these tidal waters are adequate."
1.3.16 With regard to the treatment of data in Appendix 16.3, NRW stated:
"We also note that 'average levels' and 'ranges' are provided. This data is of
limited use in interpreting water quality data trends with respect to the SSSIs. All
data from samples must be viewed independently as this is the only way to
ensure exceedances of contaminants can be identified. In particular, when
considered in conjunction with the proposals and the potential for adverse impact
on water quality during both construction and operation phases."
Water Quality Meeting with NRW
1.3.17 Following a meeting with NRW water quality and conservation specialists, a set
of revised water quality trigger levels were presented. These are intended to
replace the former Countryside Council for Wales (CCW) trigger levels provided
by NRW at the time of assessment for, and publication of, the March 2016
Environmental Statement. The new trigger levels are based principally on Water
Framework Directive (WFD) Environmental Quality Standards (EQS) and thus
afford a predominantly higher standard of protection to the watercourses of the
Gwent Levels SSSI.
1.3.18 At this meeting the HAWRAT assessments provided to support the Water
Environment and Drainage chapter of the Environmental Statement was
discussed. It was accepted that HAWRAT was an appropriate tool to assess
likely risks on water quality from the proposed WTA, however caution was
expressed on the validity of reliance on flow within reens accepting drainage
discharges. On this basis, revised HAWRAT calculations will be undertaken
within this revised assessment to explore sensitivity to low flow conditions on
soluble and sediment discharges from WTA on water quality.
1.3.19 Reed bed sizing methodology was discussed and the approach based on
residence time analysis, as described in Ellis et al., 2003 and used to inform the
March 2016 Environmental Statement, was considered an appropriate approach.
Welsh Government M4 Corridor around Newport
December 2016 Environmental Statement Supplement
Appendix SS16.1 Revised Water Treatment Area DMRB Risk Assessment
M4CaN-DJV-EWE-ZG_GEN-AX-EN-0003 | At Issue | December 2016
Page 5
1.3.20 Finally, the requirement for the identification of appropriate contingency
measures was discussed. To this end, a number of additional practices are
identified and described to foresee, avoid and/or mitigate potentially
unacceptable deteriorations in long term water quality or aquatic ecological
quality within reens accepting WTA discharges.
Welsh Government M4 Corridor around Newport
December 2016 Environmental Statement Supplement
Appendix SS16.1 Revised Water Treatment Area DMRB Risk Assessment
M4CaN-DJV-EWE-ZG_GEN-AX-EN-0003 | At Issue | December 2016
Page 6
2 Revised HAWRAT Assessment
2.1 Soluble Pollutants
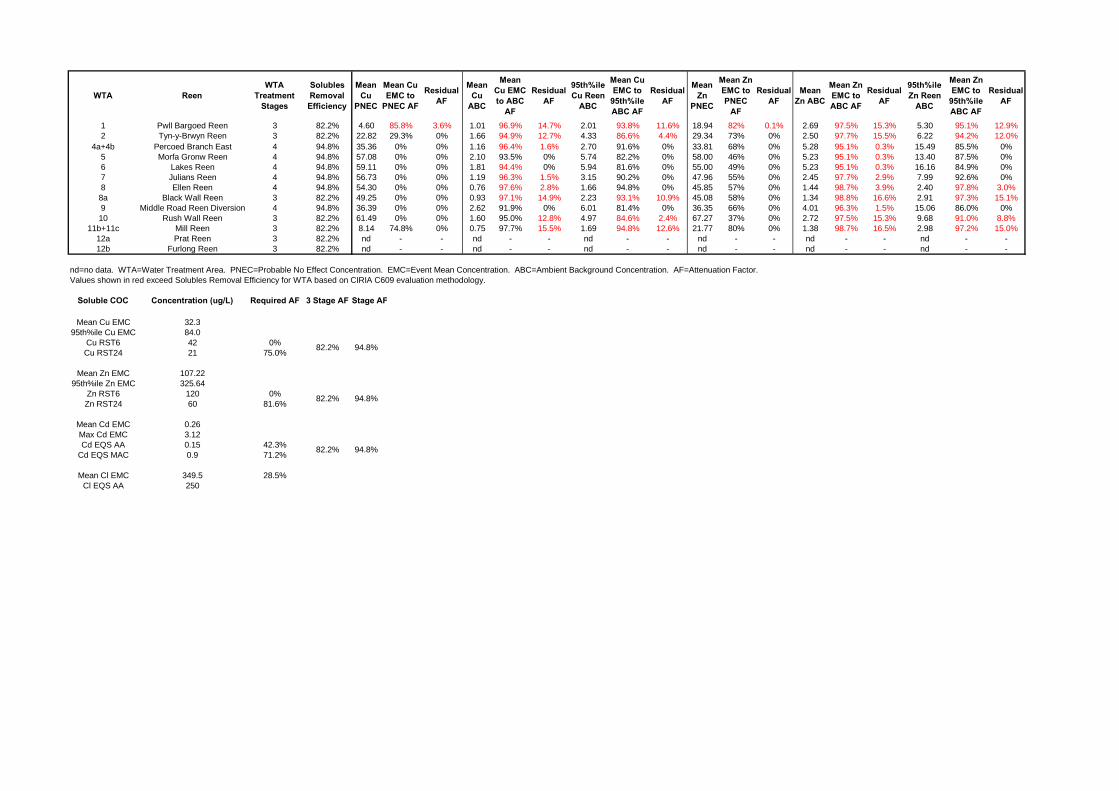
2.1.1 Annex 1 to this report presents the average Ambient Background Concentrations
recorded in each reen where WTA discharges are proposed. The table also
records the Probable No Effect Concentration (PNEC) calculated for each
location for both dissolved copper and zinc using the M-BAT tool based on
average concentrations of calcium, pH and dissolved organic carbon. Site
specific PNECs are required to determine compliance under the Water
Framework Directive. They replace Environmental Quality Standards (EQS)
concentrations based on water hardness alone.
2.1.2 HAWRAT utilises a large database of real monitored 'events' being a rainfall
driven flush of pollutants from a road surface for a number of rural sites
throughout England and Wales. Site monitoring involved continuous rainfall and
run-off flow monitoring (depth and velocity) and automatic sampling triggered by
predetermined flow thresholds in a highway drain. Event selection was based on
a minimum antecedent dry weather period (ADWP) of 24 hours. Samples were
then combined according to the flow regime at the time of each sample to
produce a flow weighted event mean concentration (EMC). All EMCs for the
principal pollutants of concern from road drainage were statistically treated to find
minimum, mean, median and maximum EMCs (Crabtree et al., 2008).
2.1.3 Below the table at Annex 1 the HAWRAT generated Event Mean Concentrations
(EMC) for copper, zinc and cadmium are shown for both the mean and maximum
values. WTA specific PNEC values for copper and zinc, which are defined as
long term average concentrations, are compared with the relevant mean EMC to
derive a 'mean EMC to PNEC' attenuation factor (AF) that is the WTA specific AF
that would need to be achieved by any treatment train to reduce the EMC to the
PNEC for both dissolved copper and zinc.
2.1.4 Comparison of the WTA specific mean EMC to PNEC AF values for both copper
and zinc show that with the exception of a minor deficiency at WTA1 of 3.6% and
0.1% for copper and zinc respectively, all discharges are attenuated to below the
PNEC. A residual value has been shown, that is the difference where positive
between the required and the available AF at each WTA as shown under
solubles removal efficiency.
2.1.5 This assessment approach is also undertaken to determine an AF for each WTA
to reduce the mean EMC to the mean ABC and the 95th%ile ABC as monitored
in each WTA specific reen. A residual value is again presented for both where
positive. These residuals are less than 15% and accordingly it is considered that,
given the solubles reduction efficiencies for the WTA used are based on a highly
conservative approach, such residuals are within the likely performance envelope
for the WTA treatment trains, particularly given the large scale and size of the
individual treatments stages described in Appendix 16.3 to the March 2016 ES,
being far larger than comparable systems in existence currently operating on the
Highways estate within the UK.
2.1.6 Furthermore, the calculations presented in Annex 1 are based on 'event'
impacted drainage entering the grass lined channels and WTA. Such events as
described previously, follow a duration of dry weather - the antecedent dry

Welsh Government M4 Corridor around Newport
December 2016 Environmental Statement Supplement
Appendix SS16.1 Revised Water Treatment Area DMRB Risk Assessment
M4CaN-DJV-EWE-ZG_GEN-AX-EN-0003 | At Issue | December 2016
Page 7
weather period (ADWP) - of at least 24 hours and are therefore representative of
'first flush' road drainage. This so called 'first flush' of the road surface whereby
maximum pollutants are associated with the washing of the highway pavement
following the build-up of pollutants during antecedent periods of dry weather,
typically occurs within the first 10 mm of a rainfall event.
2.1.7 It is the case that the majority of weather events in the UK are of short duration
and limited rain depth. It has been estimated that around 50% of rainfall events
(probably in excess of 70 events a year in most areas), are less than 5mm
(Environment Agency, 2013). HAWRAT predicts an average of 95 ADWP events
of any rain depth per year occurring in the Cardiff area, being the nearest to
Newport. The Met Office long term daily rainfall data for Usk weather station
(being the nearest to Newport) gives an average number of 135 days a year
seeing rain of which 25 to 40 days see rainfall in excess of 10 mm.
2.1.8 It can therefore be appreciated that a sizeable proportion of rainfall will fall after
the first flush has been generated, i.e. during first 10 mm of rainfall. Such non-
event rainfall, i.e. rainfall following the first 10 mm, received at the WTA via the
grass lined channels will be relatively unpolluted and dilute water stored within
the grass lined channels, pollution control and attenuation lagoons, and reed bed.
Treated water discharged by the WTA will be of a higher quality and require lower
attenuation factors than those calculated within the tables at Annex 1.
2.1.9 Finally, following NRW concerns of impact to low/no flow reens within the Gwent
Levels, particularly during summer, no account of in-channel pollutant dilution or
dispersion has been allowed for. Under winter penning, such an approach is
likely to result in an over estimate of the impact on water quality. Certainly taken
over the year as an annual average, dilution and dispersion of pollutants can be
expected to occur either as a consequence of mixing or flow resulting in reduced
impact.
2.1.10 Taking the above considerations together, there is high confidence that WTA
discharges will be able to preserve existing baseline water quality within reens
and very high confidence that water quality will remain within PNEC
concentrations, i.e. those considered to have no detectable adverse effect on
aquatic life. This is in keeping with the findings of the original HAWRAT
assessments - for which an annual Q95 low flow of 1L/s was assumed - where
the principal soluble pollutants of concern were not predicted to exceed the more
stringent RST6 or RST24 concentrations for protected sites.
2.1.11 This evidence also supports Commitment Ref. No. 4 and No. 5 concerning
meeting of WFD and SSSI requirements with respect to water quality.
2.2 Sediment Bound Pollutants
2.2.1 Following NRW's stated concerns regarding dependence on reen dilution and
HAWRAT dependence on a flow regime to predict impact polluted sediment
accumulation beyond discharge outfalls, the HAWRAT assessments were
revisited to identify how improvements could be made to deliver higher
confidence in the risk assessment predictions being attributable to the Gwent
Levels SSSI, particularly under summer penning. The following areas were
identified:

Welsh Government M4 Corridor around Newport
December 2016 Environmental Statement Supplement
Appendix SS16.1 Revised Water Treatment Area DMRB Risk Assessment
M4CaN-DJV-EWE-ZG_GEN-AX-EN-0003 | At Issue | December 2016
Page 8
Fivefold reduction in the assumed Q95 flow rate of the reen network from
0.0005 to 0.0001 m3/s. This is used by HAWRAT to determine what size of
rainfall event needs to be exceeded to prevent sediment from accumulating.
This reduction will lead to in many instances to all HAWRAT predicted rainfall
events leading to sediment deposition, i.e. no in channel dispersion is
predicted due to perennial low flow conditions being imposed.
WTA specific reen dimensions. Previously a generic reen width was used of
4.2 metres. Reen dimensions based on field measurements are now
adopted, as summarised in Table 2.1. The majority of reens are narrower
than 4.2 m, by up to 71%, leading to more onerous predicted impacts being
made by HAWRAT on sediment accumulation depths within these reens.
This leads to a more conservative assessment than that reported in
Appendix 16.3 to the Environmental Statement.
Comparison of baseline flow modelling for individual reens from the Flood
Consequence Assessment (Appendix 16.1 of the March 2016 ES) to identify
order of magnitude likely annualised flow rates within the Gwent Levels for
comparison with the Q95 flow.
Table 2.1: WTA Specific Reen Widths
WTA Receiving Reen Reen Width (m) Change from previous
assessment
1 Pwll Bargoed Reen 2.6 -38%
2 Tyn-y-Brwyn Reen 2.5 -40%
4a Percoed Branch East 1.3 -69%
4b
5 Morfa Gronw Reen 1.5 -64%
6 Lakes Reen 1.2 -71%
7 Julians Reen 2.7 -36%
8 Ellen Reen 5.9 40%
8a Black Wall Reen 2.1 -50%
9 Middle Road Reen
Diversion 4.2 0%
10 Rush Wall South Reen 1.5 -64%
11b Mill Reen 1.4 -67%
11c
WTA discharging to the same reen have been assessed as a single combined discharge.
2.2.2 The HAWRAT chronic impact assessments were rerun using the above
conservative modifications. The results are presented in HAWRAT by a
Deposition Index (DI) where a factor of 100% is taken to be the threshold of
acceptability of accumulating sediment discharged by a WTA into a reen. The
threshold equates to the predicted toxicity of an accumulation of sediment to a
depth of 10 mm over a 10 m length of riverbed.
2.2.3 In this eventuality during a ten year modelling period, HAWRAT calculates the
concentration of pollutants within this sediment for comparison with scientifically
derived Threshold Effect Levels (TEL) and Probable Effect Levels (PEL). These
are risk based thresholds following extensive field measurements within sediment
accumulating and non-accumulating watercourses receiving highways drainage
within England and Wales (Gaskell et al., 2007).

Welsh Government M4 Corridor around Newport
December 2016 Environmental Statement Supplement
Appendix SS16.1 Revised Water Treatment Area DMRB Risk Assessment
M4CaN-DJV-EWE-ZG_GEN-AX-EN-0003 | At Issue | December 2016
Page 9
2.2.4 HAWRAT also calculates a sediment reduction attenuation factor that would be
required to achieve compliance with the TEL and PEL thresholds for the
modelled discharge. These can be compared with the WTA specific cumulative
treatment efficiencies, i.e. for 3 or 4 stage treatment trains as appropriate.
2.2.5 A review was undertaken of the lowest predicted pre storm event baseline flows
in reens within the study catchment as modelled and reported within the Flood
Consequences Assessment (Appendix 16.1 to the March 2016 Environmental
Statement). The lowest baseline flow was found to be of the order 0.01 m3/s.
The Q95 low flow modelled for the purposes of determining impact from
accumulating sediment of 0.0001 m3/s is two orders of magnitude below these
modelled baseline flows. This gives confidence that the effective HAWRAT
modelled Q95 flow rate is likely to be appropriate for the purposes of the risk
assessment.
2.2.6 The results of the HARWAT assessment for chronic sediment impact are
summarised in Table 2.2. Deposition Indices and HAWRAT calculated sediment
reduction attenuation factors are presented together with the individual WTA
cumulative treatment efficiencies for comparison.
Table 2.2: WTA Specific Sediment Risk Assessment Results
WTA Receiving Reen Discharge
within 100m of SSSI?
HAWRAT Deposition
Index
HAWRAT Sediment Reduction
WTA Cumulative Treatment Efficiency
1 Pwll Bargoed Reen No 95 92% 82%
2 Tyn-y-Brwyn Reen No 99 94% 82%
4a Percoed Branch East Yes 94 96% 95%
4b
5 Morfa Gronw Reen Yes 70 94% 95%
6 Lakes Reen Yes 57 93% 95%
7 Julians Reen Yes 22 80% 82%
8 Ellen Reen Yes 22 80% 95%
8a Black Wall Reen Yes 13 36% 82%
9 Middle Road Reen Diversion Yes 54 92% 95%
10 Rush Wall South Reen Yes 58 87% 82%
11b Mill Reen No 208 97% 82%
11c
WTA discharging to the same reen have been assessed as a single combined discharge.
2.2.7 The results of the revised HAWRAT sediment bound pollutant assessment show
that, with the exception of WTA 11b/c, all discharges are not predicted to present
a risk of accumulation of sediments at levels that are considered to present a
toxicity risk to aquatic biology.
2.2.8 Given the increased levels of conservatism employed within this revised risk
assessment, it is concluded that a high level of certainty can be afforded to these
results.
2.2.9 The risk assessment for Mill Reen was reassessed in light of the exceedance of
acceptable limits presented above. Notwithstanding that discharges from WTA11
do not occur within the Gwent Levels SSSI, and that the residual treatment
efficiency of 15% could be accounted for within the likely performance envelope
for the WTA treatment trains as previously discussed, a sensitivity analysis was

Welsh Government M4 Corridor around Newport
December 2016 Environmental Statement Supplement
Appendix SS16.1 Revised Water Treatment Area DMRB Risk Assessment
M4CaN-DJV-EWE-ZG_GEN-AX-EN-0003 | At Issue | December 2016
Page 10
performed on the Q95 flow rate required to reduce the Deposition Index to below
100. This was found to equal 0.0032 m3/s.
2.2.10 Examination of the Flood Consequence Assessment baseline flow data for Mill
Reen as modelled within the Magor area (Inflow 4), a baseline flow of 0.2 m3/s is
predicted, i.e. two orders of magnitude higher than the value input to HAWRAT
as was the case for the other reens receiving proposed discharges. This is also
supported by field observations of Mill Reen where visible stream flows are
reported reflecting the elevated spring fed catchment of this watercourse north of
Magor.
2.2.11 On this basis it is judged that the discharges from WTA11b and WTA11c are not
considered to represent a risk of sediment accumulation leading to potential
impact on aquatic biology.
2.2.12 In summary, the revised sediment bound pollutant assessment has shown there
is high confidence that the proposed WTA discharges will not lead to
unacceptable sediment accumulation within reens.

Welsh Government M4 Corridor around Newport
December 2016 Environmental Statement Supplement
Appendix SS16.1 Revised Water Treatment Area DMRB Risk Assessment
M4CaN-DJV-EWE-ZG_GEN-AX-EN-0003 | At Issue | December 2016
Page 11
3 Proposed Contingency Measures
3.1.1 At the meeting held on 8th November 2016, NRW expressed a need to
understand what contingency measures could be taken in the event that water
quality of reens receiving proposed WTA discharges did not perform as
predicted.
3.1.2 A number of contingency measures have been identified to provide confidence
that the Gwent Levels SSSI will be protected as follows. A number of these
measures form current commitments as recorded in the Register of
Commitments. The relevant commitment reference number is given where
applicable.
3.2 Grass Lined Channel and WTA Maintenance
3.2.1 HA103/06 (May 2006) provides suggestions for maintenance and management of
vegetative drainage systems recognising the requirement for a more frequent
level of inspection compared to conventional drainage systems. Table 3.1
summarises the HA suggested requirements whilst acknowledging these should
not be interpreted rigidly.
Table 3.1: Inspection and Maintenance Requirements for Vegetative Systems
Grass Lined
Channel Attenuation
Lagoon Reed Bed
INSPECTIONS
Inflow/outfalls Integrity/erosion Debris/rubbish
Quarterly or after each major storm
Monthly Monthly or after each major storm
Build-up of sediment or invasive weeds
Annually Annually Annually
Vegetation cover/vigour Monthly or after each major storm
Annually Annually
Check for protected species Specialist advice to be sought
ROUTINE WORKS
Clearance of rubbish/debris Monthly or after each major storm
Quarterly Quarterly
Cutting vegetation Monthly or after each major storm
5-10 year cycle and remove
1-5 year cycle and remove
Removal of plant litter N/A N/A 5-10 year cycle if required
Removal of sediment To be determined annually
To be determined annually
To be determined annually
3.2.2 Through these inspections and maintenance, high confidence can be maintained
in the design functionality of the water treatment described systems. It is
therefore important that responsibilities and maintenance routines are clearly
identified at an early stage.
3.2.3 A Management Plan will be prepared setting out objectives and an annual
programme of intended maintenance operations. This supports Commitment No.
161 describing ongoing long term maintenance commitment transferring to Welsh
Government’s highway maintenance contractor (currently SWTRA) to be
documented within a Handover Environmental Management Plan (HEMP).

Welsh Government M4 Corridor around Newport
December 2016 Environmental Statement Supplement
Appendix SS16.1 Revised Water Treatment Area DMRB Risk Assessment
M4CaN-DJV-EWE-ZG_GEN-AX-EN-0003 | At Issue | December 2016
Page 12
3.3 Post Construction Monitoring
3.3.1 As stated in the Register of Commitments, a period of 5 years contingency
chemical water quality and biological assurance monitoring of reens receiving
WTA discharges is proposed. Upstream and downstream monitoring of reen
chemical and ecological status will be recorded to allow any measurable impact
from the proposed drainage on the SSSI features to be identified. To aid
delineation of natural variations unattributable to the new section of motorway,
monitoring sites will also be chosen as representative of reen aquatic biology not
considered to be in direct or indirect.
3.3.2 This supports Commitment No. 159 where Water quality would continue to be
monitored for 5 years of operational use of the new section of motorway to
demonstrate acceptable quality of the water treatment area discharges.
3.4 Trigger and Control Levels Reporting
3.4.1 Trigger levels are useful data management approaches to provide better
understanding of WTA performance and to draw the attention of operators and
regulators to the development of adverse, or unexpected, trends in the monitoring
data.
3.4.2 Control levels are additional specific concentrations defined as criteria below
which a WTA can be considered to be operating within expected and acceptable
pollutant reduction efficiency. Additionally, control levels can be set to allow for
variation in natural water quality from baseline conditions as well as giving
sufficient time to take corrective or remedial action before trigger levels are
breached.
3.4.3 It is therefore proposed to maintain quarterly monitoring during the 5 year
aftercare period to demonstrate compliance with the NRW trigger levels but also
to identify baseline conditions and trends so that any statistically relevant
deviations can be identified and contingencies put into practice before a trigger
level is potentially breached. Accordingly a control level will be defined for each
pollutant at the 95th %ile of the baseline data set or similar in agreement with
NRW. In this way, the range of natural variation of baseline conditions can be
accounted for.
3.4.4 A significant control level breach will be considered to have occurred following 3
consecutive exceedances of the control level or other number in agreement with
NRW. Such an approach allows for sporadic, non-repeating fluctuations to be
observed but discounted as they are not in themselves considered as significant
or warranting corrective actions to be implemented.
3.4.5 Following the identification of a significant control level breach following
consecutive exceedances of a control level, corrective action would be started.
This would be agreed with NRW within the Surface Water Management Plan but
would typically involve the communication of the event to concerned parties, the
instigation of further monitoring to verify conditions and further investigations of
the drainage catchment to identify likely causes and to propose mitigation. In the
first instance, this would likely be the inspection of grass lined channels and the
WTA for possible causes potentially leading to the removal of silts from grass
lined channels or WTA lagoons or partial regeneration of reed beds.

Welsh Government M4 Corridor around Newport
December 2016 Environmental Statement Supplement
Appendix SS16.1 Revised Water Treatment Area DMRB Risk Assessment
M4CaN-DJV-EWE-ZG_GEN-AX-EN-0003 | At Issue | December 2016
Page 13
3.4.6 It is considered that this methodology will provide the necessary understanding of
drainage treatment functionality and provide evidence to NRW of adequate levels
of WTA performance and hence protection of surface water quality, whilst
allowing for timely identification and intervention should significant deficiencies in
WTA performance occur.
3.4.7 This contingency supports Commitment Ref. No. 102 and No.103 to provide, as
part of a general environmental monitoring strategy, trigger levels for ongoing
construction and operation monitoring to be agreed and a protocol for reporting
any problems quickly.
3.5 Reen Flow and Storage Management
3.5.1 Whilst not accounted for within the risk assessments for proposed water
discharges, reen character and flow characteristics may at times be identified as
a contributing factor to the rise in concentrations of pollutants derived from
motorway run-off.
3.5.2 Although calculated as a very low risk, for contingency purposes a scenario is
identified that, following all necessary WTA and grass lined channel repair and
maintenance having being implemented, there remains strong evidence that a
WTA discharge is responsible for unacceptable water quality deterioration and
trend analysis suggests long term breach of water quality standards, i.e. breach
of NRW trigger levels. In this hypertheoretical scenario, it is proposed that the
receiving reen be investigated to identify measures in which in-reen dilution and
dispersion could be enhanced through increase in channel volume and/or
increase in average flow rates.
3.5.3 Reen channel volume flow rates could be enhanced by widening or deepening
during routine dredging. Reen flow rates could be enhanced by the managing of
local water level (penning) to promote flow in the vicinity of a WTA discharge.
Finally, WTA discharge rates could be adjusted where evidence could be
gathered to demonstrate the necessary storm water flows through the drainage
system could still be accommodated due to the over pessimistic assumptions
utilised during design.
3.6 Sediment Monitoring and Recovery
3.6.1 As a final resort where unacceptable sediment discharge and accumulation was
considered to be occurring as a consequence of WTA discharge, sampling would
be undertaken for chemical analysis. Early dredging would be considered where
concentrations found to exceed HAWRAT chronic toxicity thresholds for heavy
metals and PAH were assessed as contributing to unacceptable long term water
quality and demonstrably adverse impacts on aquatic ecology. This could be
undertaken during routine reen dredging within the Gwent Levels SSSI.

Welsh Government M4 Corridor around Newport
December 2016 Environmental Statement Supplement
Appendix SS16.1 Revised Water Treatment Area DMRB Risk Assessment
M4CaN-DJV-EWE-ZG_GEN-AX-EN-0003 | At Issue | December 2016
Page 14
4 Conclusions
4.1.1 Further information has been provided on the HAWRAT methodology to highlight
the conservatism of this approach and what further steps have been taken to
further limit the dependence on reen flow in the prediction of worst case impacts
on water quality. These are as follows
A review of regional rainfall data to show first flush events - representing the
occasion pollutant is actually mobilised from the carriageway – occurs more
infrequently than assumed for the risk assessment;
A five-fold reduction in assumed low flow conditions to 100 times smaller
than the summer baseline flows modelled within the Flood Consequences
Assessment; and
Use of actual reen widths which are up to 71% and on average 42% smaller
than the generic reen width used by the original HAWRAT assessments
based on the Drainage Strategy Report generic width of 4.2m.
4.1.2 A number of contingency measures have been identified and described to
provide further assurances that reen water quality can be managed effectively
and be further protected in the albeit ver low risk of deteriorating chemical or
ecological conditions as a consequence of treated drainage discharges. These
include
Grass lined channel and Water Treatment Area maintenance;
Post construction monitoring;
Trigger and control levels reporting;
Reen flow and storage management; and
Sediment monitoring and recovery.
4.1.3 In summary, the revised risk assessment has shown there is high confidence that
the proposed Water Treatment Area discharges will preserve reen baseline water
quality within existing baseline conditions. It is concluded that associated
potentially adverse effects on the Gwent Levels Sites of Special Scientific Interest
as a consequence of operational motorway drainage can be avoided.
Welsh Government M4 Corridor around Newport
December 2016 Environmental Statement Supplement
Appendix SS16.1 Revised Water Treatment Area DMRB Risk Assessment
M4CaN-DJV-EWE-ZG_GEN-AX-EN-0003 | At Issue | December 2016
Page 15
5 References
Environment Agency, 2003. Report SC030219. Rainfall runoff management for developments. Highways Agency, Transport Scotland, Welsh Assembly Government & The Department for Regional Development Northern Ireland (2006a) Design Manual for Roads and Bridges, Volume 4, Section 2, Part 9: Grassed surface water channels for highway runoff, (HA119/06) (May 2006). Highways Agency, Transport Scotland, Welsh Assembly Government & The Department for Regional Development Northern Ireland (2006b) Design Manual for Roads and Bridges, Volume 4 Section 2 Part 1: (HA103/06) Vegetated drainage systems for highways runoff, (HA103/06) (May 2006). Highways Agency, Transport Scotland, Welsh Assembly Government & The Department for Regional Development Northern Ireland (2009) Design Manual for Roads and Bridges, Volume 11, Section 2, Part 10: Road Drainage and the Water Environment (HD45/09)(November 2009). Highways Agency Drainage Data Management System (HADDMS) (2009) Highways Agency Water Risk Assessment Tool (HAWRAT), Technical Manual, November 2009. Available at: www.haddms.com. Highways Agency Water Risk Assessment Tool (HAWRAT). November 2009. Ellis, J.B., Shutes, R.B. and Revitt, D.M. (2003). Guidance manual for constructed wetlands. R&D Technical Report P2-159/TR2. Environment Agency, 2003. Sustainable Drainage Systems. Hydraulic, structural and water quality advice. CIRIA Report C609 (2004). Met Office, 2016. UK climate, Days of rain >= 10.0 mm - Annual average: 1981-2010. http://www.metoffice.gov.uk/public/weather/climate/#?tab=climateMaps. Met Office, 2016. Usk climate period: 1981-2010. Days of rainfall >= 1 mm. http://www.metoffice.gov.uk/public/weather/climate/gcjyjuwdv.

Welsh Government M4 Corridor around Newport
December 2016 Environmental Statement Supplement
Appendix SS16.1 Revised Water Treatment Area DMRB Risk Assessment
M4CaN-DJV-EWE-ZG_GEN-AX-EN-0003 | At Issue | December 2016
Page 16
Annex 1 HAWRAT Results
WTA ReenWTA
Treatment Stages
Solubles Removal Efficiency
Mean Cu
PNEC
Mean Cu EMC to
PNEC AF
Residual AF
Mean Cu
ABC
Mean Cu EMC to ABC
AF
Residual AF
95th%ile Cu Reen
ABC
Mean Cu EMC to
95th%ile ABC AF
Residual AF
Mean Zn
PNEC
Mean Zn EMC to PNEC
AF
Residual AF
Mean Zn ABC
Mean Zn EMC to ABC AF
Residual AF
95th%ile Zn Reen
ABC
Mean Zn EMC to
95th%ile ABC AF
Residual AF
1 Pwll Bargoed Reen 3 82.2% 4.60 85.8% 3.6% 1.01 96.9% 14.7% 2.01 93.8% 11.6% 18.94 82% 0.1% 2.69 97.5% 15.3% 5.30 95.1% 12.9%2 Tyn-y-Brwyn Reen 3 82.2% 22.82 29.3% 0% 1.66 94.9% 12.7% 4.33 86.6% 4.4% 29.34 73% 0% 2.50 97.7% 15.5% 6.22 94.2% 12.0%
4a+4b Percoed Branch East 4 94.8% 35.36 0% 0% 1.16 96.4% 1.6% 2.70 91.6% 0% 33.81 68% 0% 5.28 95.1% 0.3% 15.49 85.5% 0%5 Morfa Gronw Reen 4 94.8% 57.08 0% 0% 2.10 93.5% 0% 5.74 82.2% 0% 58.00 46% 0% 5.23 95.1% 0.3% 13.40 87.5% 0%6 Lakes Reen 4 94.8% 59.11 0% 0% 1.81 94.4% 0% 5.94 81.6% 0% 55.00 49% 0% 5.23 95.1% 0.3% 16.16 84.9% 0%7 Julians Reen 4 94.8% 56.73 0% 0% 1.19 96.3% 1.5% 3.15 90.2% 0% 47.96 55% 0% 2.45 97.7% 2.9% 7.99 92.6% 0%8 Ellen Reen 4 94.8% 54.30 0% 0% 0.76 97.6% 2.8% 1.66 94.8% 0% 45.85 57% 0% 1.44 98.7% 3.9% 2.40 97.8% 3.0%8a Black Wall Reen 3 82.2% 49.25 0% 0% 0.93 97.1% 14.9% 2.23 93.1% 10.9% 45.08 58% 0% 1.34 98.8% 16.6% 2.91 97.3% 15.1%9 Middle Road Reen Diversion 4 94.8% 36.39 0% 0% 2.62 91.9% 0% 6.01 81.4% 0% 36.35 66% 0% 4.01 96.3% 1.5% 15.06 86.0% 0%10 Rush Wall Reen 3 82.2% 61.49 0% 0% 1.60 95.0% 12.8% 4.97 84.6% 2.4% 67.27 37% 0% 2.72 97.5% 15.3% 9.68 91.0% 8.8%
11b+11c Mill Reen 3 82.2% 8.14 74.8% 0% 0.75 97.7% 15.5% 1.69 94.8% 12.6% 21.77 80% 0% 1.38 98.7% 16.5% 2.98 97.2% 15.0%12a Prat Reen 3 82.2% nd - - nd - - nd - - nd - - nd - - nd - -12b Furlong Reen 3 82.2% nd - - nd - - nd - - nd - - nd - - nd - -
nd=no data. WTA=Water Treatment Area. PNEC=Probable No Effect Concentration. EMC=Event Mean Concentration. ABC=Ambient Background Concentration. AF=Attenuation Factor. Values shown in red exceed Solubles Removal Efficiency for WTA based on CIRIA C609 evaluation methodology.
Soluble COC Concentration (ug/L) Required AF 3 Stage AF4 Stage AF
Mean Cu EMC 32.395th%ile Cu EMC 84.0
Cu RST6 42 0%Cu RST24 21 75.0%
Mean Zn EMC 107.2295th%ile Zn EMC 325.64
Zn RST6 120 0%Zn RST24 60 81.6%
Mean Cd EMC 0.26Max Cd EMC 3.12Cd EQS AA 0.15 42.3%
Cd EQS MAC 0.9 71.2%
Mean Cl EMC 349.5 28.5%Cl EQS AA 250
82.2% 94.8%
82.2% 94.8%
82.2% 94.8%

Welsh Government M4 Corridor around Newport
December 2016 Environmental Statement Supplement
Appendix SS16.1 Revised Water Treatment Area DMRB Risk Assessment
M4CaN-DJV-EWE-ZG_GEN-AX-EN-0003 | At Issue | December 2016
Page 17
Annex 2: Drainage and WTA Design Information

M4CaN Annex 2- Drainage and WTA design information December 2016
Water Treatment Area No.
Drained Chainage Start (m)
Drained Chainage End (m)
Total Drained Chainage (m) Receiving Watercourse Reen Width
(m)
Estimated Highway Run-off Storage
(m3)
Contributing Impermeable
Area (Ha)
Discharge Rate (l/s)
Treatment Train
Stages
Treatment Train
Efficiency (%)
HAWRAT Required Sediment
Reduction (%)
HAWRAT DI
1 1350 2850 1500 Pwll Bargoed Reen 2.6 9,000 9.3 32.6 3 82.2 92 952 2850 4300 1450 Tyn-y-Brwyn Reen 2.5 10,500 11.5 40.3 3 82.2 94 994a 4,200 4.3 15.1 4 91.44b 4,200 4.2 14.7 4 91.45 6550 10150 3600 Morfa Gronw Reen 1.5 7,000 7.3 25.6 4 91.4 94 706 10150 12400 2250 Lakes Reen 1.2 4,000 4.8 16.8 4 91.4 93 577 12400 13350 950 Julians Reen 2.7 3,600 4.1 14.4 4 91.4 80 228 13350 15500 2150 Ellen Reen 5.9 8,400 9.0 31.5 4 91.4 80 228a - Black Wall Reen 2.1 3,500 1.0 3.5 3 82.2 36 139 15500 19100 3600 Middle Road Reen Diversion 4.2 13,000 15.8 55.3 4 91.4 92 5410 19100 20500 1400 Rush Wall South Reen 1.5 2,700 3.3 11.6 3 82.2 87 5811b 20500 21300 800 Mill Reen 1.4 7,950 6.0 17.7 3 82.211c 21300 22050 750 Mill Reen 1.4 5,100 5.0 17.5 3 82.212a 22050 23950 1900 Prat Reen North dry 18,000 14.4 50.4 3 82.2 nd nd12b - Furlong Reen dry 675 0.73 2.6 3 82.2 nd nd
TOTALS 101,825 100.7
Water Treatment Area No.
Drained Chainage Start (m)
Drained Chainage End (m)
Total Drained Chainage (m) Located In SSSI?
SSSI Chainage Start (m)
SSSI Chainage End (m)
SSSI Total Chainage (m)
Grass Lined Channels ?
Grass Lined Channel
Chainage Start (m)
Grass lined channel
Chainage End (m)
Grass Llined Channel Total
Length (m)
%SSSI with Grass Lined
Channels
1 1350 2850 1500 No - - 0 No 1,350 2,800 1,450 -2 2850 4300 1450 No - - 0 No 2,800 4,300 1,500 -4a Yes4b Yes5 6550 10150 3600 Yes 6,550 8,450 1,900 Yes 6,750 8,150 1,400 74%6 10150 12400 2250 No - - 0 E/B only 11,400 12,400 1,000 -7 12400 13350 950 Yes 13,000 13,350 350 Yes 12,650 13,350 700 100%8 13350 15500 2150 Yes 13,350 14,900 1,550 Yes 13,350 15,500 2,150 100%8a - No - - 0 No - - 0 -9 15500 19100 3600 Yes 16,550 19,100 2,550 Yes 15,500 19,100 3,600 100%10 19100 20500 1400 Yes 19,100 20,050 950 Limited 19,100 19,150 50 5%11b 20500 21300 800 No - - 0 No - - 0 -11c 21300 22050 750 No - - 0 No - - 0 -12a 22050 23950 1900 No - - 0 No - - 0 -12b - No - - 0 No - - 0 -
TOTALS 8,850 13,950 80%
Glan Llyn junction
M48 junction
M48 junction
2250 1.3
4300 6550 2250 100%
4300 6550
Glan Llyn junction
20897
Percoed Branch East
2,100
9496
4,300 6,400Yes5,000 6,550 1,550

M4CaN Annex 2- Drainage and WTA design information December 2016
Water Treatment Area No.
Drained Chainage Start (m)
Drained Chainage End (m)
Total Drained
Chainage (m)
Water Treatment Area No.
Drained Chainage Start (m)
Drained Chainage End (m)
Total Drained
Chainage (m)
Atenuation Lagoon
volume (m3)
HRT Volume
(m3)
HRT Area (m2)
Proposed Reed Bed Area (m2)
Proposed Area / HRT
Area
1 1350 2850 1500 1 1350 2850 1500 6,680 39 65 7,100 109.1%2 2850 4300 1450 2 2850 4300 1450 11,180 48 81 7,210 89.6%4a 4a 8,068 18 30 3,890 129.2%4b 4b 6,509 18 29 3,750 127.6%5 6550 10150 3600 5 6550 10150 3600 23,079 31 51 6,329 123.9%6 10150 12400 2250 6 10150 12400 2250 6,465 20 34 3,336 99.3%7 12400 13350 950 7 12400 13350 950 3,725 17 29 2,859 99.6%8 13350 15500 2150 8 13350 15500 2150 8,261 38 63 6,379 101.3%8a - 8a - 3,590 4 7 3,373 481.9%9 15500 19100 3600 9 15500 19100 3600 27,255 66 111 10,299 93.1%10 19100 20500 1400 10 19100 20500 1400 20,439 14 23 8,062 349.0%11b 20500 21300 800 11b 20500 21300 800 7,802 21 35 2,770 78.2%11c 21300 22050 750 11c 21300 22050 750 2,255 21 35 3,200 91.4%12a 22050 23950 1900 12a 22050 23950 1900 20,775 60 101 11,595 115.0%12b - 12b - 354 3 5 450 88.1%
TOTALS TOTALS 156,437 699 80,602 115.4%
Input Parameter Value Units NotesGreenfield Run-off Rate 3.5 L/s/Ha NRW design parameterWetland depth 0.6 m Drainage design parameterSubstrate porosity 37.5 % Reed bed design parameterHydraulic Rentention Time 12.5 hours 10-15 hrs recommended - mid value used
Calculated Parameter Value Units Optimal RangeSSF Void Volume / Drained Area 158 m3/Ha Min. 100 m3 for 10 mm first flush recommended by EAAverage Reed Bed Area / Drained Area 800 m2/Ha not prescribedHydraulic Loading Rate (HLR) 43.20 (m3/m2/d) Recommended <1.0. Optimum = 0.2. Acceptable HLR
6550 2250
Glan Llyn junction
M48 junction
43004300 6550 2250
Glan Llyn junction
M48 junction
Reed bed Sizing formula variables