Embed Size (px)
Citation preview
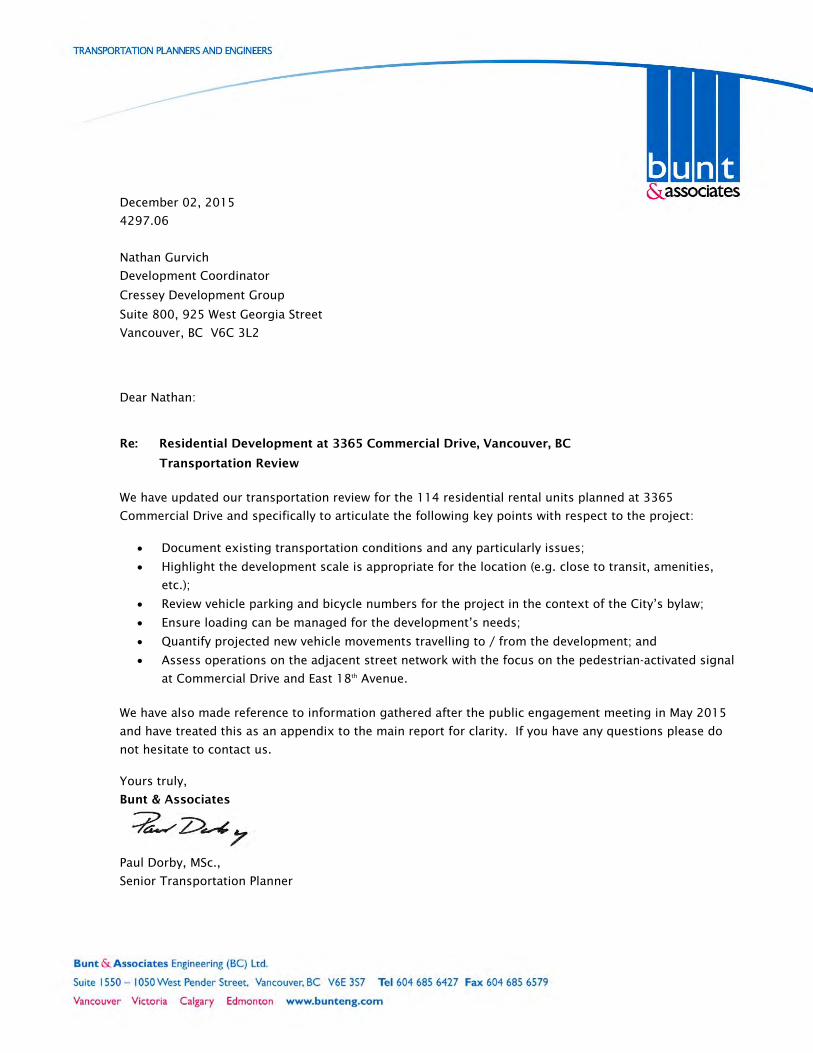
December 02, 2015
4297.06
Nathan Gurvich
Development Coordinator
Cressey Development Group
Suite 800, 925 West Georgia Street
Vancouver, BC V6C 3L2
Dear Nathan:
Re: Residential Development at 3365 Commercial Drive, Vancouver, BC
Transportation Review
We have updated our transportation review for the 114 residential rental units planned at 3365
Commercial Drive and specifically to articulate the following key points with respect to the project:
Document existing transportation conditions and any particularly issues;
Highlight the development scale is appropriate for the location (e.g. close to transit, amenities,
etc.);
Review vehicle parking and bicycle numbers for the project in the context of the City’s bylaw;
Ensure loading can be managed for the development’s needs;
Quantify projected new vehicle movements travelling to / from the development; and
Assess operations on the adjacent street network with the focus on the pedestrian-activated signal
at Commercial Drive and East 18th Avenue.
We have also made reference to information gathered after the public engagement meeting in May 2015
and have treated this as an appendix to the main report for clarity. If you have any questions please do
not hesitate to contact us.
Yours truly,
Bunt & Associates
Paul Dorby, MSc.,
Senior Transportation Planner
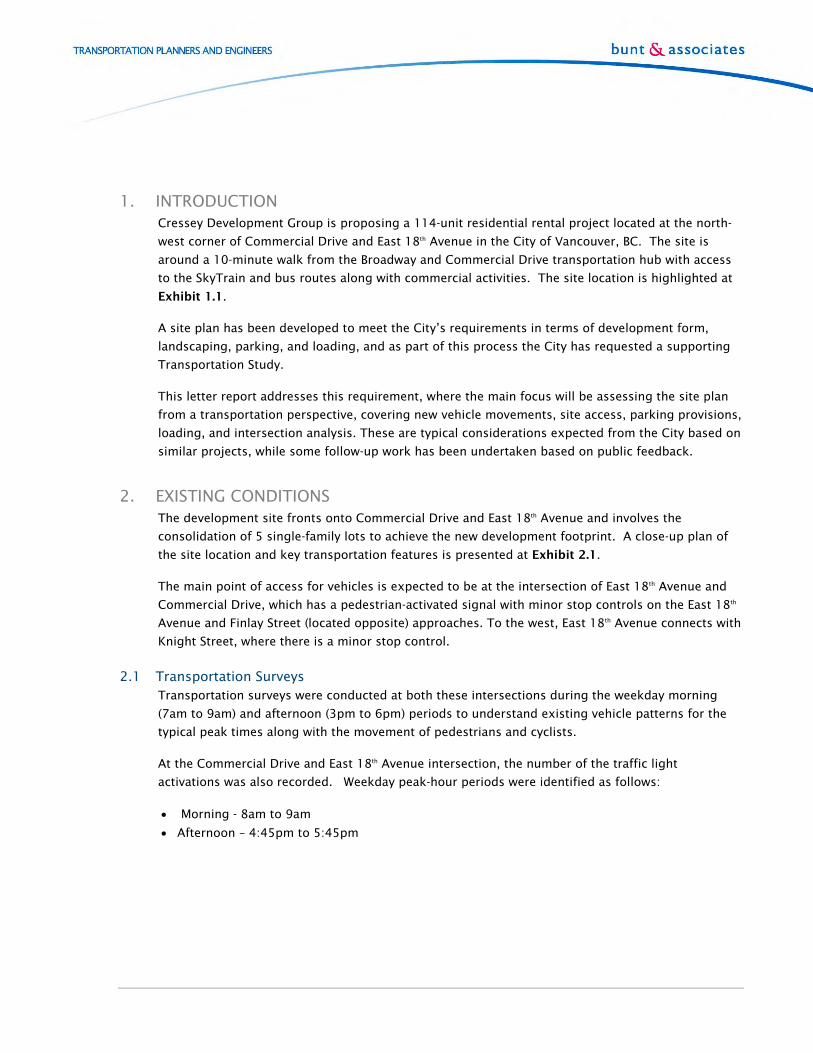
1. INTRODUCTION Cressey Development Group is proposing a 114-unit residential rental project located at the north-
west corner of Commercial Drive and East 18th Avenue in the City of Vancouver, BC. The site is
around a 10-minute walk from the Broadway and Commercial Drive transportation hub with access
to the SkyTrain and bus routes along with commercial activities. The site location is highlighted at
Exhibit 1.1.
A site plan has been developed to meet the City’s requirements in terms of development form,
landscaping, parking, and loading, and as part of this process the City has requested a supporting
Transportation Study.
This letter report addresses this requirement, where the main focus will be assessing the site plan
from a transportation perspective, covering new vehicle movements, site access, parking provisions,
loading, and intersection analysis. These are typical considerations expected from the City based on
similar projects, while some follow-up work has been undertaken based on public feedback.
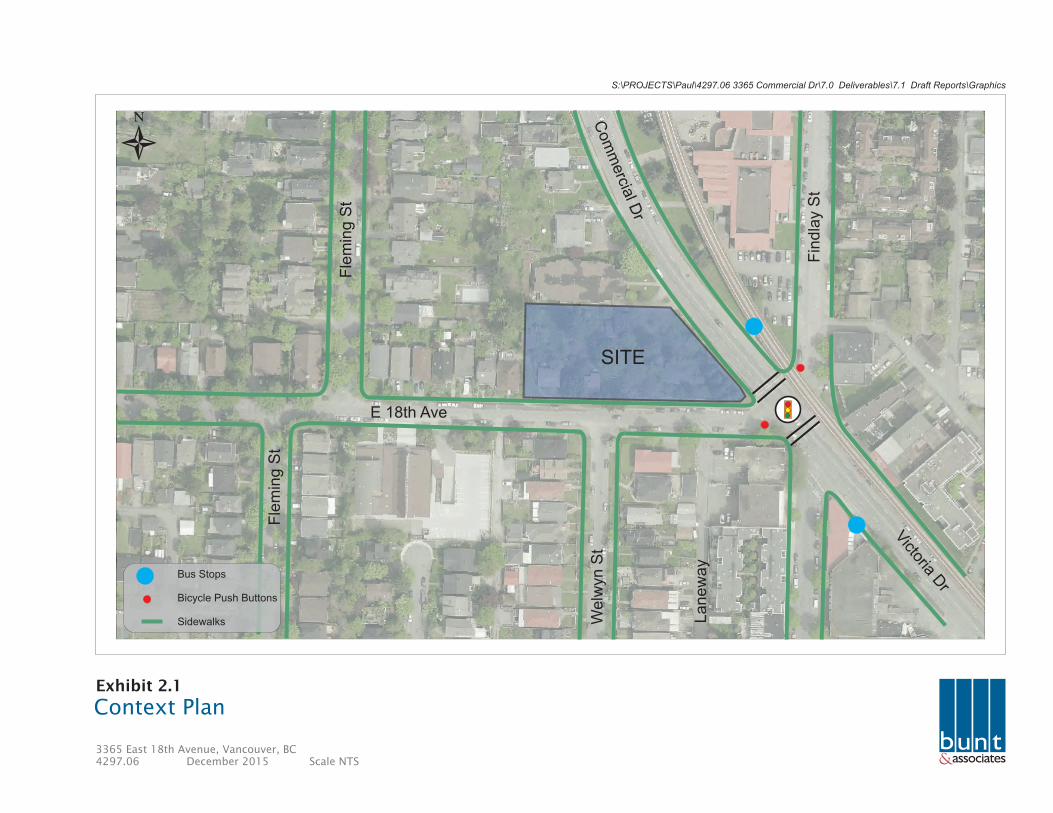
2. EXISTING CONDITIONS The development site fronts onto Commercial Drive and East 18th Avenue and involves the
consolidation of 5 single-family lots to achieve the new development footprint. A close-up plan of
the site location and key transportation features is presented at Exhibit 2.1.
The main point of access for vehicles is expected to be at the intersection of East 18th Avenue and
Commercial Drive, which has a pedestrian-activated signal with minor stop controls on the East 18th
Avenue and Finlay Street (located opposite) approaches. To the west, East 18th Avenue connects with
Knight Street, where there is a minor stop control.
2.1 Transportation Surveys Transportation surveys were conducted at both these intersections during the weekday morning
(7am to 9am) and afternoon (3pm to 6pm) periods to understand existing vehicle patterns for the
typical peak times along with the movement of pedestrians and cyclists.
At the Commercial Drive and East 18th Avenue intersection, the number of the traffic light
activations was also recorded. Weekday peak-hour periods were identified as follows:
Morning - 8am to 9am
Afternoon – 4:45pm to 5:45pm
&
S:\PROJECTS\Paul\4297.06 3365 Commercial Dr\7.0 Deliverables\7.1 Draft Reports\Graphics
3365 East 18th Avenue Vancouver, BC4297.06 December 2015 Scale NTS
Site LocationExhibit 1.1
SITEE 18th Ave
Com
merc
ial D
r
Knig
ht S
t
N
Victoria D
r
Trout Lake
E Broadway
E 12th Ave
Central Valley Greenway
Kingsway
&
S:\PROJECTS\Paul\4297.06 3365 Commercial Dr\7.0 Deliverables\7.1 Draft Reports\Graphics
3365 East 18th Avenue, Vancouver, BC4297.06 December 2015 Scale NTS
Context PlanExhibit 2.1
SITE
Com
mercia
l Dr
Victoria Dr
E 18th Ave
Fle
min
g S
t
Fle
min
g S
t
Lanew
ay
Welw
yn S
t
Fin
dla
y S
t
N
Bus Stops
Bicycle Push Buttons
Sidewalks
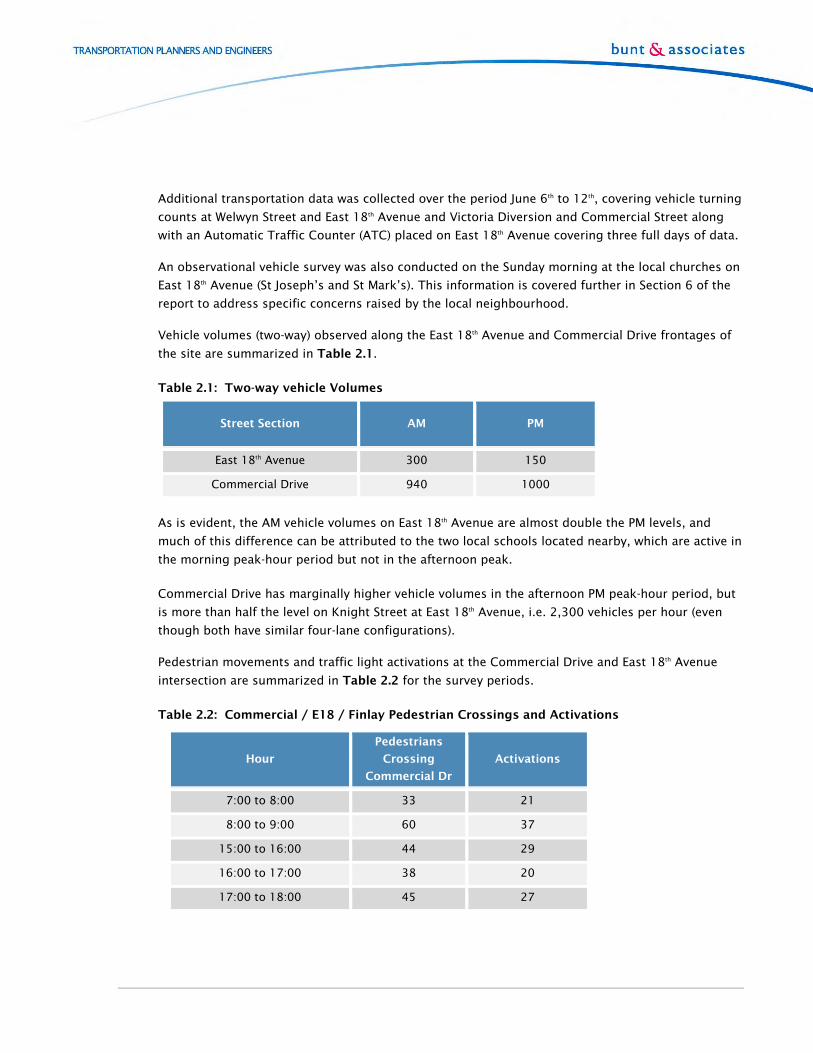
Additional transportation data was collected over the period June 6th to 12th, covering vehicle turning
counts at Welwyn Street and East 18th Avenue and Victoria Diversion and Commercial Street along
with an Automatic Traffic Counter (ATC) placed on East 18th Avenue covering three full days of data.
An observational vehicle survey was also conducted on the Sunday morning at the local churches on
East 18th Avenue (St Joseph’s and St Mark’s). This information is covered further in Section 6 of the
report to address specific concerns raised by the local neighbourhood.
Vehicle volumes (two-way) observed along the East 18th Avenue and Commercial Drive frontages of
the site are summarized in Table 2.1.
Table 2.1: Two-way vehicle Volumes
Street Section AM PM
East 18th Avenue 300 150
Commercial Drive 940 1000
As is evident, the AM vehicle volumes on East 18th Avenue are almost double the PM levels, and
much of this difference can be attributed to the two local schools located nearby, which are active in
the morning peak-hour period but not in the afternoon peak.
Commercial Drive has marginally higher vehicle volumes in the afternoon PM peak-hour period, but
is more than half the level on Knight Street at East 18th Avenue, i.e. 2,300 vehicles per hour (even
though both have similar four-lane configurations).
Pedestrian movements and traffic light activations at the Commercial Drive and East 18th Avenue
intersection are summarized in Table 2.2 for the survey periods.
Table 2.2: Commercial / E18 / Finlay Pedestrian Crossings and Activations
Hour
Pedestrians
Crossing
Commercial Dr
Activations
7:00 to 8:00 33 21
8:00 to 9:00 60 37
15:00 to 16:00 44 29
16:00 to 17:00 38 20
17:00 to 18:00 45 27
Activations are reasonably frequent during the hours surveyed, ranging from 1 call per 3-minutes to
1 call per 2-minutes with the 8:00 to 9:00 period the highest. This information will be used in the
operational assessment in Section 6.
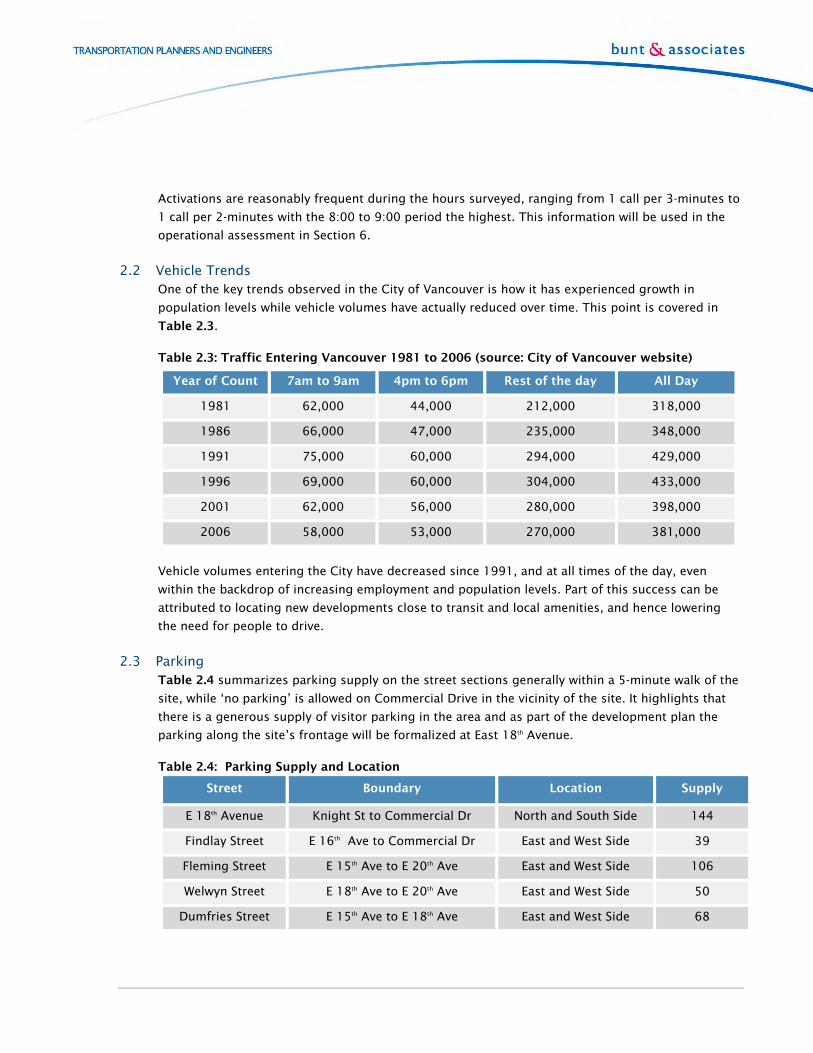
2.2 Vehicle Trends One of the key trends observed in the City of Vancouver is how it has experienced growth in
population levels while vehicle volumes have actually reduced over time. This point is covered in
Table 2.3.
Table 2.3: Traffic Entering Vancouver 1981 to 2006 (source: City of Vancouver website)
Year of Count 7am to 9am 4pm to 6pm Rest of the day All Day
1981 62,000 44,000 212,000 318,000
1986 66,000 47,000 235,000 348,000
1991 75,000 60,000 294,000 429,000
1996 69,000 60,000 304,000 433,000
2001 62,000 56,000 280,000 398,000
2006 58,000 53,000 270,000 381,000
Vehicle volumes entering the City have decreased since 1991, and at all times of the day, even
within the backdrop of increasing employment and population levels. Part of this success can be
attributed to locating new developments close to transit and local amenities, and hence lowering
the need for people to drive.
2.3 Parking Table 2.4 summarizes parking supply on the street sections generally within a 5-minute walk of the
site, while ‘no parking’ is allowed on Commercial Drive in the vicinity of the site. It highlights that
there is a generous supply of visitor parking in the area and as part of the development plan the
parking along the site’s frontage will be formalized at East 18th Avenue.
Table 2.4: Parking Supply and Location
Street Boundary Location Supply
E 18th Avenue Knight St to Commercial Dr North and South Side 144
Findlay Street E 16th Ave to Commercial Dr East and West Side 39
Fleming Street E 15th Ave to E 20th Ave East and West Side 106
Welwyn Street E 18th Ave to E 20th Ave East and West Side 50
Dumfries Street E 15th Ave to E 18th Ave East and West Side 68
3. ACTIVE MODES AND TRANSIT This section reviews the site’s accessibility for pedestrians, cyclists, and transit as this will be an
important influence on the development’s future vehicle and parking projections. It will also
confirm the site’s suitability for the development form planned.
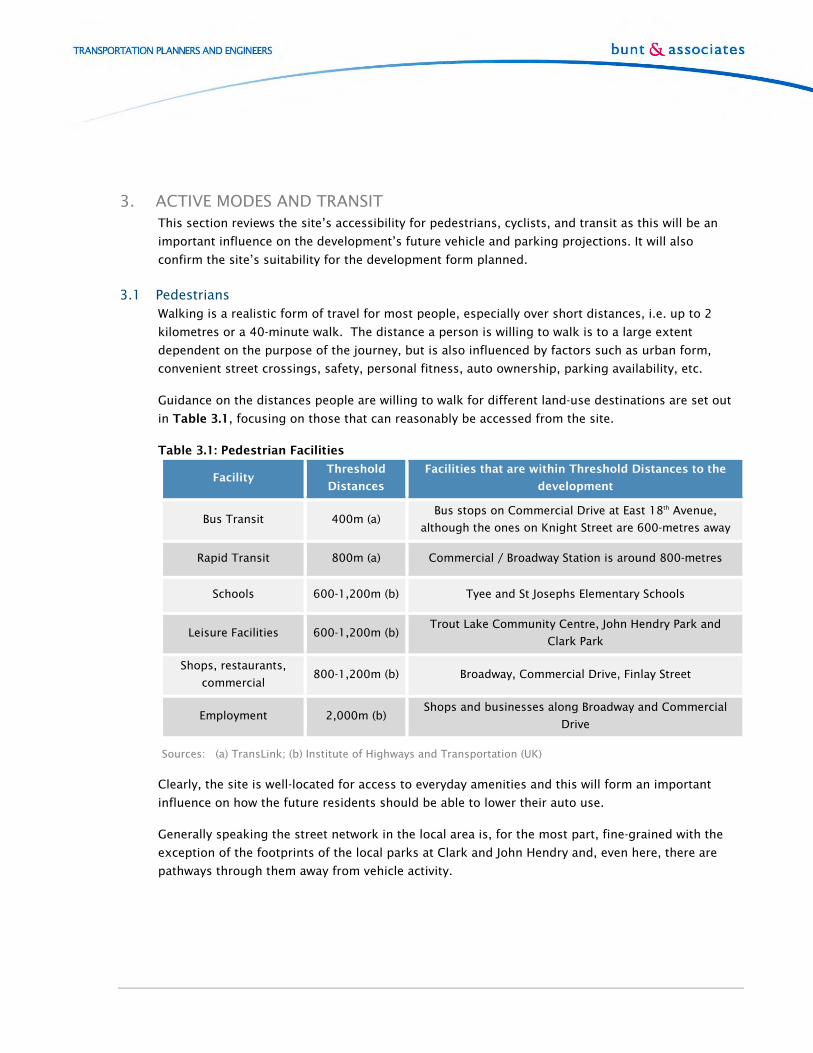
3.1 Pedestrians Walking is a realistic form of travel for most people, especially over short distances, i.e. up to 2
kilometres or a 40-minute walk. The distance a person is willing to walk is to a large extent
dependent on the purpose of the journey, but is also influenced by factors such as urban form,
convenient street crossings, safety, personal fitness, auto ownership, parking availability, etc.
Guidance on the distances people are willing to walk for different land-use destinations are set out
in Table 3.1, focusing on those that can reasonably be accessed from the site.
Table 3.1: Pedestrian Facilities
Facility Threshold
Distances
Facilities that are within Threshold Distances to the
development
Bus Transit 400m (a) Bus stops on Commercial Drive at East 18th Avenue,
although the ones on Knight Street are 600-metres away
Rapid Transit 800m (a) Commercial / Broadway Station is around 800-metres
Schools 600-1,200m (b) Tyee and St Josephs Elementary Schools
Leisure Facilities 600-1,200m (b) Trout Lake Community Centre, John Hendry Park and
Clark Park
Shops, restaurants,
commercial 800-1,200m (b) Broadway, Commercial Drive, Finlay Street
Employment 2,000m (b) Shops and businesses along Broadway and Commercial
Drive
Sources: (a) TransLink; (b) Institute of Highways and Transportation (UK)
Clearly, the site is well-located for access to everyday amenities and this will form an important
influence on how the future residents should be able to lower their auto use.
Generally speaking the street network in the local area is, for the most part, fine-grained with the
exception of the footprints of the local parks at Clark and John Hendry and, even here, there are
pathways through them away from vehicle activity.
The strongest pedestrian desire line to local amenities and transit is expected to be northwards
along Commercial Drive to Broadway, while the local commercial on Finlay Street and Commercial
Drive (south of East 18th Avenue) will be important for day-to-day needs.
Sidewalks are present surrounding the site, as indicated at Exhibit 2.1, and extend along East 18th
Avenue, Fleming Street, Finlay Street, Welwyn Street, and Commercial Drive. Along the frontages of
the site the sidewalks will be upgraded along with the landscaping as part of the development plan
while the corner at Commercial Drive and East 18th Avenue will be given specific treatment.
Commercial Drive at East 18th Avenue has a pedestrian / cycle activated traffic signal. Pedestrian
volumes at East 18th Avenue is around 20 to 30 people crossing on the north-leg of the intersection
(adjacent to the site) during the peak-hour periods, and the storage for people waiting will be an
important design consideration.
Another pedestrian controlled crossing is located to the north at East 14th Avenue while full traffic
signals can be found at East 12th Avenue (Grandview) and Broadway.
Knight Street has pedestrian activated facilities at East 19th Avenue (for the school and bus stops)
and East 14th Avenue (accommodating the bicycle route). East 18th Avenue at Knight Street is not
considered to be on any particular desire line for cyclists or pedestrians.
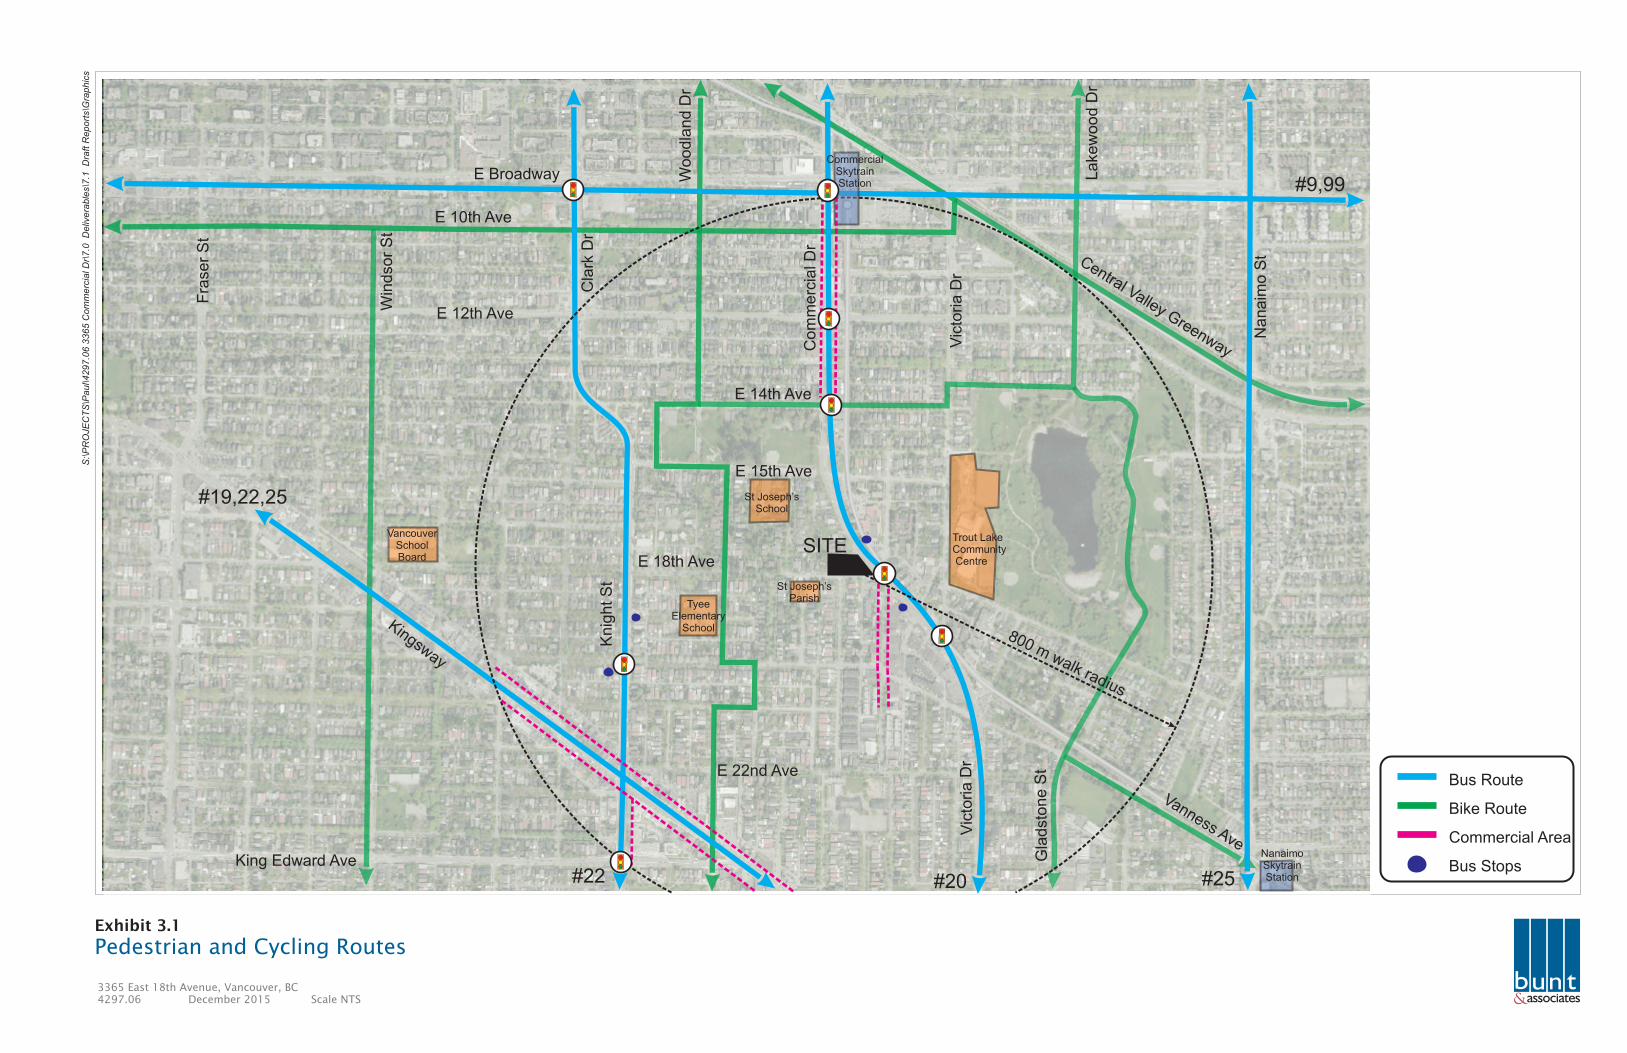
3.2 Cyclists The site is also well-located for cycling in Vancouver and the distance to the downtown is around 6-
kilometres. Bike routes in the vicinity of the site are highlighted at Exhibit 3.1 along with transit
connections and key local amenities.
To the west side of the site is the Dumfries / Woodlands bicycle route, running in a north-south
direction parallel to Commercial Drive and Knight Street. It connects with the east-west routes at
East 14th Avenue and East 10th Avenue to the north, and East 37th Avenue to the south.
To the east of Commercial Drive is John Hendry Park, where the Vanness and Gladstone routes are
located and these can be accessed via Victoria Drive and East 19th Street.
Cycling-activated push buttons are provided at the East 18th Avenue and Commercial Drive traffic
light.
Bicycle volumes on the section of East 18th Avenue fronting the site are typically around 10
movements per hour during the peak-hour periods
&
Pedestrian and Cycling RoutesExhibit 3.1
160(260)263(260)260(260)
260(260)260(260)260(260)
26
0(2
60
)2
60
(26
0)
26
0(2
60
)
26
0(2
60
)2
60
(26
0)
Bus Route
Bike Route
Commercial Area
Bus Stops
S:\
PR
OJE
CT
S\P
aul\4
29
7.0
6 3
36
5 C
om
me
rcia
l Dr\
7.0
D
eliv
era
ble
s\7
.1 D
raft R
ep
ort
s\G
rap
hic
s
3365 East 18th Avenue, Vancouver, BC4297.06 December 2015 Scale NTS
E Broadway
E 12th Ave
E 15th Ave
Kingsway
E 18th Ave
Com
merc
ial D
r
Vic
toria D
rV
icto
ria D
r
Knig
ht S
tC
lark
Dr
Fra
ser
St
Win
dso
r S
t
Woodla
nd D
r
E 14th Ave
Nanaim
o S
t
King Edward Ave
E 22nd Ave
E 10th Ave
Lake
wood D
r
Central Valley Greenway
Gla
dst
one S
t
Vanness Ave
#20#22
#9,99
800 m walk radius
Trout Lake Community Centre
St Joseph’sParish
St Joseph’sSchool
Tyee Elementary
School
VancouverSchoolBoard
CommercialSkytrainStation
NanaimoSkytrainStation
#19,22,25
SITE
#25
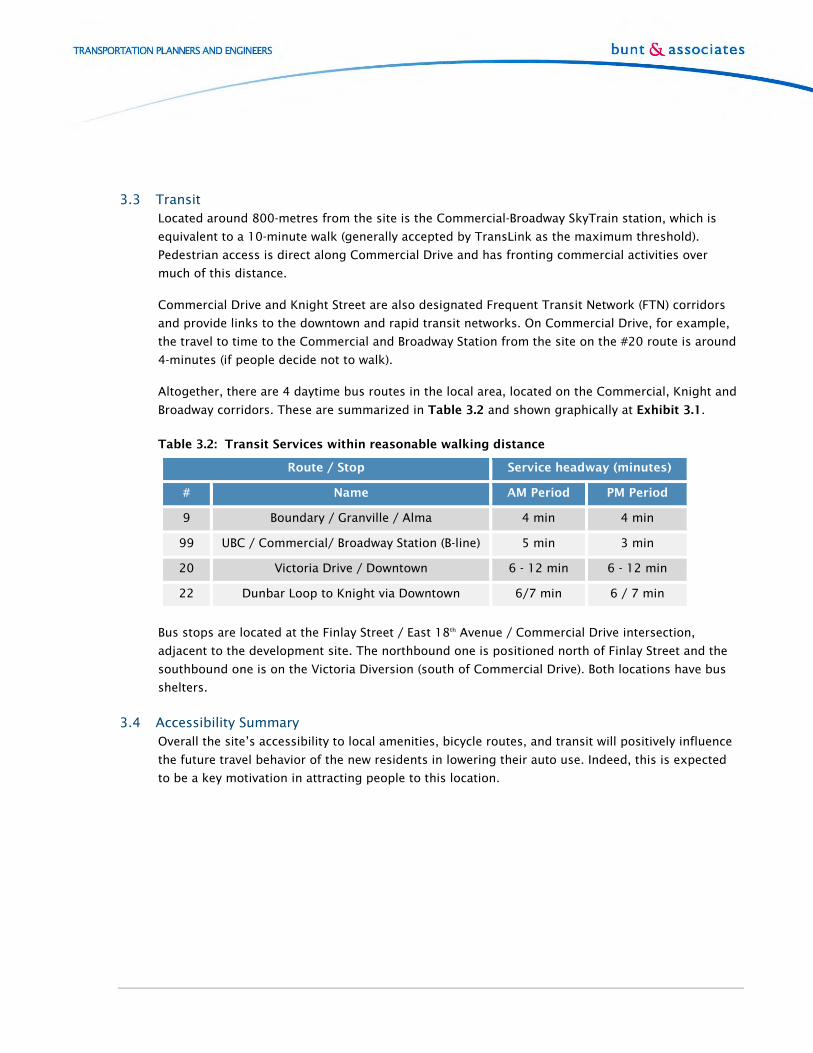
3.3 Transit Located around 800-metres from the site is the Commercial-Broadway SkyTrain station, which is
equivalent to a 10-minute walk (generally accepted by TransLink as the maximum threshold).
Pedestrian access is direct along Commercial Drive and has fronting commercial activities over
much of this distance.
Commercial Drive and Knight Street are also designated Frequent Transit Network (FTN) corridors
and provide links to the downtown and rapid transit networks. On Commercial Drive, for example,
the travel to time to the Commercial and Broadway Station from the site on the #20 route is around
4-minutes (if people decide not to walk).
Altogether, there are 4 daytime bus routes in the local area, located on the Commercial, Knight and
Broadway corridors. These are summarized in Table 3.2 and shown graphically at Exhibit 3.1.
Table 3.2: Transit Services within reasonable walking distance
Route / Stop Service headway (minutes)
# Name AM Period PM Period
9 Boundary / Granville / Alma 4 min 4 min
99 UBC / Commercial/ Broadway Station (B-line) 5 min 3 min
20 Victoria Drive / Downtown 6 - 12 min 6 - 12 min
22 Dunbar Loop to Knight via Downtown 6/7 min 6 / 7 min
Bus stops are located at the Finlay Street / East 18th Avenue / Commercial Drive intersection,
adjacent to the development site. The northbound one is positioned north of Finlay Street and the
southbound one is on the Victoria Diversion (south of Commercial Drive). Both locations have bus
shelters.
3.4 Accessibility Summary Overall the site’s accessibility to local amenities, bicycle routes, and transit will positively influence
the future travel behavior of the new residents in lowering their auto use. Indeed, this is expected
to be a key motivation in attracting people to this location.
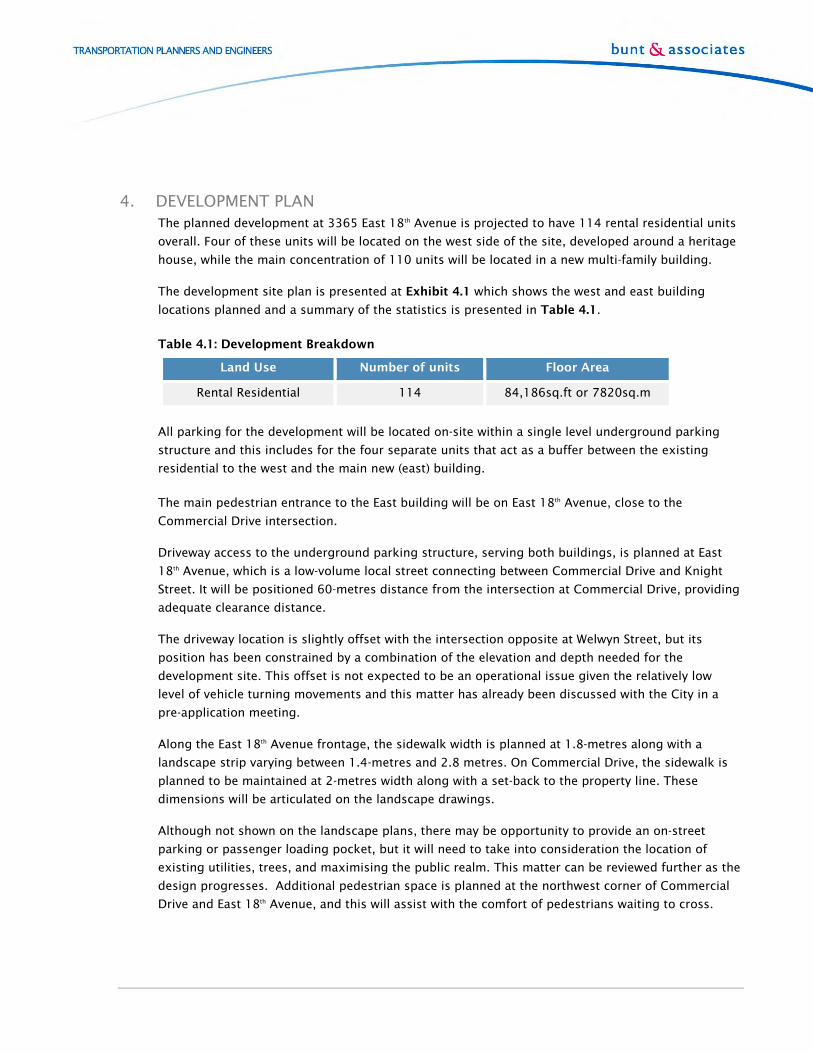
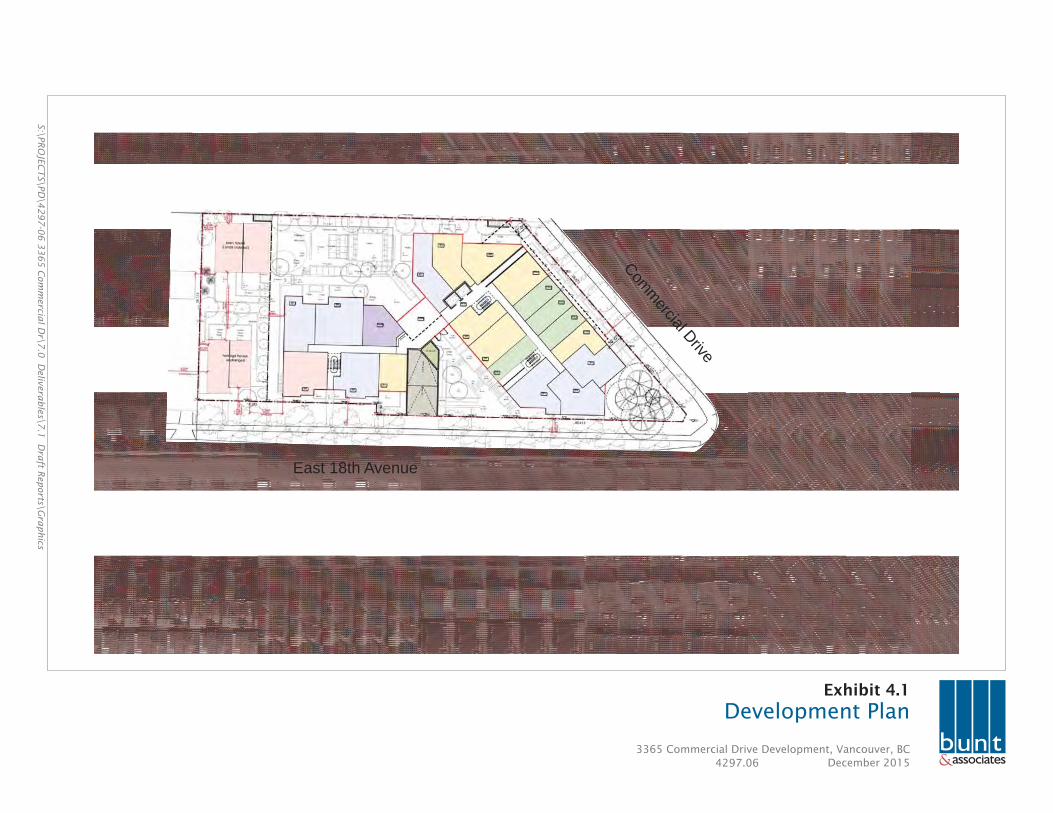
4. DEVELOPMENT PLAN The planned development at 3365 East 18th Avenue is projected to have 114 rental residential units
overall. Four of these units will be located on the west side of the site, developed around a heritage
house, while the main concentration of 110 units will be located in a new multi-family building.
The development site plan is presented at Exhibit 4.1 which shows the west and east building
locations planned and a summary of the statistics is presented in Table 4.1.
Table 4.1: Development Breakdown
Land Use Number of units Floor Area
Rental Residential 114 84,186sq.ft or 7820sq.m
All parking for the development will be located on-site within a single level underground parking
structure and this includes for the four separate units that act as a buffer between the existing
residential to the west and the main new (east) building.
The main pedestrian entrance to the East building will be on East 18th Avenue, close to the
Commercial Drive intersection.
Driveway access to the underground parking structure, serving both buildings, is planned at East
18th Avenue, which is a low-volume local street connecting between Commercial Drive and Knight
Street. It will be positioned 60-metres distance from the intersection at Commercial Drive, providing
adequate clearance distance.
The driveway location is slightly offset with the intersection opposite at Welwyn Street, but its
position has been constrained by a combination of the elevation and depth needed for the
development site. This offset is not expected to be an operational issue given the relatively low
level of vehicle turning movements and this matter has already been discussed with the City in a
pre-application meeting.
Along the East 18th Avenue frontage, the sidewalk width is planned at 1.8-metres along with a
landscape strip varying between 1.4-metres and 2.8 metres. On Commercial Drive, the sidewalk is
planned to be maintained at 2-metres width along with a set-back to the property line. These
dimensions will be articulated on the landscape drawings.
Although not shown on the landscape plans, there may be opportunity to provide an on-street
parking or passenger loading pocket, but it will need to take into consideration the location of
existing utilities, trees, and maximising the public realm. This matter can be reviewed further as the
design progresses. Additional pedestrian space is planned at the northwest corner of Commercial
Drive and East 18th Avenue, and this will assist with the comfort of pedestrians waiting to cross.
&4297.063365 Commercial Drive Development, Vancouver, BC
S:\P
RO
JEC
TS\P
D\4
297-0
6 3
365 C
om
merc
ial D
r\7.0
Deliv
era
ble
s\7.1
Dra
ft Reports\G
raphic
s
Exhibit 4.1
Development Plan
December 2015
East 18th Avenue
Com
merc
ial D
rive
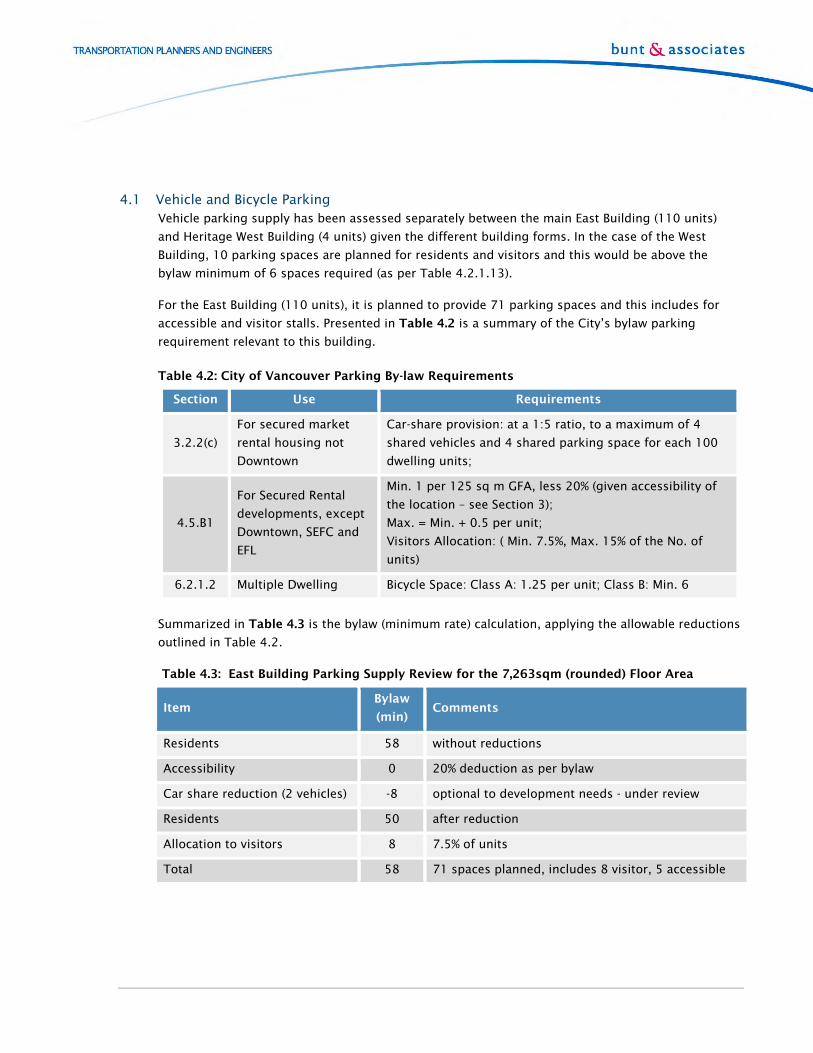
4.1 Vehicle and Bicycle Parking Vehicle parking supply has been assessed separately between the main East Building (110 units)
and Heritage West Building (4 units) given the different building forms. In the case of the West
Building, 10 parking spaces are planned for residents and visitors and this would be above the
bylaw minimum of 6 spaces required (as per Table 4.2.1.13).
For the East Building (110 units), it is planned to provide 71 parking spaces and this includes for
accessible and visitor stalls. Presented in Table 4.2 is a summary of the City’s bylaw parking
requirement relevant to this building.
Table 4.2: City of Vancouver Parking By-law Requirements
Section Use Requirements
3.2.2(c)
For secured market
rental housing not
Downtown
Car-share provision: at a 1:5 ratio, to a maximum of 4
shared vehicles and 4 shared parking space for each 100
dwelling units;
4.5.B1
For Secured Rental
developments, except
Downtown, SEFC and
EFL
Min. 1 per 125 sq m GFA, less 20% (given accessibility of
the location – see Section 3);
Max. = Min. + 0.5 per unit;
Visitors Allocation: ( Min. 7.5%, Max. 15% of the No. of
units)
6.2.1.2 Multiple Dwelling Bicycle Space: Class A: 1.25 per unit; Class B: Min. 6
Summarized in Table 4.3 is the bylaw (minimum rate) calculation, applying the allowable reductions
outlined in Table 4.2.
Table 4.3: East Building Parking Supply Review for the 7,263sqm (rounded) Floor Area
Item Bylaw
(min) Comments
Residents 58 without reductions
Accessibility 0 20% deduction as per bylaw
Car share reduction (2 vehicles) -8 optional to development needs - under review
Residents 50 after reduction
Allocation to visitors 8 7.5% of units
Total 58 71 spaces planned, includes 8 visitor, 5 accessible
Key points from this review are:
71 spaces are planned, including 9 visitor and 5 accessible, and this will meet the City’s
minimum bylaw requirement along with being below the maximum (which is minimum plus 0.5
x 110units);
Five of the parking spaces will meet the City’s accessibility requirements and these can be
counted as double in the bylaw calculation;
Two spaces could be allocated to car-share vehicles, but this would not be fixed as the parking
provision is not reliant on this bylaw reduction;
Additionally 10% of the resident parking spaces are expected to have an electric charging
station;
Just under 25% of the provision will be small parking spaces, i.e. 15 spaces.
For the west building, 10 spaces are planned, including for visitor, and this will be above the
minimum of 6 spaces required in the bylaw. All parking will be accessed from the planned new
driveway at East 18th Avenue.
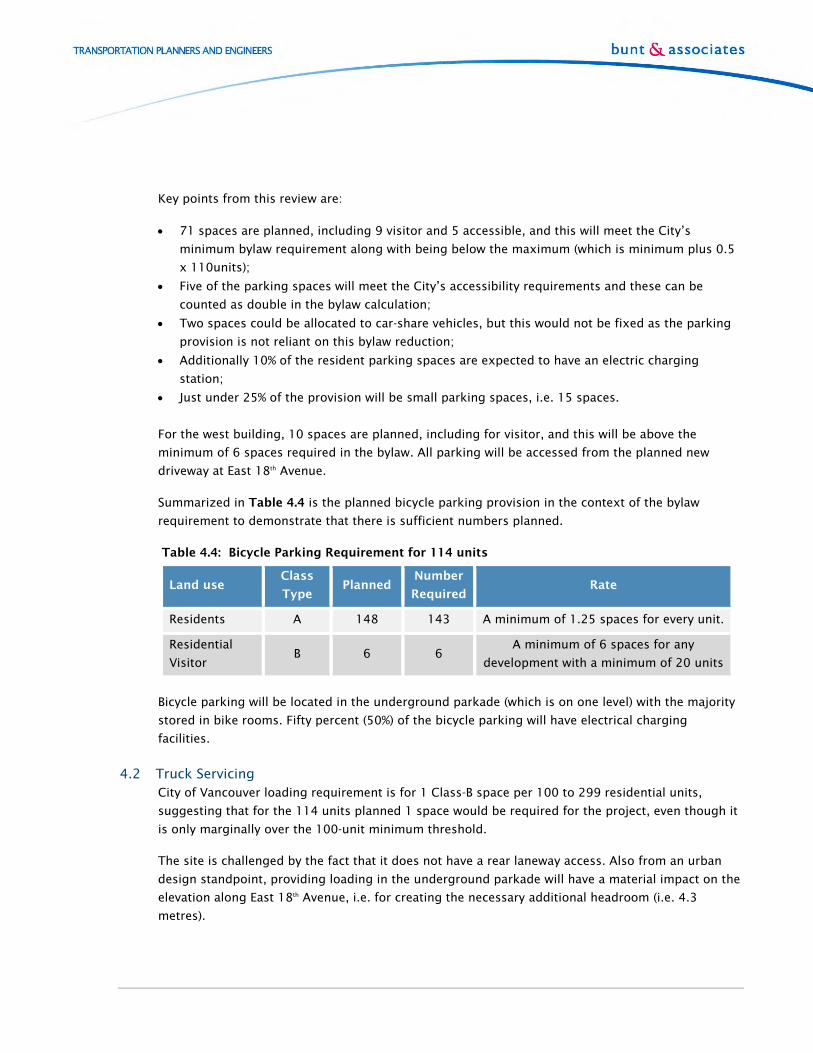
Summarized in Table 4.4 is the planned bicycle parking provision in the context of the bylaw
requirement to demonstrate that there is sufficient numbers planned.
Table 4.4: Bicycle Parking Requirement for 114 units
Land use Class
Type Planned
Number
Required Rate
Residents A 148 143 A minimum of 1.25 spaces for every unit.
Residential
Visitor B 6 6
A minimum of 6 spaces for any
development with a minimum of 20 units
Bicycle parking will be located in the underground parkade (which is on one level) with the majority
stored in bike rooms. Fifty percent (50%) of the bicycle parking will have electrical charging
facilities.
4.2 Truck Servicing City of Vancouver loading requirement is for 1 Class-B space per 100 to 299 residential units,
suggesting that for the 114 units planned 1 space would be required for the project, even though it
is only marginally over the 100-unit minimum threshold.
The site is challenged by the fact that it does not have a rear laneway access. Also from an urban
design standpoint, providing loading in the underground parkade will have a material impact on the
elevation along East 18th Avenue, i.e. for creating the necessary additional headroom (i.e. 4.3
metres).
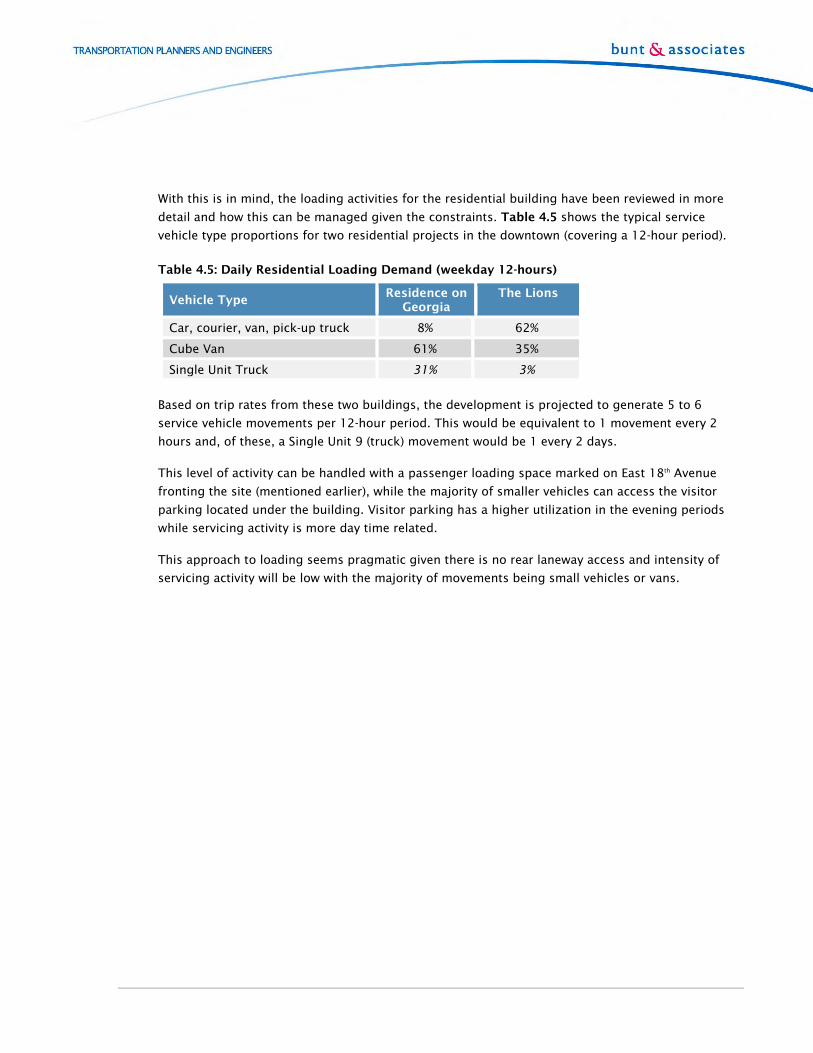
With this is in mind, the loading activities for the residential building have been reviewed in more
detail and how this can be managed given the constraints. Table 4.5 shows the typical service
vehicle type proportions for two residential projects in the downtown (covering a 12-hour period).
Table 4.5: Daily Residential Loading Demand (weekday 12-hours)
Vehicle Type Residence on
Georgia The Lions
Car, courier, van, pick-up truck 8% 62%
Cube Van 61% 35%
Single Unit Truck 31% 3%
Based on trip rates from these two buildings, the development is projected to generate 5 to 6
service vehicle movements per 12-hour period. This would be equivalent to 1 movement every 2
hours and, of these, a Single Unit 9 (truck) movement would be 1 every 2 days.
This level of activity can be handled with a passenger loading space marked on East 18th Avenue
fronting the site (mentioned earlier), while the majority of smaller vehicles can access the visitor
parking located under the building. Visitor parking has a higher utilization in the evening periods
while servicing activity is more day time related.
This approach to loading seems pragmatic given there is no rear laneway access and intensity of
servicing activity will be low with the majority of movements being small vehicles or vans.
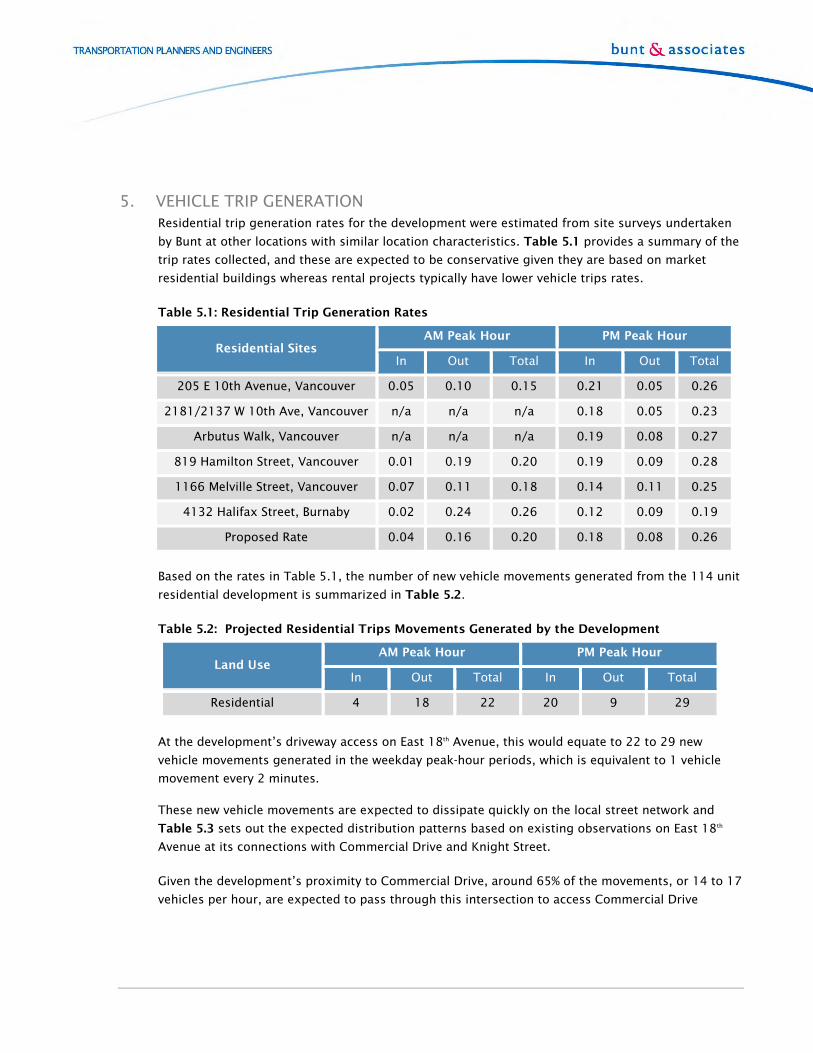
5. VEHICLE TRIP GENERATION Residential trip generation rates for the development were estimated from site surveys undertaken
by Bunt at other locations with similar location characteristics. Table 5.1 provides a summary of the
trip rates collected, and these are expected to be conservative given they are based on market
residential buildings whereas rental projects typically have lower vehicle trips rates.
Table 5.1: Residential Trip Generation Rates
Residential Sites AM Peak Hour PM Peak Hour
In Out Total In Out Total
205 E 10th Avenue, Vancouver 0.05 0.10 0.15 0.21 0.05 0.26
2181/2137 W 10th Ave, Vancouver n/a n/a n/a 0.18 0.05 0.23
Arbutus Walk, Vancouver n/a n/a n/a 0.19 0.08 0.27
819 Hamilton Street, Vancouver 0.01 0.19 0.20 0.19 0.09 0.28
1166 Melville Street, Vancouver 0.07 0.11 0.18 0.14 0.11 0.25
4132 Halifax Street, Burnaby 0.02 0.24 0.26 0.12 0.09 0.19
Proposed Rate 0.04 0.16 0.20 0.18 0.08 0.26
Based on the rates in Table 5.1, the number of new vehicle movements generated from the 114 unit
residential development is summarized in Table 5.2.
Table 5.2: Projected Residential Trips Movements Generated by the Development
Land Use AM Peak Hour PM Peak Hour
In Out Total In Out Total
Residential 4 18 22 20 9 29
At the development’s driveway access on East 18th Avenue, this would equate to 22 to 29 new
vehicle movements generated in the weekday peak-hour periods, which is equivalent to 1 vehicle
movement every 2 minutes.
These new vehicle movements are expected to dissipate quickly on the local street network and
Table 5.3 sets out the expected distribution patterns based on existing observations on East 18th
Avenue at its connections with Commercial Drive and Knight Street.
Given the development’s proximity to Commercial Drive, around 65% of the movements, or 14 to 17
vehicles per hour, are expected to pass through this intersection to access Commercial Drive
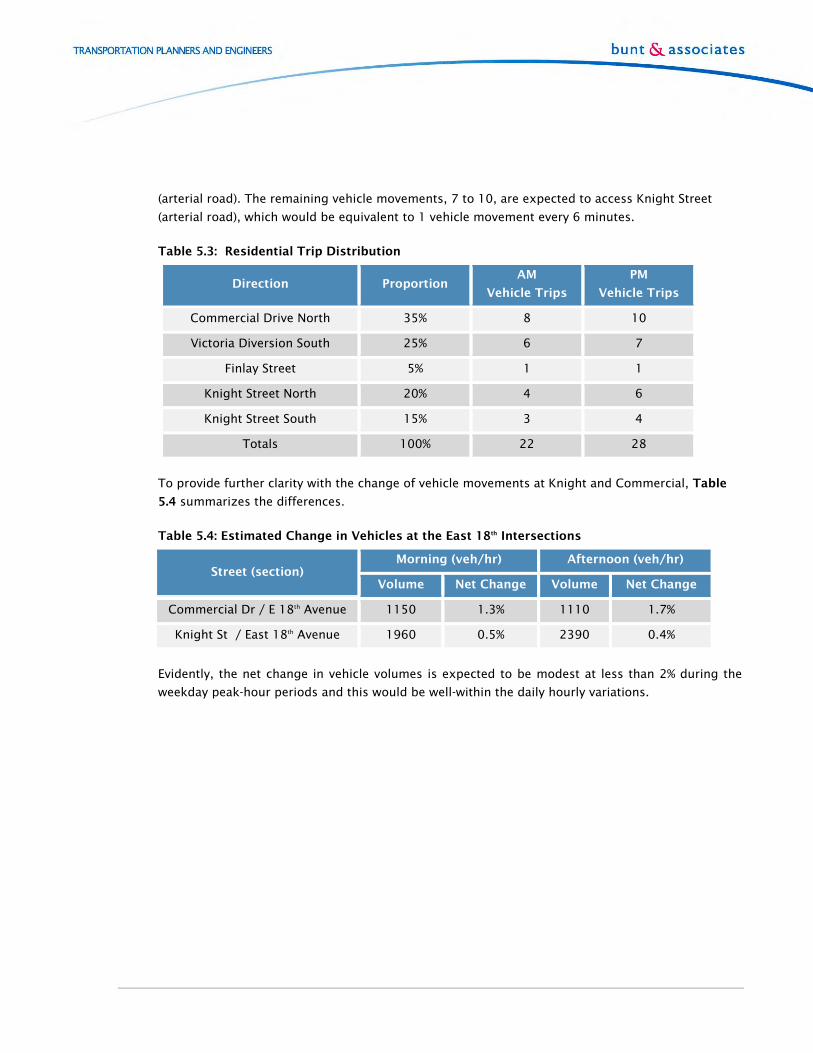
(arterial road). The remaining vehicle movements, 7 to 10, are expected to access Knight Street
(arterial road), which would be equivalent to 1 vehicle movement every 6 minutes.
Table 5.3: Residential Trip Distribution
Direction Proportion AM
Vehicle Trips
PM
Vehicle Trips
Commercial Drive North 35% 8 10
Victoria Diversion South 25% 6 7
Finlay Street 5% 1 1
Knight Street North 20% 4 6
Knight Street South 15% 3 4
Totals 100% 22 28
To provide further clarity with the change of vehicle movements at Knight and Commercial, Table
5.4 summarizes the differences.
Table 5.4: Estimated Change in Vehicles at the East 18th Intersections
Street (section) Morning (veh/hr) Afternoon (veh/hr)
Volume Net Change Volume Net Change
Commercial Dr / E 18th Avenue 1150 1.3% 1110 1.7%
Knight St / East 18th Avenue 1960 0.5% 2390 0.4%
Evidently, the net change in vehicle volumes is expected to be modest at less than 2% during the
weekday peak-hour periods and this would be well-within the daily hourly variations.
6. OPERATIONAL REVIEW AND FOLLOW UP This section first covers the operational capacity review to demonstrate that there would be no
operational issues with the development plan before considering matters that arose from the public
engagement meeting in May 2015.
6.1 Operational Review Intersection operations were modeled at East 18th Avenue’s intersections with Commercial Drive and
Knight Street for the weekday AM and PM peak-hour periods using Synchro 8.0.
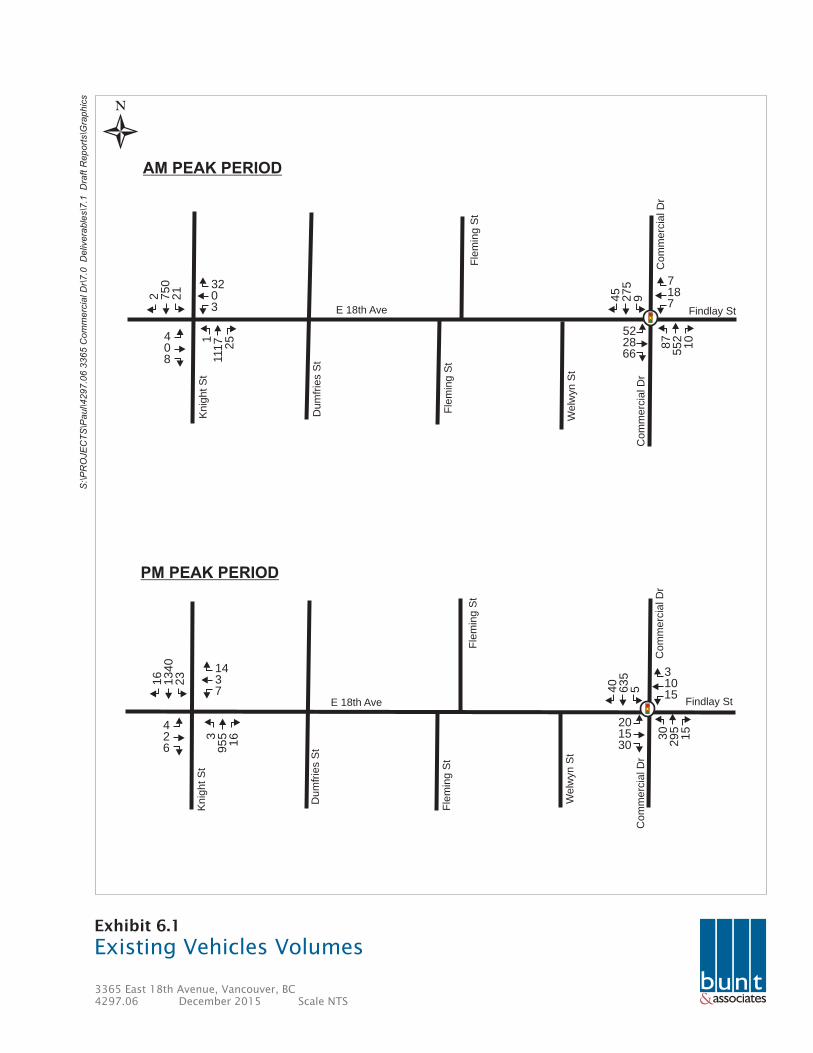
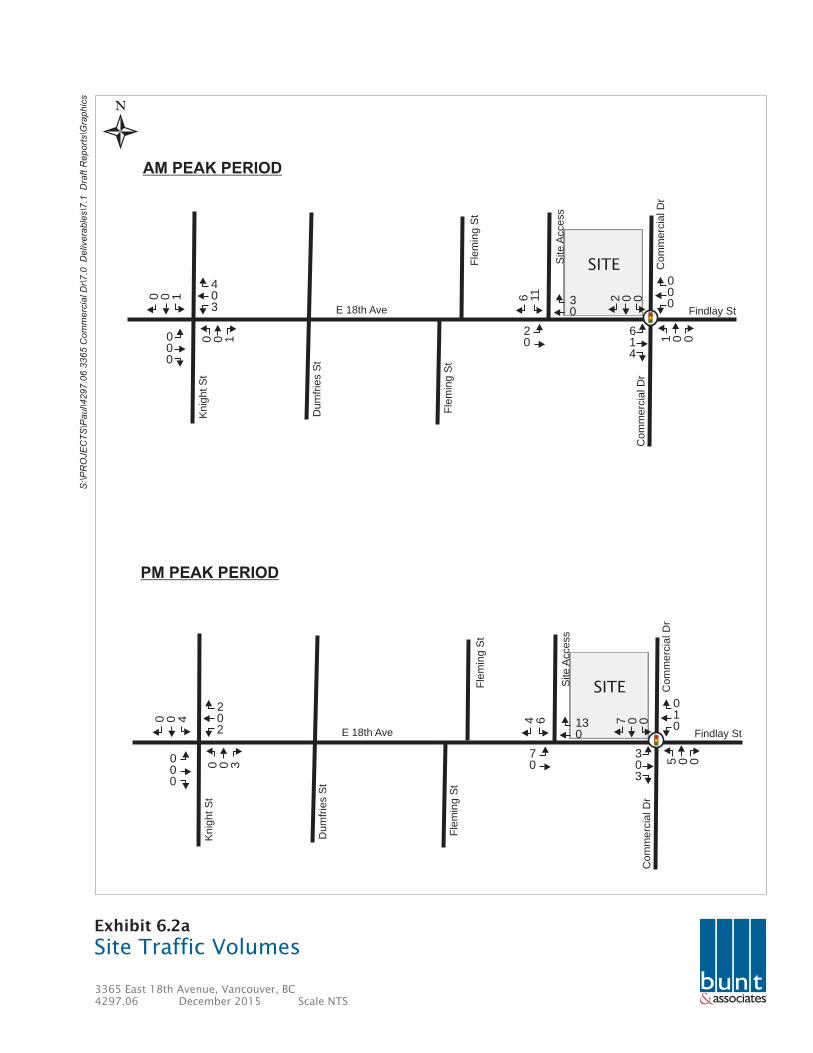
Existing vehicle volumes are presented at Exhibit 6.1 based on the observed survey flows referred
to in Section 2 of the report, while future movements were added to the network based on the
distribution patterns developed in the previous section and these are presented at Exhibit 6.2.
One of the key outputs of the Synchro model is “Level of Service” (LOS), and outlined below is the
range of LOS outcomes based on vehicle delay and volume / capacity ratio (Source: Highway
Capacity Manual):
LOS A: Free Flow
LOS B: Reasonably Free Flow
LOS C: Stable Flow
LOS D: Approaching Unstable Flow
LOS E: Unstable Flow
LOS F: Forced or Breakdown Flow
Synchro has its limitations with regard to modelling pedestrian-activated signals, such as at
Commercial Drive and East 18th Avenue. For un-signalized intersections, the volume / capacity ratio
is not reported so alternatively the intersection capacity utilization (ICU) is used, which essentially
presents the capacity of the intersection and its utilization percentage.
The model also includes pedestrian volumes crossing Commercial Drive at E 18th Avenue along with
the number of activations (presented in Table 2.2). Results from the existing intersections
operations are presented in Table 6.1. Clearly, no operational issues are observed based on the
existing volumes applied to both the intersections.
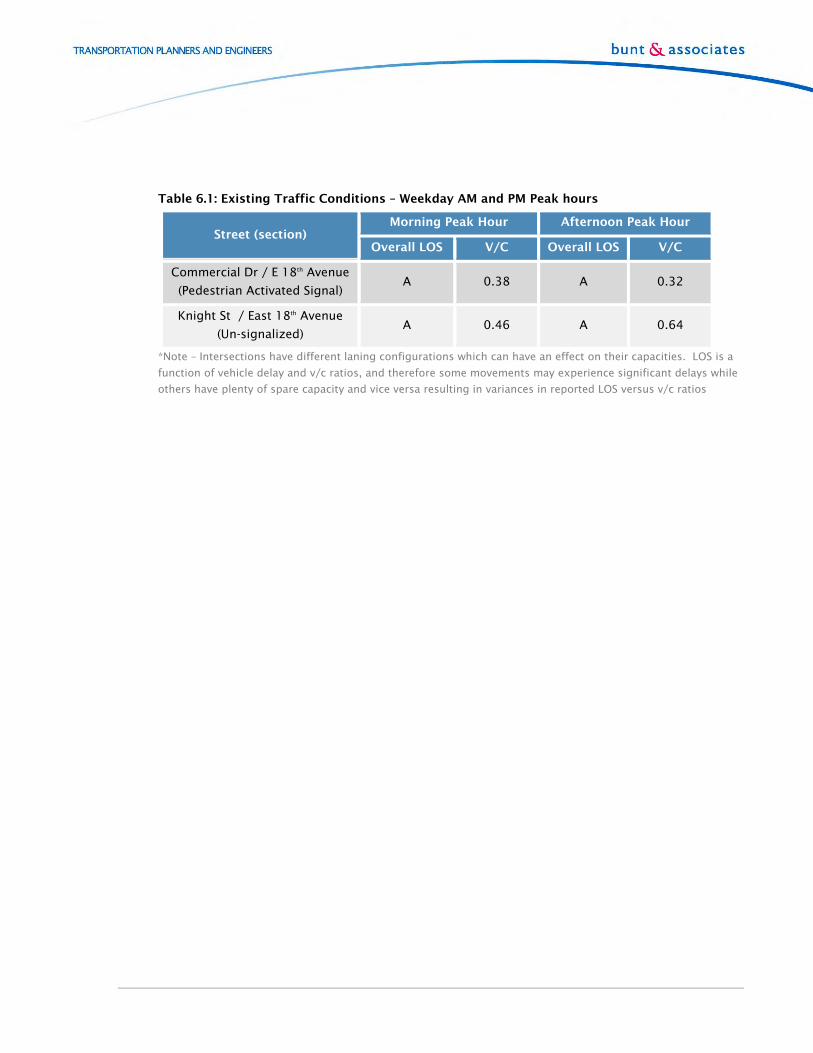
Table 6.1: Existing Traffic Conditions – Weekday AM and PM Peak hours
Street (section) Morning Peak Hour Afternoon Peak Hour
Overall LOS V/C Overall LOS V/C
Commercial Dr / E 18th Avenue
(Pedestrian Activated Signal) A 0.38 A 0.32
Knight St / East 18th Avenue
(Un-signalized) A 0.46 A 0.64
*Note – Intersections have different laning configurations which can have an effect on their capacities. LOS is a
function of vehicle delay and v/c ratios, and therefore some movements may experience significant delays while
others have plenty of spare capacity and vice versa resulting in variances in reported LOS versus v/c ratios
&
S:\P
RO
JE
CT
S\P
aul\4297.0
6 3
365 C
om
merc
ial D
r\7.0
D
eliv
era
ble
s\7
.1 D
raft R
eport
s\G
raphic
s
3365 East 18th Avenue, Vancouver, BC4297.06 December 2015 Scale NTS
Existing Vehicles VolumesExhibit 6.1
N
32
0
3
4
0
8
1
1117
25
2 750
21
7
18
7
52
28
66
87
55
2
10
45
275
9
20
15
30
30
29
5
15
14
3
7
4
2
6
3
95
5
16
16
1340
23
E 18th AveD
um
frie
s S
t
Fle
min
g S
t
Fle
min
g S
t
Welw
yn S
t
Knig
ht S
t
E 18th Ave
Dum
frie
s S
t
Fle
min
g S
t
Fle
min
g S
t
Welw
yn S
t
Knig
ht S
t
3
10
15
40
635
5
AM PEAK PERIOD
PM PEAK PERIOD
Com
merc
ial D
r
Com
merc
ial D
rC
om
merc
ial D
r
Com
merc
ial D
r
Findlay St
Findlay St
&
S:\P
RO
JE
CT
S\P
aul\4297.0
6 3
365 C
om
merc
ial D
r\7.0
D
eliv
era
ble
s\7
.1 D
raft R
eport
s\G
raphic
s
3365 East 18th Avenue, Vancouver, BC4297.06 December 2015 Scale NTS
Site Traffic VolumesExhibit 6.2a
N
4
0
3
0
0
0
0 0 1
0 0 1
0
0
0
6
1
4
1 0 0
2 0 0
E 18th AveD
um
frie
s S
t
Fle
min
g S
t
Fle
min
g S
t
Knig
ht S
t
AM PEAK PERIOD
PM PEAK PERIOD
Com
merc
ial D
r
Com
merc
ial D
r
Findlay St
Site
Access
3
0
2
0
6 11
SITE
2
0
2
0
0
0
0 0 3
0 0 4
0
1
0
3
0
3
5 0 0
7 0 0
E 18th Ave
Dum
frie
s S
t
Fle
min
g S
t
Fle
min
g S
t
Knig
ht S
t
Com
merc
ial D
r
Com
merc
ial D
r
Findlay St
Site
Access
13
0
7
0
4 6
SITE

&
S:\P
RO
JE
CT
S\P
aul\4297.0
6 3
365 C
om
merc
ial D
r\7.0
D
eliv
era
ble
s\7
.1 D
raft R
eport
s\G
raphic
s
3365 East 18th Avenue, Vancouver, BC4297.06 December 2015 Scale NTS
Total Vehicle VolumesExhibit 6.2b
N
36
0
6
4
0
8
1
1117
26
5 750
22
7
18
7
58
29
70
88
55
2
10
47
275
9
E 18th AveD
um
frie
s S
t
Fle
min
g S
t
Fle
min
g S
t
Knig
ht S
t
AM PEAK PERIOD
PM PEAK PERIOD
Com
merc
ial D
r
Com
merc
ial D
r
Findlay St
Site
Access
3
150
2
46
6 11
SITE
16
3
9
4
2
6
3
95
5
19
16
1340
27
3
11
15
23
15
33
35
29
5
15
47
635
5
E 18th Ave
Dum
frie
s S
t
Fle
min
g S
t
Fle
min
g S
t
Knig
ht S
t
Com
merc
ial D
r
Com
merc
ial D
r
Findlay St
Site
Access
13
80
7
41
4 6
SITE
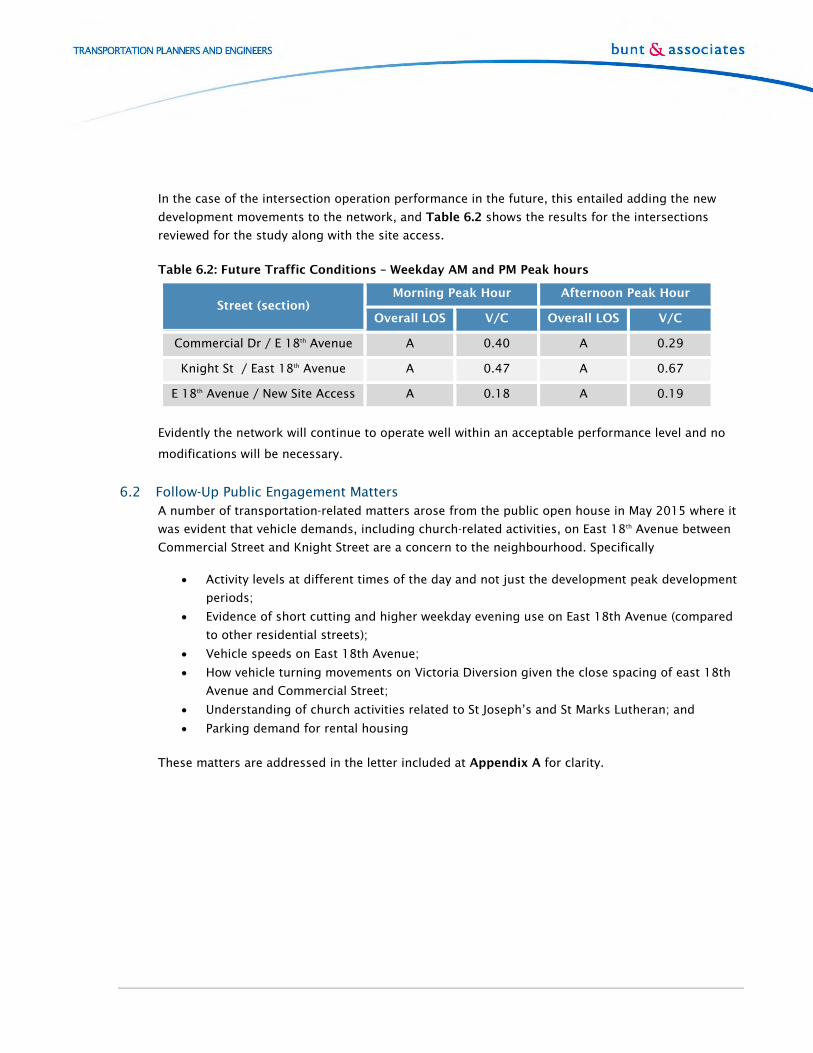
In the case of the intersection operation performance in the future, this entailed adding the new
development movements to the network, and Table 6.2 shows the results for the intersections
reviewed for the study along with the site access.
Table 6.2: Future Traffic Conditions – Weekday AM and PM Peak hours
Street (section) Morning Peak Hour Afternoon Peak Hour
Overall LOS V/C Overall LOS V/C
Commercial Dr / E 18th Avenue A 0.40 A 0.29
Knight St / East 18th Avenue A 0.47 A 0.67
E 18th Avenue / New Site Access A 0.18 A 0.19
Evidently the network will continue to operate well within an acceptable performance level and no
modifications will be necessary.
6.2 Follow-Up Public Engagement Matters A number of transportation-related matters arose from the public open house in May 2015 where it
was evident that vehicle demands, including church-related activities, on East 18th Avenue between
Commercial Street and Knight Street are a concern to the neighbourhood. Specifically
Activity levels at different times of the day and not just the development peak development
periods;
Evidence of short cutting and higher weekday evening use on East 18th Avenue (compared
to other residential streets);
Vehicle speeds on East 18th Avenue;
How vehicle turning movements on Victoria Diversion given the close spacing of east 18th
Avenue and Commercial Street;
Understanding of church activities related to St Joseph’s and St Marks Lutheran; and
Parking demand for rental housing
These matters are addressed in the letter included at Appendix A for clarity.
7. SUMMARY Cressey Development Group is proposing a 114-unit residential rental project, located at the north-
west corner of Commercial Drive and East 18th Avenue within the City of Vancouver.
The site driveway access will be located around 60-metres west of Commercial Drive and be slightly
offset from Welwyn Avenue, located opposite.
On-site observations and analysis confirm no existing operational issues were identified in the
vicinity of the site. Weekday morning vehicle flows are typically higher along East 18th Avenue due to
the influence of the local schools nearby.
The development project is accessible to local amenities and transit, and especially given its
proximity to the Commercial and Broadway transit hub. It therefore can be considered supportive of
the density planned.
On-site vehicle parking provisions of 71 spaces falls within the minimum / maximum allowed under
the bylaw for this type of rental residential project, and all of which, will be located on a single level
below grade structure. Parking space allocation will comply with the City’s design requirements for
small spaces and charging stations.
Resident bicycle parking (148 spaces) will be provided mainly in storage rooms, with some bike
room provision, while visitor parking will be located close to the main east building entrance on
East 18th Avenue.
The development unit count at 114 is just above the minimum threshold triggering a Class-B
loading space (i.e. 100 units). However, there is no rear laneway to the site and the servicing vehicle
intensity is expected to be low (1 movement per 2 hours). Given this, it is suggested to provide a
passenger loading zone on East 18th Avenue, fronting the site, while smaller service vehicles would
be able to access the visitor parking, located within the building if necessary.
New vehicle movements projected with the development site are expected to be around 22 to 29
(per hour) in the peak-hour periods, or 1 vehicle every 2 minutes, and the majority (two-thirds) are
expected to directly access Commercial Drive at the East 18th Avenue intersection.
The pedestrian-activated signal at Commercial Drive / East 18th Avenue / Finlay Street is expected
to operate well within capacity at peak times along with the intersection at East 18th Avenue and
Knight Street.
* * * * * * * * *
APPENDIX A Letter Addendum
June 25, 2015
4297-06
Nathan Gurvich, Development Coordinator
Cressey Development Group
Suite 800, 925 West Georgia Street
Vancouver, BC V6C 3L2
Dear Nathan:
Re: 3365 Commercial Drive – Rental Residential Development
Transportation Addendum
Introduction
We have prepared this letter as an addendum to the Transportation Review (March 2015) to cover the
additional transportation-related matters arising from the public open house in May 2015.
It was evident from the open house that vehicle demands, including church-related activities, on East 18th
Avenue (between Commercial Street and Knight Street) are currently a concern to the neighbourhood and
more data would be needed to understand existing operations more fully. Specifically, the letter will aim
to address the following key points:
Activity levels at different times of the day and not just the development peak development
periods;
Evidence of short cutting and higher weekday evening use on East 18th Avenue (compared to
other residential streets);
Vehicle speeds on East 18th Avenue;
How vehicle turning movements on Victoria Diversion given the close spacing of east 18th
Avenue and Commercial Street;
Understanding of church activities related to St Joseph’s and St Marks Lutheran; and,
Parking demand for rental housing
1 bunt & associates | Addendum Letter, June 25, 2015
Additional transportation data was collected over the period June 6th to 12th, covering vehicle turning
counts at Welwyn Street and East 18th Avenue and Victoria Diversion and Commercial Street along with an
Automatic Traffic Counter (ATC) placed on East 18th Avenue covering three full days of data. An
observational vehicle survey was also conducted on a Sunday morning at the local churches on East 18th
Avenue (St Joseph’s and St Mark’s).
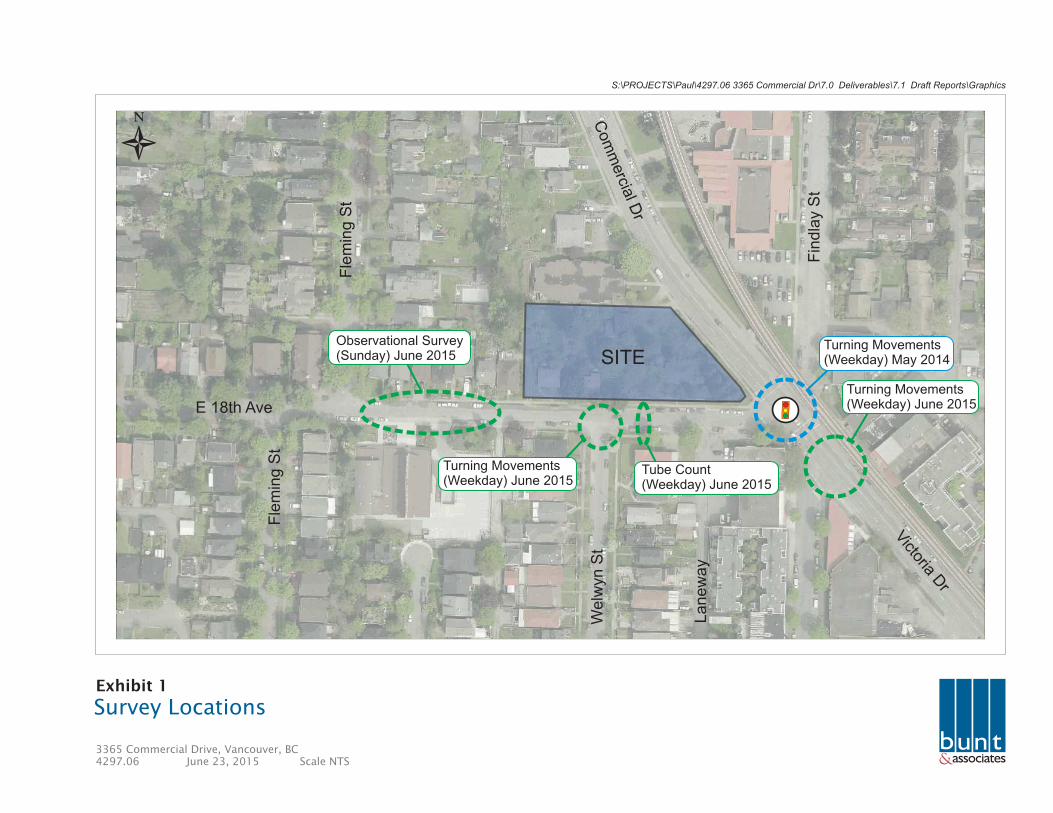
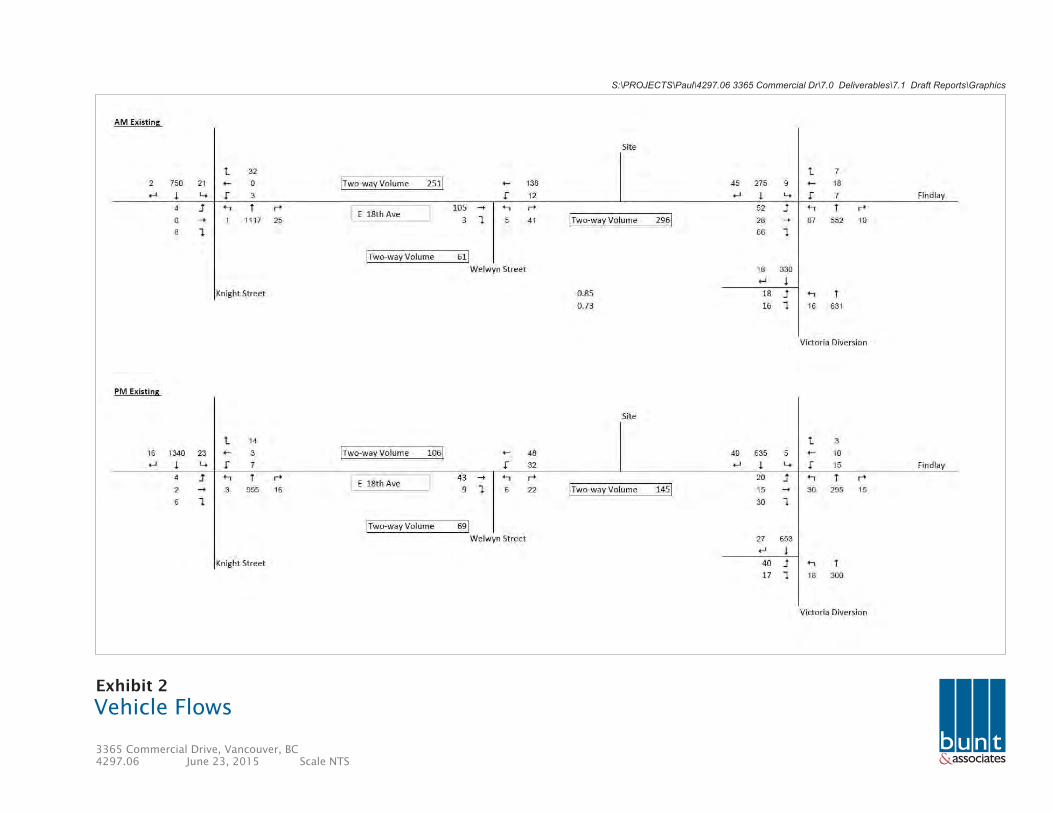
A summary for all the data collection locations is presented at the attached Exhibit 1 for reference and
vehicle flow diagram is presented at Exhibit 2.
Response to Points
Activity levels at different times of the day and not just the development peak development periods.
Typically a residential development peak vehicle demands falls during the weekday morning and afternoon
peak-hour periods and this generally coincides with the peak-hour periods on the adjacent street network
(commuters / school traffic). These periods were identified in our transportation review as:
Weekday Morning: 8am to 9am
Weekday Afternoon: 4:45pm to 5:45pm
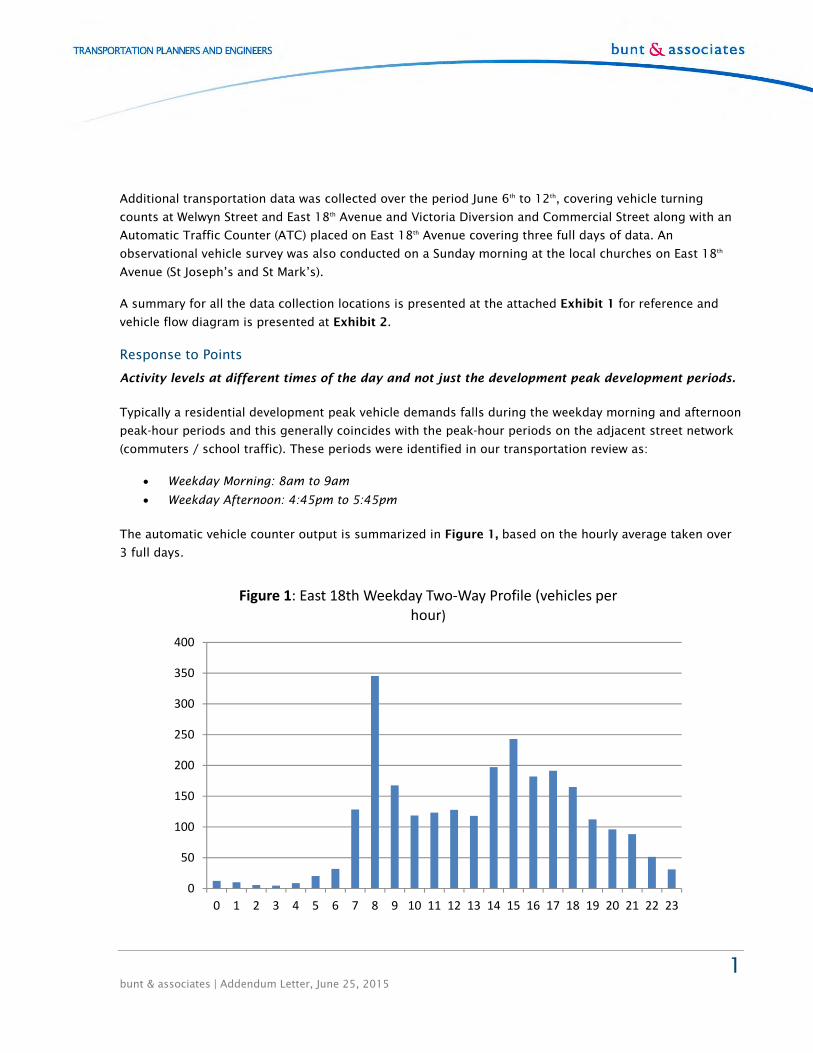
The automatic vehicle counter output is summarized in Figure 1, based on the hourly average taken over
3 full days.
0
50
100
150
200
250
300
350
400
0 1 2 3 4 5 6 7 8 9 10 11 12 13 14 15 16 17 18 19 20 21 22 23
Figure 1: East 18th Weekday Two‐Way Profile (vehicles per hour)
2 bunt & associates | Addendum Letter, June 25, 2015
This graph confirms the hours starting 8am and 3pm (15:00 on figure) were identified as the peak-hour
periods, with the morning period having the highest peak at close to 350 vehicles per hour. It confirms the
morning period applied in the Bunt Transportation Review (March 2015) can be considered as the ‘worst
case’ time condition for street operations, while the afternoon peak-hour has almost 100 vehicles less.
On the weekday evening after 8pm, the vehicle volume on East 18th Avenue drops below100 vehicles per
hour (or less than 2 vehicles per minute) and after 10pm it is less than 50 vehicles per hour. Evening
vehicle volumes are considered further below in the context of other nearby local street observations.
Evidence of short cutting and higher weekday evening use on East 18th Avenue (compared to other
residential streets);
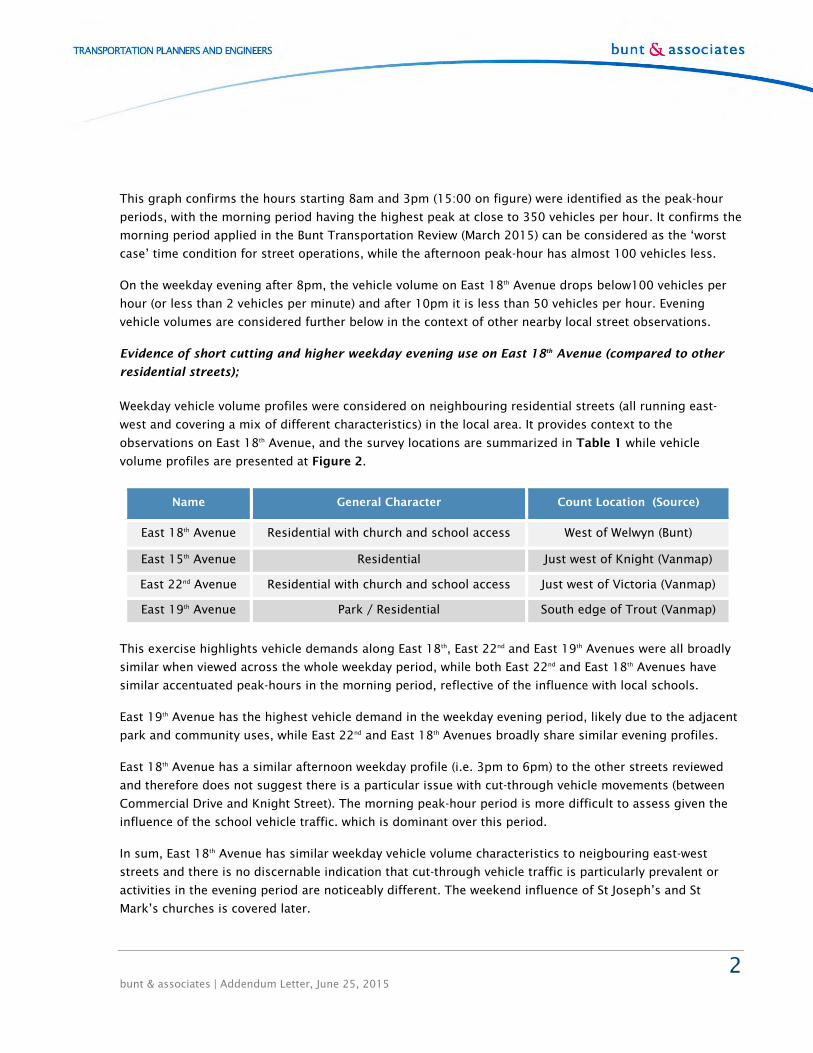
Weekday vehicle volume profiles were considered on neighbouring residential streets (all running east-
west and covering a mix of different characteristics) in the local area. It provides context to the
observations on East 18th Avenue, and the survey locations are summarized in Table 1 while vehicle
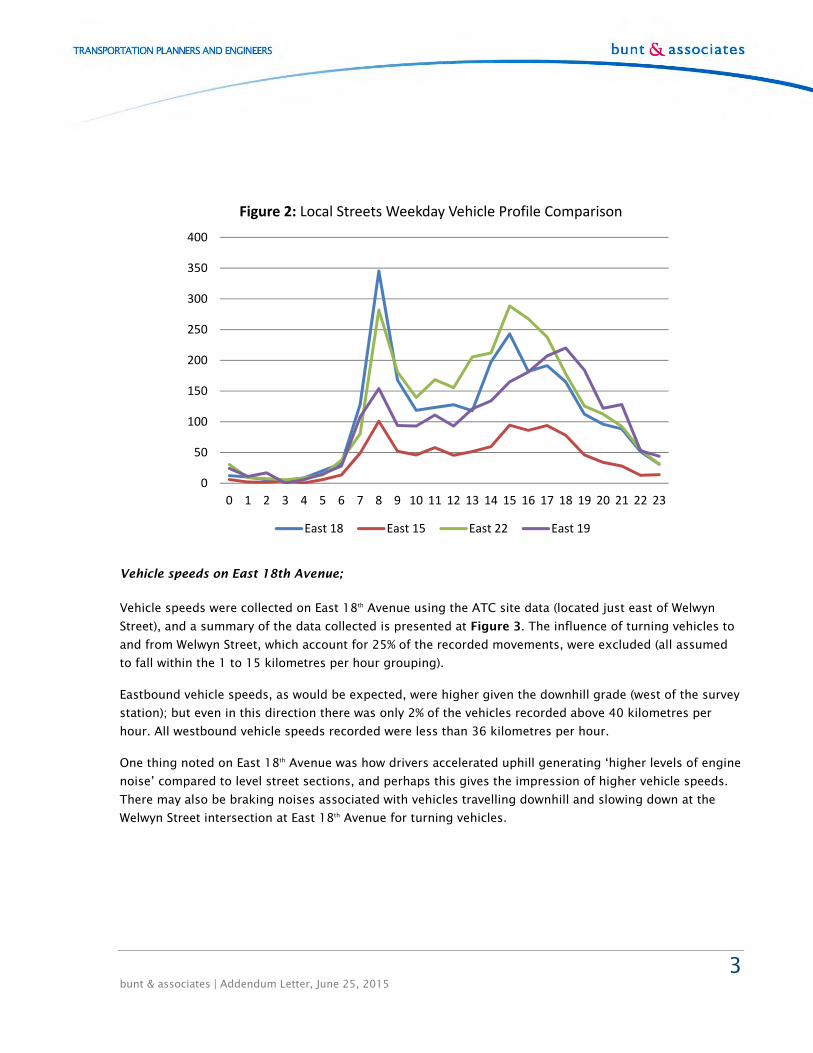
volume profiles are presented at Figure 2.
Name General Character Count Location (Source)
East 18th Avenue Residential with church and school access West of Welwyn (Bunt)
East 15th Avenue Residential Just west of Knight (Vanmap)
East 22nd Avenue Residential with church and school access Just west of Victoria (Vanmap)
East 19th Avenue Park / Residential South edge of Trout (Vanmap)
This exercise highlights vehicle demands along East 18th, East 22nd and East 19th Avenues were all broadly
similar when viewed across the whole weekday period, while both East 22nd and East 18th Avenues have
similar accentuated peak-hours in the morning period, reflective of the influence with local schools.
East 19th Avenue has the highest vehicle demand in the weekday evening period, likely due to the adjacent
park and community uses, while East 22nd and East 18th Avenues broadly share similar evening profiles.
East 18th Avenue has a similar afternoon weekday profile (i.e. 3pm to 6pm) to the other streets reviewed
and therefore does not suggest there is a particular issue with cut-through vehicle movements (between
Commercial Drive and Knight Street). The morning peak-hour period is more difficult to assess given the
influence of the school vehicle traffic. which is dominant over this period.
In sum, East 18th Avenue has similar weekday vehicle volume characteristics to neigbouring east-west
streets and there is no discernable indication that cut-through vehicle traffic is particularly prevalent or
activities in the evening period are noticeably different. The weekend influence of St Joseph’s and St
Mark’s churches is covered later.
3 bunt & associates | Addendum Letter, June 25, 2015
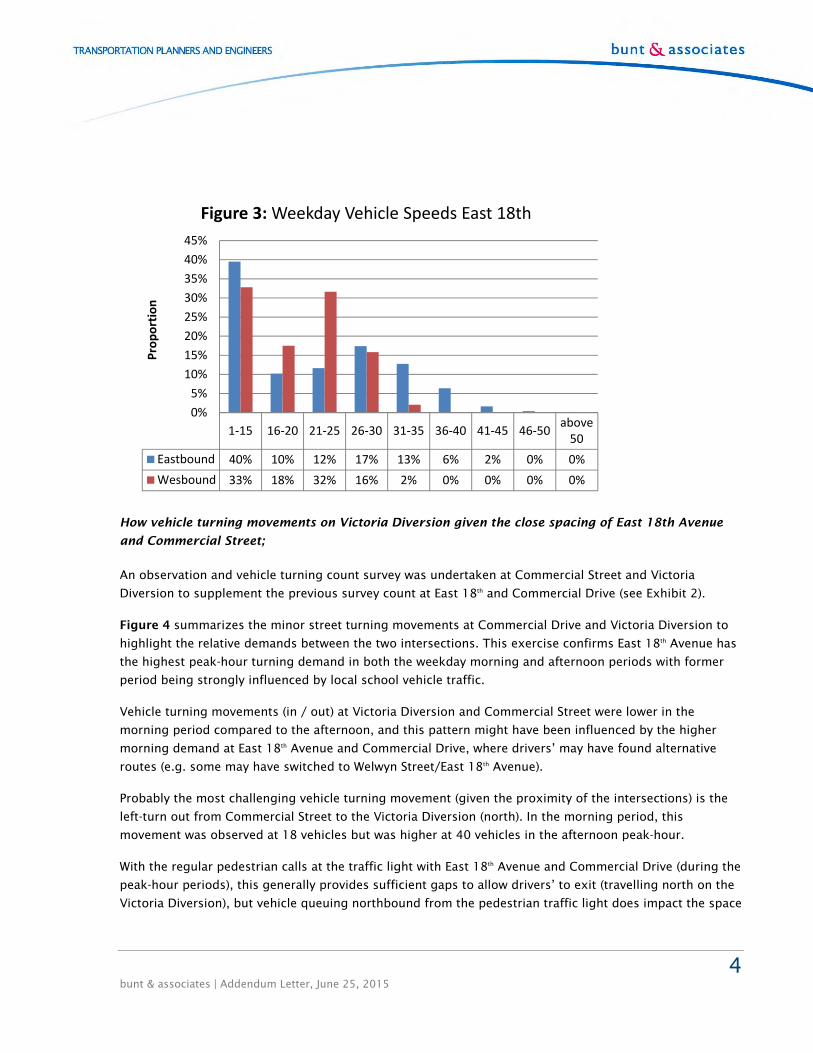
Vehicle speeds on East 18th Avenue;
Vehicle speeds were collected on East 18th Avenue using the ATC site data (located just east of Welwyn
Street), and a summary of the data collected is presented at Figure 3. The influence of turning vehicles to
and from Welwyn Street, which account for 25% of the recorded movements, were excluded (all assumed
to fall within the 1 to 15 kilometres per hour grouping).
Eastbound vehicle speeds, as would be expected, were higher given the downhill grade (west of the survey
station); but even in this direction there was only 2% of the vehicles recorded above 40 kilometres per
hour. All westbound vehicle speeds recorded were less than 36 kilometres per hour.
One thing noted on East 18th Avenue was how drivers accelerated uphill generating ‘higher levels of engine
noise’ compared to level street sections, and perhaps this gives the impression of higher vehicle speeds.
There may also be braking noises associated with vehicles travelling downhill and slowing down at the
Welwyn Street intersection at East 18th Avenue for turning vehicles.
0
50
100
150
200
250
300
350
400
0 1 2 3 4 5 6 7 8 9 10 11 12 13 14 15 16 17 18 19 20 21 22 23
Figure 2: Local Streets Weekday Vehicle Profile Comparison
East 18 East 15 East 22 East 19
4 bunt & associates | Addendum Letter, June 25, 2015
How vehicle turning movements on Victoria Diversion given the close spacing of East 18th Avenue
and Commercial Street;
An observation and vehicle turning count survey was undertaken at Commercial Street and Victoria
Diversion to supplement the previous survey count at East 18th and Commercial Drive (see Exhibit 2).
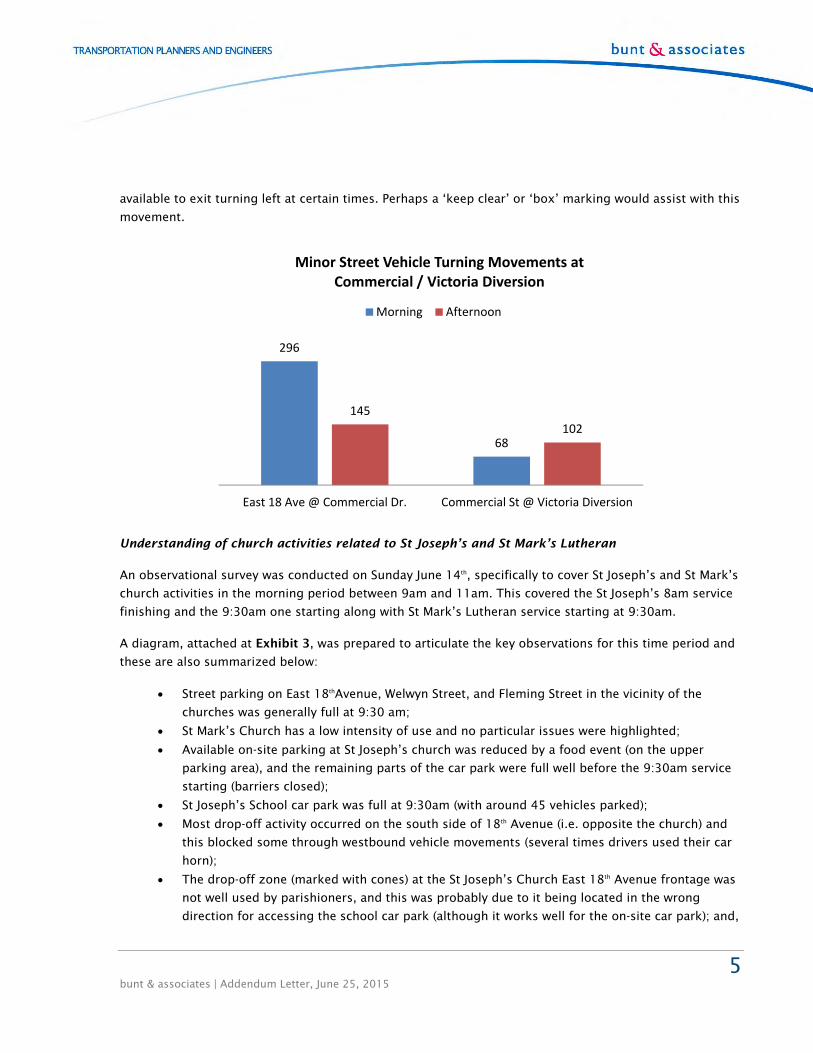
Figure 4 summarizes the minor street turning movements at Commercial Drive and Victoria Diversion to
highlight the relative demands between the two intersections. This exercise confirms East 18th Avenue has
the highest peak-hour turning demand in both the weekday morning and afternoon periods with former
period being strongly influenced by local school vehicle traffic.
Vehicle turning movements (in / out) at Victoria Diversion and Commercial Street were lower in the
morning period compared to the afternoon, and this pattern might have been influenced by the higher
morning demand at East 18th Avenue and Commercial Drive, where drivers’ may have found alternative
routes (e.g. some may have switched to Welwyn Street/East 18th Avenue).
Probably the most challenging vehicle turning movement (given the proximity of the intersections) is the
left-turn out from Commercial Street to the Victoria Diversion (north). In the morning period, this
movement was observed at 18 vehicles but was higher at 40 vehicles in the afternoon peak-hour.
With the regular pedestrian calls at the traffic light with East 18th Avenue and Commercial Drive (during the
peak-hour periods), this generally provides sufficient gaps to allow drivers’ to exit (travelling north on the
Victoria Diversion), but vehicle queuing northbound from the pedestrian traffic light does impact the space
1‐15 16‐20 21‐25 26‐30 31‐35 36‐40 41‐45 46‐50above 50
Eastbound 40% 10% 12% 17% 13% 6% 2% 0% 0%
Wesbound 33% 18% 32% 16% 2% 0% 0% 0% 0%
0%
5%
10%
15%
20%
25%
30%
35%
40%
45%
Proportion
Figure 3: Weekday Vehicle Speeds East 18th
5 bunt & associates | Addendum Letter, June 25, 2015
available to exit turning left at certain times. Perhaps a ‘keep clear’ or ‘box’ marking would assist with this
movement.
Understanding of church activities related to St Joseph’s and St Mark’s Lutheran
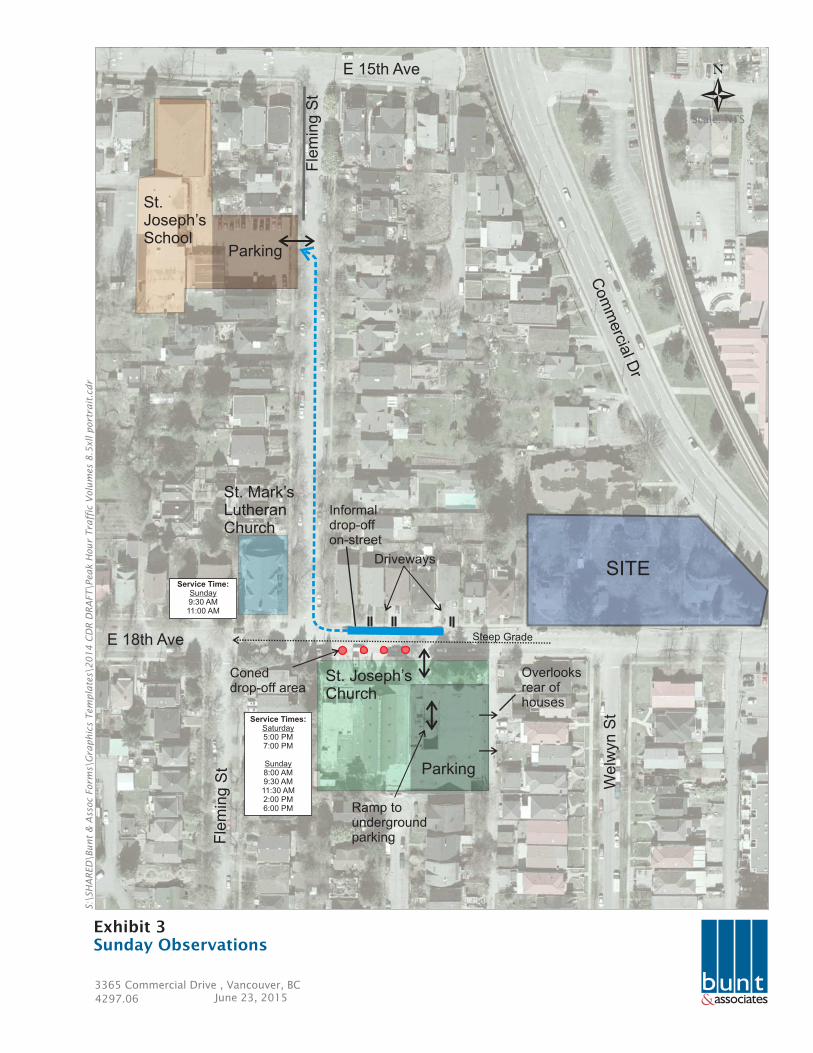
An observational survey was conducted on Sunday June 14th, specifically to cover St Joseph’s and St Mark’s
church activities in the morning period between 9am and 11am. This covered the St Joseph’s 8am service
finishing and the 9:30am one starting along with St Mark’s Lutheran service starting at 9:30am.
A diagram, attached at Exhibit 3, was prepared to articulate the key observations for this time period and
these are also summarized below:
Street parking on East 18thAvenue, Welwyn Street, and Fleming Street in the vicinity of the
churches was generally full at 9:30 am;
St Mark’s Church has a low intensity of use and no particular issues were highlighted;
Available on-site parking at St Joseph’s church was reduced by a food event (on the upper
parking area), and the remaining parts of the car park were full well before the 9:30am service
starting (barriers closed);
St Joseph’s School car park was full at 9:30am (with around 45 vehicles parked);
Most drop-off activity occurred on the south side of 18th Avenue (i.e. opposite the church) and
this blocked some through westbound vehicle movements (several times drivers used their car
horn);
The drop-off zone (marked with cones) at the St Joseph’s Church East 18th Avenue frontage was
not well used by parishioners, and this was probably due to it being located in the wrong
direction for accessing the school car park (although it works well for the on-site car park); and,
296
68
145
102
East 18 Ave @ Commercial Dr. Commercial St @ Victoria Diversion
Minor Street Vehicle Turning Movements at Commercial / Victoria Diversion
Morning Afternoon
6 bunt & associates | Addendum Letter, June 25, 2015
Cars accelerating after dropping off people on the uphill section of East 18th Avenue added to
the vehicle noise.
St Joseph’s Church has seven services over the weekend with two of these on a Saturday and five on a
Sunday. This frequency is perhaps one of the main concerns for the neighbourhood, and occurs more
often compared to many other local churches.
One change that may assist would be for the church to discourage drop-off activity westbound on East 18th
Avenue (i.e. on the way to the school car park) along with prioritizing the parking on-site for those
members who are less mobile.
Last, a car headlight issue was highlighted (speaking to a neighbour) with the upper level of the St
Joseph’s Church car park, which overlooks residences located to the east (i.e. those fronting Welwyn
Street). Perhaps some form of mitigation measure could be installed on the car park railing to block this
light issue.
Parking Demand for Rental Housing
One question raised at the open house was to understand the actual parking demand for rental housing as
opposed to just what the bylaw states.
Parking demand for rental housing parking is typically lower than equivalent market units, where a recent
survey at Heather Place in the City indicated a parking use rate of around 0.6 spaces per unit (based on car
park observations). Another survey in North Vancouver at the Malborough Tower I apartment building
indicated vehicle ownership at around 0.66 vehicles per unit.
These surveys confirm parking demand, or vehicle ownership, for rental housing is typically lower by
around 40% than the equivalent market housing units. At the 3365 Commercial Drive project, the parking
space ratio for residents is expected to be around 0.66 per unit, similar to the observed demands for the
other locations while the site will also benefit from its proximity to the SkyTrain at Broadway.
Summary
We hope the above responses cover the concerns and questions raised through the public consultation
process and can assist with progressing this planning application.
Yours truly,
Bunt & Associates
Paul Dorby, MSc
Senior Transportation Planner
&
S:\PROJECTS\Paul\4297.06 3365 Commercial Dr\7.0 Deliverables\7.1 Draft Reports\Graphics
3365 Commercial Drive, Vancouver, BC4297.06 June 23, 2015 Scale NTS
Survey LocationsExhibit 1
SITE
N Com
mercia
l Dr
Victoria Dr
E 18th Ave
Fle
min
g S
t
Fle
min
g S
t
Lanew
ay
Welw
yn S
t
Fin
dla
y S
t
Observational Survey(Sunday) June 2015
Turning Movements(Weekday) June 2015
Tube Count(Weekday) June 2015
Turning Movements(Weekday) May 2014
Turning Movements (Weekday) June 2015
&
S:\PROJECTS\Paul\4297.06 3365 Commercial Dr\7.0 Deliverables\7.1 Draft Reports\Graphics
3365 Commercial Drive, Vancouver, BC4297.06 June 23, 2015 Scale NTS
Vehicle FlowsExhibit 2
&
S:\
SH
ARED
\Bunt
& A
ssoc F
orm
s\G
raphic
s Tem
pla
tes\
20
14
CD
R D
RA
FT\P
eak H
our
Tra
ffic
Volu
mes
8.5
xll p
ort
rait
.cdr
4297.06
3365 Commercial Drive , Vancouver, BC
Exhibit 3Sunday Observations
June 23, 2015
Scale: NTS
N
SITE
E 18th Ave
Fle
min
g S
t
Fle
min
g S
t
We
lwyn
St
Com
mercia
l Dr
St. Joseph’s Church
St. Mark’s Lutheran Church
St. Joseph’s School
E 15th Ave
Driveways
Parking
Parking
Service Times:Saturday5:00 PM7:00 PM
Sunday8:00 AM9:30 AM11:30 AM2:00 PM6:00 PM
Service Time:Sunday9:30 AM11:00 AM
Informaldrop-offon-street
Ramp tounderground parking
Steep Grade
Overlooksrear of houses
Coned drop-off area

![Dualization of a Monotone Boolean Function · Monotone separable inequalities where, monotone & P-computable Th [Boros, Elbassioni, Gurvich, Khachiyan, Makino, 03] All minimal integral](https://img.pdfslide.us/doc/110x75/5f85d9e5a3ab42653e78ea84/dualization-of-a-monotone-boolean-function-monotone-separable-inequalities-whereioe.jpg)


![JOSÉ GURVICH - Galería Guillermo de Osmaguillermodeosma.com/wp-content/uploads/2019/11/JOSE...JOSÉ GURVICH [1927-1974] MADRID • GUILLERMO DE OSMA GALERÍA BARCELONA • SALA DALMAU](https://img.pdfslide.us/doc/110x75/60b8c50962797432546e9c6e/jos-gurvich-galera-guillermo-de-jos-gurvich-1927-1974-madrid-a-guillermo.jpg)