Embed Size (px)
Citation preview
Instructions for use
Title Decadal variability in the Arctic Ocean shown in hydrochemical data
Author(s) Ikeda, M.; Colony, R.; Ikeda, T.; Yamaguchi, H.
Citation Geophysical Research Letters, 32(21), L21605https://doi.org/10.1029/2005GL023908
Issue Date 2005-11-15
Doc URL http://hdl.handle.net/2115/894
Type article (author version)
Note An edited version of this paper was published by AGU. Copyright 2005, American Geophysical Union, GeophysicalResearch Letters, Issue 21
File Information GRL32.pdf
Hokkaido University Collection of Scholarly and Academic Papers : HUSCAP
Decadal variability in the Arctic Ocean shown in hydrochemical data
M. Ikeda 1) 2) , R. Colony 2) , H. Yamaguchi 1) and T. Ikeda 1)
1) Graduate School of Environmental Earth Science, Hokkaido University, Sapporo, Japan;
2) International Arctic Research Center, University of Alaska, Fairbanks, Alaska
Abstract
The recent distribution of Russian hydrochemical data collected from the Arctic Basin
provides useful information on ocean interior variabilities. Among various chemical components,
silicate is the most valuable for showing the boundary between the silicate-rich Pacific Water and
the opposite Atlantic Water. Here, it is assumed that the silicate distribution receives minor
influence from seasonal biological productivity and Siberian Rivers outflow. It shows a clear
maximum around 100-m depth in the Canada Basin. The vertical gradient below 100 m provides
information on the vertical motion of the upper boundary of the Atlantic Water at a decadal time
scale: i.e., the boundary shifts upward (downward), as realized by the silicate reduction (increase) at
a fixed depth, responding to a more intense (weaker) Polar Vortex or the positive (negative) phase
of the Arctic Oscillation. This valuable hydrochemical data set has provided a tool for
verifying Arctic Ocean models with decadal responses to atmospheric variabilities.
1. Introduction
Sea ice distribution and atmospheric conditions have shown significant decadal variabilities:
i.e., the ice area reduced (increased) along the Russian coast, responding to a more intense (weaker)
Polar Vortex and higher (lower) air temperature (Wang et al., 2000). The atmospheric variabilities
are explained by the Arctic Oscillation (AO), being positive (negative) for the more intense
(weaker) Polar Vortex (Thompson and Wallace, 1998). The suggested mechanisms include both
dynamical and thermodynamical types. The dynamical effects are represented by more
predominant seaward (shoreward) winds off the Russian coast during the positive (negative) AO
phase (Zhang et al., 2000).
A more sophisticated dynamical linkage involves the coupled ice-ocean system: i.e., the
positive (negative) AO yields a faster (slower) Transpolar Drift Flow associated with larger
(smaller) water exchange between the Arctic Basin and the Greenland Sea (Polyakov and Johnson,
2000). More reliable observational evidence has been provided by sea ice motion in Kwok (2000)
and Rigor et al. (2002) than ocean circulation. The other mechanism is a thermodynamical one,
which seems straightforward being related to air temperature. The secondary thermodynamical
mechanism consists of a larger (smaller) absorption of shortwave radiation through wider
(narrower) open water areas in summer (Zhang et al., 2000).
In contrary to the sea ice, it has been difficult to identify a corresponding signal in the ocean
interior due to the unavailable data. Polyakov et al. (2004) have presented two cycles of
multi-decadal oscillations shown in temperature and salinity. They have suggested that more
(less) warm Atlantic Water flows into the Arctic Ocean during the positive (negative) phase of the
AO. Although their study is a pioneer one, the further work is necessary in exploring an oceanic
response to the decadal AO, which is dominant in the atmospheric variabilities. Complete open
access to T-S data in a public domain is desirable, but they are open only on demand.
The recent distribution of Russian geochemical data collected through drifting stations (North
Pole Stations) from the Arctic Basin has opened up a new source for exploring ocean interior
variability (Hydrochemical Atlas, 2001). Among various oceanic parameters, silicate may be used
as an indicator of the boundary between the silicate-rich Pacific Water and the opposite Atlantic
Water (NOAA Atlas, 2002). Here, we should remember the secondary effects by which silicate is
transported downward due to seasonal biological productivity as well as outflow from Siberian
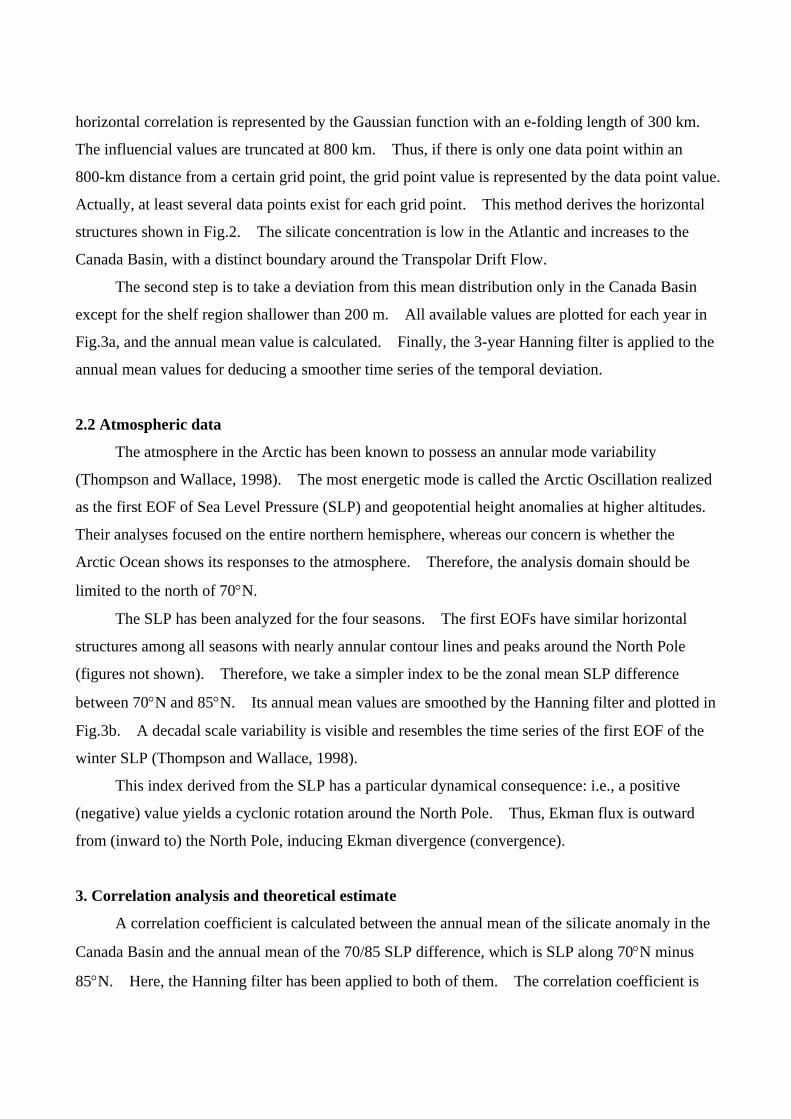
rivers and shelves (Wilson and Wallace, 1990). The silicate distribution in Fig.1 shows a clear
maximum around 100-m depth in the Canada Basin. The vertical gradient below 100 m provides
information on the vertical motion of the upper boundary of the Atlantic Water. An upward or
downward shift of the boundary is expected to show an oceanic response to the AO.
In section 2, the geochemical data are first introduced and analyzed with caution by means of
the data quality and sparseness. Among the atmospheric data, we pay close attention to the annual
mean of sea level pressure, whose variability is expected to induce wind variability, and hence,
ice-ocean motion variability. The correlation between the geochemical distribution and the
atmospheric circulation is quantitatively examined in section 3. The results are discussed in
section 4.
2. Data
2.1 Geochemical data
Various kinds of data were collected in and over the Arctic Ocean at the drifting stations
(North Pole Stations) by ex-Soviet observers. In addition to meteorological data, marine
hydrochemical data are considered to provide useful information on the Arctic and have now
become available (Hydrochemical Atlas, 2001). Since it is difficult to infer the ocean interior
through satellite data, this new data set is expected to give a new insight into oceanic responses to
atmospheric variability.
The geochemical parameters may represent both bio-geochemical and physical processes of
the ocean. We have decided to focus on the physical processes in this report by isolating
bio-geochemical ones and to use a geochemical parameter as a tracer. A chemical oceanographer
often uses a conserved value on geochemical parameters: e.g., Wilson and Wallace (1990) tried to
identify a source region of the Halocline Water by distinguishing the Pacific Water and a water
mass influenced by the continental shelf. In contrast, our main objective is to find out an oceanic
response to atmospheric forcing at a decadal scale by tracing a more robust geochemical signal
between the Pacific Water and the Atlantic Water.
We have decided to utilize silicate shown in Fig.1, which is much higher in the Pacific Ocean
(40 µmol kg-1) than in the Atlantic Ocean (5 µmol kg-1). This allows us to search for vertical motion
of the lower boundary of the near surface Arctic Water, which includes the Pacific Water,
overlying the Atlantic Water in the Canada Basin. The biological effects transport silicate in the
top 50 m downward in summer and create a clear maximum between 100 m and 200 m, with decay
to the Atlantic value at 250-m depth (Hydrochemical Atlas, 2001). We can make an analogy
between silicate and the other biogeochemical parameters used by Wilson and Wallace (1990): i.e.,
the influence of the continental shelf region may input silicate to the layer between 100 m and 200
m. Taking these mechanisms into account, the robust signal of vertical water motion is possibly
extracted from the upper boundary of the Atlantic Water, once the silicate concentration varies by a
factor of 2 such as a change from 15 µmol kg-1 to 30 µmol kg-1.
Hydrochemical Atlas (2001) contains geochemical data collected in the second half of the
20th century, while mainly collected parameters varied in time. Silicate was more extensively
collected during the period of 1965-90. The data set spans two cycles of the decadal AO and has
the potential to resolve the oceanic responses to the AO.
The silicate data are distributed in the Arctic Ocean with high spatial and temporal
inhomogeneity. We therefore aim to effectively utilize such a data set in our analysis. The
horizontal distribution of the mean state is first constructed, and then, a temporal deviation from the
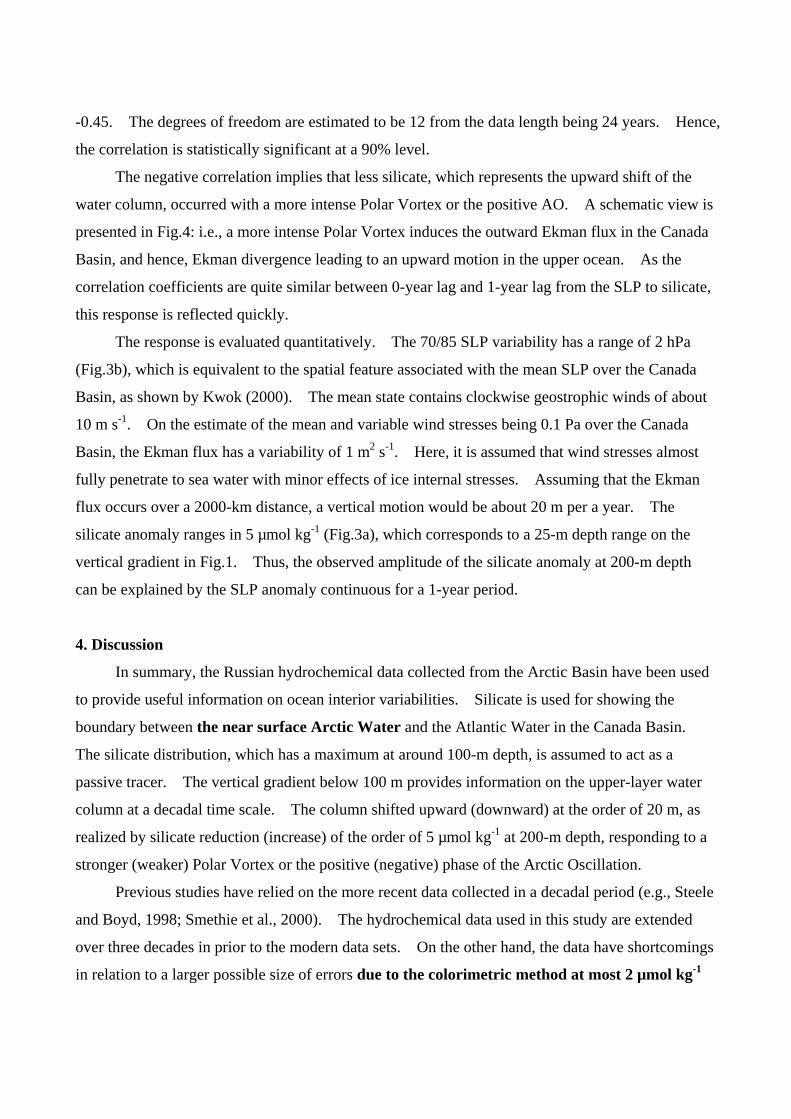
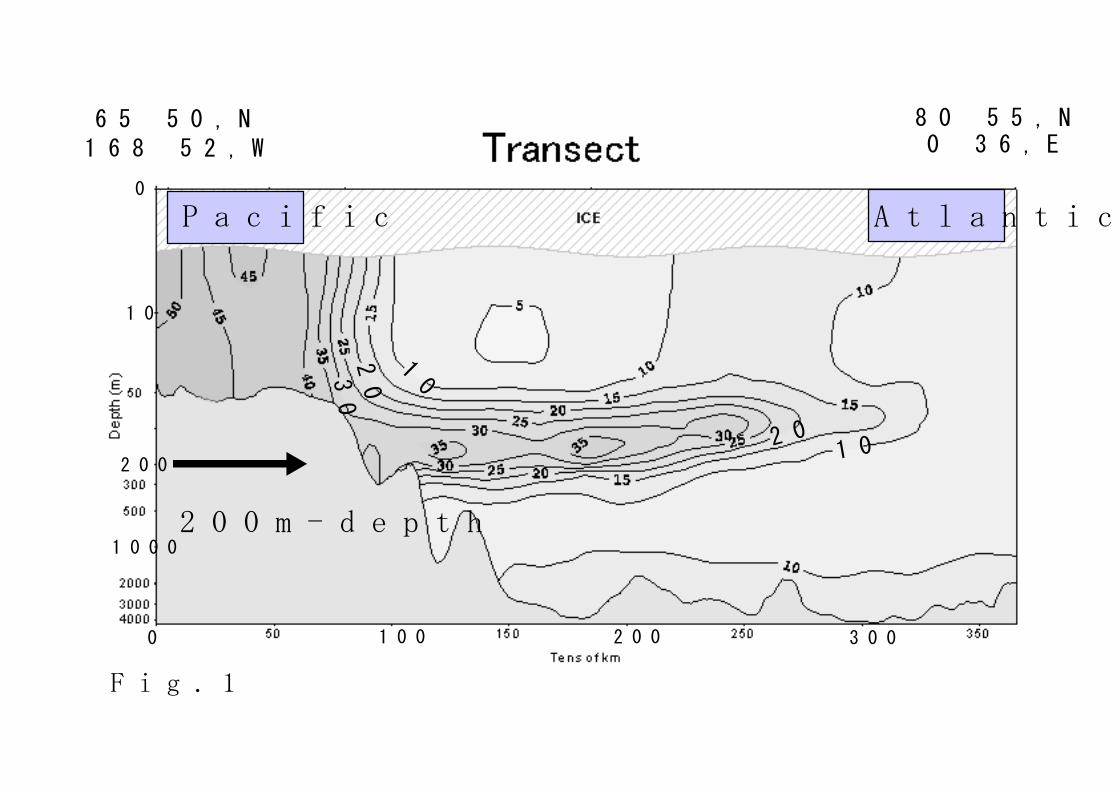
mean state is retrieved. The mean horizontal structure at 200-m depth is constructed, in which a
horizontal correlation is represented by the Gaussian function with an e-folding length of 300 km.
The influencial values are truncated at 800 km. Thus, if there is only one data point within an
800-km distance from a certain grid point, the grid point value is represented by the data point value.
Actually, at least several data points exist for each grid point. This method derives the horizontal
structures shown in Fig.2. The silicate concentration is low in the Atlantic and increases to the
Canada Basin, with a distinct boundary around the Transpolar Drift Flow.
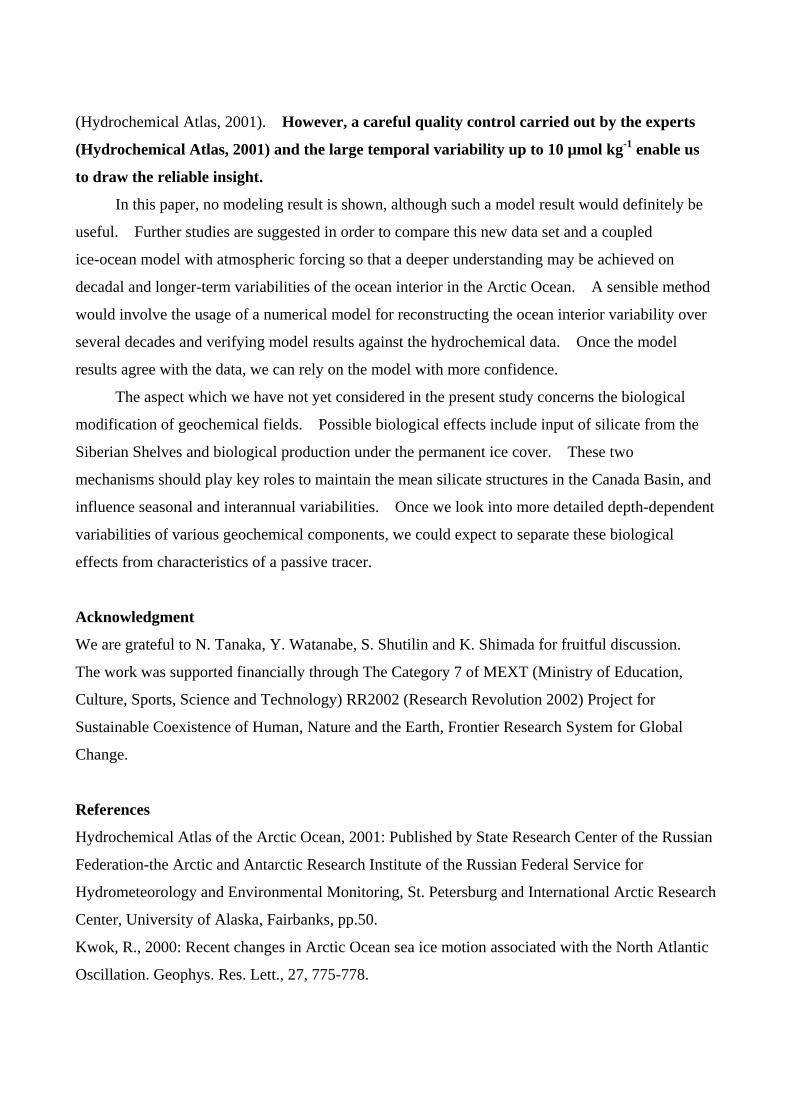
The second step is to take a deviation from this mean distribution only in the Canada Basin
except for the shelf region shallower than 200 m. All available values are plotted for each year in
Fig.3a, and the annual mean value is calculated. Finally, the 3-year Hanning filter is applied to the
annual mean values for deducing a smoother time series of the temporal deviation.
2.2 Atmospheric data
The atmosphere in the Arctic has been known to possess an annular mode variability
(Thompson and Wallace, 1998). The most energetic mode is called the Arctic Oscillation realized
as the first EOF of Sea Level Pressure (SLP) and geopotential height anomalies at higher altitudes.
Their analyses focused on the entire northern hemisphere, whereas our concern is whether the
Arctic Ocean shows its responses to the atmosphere. Therefore, the analysis domain should be
limited to the north of 70°N.
The SLP has been analyzed for the four seasons. The first EOFs have similar horizontal
structures among all seasons with nearly annular contour lines and peaks around the North Pole
(figures not shown). Therefore, we take a simpler index to be the zonal mean SLP difference
between 70°N and 85°N. Its annual mean values are smoothed by the Hanning filter and plotted in
Fig.3b. A decadal scale variability is visible and resembles the time series of the first EOF of the
winter SLP (Thompson and Wallace, 1998).
This index derived from the SLP has a particular dynamical consequence: i.e., a positive
(negative) value yields a cyclonic rotation around the North Pole. Thus, Ekman flux is outward
from (inward to) the North Pole, inducing Ekman divergence (convergence).
3. Correlation analysis and theoretical estimate
A correlation coefficient is calculated between the annual mean of the silicate anomaly in the
Canada Basin and the annual mean of the 70/85 SLP difference, which is SLP along 70°N minus
85°N. Here, the Hanning filter has been applied to both of them. The correlation coefficient is
-0.45. The degrees of freedom are estimated to be 12 from the data length being 24 years. Hence,
the correlation is statistically significant at a 90% level.
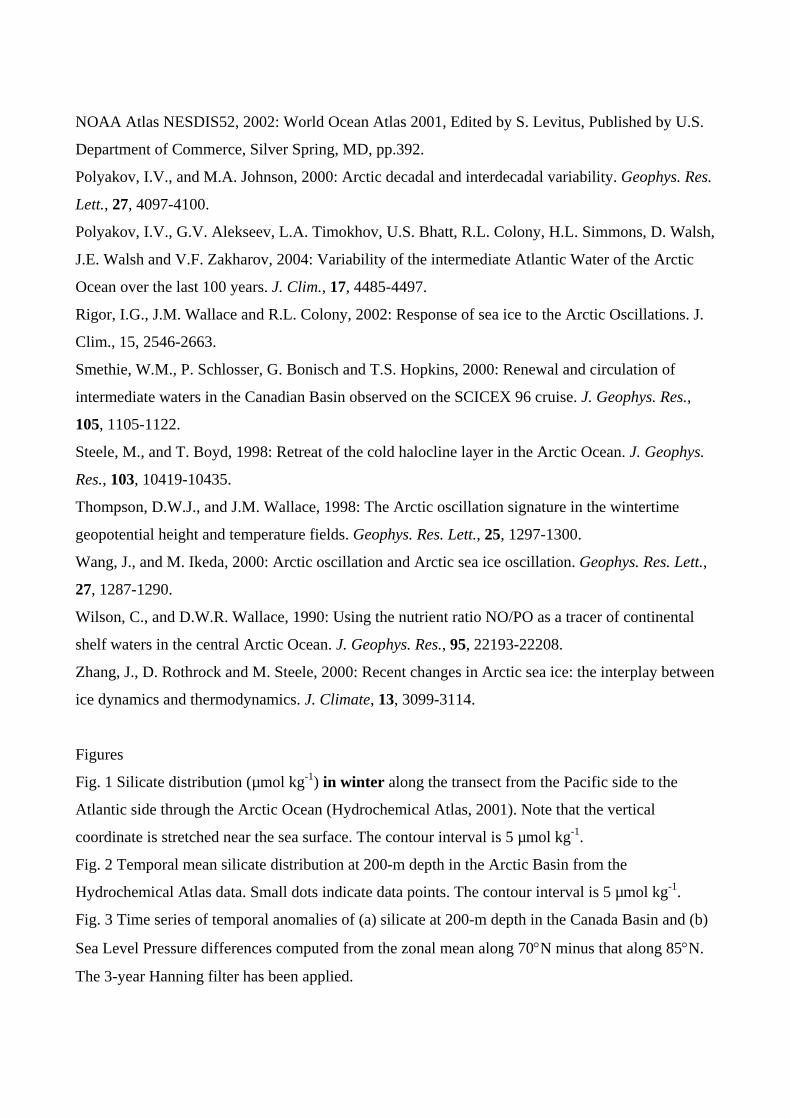
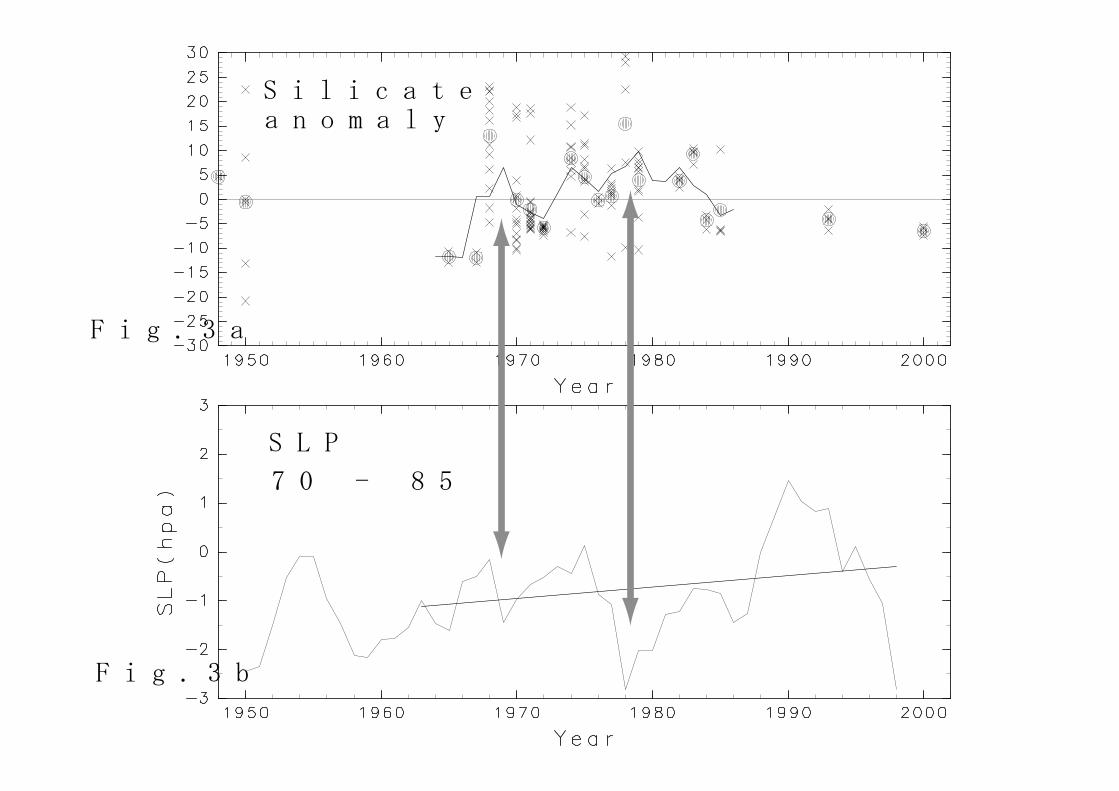
The negative correlation implies that less silicate, which represents the upward shift of the
water column, occurred with a more intense Polar Vortex or the positive AO. A schematic view is
presented in Fig.4: i.e., a more intense Polar Vortex induces the outward Ekman flux in the Canada
Basin, and hence, Ekman divergence leading to an upward motion in the upper ocean. As the
correlation coefficients are quite similar between 0-year lag and 1-year lag from the SLP to silicate,
this response is reflected quickly.
The response is evaluated quantitatively. The 70/85 SLP variability has a range of 2 hPa
(Fig.3b), which is equivalent to the spatial feature associated with the mean SLP over the Canada
Basin, as shown by Kwok (2000). The mean state contains clockwise geostrophic winds of about
10 m s-1. On the estimate of the mean and variable wind stresses being 0.1 Pa over the Canada
Basin, the Ekman flux has a variability of 1 m2 s-1. Here, it is assumed that wind stresses almost
fully penetrate to sea water with minor effects of ice internal stresses. Assuming that the Ekman
flux occurs over a 2000-km distance, a vertical motion would be about 20 m per a year. The
silicate anomaly ranges in 5 µmol kg-1 (Fig.3a), which corresponds to a 25-m depth range on the
vertical gradient in Fig.1. Thus, the observed amplitude of the silicate anomaly at 200-m depth
can be explained by the SLP anomaly continuous for a 1-year period.
4. Discussion
In summary, the Russian hydrochemical data collected from the Arctic Basin have been used
to provide useful information on ocean interior variabilities. Silicate is used for showing the
boundary between the near surface Arctic Water and the Atlantic Water in the Canada Basin.
The silicate distribution, which has a maximum at around 100-m depth, is assumed to act as a
passive tracer. The vertical gradient below 100 m provides information on the upper-layer water
column at a decadal time scale. The column shifted upward (downward) at the order of 20 m, as
realized by silicate reduction (increase) of the order of 5 µmol kg-1 at 200-m depth, responding to a
stronger (weaker) Polar Vortex or the positive (negative) phase of the Arctic Oscillation.
Previous studies have relied on the more recent data collected in a decadal period (e.g., Steele
and Boyd, 1998; Smethie et al., 2000). The hydrochemical data used in this study are extended
over three decades in prior to the modern data sets. On the other hand, the data have shortcomings
in relation to a larger possible size of errors due to the colorimetric method at most 2 µmol kg-1
(Hydrochemical Atlas, 2001). However, a careful quality control carried out by the experts
(Hydrochemical Atlas, 2001) and the large temporal variability up to 10 µmol kg-1 enable us
to draw the reliable insight.
In this paper, no modeling result is shown, although such a model result would definitely be
useful. Further studies are suggested in order to compare this new data set and a coupled
ice-ocean model with atmospheric forcing so that a deeper understanding may be achieved on
decadal and longer-term variabilities of the ocean interior in the Arctic Ocean. A sensible method
would involve the usage of a numerical model for reconstructing the ocean interior variability over
several decades and verifying model results against the hydrochemical data. Once the model
results agree with the data, we can rely on the model with more confidence.
The aspect which we have not yet considered in the present study concerns the biological
modification of geochemical fields. Possible biological effects include input of silicate from the
Siberian Shelves and biological production under the permanent ice cover. These two
mechanisms should play key roles to maintain the mean silicate structures in the Canada Basin, and
influence seasonal and interannual variabilities. Once we look into more detailed depth-dependent
variabilities of various geochemical components, we could expect to separate these biological
effects from characteristics of a passive tracer.
Acknowledgment
We are grateful to N. Tanaka, Y. Watanabe, S. Shutilin and K. Shimada for fruitful discussion.
The work was supported financially through The Category 7 of MEXT (Ministry of Education,
Culture, Sports, Science and Technology) RR2002 (Research Revolution 2002) Project for
Sustainable Coexistence of Human, Nature and the Earth, Frontier Research System for Global
Change.
References
Hydrochemical Atlas of the Arctic Ocean, 2001: Published by State Research Center of the Russian
Federation-the Arctic and Antarctic Research Institute of the Russian Federal Service for
Hydrometeorology and Environmental Monitoring, St. Petersburg and International Arctic Research
Center, University of Alaska, Fairbanks, pp.50.
Kwok, R., 2000: Recent changes in Arctic Ocean sea ice motion associated with the North Atlantic
Oscillation. Geophys. Res. Lett., 27, 775-778.
NOAA Atlas NESDIS52, 2002: World Ocean Atlas 2001, Edited by S. Levitus, Published by U.S.
Department of Commerce, Silver Spring, MD, pp.392.
Polyakov, I.V., and M.A. Johnson, 2000: Arctic decadal and interdecadal variability. Geophys. Res.
Lett., 27, 4097-4100.
Polyakov, I.V., G.V. Alekseev, L.A. Timokhov, U.S. Bhatt, R.L. Colony, H.L. Simmons, D. Walsh,
J.E. Walsh and V.F. Zakharov, 2004: Variability of the intermediate Atlantic Water of the Arctic
Ocean over the last 100 years. J. Clim., 17, 4485-4497.
Rigor, I.G., J.M. Wallace and R.L. Colony, 2002: Response of sea ice to the Arctic Oscillations. J.
Clim., 15, 2546-2663.
Smethie, W.M., P. Schlosser, G. Bonisch and T.S. Hopkins, 2000: Renewal and circulation of
intermediate waters in the Canadian Basin observed on the SCICEX 96 cruise. J. Geophys. Res.,
105, 1105-1122.
Steele, M., and T. Boyd, 1998: Retreat of the cold halocline layer in the Arctic Ocean. J. Geophys.
Res., 103, 10419-10435.
Thompson, D.W.J., and J.M. Wallace, 1998: The Arctic oscillation signature in the wintertime
geopotential height and temperature fields. Geophys. Res. Lett., 25, 1297-1300.
Wang, J., and M. Ikeda, 2000: Arctic oscillation and Arctic sea ice oscillation. Geophys. Res. Lett.,
27, 1287-1290.
Wilson, C., and D.W.R. Wallace, 1990: Using the nutrient ratio NO/PO as a tracer of continental
shelf waters in the central Arctic Ocean. J. Geophys. Res., 95, 22193-22208.
Zhang, J., D. Rothrock and M. Steele, 2000: Recent changes in Arctic sea ice: the interplay between
ice dynamics and thermodynamics. J. Climate, 13, 3099-3114.
Figures
Fig. 1 Silicate distribution (µmol kg-1) in winter along the transect from the Pacific side to the
Atlantic side through the Arctic Ocean (Hydrochemical Atlas, 2001). Note that the vertical
coordinate is stretched near the sea surface. The contour interval is 5 µmol kg-1.
Fig. 2 Temporal mean silicate distribution at 200-m depth in the Arctic Basin from the
Hydrochemical Atlas data. Small dots indicate data points. The contour interval is 5 µmol kg-1.
Fig. 3 Time series of temporal anomalies of (a) silicate at 200-m depth in the Canada Basin and (b)
Sea Level Pressure differences computed from the zonal mean along 70°N minus that along 85°N.
The 3-year Hanning filter has been applied.
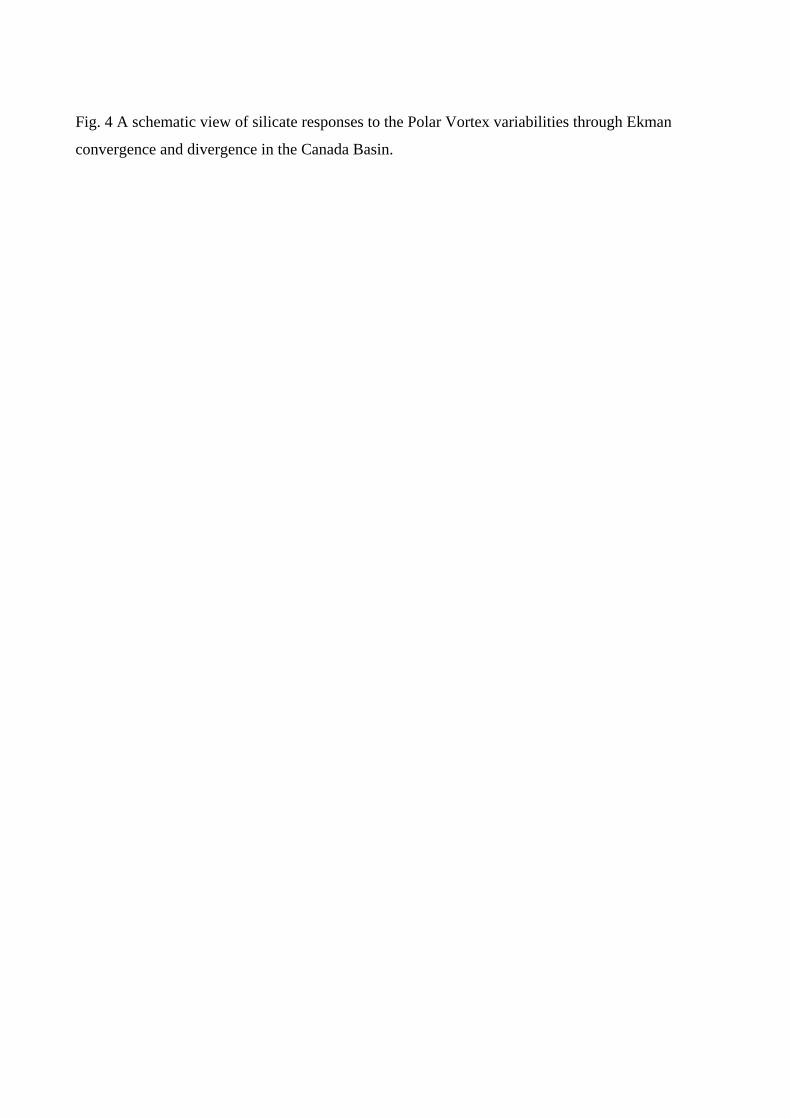
Fig. 4 A schematic view of silicate responses to the Polar Vortex variabilities through Ekman
convergence and divergence in the Canada Basin.
10
1000
0
0
200
100 200 300
65°50,N168°52,W
80°55,N0°36,E
Fig.1
10
2030
1020
Pacific Atlantic
200m-depth
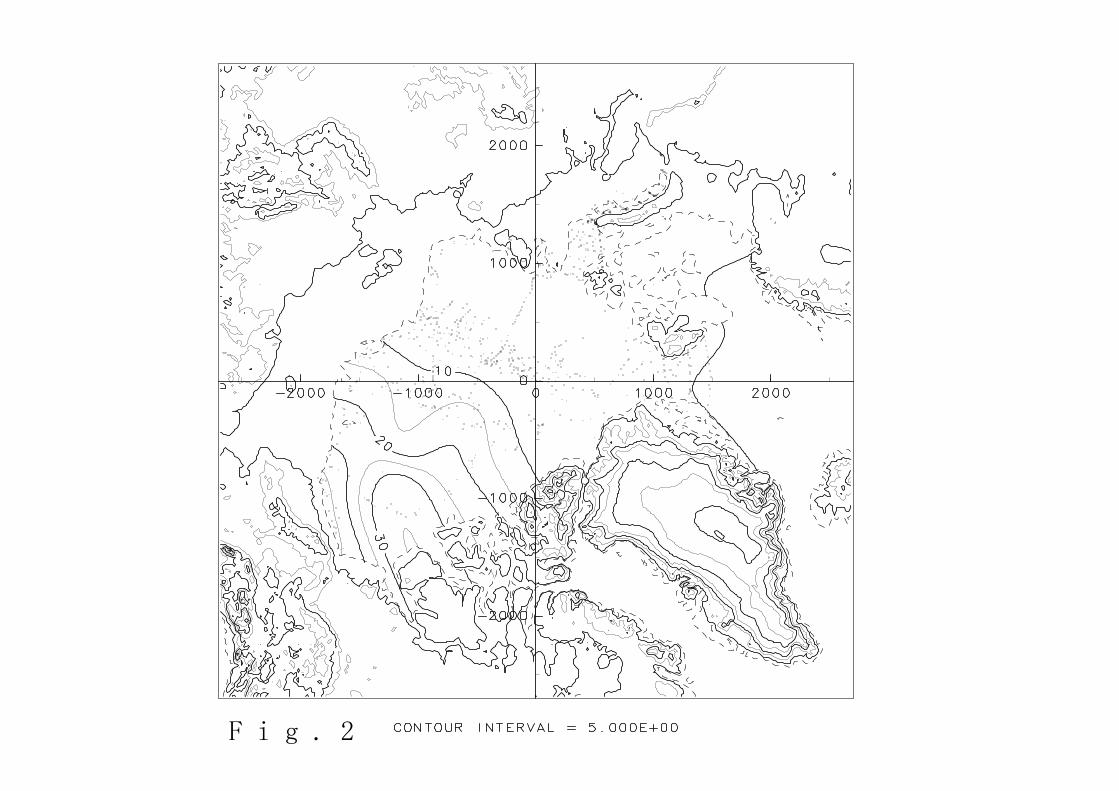
Fig.2
Silicateanomaly
SLP
70°- 85°
Fig.3a
Fig.3b
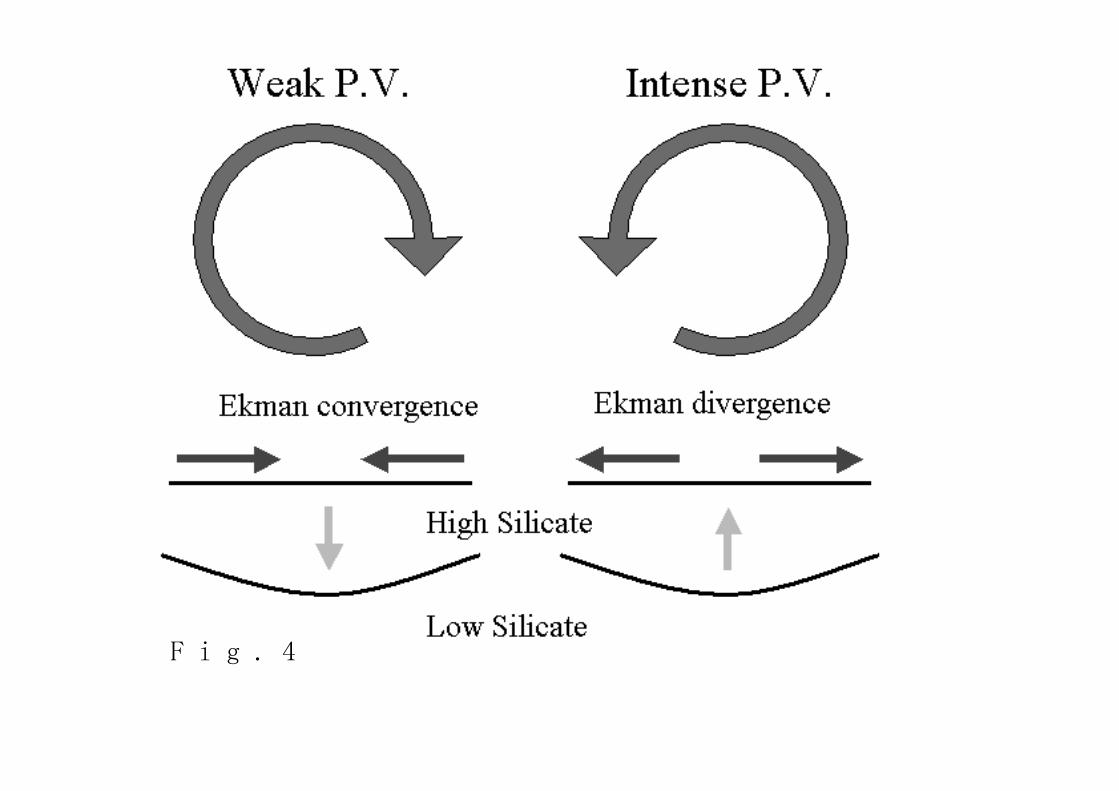
Fig.4