Embed Size (px)
Citation preview

October 25, 2016
Debut of the 2016–2017 HR Systems Survey Results
19th Annual EditionEuropean Breakouts

EmployeesService & Solution AreasApplication Services
Business Intelligence
Host & Managed Services
Infrastructure Services
Integration & Cloud Solutions
Research
Strategy
Training
Delivering industry-focused client success by providing consulting, technical, and managed services
for the deployment, management and optimization of next-generation applications and technology.
Industry FocusCommercial
Healthcare
Higher Education
Public Sector
Justice & Public Safety
Sierra-Cedar Fast Facts
Years of Leading
HR Systems Survey &
Thought Leadership
7 19 950+
5
2
Consulting
Projects
1,500+
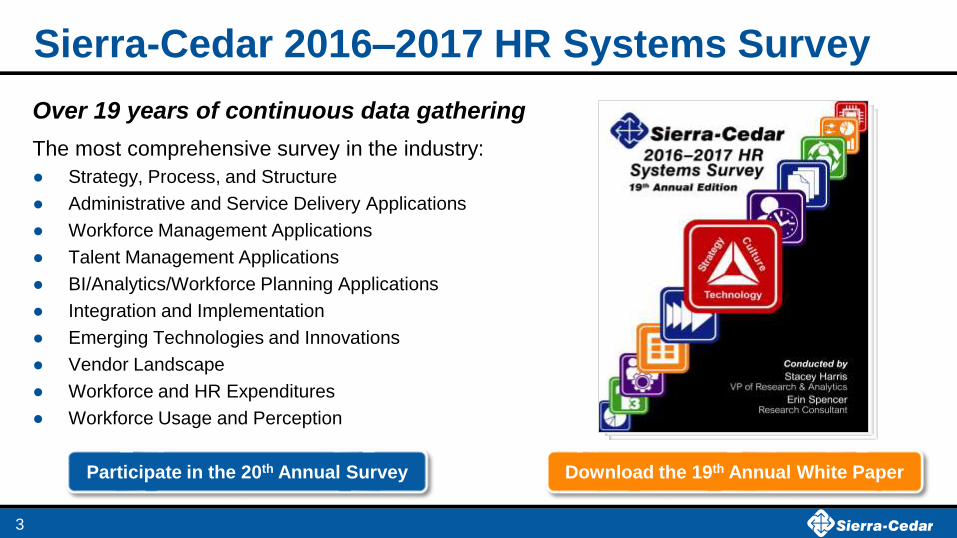
Sierra-Cedar 2016–2017 HR Systems Survey
Over 19 years of continuous data gathering
The most comprehensive survey in the industry:
● Strategy, Process, and Structure
● Administrative and Service Delivery Applications
● Workforce Management Applications
● Talent Management Applications
● BI/Analytics/Workforce Planning Applications
● Integration and Implementation
● Emerging Technologies and Innovations
● Vendor Landscape
● Workforce and HR Expenditures
● Workforce Usage and Perception
Participate in the 20th Annual Survey Download the 19th Annual White Paper
3

Organization Sizes and Types
4
Data-Driven
Talent-Driven
Top Performers
AggregateSmall<2,500
Medium2,500–10,000
Large10,000+

High TechHealthManu-
facturing
Sierra-Cedar 2016–2017 HR Systems SurveyDemographics: All Respondents
5
Trans./Comm.
Utilities
Higher EdFinance Retail Ag. Mining.
Const.
16% 15% 14% 14%11%
9% 8% 7% 7%
Other
20.6 Million Employees/Contingents
1,528Organizations
Industries
56%
21%
23%
Avg. number of Employees = 13,551

High TechHealthManu-
facturing
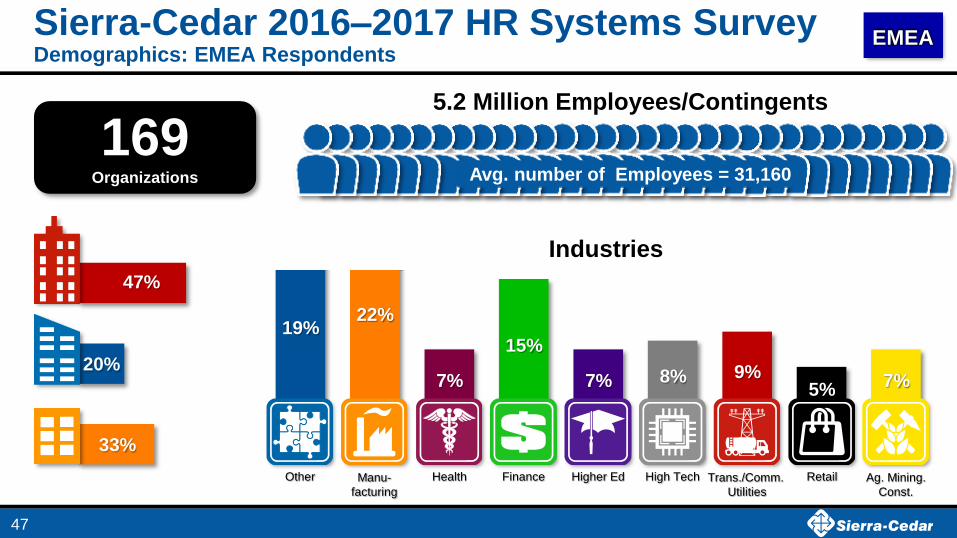
Sierra-Cedar 2016–2017 HR Systems SurveyDemographics: EMEA Respondents
6
Trans./Comm.
Utilities
Higher EdFinance Retail Ag. Mining.
Const.
19%22%
7%
15%
7% 8% 9%5%
7%
Other
5.2 Million Employees/Contingents
Avg. number of Employees = 31,160
169Organizations
Industries
33%
20%
47%
EMEA
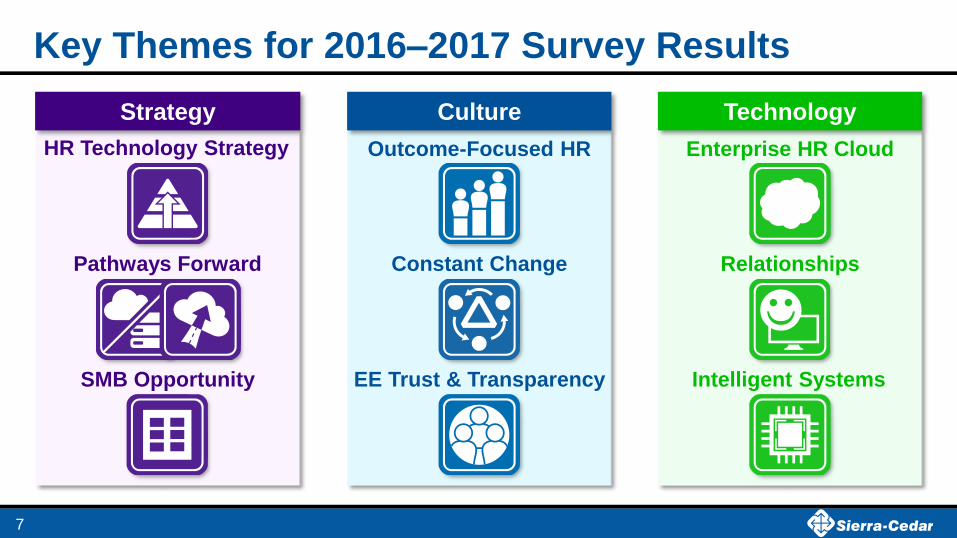
CultureStrategy Technology
Key Themes for 2016–2017 Survey Results
Relationships
HR Technology Strategy
SMB Opportunity
Enterprise HR Cloud
EE Trust & Transparency
Pathways Forward
Intelligent Systems
Outcome-Focused HR
7
Constant Change
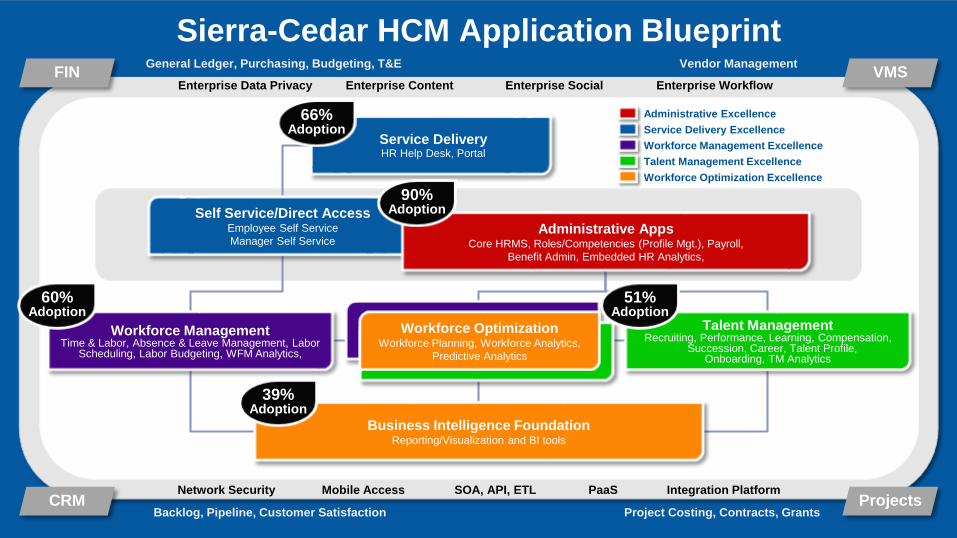
Backlog, Pipeline, Customer Satisfaction
General Ledger, Purchasing, Budgeting, T&E Vendor Management
Project Costing, Contracts, GrantsProjects
FIN
CRM
VMS
Talent Management Excellence
Service Delivery Excellence
Administrative Excellence
Workforce Management Excellence
Workforce Optimization Excellence
SOA, API, ETL
Enterprise Content Enterprise Workflow
Network Security
Enterprise Social
Mobile Access Integration Platform
Workforce OptimizationWorkforce Planning, Workforce Analytics,
Predictive Analytics
Service DeliveryHR Help Desk, Portal
Self Service/Direct AccessEmployee Self Service
Manager Self Service
Workforce ManagementTime & Labor, Absence & Leave Management, Labor
Scheduling, Labor Budgeting, WFM Analytics,
Talent ManagementRecruiting, Performance, Learning, Compensation,
Succession, Career, Talent Profile, Onboarding, TM Analytics
Business Intelligence FoundationReporting/Visualization and BI tools
Administrative Apps Core HRMS, Roles/Competencies (Profile Mgt.), Payroll,
Benefit Admin, Embedded HR Analytics,
Sierra-Cedar HCM Application Blueprint
66%Adoption
90%Adoption
60%Adoption
51%Adoption
39%Adoption
PaaS
Enterprise Data Privacy

72%
87%
91%
91%
55%
71%
65%
67%
66%
70%
59%
59%
39%
54%
48%
51%
32%
44%
35%
39%
28%
32%
33%
36%
Application Adoption Levels by Region
WFMService DeliveryAdmin SocialBI/AnalyticsTM
9
USA
CAN
APAC
EMEA

Top 4 Major HR Initiatives By RegionEveryone is Investing 25% or More of Their Time and Resources Here
64%
41% 41%38%
66%
40% 39% 37%
Bus. Procimprovement
HR SystemsStrategy
TalentManagement
ServiceDelivery
WorldwideAverage EMEA

41%
32%
13%
14%
Updated Regularly In Development Updated Rarely No Plans
33%
27%
10%
30%
2016 HR Systems Strategy By Region
11
HR Systems Strategies Increases Value to BusinessOrganizations with a Regularly Updated HR Systems Strategy are twice as
likely to be viewed by all levels of management as contributing strategic
value, versus organizations that have no HR Systems Strategy.
2X
WorldwideAverage EMEA

Remaining Top 10 HR Initiatives By RegionNoticing What Makes Them Different
n=1,528
34%
20% 19% 18% 17% 17%
Bi/WorkforceMetrics
HR AppsIntegration
WorkforceManagement
WorkforcePlanning
All SystemsIngegration
SocialEnablement
32% 32%27% 24% 22% 22%
BI/WorkforceMetrics
Expanding toGlobal HRMS
HR AppsIntegration
SocialEnablement
ReplacingHRMS
MobileEnablement
WorldwideAverage
EMEA
Service Delivery
Core HR
Payroll
Recruiting
Onboarding
Performance
Learning & Skills
Succession
HR Analytics
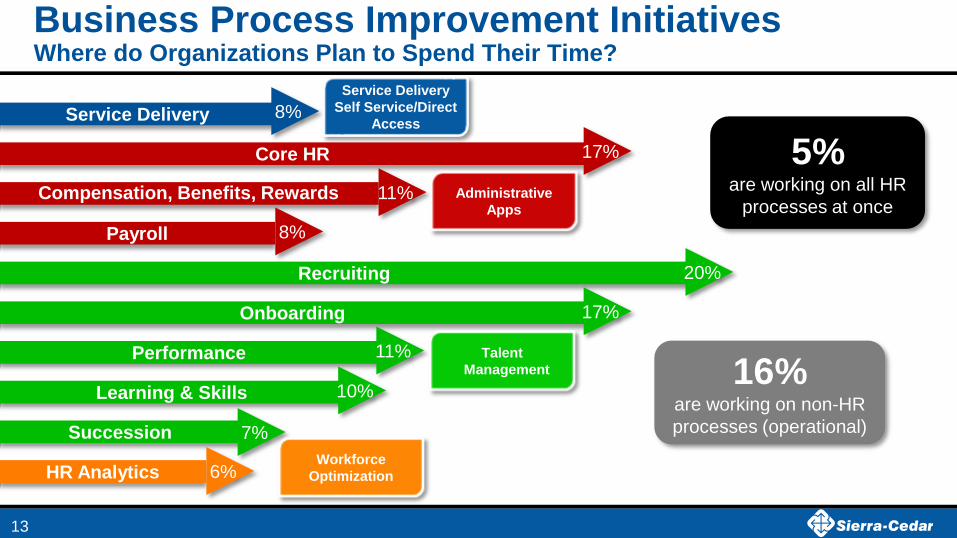
Business Process Improvement InitiativesWhere do Organizations Plan to Spend Their Time?
13
7%
8%
17%
8%
20%
17%
11%
11%
10%
6%
5%are working on all HR
processes at once
16%are working on non-HR
processes (operational)
Compensation, Benefits, Rewards Administrative
Apps
Talent
Management
Workforce
Optimization
Service Delivery
Self Service/Direct
Access

2016–2017 HR Tech Spending Trends OutlookOutside the US Spending Increases Continue
6%
6%
10%
7%
39%
39%
43%
54%
56%
55%
47%
39%
2016–2017 Regional HR Technology Spending Plans
Increase DecreaseStay the Same
USA
CAN
APAC
EMEA

10% 7% 10% 7% 6% 5% 7% 8% 4% 3% 5%14% 15% 12% 16% 16%
21% 23% 23%29% 33% 37%
Payroll HRManagement
HR Generalist HR BusinessPartner
Benefits WorkforceManagement
HR ITInfrastructure
HR SystemSupport
TalentManagement
HR DataAnalytics
Learning &Development
IncreaseDecrease
Tomorrow’s HR is More Focused and AnalyticalWhat HR roles does your organization plan to increase or decrease this year?
15
24%
13%
23%16%
11% 10%18% 17%
6% 3%10%10%
25%
13%21% 20% 23%
32% 33%41% 45%
39%
Payroll HRManagement
HR Generalist HR BusinessPartner
Benefits WorkforceManagement
HR ITInfrastructure
HR SystemSupport
TalentManagement
HR DataAnalytics
Learning &Development
EMEA
WorldwideAverage

2016 The Enterprise HR Cloud ConversationExpectations are High That On Premise HRMS’s Will Decline
16
52%
43%
54%
31%
44%
35%
38%
24%
On-Premise
72%
63%
59%
50%
66%
51%
53%
41%
TM Cloud
HRMS Cloud
Payroll Cloud
WFM Cloud
SaaS/Cloud
70%
64%
81%
38%
60%
52%
59%
28%
On-Premise
68%
62%
41%
35%
57%
32%
35%
21%
TM Cloud
HRMS Cloud
Payroll Cloud
WFM Cloud
SaaS/Cloud
12 MonthsToday12 MonthsToday
WorldwideAverage
EMEA

HybridsMove ONLY TM or WFM apps to Cloud
Rip & ReplaceMove everything all at onceto the Cloud
Parallel/PatchworkCombination Licensed and Cloud Solutions
Hosting/OutsourceSingle Tenant, or BPO
Multiple Pathways to an HR Tech TransformationTodays State of Replacing HR Technology in EMEA
17
ReactiveFocused
Hig
h R
isk
Lo
w R
isk
Current State60%
more Rip & Replace
in Aggregate
Data
WorldwideAverage

Multiple Pathways to an HR Tech TransformationFuture State of EMEA Replacing HR Technology
Future Plans
ReactiveFocused
Hig
h R
isk
Lo
w R
isk
HybridsMove ONLY TM orWFM apps to Cloud
Rip & ReplaceMove everything allat once to the Cloud
PatchworkReplace asLicense Ends
Hosting/OutsourceSingle Tenant, or BPO
ParallelCombo Licensedand Cloud Solutions

EMEA Plans For Replacing HR Technologies40% of Organizations are planning to replace or evaluating options
19
49%
24% 26%
66%
12%
22%
61%
16%24%
56%
17%
27%
4XMore likely to replace a
vendor if User Experience
Score is low
19
WFM SuitePayrollHRMS TM Suite
Replace in
12–24 MonthsNo Change Evaluating
25%less likely to be
evaluating options
now
Worldwide
Average

17%
58%
12%
13%0%
17%
58%
12%
13%0%
11%
61%
13%
11%
4%
8%
53%25%
10%4%
Payroll Meets Our Needs…
HRMS Meets Our Needs…
WFM Meets Our Needs…
TMS Meets Our Needs…
Does the Technology Meet Your Current Needs?EMEA, 50% More Believe Payroll Never or only Sometimes Meets Needs
20
Always Most Times
½ Time Sometimes Never
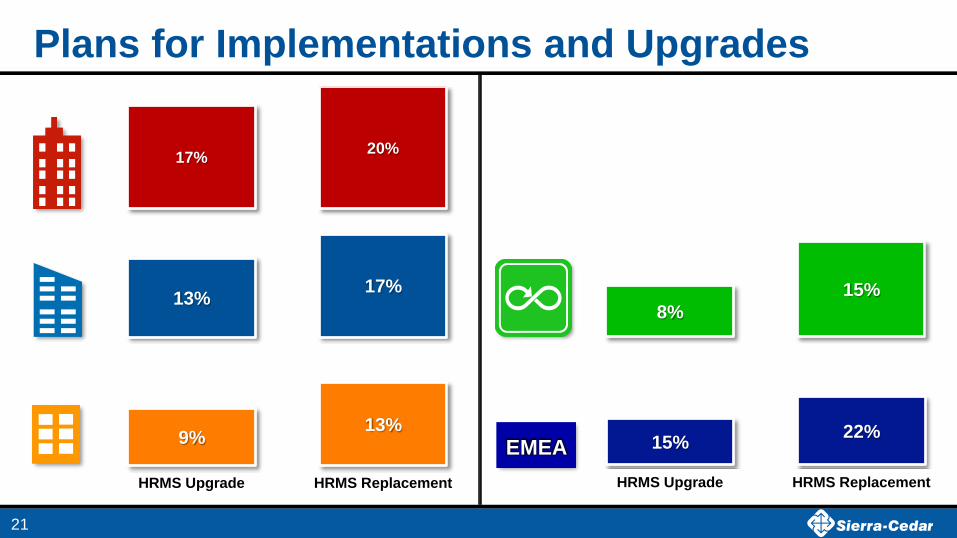
Plans for Implementations and Upgrades
21
17%20%
13%17%
9%13%
HRMS Upgrade HRMS Replacement
8%
15%
15%22%
HRMS Upgrade HRMS Replacement
EMEA

HRMS Adoption By Size
22
1%
1%
2%
4%
5%
10%
12%
9%
7%
10%
22%
16%
31%
0%
2%
2%
4%
7%
7%
8%
9%
11%
15%
15%
22%
34%
Paycor
ADP (WN)
Ceridian Dayforce
UltiPro
Infor Cloud/Lawson
Oracle (HCM Cloud)
SuccessFactors (EC)
Oracle (EBS/JD)
ADP (GV/V)
Kronos WFC WFR
Workday
SAP (HCM)
Oracle (PS)
Today 12 months
1%
2%
5%
9%
7%
10%
5%
6%
10%
7%
24%
2%
25%
1%
3%
5%
6%
7%
5%
4%
9%
12%
11%
18%
4%
27%
Today 12 months
12%
15%
6%
13%
3%
2%
4%
3%
18%
5%
15%
3%
6%
12%
15%
5%
12%
2%
2%
2%
3%
18%
5%
11%
3%
7%
Today 12 months

HRMS Adoption– EMEA
23
1%
3%
2%
3%
3%
10%
6%
11%
21%
12%
16%
19%
1%
3%
2%
2%
4%
7%
8%
8%
16%
14%
17%
26%
Epicor
Ceridian Dayforce
Meta4
UltiPro
Kronos (Combined)
Oracle (HCM Cloud)
Oracle (EBS/JD)
Workday
SuccessFactors (EC)
ADP (WN/GV/Vantage)
Oracle (PS)
SAP (HCM)
Today 12 months

Ve
nd
or
Sa
tis
fac
tio
n
User Experience
Good Enough
Zone
We Expect More!
Zone
24
Workday
Ceridian DF
UltiPro
SF (EC)
Oracle
(HCM C)
SilkRoad
Kronos
WFC
Oracle PS
ADP
(WN)
Infor/Lawson
SAP (HCM)
Oracle EBSADP (V)
ADP GV/E
Paycor
Kronos WFR
SumTotal SS
Administrative
Good Excellent
Dis
sati
sfi
ed
Very
Sati
sfi
ed
Poor
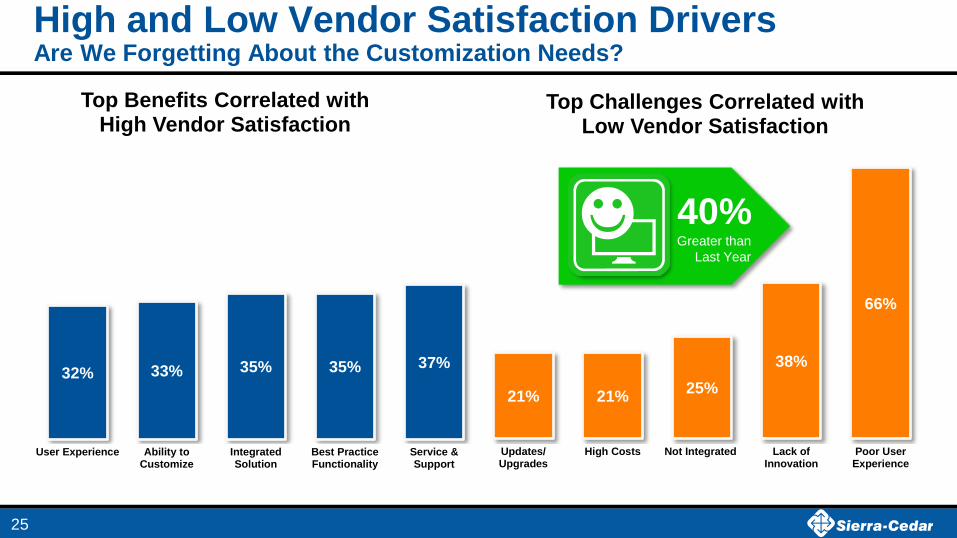
High and Low Vendor Satisfaction DriversAre We Forgetting About the Customization Needs?
25
32% 33% 35% 35% 37%
User Experience Ability toCustomize
IntegratedSolution
Best PracticeFunctionality
Service &Support
Top Benefits Correlated with High Vendor Satisfaction
21% 21%25%
38%
66%
Updates/Upgrades
High Costs Not Integrated Lack ofInnovation
Poor UserExperience
Top Challenges Correlated with Low Vendor Satisfaction
40%Greater than
Last Year

Payroll Adoption By Size
26
0%
1%
2%
3%
3%
4%
4%
3%
4%
4%
5%
7%
12%
19%
17%
23%
0%
1%
1%
2%
3%
3%
3%
4%
5%
5%
8%
8%
8%
17%
17%
28%
Paycor
SuccessFactors (EC)
NG HR (Preceda/Moore)
Oracle (HCM Cloud)
Ceridian Dayforce/HR
Ultipro
HR BPO (NG, Aon, Infosys)
Kronos WFR
ADP (Vantage)
Infor/Lawson
ADP (WN)
Oracle (EBS/JD)
Workday
SAP (HCM)
ADP (GV)
Oracle (PS)
Today 12 months
1%
1%
1%
2%
8%
10%
1%
3%
8%
2%
3%
2%
18%
3%
8%
21%
1%
0%
1%
7%
7%
1%
4%
7%
4%
3%
3%
12%
4%
7%
21%
Today 12 months
18%
1%
0%
2%
8%
15%
1%
4%
5%
2%
22%
0%
10%
2%
3%
4%
17%
0%
0%
1%
7%
13%
0%
5%
4%
2%
21%
1%
7%
2%
3%
5%
Today 12 months

Payroll Adoption – EMEA
27
1%
1%
3%
3%
2%
3%
2%
4%
4%
4%
5%
5%
1%
5%
7%
12%
10%
22%
26%
1%
1%
1%
1%
1%
1%
2%
2%
3%
3%
3%
3%
4%
5%
5%
7%
8%
12%
22%
Unit 4
Epicor
Workday
Ceridian Dayforce
Aggregators…
HRO/BPO
Raet
Ramco
Oracle (HCM Cloud)
Ultipro
SuccessFactors (EC)
ADP (Vantage)
CeridianHR
Oracle (EBS/JD)
NGA HR (P/M/R)
ADP (WN)
Oracle (PS)
ADP (GV)
SAP (HCM)
Today 12 months

Higher Cloud Adoption = More Needs Met?
28
31%24%
20% 21%17%
8% 9% 8%
Payroll HRMS WFM TMS
Our HR Systems Always Meets Our Needs
High Cloud Low Cloud
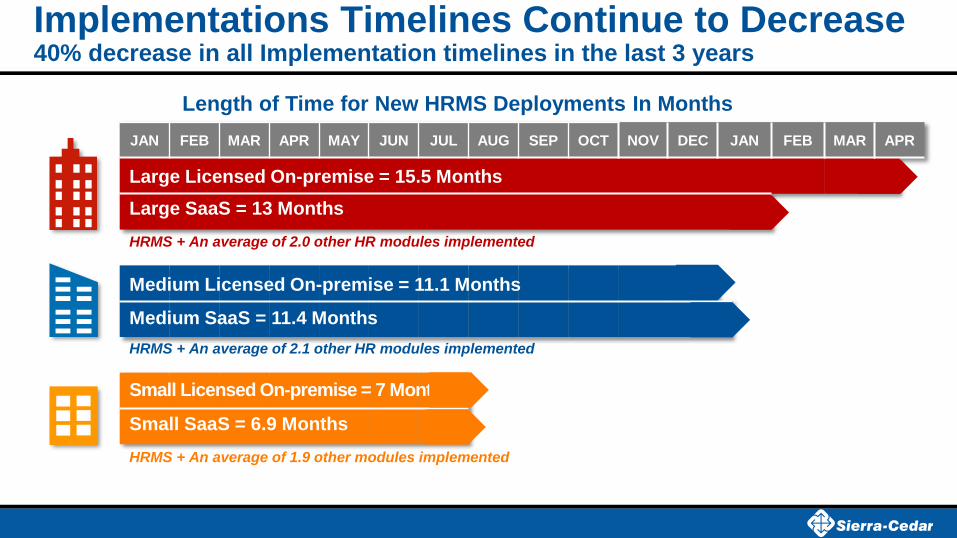
JAN FEB MAR APR MAY JUN JUL AUG SEP OCT NOV DEC JAN FEB MAR APR
Implementations Timelines Continue to Decrease40% decrease in all Implementation timelines in the last 3 years
Length of Time for New HRMS Deployments In Months
Large Licensed On-premise = 15.5 Months
Large SaaS = 13 Months
Medium Licensed On-premise = 11.1 Months
Medium SaaS = 11.4 Months
Small SaaS = 6.9 Months
HRMS + An average of 2.0 other HR modules implemented
HRMS + An average of 2.1 other HR modules implemented
HRMS + An average of 1.9 other modules implemented
Small Licensed On-premise = 7 Months
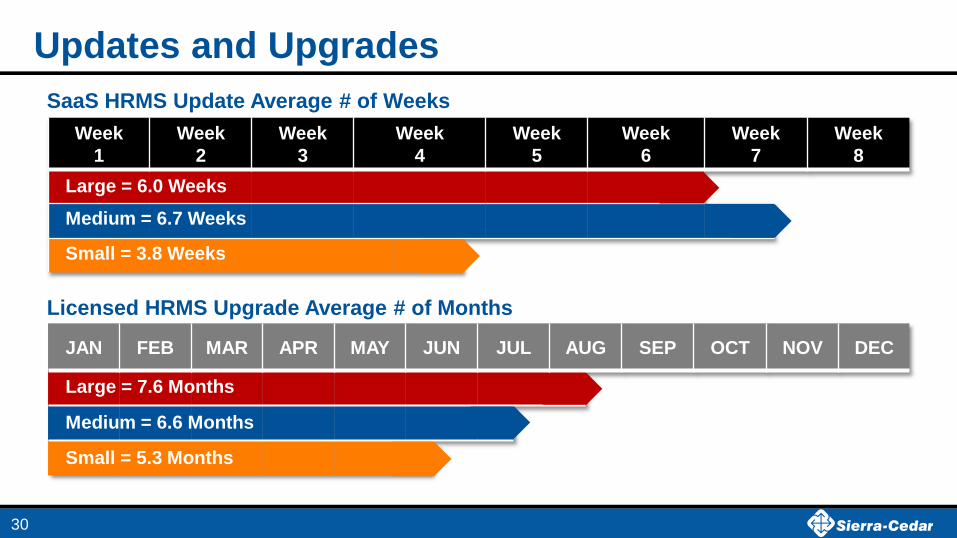
Updates and Upgrades
SaaS HRMS Update Average # of Weeks
Week
1
Week
2
Week
3
Week
4
Week
5
Week
6
Week
7
Week
8
Large = 6.0 Weeks
Medium = 6.7 Weeks
Small = 3.8 Weeks
JAN FEB MAR APR MAY JUN JUL AUG SEP OCT NOV DEC
Large = 7.6 Months
Medium = 6.6 Months
Small = 5.3 Months
Licensed HRMS Upgrade Average # of Months
30

2016 Change Management Practices By RegionEMEA Better Prepared for Cloud with Change Management Practices
33%
34%
25%
8%
Consistent culture of change mangement Key projects that meet criteria Sporadically, with no criteria Never
31
27%
38%
27%
8%
Change Management Increases Strategic Value of HROrganizations with a Culture of Change Management are twice as likely to
be viewed by all levels of management as contributing strategic value,
versus organizations that never use change management.
4X
WorldwideAverage EMEA

35%43%
65% 47%
EMEA Aggregate
Enterprise Integration Strategy?
2016 Integration Strategies MatterIn Implementation Years, Integration Costs can reach 40% of Expenditures
32
10%
5%
8%
24%
14%
39%
None
Other
Integrationplatform
Into TM Suite
Into core HR
Case by Case
EMEA Approach to Integrating HR Technology
38%Spend 10–25% of
their HR Technology
budgets on
Integration
Yes or Developing No Strategy/Unknown

Data Privacy & Protection StrategiesIn EMEA only 40% of Organizations Feel Prepared in this Area?
10%
30%
46%
15%
EMEA Data Privacy Process Maturity
Transformational
Effective
Efficient
Noprocess/Manual
High Cloud
21%more likely to be
confident in Data
Privacy processes
EMEA

What Is HR Analytics?
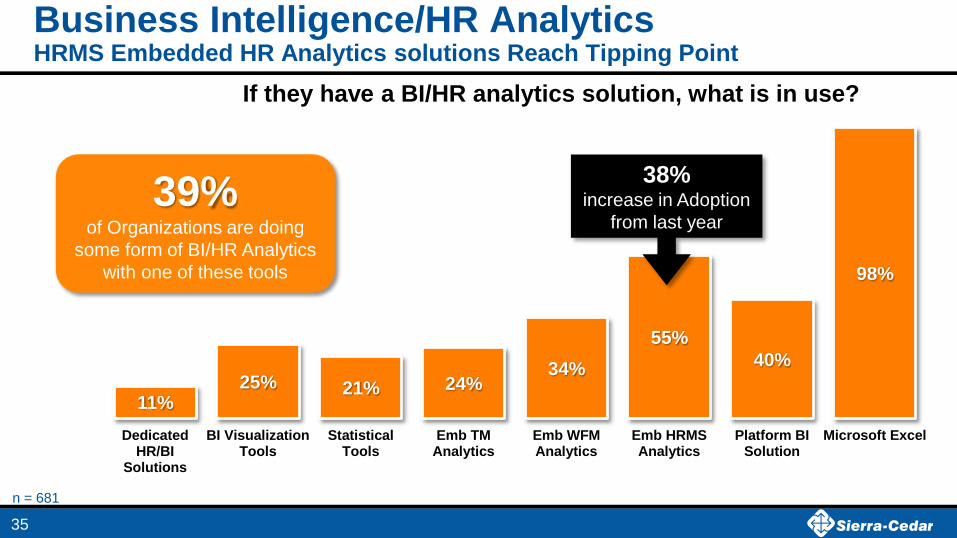
Business Intelligence/HR AnalyticsHRMS Embedded HR Analytics solutions Reach Tipping Point
11%25% 21% 24%
34%
55%
40%
98%
DedicatedHR/BI
Solutions
BI VisualizationTools
StatisticalTools
Emb TMAnalytics
Emb WFMAnalytics
Emb HRMSAnalytics
Platform BISolution
Microsoft Excel
If they have a BI/HR analytics solution, what is in use?
39%of Organizations are doing
some form of BI/HR Analytics
with one of these tools
38%increase in Adoption
from last year
n = 681
35

Workforce Planning RealitiesRip & Replace Orgs More Likely to Conduct Enterprise Workforce Planning
30%23% 21% 19% 18%
Rip &Replace
Hosting Parallel Hybrid Patchwork
Enterprise Workforce Planning
36
66%More Likely
22%of all organizations are conducting
Enterprise Workforce Planning
Workforce Planning
Approaches

Modern HR Changes EverythingRethink Implementations, Change Management, and Cost Assumptions
37
Traditional OnPremise World Modern Cloud World
=/< 25% implementation done by SIs
takes 25% longer and costs more
=/> 60% implementation done by SIs
is 20% faster & within budget
Licensed 2X more likely to conduct BPI efforts
before Implementation Work vs SaaS
8% lower UE and VS scores
10% lower Business Outcome averages
4X more likely to be viewed as contributing
strategic value to their organizations
SI’s Extra Hands & Extra Work SI’s Strategic Partners
Negotiate Lowest Cost Negotiate Better Relationships
Project-Based Change Management Continuous Change Management
Cloud Tech, 1½X more likely to
Always Meet Needs
IT = 8%, Ops = 9%, HR = 15%
% Expenditures & Budgets Allocated % Expenditures & Budgets Allocated
IT = 7%, Ops = 5%, HR = 24%

2016 Business Systems: On the Move to Cloud25% Increase in Organizations Evaluating Cloud Solutions from Last Year
38
31%
17%
17%
17%
15%
7%
7%
5%
10%
8%
14%
17%
15%
21%
19%
48%
59%
63%
52%
58%
Sales/CRM
OperationsSystems
MarketingSystems
FinancialSystems
VendorMgmt
Non-HR Systems in the Cloud Today?
Cloud in 12–24 Months EvaluatingCloud today No Plans
38%
13%
19%
16%
13%
7%
8%
6%
4%
8%
21%
17%
26%
23%
23%
34%
62%
49%
58%
57%
Sales/CRM
OperationsSystems
MarketingSystems
FinancialSystems
VendorMgmt
WorldwideAverage EMEA

Worldwide
Average
Mobile-enabled HR Process Adoption Overall Mobile Adoption Has Doubled in the Last Three Years
39%47%
Organizations that UseMobile-enabled HR Technology
39
2016 12 Months
33%40%
Organizations that UseMobile-enabled HR Technology
2016 12 Months
EMEA
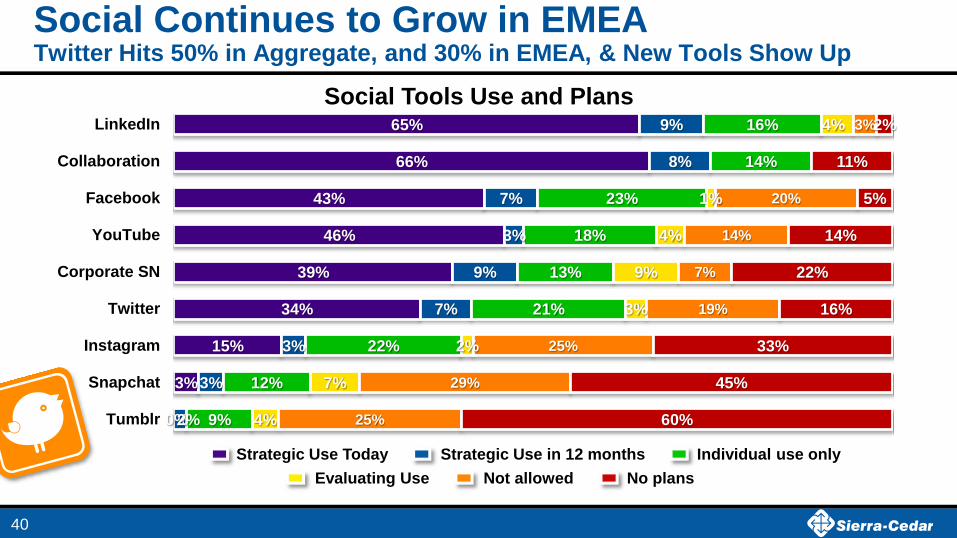
Social Continues to Grow in EMEATwitter Hits 50% in Aggregate, and 30% in EMEA, & New Tools Show Up
40
Strategic Use in 12 months
No plansNot allowedEvaluating Use
Strategic Use Today Individual use only
0%
3%
15%
34%
39%
46%
43%
66%
65%
2%
3%
3%
7%
9%
3%
7%
8%
9%
9%
12%
22%
21%
13%
18%
23%
14%
16%
4%
7%
2%
3%
9%
4%
1%
4%
25%
29%
25%
19%
7%
14%
20%
3%
60%
45%
33%
16%
22%
14%
5%
11%
2%
Tumblr
Snapchat
Corporate SN
YouTube
Collaboration
Social Tools Use and Plans

Strategic Social Technology Use by GenerationsOne of the Only Areas Where Differences Show Up in Technology Adoption
71%
64% 65%
55%
48%
42%
35%
11% 5%
Older Workforce Equal Generations Younger Workforce
41

Ve
ry
Va
lua
ble
No
Va
lue
So
me
Va
lue
The Value Placed On Emerging Tech FeaturesEMEA Values Them More Than Aggregate
42
Voice Interface Robotics/Artificial Intelligence
Experience API Gamification/Badges
PredictiveAnalytics
EMEA
Worldwide
Average

Wrapping Up: Takeaways
Enterprise HR Systems Strategy, You Need One
Multiple Pathways to the Modern HR Tech Environment, but
Payroll and Workforce Management Solutions need addressed to
reach an Enterprise HR Cloud
Vendors and Buyers Need to Build Stronger Relationships in this
new HR Future.
Emerging Technology is about Achieving Outcomes
43

Thank you!
44

Visit Sierra-Cedar Website Get Full Survey Details and Sign Up To Participate Next Year!
45
www.Sierra-Cedar.com/annual-survey
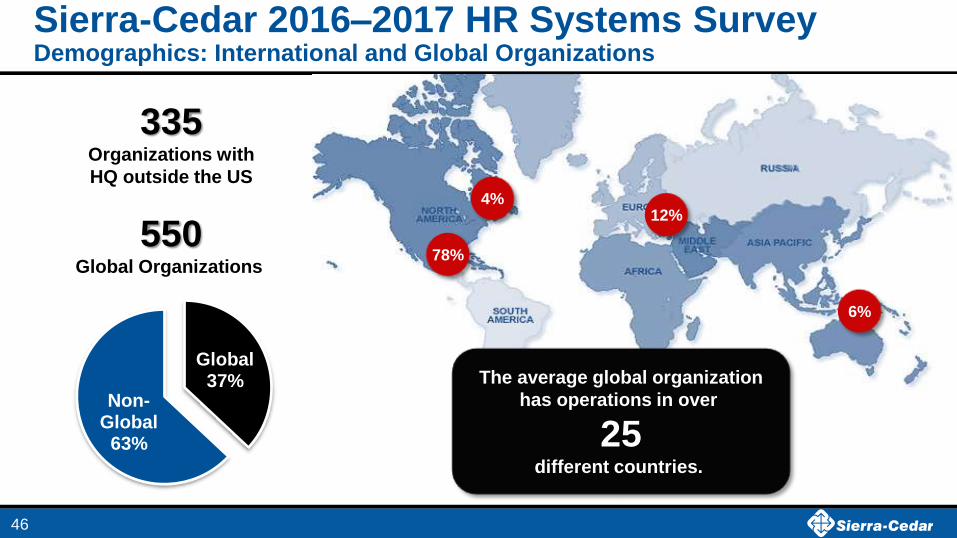
Sierra-Cedar 2016–2017 HR Systems SurveyDemographics: International and Global Organizations
78%
4%12%
6%
Global37%
Non-Global
63%
The average global organization
has operations in over
25different countries.
335Organizations with
HQ outside the US
550Global Organizations
46
High TechHealthManu-
facturing
Sierra-Cedar 2016–2017 HR Systems SurveyDemographics: EMEA Respondents
47
Trans./Comm.
Utilities
Higher EdFinance Retail Ag. Mining.
Const.
19%22%
7%
15%
7% 8% 9%5%
7%
Other
5.2 Million Employees/Contingents
Avg. number of Employees = 31,160
169Organizations
Industries
33%
20%
47%
EMEA

Survey Methodology
Sierra-Cedar follows rigorous standards in the form of a nine-step survey
methodology, independently validated in 2011 by the Mercer Survey Quality
group. Each year, this annual reach provides a wealth of knowledge that is
shared openly with the HR systems community. All participants are kept strictly
anonymous, and only aggregate data is used.
48
Stacey HarrisVice President Research and Analytics, Sierra-Cedar
Background:
● Oversee the Annual HR Systems Survey and its safekeeping for the Industry
● HR and OE Practitioner for over 10 years in finance, retail, and franchised businesses.
● Director of Research at Bersin & Associates, Launched the HR research practice
● VP of Research for Brandon Hall Group
● Major Research and Papers: The High Impact HR Organization, The HR Framework, Employee Engagement: A Changing
Marketplace, and Relationship Centered Learning
● Feel free to connect at: www.linkedin.com/in/staceyharris
● @StaceyHarrisHR

Metrics tell such a great story and are fabulous for supporting proposed
initiatives. The data provided underscored what we have been hearing and
seeing as trends in HR—especially as they relate to social media.
Leslie KrugHRIT
Why Organizations Participate?
● To obtain a personalized benchmarking snapshot filtered by size, region, or industry
● They like conducting a review of their own enterprise HR system environment annually
● They need data to build their own HR Technology strategy or business case for change
● They believe it is important to support the broader HR technology community
50