Embed Size (px)
Citation preview
Debt and reservesmanagement report
2008-09
March 2008

March 2008
Debt and reservesmanagement report
2008-09
© Crown copyright 2008
The text in this document (excluding the Royal Coat of Armsand departmental logos) may be reproduced free of chargein any format or medium providing that it is reproducedaccurately and not used in a misleading context. The materialmust be acknowledged as Crown copyright and the title ofthe document specified.
Any enquiries relating to the copyright in this documentshould be sent to:
Office of Public Sector InformationInformation Policy TeamSt Clements House2-16 ColegateNorwichNR3 1BQFax: 01603 723000e-mail: [email protected]
HM Treasury contacts
This document can be found on HM Treasury’s website at:
www.hm-treasury.gov.uk
For general enquiries about HM Treasury and its work, contact:
Correspondence and Enquiry UnitHM Treasury1 Horse Guards RoadLondonSW1A 2HQ
Tel: 020 7270 4558 Fax: 020 7270 4861E-mail: [email protected]
Printed on at least 75% recycled paper.When you have finished with it please recycle it again.
ISBN: 978-1-84532-433-9PU220
All enquiries about this document should be addressed to:
HM Treasury
Peter SymonsDebt and Reserves Management TeamFloor 3/E2HM Treasury1 Horse Guards RoadLondonSW1A 2HQ
E-mail: [email protected]: +44 (0) 20 7270 5329
UK Debt Management Office
Tim Riddington/Gurminder BhachuUK Debt Management OfficeEastcheap Court11 Philpot LaneLondonEC3M 8UD
E-mail: [email protected]: +44 (0) 20 7862 6623
E-mail: [email protected]: +44 (0) 20 7862 6512

CO N T E N T S
Debt and reserves management report 2008-09
Page
Foreword by the Exchequer Secretary to the Treasury 3
Chapter 1 Introduction 5
Chapter 2 Size and structure of UK Government debt in 2007-08 7
Chapter 3 UK Government’s debt management policy 13
Chapter 4 UK Government’s financing programme for 2008-09 19
Chapter 5 The Debt Management Office’s financing remit for 2008-09 25
Chapter 6 The Debt Management Office’s Exchequer cash management remit for 2008-09 29
Chapter 7 National Savings & Investments’ activities in 2007-08 33
Chapter 8 National Savings & Investments’ financing remit for 2008-09 35
Chapter 9 Management of the Official Reserves in 2007-08 37
Chapter 10 The Bank of England’s Service Level Agreement for management of the Official Reserves 41
Chapter 11 Central Government’s financial asset and liability risk monitor 47
Annex A Key developments in the gilt market: April 2007 to January 2008 53
Annex B The Strategic Debt Analysis model and a comparison of debt issuance strategies 59
Annex C The Exchequer’s cash management objective and key performanceindicators and controls 65
1

FO R E W O R D BY T H E EXC H E Q U E R SE C R E TA RYT O T H E TR E A S U RY
Debt and reserves management report 2008-09
This is the fifteenth report outlining the Government’s debt management activities. It also includesdetails of the management of the Official Reserves by the Bank of England.
Gross gilt issuance in 2007-08 is projected to be £58.5 billion, a level broadly similar to that in theprevious year. Net gilt issuance is projected to be £29.3 billion. A total of 34 auctions are planned in2007-08. The structure of issuance and the gilt auction calendar reflect the Government’scommitment to the principles of transparency and predictability, to delivering its debt managementobjective and a well-functioning gilt market as well as its aim to be responsive to investor demandand the market environment. It is a testimony to the efficiency of the UK Debt Management Office(DMO), the Gilt-edged Market Makers (GEMMs) and the gilt market in general that the gilt salesprogramme has been managed so effectively to date in challenging market circumstances.
A notable development in 2007-08 has been the change in the shape of the nominal yield curve. Atthe beginning of the year, the slope of the yield curve was negative as it had been for most of thedecade. However, throughout 2007-08 the slope of the yield curve changed. The yield curve iscurrently ‘hump shaped’, that is, it is positively sloped between short and medium maturities andnegatively sloped between medium and long maturities. By contrast, the slope of the real yield curveremains distinctly negatively sloped. The change in the slope of the yield curve during the year reflectsa number of factors but is largely a reflection of developments at the short end of the curve in whichyields on short-maturity gilts have fallen significantly. By contrast, yields on long-maturity gilts havefallen less dramatically.
Against this backdrop, there has been a clear skew towards long-dated conventional and index-linkedgilts. Together, long-dated conventional and index-linked gilts are expected to account for 66 per centof all gilt issuance in 2007-08.
Net gilt issuance in 2008-09 is projected to be £62.7 billion and gross gilt issuance is projected to be£80.0 billion. This includes the impact of the refinancing of the Bank of England's loan to NorthernRock by a loan from HM Treasury to Northern Rock. The net amount outstanding of that loan as at 31 March 2009 is projected to be £14 billion. It also includes the impact of the partial repayment in2007-08 of £6 billion of the Ways and Means Advance from the Bank of England. The remit also takesinto account further repayments of up to £7 billion of the remaining balance of the Ways and MeansAdvance during 2008-09. The structure of issuance and the planned gilt auction calendar reflect theGovernment’s commitment to a well-functioning gilt market as well as its aim to be responsive toinvestor demand and the market environment.
Our annual consultation held in December 2007 with GEMMs and end-investors showed clearsupport for skewing gilt issuance toward short-maturity and long-maturity nominal gilts andcontinued high issuance of index-linked gilts. Underlying conditions in the gilt market support thesepreferences. The gilt issuance plans for 2008-09 announced today are underpinned by the medium-term approach to gilt issuance announced in Budget 2007 but are tempered by the changed marketenvironment and the change in the shape of the nominal yield curve since Budget 2007. Issuance oflong-maturity gilts will remain at the historically high levels of recent years, responding to ongoingstrong structural demand at that end of the curve. We have also responded to greatly increaseddemand at the short end of the curve by increasing planned issuance of short-maturity gilts.
3

FO R E W O R D BY T H E EXC H E Q U E R SE C R E TA RY T O T H E TR E A S U RY
In the retail sector, National Savings & Investments (NS&I) is estimated to sell more than £16.7 billionof retail products, bringing its net financing contribution for 2007-08 to an estimated £5.6 billion.2007-08 was the first year of NS&I’s five year strategy “Adding Value” which aims to deliversustainable long-term value to stakeholders by simplifying, modernising and diversifying the business.NS&I’s overall cost of financing was estimated at £353 million lower than that of comparable gilts,taking into account management costs and imputed tax foregone. Gross sales (includingreinvestments and gross accrued interest) of NS&I products are assumed to be around £15.3 billionin 2008-09. After meeting expected maturities and withdrawals, NS&I is expected to make a netcontribution to Government financing of £4.0 billion in 2008-09.
ANGELA EAGLE
Exchequer Secretary
4 Debt and reserves management report 2008-09
1 IN T R O D U C T I O N
Debt and reserves management report 2008-09
1.1 This is the fifteenth report outlining the Government’s debt management activities.
1.2 The Debt and reserves management report (DRMR) is published in compliance with
the Code for Fiscal Stability1 which requires that a debt management report be published
every year covering the following areas:
• the overall size of the gilt issuance programme for the coming financial year;
• the planned maturity structure and the proportion of index-linked and
conventional gilts;
• the gilt auction calendar; and
• a forecast of net financing through National Savings & Investments (NS&I).
1.3 The Debt Management Office (DMO) publishes detailed information in its Annual
Reviews on developments in debt management and the gilt market over the previous year. To
avoid duplication, only a summary of developments in the gilt market during 2007-08 (up to
January 2008) is set out in Annex A of this report.
5
1 The Code for Fiscal Stability can be found on HM Treasury’s website at:http://www.hm-treasury.gov.uk/documents/uk_economy/fiscal_policy/ukecon_fisc_code98.cfm

2 SI Z E A N D S T R U C T U R E O F UKGOV E R N M E N T D E B T I N 2007-08
Debt and reserves management report 2008-09
Debt stock
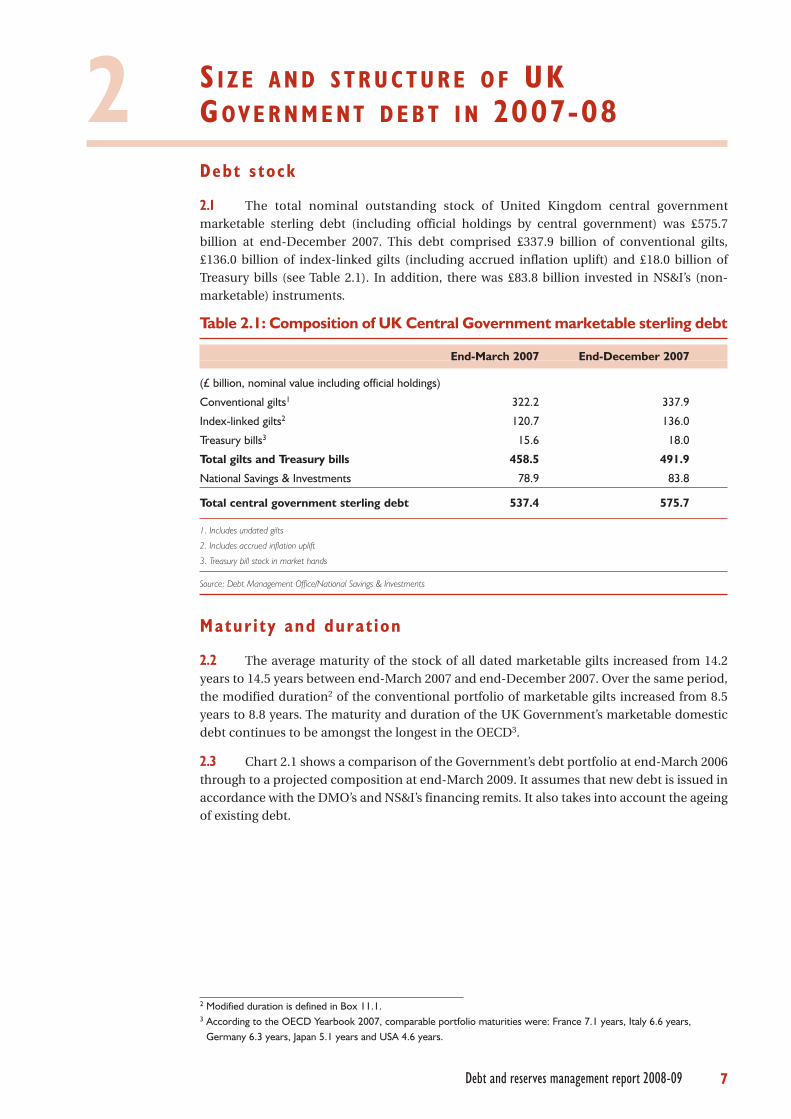
2.1 The total nominal outstanding stock of United Kingdom central government
marketable sterling debt (including official holdings by central government) was £575.7
billion at end-December 2007. This debt comprised £337.9 billion of conventional gilts,
£136.0 billion of index-linked gilts (including accrued inflation uplift) and £18.0 billion of
Treasury bills (see Table 2.1). In addition, there was £83.8 billion invested in NS&I’s (non-
marketable) instruments.
Table 2.1: Composition of UK Central Government marketable sterling debt
End-March 2007 End-December 2007
(£ billion, nominal value including official holdings)
Conventional gilts1 322.2 337.9
Index-linked gilts2 120.7 136.0
Treasury bills3 15.6 18.0
Total gilts and Treasury bills 458.5 491.9
National Savings & Investments 78.9 83.8
Total central government sterling debt 537.4 575.7
1. Includes undated gilts
2. Includes accrued inflation uplift
3. Treasury bill stock in market hands
Source: Debt Management Office/National Savings & Investments
Matur i ty and durat ion
2.2 The average maturity of the stock of all dated marketable gilts increased from 14.2
years to 14.5 years between end-March 2007 and end-December 2007. Over the same period,
the modified duration2 of the conventional portfolio of marketable gilts increased from 8.5
years to 8.8 years. The maturity and duration of the UK Government’s marketable domestic
debt continues to be amongst the longest in the OECD3.
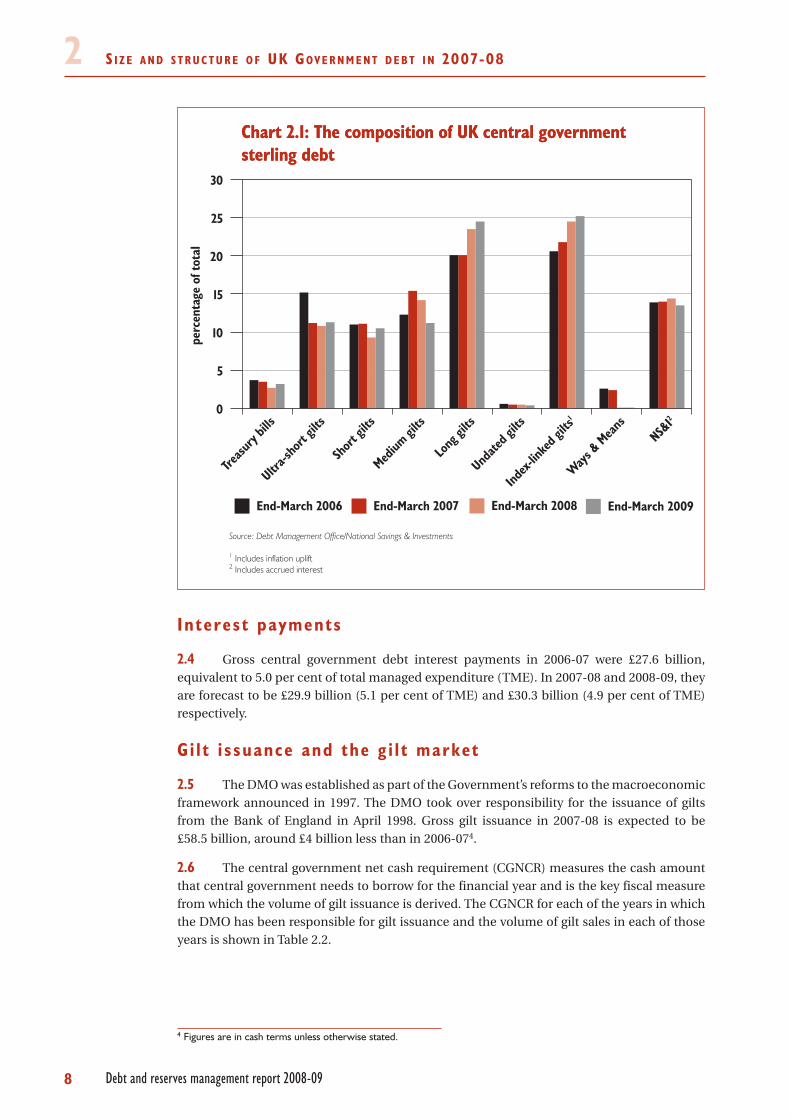
2.3 Chart 2.1 shows a comparison of the Government’s debt portfolio at end-March 2006
through to a projected composition at end-March 2009. It assumes that new debt is issued in
accordance with the DMO’s and NS&I’s financing remits. It also takes into account the ageing
of existing debt.
7
2 Modified duration is defined in Box 11.1.3 According to the OECD Yearbook 2007, comparable portfolio maturities were: France 7.1 years, Italy 6.6 years,
Germany 6.3 years, Japan 5.1 years and USA 4.6 years.
S I Z E A N D S T R U C T U R E O F UK GOV E R N M E N T D E B T I N 2007-082
Interest payments
2.4 Gross central government debt interest payments in 2006-07 were £27.6 billion,
equivalent to 5.0 per cent of total managed expenditure (TME). In 2007-08 and 2008-09, they
are forecast to be £29.9 billion (5.1 per cent of TME) and £30.3 billion (4.9 per cent of TME)
respectively.
Gi l t i ssuance and the g i l t market
2.5 The DMO was established as part of the Government’s reforms to the macroeconomic
framework announced in 1997. The DMO took over responsibility for the issuance of gilts
from the Bank of England in April 1998. Gross gilt issuance in 2007-08 is expected to be
£58.5 billion, around £4 billion less than in 2006-074.
2.6 The central government net cash requirement (CGNCR) measures the cash amount
that central government needs to borrow for the financial year and is the key fiscal measure
from which the volume of gilt issuance is derived. The CGNCR for each of the years in which
the DMO has been responsible for gilt issuance and the volume of gilt sales in each of those
years is shown in Table 2.2.
Chart 2.1: The composition of UK central governmentsterling debtChart 2.1: The composition of UK central governmentsterling debt
End-March 2007End-March 2006 End-March 2008 End-March 2009
perc
enta
geof
tota
l
N S &I2
W ays &
Means
Index
-link e
d gilts1
Undate
d gilts
L ong
gilts
Mediu m
gilts
S hor
t gilts
Ultra-s
hort
gilts
Treasu
rybil
ls0
30
25
20
15
10
5
Source: Debt Management Office/National Savings & Investments
1 Includes inflation uplift2 Includes accrued interest
8 Debt and reserves management report 2008-09
4 Figures are in cash terms unless otherwise stated.
S I Z E A N D S T R U C T U R E O F UK GOV E R N M E N T D E B T I N 2007-08 2Table 2.2: Central government net cash requirement and gross gilt sales1998-99 to 2007-08
Financial year CGNCR Gross gilt sales(£ billion) (£ billion)
1998-99 –4.5 8.2
1999-00 –9.1 14.4
2000-011 –35.6 10.0
2001-02 2.8 13.7
2002-03 21.8 26.3
2003-04 39.4 49.9
2004-05 38.5 50.1
2005-06 40.8 52.3
2006-07 37.1 62.5
2007-082 37.7 58.5
1. Reflecting the proceeds from the 3G Spectrum auction
2. CGNCR forecast at Budget 2008
Source: HM Treasury/Debt Management Office
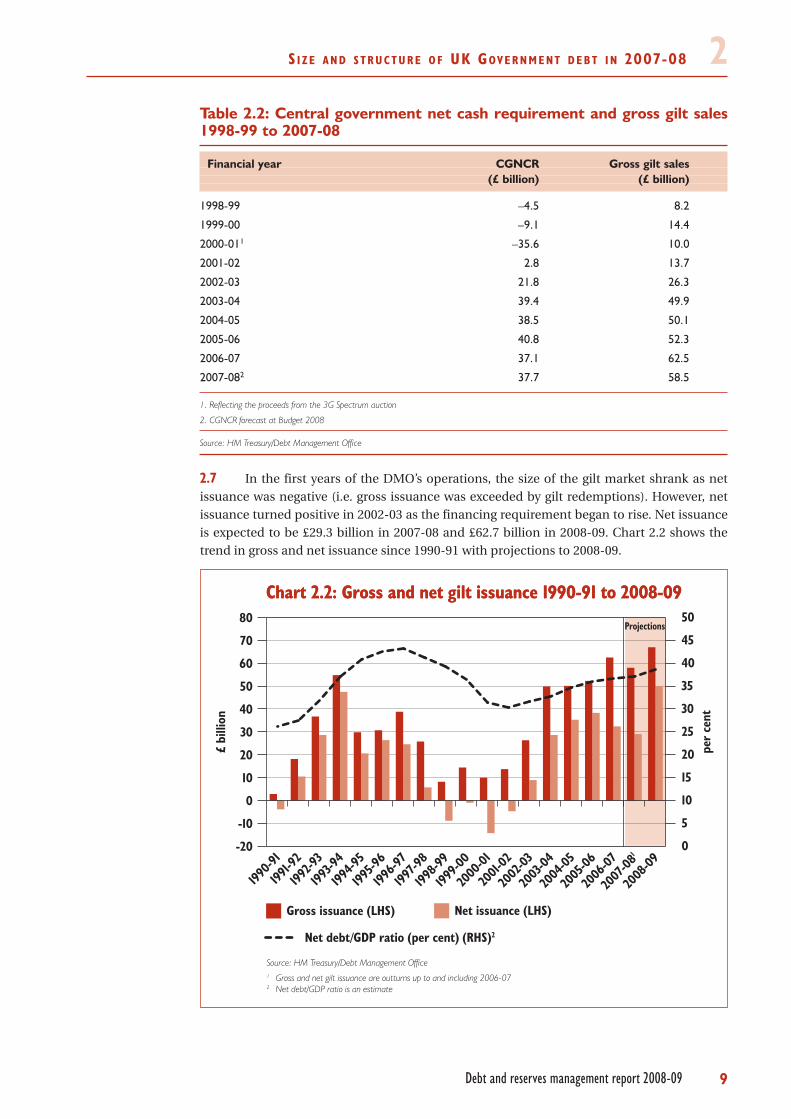
2.7 In the first years of the DMO’s operations, the size of the gilt market shrank as net
issuance was negative (i.e. gross issuance was exceeded by gilt redemptions). However, net
issuance turned positive in 2002-03 as the financing requirement began to rise. Net issuance
is expected to be £29.3 billion in 2007-08 and £62.7 billion in 2008-09. Chart 2.2 shows the
trend in gross and net issuance since 1990-91 with projections to 2008-09.
Chart 2.2: Gross and net gilt issuance 1990-91 to 2008-09Chart 2.2: Gross and net gilt issuance 1990-91 to 2008-09
Source: HM Treasury/Debt Management Office1 Gross and net gilt issuance are outturns up to and including 2006-072 Net debt/GDP ratio is an estimate
£bi
llion
per
cent
Net debt/GDP ratio (per cent) (RHS)2
0
5
10
15
20
25
30
35
40
45
50Projections
Net issuance (LHS)Gross issuance (LHS)
-20
-10
0
10
20
30
40
50
60
70
80
2008
-09
2007
-081
2006
-07
2005
-06
2004
-05
2003
-04
2002
-03
2001-
02
2000
-01
1999-0
0
1998-9
9
1997-9
8
1996-9
7
1995-9
6
1994-9
5
1993-9
4
1992-9
3
1991-9
2
1990-9
1
9Debt and reserves management report 2008-09
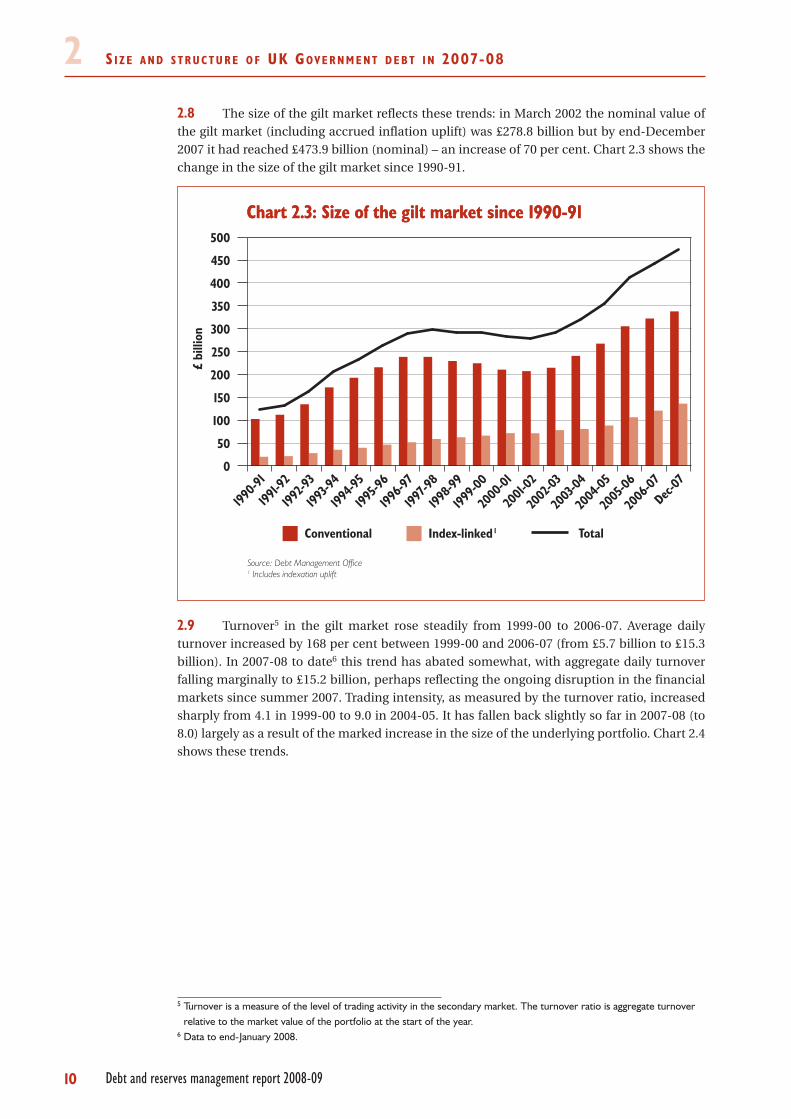
S I Z E A N D S T R U C T U R E O F UK GOV E R N M E N T D E B T I N 2007-0822.8 The size of the gilt market reflects these trends: in March 2002 the nominal value of
the gilt market (including accrued inflation uplift) was £278.8 billion but by end-December
2007 it had reached £473.9 billion (nominal) – an increase of 70 per cent. Chart 2.3 shows the
change in the size of the gilt market since 1990-91.
2.9 Turnover5 in the gilt market rose steadily from 1999-00 to 2006-07. Average daily
turnover increased by 168 per cent between 1999-00 and 2006-07 (from £5.7 billion to £15.3
billion). In 2007-08 to date6 this trend has abated somewhat, with aggregate daily turnover
falling marginally to £15.2 billion, perhaps reflecting the ongoing disruption in the financial
markets since summer 2007. Trading intensity, as measured by the turnover ratio, increased
sharply from 4.1 in 1999-00 to 9.0 in 2004-05. It has fallen back slightly so far in 2007-08 (to
8.0) largely as a result of the marked increase in the size of the underlying portfolio. Chart 2.4
shows these trends.
Chart 2.3: Size of the gilt market since 1990-91Chart 2.3: Size of the gilt market since 1990-91
Source: Debt Management Office1 Includes indexation uplift
Conventional
£bi
llion
TotalIndex-linked 1
0
50
100
150
200
250
300
350
400
450
500
D ec-07
2006
-07
2005
-06
2004
-05
2003
-04
2002
-03
2001-
02
2000
-01
1999-0
0
1998-9
9
1997-9
8
1996-9
7
1995-9
6
1994-9
5
1993-9
4
1992-9
3
1991-9
2
1990-9
1
10 Debt and reserves management report 2008-09
5 Turnover is a measure of the level of trading activity in the secondary market. The turnover ratio is aggregate turnoverrelative to the market value of the portfolio at the start of the year.
6 Data to end-January 2008.

S I Z E A N D S T R U C T U R E O F UK GOV E R N M E N T D E B T I N 2007-08 2
Chart 2.4: Gilt market turnoverChart 2.4: Gilt market turnover
Aggregate daily turnover (LHS)
turn
over
(£bi
llion
)
turn
over
ratio
Turnover ratio (RHS)
0
1
2
3
4
5
6
7
8
9
10
Source: Debt Management Office
1 Financial year to end-January 2008
0
2
4
6
8
10
12
16
14
2007
- 081
2006
- 07
2005
- 06
2004
- 05
2003
- 04
2002
- 03
2001-
02
2000
- 01
1999- 0
0
1998- 9
9
1997- 9
8
1996- 9
7
1995- 9
6
11Debt and reserves management report 2008-09

3 UK GOV E R N M E N T ’ S D E B T M A N A G E M E N TP O L I C Y
Debt and reserves management report 2008-09
Object ives o f debt management
3.1 The Government’s debt management objective is:
“to minimise, over the long term, the costs of meeting the Government’s financing
needs, taking into account risk, whilst ensuring that debt management policy is
consistent with the aims of monetary policy”.
3.2 The debt management policy objective is achieved by:
• pursuing an issuance policy that is open, transparent and predictable;
• issuing gilts that achieve a benchmark premium;
• adjusting the maturity and nature of the Government’s debt portfolio,
primarily by means of the maturity and composition of debt issuance and
potentially by other market operations including switch auctions, conversion
offers and buy-backs;
• developing a liquid and efficient gilt market; and
• offering cost-effective savings instruments to the retail sector through
National Savings & Investments.
3.3 HM Treasury has overall responsibility for meeting the debt management policy
objective but has delegated operational responsibility for debt management to its agents: the
DMO undertakes borrowing in sterling through issuance of government bonds and short-
term debt instruments in the wholesale market; NS&I undertakes retail borrowing through
sales of retail savings products; and the Bank of England undertakes borrowing in foreign
currencies through issuance of foreign currency denominated government bonds.
The ro le o f the Debt Management Of f i ce
3.4 HM Treasury has two overarching requirements for the DMO in the conduct of its
delegated responsibility for wholesale debt financing operations, namely, that it:
• raises the quantum of financing set out in its annual financing remit. This
means that the DMO is expected to achieve the sale of inflation-linked
(“index-linked”) and nominal (“conventional”) gilts and Treasury bills within
the operational tolerances specified in the financing and Exchequer cash
management remits respectively (see Chapters 4, 5 and 6); and
• conducts its operations in accordance with the principles of openness,
predictability and transparency, which underpin the Government’s approach
to debt management policy more generally. The Government judges that
by conducting its operations in accordance with these principles, the DMO
will effectively contribute to achieving long-term cost minimisation subject
to risk.
13
UK GOV E R N M E N T ’ S D E B T M A N A G E M E N T P O L I C Y33.5 In practice, this means that HM Treasury expects the DMO to:
• adopt a predictable approach to debt issuance, which includes publishing an
annual gilt auction calendar before the beginning of each financial year and
holding auctions in accordance with its remit;
• pre-announce the details of its debt issuance plans to the market to ensure
transparency about its activities; and
• act in a manner consistent with its remit and explain the basis for its decisions
about gilt issuance as fully as possible to the market in order to allow market
participants better to understand the rationale behind the DMO’s decisions.
3.6 In addition, HM Treasury expects the DMO to:
• provide advice in its capacity as the Government’s official presence in the gilt
market on: (i) the appropriate structure and contents for the financing remit
in preparation for publication of the remit each year alongside the Budget;
and (ii) how to accommodate revisions to the remit during the course of the
year;
• report during the financial year on progress against the remit, in particular,
progress of gilt sales against the remit targets;
• monitor developments in the gilt market and the wider economy and report in
a timely manner on changing conditions that might require the terms of the
remit to be revisited;
• maintain open channels of communication with market participants both
formally and informally to solicit their views on gilt issuance and other issues
affecting the remit and, as far as possible, to explain the rationale for
decisions;
• advise on any operation to manage the maturity and nature of the
Government’s debt portfolio and conduct any such operation if so directed by
HM Treasury, through gilt issuance decisions and through use of other market
management techniques;
• develop a liquid and efficient gilt market primarily through regular issuance of
benchmark gilts;
• provide advice on the introduction of any new financing instrument or debt
management technique as deemed appropriate to fulfil the Government’s debt
management objective; and
• ensure the continuing and efficient functioning of the gilt market by
undertaking market management operations as necessary.
14 Debt and reserves management report 2008-09
UK GOV E R N M E N T ’ S D E B T M A N A G E M E N T P O L I C Y 33.7 This approach to debt management policy, based on principles of openness,
predictability and transparency, is recognised internationally as the most effective way to
minimise the long-term costs of debt management, although there is no recognised way to
measure quantitatively whether long-term costs are minimised through this approach7. In
order to demonstrate that the DMO is taking decisions aimed at fulfilling the objective of
long-term cost minimisation subject to risk, HM Treasury expects the DMO to explain
publicly, in its Annual Review, the key factors that motivated its decisions on implementation
of the remit during the course of the previous financial year. Quantitative reporting of aspects
of the DMO’s performance is also undertaken against a range of measures and indicators
wherever that is possible. A number of these measures are set out in the DMO’s annual
published Business Plan8.
Matur i ty and composi t ion o f debt i ssuance
3.8 In order to determine the maturity and composition of debt issuance, the
Government needs to take account of a number of factors including:
• investors’ demand for gilts;
• the Government’s own appetite for risk, both nominal and real;
• the shape of both the nominal and real yield curves and the expected effect of
issuance policy; and
• changes to the stock of Treasury bills and other short-term instruments.
Medium-term approach to debt i ssuance
3.9 In the medium term, consistent with the debt management policy objective of
minimising long-term costs taking into account risk, the Government’s annual decisions
about gilt issuance will continue to be informed by a number of factors including: the size of
the annual financing requirement; supply-side considerations including the Government’s
risk preferences; investors’ demand for gilts; the shape of the yield curve; and other financial
market conditions. It is likely that strong demand for long-dated conventional and index-
linked gilts will persist in the medium term and continue to influence the shape of the yield
curve. Should that be the case, the Government’s policy of skewing issuance towards long
maturities would continue.
3.10 In conjunction with sound judgement, formal modelling continues to play a key role
in providing analytical support for the formulation of the medium-term debt management
strategy. The Strategic Debt Analysis model is a debt strategy simulation model used by the
DMO to illustrate the debt service cost and risk of different debt issuance strategies, given
assumptions about the shape of both the nominal and real yield curves. The model is not
used to determine a single optimal debt issuance strategy but to illustrate the cost and risk
trade-off of different issuance strategies. Simulations using this model are set out in Annex B.
3.11 It should be noted that the simulation modelling presented in Annex B is intended to
convey the impact that the different issuance strategies could have on the debt service cost
and risk of the Government’s debt portfolio. It is based on a number of strong assumptions,
including those for the nominal and real yield curves. The model has not been used
to determine a particular debt issuance strategy, but to illustrate the impact of different
issuance strategies.
15Debt and reserves management report 2008-09
7 The key ways in which the Debt Management Office seeks to achieve transparency and predictability in its operationsare outlined in Box 3.1, Debt and reserves management report 2007-08.
8 The Business Plan is available on the DMO’s website at:http://www.dmo.gov.uk/documentview.aspx?docname=publications/corpgovernance/busplan2007
UK GOV E R N M E N T ’ S D E B T M A N A G E M E N T P O L I C Y33.12 The considerations underpinning the 2007-08 remit are set out in Box 3.1.
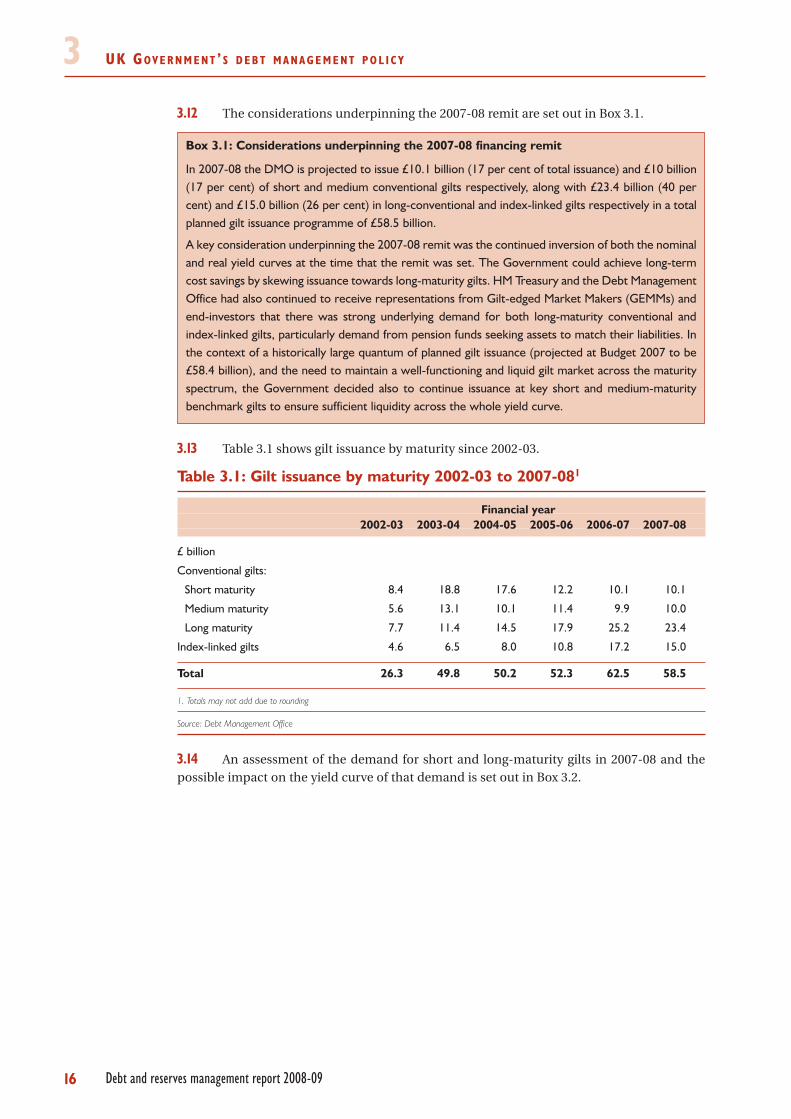
3.13 Table 3.1 shows gilt issuance by maturity since 2002-03.
Table 3.1: Gilt issuance by maturity 2002-03 to 2007-081
Financial year2002-03 2003-04 2004-05 2005-06 2006-07 2007-08
£ billion
Conventional gilts:
Short maturity 8.4 18.8 17.6 12.2 10.1 10.1
Medium maturity 5.6 13.1 10.1 11.4 9.9 10.0
Long maturity 7.7 11.4 14.5 17.9 25.2 23.4
Index-linked gilts 4.6 6.5 8.0 10.8 17.2 15.0
Total 26.3 49.8 50.2 52.3 62.5 58.5
1. Totals may not add due to rounding
Source: Debt Management Office
3.14 An assessment of the demand for short and long-maturity gilts in 2007-08 and the
possible impact on the yield curve of that demand is set out in Box 3.2.
Box 3.1: Considerations underpinning the 2007-08 financing remit
In 2007-08 the DMO is projected to issue £10.1 billion (17 per cent of total issuance) and £10 billion(17 per cent) of short and medium conventional gilts respectively, along with £23.4 billion (40 percent) and £15.0 billion (26 per cent) in long-conventional and index-linked gilts respectively in a totalplanned gilt issuance programme of £58.5 billion.
A key consideration underpinning the 2007-08 remit was the continued inversion of both the nominaland real yield curves at the time that the remit was set. The Government could achieve long-termcost savings by skewing issuance towards long-maturity gilts. HM Treasury and the Debt ManagementOffice had also continued to receive representations from Gilt-edged Market Makers (GEMMs) andend-investors that there was strong underlying demand for both long-maturity conventional andindex-linked gilts, particularly demand from pension funds seeking assets to match their liabilities. Inthe context of a historically large quantum of planned gilt issuance (projected at Budget 2007 to be£58.4 billion), and the need to maintain a well-functioning and liquid gilt market across the maturityspectrum, the Government decided also to continue issuance at key short and medium-maturitybenchmark gilts to ensure sufficient liquidity across the whole yield curve.
16 Debt and reserves management report 2008-09
UK GOV E R N M E N T ’ S D E B T M A N A G E M E N T P O L I C Y 3
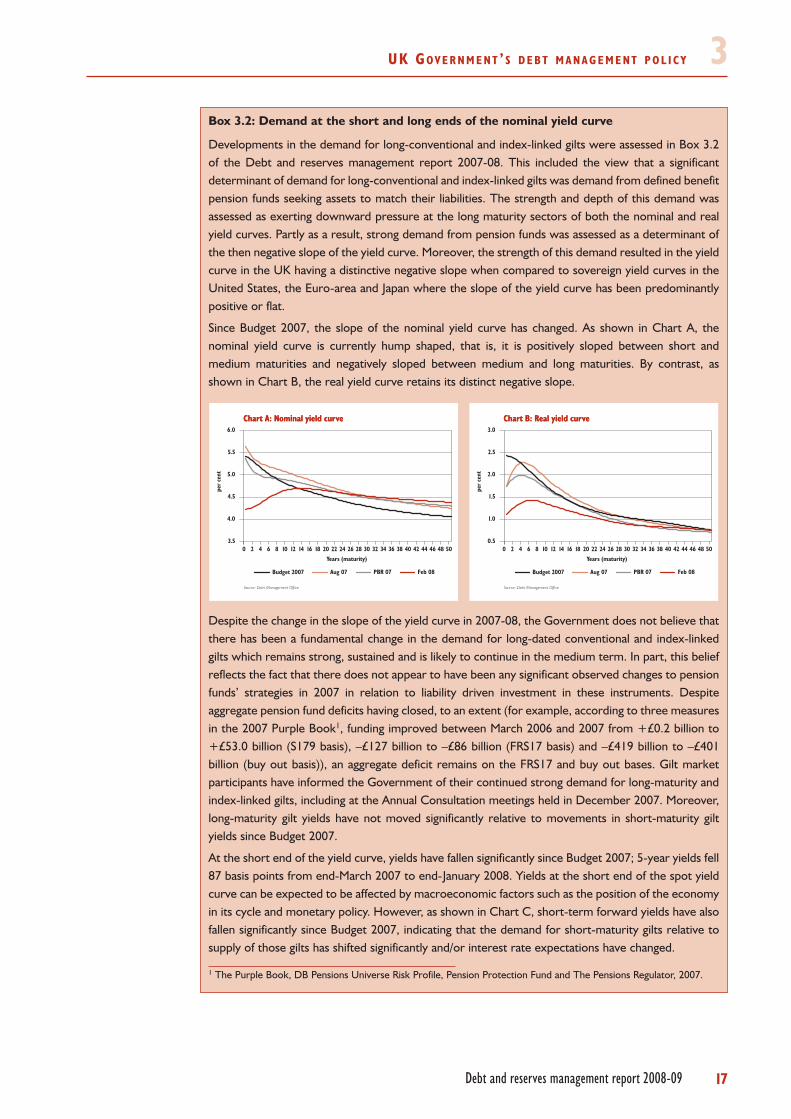
Box 3.2: Demand at the short and long ends of the nominal yield curve
Developments in the demand for long-conventional and index-linked gilts were assessed in Box 3.2of the Debt and reserves management report 2007-08. This included the view that a significantdeterminant of demand for long-conventional and index-linked gilts was demand from defined benefitpension funds seeking assets to match their liabilities. The strength and depth of this demand wasassessed as exerting downward pressure at the long maturity sectors of both the nominal and realyield curves. Partly as a result, strong demand from pension funds was assessed as a determinant ofthe then negative slope of the yield curve. Moreover, the strength of this demand resulted in the yieldcurve in the UK having a distinctive negative slope when compared to sovereign yield curves in theUnited States, the Euro-area and Japan where the slope of the yield curve has been predominantlypositive or flat.
Since Budget 2007, the slope of the nominal yield curve has changed. As shown in Chart A, thenominal yield curve is currently hump shaped, that is, it is positively sloped between short andmedium maturities and negatively sloped between medium and long maturities. By contrast, asshown in Chart B, the real yield curve retains its distinct negative slope.
Despite the change in the slope of the yield curve in 2007-08, the Government does not believe thatthere has been a fundamental change in the demand for long-dated conventional and index-linkedgilts which remains strong, sustained and is likely to continue in the medium term. In part, this beliefreflects the fact that there does not appear to have been any significant observed changes to pensionfunds’ strategies in 2007 in relation to liability driven investment in these instruments. Despiteaggregate pension fund deficits having closed, to an extent (for example, according to three measuresin the 2007 Purple Book1, funding improved between March 2006 and 2007 from +£0.2 billion to+£53.0 billion (S179 basis), –£127 billion to –£86 billion (FRS17 basis) and –£419 billion to –£401billion (buy out basis)), an aggregate deficit remains on the FRS17 and buy out bases. Gilt marketparticipants have informed the Government of their continued strong demand for long-maturity andindex-linked gilts, including at the Annual Consultation meetings held in December 2007. Moreover,long-maturity gilt yields have not moved significantly relative to movements in short-maturity giltyields since Budget 2007.
At the short end of the yield curve, yields have fallen significantly since Budget 2007; 5-year yields fell87 basis points from end-March 2007 to end-January 2008. Yields at the short end of the spot yieldcurve can be expected to be affected by macroeconomic factors such as the position of the economyin its cycle and monetary policy. However, as shown in Chart C, short-term forward yields have alsofallen significantly since Budget 2007, indicating that the demand for short-maturity gilts relative tosupply of those gilts has shifted significantly and/or interest rate expectations have changed.
1 The Purple Book, DB Pensions Universe Risk Profile, Pension Protection Fund and The Pensions Regulator, 2007.
17Debt and reserves management report 2008-09
Chart A: Nominal yield curveChart A: Nominal yield curve
Years (maturity)
Source: Debt Management Office
per
cent
50484644424038363432302826242220181614121086420
Feb 08PBR 07Aug 07Budget 2007
3.5
4.0
4.5
5.0
5.5
6.0
Chart B: Real yield curveChart B: Real yield curve
Years (maturity)
Source: Debt Management Office
per
cent
50484644424038363432302826242220181614121086420
Feb 08PBR 07Aug 07Budget 2007
0.5
1.0
1.5
2.0
2.5
3.0
UK GOV E R N M E N T ’ S D E B T M A N A G E M E N T P O L I C Y3
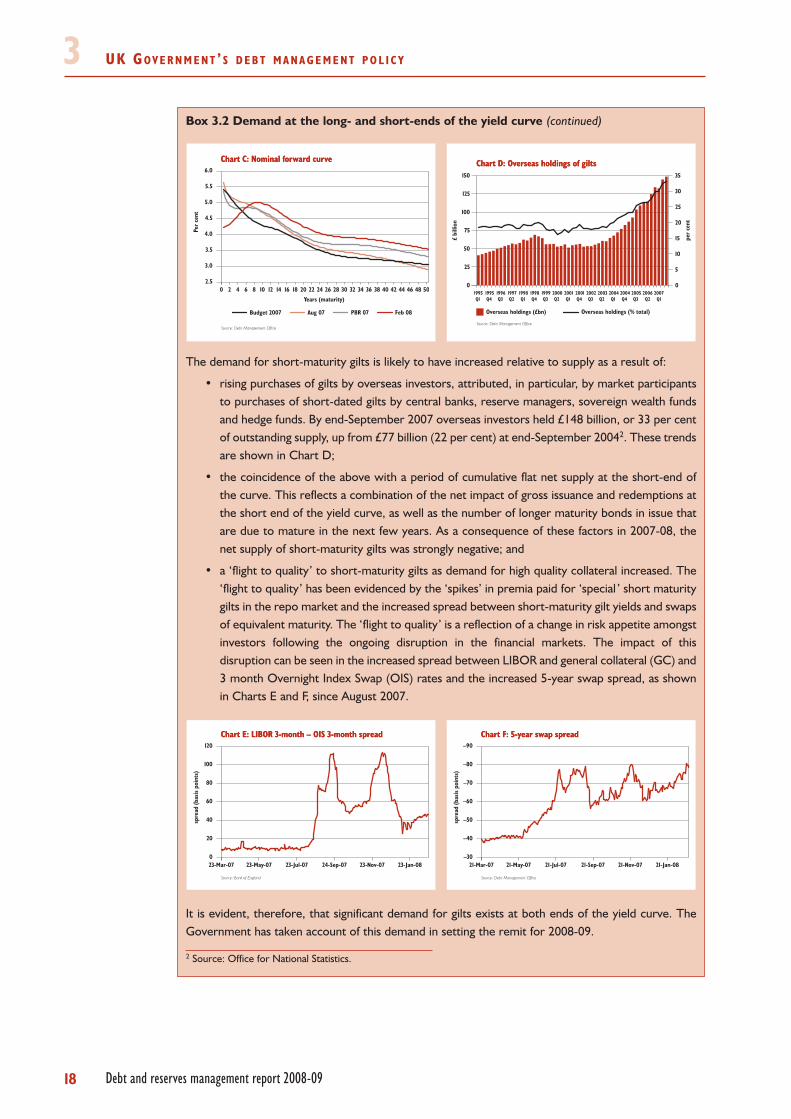
Box 3.2 Demand at the long- and short-ends of the yield curve (continued)
The demand for short-maturity gilts is likely to have increased relative to supply as a result of:
• rising purchases of gilts by overseas investors, attributed, in particular, by market participantsto purchases of short-dated gilts by central banks, reserve managers, sovereign wealth fundsand hedge funds. By end-September 2007 overseas investors held £148 billion, or 33 per centof outstanding supply, up from £77 billion (22 per cent) at end-September 20042. These trendsare shown in Chart D;
• the coincidence of the above with a period of cumulative flat net supply at the short-end ofthe curve. This reflects a combination of the net impact of gross issuance and redemptions atthe short end of the yield curve, as well as the number of longer maturity bonds in issue thatare due to mature in the next few years. As a consequence of these factors in 2007-08, thenet supply of short-maturity gilts was strongly negative; and
• a ‘flight to quality’ to short-maturity gilts as demand for high quality collateral increased. The‘flight to quality’ has been evidenced by the ‘spikes’ in premia paid for ‘special ’ short maturitygilts in the repo market and the increased spread between short-maturity gilt yields and swapsof equivalent maturity. The ‘flight to quality’ is a reflection of a change in risk appetite amongstinvestors following the ongoing disruption in the financial markets. The impact of thisdisruption can be seen in the increased spread between LIBOR and general collateral (GC) and3 month Overnight Index Swap (OIS) rates and the increased 5-year swap spread, as shownin Charts E and F, since August 2007.
It is evident, therefore, that significant demand for gilts exists at both ends of the yield curve. TheGovernment has taken account of this demand in setting the remit for 2008-09.
2 Source: Office for National Statistics.
18 Debt and reserves management report 2008-09
Chart C: Nominal forward curveChart C: Nominal forward curve
Years (maturity)
Source: Debt Management Office
Per
cent
50484644424038363432302826242220181614121086420
Feb 08PBR 07Aug 07Budget 2007
2.5
6.0
5.5
5.0
4.5
4.0
3.5
3.0
Chart D: Overseas holdings of giltsChart D: Overseas holdings of gilts
Source: Debt Management Office
£bi
llion
per
cent
Overseas holdings (£bn)
0
25
50
75
100
125
150
2007Q1
2006Q2
2005Q3
2004Q4
2004Q1
2003Q2
2002Q3
2001Q4
2001Q1
2000Q2
1999Q3
1998Q4
1998Q1
1997Q2
1996Q3
1995Q4
1995Q1
Overseas holdings (% total)
0
5
10
15
20
25
30
35
Chart E: LIBOR 3-month – OIS 3-month spreadChart E: LIBOR 3-month – OIS 3-month spread
Source: Bank of England
spre
ad(b
asis
poin
ts)
0
120
100
80
60
40
20
23-Jan-0823-Nov-0724-Sep-0723-Jul-0723-May-0723-Mar-07
Chart F: 5-year swap spreadChart F: 5-year swap spread
Source: Debt Management Office
spre
ad(b
asis
poin
ts)
–30
–90
–80
–70
–60
–50
–40
21-Jan-0821-Nov-0721-Sep-0721-Jul-0721-May-0721-Mar-07
4 UK GOV E R N M E N T ’ S F I N A N C I N GP R O G R A M M E F O R 2008-09
Debt and reserves management report 2008-09
Financ ing f ramework
4.1 The Government intends to continue to finance the central government net cash
requirement (CGNCR) using the framework that was established in the 1995 Debt
Management Review. The Government aims to finance its net cash requirement plus
maturing debt and any financing required for additional net foreign currency reserves
through the issuance of debt. All such debt issuance will take place within a set maturity
structure. Auctions remain the preferred means of issuance for all gilts. In addition, the
Government may hold conversion offers, switch auctions, reverse auctions of non-
benchmark gilts and syndicated offerings of gilts (although there are no current plans to hold
such operations in 2008-09).
Financ ing ar i thmet ic
4.2 The new forecast for the CGNCR in 2008-09 is £59.3 billion, an increase of £21.3
billion from the forecast in the Pre-Budget Report (PBR) 2007. The 2008-09 forecast includes
the impact of the refinancing of the Bank of England’s loan to Northern Rock by a loan from
HM Treasury to Northern Rock. The net amount outstanding of that loan as at 31 March 2009
is projected to be £14 billion but this amount is subject to revision and will be updated at the
2008 PBR.
4.3 The forecast net financing requirement of £78.8 billion reflects expected gilt
redemptions of £17.3 billion and the decision to refinance, in sterling, the $US3 billion bond
due to mature on 8 July 2008. NS&I’s net contribution to financing (including accrued
interest) in 2008-09 is forecast to be £4.0 billion. This assumes gross sales (i.e. sales and
deposits including accrued interest) of £15.3 billion. This forecast is not a target but an
estimate based on experience in previous years, trends in the retail savings product market
during 2007-08 and NS&I’s own forecasts and objectives.
4.4 In addition, the net financing requirement in 2008-09 includes the impact of the
partial repayment in 2007-08 of £6 billion of the Ways and Means Advance from the Bank of
England. The Government’s decision to repay up to £7 billion of the Ways and Means Advance
from the Bank of England is not reflected in the net financing requirement in 2008-09 but is
included as a planned change in the short-term debt level (see Box 4.1).
4.5 The financing requirement will be met by gross gilt issuance of £80.0 billion and an
increase in the Treasury bill stock of £5.8 billion. The additional sum raised in excess of the
net financing requirement is to meet further repayments of the Ways and Means Advance
in 2008-09.
4.6 Table 4.1 gives details of the financing arithmetic for 2008-09. It shows the proposed
debt instruments that the Government intends to use to meet its financing requirement in
2008-09.
19
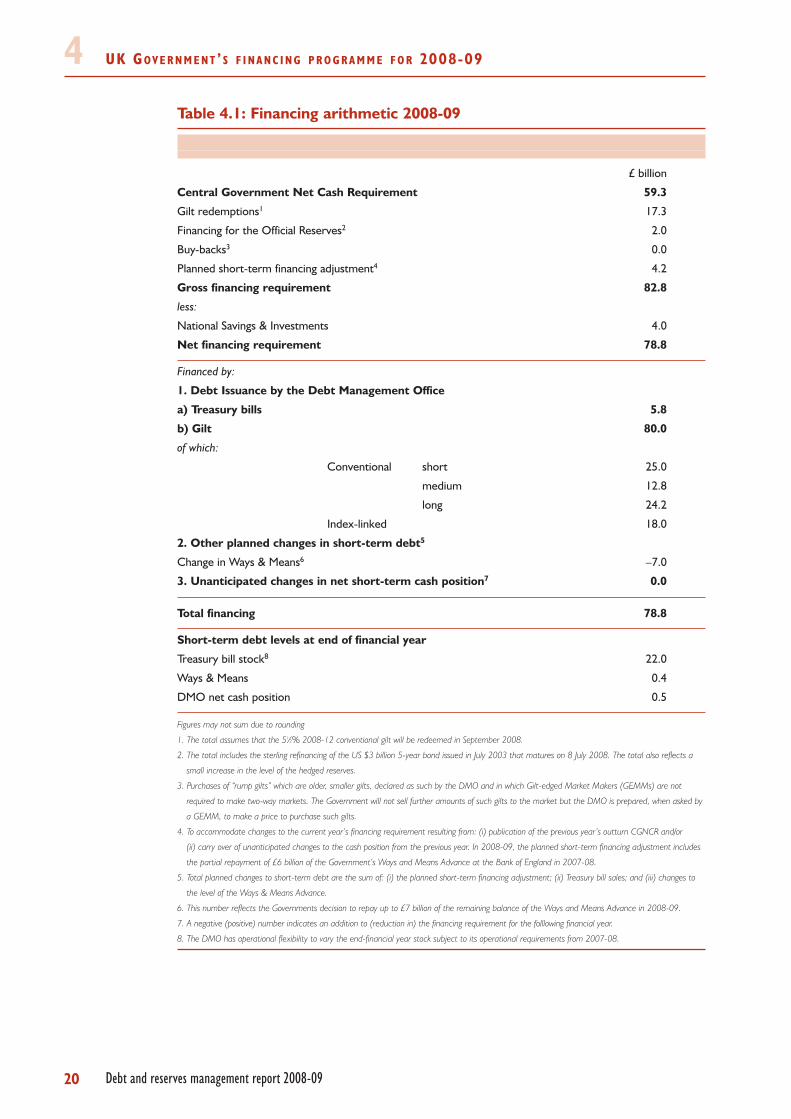
UK GOV E R N M E N T ’ S F I N A N C I N G P R O G R A M M E F O R 2008-094Table 4.1: Financing arithmetic 2008-09
£ billion
Central Government Net Cash Requirement 59.3
Gilt redemptions1 17.3
Financing for the Official Reserves2 2.0
Buy-backs3 0.0
Planned short-term financing adjustment4 4.2
Gross financing requirement 82.8
less:
National Savings & Investments 4.0
Net financing requirement 78.8
Financed by:
1. Debt Issuance by the Debt Management Office
a) Treasury bills 5.8
b) Gilt 80.0
of which:
Conventional short 25.0
medium 12.8
long 24.2
Index-linked 18.0
2. Other planned changes in short-term debt5
Change in Ways & Means6 –7.0
3. Unanticipated changes in net short-term cash position7 0.0
Total financing 78.8
Short-term debt levels at end of financial year
Treasury bill stock8 22.0
Ways & Means 0.4
DMO net cash position 0.5
Figures may not sum due to rounding
1. The total assumes that the 51⁄2% 2008-12 conventional gilt will be redeemed in September 2008.
2. The total includes the sterling refinancing of the US $3 billion 5-year bond issued in July 2003 that matures on 8 July 2008. The total also reflects a
small increase in the level of the hedged reserves.
3. Purchases of “rump gilts” which are older, smaller gilts, declared as such by the DMO and in which Gilt-edged Market Makers (GEMMs) are not
required to make two-way markets. The Government will not sell further amounts of such gilts to the market but the DMO is prepared, when asked by
a GEMM, to make a price to purchase such gilts.
4. To accommodate changes to the current year’s financing requirement resulting from: (i) publication of the previous year’s outturn CGNCR and/or
(ii) carry over of unanticipated changes to the cash position from the previous year. In 2008-09, the planned short-term financing adjustment includes
the partial repayment of £6 billion of the Government’s Ways and Means Advance at the Bank of England in 2007-08.
5. Total planned changes to short-term debt are the sum of: (i) the planned short-term financing adjustment; (ii) Treasury bill sales; and (iii) changes to
the level of the Ways & Means Advance.
6. This number reflects the Governments decision to repay up to £7 billion of the remaining balance of the Ways and Means Advance in 2008-09.
7. A negative (positive) number indicates an addition to (reduction in) the financing requirement for the folllowing financial year.
8. The DMO has operational flexibility to vary the end-financial year stock subject to its operational requirements from 2007-08.
20 Debt and reserves management report 2008-09

UK GOV E R N M E N T ’ S F I N A N C I N G P R O G R A M M E F O R 2008-09 4Financ ing for the Of f i c ia l Reser ves
4.7 If the Government judges that there is a value-for-money case for doing so,
consideration would be given to issuing foreign currency securities to finance the borrowed
reserves in 2008-09. Any decisions will be taken on the basis of the least cost comparison set
out in chapter 9.
4.8 If foreign currency bonds are issued in place of swapped sterling liabilities to finance
the official reserves then the net sterling financing requirement will decline by the sterling
value of the bonds issued. Similarly, when the foreign currency bonds mature (assuming that
the level of the hedged reserves remains unchanged and new foreign currency bonds are not
issued) the net sterling financing requirement will rise by the equivalent amount.
4.9 For the purposes of the financing arithmetic in Table 4.1, it is assumed that swapped
sterling will remain the main form of financing of the borrowed reserves (as has been the case
in recent years) and no new foreign currency debt will be issued in 2008-09. A redemption of
one of the Government’s foreign borrowings, the $US3.0 billion bond, will take place in July
2008. However, the official reserves will remain unchanged as the dollar bond will be replaced
by equivalent sterling financing. This redemption is projected to increase the financing
requirement by around £1.5 billion. There is, in addition, a further small increase in the level
of the hedged reserves. If the Government were to decide to issue a foreign currency bond
later in the year, this would be taken into account in subsequent revisions to the DMO’s
financing remit, either in PBR 2008 in the autumn or in Budget 2009, depending on when the
bond was issued.
Treasury b i l l sa les
4.10 The financing plans for 2008-09 show that the outstanding stock of Treasury bills is
expected to rise by £5.8 billion to £22.0 billion. In addition to the scheduled weekly tenders,
the DMO may continue to re-open on request existing issues of Treasury bills for sale on a
bilateral basis, to raise funds for cash management. Consequently, the DMO will continue to
have operational flexibility to vary the end-financial year stock subject to its operational
requirements (see Chapter 6 paragraph 6.8). The 2007-08 financial year outturn for the
Treasury bill stock will be reported alongside the CGNCR outturn for 2007-08 in April 2008;
similarly, the outturn for 2008-09 will be reported in April 2009.
Other short- term debt
4.11 In 2007-08, HM Treasury made a partial payment of its Ways & Means Advance from
the Bank of England (see Box 4.1) of £6 billion. The level of the Ways & Means Advance
from the Bank of England planned for 31 March 2008 is £7.4 billion. Further repayments of up
to £7 billion are planned in 2008-09. Continuing the practice established in 2007-08,
repayments in 2008-09 will be announced by the DMO as and when they take place.
21Debt and reserves management report 2008-09
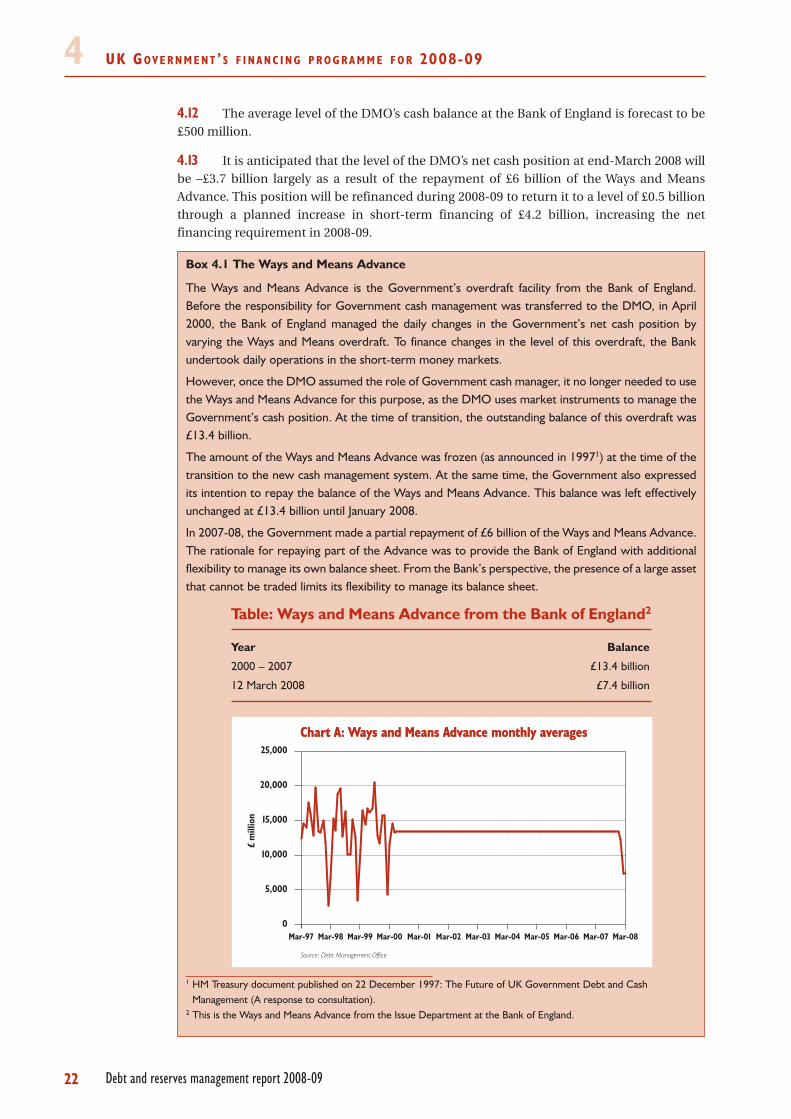
UK GOV E R N M E N T ’ S F I N A N C I N G P R O G R A M M E F O R 2008-0944.12 The average level of the DMO’s cash balance at the Bank of England is forecast to be
£500 million.
4.13 It is anticipated that the level of the DMO’s net cash position at end-March 2008 will
be –£3.7 billion largely as a result of the repayment of £6 billion of the Ways and Means
Advance. This position will be refinanced during 2008-09 to return it to a level of £0.5 billion
through a planned increase in short-term financing of £4.2 billion, increasing the net
financing requirement in 2008-09.
Box 4.1 The Ways and Means Advance
The Ways and Means Advance is the Government’s overdraft facility from the Bank of England.Before the responsibility for Government cash management was transferred to the DMO, in April2000, the Bank of England managed the daily changes in the Government’s net cash position byvarying the Ways and Means overdraft. To finance changes in the level of this overdraft, the Bankundertook daily operations in the short-term money markets.
However, once the DMO assumed the role of Government cash manager, it no longer needed to usethe Ways and Means Advance for this purpose, as the DMO uses market instruments to manage theGovernment’s cash position. At the time of transition, the outstanding balance of this overdraft was£13.4 billion.
The amount of the Ways and Means Advance was frozen (as announced in 19971) at the time of thetransition to the new cash management system. At the same time, the Government also expressedits intention to repay the balance of the Ways and Means Advance. This balance was left effectivelyunchanged at £13.4 billion until January 2008.
In 2007-08, the Government made a partial repayment of £6 billion of the Ways and Means Advance.The rationale for repaying part of the Advance was to provide the Bank of England with additionalflexibility to manage its own balance sheet. From the Bank’s perspective, the presence of a large assetthat cannot be traded limits its flexibility to manage its balance sheet.
Table: Ways and Means Advance from the Bank of England2
Year Balance
2000 – 2007 £13.4 billion
12 March 2008 £7.4 billion
1 HM Treasury document published on 22 December 1997: The Future of UK Government Debt and CashManagement (A response to consultation).
2 This is the Ways and Means Advance from the Issue Department at the Bank of England.
22 Debt and reserves management report 2008-09
Chart A: Ways and Means Advance monthly averagesChart A: Ways and Means Advance monthly averages
Source: Debt Management Office
£m
illio
n
25,000
20,000
15,000
10,000
5,000
0Mar-08Mar-01 Mar-02 Mar-03 Mar-04 Mar-05 Mar-06 Mar-07Mar-00Mar-99Mar-98Mar-97

UK GOV E R N M E N T ’ S F I N A N C I N G P R O G R A M M E F O R 2008-09 4Quant i ty o f g i l t sa les
4.14 The DMO will aim to meet the remainder of the financing requirement by selling gilts
to the private sector – on a broadly even-flow basis throughout the financial year. On the basis
of the forecast for the CGNCR, this means that there will be gross gilt sales of approximately
£80.0 billion (cash) in 2008-09.
Benchmark g i l ts
4.15 Through its gilt issuance programme, the Government aims at regular issuance
across the maturity spectrum throughout the financial year and at building up benchmarks
at key maturities in both conventional and index-linked gilts.
23Debt and reserves management report 2008-09

5 TH E DE B T MA N A G E M E N T OF F I C E ’ SF I N A N C I N G R E M I T F O R 2008-09
Debt and reserves management report 2008-09
Object ives
5.1 The DMO, an Executive Agency of HM Treasury, has been given the following
objectives in respect of Government debt management:
• to meet the annual remit set by HM Treasury Ministers for the sale of gilts,
with due regard to long-term cost minimisation taking account of risk;
• to advise Ministers on setting the remit to meet the Government’s debt
management objectives and to report to Ministers on the DMO’s performance
against its remit, objectives and targets;
• to develop policy on, and promote advances in, new instruments, issuance
techniques and structural changes to the debt markets that will help lower the
cost of debt financing, liaising as appropriate with the Bank of England,
Financial Services Authority, London Stock Exchange and other bodies and to
provide policy advice to Ministers on the DMO’s performance against its
remit, objectives and targets;
• to conduct its market operations, liaising as necessary with regulatory and
other bodies, with a view to maintaining orderly and efficient markets and
promoting a liquid market for gilts;
• to provide, including in liaison with Computershare Investor Services plc and
CRESTCo, a high quality efficient service to investors in government debt and
to deal fairly and professionally with market participants in the gilt and money
markets, consistent with achieving low cost issuance;
• to contribute to HM Treasury’s work on the development of the medium-term
strategy for the debt portfolio; and
• to make information publicly available on the debt markets and DMO policies
where that contributes through openness and predictability to efficient
markets and lowers costs of debt issuance.
Quant i ty o f g i l t sa les
5.2 The DMO, on behalf of the Government, will aim to deliver gilt sales of £80.0 billion
(cash)9 in 2008-09.
25
9 Figures in Chapter 5 are in cash terms unless otherwise stated.
TH E DE B T MA N A G E M E N T OF F I C E ’ S F I N A N C I N G R E M I T F O R 2008-095Amount and matur i ty o f convent ional g i l t i ssuance
5.3 The planned amount of issuance and maturity mix of conventional gilts in 41
auctions in 2008-09 is:
• 7 auctions in the short (1-7 years) maturity area, aiming to raise £25.0 billion
cash;
• 5 auctions in the medium (7-15 years) maturity area, aiming to raise £12.8
billion cash; and
• 11 auctions in the long (15 years and over) maturity area, aiming to raise £24.2
billion cash.
Amount o f index- l inked g i l t i ssuance
5.4 In 2008-09, the DMO aims to sell £18.0 billion (cash) in index-linked gilts.
5.5 18 auctions of index-linked gilts are planned in 2008-09. These auctions will include
frequent issuance at long maturities.
S ize o f g i l t auct ions
5.6 The gilt sales targets in paragraphs 5.3 and 5.4 above are specified in cash terms, but
the gilt auctions are sized in nominal terms, typically in £0.25 billion increments for
conventional gilts and £0.025 billion increments for index-linked gilts. Therefore all gilt sales
targets are expressed in approximate terms.
Method of i ssuance o f g i l ts
5.7 Auctions will constitute the preferred means of issuance of all gilts (conventional and
index-linked). All auctions will be single auctions held on the day indicated.
5.8 Each outright auction of conventional gilts is planned to be between £1.5 billion and
£4.0 billion (cash) on a competitive bid-price basis. Each outright auction of index-linked gilts
will be between £0.5 billion and £2.0 billion (cash) on a uniform price basis.
5.9 The expected timing of gilt sales is set out in the auction calendar in Table 5.1 below.
A more detailed auction calendar for the first quarter of the financial year, including the gilts
to be auctioned on each date, will be announced by the DMO at 3.30pm on Monday 31 March
2008. For the rest of 2008-09 the quarterly calendar announcements will be made at 3.30pm
on Friday 30 May, Friday 29 August and Friday 28 November10. Full details of all auctions will
normally be announced at 3.30pm on the Tuesday of the week preceding the auction.
26 Debt and reserves management report 2008-09
10 The announcement in November is subject to the date of the Pre-Budget Report.
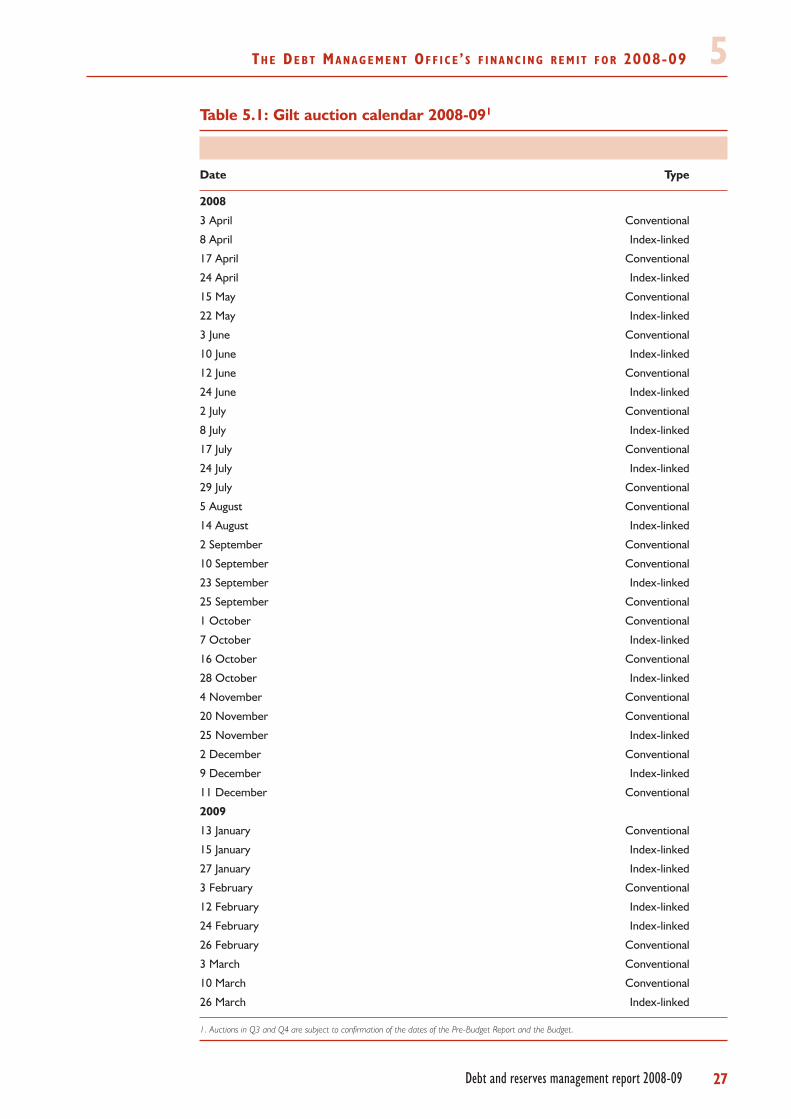
TH E DE B T MA N A G E M E N T OF F I C E ’ S F I N A N C I N G R E M I T F O R 2008-09 5Table 5.1: Gilt auction calendar 2008-091
Date Type
2008
3 April Conventional
8 April Index-linked
17 April Conventional
24 April Index-linked
15 May Conventional
22 May Index-linked
3 June Conventional
10 June Index-linked
12 June Conventional
24 June Index-linked
2 July Conventional
8 July Index-linked
17 July Conventional
24 July Index-linked
29 July Conventional
5 August Conventional
14 August Index-linked
2 September Conventional
10 September Conventional
23 September Index-linked
25 September Conventional
1 October Conventional
7 October Index-linked
16 October Conventional
28 October Index-linked
4 November Conventional
20 November Conventional
25 November Index-linked
2 December Conventional
9 December Index-linked
11 December Conventional
2009
13 January Conventional
15 January Index-linked
27 January Index-linked
3 February Conventional
12 February Index-linked
24 February Index-linked
26 February Conventional
3 March Conventional
10 March Conventional
26 March Index-linked
1. Auctions in Q3 and Q4 are subject to confirmation of the dates of the Pre-Budget Report and the Budget.
27Debt and reserves management report 2008-09
TH E DE B T MA N A G E M E N T OF F I C E ’ S F I N A N C I N G R E M I T F O R 2008-0955.10 The above programme of conventional and index-linked gilt auctions and any others
that may be added during the year may be supplemented between auctions by official sales
of gilts by the DMO “on tap”. Taps of gilts will be used only as a market management
instrument in exceptional circumstances.
5.11 The DMO has no plans to issue gilts by syndicated offering in 2008-09.
5.12 After an auction the DMO will generally refrain from issuing gilts of a similar type or
maturity to the auctioned gilt for a reasonable period, unless already pre-announced, or if
there is a clear market management case for doing so.
5.13 For the purposes of market management, the DMO may create and repo out gilts in
accordance with the provisions of its Standing Repo Facility launched on 1 June 2000 as
revised in the DMO’s announcement of 21 December 200711.
Reverse auct ions
5.14 The DMO has no current plans for a programme of reverse auctions in 2008-09.
Convers ions and switch auct ions
5.15 The DMO has no current plans for a programme of conversion or switch auctions
in 2008-09.
Coupons
5.16 As far as possible, coupons on new issues will be set to price the gilt close to par at the
time of issue.
Buy- ins o f short-matur i ty debt
5.17 The DMO will have responsibility for buying in gilts close to maturity to help manage
Exchequer cash flows.
Revis ions to the remit
5.18 Any aspect of this remit may be revised during the year, in the light of exceptional
circumstances and/or substantial changes in the following:
• the Government’s forecast of the gilt sales requirement;
• the level and shape of the gilt yield curve;
• market expectations of future interest and inflation rates; and
• market volatility.
5.19 Any revisions to the remit will be announced.
28 Debt and reserves management report 2008-09
11 The announcement of 21 December 2007 is available on the DMO website at:http://www.dmo.gov.uk/documentview.aspx?docname=giltspress/pr211207

6TH E DE B T MA N A G E M E N T OF F I C E ’ SEXC H E Q U E R C A S H M A N A G E M E N T R E M I TF O R 2008-09
Debt and reserves management report 2008-09
Exchequer cash management object ive
6.1 The Government’s cash management objective is to ensure that sufficient funds are
always available to meet any net daily central government cash shortfall and, on any day
when there is a net cash surplus, to ensure this is used to best advantage. HM Treasury and
the DMO work together to achieve this.
6.2 HM Treasury’s role in this regard is to make arrangements for a forecast of the daily
net flows into or out of the National Loans Fund (NLF); and its objective in so doing is to
provide the DMO with timely and accurate forecasts of the expected net cash position over
time.
6.3 The DMO’s role is to make arrangements for funding and for placing the net cash
positions, primarily by carrying out market transactions in the light of the forecast; and its
objective in so doing is to minimise the costs of cash management while operating within the
risk appetite approved by Ministers.
6.4 The Government’s preferences in relation to the different types of risk taking inherent
in cash management are defined by a set of explicit limits covering four types of risks, which
taken together represent the Government’s overall risk appetite12. The risk appetite defines
objectively the bounds of appropriate Government cash management in accordance with the
Government’s ethos for cash management as a cost minimising rather than profit maximising
activity and playing no role in the determination of interest rates. The DMO may not exceed
this boundary but within it the DMO will have discretion to take the actions it judges will best
achieve the cost minimisation objective.
The DMO’s cash management object ive
6.5 The DMO’s cash management objective is to minimise the cost of offsetting the
Government’s net cash flows over time, while operating within a risk appetite approved by
Ministers. In so doing, the DMO will seek to avoid actions or arrangements that would:
• undermine the efficient functioning of the sterling money markets; or
• conflict with the operational requirements of the Bank of England for
monetary policy implementation.
Instruments and operat ions used in Exchequer cashmanagement
6.6 The range of instruments and operations that the DMO may use for cash
management purposes is set out in its Operational Notice13. The arrangements for the
issuance of Treasury bills, and the management of the Treasury bill stock in market hands, will
be set out in, and operated according to, the DMO’s Operational Notice.
29
12 The four types of risks are liquidity risk, interest rate risk, foreign exchange risk and credit risk. An explanation of theserisks and the Government’s cash management operations more generally is set out in Chapter 5 of the DMO’s AnnualReview 2004-05, which is available on the DMO’s website at:http://www.dmo.gov.uk/documentview.aspx?docname=publications/annualreviews/gar0405.pdf
13 The current edition of Exchequer Cash Management Operational Notice and Treasury Bill Information Memorandum isavailable on the DMO’s website at:http://www.dmo.gov.uk/documentview.aspx?docname=publications/moneymarkets/opnot110903.pdf
TH E DE B T MA N A G E M E N T OF F I C E ’ S EXC H E Q U E R C A S H M A N A G E M E N T R E M I T F O R 2008-0966.7 One component of the debt sales planned to meet the Government’s annual
financing requirement is the year-on-year change in the outstanding stock of Treasury bills
(excluding bills issued solely for collateral purposes). In addition to the bills issued at
scheduled weekly tenders, the DMO is able to reopen, on request from its counterparties,
existing issues of Treasury bills on a bilateral basis to raise funds for cash management.
This change was announced as part of the financing remit given by HM Treasury to the DMO
last year14.
6.8 During the financial year, the DMO will manage the level of the Treasury bill stock and
may increase or reduce the stock vis-à-vis the end year target level, in order to support the
implementation of Government cash management. The DMO will announce the dates of
Treasury bill tenders on the last Friday of a quarter15. The precise details of the maturity and
the amount of the Treasury bills on offer at specific tenders will be announced one week in
advance.
6.9 As a contingency measure, the DMO may issue Treasury bills to the market to assist
the Bank of England’s operations in the sterling money market for the purpose of
implementing monetary policy while meeting the liquidity needs of the banking sector as a
whole. In response to a request from the Bank, the DMO may add a specified amount to the
size(s) of the next bill tender(s) and deposit the proceeds with the Bank, remunerated at the
weighted average yield(s) of the respective tenders. The amount being offered to
accommodate the Bank’s request will be identified in the DMO’s weekly Treasury bill tender
announcement. Treasury bill issues made at the request of the Bank will be identical in all
respects to Treasury bills issued in the normal course of DMO business.
DMO Col latera l Pool
6.10 To assist the DMO in the efficient execution of its cash management operations, a
combination of Treasury bills and gilts, which shall be chosen to have a negligible effect on
relevant indices, may be issued to the DMO on the third Wednesday of April, July and October
2008 and January 2009. Any such issues to the DMO will only be used as collateral in the
DMO’s cash management operations and will not be available for outright sale. The precise
details of any such issues to the DMO will be announced in advance. If no issue is to take
place in a particular quarter, the DMO will announce that this is the case in advance.
Act ive cash management
6.11 The combination of HM Treasury’s cash flow forecasts and the DMO’s market
operations characterises the active approach to Exchequer cash management. In 2006-07, a
new performance measurement framework for active cash management in which
discretionary decisions that are informed by forecast cash flows are evaluated against a range
of indicators was introduced. These include quantifying the excess returns to active
management by measuring the net cost of cash management after deducting an interest
charge equivalent to the Government’s marginal cost of funds.
30 Debt and reserves management report 2008-09
14 See Chapter 4 (paragraph 4.8) of the Debt and reserves management report 2007-08.15 Or the immediately preceding working day if the last Friday is a public holiday.
TH E DE B T MA N A G E M E N T OF F I C E ’ S EXC H E Q U E R C A S H M A N A G E M E N T R E M I T F O R 2008-09 66.12 The original performance measure had compared the net interest costs of
implementing the chosen active cash management strategy against the net interest cost of a
notional benchmark, intended to represent an alternative, passive default strategy. One of the
reasons for adopting this approach was to ensure that it would be resilient to the volatility
then observed in money market rates. This approach was reviewed internally following the
reforms to the sterling money markets introduced in May 2006 after which the performance
methodology was simplified. Under the new approach, performance is no longer evaluated
against a notional strategy; rather, it can be evaluated directly against the cash management
objective of minimising the costs of offsetting the Government’s cash flows.
6.13 Formal reporting of the performance of active cash management is intended for
publication to take place in 2008-09. HM Treasury and the DMO recognise that measuring the
net costs of active management alone would provide a narrow view of performance. As a
consequence, active cash management performance is evaluated against a series of key
qualitative and quantitative performance indicators that together reflect the ethos and
objectives of the Government.
6.14 Quantitative performance is one such measure. Other indicators and controls that
are used to monitor and assess performance in meeting the Government’s cash management
objectives are listed at Annex C.
31Debt and reserves management report 2008-09

7 NAT I O N A L SAV I N G S & IN V E S T M E N T S ’AC T I V I T I E S I N 2007-08
Debt and reserves management report 2008-09
Introduct ion
7.1 NS&I is both a government department and an executive agency of the Chancellor of
the Exchequer. It is one of the largest savings institutions in the UK and is an integral part of
the Government’s debt management strategy. NS&I contributes to reducing the cost of
Government borrowing by raising cost-effective financing from the retail sector. NS&I meets
this primary objective by offering customers secure savings and investment products that are
both attractive and competitive.
7.2 2007-08 was the first year of NS&I’s five year strategy “Adding Value” which aims to
deliver sustainable long-term value to stakeholders by simplifying, modernising and
diversifying the business. In 2007-08, NS&I’s overall cost of financing was an estimated £353
million lower than that of comparable gilts, taking into account management costs and
imputed tax foregone. NS&I announced nine packages of interest rate changes during 2007-
08. For new issues of fixed rate products, these reflected changes in gilt yields and for variable
rate products these reflected changes in the Bank of England’s base rate as announced by the
Bank’s Monetary Policy Committee. For both fixed and variable rate products, the cost of
providing the product to the customer was also taken into account in the setting of interest
rates and tax foregone where relevant.
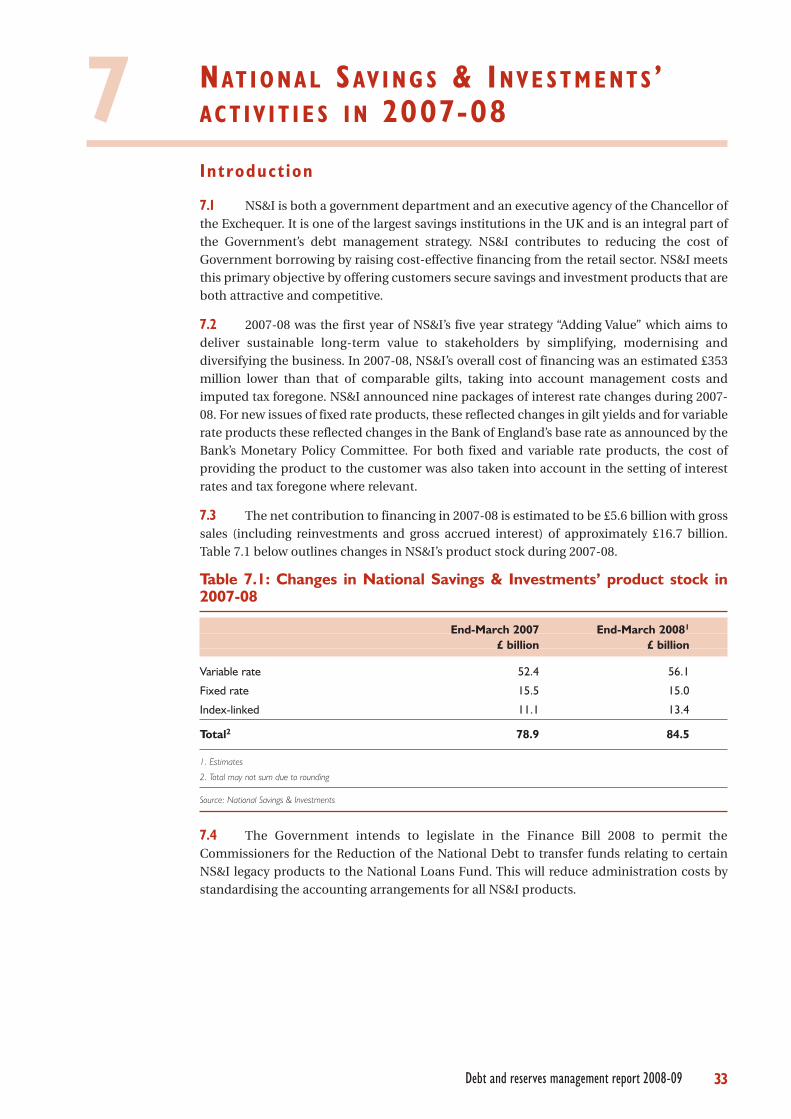
7.3 The net contribution to financing in 2007-08 is estimated to be £5.6 billion with gross
sales (including reinvestments and gross accrued interest) of approximately £16.7 billion.
Table 7.1 below outlines changes in NS&I’s product stock during 2007-08.
Table 7.1: Changes in National Savings & Investments’ product stock in2007-08
End-March 2007 End-March 20081
£ billion £ billion
Variable rate 52.4 56.1
Fixed rate 15.5 15.0
Index-linked 11.1 13.4
Total2 78.9 84.5
1. Estimates
2. Total may not sum due to rounding
Source: National Savings & Investments
7.4 The Government intends to legislate in the Finance Bill 2008 to permit the
Commissioners for the Reduction of the National Debt to transfer funds relating to certain
NS&I legacy products to the National Loans Fund. This will reduce administration costs by
standardising the accounting arrangements for all NS&I products.
33
NAT I O N A L SAV I N G S & IN V E S T M E N T S ’ AC T I V I T I E S I N 2007-087NS&I ’s net f inanc ing target
7.5 The target for NS&I’s net contribution to financing the Government’s gross financing
requirement published at Budget 2007 was £2.8 billion. The forecast for NS&I’s contribution
was revised upwards at the 2007 Pre-Budget Report to £4.2 billion. This was a result of
prevailing market conditions and changes to interest rates and inflation beyond those
originally forecast. However, despite the revised forecast, the official target remains
unchanged. The estimated outturn of £5.6 billion reflects a continued trend since the Pre-
Budget Report of higher than expected deposits and lower repayments.
Divers i f i cat ion o f product d istr ibut ion channels
7.6 NS&I has continued to modernise its product range. It has launched two new
products – Guaranteed Growth Bonds and Guaranteed Income Bonds – while also closing
three products; Capital Bonds, Pensioners Guaranteed Income Bonds and Fixed Rate Savings
Bonds. These changes are designed to standardise and simplify NS&I’s product range.
7.7 In November 2007, NS&I began its marketing partnership with WH Smith (direct
channel execution only), providing it with an additional retail channel alongside that which
it has with the Post Office. NS&I’s distribution channel diversification strategy has continued
to see an increase in sales through the website and the telephone. In 2007-08, approximately
39 per cent of NS&I’s sales were achieved through either the website or the telephone. The
forecast for sales through these channels is for continued growth and is set to reach over 50
per cent of total sales by 2011-12.
Market ing act iv i t ies
7.8 The second marketing campaign to celebrate the 50th anniversary of Premium
Bonds, with a special prize draw in June that involved five £1m prizes rather then the usual
two, was held in April 2007. NS&I sponsored a garden at the Chelsea Flower Show in May 2007
and continued its sponsorship of the BBC’s Proms in the Park. It has actively promoted its
Tracing Service to reunite customers with their funds and has, in collaboration with the
British Bankers Association (BBA) and British Standards Authority (BSA), launched the joint
online tracing portal www.mylostaccount.org.uk. Steps were taken to withdraw the majority
of NS&I’s planned marketing activity once it became clear that it would exceed its net
financing target.
Conclus ion
7.9 NS&I had a year of stronger than expected sales. In line with the “Adding Value”
strategy it has been taking steps to simplify and modernise its product range to the benefit of
customers and continued to develop new and existing distribution channels to help ensure it
continues to deliver its targets in the future.
34 Debt and reserves management report 2008-09
8 NAT I O N A L SAV I N G S & IN V E S T M E N T S ’F I N A N C I N G R E M I T F O R 2008-09
Debt and reserves management report 2008-09
Introduct ion
8.1 NS&I’s aim is to help reduce the cost to the taxpayer of Government borrowing now
and in the future. To achieve this, NS&I’s strategic objective is to provide retail funds for the
Government that are cost-effective in relation to funds raised on the wholesale market.
8.2 The key business objectives for NS&I to deliver its strategic objective are:
• to ensure levels of customer service which meet standards of best practice in
the retail financial services sector; and
• to develop a more flexible and responsive business that can deliver a range of
net financing requirements to HM Treasury.
8.3 In pursuit of its strategic objectives, NS&I will operate fairly, transparently and
competitively, engendering customer loyalty and securing new business by offering attractive
products on fair terms.
Respons ib i l i ty for sett ing product terms
8.4 HM Treasury is ultimately responsible, under the National Loans Act 1968, for setting
the terms of NS&I’s products.
8.5 NS&I will normally take the lead in bringing forward proposals to HM Treasury
Ministers on product development (including proposals for new products) or on product
terms (including interest rates). If the proposals are consistent with NS&I’s objectives, wider
government policy and this remit, Ministers would expect to endorse them.
Volume of f inanc ing in 2008-09
8.6 Gross sales (including reinvestments and gross accrued interest) of NS&I products are
assumed to be around £15.3 billion in 2008-09. After meeting expected maturities and
withdrawals, NS&I is expected to make a net contribution to Government financing of
£4 billion.
Cost o f f inanc ing
8.7 The average cost of NS&I products should lie on average below the cost of equivalent
gilts or other short term comparators.
8.8 NS&I or HM Treasury can initiate a review of product terms at any time. NS&I will
carry out each review. Any proposed changes will take account of the cost of NS&I’s financing,
the achievement of this remit and the need for NS&I to retain the capability and market
presence to contribute to Government financing over the medium term.
Review of remit
8.9 HM Treasury or NS&I may initiate a review of this remit during the course of 2008-09
in the light of any relevant factors.
35

9 MA N A G E M E N T O F T H E OF F I C I A LRE S E R V E S I N 2007-08
Debt and reserves management report 2008-09
Introduct ion
9.1 The Government’s official holdings of international reserves comprise gold, foreign
currency assets and International Monetary Fund (IMF) Special Drawing Rights (SDRs)16.
With the exception of the SDR assets that constitute the UK’s Reserve Tranche Position (RTP)
at the IMF, these assets are held in the Exchange Equalisation Account (EEA).
Orig in and purpose
9.2 The EEA was established in 1932 to provide a fund that could be used, when
necessary, to regulate the exchange value of sterling, and therefore is the mechanism through
which any Government exchange rate intervention would be conducted.
9.3 The Government’s macroeconomic framework is designed to maintain long-term
economic stability. This is achieved by maintaining low inflation, sustainable economic
growth and sound public finances. The framework does not entail management of the
exchange rate and the Government has not intervened for the purposes of influencing the
sterling exchange rate since 1992. Against this background, foreign exchange reserves are held
on a precautionary basis – to meet any change in exchange rate policy in the future, if
required, or in the event of any unexpected shocks. The reserves are also used to provide
foreign currency services for government departments and agencies to provide foreign
exchange for making payments abroad and to buy, sell and hold Special Drawing Rights
(SDRs) as required by the UK’s membership of the IMF. The way the reserve assets are
invested, financed and managed is primarily designed to meet these policy objectives.
9.4 The Bank of England may also hold foreign currency reserves on its own balance
sheet, including for intervention purposes, in pursuit of the Monetary Policy Committee’s
monetary policy objective. This is set out in the Chancellor’s letter to the Governor of the
Bank of England of May 199717.
Management o f the Exchange Equal isat ion Account
9.5 The EEA is under the control of HM Treasury, which appoints the Bank of England as
its agent to carry out the day-to-day management of the international reserves (‘the
reserves’). An annual Service Level Agreement (SLA) between HM Treasury and the Bank
specifies the parameters under which the reserves are managed. This SLA includes
investment benchmarks and limits for controlling credit, market and other risks. The SLA
specifies:
• benchmarks18 for investing the reserves, with limits to the Bank’s discretion to
take currency or interest rate positions relative to these benchmarks;
• the framework for controlling credit, market, liquidity and other risks;
37
16 The SDR is an international reserve asset created by the IMF. Its value is defined in terms of a basket of the US dollar,the euro, the yen and sterling. More information on the SDR can be found at:http://www.imf.org/external/np/exr/facts/sdr.HTM
17 This letter is available on the HM Treasury website at: http://www.hm-treasury.gov.uk/newsroom_and_speeches/press/1997/press_40_97letter.cfm
18 The benchmark is the neutral or passive investment strategy for the reserves portfolio. Active managementperformance is measured against a target return over the benchmark.

MA N A G E M E N T O F T H E OF F I C I A L RE S E R V E S I N 2007-089• a target return for active management compared to benchmark positions; and
• the programme for financing the reserves, covering the EEA’s foreign currency
borrowing and currency swaps out of sterling.
9.6 A summary of the current Service Level Agreement (SLA) which excludes market-
sensitive risk limits is set out in Chapter 10.
Financ ing o f the reser ves
9.7 The reserve assets are partly financed either by issuing securities denominated in
foreign currency or, alternatively, sterling financing from issuing gilts is used to acquire
foreign currency assets. The Government retains a flexible approach to determining which
method to adopt depending upon least cost. Least cost can be determined by comparing, on
a swapped basis, the cost of issuing bonds in foreign currency of a given maturity and
nominal amount with the cost of issuing in sterling. The Government last issued a US$3.0
billion five year Eurobond in 2003. The remaining part of the reserves are financed by retained
earnings, historic sales of sterling for foreign currency and the EEA’s net SDR position.
9.8 The reserve assets are divided between those that are currency-hedged and those that
are unhedged for currency risk. The currency-hedged reserves are also largely hedged against
interest rate risk, through the use of swaps. The unhedged reserves are in effect the net asset
position in foreign currency (because the rest of the reserves are hedged with matching
foreign currency liabilities): they comprise dollar and euro-denominated bonds, gold, the
Reserve Tranche Position (which is part of the National Loans Fund) and yen exposure
obtained largely through forward yen purchases. Movements in the value of the reserves
largely arise from changes in the value of these assets.
Composi t ion and s ize o f the Reser ves
9.9 EEA assets need to be highly liquid so that they can be made available quickly for
intervention purposes (or other permitted uses) if necessary. Inevitably, these assets (other
than gold) carry some element of credit risk. In order to keep this risk at a low level and to
ensure a high level of liquidity, the funds of the EEA are predominantly invested in securities
issued or guaranteed by the national governments of the United States, euro-area countries
and Japan and in the debt instruments of highly-rated banks.
9.10 Table 9.1 sets out developments in UK official holdings of international reserves. The
value of the gross foreign exchange reserves rose over the year, from US$51.7 billion at end-
December 2006 to US$57.9 billion at end-December 2007. This was mainly because of
valuation effects resulting from the rise in the dollar value of gold and the appreciation of the
euro against the US dollar. There was also a slight compositional shift from SDR-
denominated assets to foreign currency assets, reflecting repayments from countries that had
borrowed from the IMF. The level of the UK’s unhedged reserves rose over the year, from
US$20.9 billion at end-December 2006 to US$24.7 billion at end-December 2007, also
because of revaluation effects.
38 Debt and reserves management report 2008-09
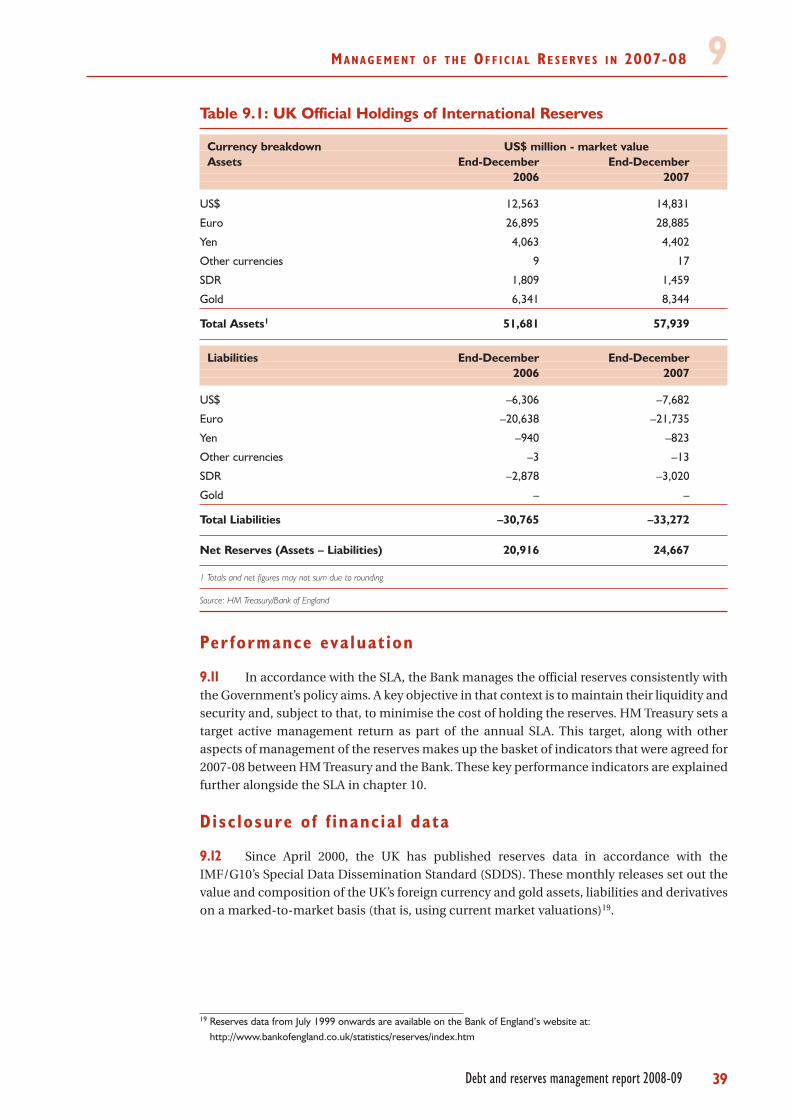
MA N A G E M E N T O F T H E OF F I C I A L RE S E R V E S I N 2007-08 9Table 9.1: UK Official Holdings of International Reserves
Currency breakdown US$ million - market valueAssets End-December End-December
2006 2007
US$ 12,563 14,831
Euro 26,895 28,885
Yen 4,063 4,402
Other currencies 9 17
SDR 1,809 1,459
Gold 6,341 8,344
Total Assets1 51,681 57,939
Liabilities End-December End-December2006 2007
US$ –6,306 –7,682
Euro –20,638 –21,735
Yen –940 –823
Other currencies –3 –13
SDR –2,878 –3,020
Gold – –
Total Liabilities –30,765 –33,272
Net Reserves (Assets – Liabilities) 20,916 24,667
1 Totals and net figures may not sum due to rounding
Source: HM Treasury/Bank of England
Per formance eva luat ion
9.11 In accordance with the SLA, the Bank manages the official reserves consistently with
the Government’s policy aims. A key objective in that context is to maintain their liquidity and
security and, subject to that, to minimise the cost of holding the reserves. HM Treasury sets a
target active management return as part of the annual SLA. This target, along with other
aspects of management of the reserves makes up the basket of indicators that were agreed for
2007-08 between HM Treasury and the Bank. These key performance indicators are explained
further alongside the SLA in chapter 10.
Disc losure o f f inanc ia l data
9.12 Since April 2000, the UK has published reserves data in accordance with the
IMF/G10’s Special Data Dissemination Standard (SDDS). These monthly releases set out the
value and composition of the UK’s foreign currency and gold assets, liabilities and derivatives
on a marked-to-market basis (that is, using current market valuations)19.
39Debt and reserves management report 2008-09
19 Reserves data from July 1999 onwards are available on the Bank of England’s website at:http://www.bankofengland.co.uk/statistics/reserves/index.htm
MA N A G E M E N T O F T H E OF F I C I A L RE S E R V E S I N 2007-0899.13 HM Treasury publishes the financial accounts for the EEA as part of the statutory
obligations set out in the Exchange Equalisation Account Act 1979 (as amended by the
Finance Act 2000). The financial accounts for 2006-07, audited by the National Audit Office,
were accordingly published and laid before both Houses of Parliament on 12 July 200720.
Inter vent ion
9.14 The Government announced in September 1997, as part of its commitment to
openness and transparency with respect to the reserves, that it would publish details of any
intervention undertaken to influence exchange rates in the subsequent monthly press
release. Since September 1997, the UK authorities have only intervened on one occasion,
when the Government joined a concerted intervention by the G7 to support the euro in
September 2000.
40 Debt and reserves management report 2008-09
20 The Financial Accounts for the EEA can be viewed on HM Treasury’s website at: http://www.hm-treasury.gov.uk/media/A/3/eea_accounts120707.pdf

10TH E BA N K O F EN G L A N D’ S SE R V I C ELE V E L AG R E E M E N T F O R M A N A G E M E N T O FT H E OF F I C I A L RE S E R V E S
Debt and reserves management report 2008-09
Introduct ion
10.1 The Service Level Agreement (‘SLA’) sets out the arrangements for the Bank of
England acting as HM Treasury’s agent in managing the Exchange Equalisation Account
(‘EEA’). It will remain in force indefinitely and be reviewed annually.
10.2 The SLA provides both parties with an understanding of what constitutes an
acceptable level of service in managing the EEA.
10.3 The SLA should be read in conjunction with all relevant legislation, particularly the
Exchange Equalisation Account Act 1979, as amended by the Finance Act 2000, which
provides that the EEA shall be used:
• for checking undue fluctuations in the exchange value of sterling;
• for securing the conservation or disposition in the national interest of the
means of making payments abroad;
• for the purpose specified in Section 1(3) of the International Monetary Fund
Act 1979 (payment of charges under Section 8 of Article V of the Articles of
Agreement of the International Monetary Fund); and
• for carrying out any of the functions of the Government of the United
Kingdom under those of the said Articles of Agreement which relate to Special
Drawing Rights (SDRs).
Object ives
10.4 The Bank of England will at all times:
• carry out efficiently and cost effectively in a legal and proper form foreign
currency and gold transactions on behalf of HM Treasury and other
government departments, including the issuance of foreign currency debt on
behalf of HM Treasury;
• manage the reserves so as to maintain their liquidity and security within limits
agreed with HM Treasury and ensure that the public funds entrusted to the
Bank in the EEA are properly and well managed and safeguarded. Subject to
these limits, the Bank will manage the reserves to maximise their return;
• advise HM Treasury on the financing of the reserves, including, as necessary,
the management of foreign currency borrowing (covering new borrowing,
hedging and repayments);
• monitor and report to HM Treasury on the level of risk and return on holding
the reserves and provide accurate and timely accounting and management
information and statistical analysis pertaining to the reserves as requested by
HM Treasury;
41
THE BANK OF ENGLAND’S SERVICE LEVEL AGREEMENT FOR MANAGEMENT OF THE OFFICIAL RESERVES10• ensure that effective management systems, including financial monitoring
and control systems, are in operation and that proper financial procedures are
followed and that accounting records are maintained in a form suited to the
requirements of management as well as in the form prescribed for the
published accounts; and
• advise HM Treasury as to how to ensure that the EEA assets have the fullest
possible protection of sovereign immunity and that the EEA enters into
appropriate legal agreements with counterparties, nominees, delegates and
agents that provide the fullest possible protection for EEA assets, subject to
commercial feasibility.
10.5 To help gauge the effectiveness of the Bank of England’s management of the reserves,
HM Treasury and the Bank have introduced a set of key performance indicators. Performance
against these indicators will be published in the EEA accounts for 2007-08. These
performance measures are explained in Box 10.1.
Author ised f inanc ia l instruments
10.6 The reserves can be invested in a specified range of financial instruments:
• bonds and commercial paper issued by other national governments,
supranational organisations and selected official sector agencies;
• foreign currency spot, forward and swap transactions;
• interest rate and currency swaps;
• bond and interest rate futures, swap notes and swap futures;
• sale and repurchase, and buy-sell back, agreements;
• gold deposits;
• forward rate agreements;
• SDRs;
• bank deposits; and
• certificates of deposit and corporate commercial paper.
Act ive management
10.7 The Bank will actively manage the reserves against a number of benchmarks. The
benchmarks will be reviewed regularly and constructed so that they are replicable and
represent HM Treasury’s long-term investment strategy. They are split into benchmarks for
the currency-hedged reserves (on which currency and interest rate exposures are hedged)
and the unhedged reserves which are not hedged against exchange rate and interest rate risk.
The Bank’s scope to deviate from the benchmarks through active management will be
constrained by agreed risk limits.
42 Debt and reserves management report 2008-09
THE BANK OF ENGLAND’S SERVICE LEVEL AGREEMENT FOR MANAGEMENT OF THE OFFICIAL RESERVES 10Risk management
10.8 The Bank will:
• ensure that the risks associated with its management of the EEA are properly
identified, evaluated and mitigated and that exposures comply with the
detailed credit risk, market risk and operational risk framework and limits
agreed with HM Treasury at the start of the year;
• monitor the EEA’s credit exposures on a daily basis, applying the credit risk
framework agreed with HM Treasury. The Bank will review this framework and
the credit limits it provides in the light of market or institutional
developments, and changes in the nature of the EEA’s activities. The Bank will
assess the credit rating of each counterparty, issuer and banking sector;
• monitor the exposure of the EEA to market risk and ensure that it complies
with the limits agreed with HM Treasury using Value at Risk (VaR) which
provides a means of aggregating risk consistently across the components of
the portfolio, and stress tests to quantify the potential loss from particular
scenarios; and
• confirm to HM Treasury, on a quarterly basis, that sufficient controls were in
place to mitigate the operational risks affecting the EEA during that quarter,
that appropriate mechanisms were in place to identify and address new risks
and that the processes and framework in place adequately meet the
“Turnbull” requirements21 relating to the Bank’s management of the EEA. If
appropriate, exceptions to such confirmation will be listed.
43Debt and reserves management report 2008-09
21 Internal Control: Guidance for Directors on the Combined Code issued by the Institute of Chartered Accountants inEngland and Wales.

THE BANK OF ENGLAND’S SERVICE LEVEL AGREEMENT FOR MANAGEMENT OF THE OFFICIAL RESERVES10
Box 10.1: Key Performance Indicators in 2007-08
HM Treasury and the Bank of England have agreed a set of performance measures to be introducedduring the course of 2007-08. The intent of the performance measures is to provide a basket ofindicators that can be used to assess the effectiveness of the management of the EEA.
The Government’s prime objective in managing the EEA is to ensure the reserves are fit for purposein order to meet current policy objectives and any potential future changes in policy. In support ofthat, the Government’s objective is to preserve the liquidity and security of the reserves and toensure that the Government maintains its capability to intervene in the foreign exchange market ifrequired. Subject to this, the aim is to minimise the overall cost of holding the reserves, whileensuring exposure to financial risk is limited through the appropriate choice of portfolio and riskmanagement practices.
HM Treasury’s role is to:
• ensure that its choice for the strategic composition for the benchmark asset allocation of thereserves, including gold, meets the policy objectives set out above. Subject to meeting thoseobjectives, HM Treasury will make that benchmark asset allocation choice to trade off risk,return and liquidity in line with its risk preferences. The performance of the reserves, includingfinancial outturns, will be reported in the annual accounts; and
• set an active management return target for the Bank in managing the reserves against thebenchmark, subject to the limits detailed in the SLA. This target will be set to at least coverthe costs of the Bank in managing the EEA.
The foreign currency reserves will be invested in assets that are liquid and secure. Specifically;
• a minimum of 90 per cent will be held in tradable debt securities and cash;
• a minimum of 90 per cent will be invested in assets that are rated at least AA-; and
• all assets must be investment grade.
The Bank will observe the limits as set out in the SLA. In line with the SLA, any substantive breachesof the limits and/or any operational errors will be reported to HM Treasury as soon as possible, alongwith advice, if necessary, as to how best to deal with them. Any significant breach will be reportedpublicly (e.g. in the annual accounts).
In order to aim to at least cover costs, and to ensure that the Bank maintains its capability tointervene in the foreign exchange market if required, the Bank will actively manage the EEA portfolioagainst the benchmark to meet the active management return target set by HM Treasury, whilstensuring compliance with the limits as detailed in the SLA.
The Bank will ensure that all transactions that relate to the Government and the IMF shall be handledefficiently, accurately and in a timely fashion.
In carrying out its services, the Bank will as far as possible ensure that:
• its management and staff are of high repute and integrity;
• staff training and experience are appropriate for the tasks they are expected to undertake andconsistent with the amount of risk that they are authorised to take;
• its internal systems and controls are adequate for the size, nature and complexity of EEAoperations and comply with best market practice so far as possible; and
• appropriate preparations are made for possible policy deployment of the reserves (e.g. foreignexchange intervention).
These performance measures were introduced during the course of 2007-08 and HM Treasury andthe Bank will report formally against them in the 2007-08 financial accounts.
44 Debt and reserves management report 2008-09
THE BANK OF ENGLAND’S SERVICE LEVEL AGREEMENT FOR MANAGEMENT OF THE OFFICIAL RESERVES 10Audit arrangements and account ing requirements
10.9 The Bank will agree the annual programme of work of the Bank’s Internal Audit
Division pertaining to the EEA with HM Treasury by the beginning of the year. The Bank’s
internal audit arrangements will follow the standards set by the Institute of Internal Auditors
UK and Ireland and will accord with the objectives, standards and practices set out in HM
Treasury’s “Government Internal Audit Standards”. The Bank will maintain the EEA’s accounts
drawn up in accordance with UK GAAP as far as appropriate and in accordance with the
relevant Accounts Directions.
Nat ional Audit Of f i ce access
10.10 For the purposes of:
• the examination and certification of the EEA accounts; or
• any examination pursuant to Section 6(1) of the National Audit Act 1983 or
any re-enactment thereof of the economy, efficiency and effectiveness with
which the Bank has managed the EEA;
the National Audit Office (NAO) may examine such documents as it may reasonably require
which are owned, held, or are otherwise within the control of the Bank, have access to Bank
buildings, and may require the Bank to produce such oral or written factual explanations as
it considers necessary. However, the NAO will address substantive questions on the
management of the reserves to HM Treasury and not the Bank.
HM Treasury ’s respons ib i l i t ies
10.11 HM Treasury is responsible for monitoring the risk environment and performance of
the Bank of England in managing the reserves. To support this process, the Bank provides the
following management information:
• monthly financial reporting, detailing the returns made with respect to the
management of the EEA and the market and credit risks incurred;
• quarterly management reports on operational risk issues and the Bank’s
compliance with the guidance issued by the Turnbull Report (see footnote 21).
These reports highlight the Bank of England’s role in identifying, assessing,
managing and monitoring the risks relating to its management of the EEA;
• quarterly reports from the Bank’s Internal Audit Division on the internal audit
programme agreed for the EEA; and
• Bank and HM Treasury officials meet at regular reserves meetings to review
the performance against the parameters set out in the SLA and to consider
wider operational and policy issues. The EEA Accounting Officer and the
Bank’s Executive Director for Markets meet twice each year to discuss overall
strategy and governance issues.
45Debt and reserves management report 2008-09
THE BANK OF ENGLAND’S SERVICE LEVEL AGREEMENT FOR MANAGEMENT OF THE OFFICIAL RESERVES10Financ ing the reser ves
10.12 The Bank of England will provide HM Treasury with relevant market intelligence and
advice on options for financing the reserves with a view to minimising the costs and risks to
the Government. An annual financing programme for the currency-hedged reserves will be
agreed between the Bank of England and HM Treasury at the beginning of the financial year.
The Bank of England will undertake this programme in accordance with the timetable and
guidelines agreed, as well as any changes subsequently agreed with HM Treasury.
10.13 The Bank of England will act as HM Treasury’s agent in issuing and managing any
foreign currency liabilities associated with the reserves. The Bank of England will provide
regular information on the pricing of foreign currency debt and, if agreed with HM Treasury,
will appoint managers to undertake an issuance in accordance with HM Treasury’s
instructions.
Ster l ing cash management
10.14 The Bank of England will liaise closely with the DMO with respect to managing
sterling flows relating to EEA operations. The Bank of England will, so far as is possible, aim
to manage the EEA so as to avoid conflict with the DMO’s sterling cash management
operations while in no way disadvantaging the EEA.
Publ icat ion requirements
10.15 The Bank of England will provide the figures for the United Kingdom’s official
holdings of international reserves monthly Press Notice, by no later than 2pm on the second
working day of every month, to be published on the third working day of every month. The
format for this Press Notice will be in accordance with the requirements of the IMF’s Special
Data Dissemination Standard and will be aligned with the conventions of the G10/IMF
reserves template published on the Bank of England’s web site. The monthly Press Notice will
provide details of the amount and date of any official intervention during the month and an
explanation of why it was undertaken.
Inter vent ion
10.16 Specific prior authority from Treasury Ministers is required for intervention designed
to influence sterling exchange rates using the EEA, or for EEA participation in concerted
intervention in support of any other currency. The Bank of England will subsequently report
on the extent to which any such authority was used, and to what effect, by letter.
46 Debt and reserves management report 2008-09
11 CE N T R A L GOV E R N M E N T ’ S F I N A N C I A LA S S E T A N D L I A B I L I T Y R I S K M O N I T O R
Debt and reserves management report 2008-09
Introduct ion
11.1 The central government’s asset and liability monitor (‘the monitor’) is produced in
order to aid quantification of the risks faced by central government on its balance sheet and
forms part of an ongoing HM Treasury work programme. It should be regarded as a ‘work in
progress’ because it records only current financial assets and liabilities of central government
and some of the calculations involve approximating assumptions. Therefore, it cannot be
reconciled with other central government accounting publications and is not subject to audit.
11.2 The monitor is a precursor to the publication of ‘Whole of Government Accounts’22
and is in accordance with the transparency and accountability recommendations published
in the International Monetary Fund’s ‘Guidelines on Public Debt Management’ 200323.
11.3 It should be noted that the monitor records only one aspect of the Government’s
wider financial position as it currently covers only financial assets and liabilities of central
government. For example, it does not take account of other significant public sector assets
and liabilities such as local authorities’ assets, or, non-financial assets and liabilities such as
contingent liabilities or future tax revenue streams. Information covering the Government’s
wider fiscal position and prospects going forward can be found in the 2008 Long-term public
finance report24, which provides a comprehensive assessment of the sustainability of the
public finances.
Descr ipt ion o f table 1 1 . 1
11.4 Table 11.1 below shows total assets and liabilities by type and by managing
institution. In addition to nominal and market values of the assets and liabilities, some other
key variables are reported, which help to provide greater insight into the characteristics of
central government’s balance sheet thereby facilitating a better evaluation of the risks that the
balance sheet is exposed to. These key variables are explained in Box 11.1.
47
22 From the 2009-10 financial year onwards, Government Accounts will be prepared using International FinancialReporting Standards, as adapted in the public sector context. The whole of Government Accounts will be presented onthe same basis from 2009-10.
23 The latest version of the Guidelines on Public Debt Management can be found on the IMF website at:http://www.imf.org/external/np/mfd/pdebt/2003/eng/am/index.htm
24 “2008 Long-term public finance report, HM Treasury, March 2008 can be found on HM Treasury’s website. See also the2003 Long-term public finance report, HM Treasury, December 2003, which provides a discussion of the differentapproaches to assessing long-term fiscal sustainability and can be found on HM Treasury’s website at: http://www.hm--treasury.gov.uk/media/8FS/85/pbro4long_term473.pdf.

CE N T R A L GOV E R N M E N T ’ S F I N A N C I A L A S S E T A N D L I A B I L I T Y R I S K M O N I T O R11
Key facts – centra l government ’s f inanc ia l assets
11.5 The nominal value of the central government’s total financial assets was £175.6 billion
at end-December 2007. This compares with £156.1 billion at end-December 2006. This
change was primarily due to an increase of £30.1 billion in short-term bills held by the
Commissioners for the Reduction in National Debt (CRND) in central Government funds,
other short-term assets held by the DMO (£6.4 billion), and the Public Works Loan Board (£1.3
billion). These were partly offset by a decrease of gilts held by the DMO (£18.2 billion).
11.6 The market value of central government’s total financial assets was £188.0 billion at
end-December 2007 compared with £166.1 billion at end-December 2006, an increase of
£21.9 billion.
11.7 The average modified duration, which excludes the gold volatility measure and
duration for index linked gilts, decreased to 5.8 years at end-December 2007 from 6.6 years
at end-December 2006. Average maturity over the period decreased to 11.7 years from
12.5 years.
11.8 The largest single contributor to the central government’s financial assets are
deposits given to the DMO by the CRND (£50.1 billion), which make up nearly 29 per cent of
the total nominal value. Other significant contributors include loans to local authorities from
the Public Works Loans Board (£49.0 billion or 28 per cent of total), foreign currency assets
managed by the Bank of England (£28.0 billion or 16 per cent of total) and other short-term
assets held by the DMO (£11.6 billion or 7 per cent of total).
Box 11.1: Description of variables in the Central Government Financial Asset andLiability Risk Monitor
• Nominal value and market value1 – the nominal value of assets or liabilities is the value atwhich they would be repaid. The market value is the value of assets or liabilities if they werepurchased in the market. For example, the nominal value of central government’s gilt liabilitiesrepresents the amount that the Government would pay on redemption of these liabilitieswhereas the market value of the gilt liabilities is their tradable value in the secondary market.
• Maturities of less than one year – the nominal value of the assets or liabilities that have lessthan one year before they are redeemed.
• Average modified duration – this is a measure of the sensitivity of the value of assets orliabilities to interest rate movements. In the context of the asset and liability monitor, durationoffers some indication of how great an impact small interest rate changes might have on thepresent value of the central government’s balance sheet. Other things equal, longer durationsuggests a greater degree of sensitivity to small interest rates changes.
• Average maturity – indicates the market value weighted average length of time (in years)before assets and liabilities are due to be redeemed.
• Floating rate composition – the value of those assets and liabilities that are indexed to ashort-term money market interest rate.
1 Nominal Value of index-linked gilts includes inflation uplift.
48 Debt and reserves management report 2008-09
CE N T R A L GOV E R N M E N T ’ S F I N A N C I A L A S S E T A N D L I A B I L I T Y R I S K M O N I T O R 11Key facts – centra l government ’s f inanc ia l l iab i l i t ies
11.9 The nominal value of central government’s total financial liabilities was £677.4 billion
at end-December 2007. This is an increase of £43.8 billion compared with end-December
2006 (£633.6 billion). This change is attributable primarily to an increase of £14.7 billion in
gross gilts in issue by the DMO to £474.4 billion, an increase of £5.7 billion in NS&I products
to £83.8 billion and other short-term liabilities managed by the DMO of £1.4 billion from
£12.7 billion. These were partially offset by a decrease in Treasury bills managed by the DMO
of £3.9 billion to £16.5 billion.
11.10 The market value of the central government’s total financial liabilities at end-
December 2007 was £718.4 billion compared with £671.5 billion at end-December 2006, an
increase of £46.9 billion.
11.11 The average modified duration of the financial liabilities at end-December 2007 was
6.4 years, a marginal increase of 0.2 years from December 2006 (at 6.2 years) and the average
maturity of the financial liabilities was also higher at 11.0 years compared with 10.9 years at
end-December 2006, reflecting increases in marketable gilts in issue. There was a 2.7 per cent
increase in the nominal value of liabilities with a maturity of less than one year from £111.8
billion to £114.8 billion.
11.12 Gross gilts issued represent the highest proportion of central government financial
liabilities (£474.4 billion), accounting for 70 per cent of the nominal value of total financial
liabilities. Other significant liabilities include those managed by NS&I (£83.8 billion)
accounting for 12 per cent of the nominal value of total liabilities, DMO holdings of other
short-term bills (£50.1 billion), Treasury bills (£16.5 billion), Ways and Means Advance
(£13.4 billion) and the DMO’s repos-outstanding (£12.7 billion).
49Debt and reserves management report 2008-09
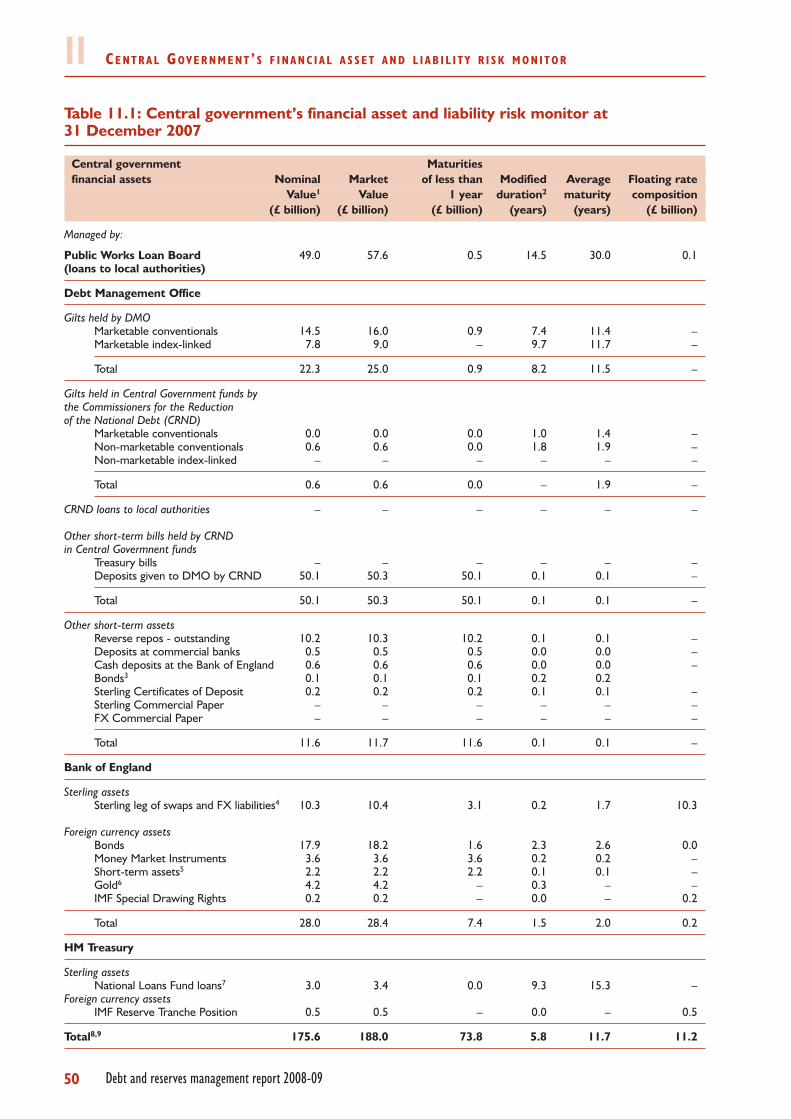
CE N T R A L GOV E R N M E N T ’ S F I N A N C I A L A S S E T A N D L I A B I L I T Y R I S K M O N I T O R11Table 11.1: Central government’s financial asset and liability risk monitor at 31 December 2007
Central government Maturitiesfinancial assets Nominal Market of less than Modified Average Floating rate
Value1 Value 1 year duration2 maturity composition(£ billion) (£ billion) (£ billion) (years) (years) (£ billion)
Managed by:
Public Works Loan Board 49.0 57.6 0.5 14.5 30.0 0.1(loans to local authorities)
Debt Management Office
Gilts held by DMOMarketable conventionals 14.5 16.0 0.9 7.4 11.4 –Marketable index-linked 7.8 9.0 – 9.7 11.7 –
Total 22.3 25.0 0.9 8.2 11.5 –
Gilts held in Central Government funds bythe Commissioners for the Reductionof the National Debt (CRND)
Marketable conventionals 0.0 0.0 0.0 1.0 1.4 –Non-marketable conventionals 0.6 0.6 0.0 1.8 1.9 –Non-marketable index-linked – – – – – –
Total 0.6 0.6 0.0 – 1.9 –
CRND loans to local authorities – – – – – –
Other short-term bills held by CRNDin Central Govermnent funds
Treasury bills – – – – – –Deposits given to DMO by CRND 50.1 50.3 50.1 0.1 0.1 –
Total 50.1 50.3 50.1 0.1 0.1 –
Other short-term assetsReverse repos - outstanding 10.2 10.3 10.2 0.1 0.1 –Deposits at commercial banks 0.5 0.5 0.5 0.0 0.0 –Cash deposits at the Bank of England 0.6 0.6 0.6 0.0 0.0 –Bonds3 0.1 0.1 0.1 0.2 0.2Sterling Certificates of Deposit 0.2 0.2 0.2 0.1 0.1 –Sterling Commercial Paper – – – – – –FX Commercial Paper – – – – – –
Total 11.6 11.7 11.6 0.1 0.1 –
Bank of England
Sterling assetsSterling leg of swaps and FX liabilities4 10.3 10.4 3.1 0.2 1.7 10.3
Foreign currency assetsBonds 17.9 18.2 1.6 2.3 2.6 0.0Money Market Instruments 3.6 3.6 3.6 0.2 0.2 –Short-term assets5 2.2 2.2 2.2 0.1 0.1 –Gold6 4.2 4.2 – 0.3 – –IMF Special Drawing Rights 0.2 0.2 – 0.0 – 0.2
Total 28.0 28.4 7.4 1.5 2.0 0.2
HM Treasury
Sterling assetsNational Loans Fund loans7 3.0 3.4 0.0 9.3 15.3 –
Foreign currency assetsIMF Reserve Tranche Position 0.5 0.5 – 0.0 – 0.5
Total8,9 175.6 188.0 73.8 5.8 11.7 11.2
50 Debt and reserves management report 2008-09

CE N T R A L GOV E R N M E N T ’ S F I N A N C I A L A S S E T A N D L I A B I L I T Y R I S K M O N I T O R 11Table 11.1: Central government’s financial asset and liability risk monitor at 31 December 2007 (continued)
Central government Maturitiesfinancial liabilities Nominal Market of less than Modified Average Floating rate
Value1 Value 1 year duration2 maturity composition(£ billion) (£ billion) (£ billion) (years) (years) (£ billion)
Managed by:
National Savings & Investments 83.8 83.8 10.7 5.3 5.1 55.6
Debt Management Office
Gross gilts in issue10
Marketable conventionals 337.9 359.5 15.3 8.8 13.5 –Non-marketable conventionals 0.6 0.6 0.0 1.8 1.9 –Marketable index-linked 135.9 155.4 – 12.5 15.0 –Non-marketable index-linked – – – – – –
Total 474.4 515.5 15.3 – 13.9 –
Treasury bills11 16.5 16.4 16.5 0.1 0.1 –Other short-term bills 50.1 50.3 50.1 0.1 0.1 –
Total 66.6 66.7 66.6 0.1 0.1 –
Other short-term liabilitiesRepos – outstanding 12.7 12.7 12.7 0.1 0.1 –Deposits made by local authorities 2.0 2.0 2.0 0.1 0.1and commercial banks
Total 14.7 14.7 14.7 0.1 0.1 –
Bank of England
Sterling liabilitiesWays and Means Advance 13.4 13.4 – 0.0 – 13.4
Foreign currency liabilitiesHMG Bonds 1.5 1.5 1.5 0.5 0.5 –Loans 0.0 0.0 0.0 0.0 0.0 –Repos 2.8 2.8 2.8 0.0 0.1 –Swaps & FX Liabilities (excludes £ leg)12 11.0 10.8 3.2 0.9 1.2 11.0IMF Special Drawing Rights allocation 1.5 1.5 – 0.0 – 1.5
Total 16.8 16.6 7.5 0.6 0.8 12.5
HM Treasury
Sterling liabilitiesIMF non-interest bearing securities 7.7 7.7 – 0.0 – 7.7
Total7,8 677.4 718.4 114.8 6.4 11.0 89.2
Figures may not sum due to rounding
Source: Bank of England/Debt Management Office/HM Treasury/National Savings & Investments
1 Nominal value of index-linked gilts includes inflation uplift.2 Modified duration of index-linked gilts is calculated with respect to changes in real yield.3 Sterlling denominated supranational bonds.4 Modified duration covers swaps only.5 Short term assets = deposits + reverse repos.6 Modified duration gold = 30-day moving average volatility of spot gold prices.7 NLF loans are composed of loans to nationalised industries and public corporations. Market value is approximated by the nominal value.8 Totals for modified duration are weighted by market value. Gold volatility measure and duration for index-linked gilts are excluded from this caluculation.9 Total for average maturity are weighed by market value.10 Non-marketable gilts are held by the Commissioners for the Reduction of the National Debt (CRND).11 Nominal value is different from Table 2.1 because Table 11.1 includes transactions made prior to end-December 2007 but due to mature in the first quarter of 200812 Modified duration covers swaps only.
51Debt and reserves management report 2008-09


A KE Y D E V E LO P M E N T S I N T H E G I LTM A R K E T: AP R I L 2007 T O JA N UA RY 2008
Debt and reserves management report 2008-09
A.1 This annex summarises the key developments in the gilt market in 2007-08 (to end-
January 2008). A more comprehensive review of the year as a whole, in the context of
developments in other major international bond markets, will be published in the DMO
Annual Review 2007-08.
Nominal par g i l t y ie ld cur ves
A.2 The significant disinversion of the nominal par gilt curve between end-March 2007
and end-January 2008 is shown in Chart A1. Yields fell at all maturities except at the very long
end (over 40- years) where they increased slightly. 2-year par yields fell by 114 basis points to
4.23 per cent, 5-year yields fell by 87 basis points to 4.35 per cent, 10-year yields fell by 45 basis
points to 4.50 per cent and 30-year by 7 basis points to 4.34 per cent. 50- year par yields, on
the other hand, rose slightly by 4 basis points to 4.22 per cent over the same period.
Convent ional benchmark g i l ts
A.3 The first quarter of the financial year was characterised by a general and sustained
rise in gilt yields. However, strong inflation data published mid-month showed CPI at 3.1 per
cent. This led to an increase in the market’s expectation of the upward path of future interest
rates. The repo rate was increased by 25 basis points to 5.5 per cent in May and yields
continued to rise throughout the month. There were further increases towards the end of the
month in the wake of strong US economic data – which had pushed US Treasury yields higher.
This trend continued into June, with nominal yields rising along the curve by approximately
20 basis points.
Chart A1: Par gilt yield curvesChart A1: Par gilt yield curves
Years to maturity
Source: Debt Management Office
per
cent
50484644424038363432302826242220181614121086420
31-Jan-0830-Mar-07
5.6
5.4
5.2
5.0
4.8
4.6
4.4
4.2
4.0
53
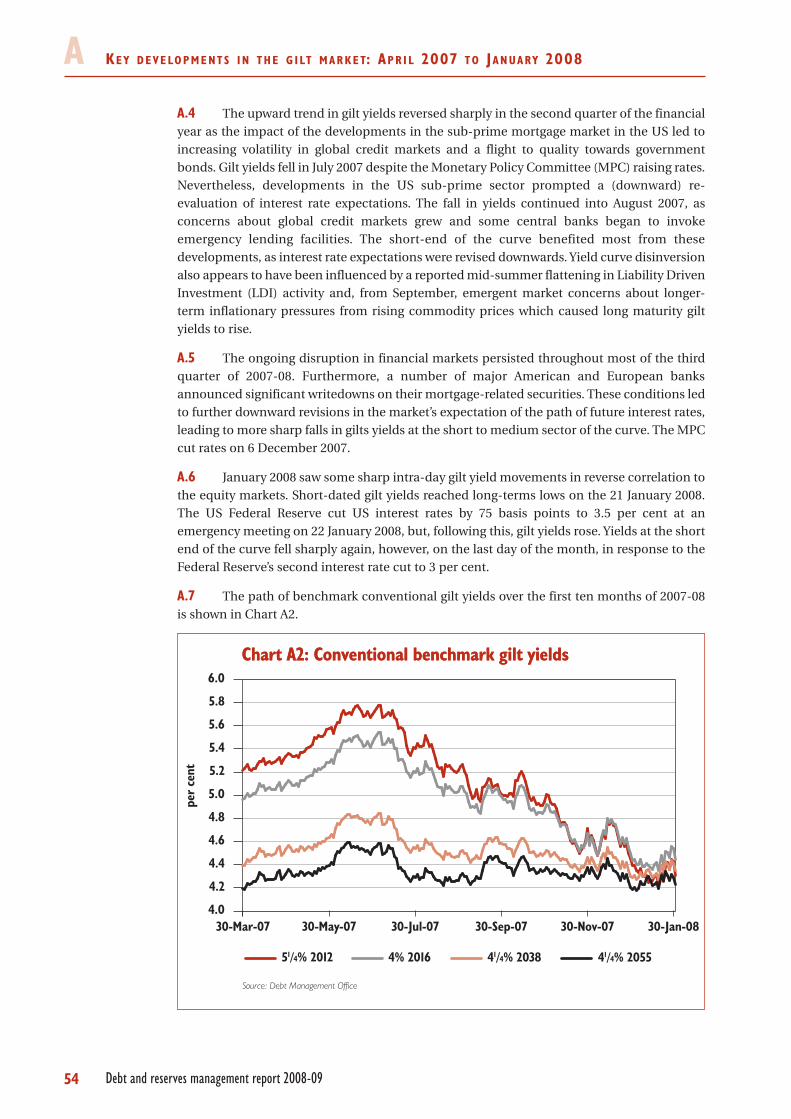
KE Y D E V E LO P M E N T S I N T H E G I LT M A R K E T: AP R I L 2007 T O JA N UA RY 2008AA.4 The upward trend in gilt yields reversed sharply in the second quarter of the financial
year as the impact of the developments in the sub-prime mortgage market in the US led to
increasing volatility in global credit markets and a flight to quality towards government
bonds. Gilt yields fell in July 2007 despite the Monetary Policy Committee (MPC) raising rates.
Nevertheless, developments in the US sub-prime sector prompted a (downward) re-
evaluation of interest rate expectations. The fall in yields continued into August 2007, as
concerns about global credit markets grew and some central banks began to invoke
emergency lending facilities. The short-end of the curve benefited most from these
developments, as interest rate expectations were revised downwards. Yield curve disinversion
also appears to have been influenced by a reported mid-summer flattening in Liability Driven
Investment (LDI) activity and, from September, emergent market concerns about longer-
term inflationary pressures from rising commodity prices which caused long maturity gilt
yields to rise.
A.5 The ongoing disruption in financial markets persisted throughout most of the third
quarter of 2007-08. Furthermore, a number of major American and European banks
announced significant writedowns on their mortgage-related securities. These conditions led
to further downward revisions in the market’s expectation of the path of future interest rates,
leading to more sharp falls in gilts yields at the short to medium sector of the curve. The MPC
cut rates on 6 December 2007.
A.6 January 2008 saw some sharp intra-day gilt yield movements in reverse correlation to
the equity markets. Short-dated gilt yields reached long-terms lows on the 21 January 2008.
The US Federal Reserve cut US interest rates by 75 basis points to 3.5 per cent at an
emergency meeting on 22 January 2008, but, following this, gilt yields rose. Yields at the short
end of the curve fell sharply again, however, on the last day of the month, in response to the
Federal Reserve’s second interest rate cut to 3 per cent.
A.7 The path of benchmark conventional gilt yields over the first ten months of 2007-08
is shown in Chart A2.
Chart A2: Conventional benchmark gilt yieldsChart A2: Conventional benchmark gilt yields
Source: Debt Management Office
per
cent
30-Jan-0830-Mar-07 30-May-07 30-Jul-07 30-Sep-07 30-Nov-07
6.0
5.8
5.6
5.4
5.2
5.0
4.8
4.6
4.4
4.2
4.0
41/4% 205541/4% 20384% 201651/4% 2012
54 Debt and reserves management report 2008-09
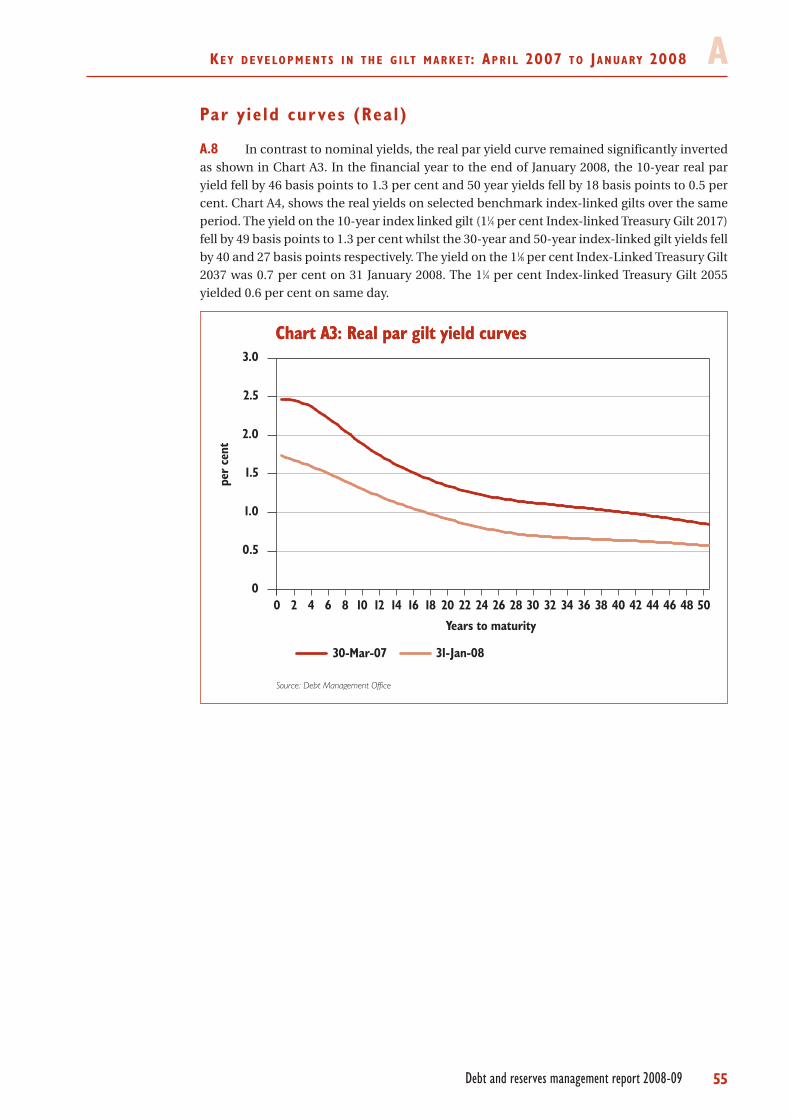
KE Y D E V E LO P M E N T S I N T H E G I LT M A R K E T: AP R I L 2007 T O JA N UA RY 2008 APar y ie ld cur ves (Real )
A.8 In contrast to nominal yields, the real par yield curve remained significantly inverted
as shown in Chart A3. In the financial year to the end of January 2008, the 10-year real par
yield fell by 46 basis points to 1.3 per cent and 50 year yields fell by 18 basis points to 0.5 per
cent. Chart A4, shows the real yields on selected benchmark index-linked gilts over the same
period. The yield on the 10-year index linked gilt (11⁄4 per cent Index-linked Treasury Gilt 2017)
fell by 49 basis points to 1.3 per cent whilst the 30-year and 50-year index-linked gilt yields fell
by 40 and 27 basis points respectively. The yield on the 11⁄8 per cent Index-Linked Treasury Gilt
2037 was 0.7 per cent on 31 January 2008. The 11⁄4 per cent Index-linked Treasury Gilt 2055
yielded 0.6 per cent on same day.
Chart A3: Real par gilt yield curvesChart A3: Real par gilt yield curves
Years to maturity
Source: Debt Management Office
per
cent
50484644424038363432302826242220181614121086420
31-Jan-0830-Mar-07
0
3.0
2.5
2.0
1.5
1.0
0.5
55Debt and reserves management report 2008-09
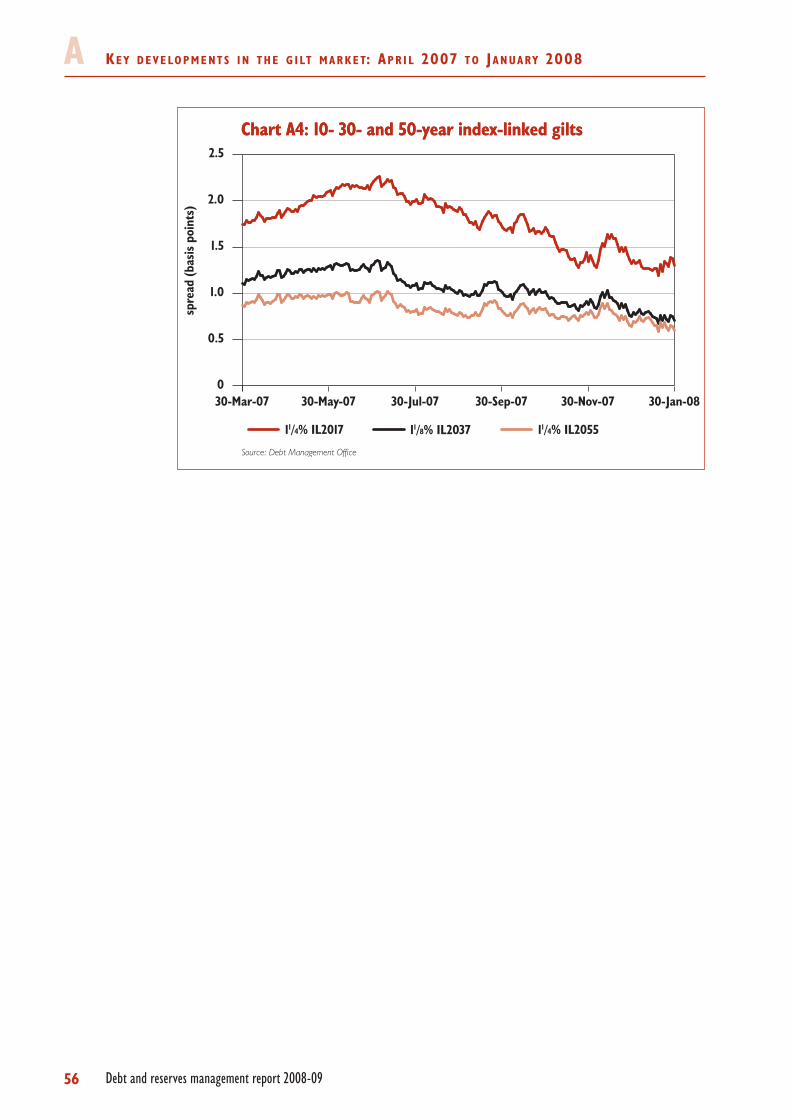
KE Y D E V E LO P M E N T S I N T H E G I LT M A R K E T: AP R I L 2007 T O JA N UA RY 2008A
Chart A4: 10- 30- and 50-year index-linked giltsChart A4: 10- 30- and 50-year index-linked gilts
Source: Debt Management Office
spre
ad(b
asis
poin
ts)
0
2.5
2.0
1.5
1.0
0.5
30-Jan-0830-Nov-0730-Sep-0730-Jul-0730-May-0730-Mar-07
11/4% IL205511/8% IL203711/4% IL2017
56 Debt and reserves management report 2008-09
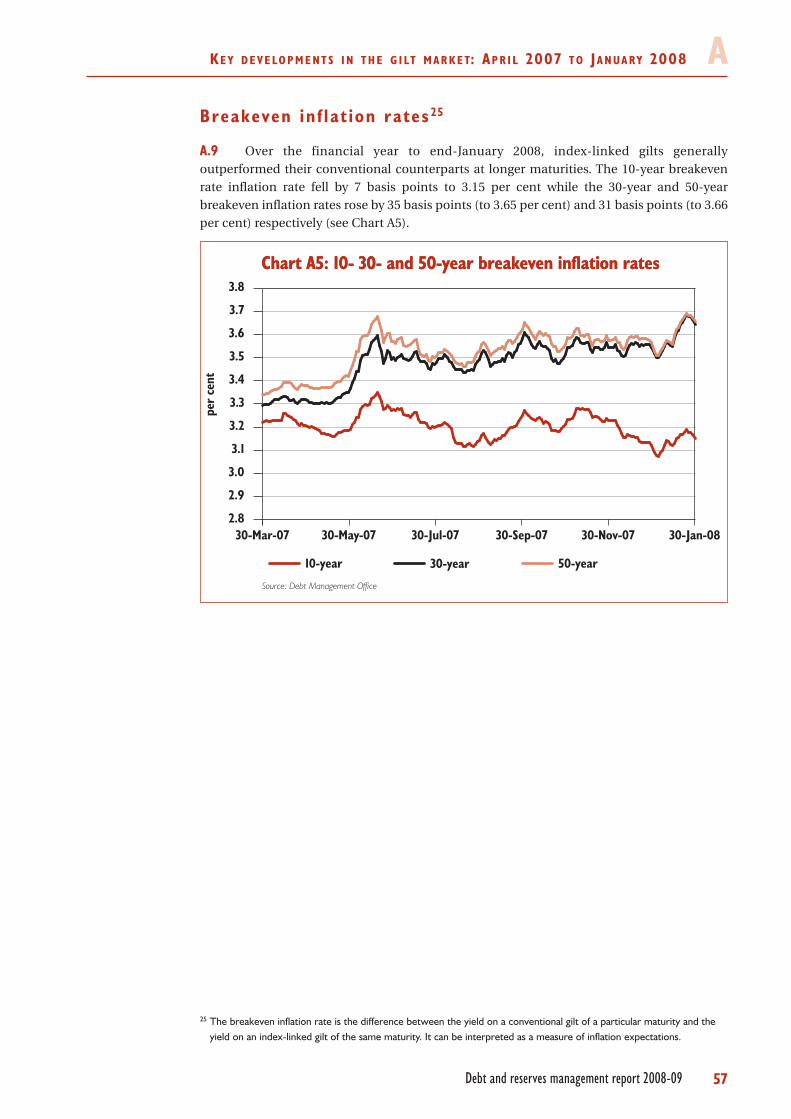
KE Y D E V E LO P M E N T S I N T H E G I LT M A R K E T: AP R I L 2007 T O JA N UA RY 2008 ABreakeven in f lat ion rates 25
A.9 Over the financial year to end-January 2008, index-linked gilts generally
outperformed their conventional counterparts at longer maturities. The 10-year breakeven
rate inflation rate fell by 7 basis points to 3.15 per cent while the 30-year and 50-year
breakeven inflation rates rose by 35 basis points (to 3.65 per cent) and 31 basis points (to 3.66
per cent) respectively (see Chart A5).
Chart A5: 10- 30- and 50-year breakeven inflation ratesChart A5: 10- 30- and 50-year breakeven inflation rates
Source: Debt Management Office
per
cent
3.8
3.7
3.6
3.5
3.4
3.3
3.2
3.1
3.0
2.9
2.830-Jan-0830-Nov-0730-Sep-0730-Jul-0730-May-0730-Mar-07
50-year30-year10-year
57Debt and reserves management report 2008-09
25 The breakeven inflation rate is the difference between the yield on a conventional gilt of a particular maturity and theyield on an index-linked gilt of the same maturity. It can be interpreted as a measure of inflation expectations.

BTH E ST R AT E G I C DE B T AN A LY S I S M O D E LA N D A C O M PA R I S O N O F D E B T I S S UA N C ES T R AT E G I E S
Debt and reserves management report 2008-09
B.1 The Strategic Debt Analysis (SDA) model – which is described in detail in Chapter 6 of
the DMO Annual Review 2005-06 and in a DMO discussion paper26 – is a debt strategy
simulation model used by the DMO to illustrate the debt service cost and risk of different debt
issuance strategies, given assumptions about the shape of both the nominal and real yield
curves. The model is not used to determine a single optimal debt issuance strategy but to
illustrate the cost and risk trade-off of different issuance strategies. Simulations using this
model are set out below.
Design o f s imulat ion exerc ises – debt ser v ice cost andr isk measures
B.2 The cost of the debt in any given period is defined as the sum, in cash flow terms, of
all nominal coupon payments27. The debt service cost is measured as a ratio with respect to
nominal GDP as this provides a clearer indication of the debt cost burden to the Government
than does the nominal cost of debt on its own and is consistent with the Government’s
fiscal rules.
B.3 The risk measures capture the concept of financing risk, that is, the uncertainty in the
financing or cash flow cost related to a given borrowing strategy. The financing risk associated
with a given debt strategy is evaluated by:
• the standard deviation of the debt cost ratio, which measures its volatility in
terms of deviations around the average (i.e. a symmetric measure); and
• the debt service cost ratio-at-risk, which is the largest debt cost ratio only
exceeded by five percent of possible realisations according to the probability
distribution of the debt cost ratio28. The debt service cost ratio-at-risk is a
useful risk measure especially when the Government is concerned about
avoiding extremely high debt costs (i.e. a tail measure).
In i t ia l condit ions for the s imulat ion
B.4 The initial conditions for the simulation exercises in the SDA model are the:
• initial portfolio – gilt portfolio as at 18 December 2007 (excluding all undated
gilts);
• initial values for the macroeconomic variables29, which are their respective
long-run average values; and
59
26 Pick, A and ML Anthony (2006), “A simulation model for the analysis of the UK’s sovereign debt strategy”, UK DMOworking paper. This paper can be found on the DMO’s website at:http://www.dmo.gov.uk/documentview.aspx?docname=research/sda160806.pdf
27 The sum of interest payments on nominal bonds, inflation compensated interest payments on inflation-linked bonds andthe realised inflation compensation effects on maturing inflation-linked bonds.
28 Or the upper 95th percentile of the debt service cost ratio distribution.29 The macroeconomic variables in the SDA model are the output gap, the net primary financing requirement (CGNCR,
excluding interest payments), the short interest rate, CPI inflation and RPI inflation.
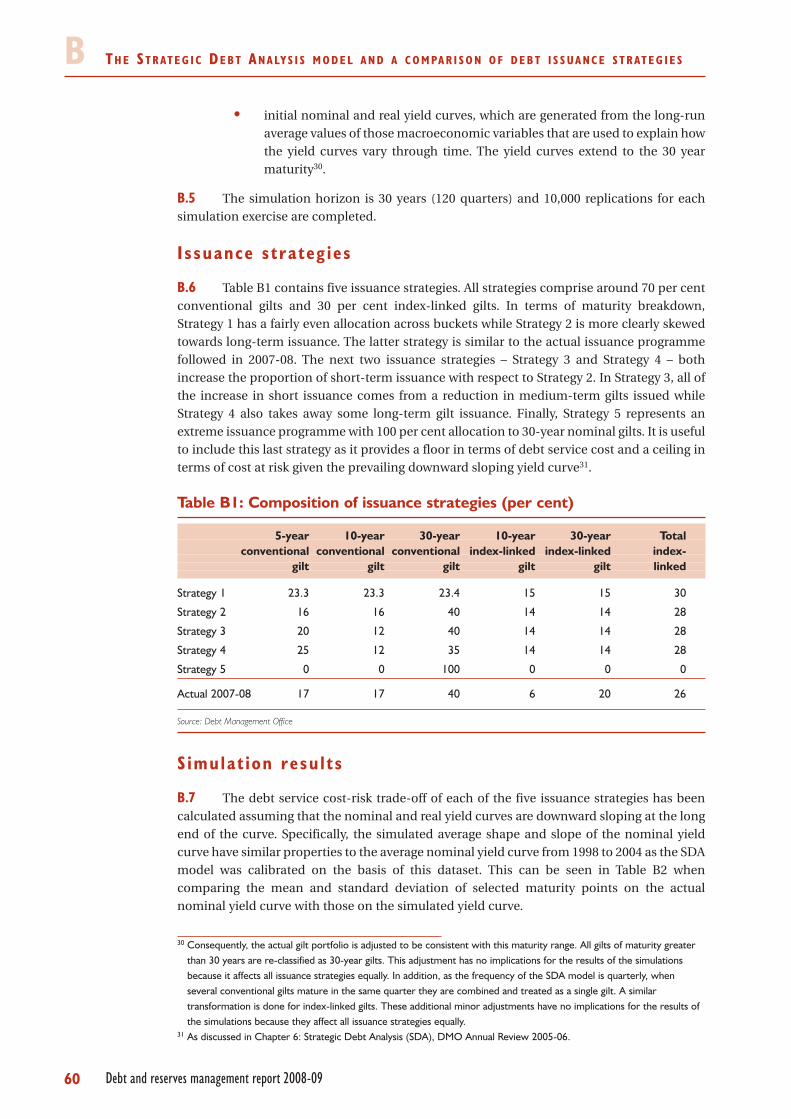
TH E ST R AT E G I C DE B T AN A LY S I S M O D E L A N D A C O M PA R I S O N O F D E B T I S S UA N C E S T R AT E G I E SB• initial nominal and real yield curves, which are generated from the long-run
average values of those macroeconomic variables that are used to explain how
the yield curves vary through time. The yield curves extend to the 30 year
maturity30.
B.5 The simulation horizon is 30 years (120 quarters) and 10,000 replications for each
simulation exercise are completed.
I ssuance strateg ies
B.6 Table B1 contains five issuance strategies. All strategies comprise around 70 per cent
conventional gilts and 30 per cent index-linked gilts. In terms of maturity breakdown,
Strategy 1 has a fairly even allocation across buckets while Strategy 2 is more clearly skewed
towards long-term issuance. The latter strategy is similar to the actual issuance programme
followed in 2007-08. The next two issuance strategies – Strategy 3 and Strategy 4 – both
increase the proportion of short-term issuance with respect to Strategy 2. In Strategy 3, all of
the increase in short issuance comes from a reduction in medium-term gilts issued while
Strategy 4 also takes away some long-term gilt issuance. Finally, Strategy 5 represents an
extreme issuance programme with 100 per cent allocation to 30-year nominal gilts. It is useful
to include this last strategy as it provides a floor in terms of debt service cost and a ceiling in
terms of cost at risk given the prevailing downward sloping yield curve31.
Table B1: Composition of issuance strategies (per cent)
5-year 10-year 30-year 10-year 30-year Totalconventional conventional conventional index-linked index-linked index-
gilt gilt gilt gilt gilt linked
Strategy 1 23.3 23.3 23.4 15 15 30
Strategy 2 16 16 40 14 14 28
Strategy 3 20 12 40 14 14 28
Strategy 4 25 12 35 14 14 28
Strategy 5 0 0 100 0 0 0
Actual 2007-08 17 17 40 6 20 26
Source: Debt Management Office
S imulat ion resul ts
B.7 The debt service cost-risk trade-off of each of the five issuance strategies has been
calculated assuming that the nominal and real yield curves are downward sloping at the long
end of the curve. Specifically, the simulated average shape and slope of the nominal yield
curve have similar properties to the average nominal yield curve from 1998 to 2004 as the SDA
model was calibrated on the basis of this dataset. This can be seen in Table B2 when
comparing the mean and standard deviation of selected maturity points on the actual
nominal yield curve with those on the simulated yield curve.
60 Debt and reserves management report 2008-09
30 Consequently, the actual gilt portfolio is adjusted to be consistent with this maturity range. All gilts of maturity greaterthan 30 years are re-classified as 30-year gilts. This adjustment has no implications for the results of the simulationsbecause it affects all issuance strategies equally. In addition, as the frequency of the SDA model is quarterly, whenseveral conventional gilts mature in the same quarter they are combined and treated as a single gilt. A similartransformation is done for index-linked gilts. These additional minor adjustments have no implications for the results ofthe simulations because they affect all issuance strategies equally.
31 As discussed in Chapter 6: Strategic Debt Analysis (SDA), DMO Annual Review 2005-06.
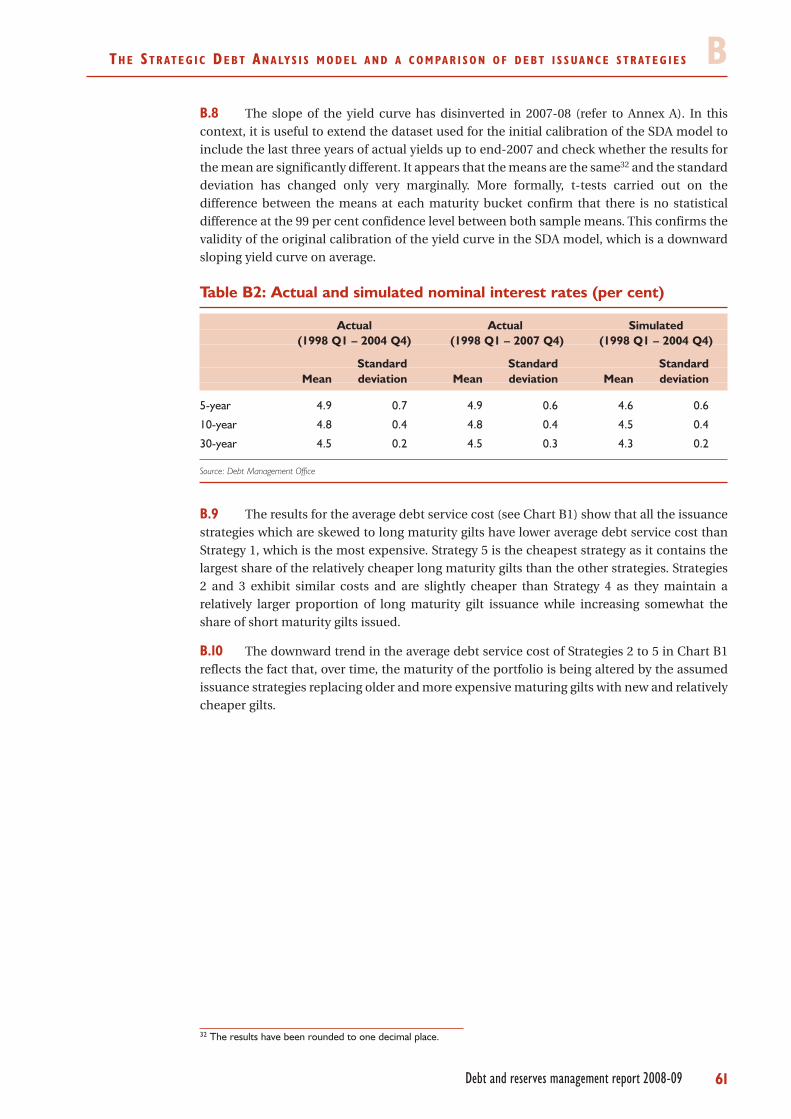
TH E ST R AT E G I C DE B T AN A LY S I S M O D E L A N D A C O M PA R I S O N O F D E B T I S S UA N C E S T R AT E G I E S BB.8 The slope of the yield curve has disinverted in 2007-08 (refer to Annex A). In this
context, it is useful to extend the dataset used for the initial calibration of the SDA model to
include the last three years of actual yields up to end-2007 and check whether the results for
the mean are significantly different. It appears that the means are the same32 and the standard
deviation has changed only very marginally. More formally, t-tests carried out on the
difference between the means at each maturity bucket confirm that there is no statistical
difference at the 99 per cent confidence level between both sample means. This confirms the
validity of the original calibration of the yield curve in the SDA model, which is a downward
sloping yield curve on average.
Table B2: Actual and simulated nominal interest rates (per cent)
Actual Actual Simulated (1998 Q1 – 2004 Q4) (1998 Q1 – 2007 Q4) (1998 Q1 – 2004 Q4)
Standard Standard StandardMean deviation Mean deviation Mean deviation
5-year 4.9 0.7 4.9 0.6 4.6 0.6
10-year 4.8 0.4 4.8 0.4 4.5 0.4
30-year 4.5 0.2 4.5 0.3 4.3 0.2
Source: Debt Management Office
B.9 The results for the average debt service cost (see Chart B1) show that all the issuance
strategies which are skewed to long maturity gilts have lower average debt service cost than
Strategy 1, which is the most expensive. Strategy 5 is the cheapest strategy as it contains the
largest share of the relatively cheaper long maturity gilts than the other strategies. Strategies
2 and 3 exhibit similar costs and are slightly cheaper than Strategy 4 as they maintain a
relatively larger proportion of long maturity gilt issuance while increasing somewhat the
share of short maturity gilts issued.
B.10 The downward trend in the average debt service cost of Strategies 2 to 5 in Chart B1
reflects the fact that, over time, the maturity of the portfolio is being altered by the assumed
issuance strategies replacing older and more expensive maturing gilts with new and relatively
cheaper gilts.
61Debt and reserves management report 2008-09
32 The results have been rounded to one decimal place.

TH E ST R AT E G I C DE B T AN A LY S I S M O D E L A N D A C O M PA R I S O N O F D E B T I S S UA N C E S T R AT E G I E SB
B.11 The results for risk show that overall Strategies 2 and 3, closely followed by 4, are less
risky than the other issuance strategies (see Charts B2 and B3 below). This reflects the larger
shares of long maturity gilts compared to Strategy 1. Strategy 5 seems to be the least risky
during the first half of the simulation horizon but later becomes progressively riskier. This is
because, as time progresses and more of the existing portfolio consists of longer-term gilts,
Strategy 5 only samples 30-year yields and, although these yields vary across replications and
time periods, they are highly correlated affecting negatively the risk measures.
Chart B1: Average debt service costChart B1: Average debt service cost
Periods (in quarters)
Source: Debt Management Office
debt
serv
ice
cost
(%of
GDP)
1201008060402001.38
1.45
1.44
1.43
1.42
1.41
1.40
1.39
Strategy 5Strategy 4Strategy 3Strategy 2Strategy 1
62 Debt and reserves management report 2008-09
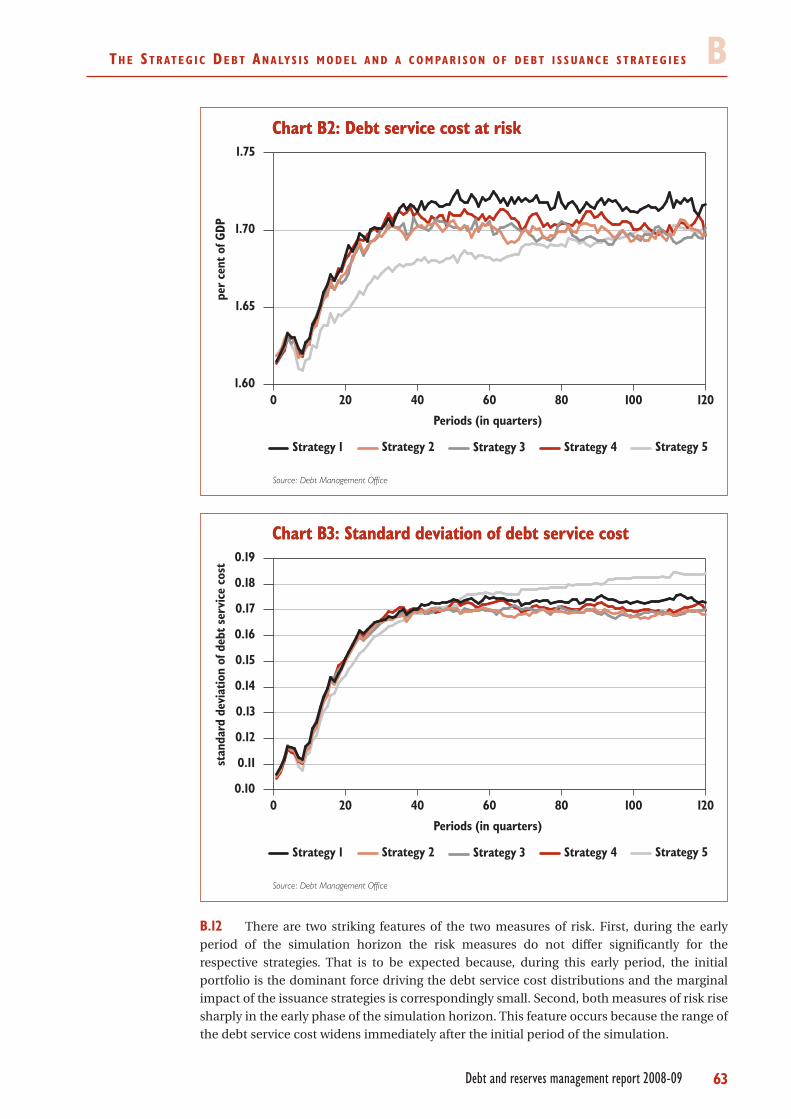
TH E ST R AT E G I C DE B T AN A LY S I S M O D E L A N D A C O M PA R I S O N O F D E B T I S S UA N C E S T R AT E G I E S B
B.12 There are two striking features of the two measures of risk. First, during the early
period of the simulation horizon the risk measures do not differ significantly for the
respective strategies. That is to be expected because, during this early period, the initial
portfolio is the dominant force driving the debt service cost distributions and the marginal
impact of the issuance strategies is correspondingly small. Second, both measures of risk rise
sharply in the early phase of the simulation horizon. This feature occurs because the range of
the debt service cost widens immediately after the initial period of the simulation.
Chart B3: Standard deviation of debt service costChart B3: Standard deviation of debt service cost
Periods (in quarters)
Source: Debt Management Office
stan
dard
devi
atio
nof
debt
serv
ice
cost
1201008060402000.10
0.19
0.18
0.17
0.16
0.15
0.14
0.13
0.12
0.11
Strategy 5Strategy 4Strategy 3Strategy 2Strategy 1
Chart B2: Debt service cost at riskChart B2: Debt service cost at risk
Periods (in quarters)
Source: Debt Management Office
per
cent
ofGD
P
1201008060402001.60
1.75
1.70
1.65
Strategy 5Strategy 4Strategy 3Strategy 2Strategy 1
63Debt and reserves management report 2008-09
TH E ST R AT E G I C DE B T AN A LY S I S M O D E L A N D A C O M PA R I S O N O F D E B T I S S UA N C E S T R AT E G I E SBB.13 Simulation results from the SDA model confirm its initial finding that the
Government could achieve a better debt service cost – risk trade-off by skewing issuance
towards long maturity gilts in circumstances where the average yield curve is downward
sloping. The model suggests that an issuance strategy that has a larger proportion of long
maturity gilts would be cheaper and less risky than issuance strategies with a smaller
allocation of these gilts. This result is robust to extending the underlying yield curve dataset
considered to end-2007. Furthermore, a strategy such as Strategy 3 or 4 in which the long-
term skew is maintained but tempered somewhat to increase the proportion of short-term
issuance still achieves lower cost and risk than an issuance strategy of even allocation of
issuance across maturity buckets. In this way the cost and risk characteristics of Strategy 3 or
4 would not deviate significantly from those attributed to the actual issuance programme
followed in 2007-08.
B.14 It is worth bearing in mind that the simulation modelling only captures one risk to
which the Government’s gilt issuance plans expose the Exchequer (i.e. the variability in debt
servicing costs over time). However, debt issuance exposes the Exchequer to other risks that
lie outside the scope of the model. In practice, consideration of these risks will be included in
the Government’s decisions about gilt issuance.
64 Debt and reserves management report 2008-09
CTH E EXC H E Q U E R ’ S C A S H M A N A G E M E N TO B J E C T I V E A N D K E Y P E R F O R M A N C EI N D I C AT O R S A N D C O N T R O L S
Debt and reserves management report 2008-09 65
33 The Debt Management Account is the government’s cash management account at the Bank of England.
CASH MANAGEMENT OBJECTIVE KEY PERFORMANCE INDICATORSAND CONTROLS
The DMO should maintain channels ofcommunication with money marketparticipants and Treasury bill counterparts bothformally and informally to explain, as far aspossible, the nature and intent of its operationsin the money markets.
The DMO should monitor compliance with itsoperational notices; provide complete,accurate and timely instructions tocounterparties, agents, external systems andoperators; and achieve the successfulsettlement of agreed trades on the due date.
The DMO should maintain a crediblereputation in the market that leads to lowercosts in the long term and a cash managementsystem that is sustainable.
The DMO will report to HM Treasury on aquarterly basis the details of its cashmanagement activity, its active managementperformance against the Government’smarginal cost of funds and the market andcredit risks incurred. Performance may also bereported in the DMO Annual Review.
The DMO should maintain a system in whichthe costs and risks are transparent, measuredand monitored and the performance ofgovernment cash management is assessed. TheDMO maintains an ethos of cost minimisationrather than profit maximisation.
The DMO will advise HM Treasury asappropriate on the impact of Exchequer cashflows on liquidity conditions in the sterlingmoney markets.
Cash management operations andarrangements should be conducted withoutimpeding the efficient working of the sterlingmoney markets.
The DMO will conduct market operations witha view to achieving, within a very small range,the weekly cumulative target balance for theDMA at the Bank of England. The DMO willmaintain formal and informal channels ofcommunication with the Bank on conditions inthe sterling money markets.
The DMO will seek to avoid holding weekly orad hoc Treasury bill tenders when the Bankconducts its weekly open market operations.
Cash management operations andarrangements should be conducted in a waythat does not interfere with monetary policyoperations.
Way and Means transfers must be avoided forcash management purposes by ensuring thatthere is always a positive Debt ManagementAccount (DMA)33 balance.
(NB: HM Treasury is responsible for monitoringand reporting performance of the forecastingfunction against outturns).
The Debt Management Office (DMO) mustsupply sufficient cash each day to enablegovernment to meet its payment obligations.This is fundamental and unconditional.


ISBN 978-1-84532-433-9
9 781845 324339