Embed Size (px)
Citation preview
Data : Debt Management Office : Historical Gilt Holdings Data
Analysis of UK Gilt Holdings 2009 - 2015
November 2015
Data : Debt Management Office : Historical Gilt Holdings Data November 2015
For more information - Check out The Saturday Economist .comData : Debt Management Office : Historical Gilt Holdings Data
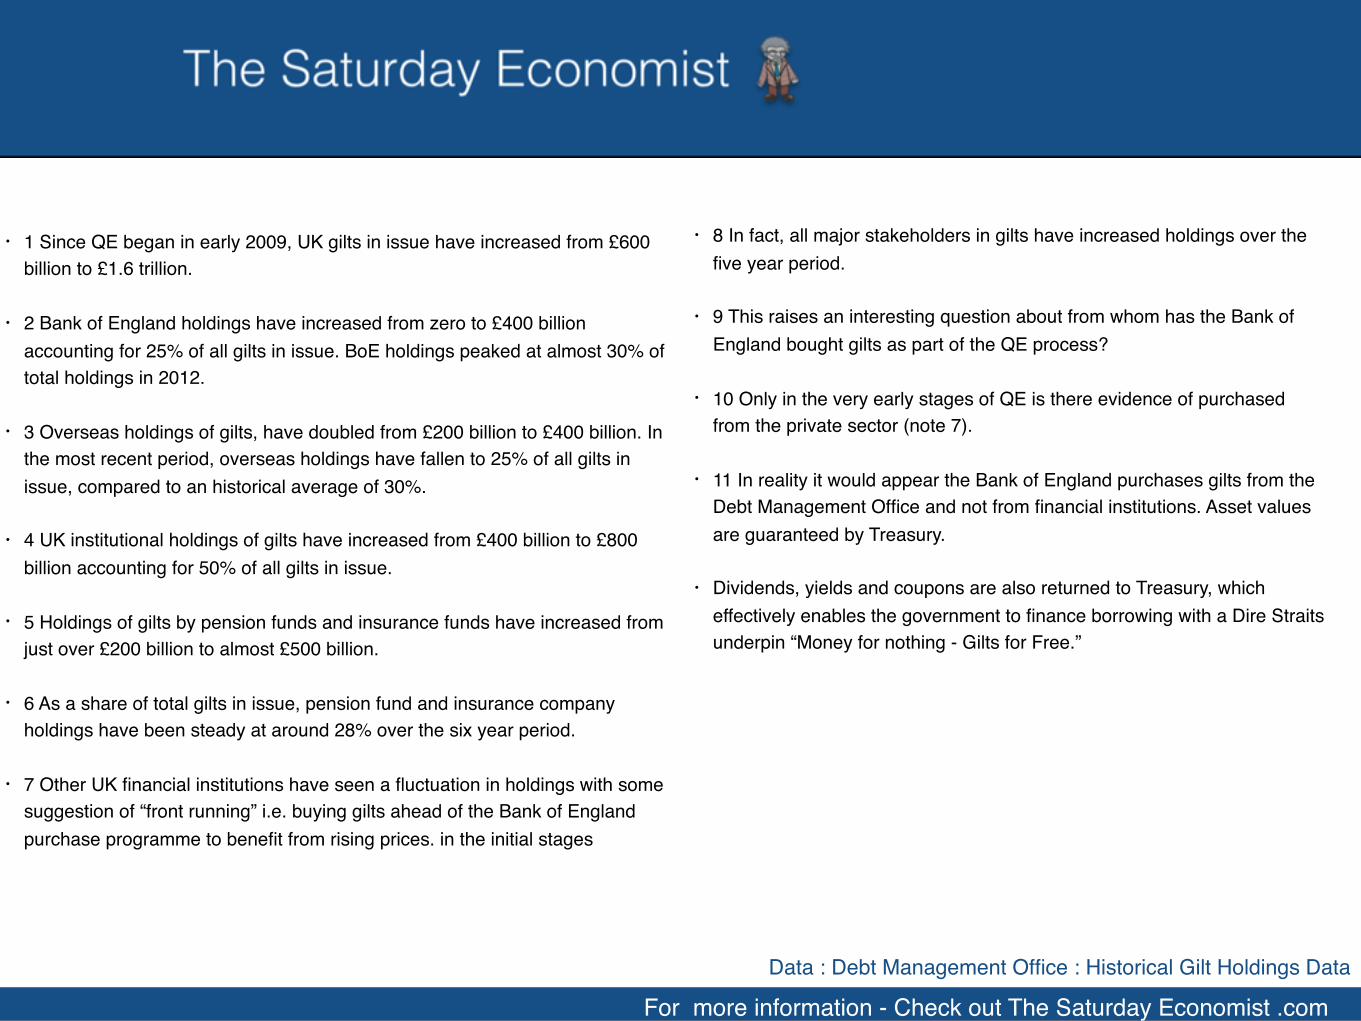
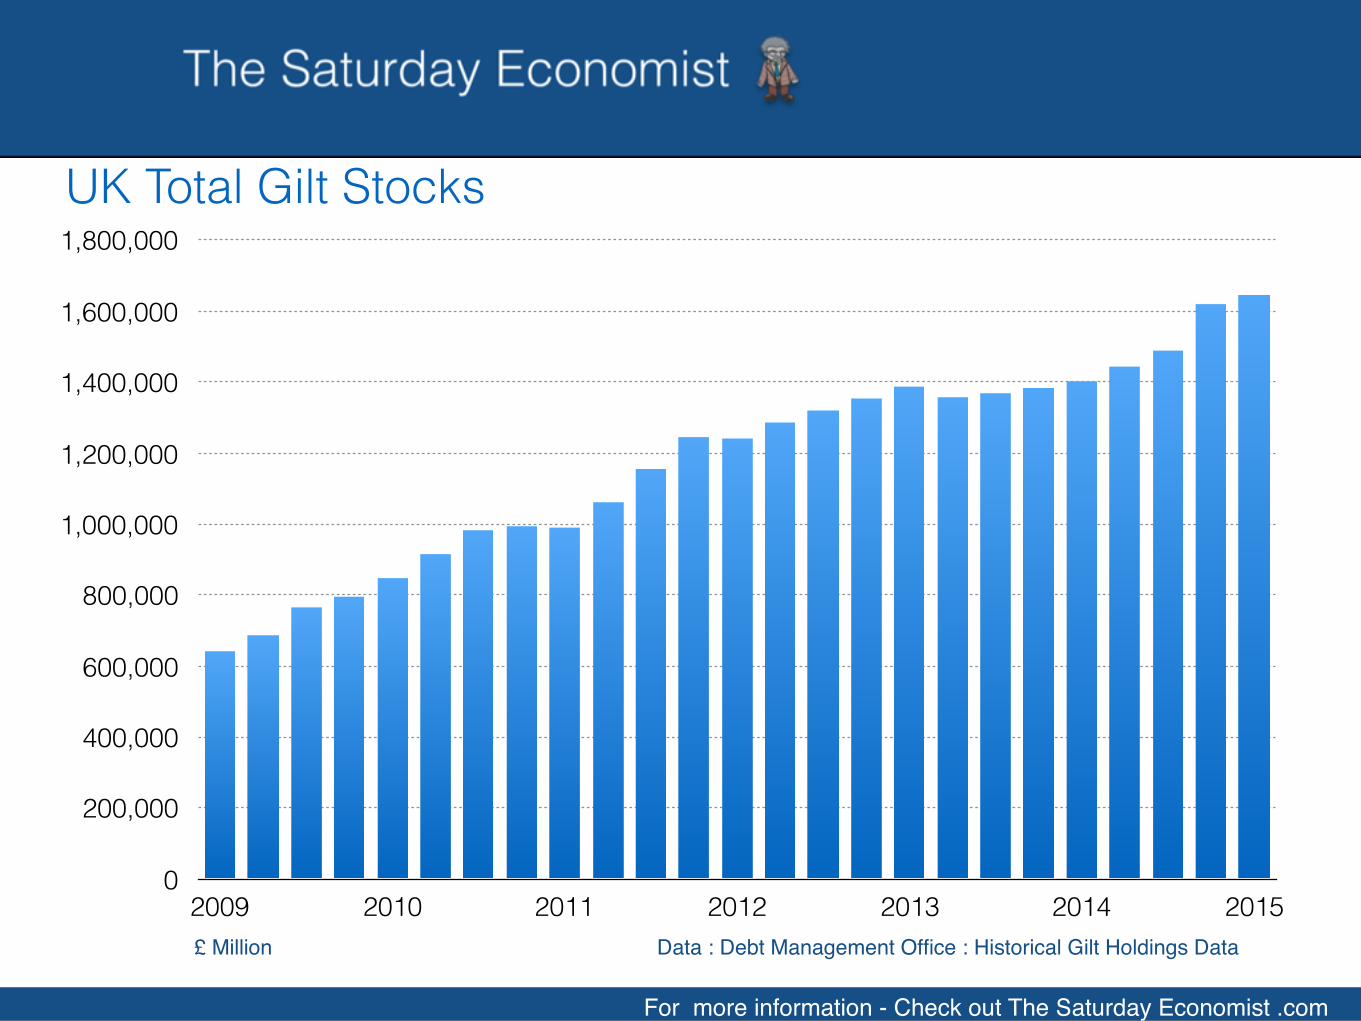
• 1 Since QE began in early 2009, UK gilts in issue have increased from £600 billion to £1.6 trillion.
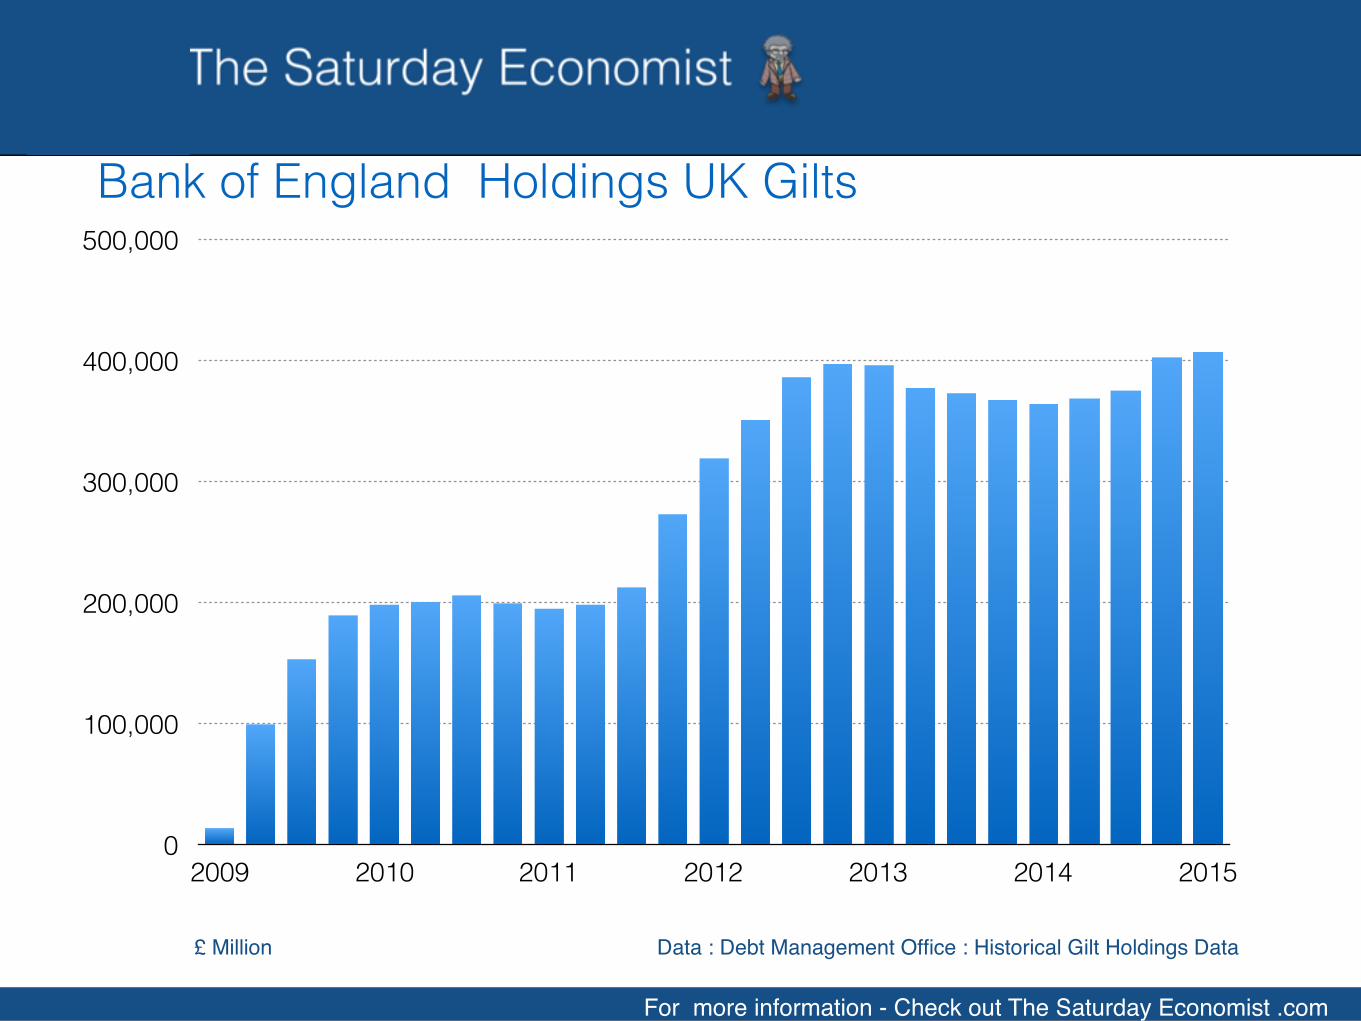
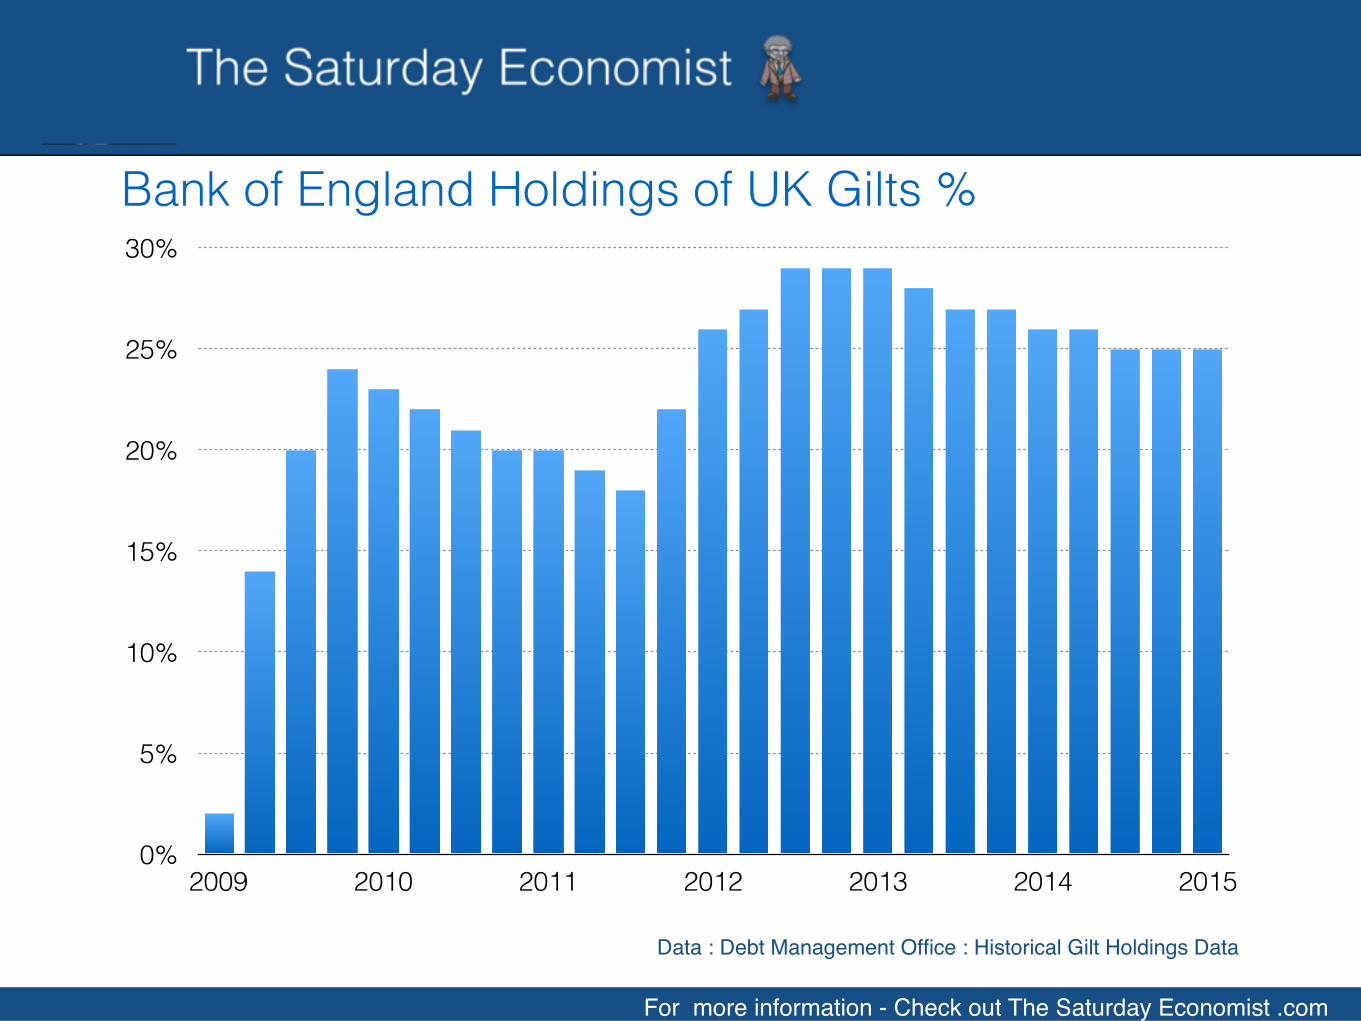
• 2 Bank of England holdings have increased from zero to £400 billion accounting for 25% of all gilts in issue. BoE holdings peaked at almost 30% of total holdings in 2012.
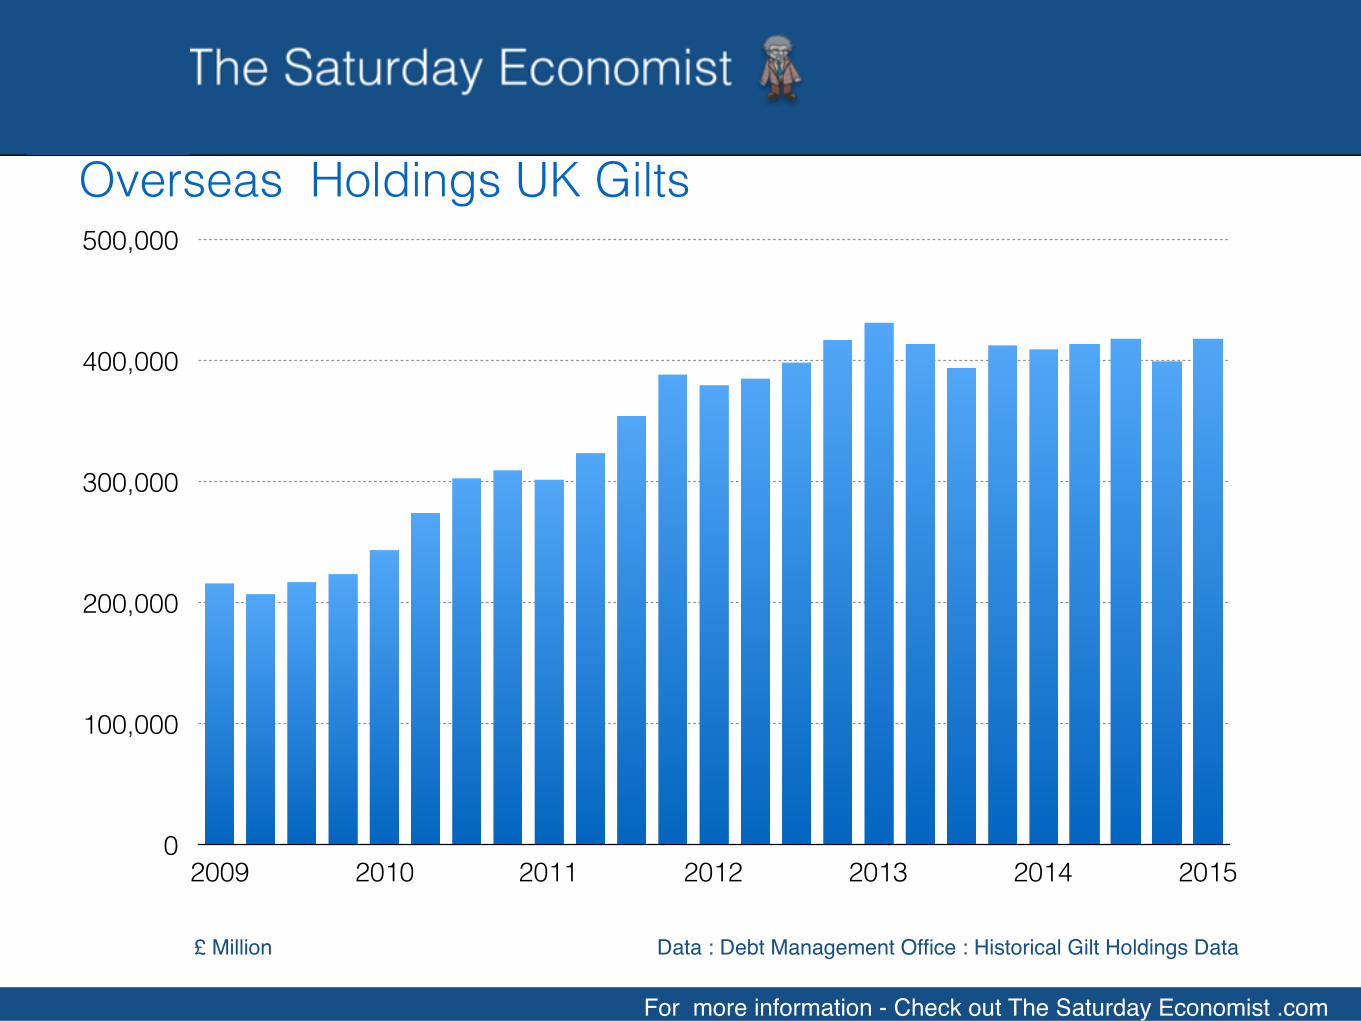
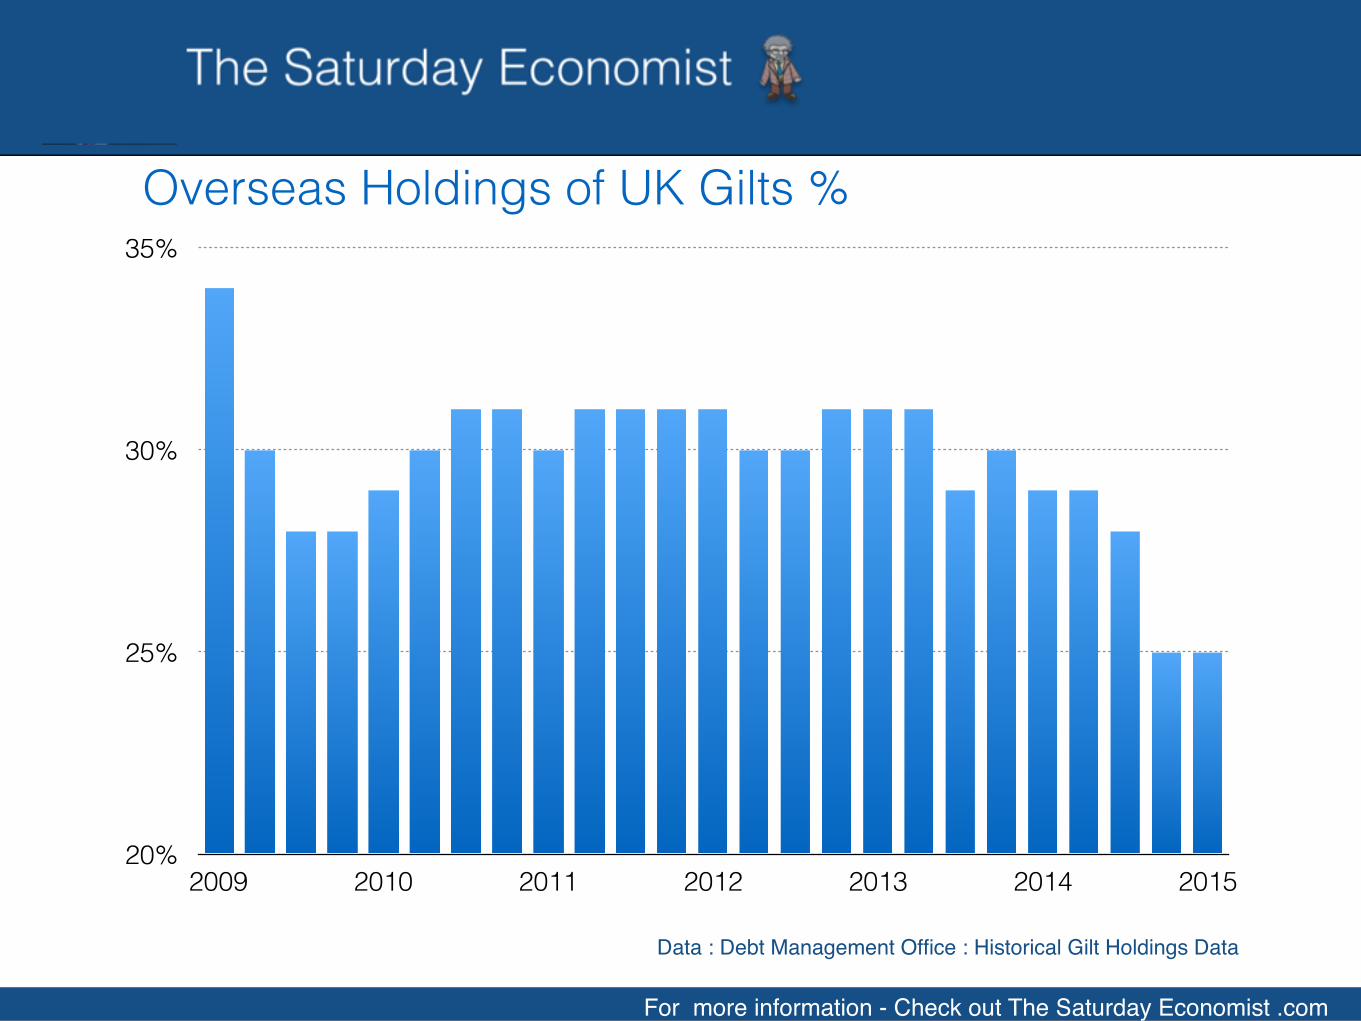
• 3 Overseas holdings of gilts, have doubled from £200 billion to £400 billion. In the most recent period, overseas holdings have fallen to 25% of all gilts in issue, compared to an historical average of 30%.
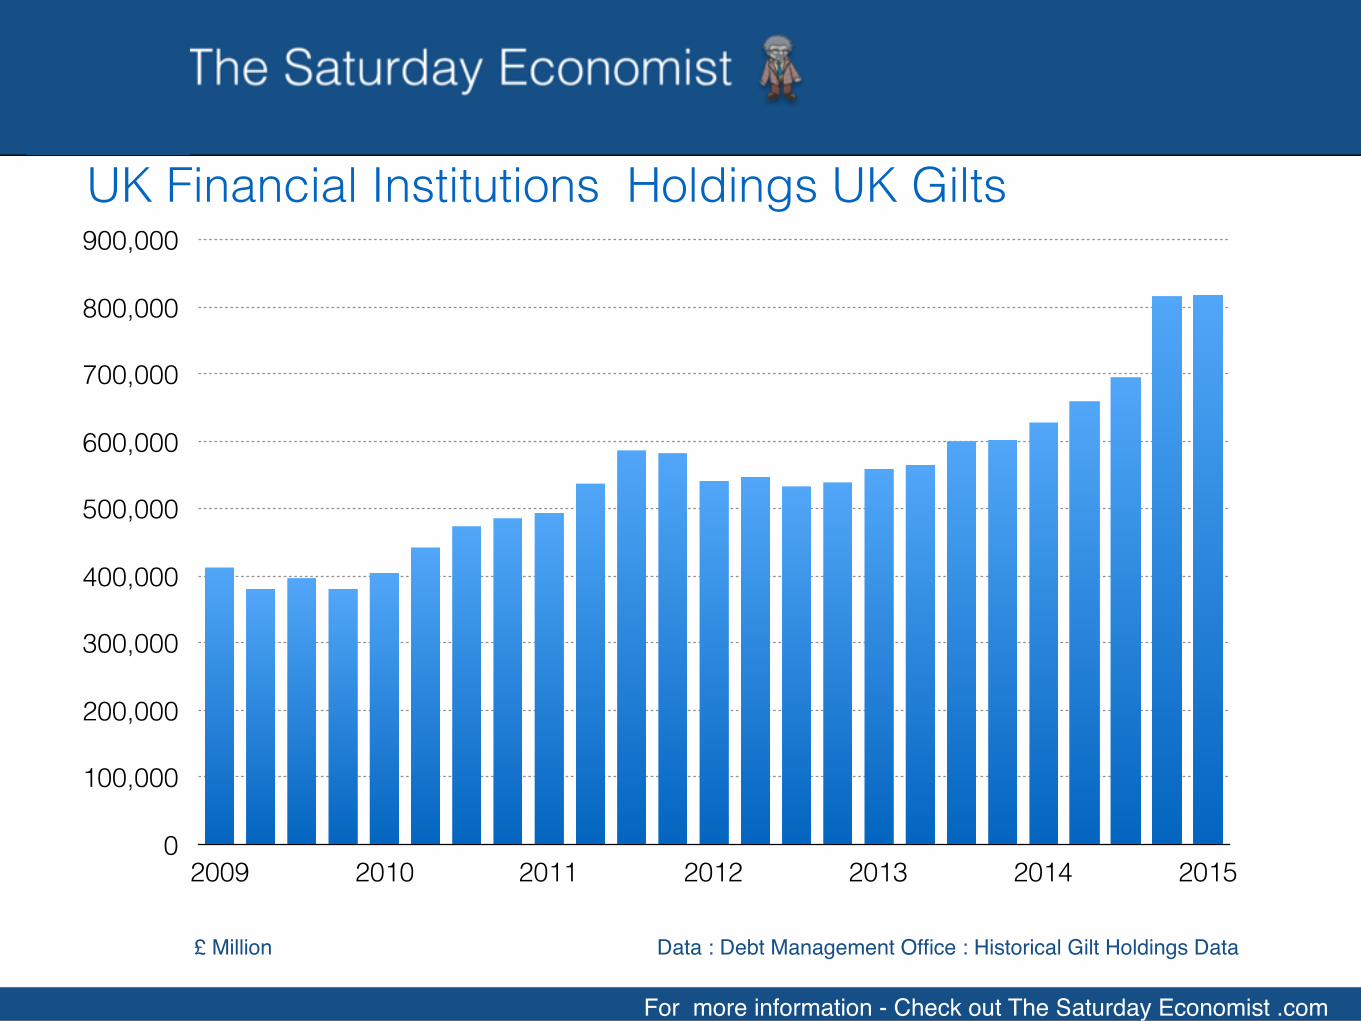
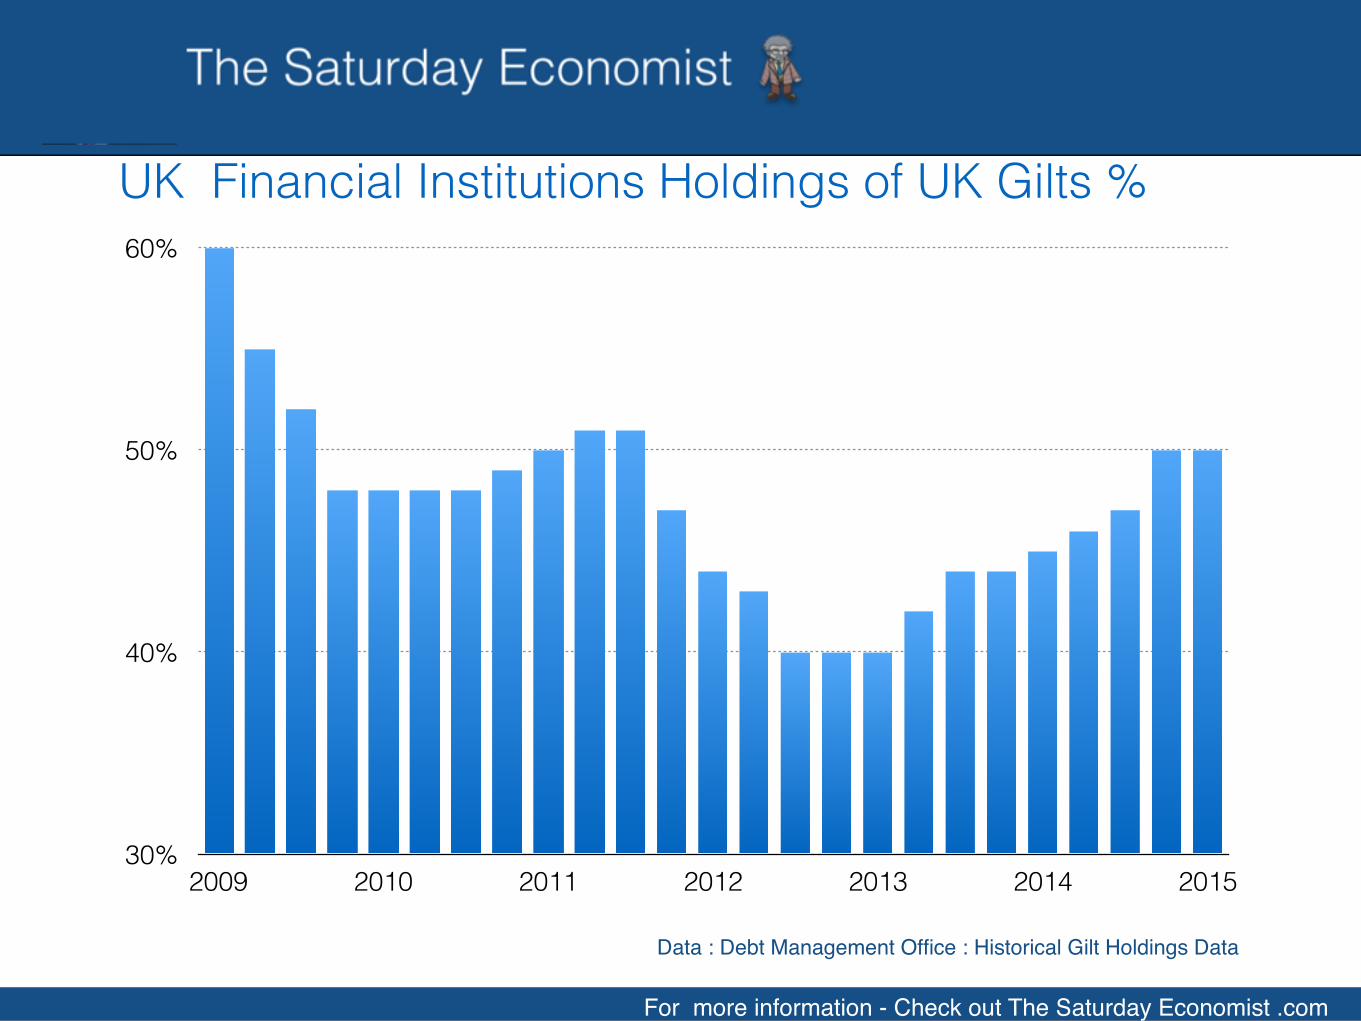
• 4 UK institutional holdings of gilts have increased from £400 billion to £800 billion accounting for 50% of all gilts in issue.
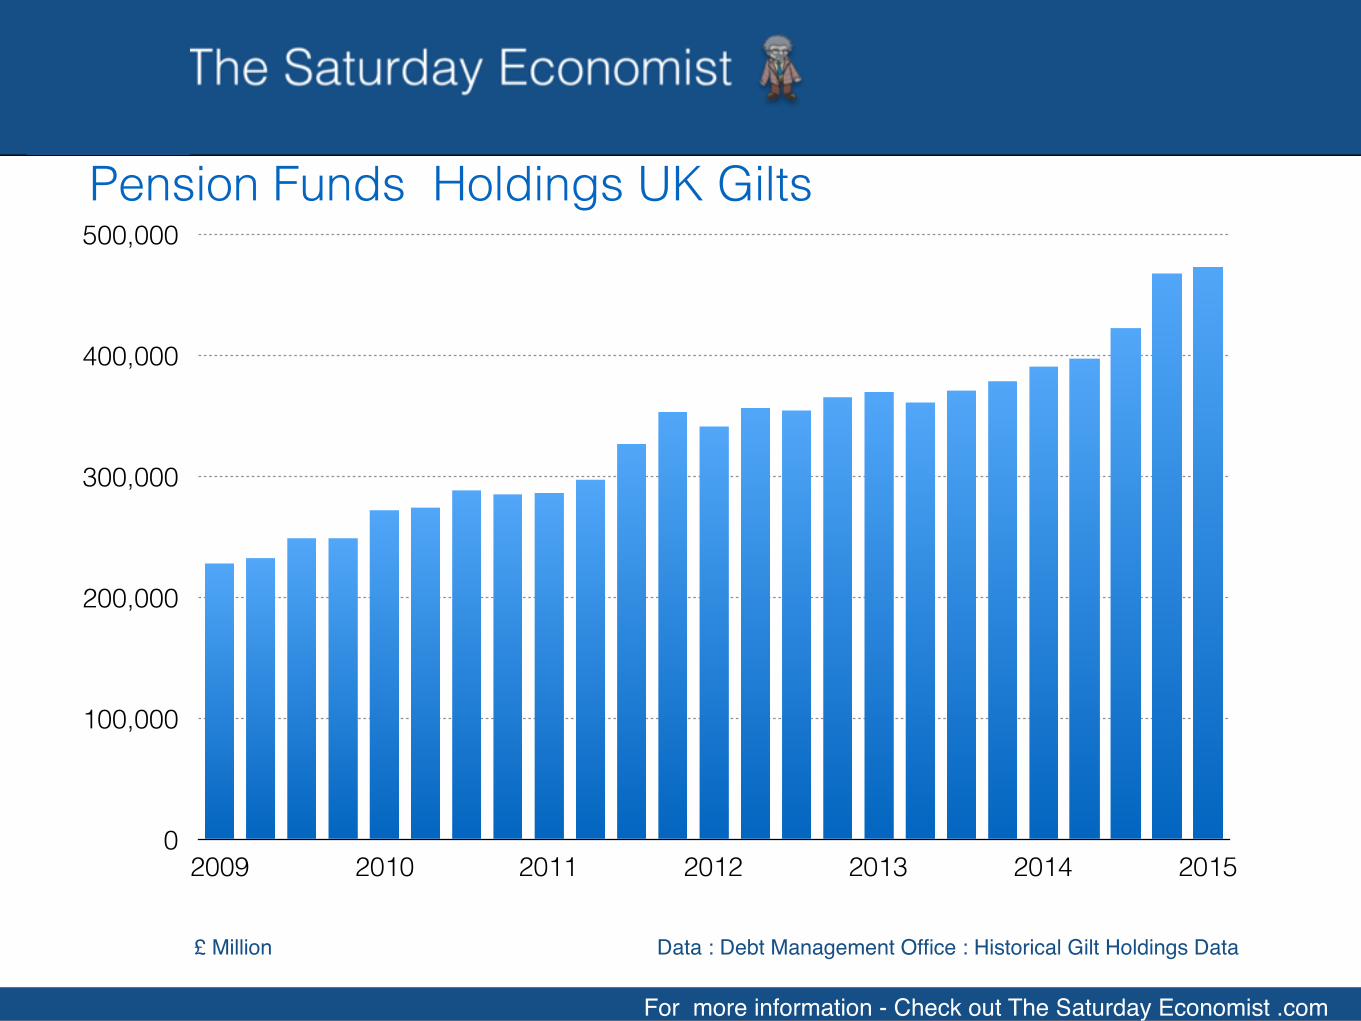
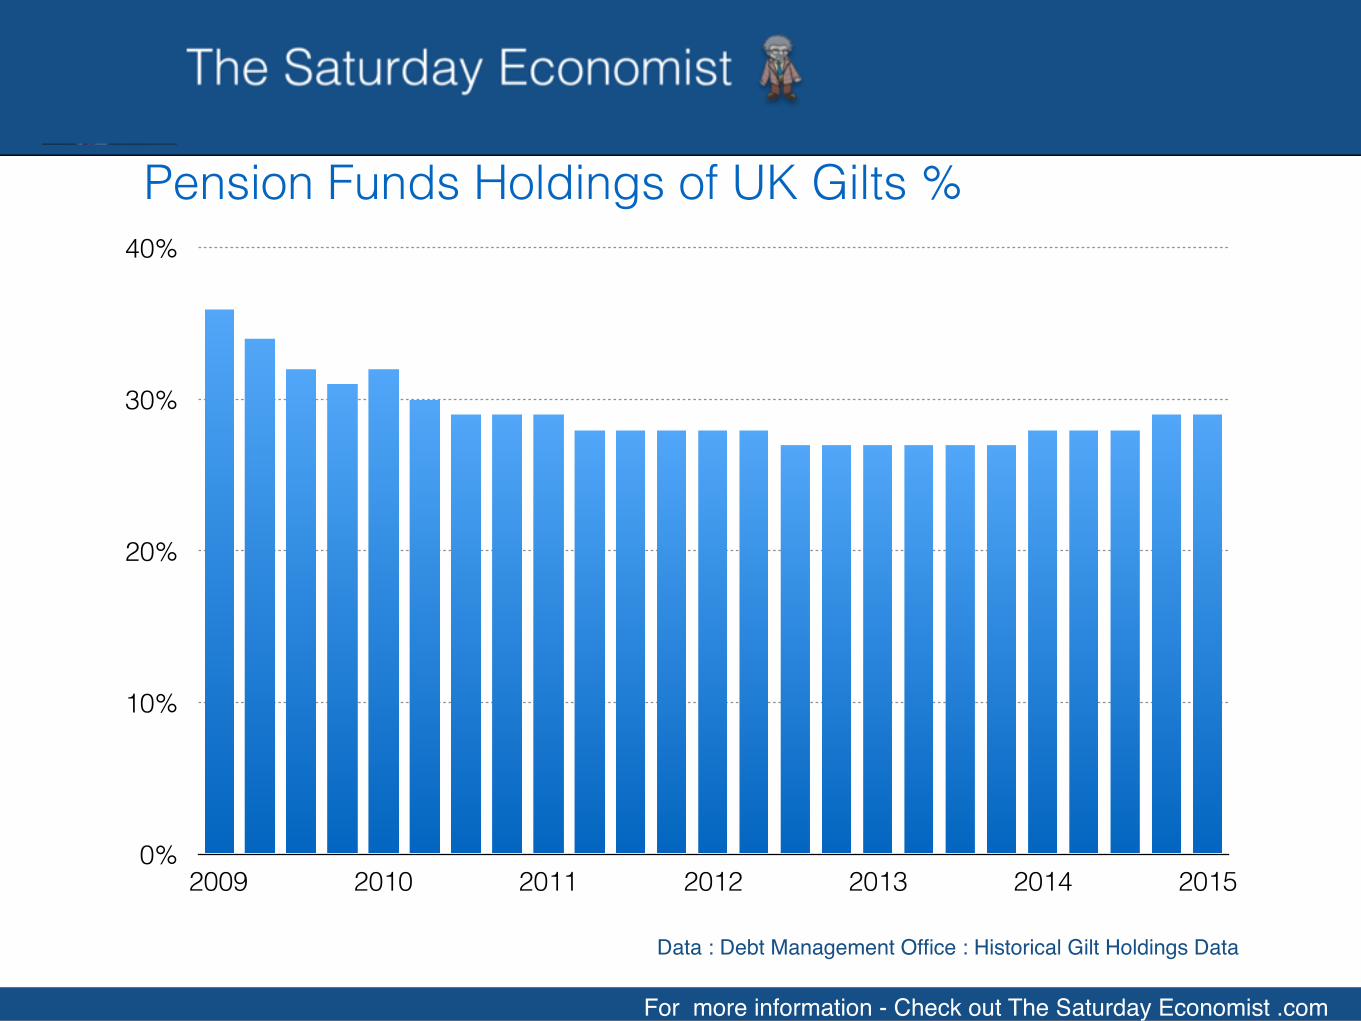
• 5 Holdings of gilts by pension funds and insurance funds have increased from just over £200 billion to almost £500 billion.
• 6 As a share of total gilts in issue, pension fund and insurance company holdings have been steady at around 28% over the six year period.
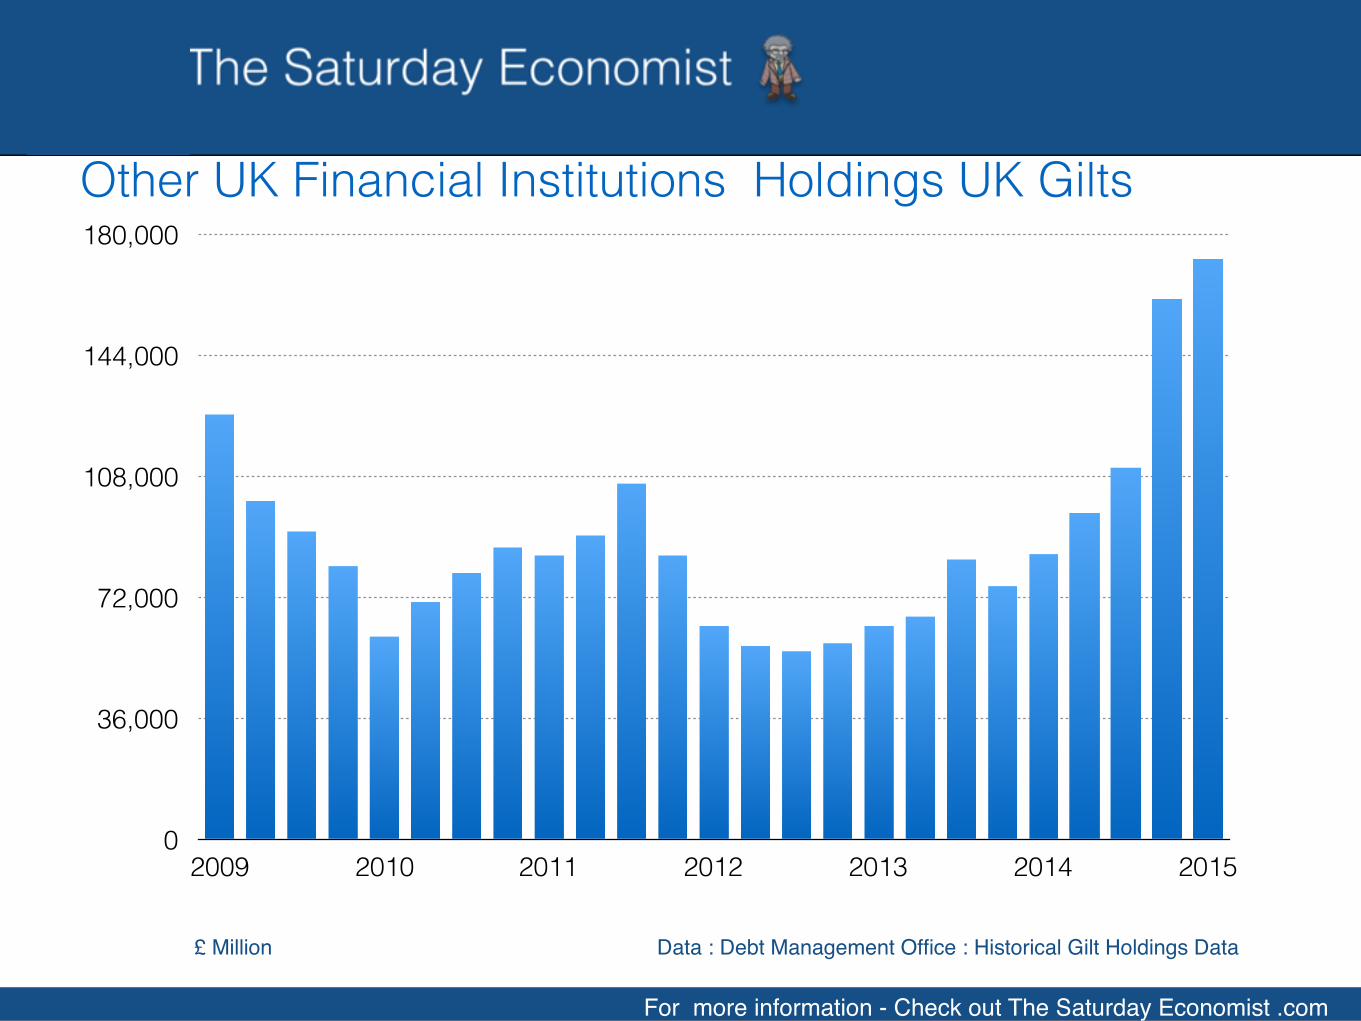
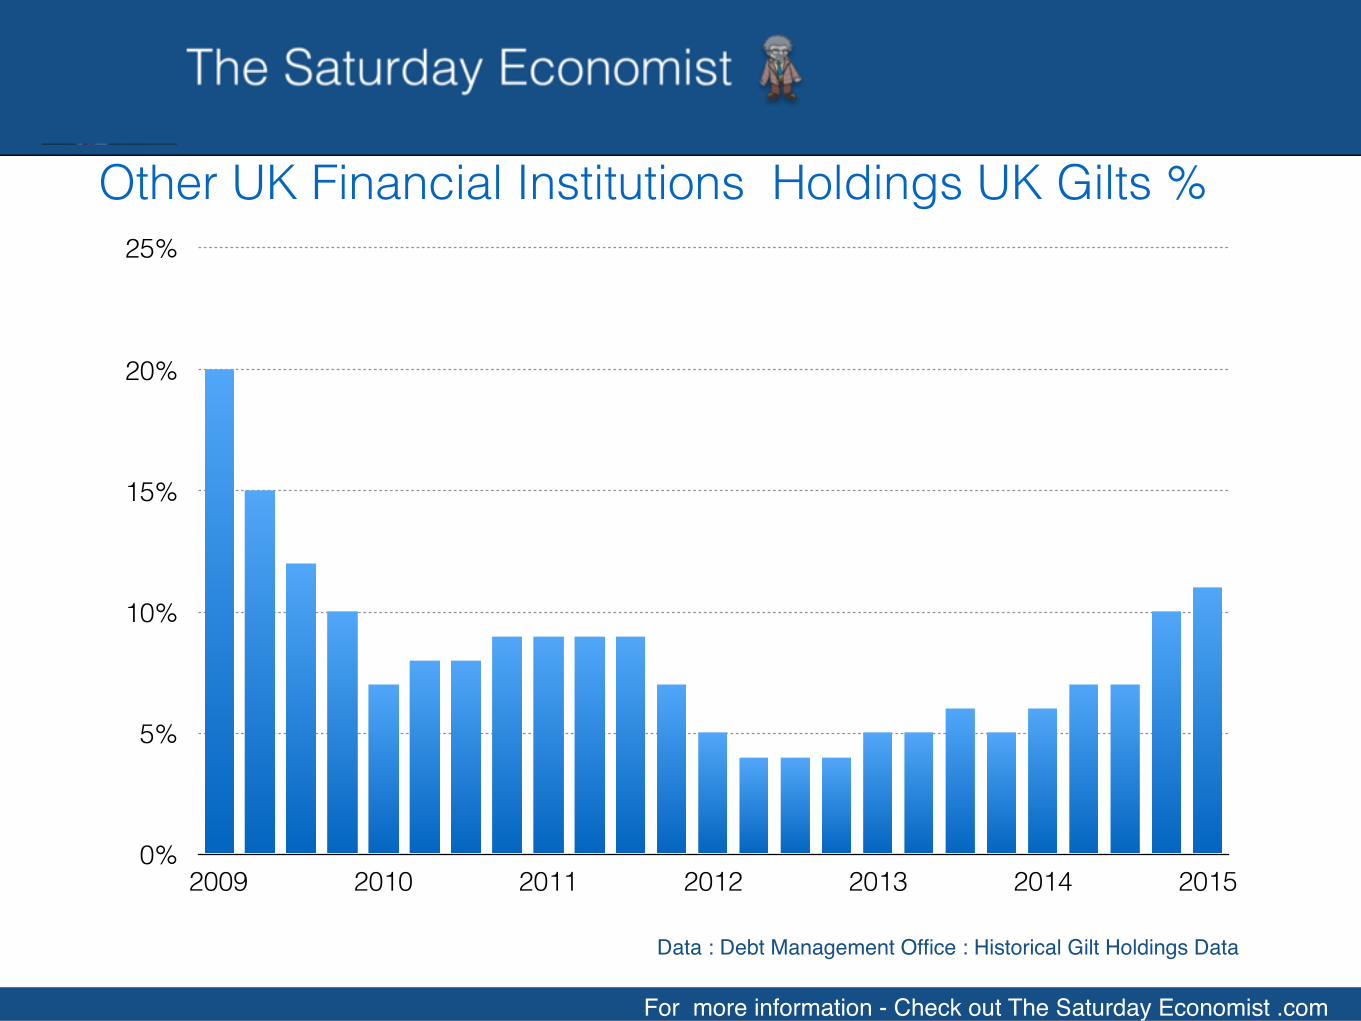
• 7 Other UK financial institutions have seen a fluctuation in holdings with some suggestion of “front running” i.e. buying gilts ahead of the Bank of England purchase programme to benefit from rising prices. in the initial stages
• 8 In fact, all major stakeholders in gilts have increased holdings over the five year period.
• 9 This raises an interesting question about from whom has the Bank of England bought gilts as part of the QE process?
• 10 Only in the very early stages of QE is there evidence of purchased from the private sector (note 7).
• 11 In reality it would appear the Bank of England purchases gilts from the Debt Management Office and not from financial institutions. Asset values are guaranteed by Treasury.
• Dividends, yields and coupons are also returned to Treasury, which effectively enables the government to finance borrowing with a Dire Straits underpin “Money for nothing - Gilts for Free.”
0
200,000
400,000
600,000
800,000
1,000,000
1,200,000
1,400,000
1,600,000
1,800,000
2009 2010 2011 2012 2013 2014 2015
UK Total Gilt Stocks
For more information - Check out The Saturday Economist .com
Data : Debt Management Office : Historical Gilt Holdings Data £ Million
0
100,000
200,000
300,000
400,000
500,000
2009 2010 2011 2012 2013 2014 2015
Bank of England Holdings UK Gilts
For more information - Check out The Saturday Economist .com
Data : Debt Management Office : Historical Gilt Holdings Data £ Million
0%
5%
10%
15%
20%
25%
30%
2009 2010 2011 2012 2013 2014 2015
Bank of England Holdings of UK Gilts %
For more information - Check out The Saturday Economist .com
Data : Debt Management Office : Historical Gilt Holdings Data
0
100,000
200,000
300,000
400,000
500,000
2009 2010 2011 2012 2013 2014 2015
Overseas Holdings UK Gilts
For more information - Check out The Saturday Economist .com
Data : Debt Management Office : Historical Gilt Holdings Data £ Million
20%
25%
30%
35%
2009 2010 2011 2012 2013 2014 2015
Overseas Holdings of UK Gilts %
For more information - Check out The Saturday Economist .com
Data : Debt Management Office : Historical Gilt Holdings Data
0
100,000
200,000
300,000
400,000
500,000
600,000
700,000
800,000
900,000
2009 2010 2011 2012 2013 2014 2015
UK Financial Institutions Holdings UK Gilts
For more information - Check out The Saturday Economist .com
Data : Debt Management Office : Historical Gilt Holdings Data £ Million
30%
40%
50%
60%
2009 2010 2011 2012 2013 2014 2015
UK Financial Institutions Holdings of UK Gilts %
For more information - Check out The Saturday Economist .com
Data : Debt Management Office : Historical Gilt Holdings Data
0
100,000
200,000
300,000
400,000
500,000
2009 2010 2011 2012 2013 2014 2015
Pension Funds Holdings UK Gilts
For more information - Check out The Saturday Economist .com
Data : Debt Management Office : Historical Gilt Holdings Data £ Million
0%
10%
20%
30%
40%
2009 2010 2011 2012 2013 2014 2015
Pension Funds Holdings of UK Gilts %
For more information - Check out The Saturday Economist .com
Data : Debt Management Office : Historical Gilt Holdings Data
0
36,000
72,000
108,000
144,000
180,000
2009 2010 2011 2012 2013 2014 2015
Other UK Financial Institutions Holdings UK Gilts
For more information - Check out The Saturday Economist .com
Data : Debt Management Office : Historical Gilt Holdings Data £ Million
0%
5%
10%
15%
20%
25%
2009 2010 2011 2012 2013 2014 2015
For more information - Check out The Saturday Economist .com
Data : Debt Management Office : Historical Gilt Holdings Data
Other UK Financial Institutions Holdings UK Gilts %
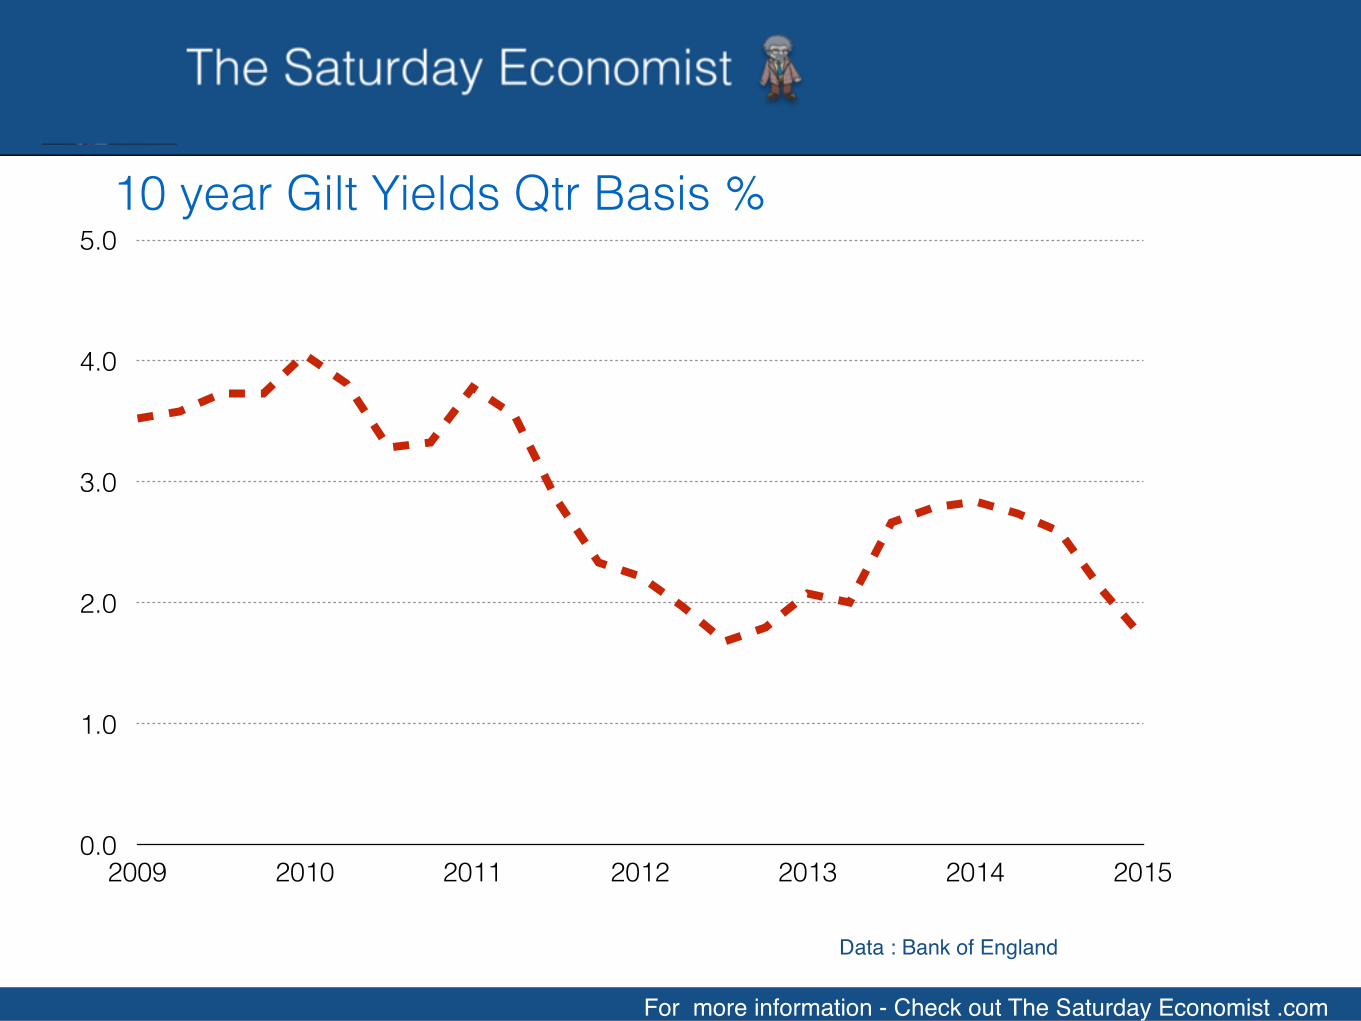
10 year Gilt Yields Qtr Basis %
For more information - Check out The Saturday Economist .com
Data : Bank of England
0.0
1.0
2.0
3.0
4.0
5.0
2009 2010 2011 2012 2013 2014 2015
For more information - Check out The Saturday Economist .com
Data : Debt Management Office : Historical Gilt Holdings Data
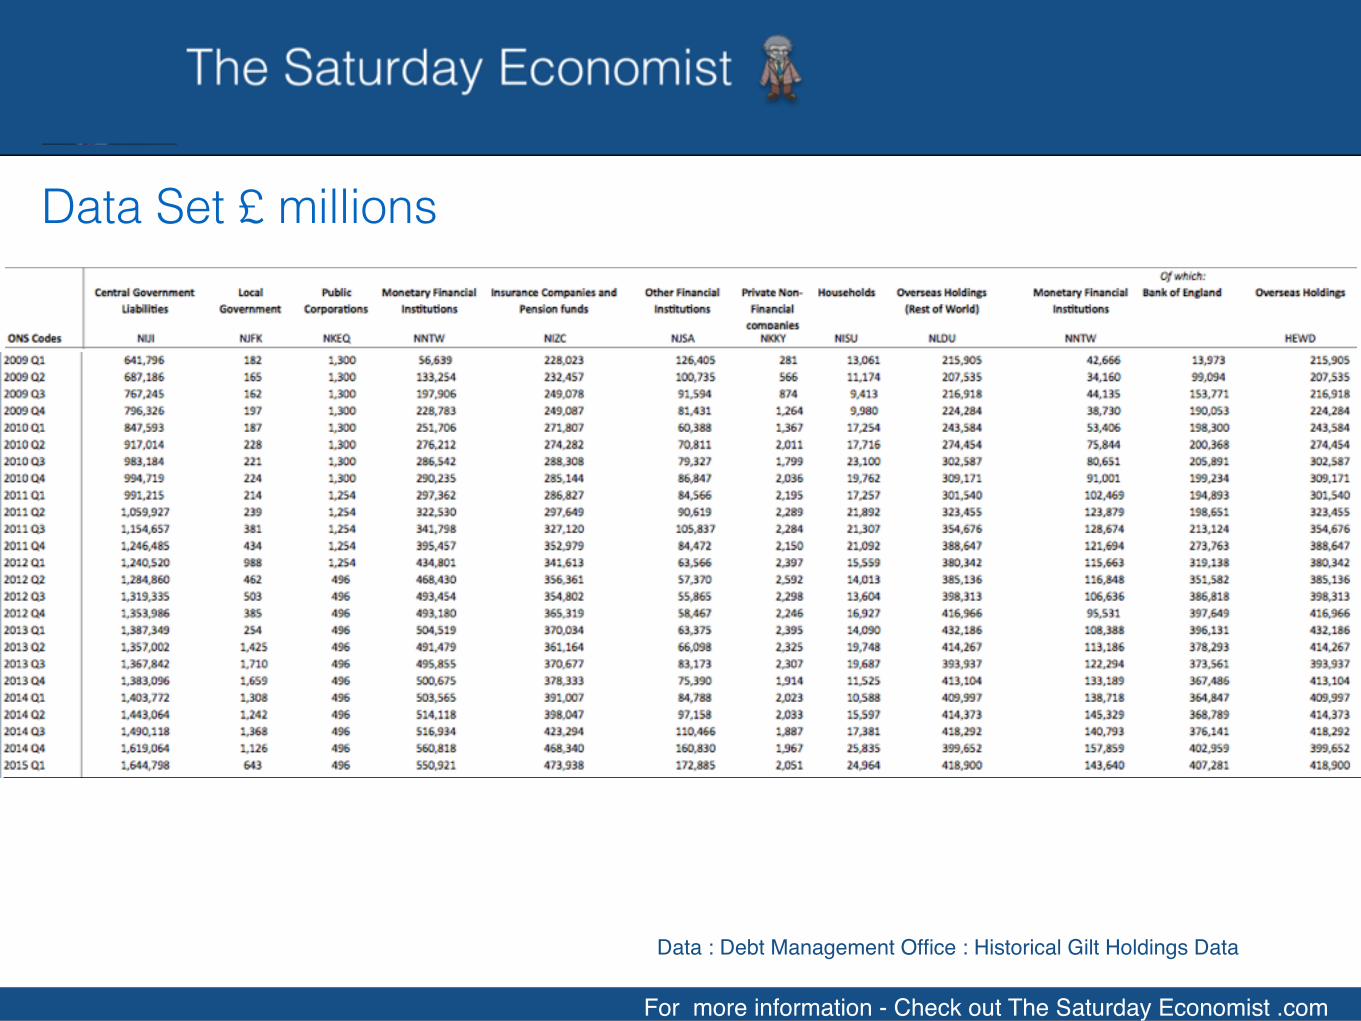
Data Set £ millions
For more information - Check out The Saturday Economist .com
Data : Debt Management Office : Historical Gilt Holdings Data
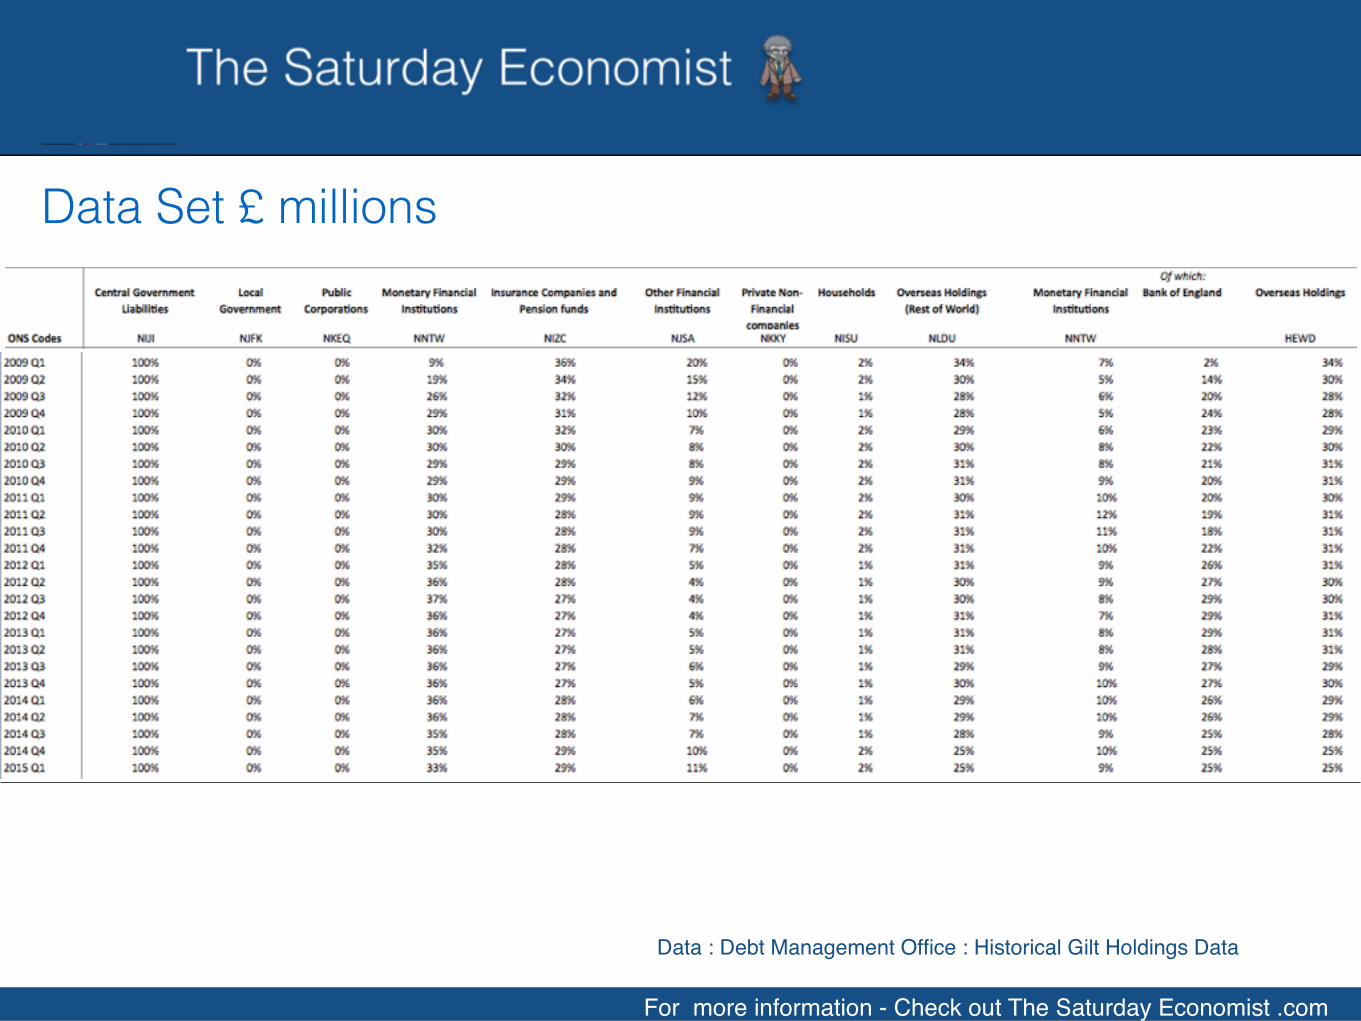
Data Set £ millions
Data : Debt Management Office : Historical Gilt Holdings Data
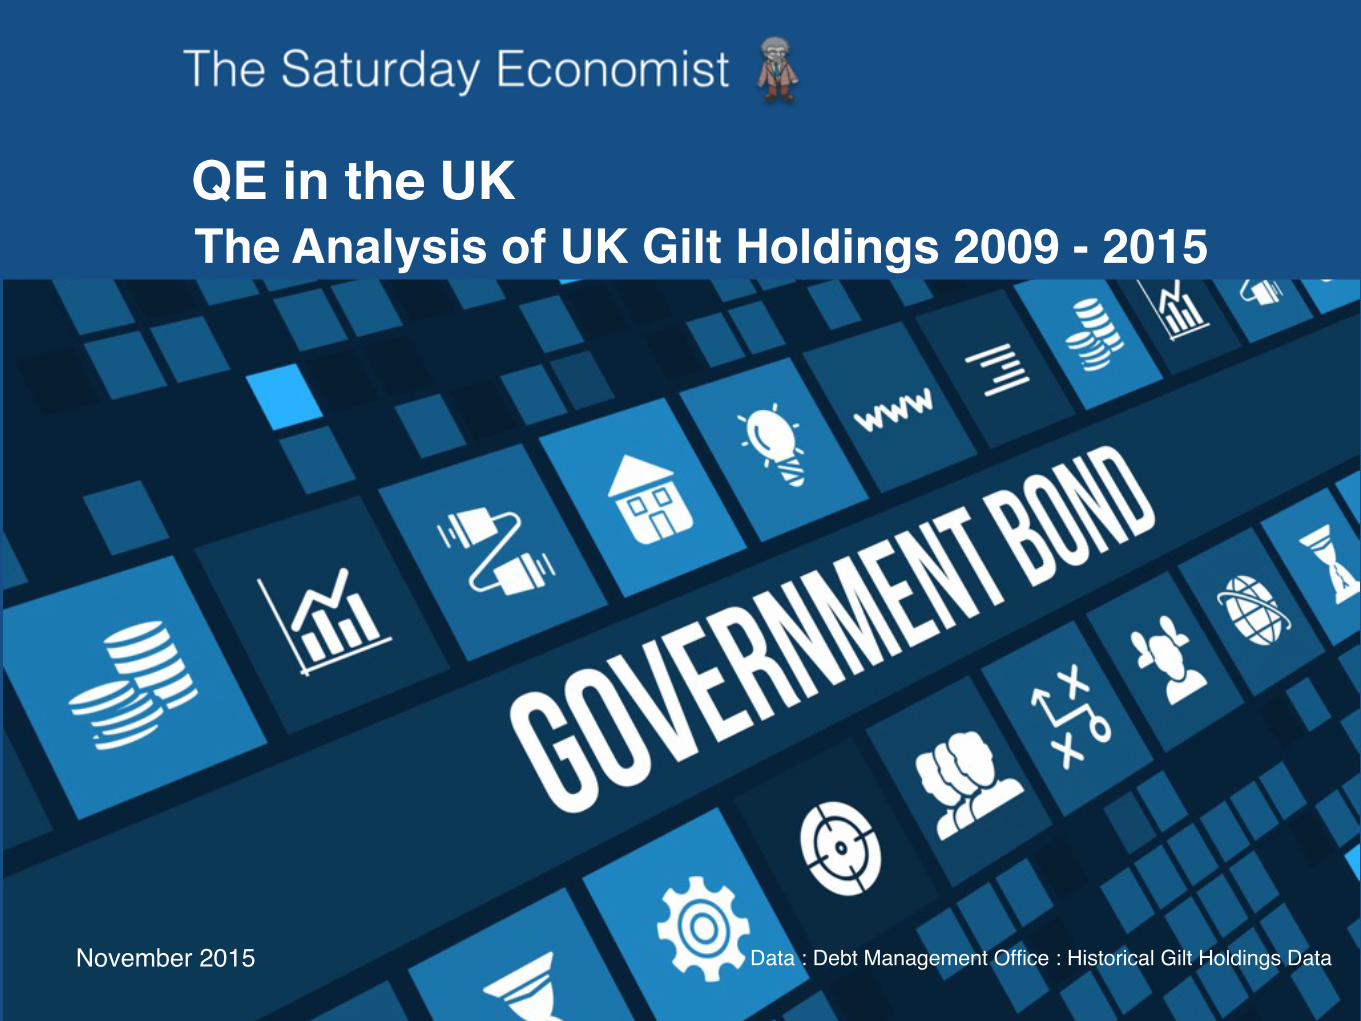
The Analysis of UK Gilt Holdings 2009 - 2015
November 2015
QE in the UK