Embed Size (px)
Citation preview

EX0565 Independent Project in Biology E, 30 HEC M.Sc. Thesis for the Master Programme in Sustainable Technology, Royal Institute of
Technology (KTH), Stockholm
Integrated Production of Bioethanol and Biogas from
Agricultural Residue: Comparison of Pretreatment
Methods Using Mass Flow and Energy Yields Analysis
Debebe Yilma Dererie
Department of Molecular Biology,
Swedish University of Agricultural Sciences
Uppsala, 2010
MicroDrivE Microbially Derived Energy
2
Title
(English)
Integrated Production of Bioethanol and Biogas from Agricultural Residue:
Comparison of Pretreatment Methods Using Mass Flow and Energy Yields
Analysis
Title
(Swedish)
Framställning av bioetanol och biogas från havrehalm: Effekter av olika
förbehandlingsmetoder på utbyte och produktivitet Author Debebe Yilma Dererie
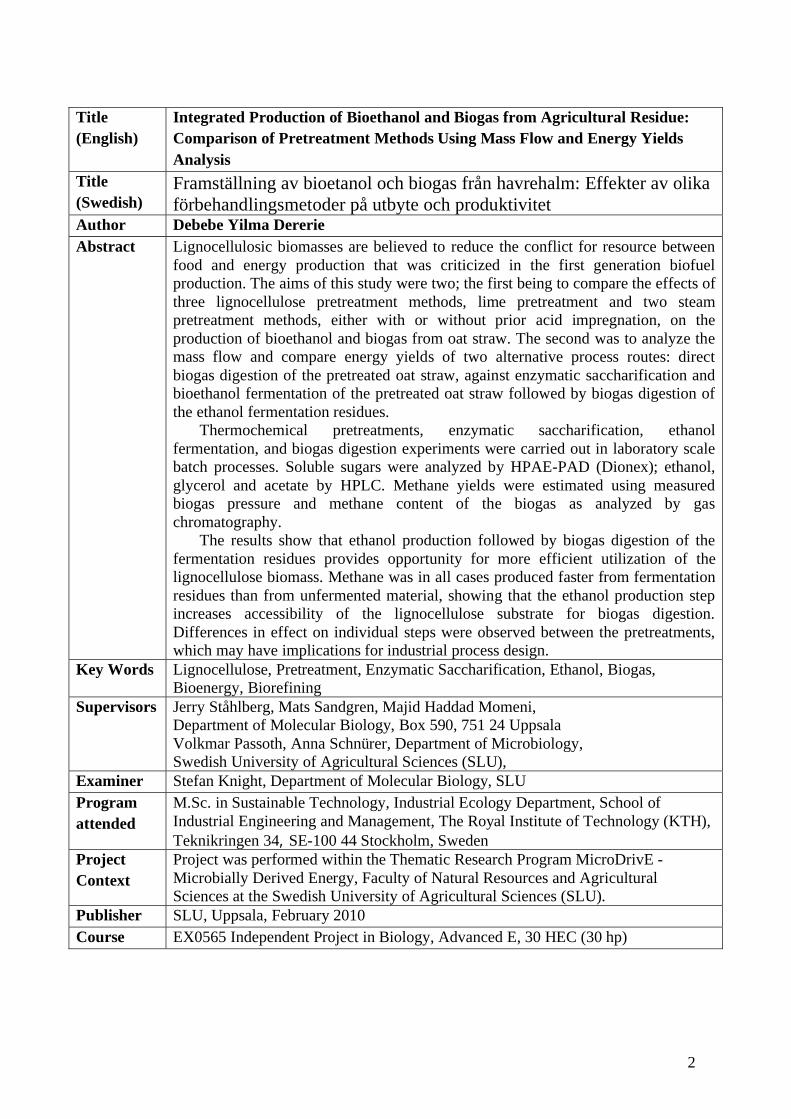
Abstract Lignocellulosic biomasses are believed to reduce the conflict for resource between
food and energy production that was criticized in the first generation biofuel production. The aims of this study were two; the first being to compare the effects of
three lignocellulose pretreatment methods, lime pretreatment and two steam pretreatment methods, either with or without prior acid impregnation, on the
production of bioethanol and biogas from oat straw. The second was to analyze the mass flow and compare energy yields of two alternative process routes: direct
biogas digestion of the pretreated oat straw, against enzymatic saccharification and bioethanol fermentation of the pretreated oat straw followed by biogas digestion of
the ethanol fermentation residues. Thermochemical pretreatments, enzymatic saccharification, ethanol
fermentation, and biogas digestion experiments were carried out in laboratory scale batch processes. Soluble sugars were analyzed by HPAE-PAD (Dionex); ethanol,
glycerol and acetate by HPLC. Methane yields were estimated using measured biogas pressure and methane content of the biogas as analyzed by gas
chromatography. The results show that ethanol production followed by biogas digestion of the
fermentation residues provides opportunity for more efficient utilization of the lignocellulose biomass. Methane was in all cases produced faster from fermentation
residues than from unfermented material, showing that the ethanol production step increases accessibility of the lignocellulose substrate for biogas digestion.
Differences in effect on individual steps were observed between the pretreatments, which may have implications for industrial process design.
Key Words Lignocellulose, Pretreatment, Enzymatic Saccharification, Ethanol, Biogas,
Bioenergy, Biorefining
Supervisors Jerry Ståhlberg, Mats Sandgren, Majid Haddad Momeni, Department of Molecular Biology, Box 590, 751 24 Uppsala
Volkmar Passoth, Anna Schnürer, Department of Microbiology, Swedish University of Agricultural Sciences (SLU),
Examiner Stefan Knight, Department of Molecular Biology, SLU
Program
attended
M.Sc. in Sustainable Technology, Industrial Ecology Department, School of
Industrial Engineering and Management, The Royal Institute of Technology (KTH),
Teknikringen 34, SE-100 44 Stockholm, Sweden
Project
Context
Project was performed within the Thematic Research Program MicroDrivE -
Microbially Derived Energy, Faculty of Natural Resources and Agricultural Sciences at the Swedish University of Agricultural Sciences (SLU).
Publisher SLU, Uppsala, February 2010
Course EX0565 Independent Project in Biology, Advanced E, 30 HEC (30 hp)
3
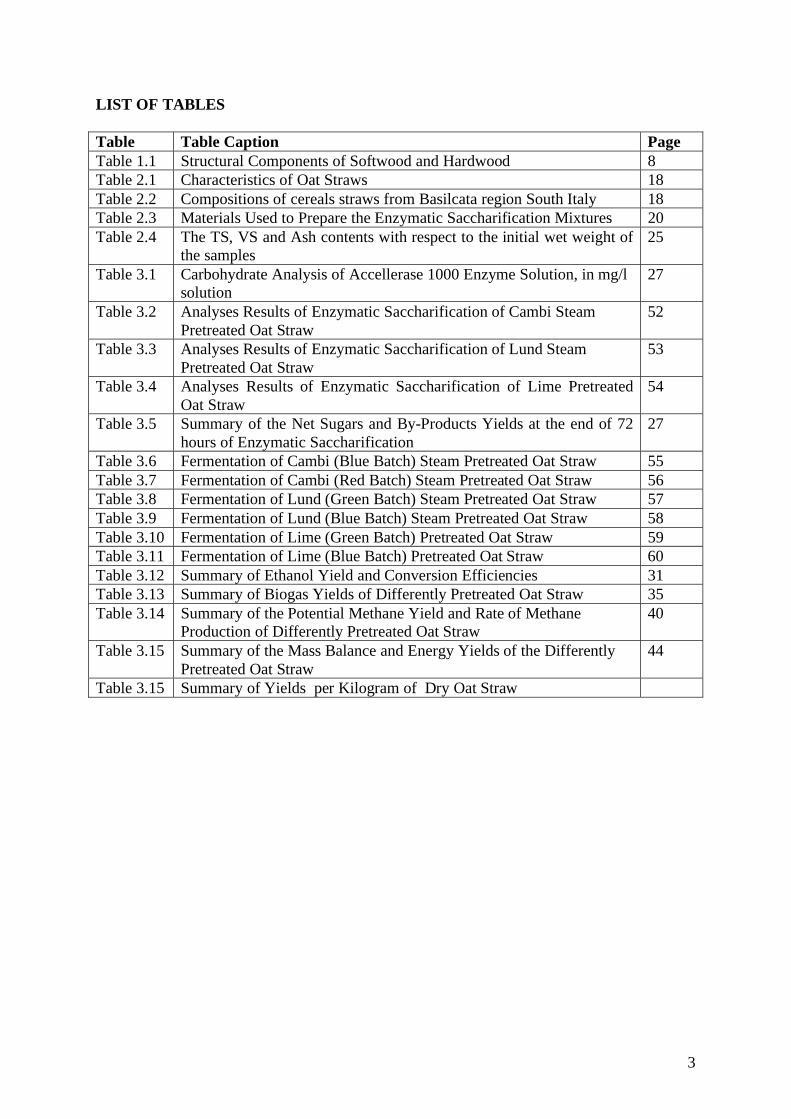
LIST OF TABLES
Table Table Caption Page
Table 1.1 Structural Components of Softwood and Hardwood 8
Table 2.1 Characteristics of Oat Straws 18
Table 2.2 Compositions of cereals straws from Basilcata region South Italy 18
Table 2.3 Materials Used to Prepare the Enzymatic Saccharification Mixtures 20
Table 2.4 The TS, VS and Ash contents with respect to the initial wet weight of the samples
25
Table 3.1 Carbohydrate Analysis of Accellerase 1000 Enzyme Solution, in mg/l solution
27
Table 3.2 Analyses Results of Enzymatic Saccharification of Cambi Steam
Pretreated Oat Straw
52
Table 3.3 Analyses Results of Enzymatic Saccharification of Lund Steam
Pretreated Oat Straw
53
Table 3.4 Analyses Results of Enzymatic Saccharification of Lime Pretreated
Oat Straw
54
Table 3.5 Summary of the Net Sugars and By-Products Yields at the end of 72
hours of Enzymatic Saccharification
27
Table 3.6 Fermentation of Cambi (Blue Batch) Steam Pretreated Oat Straw 55
Table 3.7 Fermentation of Cambi (Red Batch) Steam Pretreated Oat Straw 56
Table 3.8 Fermentation of Lund (Green Batch) Steam Pretreated Oat Straw 57
Table 3.9 Fermentation of Lund (Blue Batch) Steam Pretreated Oat Straw 58
Table 3.10 Fermentation of Lime (Green Batch) Pretreated Oat Straw 59
Table 3.11 Fermentation of Lime (Blue Batch) Pretreated Oat Straw 60
Table 3.12 Summary of Ethanol Yield and Conversion Efficiencies 31
Table 3.13 Summary of Biogas Yields of Differently Pretreated Oat Straw 35
Table 3.14 Summary of the Potential Methane Yield and Rate of Methane Production of Differently Pretreated Oat Straw
40
Table 3.15 Summary of the Mass Balance and Energy Yields of the Differently
Pretreated Oat Straw
44
Table 3.15 Summary of Yields per Kilogram of Dry Oat Straw

4
LIST OF FIGURES
Figure Caption Page
Figure 1.1 Subsequent Microbial Processes in Anaerobic Biogas Digestion 14
Figure 2.1 Overall Experimental Layout 17
Figure 2.2 Cambi Steam Pretreatment Process Flow Sheet 19
Figure 2.3 Enzymatic Saccharification in Shaking Incubator and the Appearances
of the Hydrolyzed Solutions after Boiling them in Water Bath to terminate enzymatic reaction
21
Figure 2.4 Ethanol fermentation in 1.8 liter Jenny Reactors (Belach Bioteknik AB Sweden)
22
Figure 2.5 Flow Sheet of Methane Yield Calculation Scheme 26
Figure 3.1 Glucose and Xylose Concentration during the Enzymatic Saccharification
28
Figure 3.2 Process Parameters during Ethanol Fermentation of Cambi (Blue) Steam Pretreated Oat Straw
61
Figure 3.3 Process Parameters during Ethanol Fermentation of Cambi (Red) Steam Pretreated Oat Straw
61
Figure 3.4 Process Parameters during Ethanol Fermentation of Lund (Green) Steam Pretreated Oat Straw
62
Figure 3.5 Process Parameters during Ethanol Fermentation of Lund (Blue) Steam Pretreated Oat Straw
62
Figure 3.6 Process Parameters during Ethanol Fermentation of Lime (Green) Pretreated Oat Straw
63
Figure 3.7 Process Parameters during Ethanol Fermentation of Lime (Blue) Pretreated Oat Straw
63
Figure 3.8 Fermentation of Cambi (Blue Batch) Steam Pretreated Oat Straw 29
Figure 3.9 Fermentation of Cambi (Red Batch) Steam Pretreated Oat Straw 29
Figure 3.10 Fermentation of Lund (Green Batch) Steam Pretreated Oat Straw 30
Figure 3.11 Fermentation of Lund (Blue Batch) Steam Pretreated Oat Straw 30
Figure 3.12 Fermentation of Lime (Green Batch) Pretreated Oat Straw 30
Figure 3.13 Fermentation of Lime (Blue Batch) Pretreated Oat Straw 31
Figure 3.14 Comparison of Acetate Concentrations during Ethanol Fermentations 33
Figure 3.15 Comparison of Glycerol Concentrations during Ethanol Fermentations 33
Figure 3.16 Ethanol Production Rate during the Ethanol Fermentation 34
Figure 3.17 Biogas Yields of the Differently Pretreated Oat Straw 35
Figure 3.18 Methane Contents of the Biogases from Pretreated Oat Straw 36
Figure 3.19 Methane Yield of the Differently Pretreated Oat Straw 37
Figure 3.20 The Rate of Production of Methane from Differently Pretreated Oat Straw
39

5
LIST OFABBREVIATIONS
CMC = Carboxymethylcellulose
HMF = Hydroxymethylfurfural
OD = Optical Density
SRB = Sulphate Reducing Bacteria
SSF = Simultaneous Saccharification and Fermentation
SSCF = Simultaneous Saccharification and Co-fermentation
TS = Total Solids
VS = Volatile Solids
VFA = Volatile Fatty Acids
VOL = Volatile Organic Liquids
TOM = Total Organic Materials (Including volatile solids and volatile organic liquids)
TOMS = Total Organic Materials and Solids (including total solids and volatile organic
liquids)
6
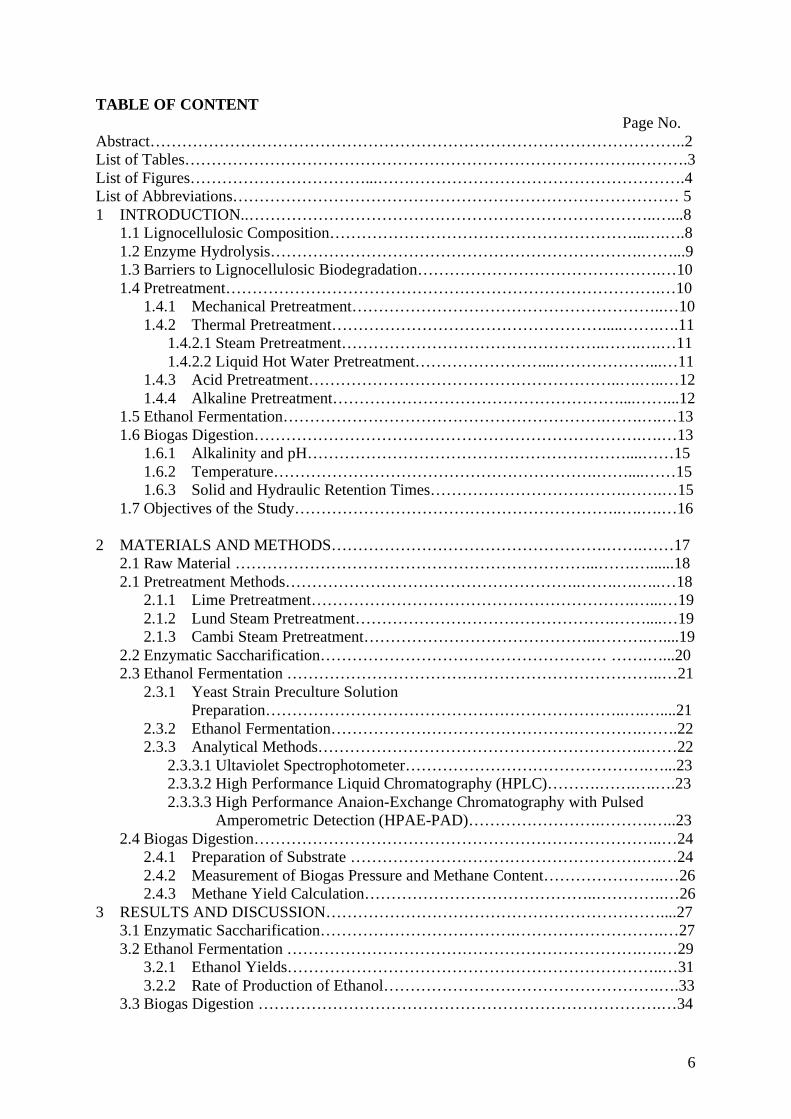
TABLE OF CONTENT
Page No.
Abstract………………………………………………………………………………………..2 List of Tables………………………………………………………………………….……….3
List of Figures……………………………...………………………………………………….4 List of Abbreviations………………………………………………………………………… 5
1 INTRODUCTION..…………………………………………………………………..…...8 1.1 Lignocellulosic Composition…………………………………………………...….….8
1.2 Enzyme Hydrolysis…………………………………………………………….……...9 1.3 Barriers to Lignocellulosic Biodegradation……………………………………….…10
1.4 Pretreatment……………………………………………………………………….…10 1.4.1 Mechanical Pretreatment…………………………………………………..…10
1.4.2 Thermal Pretreatment…………………………………………….....…….….11 1.4.2.1 Steam Pretreatment…………………………………………..…….….…11
1.4.2.2 Liquid Hot Water Pretreatment……………………...………………...…11 1.4.3 Acid Pretreatment…………………………………………………..….…..…12
1.4.4 Alkaline Pretreatment………………………………………………....……...12 1.5 Ethanol Fermentation…………………………………………………….…….….…13
1.6 Biogas Digestion……………………………………………………………….….…13 1.6.1 Alkalinity and pH……………………………………………………....……15
1.6.2 Temperature…………………………………………………….……....……15 1.6.3 Solid and Hydraulic Retention Times……………………………….…….…15
1.7 Objectives of the Study……………………………………………………..….….…16
2 MATERIALS AND METHODS…………………………………………….…….……17 2.1 Raw Material …………………………………………………………...…….…......18
2.1 Pretreatment Methods………………………………………………..…….….…..…18 2.1.1 Lime Pretreatment…………………………………………………….…...…19
2.1.2 Lund Steam Pretreatment………………………………………….……....…19 2.1.3 Cambi Steam Pretreatment……………………………………..……….…....19
2.2 Enzymatic Saccharification……………………………………………… …….…...20 2.3 Ethanol Fermentation ……………………………………………………………..…21
2.3.1 Yeast Strain Preculture Solution Preparation…………………………………………………………..….…....21
2.3.2 Ethanol Fermentation……………………………………….………….…….22 2.3.3 Analytical Methods……………………………………………………..……22
2.3.3.1 Ultaviolet Spectrophotometer……………………………………….…...23
2.3.3.2 High Performance Liquid Chromatography (HPLC)……….…….….….23
2.3.3.3 High Performance Anaion-Exchange Chromatography with Pulsed Amperometric Detection (HPAE-PAD)…………………….……….…..23
2.4 Biogas Digestion…………………………………………………………………..…24 2.4.1 Preparation of Substrate ……………………………………………….….…24
2.4.2 Measurement of Biogas Pressure and Methane Content…………………..…26 2.4.3 Methane Yield Calculation……………………………………..………….…26
3 RESULTS AND DISCUSSION………………………………………………………....27
3.1 Enzymatic Saccharification……………………………….……………………….…27
3.2 Ethanol Fermentation ………………………………………………………….….…29
3.2.1 Ethanol Yields……………………………………………………………..…31
3.2.2 Rate of Production of Ethanol…………………………………………….….33 3.3 Biogas Digestion ………………………………………………………………….…34

7
3.3.1 Biogas Yield……………………………………………………………….…35 3.3.2 Methane Content……………………………………………………..………36
3.3.3 Methane Yield……………………………………………………………..…36 3.3.4 Rate of Methane Production……………………………………….....………39
3.4 Energy Yields based on Mass Flow Study…………………………………...………40 4 CONCLUSIONS…………………………………………………………………………47
5 FUTURE STUDIES …………………………………………………………….….……48 6 REFERENCES………………………………………………………….………..………47
7 ACKNOWLEDGEMENTS……………………………………………………………...51 8 APPENDICES………………………………………………………………………....…52
8.1 Appendix A – Enzymatic Saccharification …………………………………….……52 8.2 Appendix B – Ethanol Fermentation ………………………………………………..55

8
1. INTRODUCTION
The threats of depletion of the global fossil fuel reserve, and the climate change due to greenhouse gas effects have intensified the search for alternative fuel (Tomas-Pejo, 2008).
The choice of raw material for biofuel production has already become key area of research because of the conflict over resources between food and energy production (Kim et al, 2008).
Lignocellulosic biomass such as forest and agricultural residues, grasses and municipality solid waste are seen as options to resolve this conflict. As lignocelluloses are renewable,
abundant (constituting half of the biomass in the planet), ubiquitous to most part of the planet, and have low cost, they are attractive for energy and materials production towards
replacing fossil fuels (Cloete and Malherbe, 2003; Delegnes et al., 1996; Bezzo et al, 2008).
1.1 Lignocellulose Composition
Lignocellulosic biomass refers to plant biomass, which is composed mainly of the following
biopolymers: cellulose, hemicellulose, and lignin (Cloete and Malherbe, 2002; Hendriks and Zeeman, 2008; Zhang et al., 2009). The basic chemistry of cellulose, hemicellulose and
lignin and the physical and chemical associations between these constituents pose physical and chemical barriers to the commercial use of lignocellulosic biomass for ethanol
production (Cleote and Malherbe, 2002).
Cellulose is composed of D-glucopyranose (glucose) monomers bonded with ß-1-4 glycosdic linkage. The repeating unit of cellulose chain is cellobiose, because the successive glucose
units in the cellulose chain are rotated by180° relative to each other. The average degree of polymerization (DP) is estimated in the range of 7000-15000 glucose units.
Hemicellulose is a heterogeneous mixture of shorter polysaccharides, composed mainly of
pentoses (such as xylose and arabinose), hexoses (such as glucose and mannose), and glucoronic acid (Hendriks and Zeeman, 2008); and hemicellulose is more soluble than
cellulose (Palonen, 2004). The most common hemicellulose in hardwood like grasses and straw is xylan, while glucomannan dominates in softwoods (Hendriks and Zeeman, 2008).
Hemicellulose is linked with cellulose and lignin, and thus provides rigidity to the lignocellulose structure formed with the networks of cellulose-hemicellulose-lignin
(Hendriks and Zeeman, 2008).
Table 1.1 Structural Components of Softwood and Hardwood (Source: Siren, 2008)
Hemicellulose %DM Type of
wood
Cellulose
% DM glucomannan Xylan
Other Polysaccharides
%DM
Lignin in %DM
(Dry wood)
Softwoods 33-42 4-20 5-11 3-9 27-32
Hardwood 38-51 1-4 14-30 2-4 21-31
The most soluble hemicellulose sugar is mannose, followed by xylose, glucose, arabinose and
galactose sequentially; and their solubility is positively related with temperature. The solubilization of the components of lignocellulose depends on temperature, pH as well as
moisture content (Hendriks and Zeeman, 2008). The solubilization of hemicellulose in neutral condition starts around 150-180°C, while lignin solubilization starts at around 180°C
in neutral condition (Hendriks and Zeeman, 2008). The xylan part of hemicellulose can be released easily in acid and alkaline environment, while glucomannan requires stronger
alkaline environment (Hendrik and Zeeman, 2008).

9
Lignin is a highly irregular and insoluble polymer consisting of three different
phenylpropanoid subunits, namely p-hydroxyphenyl (H-type), guaiacyl (G-type), and syringyl (S-type) units that are linked by different types of linkages (Cloete and Malherbe,
2002; Hendriks and Zeeman, 2008). It is not composed of chains with repeating sub-units, as is the case in cellulose and hemicellulose, making enzymatic hydrolysis of lignin difficult
(Cloete and Malherbe, 2002).
The intermolecular and intra-molecular hydrogen bonds in cellulose microfibrils, and the covalent and hydrogen bonds with the surrounding hemicellulosic polysaccharides (mannans
and xylans) stabilizes the cellulose microfibrils; however, the amorphous region in the cellulose structure that is characterized by a heterogeneous composition and variety of bonds
creates the opportunity for easier degradation of cellulose (Cloete and Malherbe, 2002).
1.2 Enzymatic Hydrolysis
The hydrolysis of cellulose and hemicellulose to monomeric sugars can be done
enzymatically or by using acids. Efficient enzymatic hydrolysis of celluloses requires at least three categories of enzymes that act synergistically: endoglucanases (EG), cellbiohydrolase
(CBH) and ß-glucosidase or cellobiase (BG). The endo-glucanases randomly hydrolyze the internal 1,4-glucosidic bonds, i.e. intermonomer bonds in the amorphous regions of cellulose
structure. The exoglucanase (CBH) enzymes cut off the cellobiose units processively from the ends of the cellulose chains and are able to proceed to the crystalline cellulose; while the
third category, ß-glucosidase enzymes, hydrolyzes cellobiose to glucose (Xia et al., 2006). Through their action on the amorphous regions of cellulose, endoglucanse enzymes create
new ends for CBH enzyme attack; and ß-glucosidases prevent the accumulation of cellobiose that is inhibitory to the endo- and exoglucanases (Cleote and Malherbe, 2002).
Similar types of enzymes are required to biodegrade hemicellulose; however, it requires a
large number of different enzymes for complete degradation because of its greater complexity compared to cellulose (Cleote and Malherbe, 2002).
The type of raw material most notably affects the yields from hydrolysis of lignocellulosic
material, where softwoods are generally recognized as being more recalcitrant than
hardwoods (Palonen, 2004). The hydrolysis rate limiting factors are traditionally categorized
into two: the first group is related to the structural properties of the substrate and include the degree of polymerization, cellulose crystallinity and lattice structure, structural composition,
particle size, available surface area, degree of fiber swelling, and pore structure and distribution; while the second one is related to the mechanism and interactions of the
cellulase enzymes (Palonen, 2004).
There are commercially available enzymes solutions that can be utilized to hydrolyze
cellulose, and they may have high sugar concentrations as much as 20 to 100g glucose per
liter of enzyme solution; and thus this amount of sugar in the enzyme solution need to be subtracted from sugar yield measured after enzymatic hydrolysis to determine the yield of the
raw material (Zhang et al., 2009).
Hydrolytic enzymes are also applied externally toward the improvement of specific methane yield and productivity of biogas production. Their role was analyzed with studies conducted

10
in 30 biogas plants in Germany that used agricultural biomass as feedstock; and the increase in biogas production achieved as a result of utilizing hydrolytic enzymes externally was
reported to be in the range of 4-35% with an average increase of 18% biogas yield (Gerhardt et al., 2007).
1.3 Barriers to Lignocellulose Biodegradation
The primary objective of any pretreatment technology is to overcome the impediments to hydrolysis, that are structural or compositional in nature, with the aim of improving the rate
of enzymatic hydrolysis and yield of fermentable sugars from the cellulose and hemicelluloses in lignocellulosic biomass (Ladisch et al., 2005). Thus, the effect of the
pretreatment could be composition change (such as decreasing the hemicellulose and the lignin content), physical change (such as increasing surface area and porosity of the substrate,
as well as decreasing crystallinity and degree of polymerization) and improving accessibility of enzymes to the cellulose substrate (Hendriks and Zeeman, 2008; Ladisch et al., 2005).
1.4 Pretreatment
Pretreatment is one of the process stages that bear the highest share of the production cost of biochemical conversion of lignocellulosic biomass (Eggeman, 2005; Zhang, 2009; de Costa
Sousa, 2009). It also influences the costs of processes following the pretreatment such as detoxification of inhibitors (if they were produced), the rate of enzymatic hydrolysis and
enzyme loading, product concentration, mixing power, product purification, power generation, as well as waste treatment requirement (Wyman et. al., 2005).
The following factors could be used as guiding indicators for selection of effective and
economical pretreatment methods: yield of cellulosic fiber that can be easily attacked by enzymes, extent of loss of hemi (cellulose) through conversion to other products, production
of inhibitors to enzymatic hydrolysis as well as ethanol fermentation, the energy requirement for the pretreatment as well as the downstream processes, the cost of size reduction before
pretreatment, the consumption and so the cost of chemical for the pretreatment process, the
amount of residue it produces and the cost of residue treatment (Taherzadeh and Karimi,
2008).
The pretreatment methods can be categorized into mechanical, thermal, chemical, and biological pretreatment, though combination of them is also used.
1.4.1 Mechanical pretreatment
Lignocellulosic biomass is usually cut into smaller pieces that reduces the crystallinity and degree of polymerization, and increase specific surface area. This improves the total yield of
hydrolysis by 5-25% depending on the kind and duration of the size reduction process, while
reducing the time required for hydrolysis by 23-59% (Hendriks and Zeeman, 2008).
Mechanical pretreatment (milling) does not produce inhibitor such as furfural and hydroxmethyl furfural; and thus it has advantage of increasing the ethanol and methane
yields; however it requires high energy for size reduction (Ramos, 2003).

11
1.4.2 Thermal Pretreatment
Thermal pretreatment methods are characterized by heating the lignocellulosic biomass to a temperature above 150-180°C, where the hemicellulose followed by lignin starts to become
soluble. When the temperature reaches 180°C, the solubilization process become exothermic. Severe thermal pretreatments that result in soluble cellulose, hemicellulose, and lignin has a
risk of forming phenolic and heterocyclic compounds such as vanillin, vanillin alcohol, furfural and 5-hydroxymethylfurfural (HMF), especially in acidic environment; and these
compounds can have inhibition and/or toxic effect on the biological reaction processes (Ramos, 2003). When the temperature exceeds 250°C, unwanted pyrolysis reaction may start
to occur, thus such temperatures need to be avoided (Hendriks and Zeeman, 2008).
1.4.2.1 Steam pretreatment
Steam explosion involves exposing the biomass to high temperature (180-210°C) and
pressure for a short time (typically 5-15 minutes) followed by a sudden pressure release. It removes a considerable part of the hemicellulose enhancing the reactivity of cellulose fiber
perhaps because of improved accessibility of cellulose for the enzymes (Laser et al., 2002). The particle size reduction and increase in pore volume of the biomass after the steam
pretreatment does not affect the digestibility of the lignocellulosic biomass much (Ladisch et al., 2005).
The acids formed through the hydrolysis of hemicellulose during steam pretreatment are
thought to catalyze the hemicellulose hydrolysis further; and this effect is called “auto-cleave” steam pretreatment. The formed acids catalyzes the hydrolysis of hemicellulose
oligomers than the solubilization of the hemicellulose (Hendriks and Zeeman, 2008).
The severity of pretreatment is expressed as “Severity factor” (= log R0), which depends on the pretreatment temperature and pretreatment duration, as shown in equation below, though
the duration required for steam pretreatment increases with the moisture content of the biomass (Hendriks and Zeeman, 2008).
Log R0 = Log (t* Exp ((T-100)/14.75))
where t is time in minute and T is temperature in °C.
Steam pretreatment involves the risk of producing compounds such as furfural and soluble phenolic compounds that inhibit the production of ethanol and methane, though methane-
producing bacteria have demonstrated adapting and sometimes converting these inhibitors after sometime (Delegnes et al., 1996). The formation of inhibitors due to further degradation
of hemicellulose could be minimized by separating the liquid condensate from the solid part, adding external alkali to keep the pH between 5-7, or using two step pretreatment (Hendriks
and Zeeman, 2008).
1.4.2.2 Liquid hot water pretreatment
In case of liquid hot water treatment, hot water is used instead of steam to solubilize the
hemicellulose. Keeping pH in the range of 4-7 prevents the formation of inhibitors; however, it minimizes the formation of monosaccharides and degradation products like acids that can

12
catalyze the cellulose hydrolysis further during pretreatment (Ladisch et al., 2005; Hendriks and Zeeman, 2008). The major advantage of the liquid hot water pretreatment method is that
the concentrations of soluble hemicellulose and lignin components are low, compared to the steam pretreatment, because of the higher water input (Hendriks and Zeeman, 2008).
1.4.3 Acid pretreatment
The main effect of acid pretreatment is the hydrolysis of the xylan part of hemicellulose, because glucomannan is relatively stable in acidic environment. The solubilized
hemicellulose may undergo hydrolytic reactions to produce monomers, furfural and HMF, as well as other volatile products in acid environment, and the solubilized lignin condensate and
precipitate faster (Liu and Wyman, 2003). These effects are more pronounced in strong acid pretreatment than in weak acid (Hendriks and Zeeman, 2008).
The risk of formation of inhibiting and volatile degradation products will cause loss of carbon
that could have been used for ethanol production; however, the condensation and precipitation of solublized lignin is usually inhibiting both ethanol and methane production
processes (Hendriks and Zeeman, 2008).
Therefore, acid pretreatment is an appealing method for the production of methane, as certain concentrations of ethanol-inhibiting compounds like furfural and HMF can be handled by
methanogens with time for acclimatization. Dilute acid pretreatment is also one of the potential methods for ethanol production, because the unwanted reactions during the
pretreatment process can be avoided in dilute acid pretreatment; however, strong acid pretreatment is not attractive for ethanol production. (Hendriks and Zeeman, 2008)
1.4.4 Alkaline Pretreatment
The first reactions during alkaline pretreatment are solvation and saponification, which brings the biomass to a swollen state and thus it becomes more easily accessible to enzymes and
bacteria. The main effect of the alkaline pretreatment is delignification of the biomass, and so makes the accessibility of the cellulose to enzymes better. The condensation and precipitation
of solublized lignin may modify the crystalline structure of cellulose and thus can work
against the positive effect of removing the lignin that results in cellulose swelling (Gregg et
al., 1996). Alkaline pretreatment technologies use lower temperature and pressure as compared to the other technologies (Ladisch et al., 2005).
One of the shortcomings of the alkali pretreatment is that the biomass itself consumes part of
the alkali; while lime pretreatment performs better in this regard because of its low cost of chemical, recoverability as calcium carbonate precipitate, and safety in handling the
chemical. Moreover, the production of inhibitors and the loss of carbon to produce them
make alkaline pretreatment less interesting for ethanol production, while the inhibition effect
is less difficult for methane production (Hendriks and Zeeman, 2008).
As discussed above the choice of pretreatment method affects the sugar yields (both hexoses and pentoses), concentrations of the substrate, the required enzyme loadings and cellulase
and hemicellulase activity; which all determine the economic performance of the bioenergy system (Eggeman and Elander, 2005).

13
The lignocellulosic biomass solid concentration in the pretreatment is important parameter as it critically influences the overall energy requirement of the plant and the capital costs of the
down stream processes, i.e. the fermentation and ethanol recovery units (Eggeman and Elander, 2005).
1.5 Ethanol Fermentation
The hexose monomer sugars can be fermented to ethanol easily; while it is difficult to ferment the pentoses as there are only few strains that can do so. The produced ethanol itself
is an inhibitor to the yeast or bacteria that carries out the fermentation of ethanol, thus, this sets the limits to the concentration of fermentable sugars that can be added into the
fermentation broth (Hendriks and Zeeman, 2008). Saccharomyces cerevisiae could only tolerate ethanol concentration up to around 10% in the fermentation broth (El-Abyad et al.,
1992). The potential inhibitors that are produced during pretreatment process are mainly generated from the decomposition of hemi-cellulose or the water-soluble components of
lignin (Delgenes et al., 1996).
For low concentration (at 5 g/liter) of acetate, there was only 1% decrease in ethanol yield, but however 21 % decrease in the growth of Saccharomyces cerevisiae, which is expected to
affect the rate of ethanol production negatively (Delgenes et al., 1996). In severe inhibitory situation, where acetate concentration is more than 5g/liter, glucose is converted to ethanol
and then ethanol is used as substrate and changed to acetate (Pons et al., 1986). The toxic effect of acetate is relatively benign compared to the effects of other toxic products from the
degradation of lignocellulose that include furfural, HMF, vanillin, hydroxylbenzoaldehyde, and syringaldehyde; however, their inhibition effect decreases over time as Saccharomyces
cerevisiae acclimatize (Delgenes et al., 1996).
The most important process improvement made for the enzymatic hydrolysis of biomass was the introduction of simultaneous saccharification and fermentation (SSF), as it has reduced
the number of reactors involved by eliminating the separate hydrolysis reactor and avoiding the problem of product inhibition associated with enzymes. In the presence of glucose, ß-
glucosidase stops hydrolyzing cellobiose. The build up of cellobiose, in turn, shuts down cellulose degradation. In the SSF process scheme, cellulase enzyme and fermenting microbes
are combined. As the enzymes produce sugars, the fermentative organisms convert them to ethanol. The SSF process has, more recently, been improved to include the cofermentation of
multiple sugar substrates (e.g. glucose and xylose) simultaneously with saccharification, and the process is known as Simultaneous Saccharification and Cofermentation (SSCF).
1.6 Biogas Digestion
Anaerobic digestion consists of a series of microbial processes that convert organic compounds to new microbial cells, and mostly methane and carbon dioxide. The performance
of a biogas digestion system is mainly related to the structure in the population of
microorganisms (Demirel and Scherer, 2008). These microbial processes are hydrolysis,
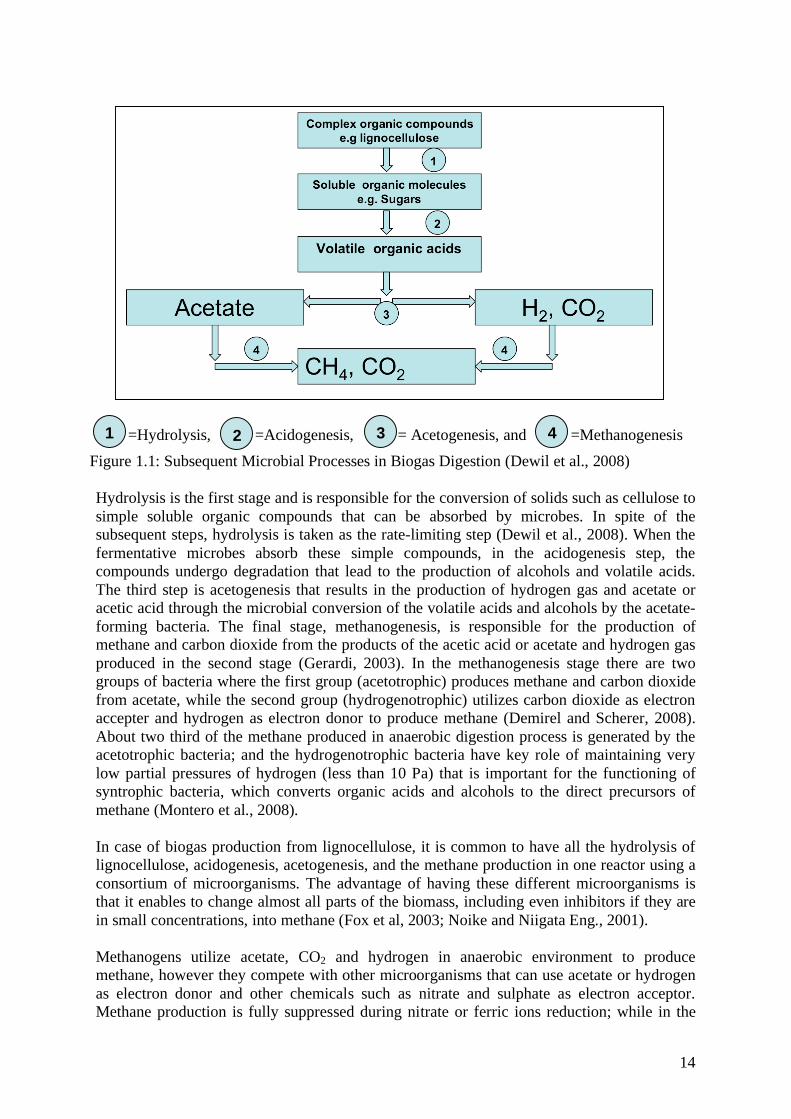
acidogenesis, acetogenesis, and finally methanogenesis as represented in figure 1.1 below (Dewil et al., 2008).
14
=Hydrolysis, =Acidogenesis, = Acetogenesis, and =Methanogenesis
Figure 1.1: Subsequent Microbial Processes in Biogas Digestion (Dewil et al., 2008)
Hydrolysis is the first stage and is responsible for the conversion of solids such as cellulose to
simple soluble organic compounds that can be absorbed by microbes. In spite of the subsequent steps, hydrolysis is taken as the rate-limiting step (Dewil et al., 2008). When the
fermentative microbes absorb these simple compounds, in the acidogenesis step, the compounds undergo degradation that lead to the production of alcohols and volatile acids.
The third step is acetogenesis that results in the production of hydrogen gas and acetate or acetic acid through the microbial conversion of the volatile acids and alcohols by the acetate-
forming bacteria. The final stage, methanogenesis, is responsible for the production of methane and carbon dioxide from the products of the acetic acid or acetate and hydrogen gas
produced in the second stage (Gerardi, 2003). In the methanogenesis stage there are two
groups of bacteria where the first group (acetotrophic) produces methane and carbon dioxide
from acetate, while the second group (hydrogenotrophic) utilizes carbon dioxide as electron accepter and hydrogen as electron donor to produce methane (Demirel and Scherer, 2008).
About two third of the methane produced in anaerobic digestion process is generated by the acetotrophic bacteria; and the hydrogenotrophic bacteria have key role of maintaining very
low partial pressures of hydrogen (less than 10 Pa) that is important for the functioning of syntrophic bacteria, which converts organic acids and alcohols to the direct precursors of
methane (Montero et al., 2008).
In case of biogas production from lignocellulose, it is common to have all the hydrolysis of lignocellulose, acidogenesis, acetogenesis, and the methane production in one reactor using a
consortium of microorganisms. The advantage of having these different microorganisms is that it enables to change almost all parts of the biomass, including even inhibitors if they are
in small concentrations, into methane (Fox et al, 2003; Noike and Niigata Eng., 2001).
Methanogens utilize acetate, CO2 and hydrogen in anaerobic environment to produce
methane, however they compete with other microorganisms that can use acetate or hydrogen
as electron donor and other chemicals such as nitrate and sulphate as electron acceptor. Methane production is fully suppressed during nitrate or ferric ions reduction; while in the
1 4 3 2

15
presence of sulfate ions sulphate-reducing bacteria (SRB) are stronger than methanogens, though not fully outcompete the methanogens, and as a result the methane production is
suppressed (Denier van der Gon et al., 2001). Generally, the SRB have better growth kinetics when compared with methanogens, however, there are other additional factors that may
influence the competition such as adherence properties, affinity for sulphate and sulphate reducers, mixed substrate utilization, relative numbers of bacteria, and conditions in the
digester (like the temperature, pH, and sulfide concentration) (Oude Elferink, 1994).
Important parameters that affect the rate of the different microbial process steps include alkalinity and pH, temperature, and solid and hydraulic retention times.
1.6.1 Alkalinity and pH
The different microorganisms require different optimum pH range. The methanogenic
microbes are very sensitive to pH with their optimum range being 6.5-7.2, while the fermentative microbes are less sensitive to pH and operate in a wide range of pH between
4.0-8.5 (Dewil et al., 2008). The volatile fatty acids formed during the acidogenesis tend to reduce the pH, which is counteracted by the methanogenic microbes that produce alkalinity
as CO2, NH3, and bicarbonate. For a stable and well buffered biogas digestion process, the stability of the buffering capacity expressed as molar ratio of bicarbonate/VFA is of major
importance, while the ratio is recommended to be maintained at least at 1.4:1 or a 70 milli-equivalent CaCO3/l buffering capacity (Dewil et al., 2008).
1.6.2 Temperature
The temperature in the digester has significant influence on the physicochemical properties of substrate components as well as the rate of growth and metabolism of the microbes, which in
turn affect the change in population of the microorganisms in the digester (Dewil et al., 2008). As thermodynamics indicates, at higher temperatures, under standard conditions,
endergonic reactions (reactions absorbing energy in the form of work) such as microbial conversion of propionate to acetate, H2 and CO2 are better favored, while exergonic reactions
such as methane formation through hydrogenotrophic methanogesis are less favored (Dewil et al., 2008).
Increasing the digestion temperature has numerous benefits such as increased solubility of the
organic compounds, increased rates of reactions, and increased pathogens’ death rates; however, it has also negative effects such as increasing free ammonia that inhibits microbial
activities, and the increase in pKa of volatile fatty acids makes the process liable to
inhibition. Therefore, process control is more sensitive issue in thermophilic processes as
compared to the mesophilic processes, because thermophilic bacteria are more sensitive to temperature than the mesophilic ones. Moreover it requires higher energy, has more
dissolved solids in the supernatant and so more odour potential (Dewil et al., 2008). Sharp and frequent temperature fluctuations influences the bacteria, particularly the methanogens;
thus temperature fluctuation more than 0.6°C/day should be avoided, and process failure may occur if the fluctuation exceeds 1°C/day (Dewil et al., 2008).
1.6.3 Solid and Hydraulic Retention Times
The solid retention time (SRT) and the hydraulic retention time (HRT) are the average residence time of the solids and liquid sludge respectively kept in the continuous flow biogas
digester; and thus the SRT is highly related to the extent of reaction. Every time sludge is removed from the digester, a part of the microorganisms in the system are also removed; thus
the cell growth in the digester must be enough to compensate this removal in order to have

16
steady state operation and avoid failure of the process. Therefore, SRT is basic design and operation process parameter in anaerobic processes, and is negatively related to the volatile
fatty acid (VFA) concentration, where very low and low SRT are accompanied with increasing and high VFA, while low VFA is related to sufficient and high SRT (Dewil et al.,
2008).
The nitrogen and phosphorous required as nutrient in biogas digestion system is usually estimated to be 11% and 2% respectively of the biological solids produced, however, it is
useful to make a pilot studies to determine the nutrient requirements for a particular system (Wang et al., 2007). This is reflected with the variation in the recommended C/N ratio for the
maximum biogas and methane yield, which has an overlapping range of 25-28 in spite of the possible differences in carbon sources. Ghose et al. (1979) reported the optimum C/N ratio as
29.5, while Burton and Turner (2003) reported it as a range of 13-28. Hills and Roberts (1984) reported it as non-lignin-carbon to nitrogen ratio of 25-32, while Hamdi et al. (2003)
reported it as C: N: P mass ratio of 100-128:4:1.
In batch experiments, substrates are used sequentially by consuming the substrate that provide the highest per capita population growth rate first; however below a critically small
concentration of the most preferred substrate the less preferred substrate is also used simultaneously (Krivan, 2005).
1.7 Objectives of the Study
The project was a continuation of the master thesis project done by Majid Haddad Momeni, who participated in conducting the experiments of this project as well. The goal of this study
was to evaluate the potential of utilizing oat straw for the production of biofuel in the form of bioethanol and/or biogas, since oat straw has been identified by Sala-Heby Energi AB as a
potential local source of lignocellulosic biomass for biofuel production. The aim of this study was to conduct experiment on biogas digestions of oat straw that had been thermo-chemically
pretreated with lime or two different steam pretreatment methods, with and without prior dilute sulfuric acid impregnation; and compare that process with a two-stage process where
the pretreated material was first subjected to enzymatic saccharification and ethanol
fermentation, thereafter the fermentation residues were subjected to biogas digestion after
evaporation of ethanol.
In this regard, this study was different from the previous study in three aspects, the first being the inclusion of a third pretreatment method, while the second is that the enzymatic
saccharification and ethanol fermentation experiments were carried out in duplicates as opposed to the previous singlet experiments. The third and most notable difference is that it
included the integrated ethanol fermentation and biogas digestion processes arranged in
series, i.e., ethanol fermentation followed by biogas digestion of the fermentation residue,
which exemplifies the application of biorefinery concept. Energy yield calculations of the integrated process have required thorough and detailed mass flow analysis in order to utilize
the experimental data for comparison of the two process routes. These data can also be utilized for more comprehensive life cycle analysis based comparison of the pretreatment
methods and alternative process routes.

17
2. MATERIALS AND METHODS
A flow sheet for the experiments that were carried out in this study is presented in figure 2.1.
Figure 2.1: Overall Experimental Layout
Ethanol

18
2.1 Raw Material
The sole lignocellulose biomass used in this study was oat straw produced in the Sala region, Sweden. Sala Heby Energi AB, the energy producing company in the region of Sala and
Heby, had identified the oat straw as a source of Lignocellulosic biomass for biofuel production and supplied it to the Department of Molecular Biology at the Swedish University
of Agricultural Sciences. The oat straw was chopped, in a previous study, to a particle size range of 5-15 cm length using an ordinary kitchen food processor operating at maximum
speed. The chopped oat straw had a dry matter content (DM or TS) of 94.6% and volatile solid content (as a measure of the organic content) of 87.9%.
Table 2.1: Characteristics of Oat Straws (Ghaly, 1993)
Variety of Oat Straw
Characteristics Shaw Sentinel Tibor
Proximate Analysis* (%)
• Volatile matter 81.54 78.88 75.65
• Fixed Carbon 16.66 17.04 19.29
• Ash 1.80 4.08 5.06
Ultimate Analysis* (%)
C 45.00 46.30 44.94
H 6.00 6.02 5.51
O 46.52 43.47 46.62
N 0.42 0.13 1.13
S 0.05 0.11 0.16
Cl 0.2 0.02 0.05
Ash 1.99 3.95 5.39
Lower Heating value (MJ/kg) 18.21 17.66 17.8
*Weight percentage on dry basis
The composition of oat straw was not measured in this experiment, however it may vary as shown in table 2.1. The sugar content of oat straw in table 2.2, as reported by Viola et al.
(2008), was presented as reference to have the feeling of the composition of the oat straw and
the yields of enzymatic saccharification and ethanol fermentation efficiency of the different
pretreatment methods used in this study.
Table 2.2: Compositions of Cereals Straws from Basilcata Region South Italy (Viola et al., 2008) Compositions in grams in 1kg straw
Lignin Glucose Xylose Arabinose Galactose Mannose Extractives Ash
Wheat straw
(Triticum Durum) 226 390 247 12 5 2 45 75
Barley Straw
(Hordeum vulgare) 250 334 249 28 10 61 68
Oat straw
(Avena sativa3) 248 344 242 27 8 56 75
2.2 Pretreatment Methods
The pretreatment methods used in this study were lime pretreatment and two steam pretreatment methods, which are elaborated below. After the pretreatment procedures were
completed, the pretreated materials were kept at -20°C until defrosted at 4°C over night for

19
use in the consecutive experimental procedures such as enzymatic saccharification or anaerobic digestion.
2.2.1 Lime Pretreatment
Chopped oat straw of 84.6 gram (equivalent to 80 gram dry matter) and 8.46 gram of lime
powder (96% Ca(OH)2 and 3% CaCO3 ) were mixed in sterile Erlenmeyer flasks, and diluted with distilled water to a final volume of 1 liter. Duplicate mixtures were put in shaking
incubator (INFORS HT, Thermotron) at 55°C and 100 rpm for 24 hours. The mixtures were kept at -20°C for 11 days, before adjustment of pH to about 4.5 and then kept again at -20°C
until use in enzymatic saccharification and ethanol fermentation consecutively. However, the pH adjustment of the lime pretreated oat straw that was used in the biogas digestion was done
after about three months at -20°C, prior to the biogas digestion experiment.
2.2.2 Lund Steam Pretreatment
Chopped oat straw of 3-5 mm length was presoaked with 0.2% diluted sulfuric acid solution
over night, followed by steam explosion after being kept at 190°C for 10 minutes. This was done at the Chemical Engineering Department of Lund University.
2.2.3 Cambi Steam Pretreatment
Chopped oat straw of 3-5 mm length was steam pretreated at Cambi AB, in Norway. The industrial scale steam pretreatment (also called hydrothermal pretreatment) process is a
continuous process where the process flow sheet and the parameters are depicted as shown in figure 2.2 below. In the laboratory scale steam pretreatment, the straw is fed to the main
reactor, and steam is supplied until the temperature in it is 190°C, and then15minutes later the steam pressure and so the straw is released to the flash tank.
Figure 2.2: Cambi Steam Pretreatment Process Flow Sheet (Source: www.Cambi.no)
20
2.3 Enzymatic Saccharification
The enzyme used for the saccharification was Accellerase 1000, a commercially available cellulase enzyme mixture designed for complex lignocellulosic biomass hydrolysis. The
enzyme was a gift from Genencor - A Danisco Division (Palo Alto, USA). The product certificate analysis showed endoglucanase activity of 2707 CMC unit/g, where 1 CMC unit
of activity releases 1 micromole of reducing sugars (expressed as glucose equivalents) from carboxymethyl cellulose (CMC) in one minute under assay conditions of 50°C and pH of 4.8.
This was checked according to the procedure provided by the producer. Similarly, the certificate indicated beta-glucosidase activity of 431 pNPG unit/g, where 1 pNPG unit
represents 1 micro mole of nitrophenol released from para-nitrophenyl-ß-D-glucopyranoside in 10 minutes at 50°C and pH 4.8.
Cambi and Lund steam pretreated oat straw that were kept at -20 °C were defrosted and
weighed and put into 3 liter Erlenmeyer flasks, while lime pretreated oat straw was defrosted and placed into another 3 liter Erlenmeyer flask. About 30ml distilled water was used for
final rinsing to ensure complete transfer of the contents. 1M Citrate buffer was filtered using non-pyrogenic sterile-R 0.45-micrometer filters, and it was added to flasks to a final
concentration 50mM. Then the pH was adjusted to 4.5 using NaOH or hydrochloric acid. The saccharification solution was prepared as shown in table 2.3. The total solid content (TS) of
the Accellerase 1000 was 12.36% as measured in the Department of Molecular Biology.
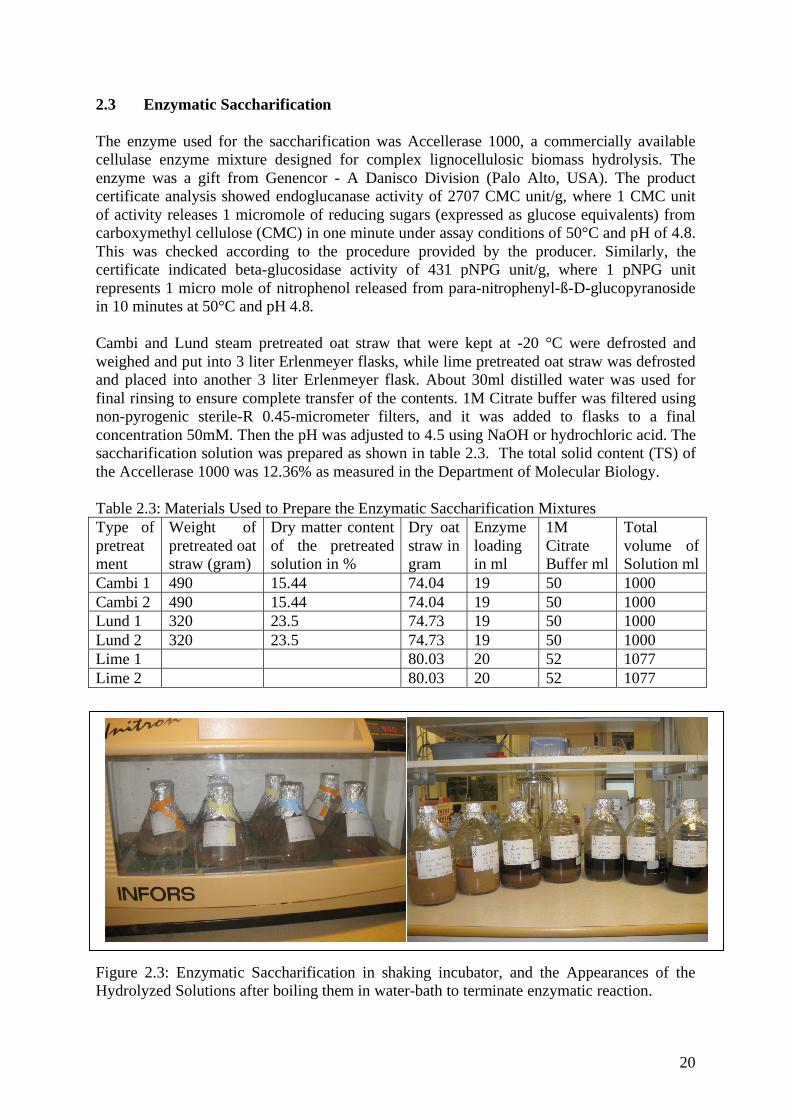
Table 2.3: Materials Used to Prepare the Enzymatic Saccharification Mixtures
Type of
pretreatment
Weight of
pretreated oat straw (gram)
Dry matter content
of the pretreated solution in %
Dry oat
straw in gram
Enzyme
loading in ml
1M
Citrate Buffer ml
Total
volume of Solution ml
Cambi 1 490 15.44 74.04 19 50 1000
Cambi 2 490 15.44 74.04 19 50 1000
Lund 1 320 23.5 74.73 19 50 1000
Lund 2 320 23.5 74.73 19 50 1000
Lime 1 80.03 20 52 1077
Lime 2 80.03 20 52 1077
Figure 2.3: Enzymatic Saccharification in shaking incubator, and the Appearances of the Hydrolyzed Solutions after boiling them in water-bath to terminate enzymatic reaction.

21
The enzymatic saccharification of all the duplicates of the pretreated oat straw was done in shaking incubator (INFORS HT) at 100 rpm, 55°C and pH of 4.5, and the enzyme loading
was 0.25ml Accellerase solution per gram of dry oat straw. This saccharification condition was chosen based on the enzyme producer’s recommended ranges of temperature of 50-65°C,
pH of 4.0 – 5.0, and enzyme loading rate of 0.05 – 0.25ml per g of biomass. Duplicate samples of 1ml were taken, for the composition analysis using HPLC and HPAE-PAD, after
24, 48 and 72 hours. The saccharification process was terminated after 72 hours, followed by boiling the hydrolyzed mixtures in water bath for 25 minutes in order to discontinue the
enzymatic actions, and then the hydrolyzates were kept at -20°C until used for ethanol fermentation.
2.4 Ethanol Fermentation
The ethanol fermentation of the pretreated and saccharified oat straw mixtures were carried out according to the following procedures.
2.4.1 Yeast Strain Pre-culture Solution Preparation
Agar solution was prepared containing 2% glucose, 2% peptone, 1.65% agar technical, and 1% yeast extract, followed by sterilization at 125°C for 20 minutes. When the agar solution
temperature was in the range of 60-70°C, it was used to prepare agar plates of roughly 20 ml each, in sterile environment. The conventional Saccharomyces cerevisiae yeast strain was
kept at -70°C freezer at the Genetic Center (SLU); and thus was defrosted on ice. After maintaining the agar plates for 72 hours at room temperature, then about 50 micro liters (5
loops) of the yeast strain was applied on each of the agar plates. Yeast inoculated agar plates were kept at room temperature overnight to let the yeast grow.
Glucose solution containing 20% w/v glucose in distilled water, and yeast nitrogen base
(YNB) solution containing 6.7% w/v YNB in distilled water were prepared and sterilized at 125°C for 20 minutes. The glucose solution was kept at room temperature, while the YNB
solution was stored in 4°C refrigerator. The pre-culture yeast solution was prepared by
mixing 20 ml of the glucose solution, 20 ml of the YNB solution, about 100 micro liters (10-
11 loops) of yeast cells grown on the agar plates, and 160 ml of distilled water in 500ml Erlenmeyer flask, which was then kept at 30°C overnight. The 200ml of yeast preculture
solution was used for a duplicate of fermentation, though some amount is left unused.
The amount of yeast pre-culture solution added into the fermenters were determined by measuring the optical density (OD) of the yeast pre-culture solution using the UV
spectrophotometer and calculating the amount of pre-culture solution required to make the
optical density of the final fermentation broth become 0.1. Actually, the preculture solutions
had OD of around 2.4, and the amounts of pre-culture solution added to the fermentation units were 50ml for Lund, 53ml for lime and 51ml for Cambi. This made the estimated OD
in the final fermentation solutions of to be 0.115 in all the three cases.

22
2.4.2 Ethanol Fermentation
The ethanol fermentation experiments were performed using the 1.8 liter Jenny reactors (Belach Biotechnik, Sweden) that can contain 1-liter fermentation solution. The duplicates of
pretreated and enzymatically hydrolyzed oat straw were fermented in parallel.
The internal part of the fermentation units that were expected to be in contact with the material to be fermented were cleaned with hot water and detergent followed by spraying
70% ethanol. The reactors were assembled, and the pH and oxygen sensors were calibrated according to the procedure provided in the manufacturer’s manual. The ethanol fermentation
process was controlled automatically, at pH 4.5-4.6, temperature 30°C, and 200 rpm. The pH of the fermentation broth was controlled automatically using 25%w/w NaOH and 3M H3PO4, while oxygen content was measured and recorded but not controlled.
Figure 2.4: Ethanol fermentation in 1.8 liter Jenny Reactors (Belach Bioteknik AB, Sweden)
Duplicates of 1ml samples were taken from the fermentation broth at planned intervals and
kept at -20°C freezer. The samples were then centrifuged, filtered and sterilized using non-pyrogenic sterile-R filter (0.45 micro meter mesh), and analyzed using HPLC and HPAE-
PAD to study the ethanol fermentation processes and yields of the differently pretreated oat straw.
2.4.3 Analytical Methods
The analytical methods used in relation to the enzymatic saccharification and ethanol
fermentation were optical density (OD) using UV/VIS spectrophotometer, high performance
liquid chromatography (HPLC) and high performance anion-exchange chromatography with pulsed amperometric detection (HPLC/HPAE-PAD).

23
2.4.3.1 Spectrophotometer
The spectrophotometer was used to measure the optical density as an indicator of concentration of Saccharomyces Cerevisiae in the yeast pre-culture solutions to determine the
appropriate amount of pre-culture solution to be added to the reactors. The optical density measurements were done at 600nm wavelength and taking distilled water as zero
background. UV spectrophotometer was also used, at 540nm, in the process of checking the enzyme activity of Accellerase 1000.
2.4.3.2 High Performance Liquid Chromatograph (HPLC)
The amounts of ethanol, acetate and glycerol were analyzed using the HPLC at the
Microbiology Department of the Swedish University of Agricultural Sciences located in the Genetic Center. The HPLC was equipped with Hamilton HC-75 cation exchange column
(305 x 7.8 mm; Hamilton, Reno, Nev.) and refractory index (RI) detector (Agilent 1100 series). The column was eluted at 60°C with a mobile phase of 5mM sulfuric acid at a flow
rate of 0.6 ml/min.
The standard samples prepared for the calibration of the HPLC at the Genetic Center contained glucose, xylose, glycerol, acetate, and ethanol at equal concentrations of 10, 5, 2.5,
1.25, 0.625, and 0.3125 g/liter.
Initially, the HPLC was used to measure the concentrations of glucose, xylose, glycerol, acetate and ethanol in the samples taken during enzymatic saccharification and ethanol
fermentation processes. However, the xylose concentration was observed decreasing as the fermentation process progressed until glucose is fully depleted, while it was known that the
conventional Saccharomyces Cerevisiae used in the ethanol fermentation experiments do not use xylose (Toivari, 2004). Therefore, it was decided to consider only the glycerol, acetate
and ethanol concentrations measured by this HPLC for the analysis of the experiments, while the sugar concentrations were measured using HPAE-PAD, which shows better separation
and higher sensitivity with carbohydrates. This improvement was mainly because the retention times in HPAE-PAD were well dispersed as opposed to the close retention times of
the sugars as analyzed in HPLC, though the HPAE-PAD requires dilution which may introduce dilution errors.
2.4.3.3 High Performance Anion-Exchange Chromatography with Pulsed
Amperometric Detection (HPAE-PAD)
The concentrations of soluble sugars (arabinose, galactose, glucose, xylose, mannose and
cellobiose) in the samples taken from the saccharification and ethanol fermentation processes were measured using the high performance anion exchange chromatography with pulsed
amperometric detection (HPAE-PAD) on Dionex ICS-3000 HPLC-system (Dionex, Sunnyvale, CA, USA) at the Department of Molecular Biology of the Swedish University for
Agricultural Sciences. The CarboPac PA10 anion exchange column (4 x 250 mm) was used
to provide high-resolution separations of the sugars at 30°C, at a flow rate of 1.0 ml/min. The
sugars went through isocratic elution using 100% water and a gradient up to 200mM NaOH and 0.5 M sodium acetate (Svedberg, 2006; Momeni, 2008).
24
As the Dionex was working at lower concentration ranges, both the standard samples as well as the samples from the saccharification and ethanol fermentation processes were diluted.
Generally, the samples from the enzymatic saccharification, and the first five samples from the ethanol fermentation of Cambi steam pretreated were diluted 200 times, while the other
samples from the fermentation processes were diluted 100 times.
The standard samples that were used to calibrate the HPLC at the Genetic Center, were measured in the HPAE-PAD to compare the calibration of the two instruments. As a result of
this, the measured concentrations of glucose and xylose in the HPAE-PAD were adjusted accordingly in order to make use of the same standard. The first two of the standard samples
were diluted 200 times while the rest four were diluted 100 times.
2.5 Biogas Digestion
The inoculum, used in the batch biogas digesters to provide the consortium of microorganisms and nutrients, was biogas sludge taken from the hydrolysis stage of three-
stage continuous biogas production plant at Västerås in Sweden. The inoculum used in this experiment was taken from the plant on March 30, 2009 and used in the experiment launched
on April 7, 2009. It was filtered to remove larger materials mixed with it, and kept at 37°C room, before it was used in the biogas digesters. However, the inoculum used for the repeat
experiment was taken from the plant at the end of September, and was used in the biogas digestion experiment launched on October 12, 2009.
The biogas digestion experiments of both fermented and unfermented pretreated oat straw as
well as the inoculum were carried out at the same time and in triplicates.
2.5.1 Preparation of Substrate
The fermented materials were taken from -20°C and defrosted at 4°C, before the ethanol in the fermented mixtures were evaporated using a rotary evaporator (rotavapor), in order to
simulate the removal of ethanol by distillation in an industrial process. The evaporator worked by heating the fermented material in 80°C water bath for about 45 minutes, while
applying vacuum (using tap water as ejector) to remove the ethanol. After the evaporation of the ethanol, the duplicates of fermented materials were mixed to reduce variation in the
biogas digestion experiment. HPLC analysis revealed that substantial amounts of ethanol
remained after evaporation, but this was taken into consideration in the mass flow analysis
when calculating biogas yield in the anaerobic digestion step.
The total solid (TS) and volatile solid (VS) contents were measured for differently pretreated oat straws, their fermentation residues and the inoculum. The TS was found by dividing the
mass after drying the sample in oven at 105°C for 24 hours with the mass of the sample before drying. Similarly, the ash content is calculated by the mass after heating the sample at
550°C for 8 hours by the initial mass of the sample before drying at 105°C for 24 hours. The
volatile solid (VS) content, as a measure of the organic content in the sample, was calculated
by subtracting the ash content from the TS. The TS and VS values of the materials used for the biogas digestion are presented in table 2.4.
The batch biogas digestion experiments were carried out in triplicates using 1120 milliliter
bottles as biogas digesters, for all the six types of substrates as well as the inoculum, making the total number of bottles 21. The amount of pretreated oat straw added in each batch biogas

25
digester was calculated to have substrate equivalent to 3gram of volatile solid, except for the unfermented Cambi steam pretreated oat straw that was having 2 g volatile solid and
unfermented lime pretreated oat straw that was 4.71g. These two triplicates of biogas digestion experiments, unfermented lime and unfermented Cambi, had substrate VS values
different from 3gm by mistake, and thus they were repeated in October 2009 using another inoculum. The amount of inoculum added in each of the 21 bottles was equivalent to 6 grams
volatile solid. After putting the substrates and the inoculum, distilled water was added to make the final mass of the mixture 700 grams. The bottles were flushed with nitrogen gas
while adding the inoculum and then closed with rubber stoppers and aluminum caps to avoid potential biogas leakage.
The biogas digestion experiments in the 21 bottles were started on April 07, 2009 by putting
the batch biogas digesters on a shaker (130 rpm) in 37°C incubation room at the Genetic Center; and they were terminated after 98 days of anaerobic digestion, on July 14, 2009.
Similarly, the repeat experiment on biogas digestion that was launched on October 12, 2009 was terminated after 35 days of digestion.
The TS and VS of the digestates were also measured (Table 2.4) immediately after the
termination of the biogas digestion experiments. TS and VS values are given for the repeat experiments when appropriate, as indicated.
Table 2.4: The TS, VS and Ash contents in percentage of initial wet mass Substrates before start of
biogas digestion experiment
Digestate at the end of the
biogas digestion experiment
TS
(%)
VS (%) Ash (%)
Mass of
substrate
in digester
in grams TS (%) VS (%) Ash (%)
Lund Steam pretreated
and Fermented 6.47 5.18 1.36
3
1.21
0.73
0.48
Lime Pretreated &
Fermented 8.39 5.92 2.61
3
1.27 0.72 0.54
Cambi Steam Pretreated
and Fermented 6.45 4.85 1.69
3
1.31
0.83
0.49
Lund Pretreated
(unfermented) 23.5** 21.7**
1.8**
2
1.13 0.73 0.40
Lime Pretreated
(unfermented)
9.35 7.56 1.79
4.71
1.47 0.94 0.53
Cambi Steam Pretreated
(unfermented) 10.02* 9.53* 2.84*
2
1.13 0.75 0.38
Inoculum 4.36 3.06 1.35 6 0.99 0.64 0.36
Repeated Experiment
Lime Pretreated
(Unfermented)
9.35
7.56
1.79
3
1.52
0.88
0.64
Cambi Steam Pretreated
(Unfermented) 15.44 14.04
1.4
3
1.49
0.93
0.56
Inoculum 3.43 2.16 1.28 6 1.22 0.70 0.52 N.B: *The TS and VS of the unfermented Cambi steam pretreated oat straw used in the enzymatic
saccharification and the repeated biogas digestion were similar; however the TS and VS of the material used in
the first biogas digestion experiment were lower.
** The TS and VS values of Lund pretreated oat straw were taken from previous study by Majid (2008).
• There was a mistake in the TS and VS measurements of the first biogas digestion with unfermented lime
pretreated oat straw that lead to an excess dosage of VS in the digesters, and thus the values for the repeat
experiment were used.

26
2.5.2 Measurement of Biogas Pressure and Methane Content
The biogas pressure of the bottles were measured using digital pressure meter; and then 2ml
biogas samples were taken using syringe and put in 23 ml vials to determine the methane contents of the biogas from each bottle using gas chromatography. The pressure measurement
and sampling was done every other day initially, and the frequency was reduced to more than a week interval when the experiments near termination. The methane contents in the biogas
samples were measured using the gas chromatograph (Perkin Elmer ARNEL Clarus 500) in the Department of Microbiology that used helium as the mobile phase.
2.5.4 Methane Yield Calculation
The biogas and methane yields from the batch biogas digesters were estimated by using the Excel worksheet that was used by the Department of Microbiology for such calculations
(prepared by Mikael Hansson). The Excel sheet estimates the biogas and methane yield at standard temperature and pressure (NTP) by utilizing the measured pressure and methane
content from the gas chromatograph with the assumption of the ideal gas law equation. The Excel worksheet calculation steps are presented in figure 2.5 as flow sheet. The mass balance
was done based on the ideal gas equation where the biogas is assumed to be composed of only methane and carbon dioxide.
Figure 2.5: Flow Sheet of Methane Yield Calculation Scheme

27
3 RESULTS AND DISCUSSION
3.1 Enzymatic Saccharification
The enzymatic saccharification of the differently pretreated oat straw was done at 55°C, 100
rpm, and enzyme loading rate of 0.25ml/g dry oat straw. The compositions of the samples taken from the enzymatic saccharification processes were analyzed using the HPAE-PAD to
measure the concentrations of soluble sugars, and HPLC for acetate, glycerol and ethanol concentrations. As the study was targeted to know the final concentrations of enzymatic
saccharification, frequent sampling and analyses of the initial concentrations (before starting the enzymatic saccharification) were not done.
Table 3.1: Carbohydrate Analysis of Accellerase 1000 Enzyme Solution, in mg/l solution
Arabinose Galactose Glucose Mannose Cellobiose Total
Sample 1 108 946 3318 3134 679 8184
Sample 2 141 1179 4156 3898 835 10210
Sample 3 132 1100 3879 3643 783 9537
Average 127 1075 3785 3558 766 9310
The table 3.1 above shows the concentrations of sugars in the Accellerase 1000 enzyme solution, which needs to be multiplied by the amount of enzyme solution added in liter per
liter of saccharification solution, i.e. 0.019l/l, in order to know the contribution of the enzyme to the final sugar content of the hydrolyzates. Thus, the amount of sugars added with the
Accellerase 1000 enzyme solution was less than 80 mg/liter for a single sugar type and 180 mg/liter for the sum of all the six sugar types; and this is estimated to constitute less than 1%
of the yield measured at the end of enzymatic saccharification, which is not significant.
Table 3.5 Summary of the Net Sugars and By-Products Yields after 72 hrs Saccharification
Yields in g/kg of Dry Oat Straw Components
Lime Pretreated Lund Steam Pretrea. Cambi Steam Pretr.
Glucose 148 157 229
Xylose 80 76 44
Arabinose 19.6 4.7 1.2
Galactose 1.04 0.72 0.93
Mannose 0.12 0.94 1.10
Cellobiose 0.00 1.26 10.87
Ethanol 5.60 0.00 0.43
Glycerol 1.05 0.09 6.44
Acetate 21.9 6.5 18.0
Hexoses 149 160 242
Pentoses 100 81 45
Total Soluble Sugars 249 241 287
The HPLC and HPAE-PAD analysis on samples from the enzymatic saccharification of the
differently pretreated oat straw are presented in tables 3.2-3.4 in the appendix B. The comparison among the differently pretreated oat straw was made based on the soluble sugar
yields (in mg/g of oat straw) after 72 hours of enzymatic saccharification process, in table 3.5 above. The sugar yields per gram of oat straw were determined by dividing the measured
concentrations of the sugars to the mass of oat straw added to the enzymatic saccharification mixtures. In case of Cambi and Lund steam pretreated oat straw the mass of the material after

28
pretreatment was used; however, in case of lime the mass of the material before pretreatment was used assuming no material was lost between the pretreatment and saccharification steps.
As presented in table 3.5, glucose was the most important sugar because of its relatively
highest yield constituting more than 60% of the total soluble sugar yield, while glucose and xylose together constitute 92-97%. The total soluble sugar yield was 241-287 g/kg of oat
straw, which is in the range of 41-50% of the potential sugar yield that could be hydrolyzed according to the oat straw composition given in table 2.2. The averages of the glucose and
xylose concentrations of the duplicates of enzymatic saccharification experiments are shown in figure 3.1 below. As is evident in the figure 3.1 and the tables 3.2-3.4, the rate of
hydrolysis decreases over time significantly, making the increase in the total reducing sugars yields over the last 48 hours be in the range of only 3 to 12% of the yields of the first 24
hours saccharification.
It is logical to compare these three pretreatment methods based on their yields of hexoses as they were intended for the ethanol production, and also based on the total sum of reducing
sugar yields as they are used for the biogas digestion. Comparing the three pretreatment
methods, Cambi steam pretreatment had the highest yields of hexoses and total reducing
sugars. However, Lund steam pretreatment and lime pretreatment had similar yields, though Lund steam pretreatment had slightly higher hexoses while lime had a little more of pentoses.
With a closer look to the yields of the hydrolyzates (table 3.5), Lund steam pretreated oat straw had the least acetate and glycerol, while Cambi steam pretreated had the highest
glycerol and lime pretreated ones had the highest acetate composition. Therefore, based on the enzymatic saccharification results, the lime pretreatment method seemed to be the least
preferred for ethanol fermentation of oat straw.
Moreover, the xylose to glucose ratio of Cambi steam pretreatment was the lowest; and this
could probably indicate the relatively weakest impact on the hydrolysis of hemi-cellulose in the oat straw. However, this needs to be further confirmed with future studies that involve
another batch of pretreatment experiment, if the current batch might have some error where relatively more solids might have been taken that contain more hexoses and less pentoses.

29
Another observation noted in the saccharification process was the potential relationship between acetate and cellobiose content. Out of each duplicate, the batches with higher acetate
content had higher cellobiose concentrations. This could probably be related to the effect of acetate inhibition on the activity of beta-glucosidase enzymes; however this needs to be
confirmed with more specific experiments to study this relationship.
3.2 Ethanol Fermentation
The ethanol fermentations were done using 1.8 liter Jenny reactors (Belach Bioteknik AB,
Sweden) with automatic control of temperature at 30°C, mixing speed at 200 rpm, and pH at 4.5-4.6, while recording the unregulated oxygen content in the fermentation processes
(figures 3.1-3.7 in Appendix B). Samples were taken from the fermentation broths and analyzed using HPLC and HPAE-PAD to study the changes in concentrations of soluble
sugars, ethanol, acetate and glycerol. In two cases small amounts of ethanol were present already at the beginning of the fermentation, most likely remaining from the ethanol-
sterilization of the fermenters. This was subtracted from the subsequent ethanol yield determinations. The rate of ethanol fermentation and the hexoses-to-ethanol conversion
efficiencies were estimated using these data (tables 3.6-3.11 in Appendix B). The change in concentrations of key components of the fermentation broths are presented below, figures
3.8-3.13. In all cases, glucose was completely consumed, and ethanol had leveled out at its final concentration, within 24 hours.

30

31
3.2.1 Ethanol Yields of the Pretreated Oat Straw
The comparison of pretreatment methods with respect to the measured ethanol yields shows
that the Cambi method gave the highest yield followed by Lund and finally the lime
pretreatment. A summary of the comparison of the ethanol yields and glucose-to-ethanol
conversion efficiencies is presented in table 3.12 below. Table 3.12 Summary of Ethanol Yield and Conversion Efficiencies during Ethanol Fermentation
Consumed Sugars in % of the
Enzymatic Hydrolysis yield
Conversion Efficiencies as g Ethanol produced
per g of consumed sugar or per g of sugar yields
of enzymatic saccharification
Pretreatment
Hexoses Pentoses
Total
sugar
Consumed
Hexoses
Consumed
Total sugars
Hexoses
Yield
Total sugars
Yield
Ethanol
Yield in g
per kg of oat
straw
Lime Pretreated 99.5 9.4 63.9 0.56 0.53 0.51 0.32 85
Lund Steam P 97.2 2.7 65.8 0.73 0.72 0.66 0.45 115
Cambi Steam P 96.8 15.4 84.3 0.63 0.62 0.58 0.49 150
Most of the sugars consumed during the ethanol fermentation were hexoses constituting 94 to 99% of the total sugars consumed, while pentose consumption accounted for about 3% on
average of consumed sugars and only occurred within the first few hours of the ethanol
fermentation.
32
As indicated in the last column of table 3.12, Cambi steam pretreated oat straw had the
highest ethanol yield of 150 gram per kilogram of dry oat straw, while Lund steam pretreatment gave 115 g/kg, and lime pretreatment the lowest yield of 85 g/kg.
The hexose-to-ethanol conversion efficiencies, as ethanol produced per consumed hexoses
out of the yields of the enzymatic saccharification, are higher than the theoretically attainable value of 0.51g ethanol/g hexoses. This effect was the highest for the Lund steam pretreated
oat straw having 43% more ethanol yield than the theoretically possible out of the hexose sugars yield measured at the end of the enzymatic saccharification step. Similarly, the Cambi
steam pretreated oat straw had 24% more ethanol yield, while lime pretreated yielded 10% as the theoretical yield. This higher sugar-to-ethanol conversion efficiency indicates that the
hydrolysis of cellulose in the oat straw has continued during the ethanol fermentation; due to hydrolytic enzymatic action created during ethanol fermentation by the S. cerevisiae, and/or
incomplete inactivation of the Accellerase 1000 enzymes during the boiling of the hydrolyzates after enzymatic saccharification. The additional hydrolysis extends the amount
of hydrolyzed sugar to 43-56% of the available sugars in the oat straw given in table 2.2, making Cambi pretreatment as the highest hexoses and ethanol yielding, and lime
pretreatment as the lowest yielding method.
After a slight initial decline the xylose concentrations remained stable throughout the fermentation. The initial decrease that occurred at the beginning of all of the fermentations
indicates that a small amount of xylose is consumed initially. However, S. cerevisiae do not consume pentose sugars such as xylose to any larger extent (Toivari, 2004) and the xylose
concentrations remained stable when the fermentation progressed. The steady level also indicates that there was no further degradation of xylose-containing hemicellulose, but
mainly additional solubilization of cellulose during the continued hydrolysis that must have occured during the fermentation process.
Similarly, the acetate concentrations in the ethanol fermentation broths (figure 3.14)
remained constant throughout the processes. In all of the duplicates, it was observed that the higher acetate concentrations were accompanied with lower maximum rate of ethanol
production. This effect was more pronounced in the Cambi steam pretreated duplicates where there was the largest difference in acetate concentration between the batches. The higher
acetate concentrations and lower maximum rate of ethanol productions were also accompanied with higher cellobiose concentrations, except in case of Lund steam pretreated
duplicates where the difference in acetate concentration was the smallest. Though acetate in this concentration range has no significant effect on ethanol yield, it deters the growth of
Saccharomyces cerevisiae (Delgenes et al., 1996) that is expected to negatively affect the rate
of ethanol fermentation. However, there was no sufficient data to make conclusive remark
relating acetate concentration to the cellobiose concentrations and the rates of ethanol production, as there are only two data for each pretreatment method.
33
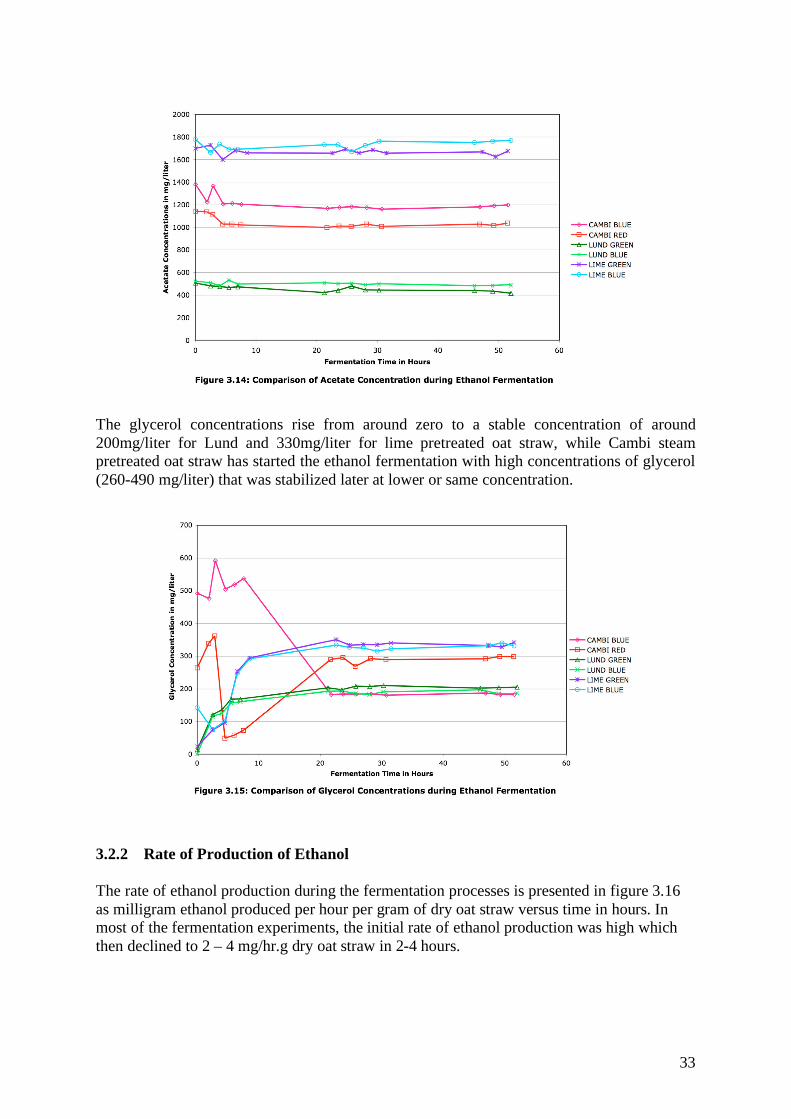
The glycerol concentrations rise from around zero to a stable concentration of around
200mg/liter for Lund and 330mg/liter for lime pretreated oat straw, while Cambi steam pretreated oat straw has started the ethanol fermentation with high concentrations of glycerol
(260-490 mg/liter) that was stabilized later at lower or same concentration.
3.2.2 Rate of Production of Ethanol
The rate of ethanol production during the fermentation processes is presented in figure 3.16
as milligram ethanol produced per hour per gram of dry oat straw versus time in hours. In most of the fermentation experiments, the initial rate of ethanol production was high which
then declined to 2 – 4 mg/hr.g dry oat straw in 2-4 hours.

34
The highest maximum ethanol production rate was observed from Lund steam pretreated oat
straw, in the range of 12.5-13.5mg/hr.g dry oat straw, followed by lime pretreated ones with 9-12 mg/hr.g dry oat straw. Cambi steam pretreated oat straw had the lowest maximum rate
of ethanol production (8.5-10.5 mg/hr.g dry oat straw) but for a longer duration than both Lund steam pretreated and lime pretreated oat straw. These maximum rates of ethanol
production are negatively related with the average acetate concentrations of the pretreatment methods, which could be because of the acetate effect on the yeast growth. However, these
results should be treated with caution since they are based on rather few data points. More frequent sampling would be required for satisfactory statistical significance. In all of the
cases, the ethanol fermentation was practically completed before 22-24 hours of fermentation.
3.3 Biogas Digestion
After evaporation of ethanol from the fermentation residues, at 80°C under reduced pressure, the total solids and ash content of the material was determined for calculation of volatile
solids content (VS%). An amount corresponding to 3 g VS of fermentation residue, and
unfermented pretreated material, respectively, from each pretreatment, was taken for biogas
digestions performed in triplicate.
The methane yield of the anaerobic digestion of a substrate is determined based on two important parameters, the biogas yield and the methane content of the biogas as analyzed by
gas chromatography; while the biogas yield was estimated using digestion temperature, the headthe biogas pressure measured during the sampling of the biogas for gas chromatography
to determine the methane content. The biogas and methane yields were determined at STP - Standard Temperature (0°C) and Pressure (1 atmosphere).

35
3.3.1 Biogas Yield
The biogas yields of the differently pretreated oat straw as well as the inoculum are shown in figure 3.17, as net accumulated biogas volume at standard temperature and pressure (1atm
and 0°C) per gram of volatile solid (VS) versus time in days. It is called net accumulated because the contribution of the inoculum was subtracted from the total biogas yield of the
substrate-inoculum mixture in the digesters. The potential biogas yield of the pretreated oat straw was attained at the point where the net accumulated biogas volume curve levels off
first. As will be explained later, for optimum operation, the time at which the net accumulated biogas volume curve levels off was taken at 23.9 days of digestion. The
exception was the unfermented lime having it at 30.9 days of digestion, probably related to the relatively more substrate added in the digesters and thus the same number of
microorganisms needed more time to digest it. On the other hand, the repeated experiments required 28.1 days of digestion, which could be attributed to the different batch of inoculum
used.
Table 3.13: Summary of Potential Biogas Yields of Differently Pretreated Oat Straw Standard Temperature and Pressure (STP) Biogas Yield in ml/g VS
Unfermented Fermented Additional yield
through fermentation
Lund steam pretreated 421 505 84
Lime pretreated 598 (616 repeat experiment) 539 30
Cambi steam pretreated 456 (414 repeat experiment) 464 8
Inoculum 94 (101 repeat experiment)
The biogas yields from the digestion of the ethanol fermentation residues were higher than their unfermented equivalents for Cambi and Lund steam pretreated oat straw, as presented in
table 3.13. This could be due to the additional digestible organic ingredients and nutrient (Accellerase 1000 enzyme, citrate buffer, glucose and YNB added with the yeast) used
during the enzymatic hydrolysis and ethanol fermentation, and the hydrolytic enzymatic

36
activity during the ethanol production processes. However, the result in case of lime pretreated oat straw was contradictory to this explanation, where the unfermented oat straw
had an exceptionally high biogas yield compared to its fermented equivalent. This could probably be because of extended time elapsed, about three months, before pH adjustment was
made on the unfermented lime pretreated oat straw, while the pH of the fermented one was adjusted in few days.
3.3.2 Methane Content of the Biogas
The biogas from the three fermented oat straws had relatively higher and more similar methane content compared to their unfermented equivalents that showed larger differences
over the first two weeks of digestion. However, near the termination of the experiment, the methane content of the biogas from all the pretreated oat straw and inoculum mixtures has
converged to methane content of 55-60 %.
Among both the ethanol fermentation residues as well as the unfermented pretreated oat
straw substrates, Lund steam pretreated oat straw had higher methane content initially that
was later overtaken by Cambi steam pretreated. This initial higher methane content in biogas
was more pronounced in the unfermented oat straw probably indicating that Lund pretreated oat straw had more easily digestible carbohydrates. However, the comparatively lower
methane at the later stage could probably be because of the sulfur-reducing bacteria (SRB) action that leads to the production of hydrogen sulfide by competing for hydrogen gas with
the methane-producing microbes.
3.3.3 Methane Yield
The methane yields as well as the rate of methane production from the differently pretreated oat straws were analyzed based on the methane yield curves (Figure 3.19), drawn as
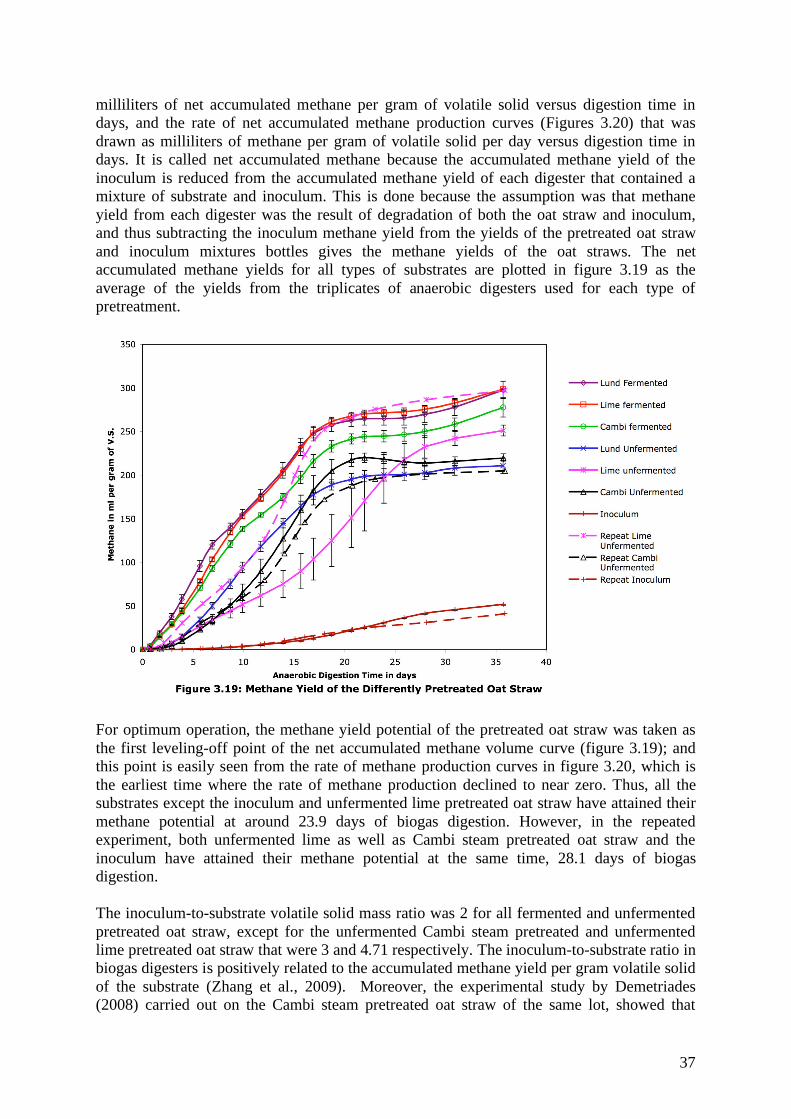
37
milliliters of net accumulated methane per gram of volatile solid versus digestion time in days, and the rate of net accumulated methane production curves (Figures 3.20) that was
drawn as milliliters of methane per gram of volatile solid per day versus digestion time in days. It is called net accumulated methane because the accumulated methane yield of the
inoculum is reduced from the accumulated methane yield of each digester that contained a mixture of substrate and inoculum. This is done because the assumption was that methane
yield from each digester was the result of degradation of both the oat straw and inoculum, and thus subtracting the inoculum methane yield from the yields of the pretreated oat straw
and inoculum mixtures bottles gives the methane yields of the oat straws. The net accumulated methane yields for all types of substrates are plotted in figure 3.19 as the
average of the yields from the triplicates of anaerobic digesters used for each type of pretreatment.
For optimum operation, the methane yield potential of the pretreated oat straw was taken as
the first leveling-off point of the net accumulated methane volume curve (figure 3.19); and this point is easily seen from the rate of methane production curves in figure 3.20, which is
the earliest time where the rate of methane production declined to near zero. Thus, all the
substrates except the inoculum and unfermented lime pretreated oat straw have attained their
methane potential at around 23.9 days of biogas digestion. However, in the repeated experiment, both unfermented lime as well as Cambi steam pretreated oat straw and the
inoculum have attained their methane potential at the same time, 28.1 days of biogas digestion.
The inoculum-to-substrate volatile solid mass ratio was 2 for all fermented and unfermented
pretreated oat straw, except for the unfermented Cambi steam pretreated and unfermented lime pretreated oat straw that were 3 and 4.71 respectively. The inoculum-to-substrate ratio in biogas digesters is positively related to the accumulated methane yield per gram volatile solid
of the substrate (Zhang et al., 2009). Moreover, the experimental study by Demetriades (2008) carried out on the Cambi steam pretreated oat straw of the same lot, showed that

38
increased methane yields and shortened digestion time to attain the optimum yields as a result of increased inoculum-to-substrate ratio from 1 to 2 and then 4. This could probably be
explained as, with every additional inoculum that increased the inoculum-to-substrate ratio, there were additional yield-limiting nutrients that can improve the capacity of the microbes to
digest more of the substrate and so give higher methane yield. Moreover, the exceptionally longer time for optimum methane yield of unfermented lime pretreated oat straw in the first
set of experiment could be related to the higher substrate volatile solid used, which can be explained as relatively less amount of yield-limiting nutrients and microorganisms was
supplied to digest more straw that expectedly require more time.
The potential methane yields of unfermented lime and Cambi steam pretreated oat straw were determined by taking the average of the yields in the repeated experiment and the first
experiment after compensating the effect of lower or higher inoculum-to-substrate ratio to 2. Moreover, these average values were compared with previous experimental values attained
on the same oat straw under the MicroDrivE project in the same departments. As a result, the unfermented Cambi steam pretreated oat straw had nearly identical value as the previously
attained, while unfermented lime pretreated one in this experiment was higher than the previous, which could probably be explained by the three months long extended action of
lime until pH adjustment was made in this study. Thus, the comparison of the fermented and unfermented lime pretreated oat straw was not based on the same pretreatment effect of lime.
The methane yield potentials of the differently pretreated oat straw are summarized in table 3.14 below.
As explained for the biogas yields, the fermented oat straw had relatively higher methane yield per gram of volatile solid, except in the case of the lime pretreated oat straw; and these
higher yields from the fermented ones were attributable to the addition of digestible chemicals and hydrolytic actions on the substrate during the enzymatic saccharification and
ethanol fermentation. These higher methane yields per gram of volatile solid of the fermented oat straws were about 32% more than the yields of their unfermented equivalents. However,
the exceptionally higher yield of unfermented lime oat straw could probably be attributed to the 3 months long extended action of lime on the oat straw that might have degraded lignin
and thus provide higher methane yield, as explained below.
The theoretical methane yield of oat straw can be estimated using Bushwell’s formula shown below (Moller et al., 2004) and the composition of oat straw.
Bushwell’s Formula:
CnHaOb + (n-(a/4)-(b/2)) H20 ((n/2)-(a/8)+(b/4))CO2+((n/2)+(a/8)-(b/4)) CH4
Theoretical methane yield = ((n/2)+(a/8)-(b/4))*22.4/(12*n + a + 16b)
The molecular formulae of cellulose, hemi-cellulose and lignin were taken as C6H10O5, C5H8O4, and C40H48O15 (Philips and Goss, 1936), and thus their theoretical methane yields
were calculated as 415ml/gVS, 424ml/gVS, and 649ml/gVS respectively using Bushwell’s formula. Then using the composition information in table 2.2 as estimates of the cellulose,
hemi-cellulose and lignin contents, the theoretical methane yield of oat straw was estimated as 421ml/gVS.

39
3.3.4 Rate of Methane Production
The average methane productivities of the differently pretreated oat straw was estimated by
dividing the net cumulative methane yield at the first level off, by the number of days to produce that yield (table 3.14). As a result of the comparison of the average methane yield
and rate of production, lime pretreatment method was the best method for biogas production because of the highest methane yield in both fermented and unfermented group. However, it
is important to note that the highest yield and so productivity from the unfermented lime pretreated oat straw is not based on equal pretreatment time as explained above and thus may
not be comparable.
Figure 3.20 provides additional information about the pretreatment methods as it shows the rate of methane production of each method at different times of biogas digestion. Both the
fermented and the unfermented ones have rate curves with two peaks; and the first peak was larger and wider for the fermented ones, indicating the availability of more easily digestible
components. However, the first peak was relatively smaller or practically non-existent for the unfermented ones and had mainly the second peak showing that the microorganisms required
more time until they get higher rate of digestion of the substrates. This figure also provide the digestion time required for optimum methane production, which is the time for the rate of
methane production became low enough to stop the digestion, or the time for the methane yield curve to start leveling-off first.
Among the fermented oat straw, Lund steam pretreated oat straw had initially the highest rate
of methane production; however, it has declined faster resulting in the narrowest first peak in the rate curve, probably because of sulfur-reducing bacteria (SRB) that compete with the methanogens by producing hydrogen sulfide, thus reducing the production of methane. On
the other hand, Cambi steam pretreated oat straw had the lowest first and second peak, showing the lowest rate of methane production among the fermented; and this could probably

40
be because the Cambi pretreated oat straw has utilized the most part of the substrate for the highest ethanol yield it has given.
Similarly, among the unfermented ones, the Lund steam pretreated oat straw had practically
no first peak, while the second peak appeared faster than the others showing the availability of more easily fermentable compounds; however, the peak was relatively shorter and broader
probably because of the SRB. The repeated experiments of the unfermented lime and Cambi steam pretreatment showed similar curve profile of rate of methane production, but with
higher rate for the Cambi steam pretreated throughout the biogas digestion process.
Table 3.14: Summary of the Potential Methane Yield and Rate of Methane Production of Differently Pretreated Oat Straw
Main Substrate
Potential Methane
yield in ml/g VS
Standard Deviationof the maximum
methane yield inml/g VS
Average Rateof Methane
production inml/gVS.day
Rank
Fermented Lund steam pretreated 265 7.5 11.1 2nd
Fermented Lime pretreated 271 4.3 11.3 1st
Fermented Cambi steam pretreated 245 6.6 10.3 3rd
Unfermented Lund steam pretreated 197 7.0 8.4 2nd
Unfermented Lime pretreated
–First experiment adjusted for inoculum-to-substrate ratio of two
275 8.1 8.9
- Repeat Experiment 287 8.2 10.2
- Average Unfermented Lime 281 9.6 1st
- Majid Haddad (2009) 256
Unfermented Cambi steam pretreated - First experiment adjusted for
inoculum-to-sustrate ratio of two
172 5.0 9.1
- Repeat Experiment 201 2.4 7.2
- Average Unfermented Cambi St 186 8.2 3rd
- Demetriades (2008) 185
Inoculum-first 46 1.0 1.5
-Repeat experiment 31.2 1.27 1.1
- Average Inoculum 39 1.3 N.B. The methane yield of the unfermented lime and Cambi steam pretreated oat straw was for inoculum-to-
substrate ratio different from 2, and thus the yield values were normalized to an Inoculum/Substrate ratio of 2.
3.4 Summary of Energy Yields Based on Mass Flow Study
The comparison of the two process routes, direct biogas against integrated ethanol and biogas production, for the three pretreatment methods is summarized in table 3.15. This summary
required a careful mass flow analysis taking into account how much raw oat straw that was added at the beginning of the experiments and its TS, VS and ash contents, as well as the
addition of other substances and their contributions to TS and VS in subsequent steps of the process. Key assumptions and how calculations were done are explained below:

41
Pretreatment
The dry matter (TS) content of the raw oat straw was measured at 94.6 %. After lime
pretreatment all material was quantitatively recovered and thus we know the amount of raw oat straw and dry matter that was utilized in the subsequent enzymatic saccharification step.
However, for the steam explosion pretreatments it was necessary to estimate how much raw oat straw that the pretreated material corresponded to. To do that, the measured VS% of the
material after pretreatment was divided by the measured VS% of the raw oat straw.
For lime pretreatment all added chemicals were weighed and thus the mass was known. For Lund pretreatment it was calculated based on the concentration of sulfuric acid and water
content. No chemicals were added in the Cambi pretreatment. The amounts of water in the pretreated materials were determined as the product of the measured total mass and TS (in %)
of the pretreated materials.
Enzymatic Saccharification
Compounds added to each batch were accounted for and distributed into VS and ash content
as follows: • 50 ml of 1 M sodium citrate buffer, pH 4.5, is assumed to remain in the solids as
sodium citrate salt upon drying in the TS measurements, with a total mass of 11.1 g contributing to the total solids (TS). Upon VS measurements all citrate ions will be
combusted as citric acid and thus contribute 9.6 g organic matter to VS, while the sodium will remain in the ash in the form of NaOH and contribute 2.73 g to the ash
content. • 12.36% of the volume of Accelerase 1000 enzyme solution was taken as VS.
• An additional 10% of the mass of solubilized hexoses and 12% of the mass of pentoses were added to VS (and TS), since water molecules are taken up when the
cellulose and hemicellulose polysaccharides are hydrolyzed.
Ethanol Fermentation
As described in the materials and methods section, 50 ml yeast preculture solution was added
to the fermentation. Initially this preculture solution contained 1g of glucose and 0.335g of YNB. The glucose is most likely consumed during the pre-cultivation, but at the same time
substantial amount of yeast biomass is being formed and the total amount of organic matter that is added in the fermentation should be accounted for, since it can contribute to the
formation of biogas in the anaerobic digestion of the fermentation residues. For simplicity,
and since the actual VS content was not measured of the yeast preculture, the initial 1 g
glucose considered to contribute to the VS as well as the TS; while the 0.335g YNB was accounted for TS, but not VS.
Moreover, as elaborated in section 3.3, the measured ethanol yield was higher than the
theoretically expected from the yields at enzymatic saccharification, which in effect indicate hydrolysis of more hexoses; thus additional water converted to VS was accounted as the sum
of 19.6% of the ethanol yield and 10% of the yield of pentoses. On the other hand, there is
loss of VS that is related to the CO2 formed during ethanol fermentation, and this was
accounted as 96% of the ethanol yield, based on the stoichiometry of the process.
Evaporation
In order to simulate the removal of ethanol after fermentation by distillation in an industrial
process, the fermentation beer was heated in a Rotavapor at 80°C for 45 min at reduced pressure. The residues after evaporation were recovered and samples were taken for TS and

42
VS measurements as well as HPLC analysis of ethanol, acetate, glycerol, glucose and xylose. The HPLC analysis revealed that substantial amounts of ethanol were still present in the
material after evaporation. This ethanol can also contribute to biogas formation in the anaerobic digestion and must be accounted for. In order to estimate the total amount of
organic material that was added to the biogas digestion, and how much of that came from the oat straw and how much was externally added, the following assumptions were made:
The first assumption was that the volatile components were completely evaporated during the
TS measurements, i.e. when the sample was dried in oven with forced ventilation at 105°C for 24 hours; and these included ethanol (78°C), water (100°C), acetate (118°C) and glycerol
(290°C). Thus, the three organic substances were assumed not to be detected as TS and VS, but are supplied to the microorganisms in the biogas digestion step.
Another important assumption made was that the absolute ash content, i.e. as mass in gram,
at the end of enzymatic saccharification was the same as the ones at the end of ethanol fermentation. This assumption was reasonable since no or only negligible amounts of acid
and/or base was added for pH control during the fermentation, as can be seen in the process parameter charts (fig 3.2-3.7 in Appendix). This is probably because the pH of enzymatic
saccharification (pH 4.5) and ethanol fermentation (pH 4.5-4.6) was the same
These two assumptions were validated by comparing directly the VS and TS values calculated based on these assumptions against the measured ones, and by looking at the
relative ratios of the calculated and measured VS and TS provided in table 3.15 as (CVS/MVS)/(CTS/MTS). Thus, the maximum error committed in estimating the TS and VS
with these assumptions was17% when the measured and calculated values are compared separately. Moreover, the practical implication of (CVS/MVS)/(CTS/MTS) was that the
calculated VS values were relatively more than the calculated TS values by 6-9%, when compared to the measured VS and TS values; and this deviation was compensated in the
methane yield calculation presented in table 3.15 and table 3.16
Biogas Digestion In order to estimate the methane yields of the oat straw of the ethanol fermentation residues,
steps of adjustment calculations were carried out as presented in the table 3.15.
The first step of adjustment was related to the assumption explained above in the evaporation section, the measured VS during the set up of biogas digestion was less than the actually fed
VS to the digesters, as the three volatile components (ethanol, acetate, glycerol) were not detected as TS and VS. Thus, the measured methane yield per gram of measured VS needed
adjustment to methane yield per gram of actual VS fed to the digesters, by multiplying the
first with the ratio of measurable VS, i.e., total VS at the end of ethanol evaporation less the
volatile organic liquid, to the total VS at the end of ethanol evaporation. As a result of this first adjustment, the average methane yield per gram of total organic material fed to the
digester.
The second step was to quantify the remaining total organic material of the oat straw after the ethanol fermentation and evaporation, and fed to the digester. Deducting the sum of external
VS that were added to the system during pretreatment, enzymatic saccharification and ethanol fermentation, the remaining total organic material fed to the digester were estimated.

43
The third step was to estimate the total methane yield from the fermentation residues that was done by multiplying the adjusted methane yield per gram of actual VS fed to the digester,
with the remaining total organic materials of oat straw at the end of the ethanol evaporation that can be fed to the digester.
The fourth step was to correct the error related to the VS accounting assumptions by dividing
the total methae yield with the (CVS/MVS)/(CTS/MTS) ratio values, to reverse all possible over estimations of the VS values that were made during the calculation.
Remaining Solids
The VS of the remaining solids after biogas digestion was estimated using the measured methane content and methane yield, assuming the biogas was composed of CH4 and CO2
only; the TS of the remaining solid was calculated by adding the 6.7% ash content of the raw oat straw on the calculated VS.
Total Energy Yields
The energy yield from ethanol of the oat straw was calculated by multiplying the ethanol yield in gram with the lower heating value of ethanol, 26.95 MJ/kg. Similarly, the energy
yield from methane was calculated by multiplying the methane yield in gram with the lower heating value of methane, 50.05 MJ/kg. Thus, the total energy yield of the oat straw was
estimated as the sum of these two energy yields. However, there were three alternative scenarios analyzed to compare the total energy yield from the oat straw:
• Scenario 1: The ethanol yield of the oat straw was partially evaporated, and the remaining residue was fed to the biogas digester with exclusion of the yield from the
externally added VS. • Scenario 2: The ethanol yield of the oat straw was fully evaporated and the remaining
residue was fed to the biogas digester with exclusion of the yield from the externally added VS.
• Scenario 3: The ethanol yield of the oat straw was fully evaporated and the remaining residue was fed to the biogas digester with the yields from the externally added VS
included in the total energy yield.
In the first two scenarios, lime pretreatment gave the highest total energy yield from the oat straw, and this was under the direct biogas digestion process route. The superior energy
yield from lime pretreatment could be related to the degradation of lignin by lime that lead to
higher methane yield, which could not made available for biogas digestion of the steam
pretreated oat straw. For lime pretreated oat straw, even though the direct biogas was favored in the first two scenarios, the integrated production was preferred in the third scenario.
Both the Cambi and Lund steam pretreatment methods have provided similar total energy
yields in all of the scenarios, though Lund steam pretreatment have shown slightly higher yields in most of the cases. However, Cambi steam pretreatment had higher ethanol energy
than Lund steam pretreated as well as the lime pretreatment, which could be important from
the business decision point of view. For both type of steam pretreatment methods, the
integrated production of ethanol and biogas was favored over the direct biogas digestion under all the scenarios as the integrated production provides more total energy. This could
probably be because the enzymatic saccharification and/or ethanol fermentation hydrolyzes the oat straw, making the remaining organic material easily accessible for the
microorganisms in the biogas digesters. In a way, the first step of biogas digestion, hydrolysis, was performed during the enzymatic saccharification and/or ethanol fermentation.

44
Moreover, the complete separation of ethanol from the fermentation broth resulted in higher total energy, as could be seen from the comparison of the total yields in scenario 1 and 2.
Therefore, the integrated ethanol and biogas production using the steam pretreatment methods provided 14 to 21% more total energy yield than the direct biogas digestion from the
same amount of oat straw, as in under scenario 2.
Table 3.15 Summary of the Mass Balance and Energy Yields
Lime
Ferm.
Lund
Steam
Ferm.
Cambi
Steam
Ferm.
Lime
Steam
Unferm.
Lund
Steam
Unferm
Cambi
Steam
Unferm
PRETREATMENT
Dry Oat Straw, g 80.03 74.73 74.04 80.03 74.73 74.04
Treatment Chemical, g 8.46 0.49 0.00 8.46 0.49 0.00
Additional Non-Volatile Solid, g 4.07 -0.02 1.62 4.17 0.00 1.59
Water, g 897.4 244.8 416.0 897.4 244.8 416.0
Total Mass of Pretreated Material, g 990.0 320.0 490.0 990.0 320.0 490.0
Total Solids, % 9.35 23.50 15.44 9.35 23.50 15.44
Organic (Volatile Solids), % 7.56 21.7 14.04 7.56 21.7 14.04
ENZYMATIC SACCHARIFICATION
1M Citrate Buffer of pH4.5, ml (g) 52 50 50
Citric Acid, g 1.997 1.92 1.92
Sodium citrate, g 12.23 11.76 11.76
Accellerase 1000 Enz.(TS=12.36%), ml 20 19 19
Accellerase 1000 Enz. as solid, g 2.47 2.35 2.35
Hexoses Yield, Dry Straw, g 11.96 11.98 17.92
Pentoses Yield, mg/g Dry Oat straw 7.99 6.07 3.32
Amount of total solubilized sugar in grams 19.94 18.05 21.24
ETHANOL FERMENTATION
Yeast Preculture Solution (YPS) , g(ml) 53.00 50.00 51.00
Glucose equivalent with the YPS, g 1.06 1 1.02
Yeast Nitrogen Base With YPS, g 0.355 0.335 0.342
Hydrolysis Water to VS on remaining sugar, g 0.819 0.747 0.395
Ethanol Yield of oat straw, g 6.78 8.61 11.11
CO2 released during Fermentation, g 6.51 8.26 10.66
Glycerol amount at the end of Fer., g 0.35 0.19 0.23
Acetate amount at the end of Fer., g 1.79 0.46 1.08
Total Organic Materials (TOM) end of Ferm. , g 80.38 73.15 69.78
Total Organic Materials and Solids, end Ferm.,g 103.6 83.71 81.44
Total Mass End of Ethanol Fermentation, g(ml) 1123 1042 1040
Total Organic Materials (TOM) end of Ferm., % 7.15 7.02 6.71
Total Organic Materials and Solids, end Ferm,% 9.22 8.04 7.83
EVAPORATION
Measured Volatile Solids, % 5.92 5.18 4.85
Measured Total Solids,% 8.39 6.47 6.45
Volatile Organic Liquid undetected as TS, g 8.92 9.26 12.42
VS if VOL are not detected as TS, % 6.33 6.07 5.45
TS if VOS are not detected as TS, % 8.42 7.15 6.63
Lost total mass with evaporation, ratio 0.15 0.17 0.26
Lost liquid mass with evaporation, ratio 0.17 0.18 0.28

45
Measured Ethanol Concentration after evap., g/l 2.835 3.940 4.102
Ethanol if liquid didn't evaporate, g/l 2.36 3.22 2.94
Measured Ethanol Concn. End of Eth. Ferm., g/l 6.81 8.67 11.20
Evaporated Ethanol Yield, g 4.43 5.41 8.19
(CVS/MVS)/(CTS/MTS) 1.06 1.06 1.09
BIOGAS DIGESTION
External (non-oat straw) VS, g 13.87 13.28 13.31
External VS out of total, ratio 0.183 0.198 0.218
Measured CH4 yield, ml/gVSM 271 265 245 281 197 187
Adjusted CH4 Yield for Volatile Organic
Liquids, ml/gVSC
256
251
230
281
197
187
Scenario 1- Partial Ethanol Evaporation with Exclusion of Methane Yield from the External VS
Total CH4 Yield of Oat Straw, litre at STP 15.89 14.00 11.75 20.91 13.68 12.85
Total CH4 Yield in grams 11.38 10.03 8.41 14.97 9.79 9.20
Energy from CH4 Yield, kJ 570 502 421 749 490 460
Energy from Ethanol Yield, kJ 119 146 221 0 0 0
Energy from CH4 and Ethanol Yield, kJ 689 648 642 749 490 460
Energy yield per gram oat straw, kJ/g 8.61 8.67 8.67 9.36 6.56 6.22
Energy Yield Ratio Fermented/Unfermented 0.92 1.32 1.39
Scenario 2- Complete Ethanol Evaporation with Exclusion of Methane Yield from External VS
Total CH4 Yield of oat straw, liter at STP 14.8 12.7 10.0 20.91 13.68 12.85
Total CH4 Yield in grams 10.62 9.11 7.18 14.97 9.79 9.20
Energy from CH4 Yield, kJ 531 456 359 749 490 460
Energy from Ethanol Yield, kJ 183 232 299 0 0 0
Energy from CH4 and Ethanol Yield, kJ 714 688 659 749 490 460
Energy yield per gram oat straw, kJ/g 8.92 9.21 8.90 9.36 6.56 6.22
Energy Yield Ratio of Fermented./Unfermented 0.95 1.40 1.43
Scenario 3-Complete Ethanol Evaporation without Exclusion of Methane Yield from External VS
Total CH4 Yield of Oat Straw, liter NTP 18.2 15.9 12.8 20.9 13.7 12.8
Total CH4 Yield in grams 13.0 11.4 9.2 15.0 9.8 9.2
Energy from CH4 Yield, kJ 650.9 568.6 459.7 749.4 490.2 460.4
Energy from Ethanol Yield, kJ 182.7 232.0 299.3 0.0 0.0 0.0
Energy from CH4 and Ethanol Yield, kJ 833.5 800.6 759.0 749.4 490.2 460.4
Energy yield per gram oat straw, kJ/g 10.4 10.7 10.3 9.4 6.6 6.2
Energy Yield Ratio of Fermented/Unfermented 1.1 1.6 1.6
Remaining Solid for Scenario 1
Cumulative CH4 content of biogas, ratio 0.5 0.5 0.5 0.4 0.4 0.4
CO2 Produced with CH4 in Liter 18.7 15.7 13.3 27.2 18.1 17.0
CO2 produced with CH4, g 36.8 30.9 26.1 53.3 35.6 33.4
Remaining VS from the oat straw, g 17.4 15.6 15.8 6.0 24.0 26.2
Remaining VS from dry oat straw, % VS 0.2 0.2 0.2 0.1 0.3 0.4
Remaining Solid for Scenario 2
Cumulative CH4 content of biogas, 1 0.5 0.5 0.5 0.4 0.4 0.4
CO2 Produced with CH4 in Liter 17.5 14.3 11.3 27.2 18.1 17.0
CO2 produced with CH4, g 34.4 28.1 22.3 53.3 35.6 33.4
Remaining VS from the oat straw, g 18.3 17.9 20.2 6.0 24.0 26.2
Remaining VS from oat straw, % VS 0.2 0.3 0.3 0.1 0.3 0.4
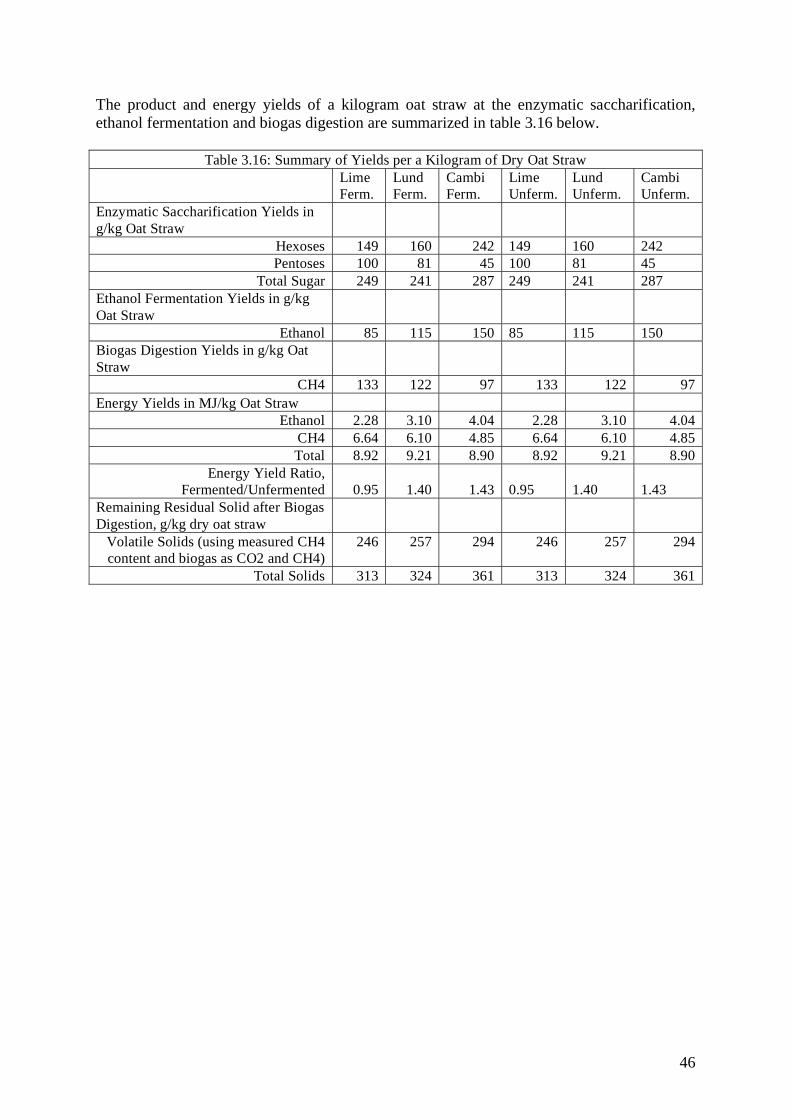
46
The product and energy yields of a kilogram oat straw at the enzymatic saccharification, ethanol fermentation and biogas digestion are summarized in table 3.16 below.
Table 3.16: Summary of Yields per a Kilogram of Dry Oat Straw
Lime
Ferm. Lund
Ferm. Cambi
Ferm. Lime
Unferm. Lund
Unferm. Cambi
Unferm.
Enzymatic Saccharification Yields in
g/kg Oat Straw
Hexoses 149 160 242 149 160 242
Pentoses 100 81 45 100 81 45
Total Sugar 249 241 287 249 241 287
Ethanol Fermentation Yields in g/kg
Oat Straw
Ethanol 85 115 150 85 115 150
Biogas Digestion Yields in g/kg Oat
Straw
CH4 133 122 97 133 122 97
Energy Yields in MJ/kg Oat Straw
Ethanol 2.28 3.10 4.04 2.28 3.10 4.04
CH4 6.64 6.10 4.85 6.64 6.10 4.85
Total 8.92 9.21 8.90 8.92 9.21 8.90
Energy Yield Ratio,
Fermented/Unfermented
0.95
1.40
1.43
0.95
1.40
1.43
Remaining Residual Solid after Biogas
Digestion, g/kg dry oat straw
Volatile Solids (using measured CH4
content and biogas as CO2 and CH4) 246 257 294 246 257 294
Total Solids 313 324 361 313 324 361
47
3. CONCLUSIONS
Based on the comparison of the energy yields through the three pretreatment methods and two process routes, the lime pretreatment method has provided the highest energy yield; and
this was attained through direct biogas production. This could probably be because the lime degrades and utilizes lignin for biogas digestion, more efficiently than the steam pretreatment
methods. In spite of the highest total yield, the lime pretreatment method used in this experiment had the lowest ethanol yield; and thus it is the least preferred method for ethanol
production.
Both steam pretreatment methods had very similar total energy yield through the integrated production of ethanol and biogas; and the integrated production had 40 to 43% higher energy
yield than the direct biogas route for both steam pretreatment methods from the same oat straw. This increased energy yield in the integrated production process may increase up to
63-65%, if the digestible chemicals added during the enzymatic saccharification and ethanol fermentation are accounted and transferred to the biogas production; and this would be the
case in practice at least partially, unless the hydrolytic enzymes and ethanol fermentation yeasts are fully recycled.
Even though Lund steam pretreatment had slightly higher total energy yield than Cambi
steam pretreatment in most of the scenarios, the Cambi steam pretreatment method had higher ethanol energy yield, which could be important for business decision.
Separation of ethanol from the fermentation broth needs to be complete in order to attain the
maximum total energy yield from the integrated production system, for all the pretreatment methods.
Though this analysis was carried out taking the energy yield as the basis of comparison, it has
indicated the benefit of integrated production of bioethanol and biogas over the production of single product, biogas that could be cited as an example for the advantage of the applying the
biorefiney concept.

48
5. FUTURE STUDIES
As the interest in the area of bioenergy is already intensified there are many issues to be studied toward improving the costs of production and sustainability, including development
of methods for raw material selection, pretreatment methods optimization, and design of decision making tools toward sustainable production and consumption.
One area that was becoming more interesting was the biogas technology development,
including dry biogas digestion, through mathematical modeling and utilizing experiments at different scale.
The other issue that was aimed at the outset of this thesis was to compare the different
scenarios, involving different pretreatment methods and process routes, based on the net energy gain they provide over their overall life cycle stages. This will serve as the basis for
economic, environmental and social assessment of the scenarios.
This study has shown opposite effects of pretreatment on bioethanol and biogas yield, and this is related to the inhibitory effects generated in the pretreatment stage. Therefore, one
immediate area for investigation is the types and extents of inhibitory effects in these pretreatment processes, as they have significant effects on the production of the biofuels,
especially on ethanol.

49
REFERENCES
1. Bauer, A., Bösch, P., Friedl, A., Amon, T., 2009, Analysis of Methane Potentials of Steam-Exploded Wheat Straw and Estimation of Energy Yields of Combined Ethanol
and Methane Production, Journal of Biotechnology 142, 50-55. 2. Bezzo, F., Piccolo C., 2009, A Techno-Economic Comparison between Two
Technologies for Bioethanol Production from Lignocellulose. Biomass and Bioenergy 33, 478-491.
3. Burton, C., Turner, C., 2003, Manure Management: Treatment Strategies for Sustainable Agriculture, Silsoe Research Institute.
4. Chen, T.-H., Hashimoto, A.G., 1996, Effects of pH and Substrate : Inoculum Ratio on Batch Methane Fermentation. Bioresource Technology 56, 179-186.
5. Cloete, T.E., Malherbe, S., 2002, Review: Lignocellulose Biodegradation: Fundamentals and Applications. Reviews in Environmental Sciences and
Biotechnology 1, 105-114. 6. da Costa Sousa, L., Chundawat, S. PS, Balan, V., Dale, B.E., 2009, “Cradel-to-Grave”
Assessment of Existing Lignocellulose Pretreatment Technology. Current Opinion in Biotechnology 20, 339-347.
7. Delgenes, J. P., Moletta, R., Navarro, J.M., 1996, Effects of Lignocellulose Degradation Products on Ethanol Fermentation of Glucose and Xylose by Saccharomyces
cerevisiea, Zymomonas mobilis, Pichia stipitis, and Candida shehatae. Enzyme and Microbial Technology 19, 220-225
8. Demirel, B., and Scherer, P., 2008, The Roles of Acetotrophic and Hydrogenotrophic Methanogens during Anaeobic Conversion of Biomass to Methane: a Review.
9. Denier van der Gon, H.A., Van Bodegom, P.M., Wassmann, R., Lantin, R.S., Metra-Corton, T.M., 2001, Sulfate-Containing Amendement to Reduce Methane Emissions
from Rice Fields: Mechanisms, Effectiveness and Costs, Mitigation and Adaptation Strategies for Global Change 6, 71-89.
10. Dewil, R., Appels, L., Baeyens, J., Degreve, J., 2008, Principles and Potentials of the Anaerobic Digestion of Waste-Activated Sludge. Progress in Energy and Combustion
Scienc 34, 755-781. 11. Eggeman, T., Elander, R.T., 2005, Process and Economic Analysis of Pretreatment
Technologies. Bioresource Technology 96, 2019-2025 12. El-Abyad, M.S., Al-Diwany, A.I., El-Refai, A.H., Sallam, L.A., Allam, R.F., 1992,
Effect of Some Fermentation Parameters on Ethanol Production from Beet Molasses by
Saccharomyces cerevisiae Y-7, Bioresource Technology 42, 191-195.
13. Gerardi, M.H., 2003, The Microbiology of Anaerobic Digesters, John Wiley and Sons,
New Jersey
14. Ghaly, E., Ergudenler, A., Al Toweel, a.M., 1993, Determination of the Kinetic Parameters of Oat Straw using Thermogravimetric Analysis, Biomass and Bioenergy,
457-465. 15. Ghose, T.K., Singh, A., and Mukhopadhyay, S.N., 1979, Increased Methane Production
in Biogas, Biotechnology Letters, Volume 1, Number 7, 275-280. 16. Gregg, D.J., Boussaid, A, Saddler, J.N., 1998, Techno-Economic Evaluation of A
generic Wood-to-Ethanol Process: Effect of Increased Cellulose Yields and Enzyme
Recycle, Bioresource Technology 63, 7-12.
17. Hamdi, M., Bouallagui, H., Cheikh, R.B., Marouani M., 2003, Mesophilic Biogas
Production from Fruit and Vegetable Waste in a Tubular Digester, Bioresouce
Technology 86, 85-89.

50
18. Hendriks, A.T.W.M., Zeeman, G., 2008, Review: Pretretments to Enhance the Digestibility of Lignocellulosic Biomass. Bioresource Technology 100, 10-18.
19. Hills, D.J., Roberts, D.W., 1981, Anaerobic Digestion of Dairy Manure and Field Crop Residue, Agricultural Wastes 3, 179-189.
20. Jesper Svedberg, 2008, Thermochemical Pretreatment and Enzymatic Saccharification of Lignocellulose for Biofuel Production, Master Thesis, Molecular Biology
Department, Swedish University of Agricultural Sciences. 21. Krivan, Vlastimil, 2006, The Ideal Free Distribution and Bacterial Growth on Two
Substrate, Theoretical Population Biology 69, 22. Kootstra, A.M.J., Beeftink, H.H., Scott, E.L., Sanders, 2009 J.P.M.Comparison of
Dilute Mineral and Organic Acid Pretreatment for Enzymatic Hydrolysis of Wheat Straw. Biochemical Engineering Journal 46, 126-131Palonen, H., 2004, The Role of
Lignin in Enzymatic Hydrolysis of Lignocellulose, Doctoral Dissertation, Helsinki University of Technology, Finland.
23. Ladisch, M., Mosier, N., Wyman, C., Dale, B., Elander, R., Lee, Y.Y., Holtzapple, M., 2005, Features of Promising Technologies for Pretreatment of Lignocellulosic Biomass.
Bioresource Technology 96, 673-686. 24. Liu, C., Wyman, C.E., 2005, Partial Flow of Compressed-Hot Water through Corn
Stover to Enhance Hemicellulose Sugar Recovery and Enzymatic Digestibility of Cellulose. Bioresource Technology 96, 1978-1985.
25. Lynd, L.R., Laser, M., Schulman D., Allen, S.G., Lichwa, J., Antal Jr., M.J., 2002, A comparison of Liquid Hot Water and Steam Pretreatments of Sugar Cane Bagasse for
Bioconversion to Ethanol. Bioresource Technology 81, 33-44. 26. Fel! Kontakt har inte definierats. Momeni, 2009, Biogas and Bioethanol Production
from Cellulosic Biomasses, Master Thesis, Molecular Biology Department, Swedish University of Agricultural Sciences.
27. Moller, H.B., Sommer, S.G., Ahring, B.K., Methane Productivity of Manure, Straw, and Solid Fraction of Manure, Biomass and Bioenergy 26, 485-495.
28. Montero B., Garcia-Morales J.L., Sales, D., Solera, R., 2008, Evolution of Microorganisms in Thermophilic-Dry Anaerobic Digestion, Bioresource Technology
99, 3233-3243. 29. Oude Elferink, S.J.W.H., Visser, A., Hulshoff Pol, L.W., Stares A.J.M., 1994, Sulfate
Reduction in Methanogenic Bioreactors, FEMS Microbiology Reviews 15, 119-136. 30. Pauline Demetriades, 2008, Thermal Pre-treatment of Cellulose Rich Biomass for
Biogas Production, Master Thesis, Department of Microbiology, Swedish University of
Agricultural Sciences.
31. Pons, M.-N., Rajab, A., Engasser, J.-M., 1986, Influence of Acetate on Growth Kinetics
and Production Control of Saccharomyces cerevisiea on Glucose and Ethanol. Applied
Microbiology and Biotechnology 24, 193-198 32. Ramos, L.P., Emmel, A., Mathias, A.L., Wypych, F., 2003, Fractionation of Eucalyptus
grandis Chips by Dilute Acid-Catalyzed Steam Explosion. Bioresource Technology 86, 105-115.
33. Siren, H., Rovio, S., Simolin, H., Koljonen, K., 2008, Determination of Monosaccharide Composition in Plant Fiber Materials by Capillary Zone
Electrophoresis, Journal of Chromatography 1185, pp 139-144.
34. Taherzadeh, M.J., Karimi, K., 2008, Pretreatment of Lignocellulosic Waste to Improve
Ethanol and Biogas Production: A Review. International Journal of Molecular Sciences
9, 1621-1651.
51
35. Tomas-Pejo, E., Oliva, J.M., Ballesteros, M., 2008, Realistic Approach for Full-Scale Bioethanol Production from Lignocellulose: A Review, Journal of Scientific and
Industrial Research, Vol. 67, 874-884. 36. Viola, E., Zimbardi, F., Cardinale, M., Cardinale, G., Braccio, G., Gambacorota, E.,
2008, Processing Cereal Straws by Steam Explosion in a Pilot Plant to Enhance Digestibility in Ruminants, Bioresource Technology 99, 681-689.
37. Wang, L.K., Hung Y.-T., Shammas, N.K., 2007, Handbook of Environmental Engineering, Volume 6: Biosolids Treatment Processes, The Humana Press Inc.,
Totowa, NJ 38. Wynam, C.E., Dale, B.E., Elander, R.T., Holtzapple, M., Ladisch, M.R., Lee, Y.Y.,
2005, Coordinated Development of Leading Biomass Pretreatment Technologies. Bioresource Technology 96, 1959-1966.
39. Zhang, R., Lui, G., El-Mashad, H.M., Dong, R., 2009, Effect of Feed to Inoculum Ratios on Biogas Yields of Food and Green Wastes. Bioresource Technology, 100,
5103-5108. 40. Zhang, P.Y.-H., Berson, E., Sarkanen, S., Dale, B.E., 2009, Pretreatment and Biomass
Recalcitrance: Fundamentals and Progress. Applied Biochemical Technology 153, 80-83.
41. Zhao, Yulin, Wang, Y., Zhu, J.Y., Ragauskas, A., Deng, Y., 2007, Enhanced Enzymatic Hydrolysis by Alkaline Pretraetment at Low Temperature. Biotechnology and
Bioengineering, Vol. 99, No. 6, 1320-1329.

52
ACKNOWLEDGEMENTS
There are many people that I would like to thank for their support while I was doing this project. My supervisors, Associate Prof. Jerry Ståhlberg and Associate Prof. Mats Sandgren,
are the first to thank for their guidance and every support that has enabled me accomplish this project with this quality. I would also like to thank Ass. Prof. Anna Schnurer for her support
in the gas chromatography analysis of the biogas, and advices with the biogas digestion experiment. Similarly, I would like to express my thanks to Ass. Prof. Volkmar Passoth and
Eberhard Thomas for their guidance with the ethanol fermentation experiment. Henrik Hansson’s guidance with the HPAE-PAD was very valuable. Johanna Blomqvist and
Borjesson Elisabet were also helpful with HPLC at the Genetic Center. The ethanol evaporation procedure provided by Anna Eriksson was useful for the project.
Majid Haddad deserves special thanks for sharing his first hand experience through
participation and guidance with the experiments. Similarly, I would like to thank Stefan Trobro for his advices and encouragement on the mass flow study.
Finally, I would like to express my parents, brothers and sisters, and my wife’s family for
their love to my family. I am indebted to the love and care that I could not provide to my sons, Amanuel Debebe and Noah Debebe, and my wife Semenesh Nigatu, while I was away
from home to do this project and pursue the M.Sc. in Sustainable Technology.

53
APPENDICES
Appendix – A: Enzymatic Saccharification
Table 3.2: Analyses Results of Enzymatic Saccharification of Cambi Steam Pretreated Oat Straw
Measured Concentration using HPAE_PAD mg/liter Measured using HPLC mg/Liter
Batch Time in
Hours Glucose Xylose Arabinose Galactose Mannose Cellobiose Ethanol Glycerol Acetate
Total
mg/liter
Blue 24 17774.1 3259.5 121.4 84.1 66.4 1199.4 0.0 487.8 1343.57 24336.2
48 19682.9 3415.6 138.2 95.8 243.0 1303.7 0.0 478.4 1339.01 26696.6
72 20017.1 3819.0 140.3 95.9 89.0 1339.6 35.3 491.8 1381.19 27409.2
Red 24 14048.2 2155.2 40.1 91.7 83.1 505.7 0.0 244.9 1058.98 18227.8
48 14902.3 2482.6 42.9 93.8 104.3 268.9 0.0 265.2 1127.84 19287.8
72 16459.1 2915.9 48.3 104.9 299.7 238.5 1.2 491.8 1381.19 21940.5
Green 24 14965.6 2524.7 96.3 74.5 69.0 884.6 0.0 514.0 1395.64 20524.4
48 17167.6 3196.2 105.4 81.5 66.9 1038.8 0.0 521.0 1438.4 23615.8
72 17650.1 3539.3 113.1 82.9 85.9 1025.6 65.1 531.8 1468.62 24562.4
Average 24 16232.2 2698.5 91.5 87.3 131.7 898.0 0.0 412.4 1264.5 21816.3
48 16614.7 2979.4 89.9 86.5 79.2 835.7 0.0 424.7 1303.3 22413.3
72 18042.1 3424.7 100.6 94.6 158.2 867.9 33.9 505.1 1410.3 24637.4
Std Dev 24 3023.4 647.9 49.2 11.3 96.6 399.2 0.0 146.2 180.3 4379.7
48 1513.7 431.4 41.5 6.5 21.7 497.4 0.0 139.1 159.2 2730.6
72 1811.1 462.3 47.3 11.1 122.6 567.2 32.0 23.1 50.5 2735.1
Coef. var 24 18.6 24.0 53.8 12.9 73.4 44.5 35.4 14.3 20.1
48 9.1 14.5 46.1 7.5 27.4 59.5 32.8 12.2 12.2
72 10.0 13.5 47.0 11.7 77.5 65.4 94.5 4.6 3.6 11.1
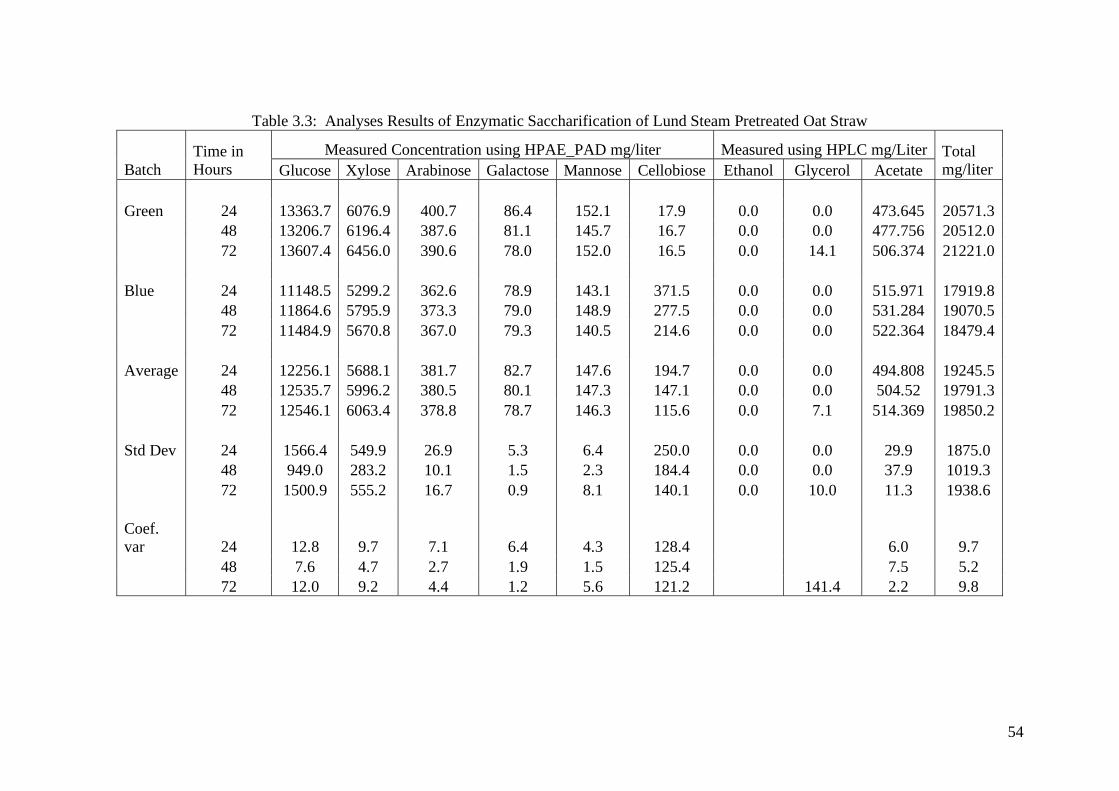
54
Table 3.3: Analyses Results of Enzymatic Saccharification of Lund Steam Pretreated Oat Straw
Measured Concentration using HPAE_PAD mg/liter Measured using HPLC mg/Liter
Batch
Time in Hours Glucose Xylose Arabinose Galactose Mannose Cellobiose Ethanol Glycerol Acetate
Total mg/liter
Green 24 13363.7 6076.9 400.7 86.4 152.1 17.9 0.0 0.0 473.645 20571.3
48 13206.7 6196.4 387.6 81.1 145.7 16.7 0.0 0.0 477.756 20512.0
72 13607.4 6456.0 390.6 78.0 152.0 16.5 0.0 14.1 506.374 21221.0
Blue 24 11148.5 5299.2 362.6 78.9 143.1 371.5 0.0 0.0 515.971 17919.8
48 11864.6 5795.9 373.3 79.0 148.9 277.5 0.0 0.0 531.284 19070.5
72 11484.9 5670.8 367.0 79.3 140.5 214.6 0.0 0.0 522.364 18479.4
Average 24 12256.1 5688.1 381.7 82.7 147.6 194.7 0.0 0.0 494.808 19245.5
48 12535.7 5996.2 380.5 80.1 147.3 147.1 0.0 0.0 504.52 19791.3
72 12546.1 6063.4 378.8 78.7 146.3 115.6 0.0 7.1 514.369 19850.2
Std Dev 24 1566.4 549.9 26.9 5.3 6.4 250.0 0.0 0.0 29.9 1875.0
48 949.0 283.2 10.1 1.5 2.3 184.4 0.0 0.0 37.9 1019.3
72 1500.9 555.2 16.7 0.9 8.1 140.1 0.0 10.0 11.3 1938.6
Coef.
var 24 12.8 9.7 7.1 6.4 4.3 128.4 6.0 9.7
48 7.6 4.7 2.7 1.9 1.5 125.4 7.5 5.2
72 12.0 9.2 4.4 1.2 5.6 121.2 141.4 2.2 9.8

55
Table 3.4: Analyses Results of Enzymatic Saccharification of Lime Pretreated Oat Straw
Measured Concentration using HPAE_PAD mg/liter
Measured using HPLC mg/Liter
Batch Time in Hours Glucose Xylose Arabinose Galactose Mannose Cellobiose Ethanol Glycerol Acetate
Green 24 9688 5047 1318 88 0 0 0 23 1684
48 12068 6730 1552 111 0 0 0 22 1656
72 12454 7000 1574 108 0 0 558 24 1697
Blue 24 9318 4127 1319 91 178 0 0 206 1593
48 10875 5365 1511 92 173 0 0 154 1775
72 11253 5733 1537 101 161 0 331 142 1778
Average 24 9503 4587 1318 90 89 0 0 114 1639
48 11472 6048 1531 101 86 0 0 88 1715
72 11854 6367 1555 104 80 0 445 83 1737
Std Dev 24 262 650 1 2 126 0 0 129 64
48 844 965 29 13 122 0 0 93 84
72 849 896 26 5 114 0 160 84 57
Coef.
var 24 2.8 14.2 0.1 2.4 141.4 #DIV/0! 113.1 3.9
48 7.4 16.0 1.9 13.1 141.4 #DIV/0! 106.5 4.9
72 7.2 14.1 1.7 4.9 141.4 #DIV/0! 36.0 101.0 3.3
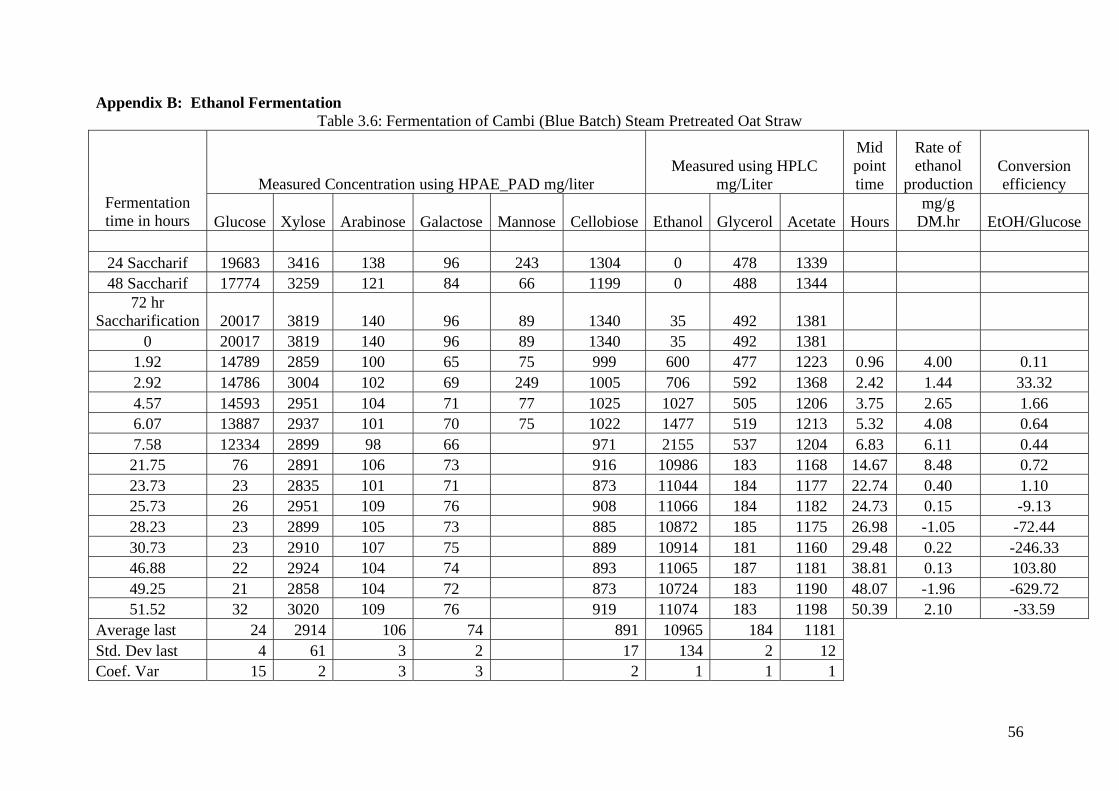
56
Appendix B: Ethanol Fermentation
Table 3.6: Fermentation of Cambi (Blue Batch) Steam Pretreated Oat Straw
Measured Concentration using HPAE_PAD mg/liter Measured using HPLC
mg/Liter
Mid point
time
Rate of ethanol
production Conversion efficiency
Fermentation time in hours Glucose Xylose Arabinose Galactose Mannose Cellobiose Ethanol Glycerol Acetate Hours
mg/g DM.hr EtOH/Glucose
24 Saccharif 19683 3416 138 96 243 1304 0 478 1339
48 Saccharif 17774 3259 121 84 66 1199 0 488 1344
72 hr Saccharification 20017 3819 140 96 89 1340 35 492 1381
0 20017 3819 140 96 89 1340 35 492 1381
1.92 14789 2859 100 65 75 999 600 477 1223 0.96 4.00 0.11
2.92 14786 3004 102 69 249 1005 706 592 1368 2.42 1.44 33.32
4.57 14593 2951 104 71 77 1025 1027 505 1206 3.75 2.65 1.66
6.07 13887 2937 101 70 75 1022 1477 519 1213 5.32 4.08 0.64
7.58 12334 2899 98 66 971 2155 537 1204 6.83 6.11 0.44
21.75 76 2891 106 73 916 10986 183 1168 14.67 8.48 0.72
23.73 23 2835 101 71 873 11044 184 1177 22.74 0.40 1.10
25.73 26 2951 109 76 908 11066 184 1182 24.73 0.15 -9.13
28.23 23 2899 105 73 885 10872 185 1175 26.98 -1.05 -72.44
30.73 23 2910 107 75 889 10914 181 1160 29.48 0.22 -246.33
46.88 22 2924 104 74 893 11065 187 1181 38.81 0.13 103.80
49.25 21 2858 104 72 873 10724 183 1190 48.07 -1.96 -629.72
51.52 32 3020 109 76 919 11074 183 1198 50.39 2.10 -33.59
Average last 24 2914 106 74 891 10965 184 1181
Std. Dev last 4 61 3 2 17 134 2 12
Coef. Var 15 2 3 3 2 1 1 1
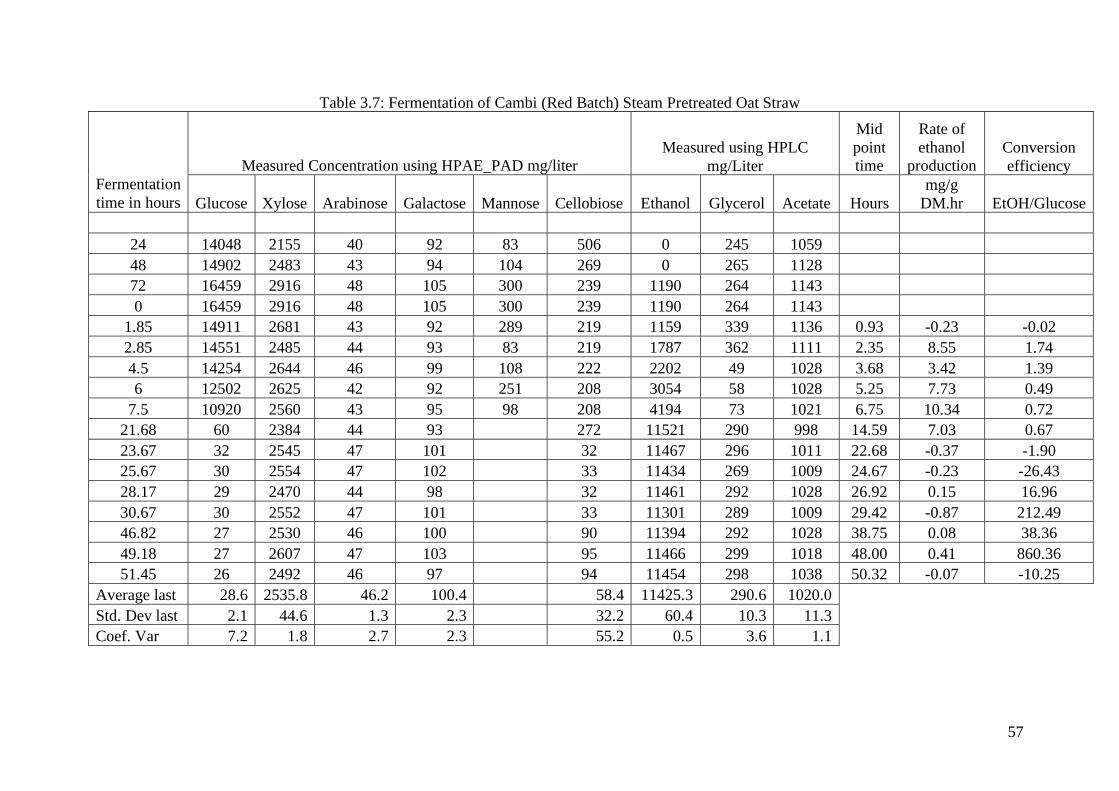
57
Table 3.7: Fermentation of Cambi (Red Batch) Steam Pretreated Oat Straw
Measured Concentration using HPAE_PAD mg/liter Measured using HPLC
mg/Liter
Mid
point time
Rate of
ethanol production
Conversion
efficiency
Fermentation
time in hours Glucose Xylose Arabinose Galactose Mannose Cellobiose Ethanol Glycerol Acetate Hours
mg/g
DM.hr EtOH/Glucose
24 14048 2155 40 92 83 506 0 245 1059
48 14902 2483 43 94 104 269 0 265 1128
72 16459 2916 48 105 300 239 1190 264 1143
0 16459 2916 48 105 300 239 1190 264 1143
1.85 14911 2681 43 92 289 219 1159 339 1136 0.93 -0.23 -0.02
2.85 14551 2485 44 93 83 219 1787 362 1111 2.35 8.55 1.74
4.5 14254 2644 46 99 108 222 2202 49 1028 3.68 3.42 1.39
6 12502 2625 42 92 251 208 3054 58 1028 5.25 7.73 0.49
7.5 10920 2560 43 95 98 208 4194 73 1021 6.75 10.34 0.72
21.68 60 2384 44 93 272 11521 290 998 14.59 7.03 0.67
23.67 32 2545 47 101 32 11467 296 1011 22.68 -0.37 -1.90
25.67 30 2554 47 102 33 11434 269 1009 24.67 -0.23 -26.43
28.17 29 2470 44 98 32 11461 292 1028 26.92 0.15 16.96
30.67 30 2552 47 101 33 11301 289 1009 29.42 -0.87 212.49
46.82 27 2530 46 100 90 11394 292 1028 38.75 0.08 38.36
49.18 27 2607 47 103 95 11466 299 1018 48.00 0.41 860.36
51.45 26 2492 46 97 94 11454 298 1038 50.32 -0.07 -10.25
Average last 28.6 2535.8 46.2 100.4 58.4 11425.3 290.6 1020.0
Std. Dev last 2.1 44.6 1.3 2.3 32.2 60.4 10.3 11.3
Coef. Var 7.2 1.8 2.7 2.3 55.2 0.5 3.6 1.1

58
Table 3.8: Fermentation of Lund (Green Batch) Steam Pretreated Oat Straw
Measured Concentration using HPAE_PAD mg/liter
Measured using HPLC
mg/Liter
Mid
point time
Rate of
ethanol production
Conversion
efficiency
Fermentation
time in hours Glucose Xylose Arabinose Galactose Mannose Cellobiose Ethanol Glycerol Acetate Hours
mg/g DM.hr EtOH/Glucose
Saccha 24 13364 6077 401 86 152 18 0 0 474
Saccha 48 13207 6196 388 81 146 17 0 0 478
Sacchar 72 13607 6456 391 78 152 17 0 14 506
0 13607 6456 391 78 152 17 0 14 506
2.5 12268 6157 374 75 141 1610 121 482 1.25 8.59 1.20
4 11219 6033 369 75 134 2074 136 476 3.25 4.12 0.44
5.5 10344 6603 404 83 136 3024 169 468 4.75 8.45 1.09
7 6647 6046 367 72 107 4530 169 472 6.25 13.39 0.41
21.25 65 6732 414 81 8443 203 422 14.13 3.66 0.59
23.5 60 7205 451 95 8593 197 443 22.38 0.89 34.04
25.75 41 5650 349 69 8590 208 478 24.63 -0.02 -0.16
28 65 5955 380 77 261 8644 207 445 26.88 0.32 -2.30
30.25 41 5705 356 70 250 8703 210 444 29.13 0.35 2.51
46 34 5777 369 73 253 8505 202 441 38.13 -0.17 -30.85
49 31 5623 360 73 246 8603 204 434 47.50 0.44 31.70
52 32 5756 369 73 251 8511 205 416 50.50 -0.41 123.07
Average last 41 5744 364 72 #DIV/0! 252 8593 206 443
Std. Dev last 12.4 118.7 11.1 3.1 #DIV/0! 5.5 76.7 2.9 20.5
Coef. Var 30.4 2.1 3.1 4.2 2.2 0.9 1.4 4.6

59
Table 3.9: Fermentation of Lund (Blue Batch) Steam Pretreated Oat Straw
Measured Concentration using HPAE_PAD mg/liter
Measured using HPLC mg/Liter
Mid point
time
Rate of ethanol
production
Conversion efficiency
Fermentation time in hours Glucose Xylose Arabinose Galactose Mannose Cellobiose Ethanol Glycerol Acetate Hours
mg/g
DM.hr EtOH/Glucose
Sacchar. 24 11148 5299 363 79 143 372 0 0 516
Sacchar. 48 11865 5796 373 79 149 278 0 0 531
Sacchar. 72 11485 5671 367 79 141 215 0 0 522
0 11485 5671 367 79 141 215 0 0 522
2.5 10409 5428 339 70 131 205 2107 116 510 1.25 11.24 1.96
4 9136 5105 320 66 118 194 2402 125 482 3.25 2.62 0.23
5.5 8445 5653 353 74 123 207 3665 157 533 4.75 11.23 1.83
7 5585 5373 337 70 97 199 5054 161 497 6.25 12.34 0.49
21.25 45 5309 338 72 204 8653 192 509 14.13 3.37 0.65
23.5 37 4902 313 66 188 8678 193 503 22.38 0.15 3.14
25.75 42 5439 347 73 208 8870 185 506 24.63 1.14 -39.66
28 39 5318 339 72 204 8698 183 493 26.88 -1.01 -52.58
30.25 39 5532 351 75 212 8837 190 501 29.13 0.82 1656.49
46 36 5610 358 76 215 8696 197 483 38.13 -0.12 -57.93
49 31 5147 327 68 197 8734 185 485 47.50 0.17 7.32
52 34 5563 353 74 213 8683 186 491 50.50 -0.23 15.65
Average last 37 5435 346 73 #DIV/0! 208 8753 188 493
Std. Dev last 3.8 174.9 11.1 2.6 #DIV/0! 6.6 80.1 5.1 8.8
Coef. Var 10.3 3.2 3.2 3.6 3.2 0.9 2.7 1.8

60
Table 3.10: Fermentation of Lime (Green Batch) Pretreated Oat Straw
Measured Concentration using HPAE_PAD mg/liter
Measured using HPLC
mg/Liter
Mid
point time
Rate of
ethanol production
Conversion
efficiency
Fermentation
time in hours Glucose Xylose Arabinose Galactose Mannose Cellobiose Ethanol Glycerol Acetate Hours
mg/g DM.hr EtOH/Glucose
Sacchar. 24 9688 5047 1318 88 0 0 0 23 1684
Sacchar. 48 12068 6730 1552 111 0 0 0 22 1656
Sacchar. 72 12454 7000 1574 108 0 0 558 24 1697
0 12454 7000 1574 108 0 0 558 24 1697
2.5 12171 7079 1611 88 0 0 1098 74 1729
4.5 10129 6494 1496 0 0 0 1677 96 1600 3.50 3.86 0.28
6.5 7867 6318 1414 0 0 0 2789 253 1679 5.50 7.41 0.49
8.5 4613 6587 1508 64 142 0 4695 295 1660 7.50 12.71 0.59
22.58 0 5735 1319 51 0 0 7293 351 1657 15.54 2.46 0.56
24.75 0 6807 1560 62 0 0 7250 333 1691 23.67 -0.26
27 21 5955 1378 62 0 0 7189 335 1659 25.88 -0.37
29.25 0 4936 1134 0 0 0 7198 335 1685 28.13 0.06
31.5 0 6826 1580 64 0 0 7139 340 1656 30.38 -0.35
47.33 0 5248 1211 0 0 0 7069 332 1668 39.42 -0.06
49.5 0 5559 1274 43 0 0 6866 328 1626 48.42 -1.25
51.5 36 5517 1278 52 0 0 7473 342 1675 50.50 4.05
Average last 9 5674 1309 37 0 0 7156 335 1662
Std. Dev last 15.5 658.7 155.3 29.5 0.0 0.0 197.6 5.1 20.5
Coef. Var 11.6 11.9 80.1 #DIV/0! #DIV/0! 2.8 1.5 1.2
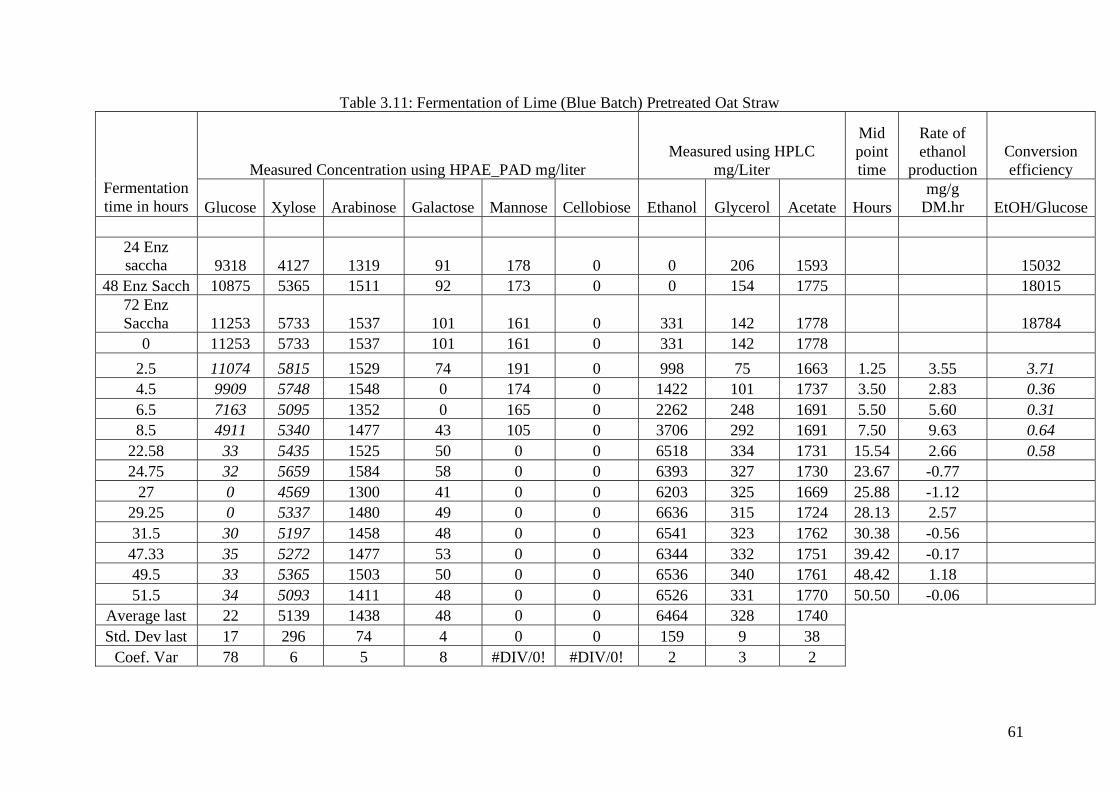
61
Table 3.11: Fermentation of Lime (Blue Batch) Pretreated Oat Straw
Measured Concentration using HPAE_PAD mg/liter
Measured using HPLC
mg/Liter
Mid
point time
Rate of
ethanol production
Conversion
efficiency
Fermentation
time in hours Glucose Xylose Arabinose Galactose Mannose Cellobiose Ethanol Glycerol Acetate Hours
mg/g DM.hr EtOH/Glucose
24 Enz saccha 9318 4127 1319 91 178 0 0 206 1593 15032
48 Enz Sacch 10875 5365 1511 92 173 0 0 154 1775 18015
72 Enz
Saccha 11253 5733 1537 101 161 0 331 142 1778 18784
0 11253 5733 1537 101 161 0 331 142 1778
2.5 11074 5815 1529 74 191 0 998 75 1663 1.25 3.55 3.71
4.5 9909 5748 1548 0 174 0 1422 101 1737 3.50 2.83 0.36
6.5 7163 5095 1352 0 165 0 2262 248 1691 5.50 5.60 0.31
8.5 4911 5340 1477 43 105 0 3706 292 1691 7.50 9.63 0.64
22.58 33 5435 1525 50 0 0 6518 334 1731 15.54 2.66 0.58
24.75 32 5659 1584 58 0 0 6393 327 1730 23.67 -0.77
27 0 4569 1300 41 0 0 6203 325 1669 25.88 -1.12
29.25 0 5337 1480 49 0 0 6636 315 1724 28.13 2.57
31.5 30 5197 1458 48 0 0 6541 323 1762 30.38 -0.56
47.33 35 5272 1477 53 0 0 6344 332 1751 39.42 -0.17
49.5 33 5365 1503 50 0 0 6536 340 1761 48.42 1.18
51.5 34 5093 1411 48 0 0 6526 331 1770 50.50 -0.06
Average last 22 5139 1438 48 0 0 6464 328 1740
Std. Dev last 17 296 74 4 0 0 159 9 38
Coef. Var 78 6 5 8 #DIV/0! #DIV/0! 2 3 2

62
Figure 3.2: Process Parameters during Ethanol Fermentation of Cambi (Blue) Steam Pretreated Oat Straw
Figure 3.3: Process Parameters during Ethanol Fermentation of Cambi (Red) Steam Pretreated Oat Straw

63
Figure 3.4: Process Parameters during Ethanol Fermentation of Lund (Green) Steam Pretreated Oat Straw
Figure 3.5: Process Parameters during Ethanol Fermentation of Lund (Blue) Steam Pretreated Oat Straw
Figure 3.6: Process Parameters during Ethanol Fermentation of Lime (Green) Pretreated Oat Straw

64
Figure 3.7: Process Parameters during Ethanol Fermentation of Lime (Blue) Pretreated Oat Straw