Embed Size (px)
Citation preview
May 2013 Dear Fiscal Officer:
Subject: Price and Population Information
Appropriations Limit The California Revenue and Taxation Code, section 2227, mandates the Department of Finance to transmit an estimate of the percentage change in population to local governments. Each local jurisdiction must use their percentage change in population factor for January 1, 2013, in conjunction with a change in the cost of living, or price factor, to calculate their appropriations limit for fiscal year 2013-14. Attachment A provides the change in California’s per capita personal income and an example for utilizing the price factor and population percentage change factor to calculate the 2013-14 appropriations limit. Attachment B provides city and unincorporated county population percentage change. Attachment C provides population percentage change for counties and their summed incorporated areas. The population percentage change data excludes federal and state institutionalized populations and military populations. Population Percent Change for Special Districts Some special districts must establish an annual appropriations limit. Consult the Revenue and Taxation Code section 2228 for further information regarding the appropriations limit. Article XIII B, section 9(C), of the State Constitution exempts certain special districts from the appropriations limit calculation mandate. The Code and the California Constitution can be accessed at the following website: http://leginfo.legislature.ca.gov/faces/codes.xhtml. Special districts required by law to calculate their appropriations limit must present the calculation as part of their annual audit. Any questions special districts have on this issue should be referred to their respective county for clarification, or to their legal representation, or to the law itself. No state agency reviews the local appropriations limits. Population Certification The population certification program applies only to cities and counties. Revenue and Taxation Code section 11005.6 mandates Finance to automatically certify any population estimate that exceeds the current certified population with the State Controller’s Office. Finance will certify the higher estimate to the State Controller by June 1, 2013. Please Note: Prior year’s city population estimates may be revised. If you have any questions regarding this data, please contact the Demographic Research Unit at (916) 323-4086. ANA J. MATOSANTOS Director By: MICHAEL COHEN Chief Deputy Director Attachment
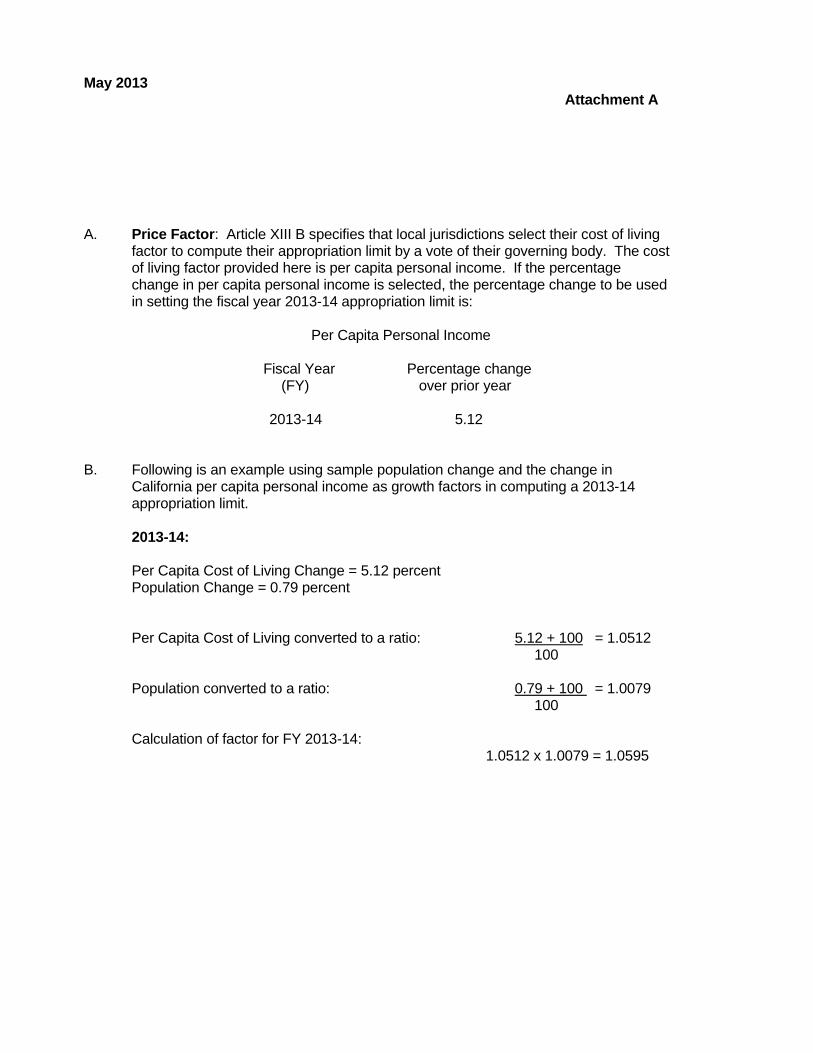
May 2013 Attachment A A. Price Factor: Article XIII B specifies that local jurisdictions select their cost of living
factor to compute their appropriation limit by a vote of their governing body. The cost of living factor provided here is per capita personal income. If the percentage change in per capita personal income is selected, the percentage change to be used in setting the fiscal year 2013-14 appropriation limit is:
Per Capita Personal Income
Fiscal Year Percentage change (FY) over prior year 2013-14 5.12 B. Following is an example using sample population change and the change in
California per capita personal income as growth factors in computing a 2013-14 appropriation limit.
2013-14: Per Capita Cost of Living Change = 5.12 percent Population Change = 0.79 percent Per Capita Cost of Living converted to a ratio: 5.12 + 100 = 1.0512 100 Population converted to a ratio: 0.79 + 100 = 1.0079 100 Calculation of factor for FY 2013-14: 1.0512 x 1.0079 = 1.0595
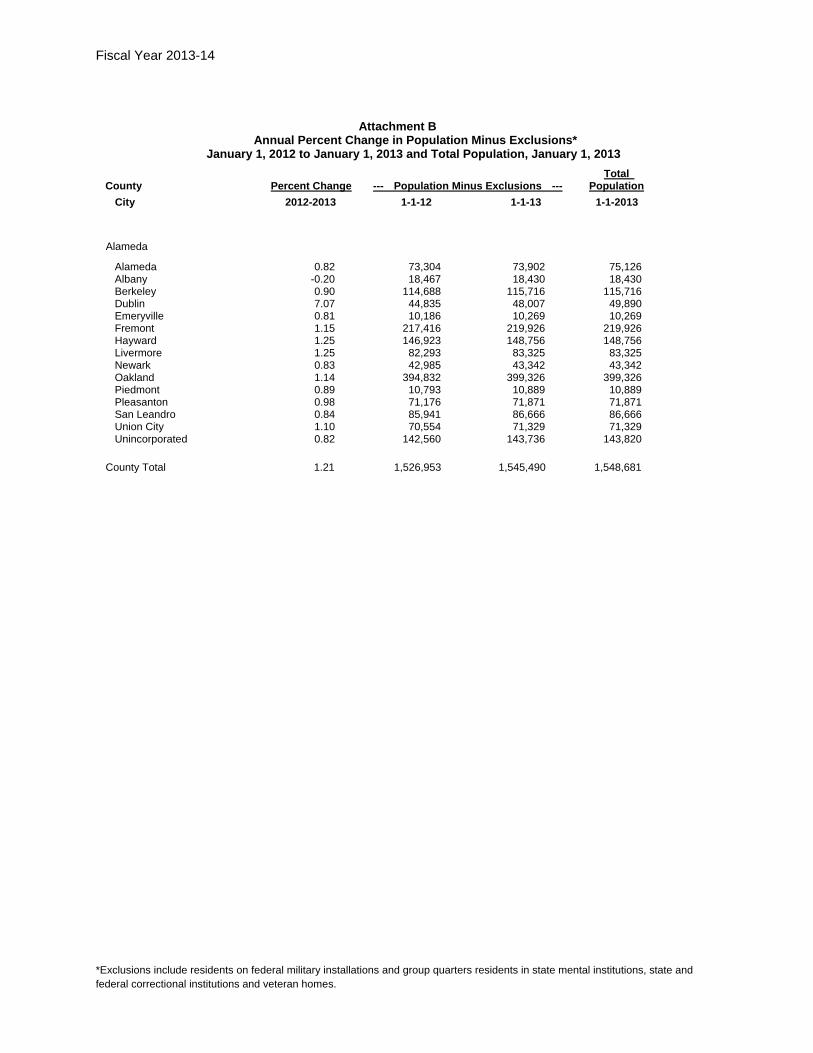
Fiscal Year 2013-14
*Exclusions include residents on federal military installations and group quarters residents in state mental institutions, state and federal correctional institutions and veteran homes.
Attachment B Annual Percent Change in Population Minus Exclusions* January 1, 2012 to January 1, 2013 and Total Population, January 1, 2013 Total County Percent Change --- Population Minus Exclusions --- Population City 2012-2013 1-1-12 1-1-13 1-1-2013
Alameda
Alameda 0.82 73,304 73,902 75,126 Albany -0.20 18,467 18,430 18,430 Berkeley 0.90 114,688 115,716 115,716 Dublin 7.07 44,835 48,007 49,890 Emeryville 0.81 10,186 10,269 10,269 Fremont 1.15 217,416 219,926 219,926 Hayward 1.25 146,923 148,756 148,756 Livermore 1.25 82,293 83,325 83,325 Newark 0.83 42,985 43,342 43,342 Oakland 1.14 394,832 399,326 399,326 Piedmont 0.89 10,793 10,889 10,889 Pleasanton 0.98 71,176 71,871 71,871 San Leandro 0.84 85,941 86,666 86,666 Union City 1.10 70,554 71,329 71,329 Unincorporated 0.82 142,560 143,736 143,820
County Total 1.21 1,526,953 1,545,490 1,548,681
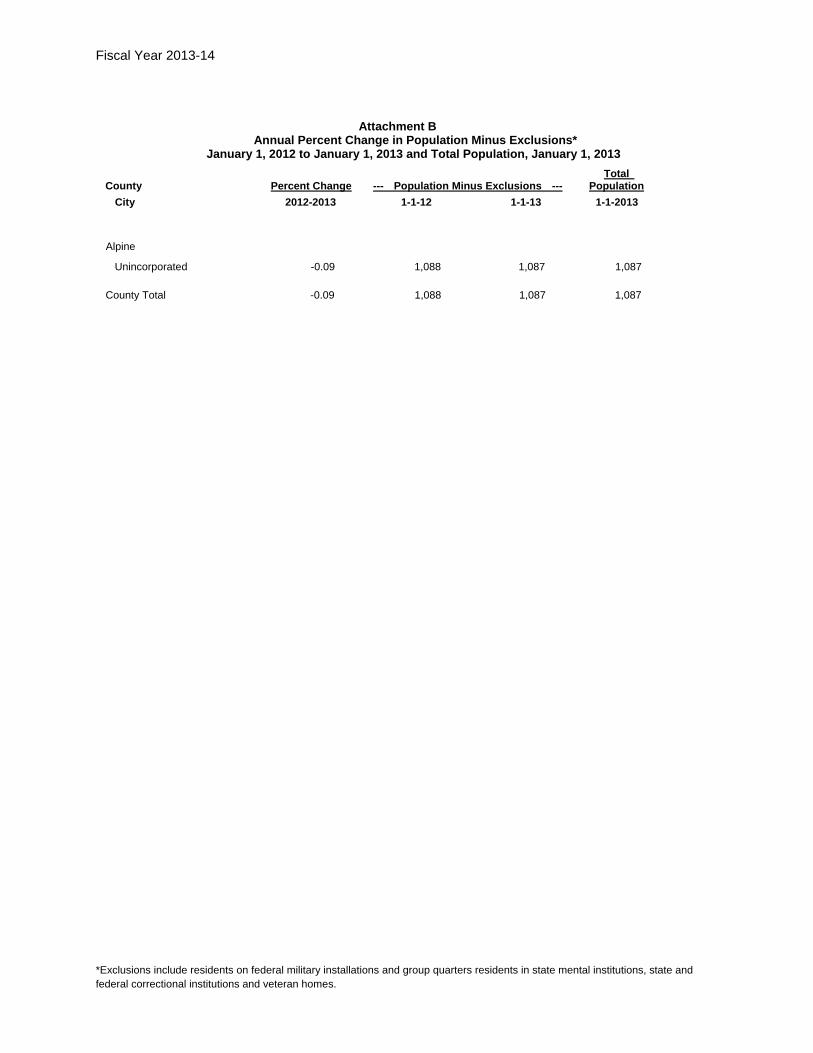
Fiscal Year 2013-14
*Exclusions include residents on federal military installations and group quarters residents in state mental institutions, state and federal correctional institutions and veteran homes.
Attachment B Annual Percent Change in Population Minus Exclusions* January 1, 2012 to January 1, 2013 and Total Population, January 1, 2013 Total County Percent Change --- Population Minus Exclusions --- Population City 2012-2013 1-1-12 1-1-13 1-1-2013
Alpine
Unincorporated -0.09 1,088 1,087 1,087
County Total -0.09 1,088 1,087 1,087

Fiscal Year 2013-14
*Exclusions include residents on federal military installations and group quarters residents in state mental institutions, state and federal correctional institutions and veteran homes.
Attachment B Annual Percent Change in Population Minus Exclusions* January 1, 2012 to January 1, 2013 and Total Population, January 1, 2013 Total County Percent Change --- Population Minus Exclusions --- Population City 2012-2013 1-1-12 1-1-13 1-1-2013
Amador
Amador 0.00 182 182 182 Ione 3.58 3,827 3,964 6,829 Jackson 0.28 4,600 4,613 4,613 Plymouth 0.20 991 993 993 Sutter Creek 0.24 2,478 2,484 2,484 Unincorporated 0.20 21,534 21,577 21,640
County Total 0.60 33,612 33,813 36,741
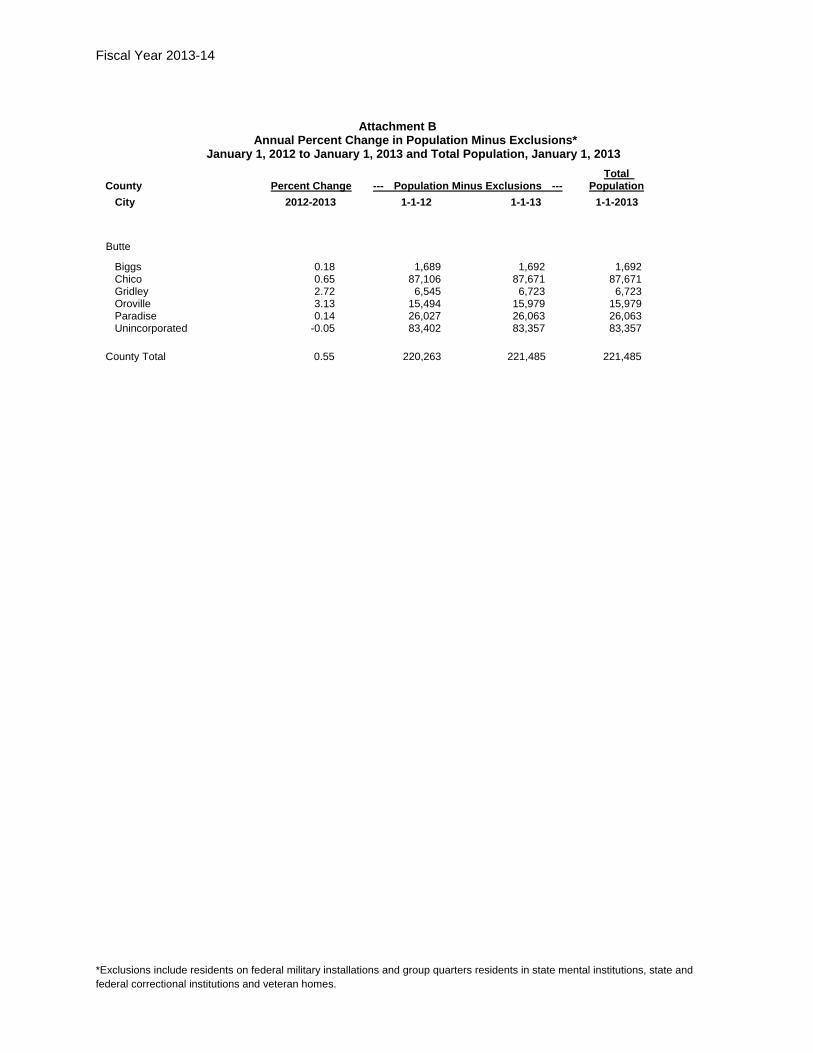
Fiscal Year 2013-14
*Exclusions include residents on federal military installations and group quarters residents in state mental institutions, state and federal correctional institutions and veteran homes.
Attachment B Annual Percent Change in Population Minus Exclusions* January 1, 2012 to January 1, 2013 and Total Population, January 1, 2013 Total County Percent Change --- Population Minus Exclusions --- Population City 2012-2013 1-1-12 1-1-13 1-1-2013
Butte
Biggs 0.18 1,689 1,692 1,692 Chico 0.65 87,106 87,671 87,671 Gridley 2.72 6,545 6,723 6,723 Oroville 3.13 15,494 15,979 15,979 Paradise 0.14 26,027 26,063 26,063 Unincorporated -0.05 83,402 83,357 83,357
County Total 0.55 220,263 221,485 221,485
Fiscal Year 2013-14
*Exclusions include residents on federal military installations and group quarters residents in state mental institutions, state and federal correctional institutions and veteran homes.
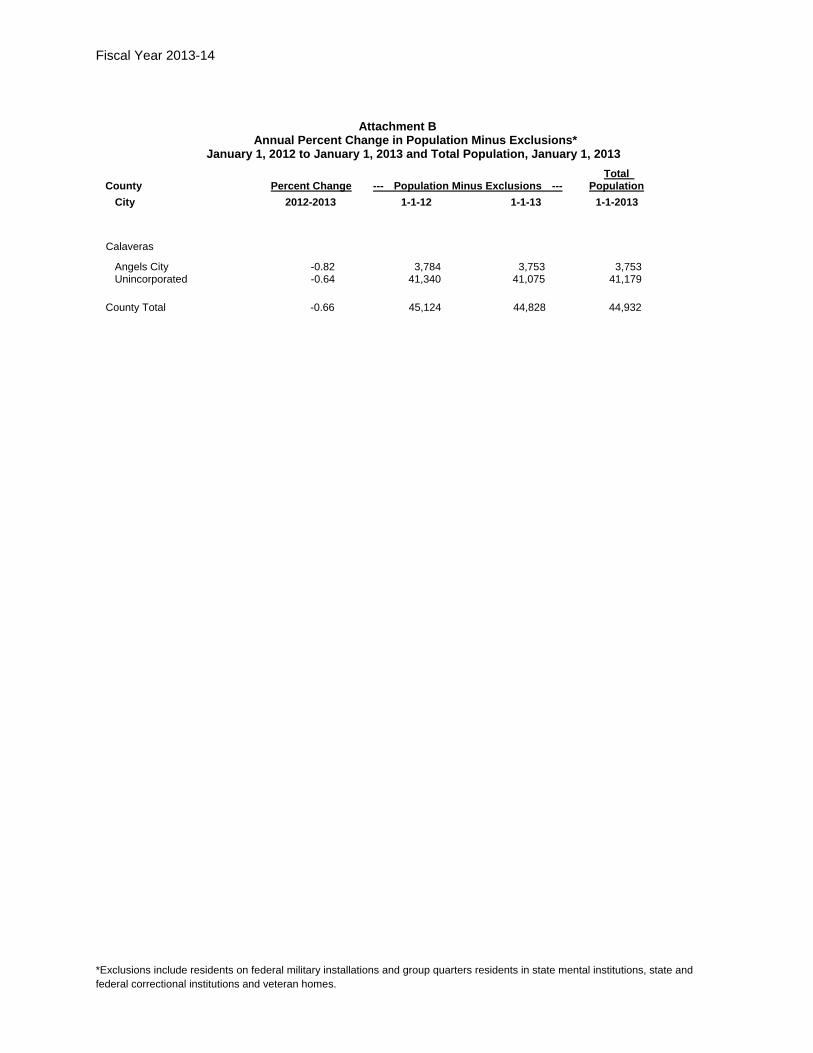
Attachment B Annual Percent Change in Population Minus Exclusions* January 1, 2012 to January 1, 2013 and Total Population, January 1, 2013 Total County Percent Change --- Population Minus Exclusions --- Population City 2012-2013 1-1-12 1-1-13 1-1-2013
Calaveras
Angels City -0.82 3,784 3,753 3,753 Unincorporated -0.64 41,340 41,075 41,179
County Total -0.66 45,124 44,828 44,932

Fiscal Year 2013-14
*Exclusions include residents on federal military installations and group quarters residents in state mental institutions, state and federal correctional institutions and veteran homes.
Attachment B Annual Percent Change in Population Minus Exclusions* January 1, 2012 to January 1, 2013 and Total Population, January 1, 2013 Total County Percent Change --- Population Minus Exclusions --- Population City 2012-2013 1-1-12 1-1-13 1-1-2013
Colusa
Colusa 0.12 6,025 6,032 6,032 Williams 0.73 5,223 5,261 5,261 Unincorporated 0.30 10,350 10,381 10,381
County Total 0.35 21,598 21,674 21,674
Fiscal Year 2013-14
*Exclusions include residents on federal military installations and group quarters residents in state mental institutions, state and federal correctional institutions and veteran homes.
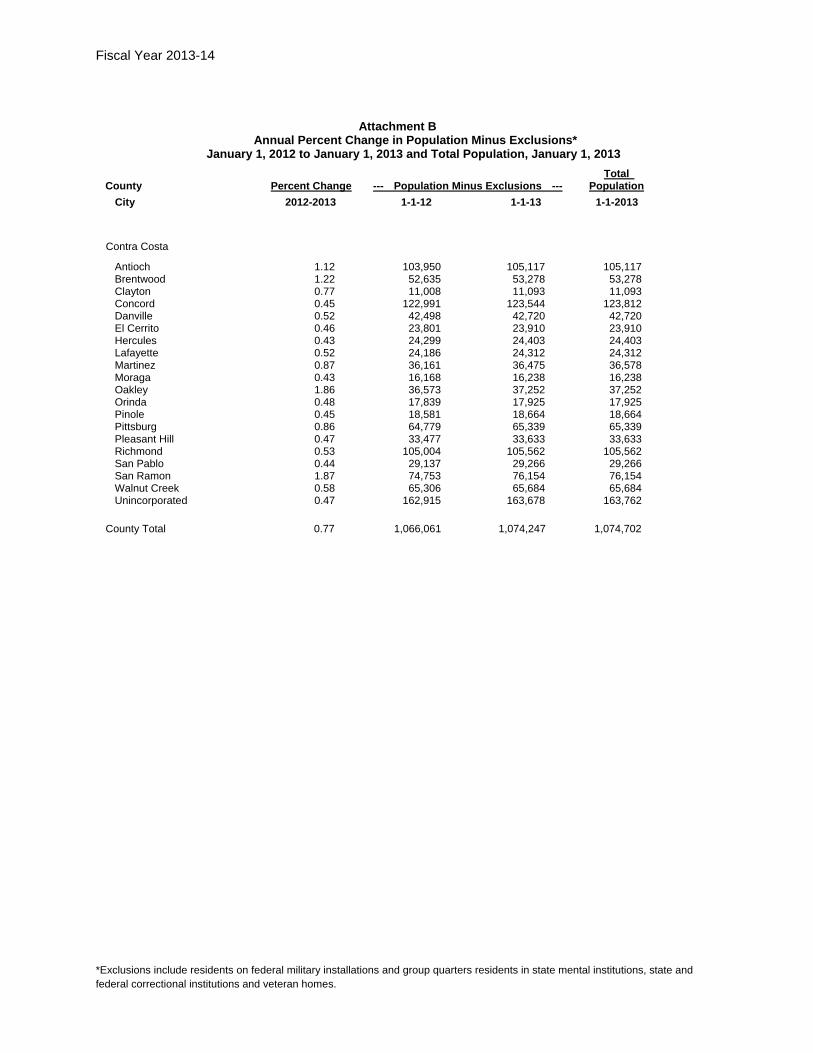
Attachment B Annual Percent Change in Population Minus Exclusions* January 1, 2012 to January 1, 2013 and Total Population, January 1, 2013 Total County Percent Change --- Population Minus Exclusions --- Population City 2012-2013 1-1-12 1-1-13 1-1-2013
Contra Costa
Antioch 1.12 103,950 105,117 105,117 Brentwood 1.22 52,635 53,278 53,278 Clayton 0.77 11,008 11,093 11,093 Concord 0.45 122,991 123,544 123,812 Danville 0.52 42,498 42,720 42,720 El Cerrito 0.46 23,801 23,910 23,910 Hercules 0.43 24,299 24,403 24,403 Lafayette 0.52 24,186 24,312 24,312 Martinez 0.87 36,161 36,475 36,578 Moraga 0.43 16,168 16,238 16,238 Oakley 1.86 36,573 37,252 37,252 Orinda 0.48 17,839 17,925 17,925 Pinole 0.45 18,581 18,664 18,664 Pittsburg 0.86 64,779 65,339 65,339 Pleasant Hill 0.47 33,477 33,633 33,633 Richmond 0.53 105,004 105,562 105,562 San Pablo 0.44 29,137 29,266 29,266 San Ramon 1.87 74,753 76,154 76,154 Walnut Creek 0.58 65,306 65,684 65,684 Unincorporated 0.47 162,915 163,678 163,762
County Total 0.77 1,066,061 1,074,247 1,074,702
Fiscal Year 2013-14
*Exclusions include residents on federal military installations and group quarters residents in state mental institutions, state and federal correctional institutions and veteran homes.
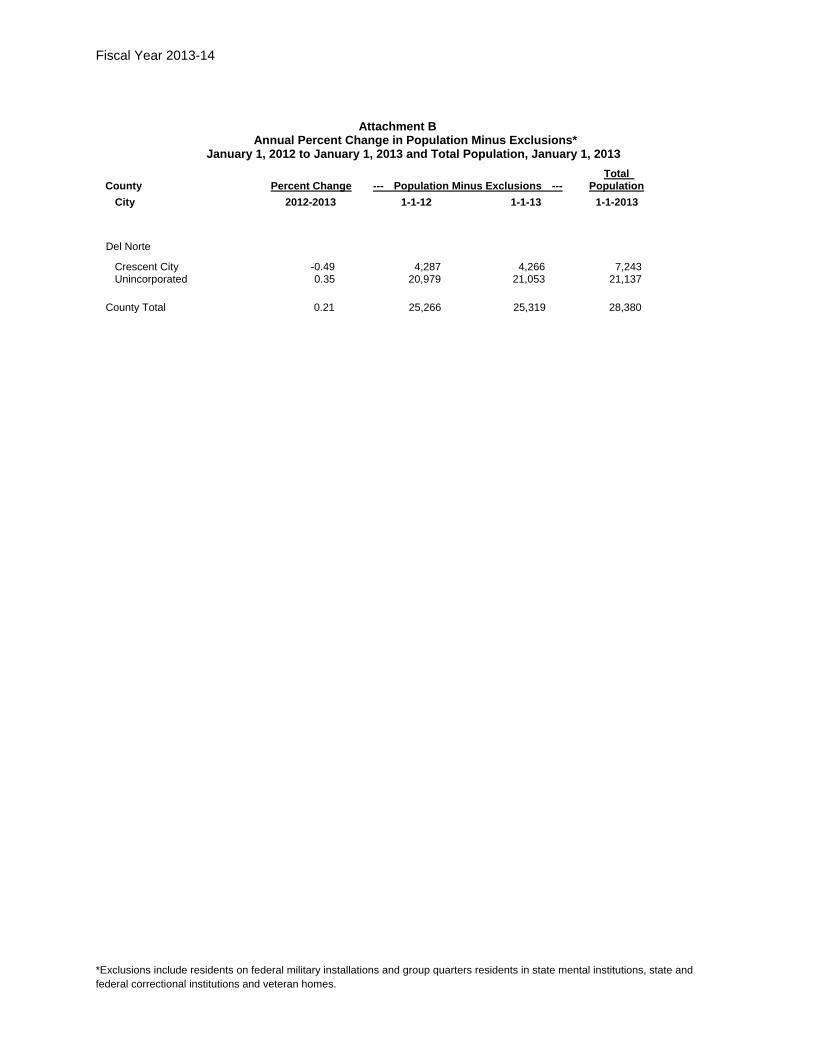
Attachment B Annual Percent Change in Population Minus Exclusions* January 1, 2012 to January 1, 2013 and Total Population, January 1, 2013 Total County Percent Change --- Population Minus Exclusions --- Population City 2012-2013 1-1-12 1-1-13 1-1-2013
Del Norte
Crescent City -0.49 4,287 4,266 7,243 Unincorporated 0.35 20,979 21,053 21,137
County Total 0.21 25,266 25,319 28,380
Fiscal Year 2013-14
*Exclusions include residents on federal military installations and group quarters residents in state mental institutions, state and federal correctional institutions and veteran homes.
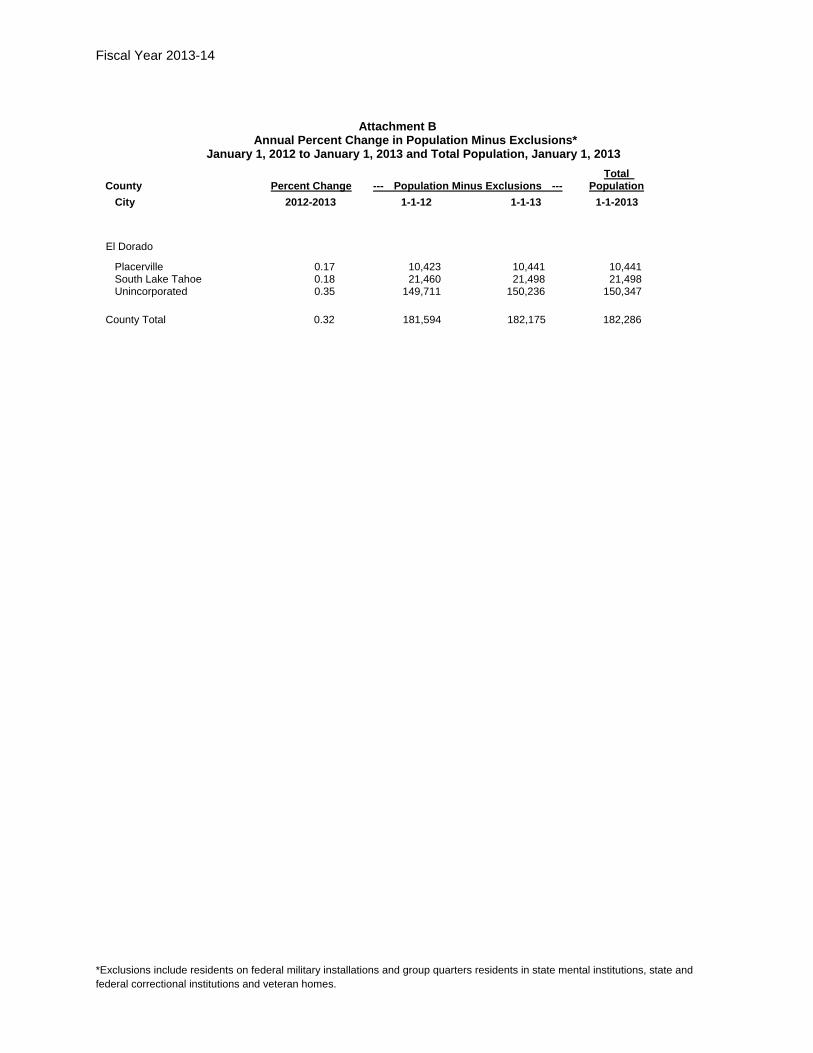
Attachment B Annual Percent Change in Population Minus Exclusions* January 1, 2012 to January 1, 2013 and Total Population, January 1, 2013 Total County Percent Change --- Population Minus Exclusions --- Population City 2012-2013 1-1-12 1-1-13 1-1-2013
El Dorado
Placerville 0.17 10,423 10,441 10,441 South Lake Tahoe 0.18 21,460 21,498 21,498 Unincorporated 0.35 149,711 150,236 150,347
County Total 0.32 181,594 182,175 182,286
Fiscal Year 2013-14
*Exclusions include residents on federal military installations and group quarters residents in state mental institutions, state and federal correctional institutions and veteran homes.
Attachment B Annual Percent Change in Population Minus Exclusions* January 1, 2012 to January 1, 2013 and Total Population, January 1, 2013 Total County Percent Change --- Population Minus Exclusions --- Population City 2012-2013 1-1-12 1-1-13 1-1-2013
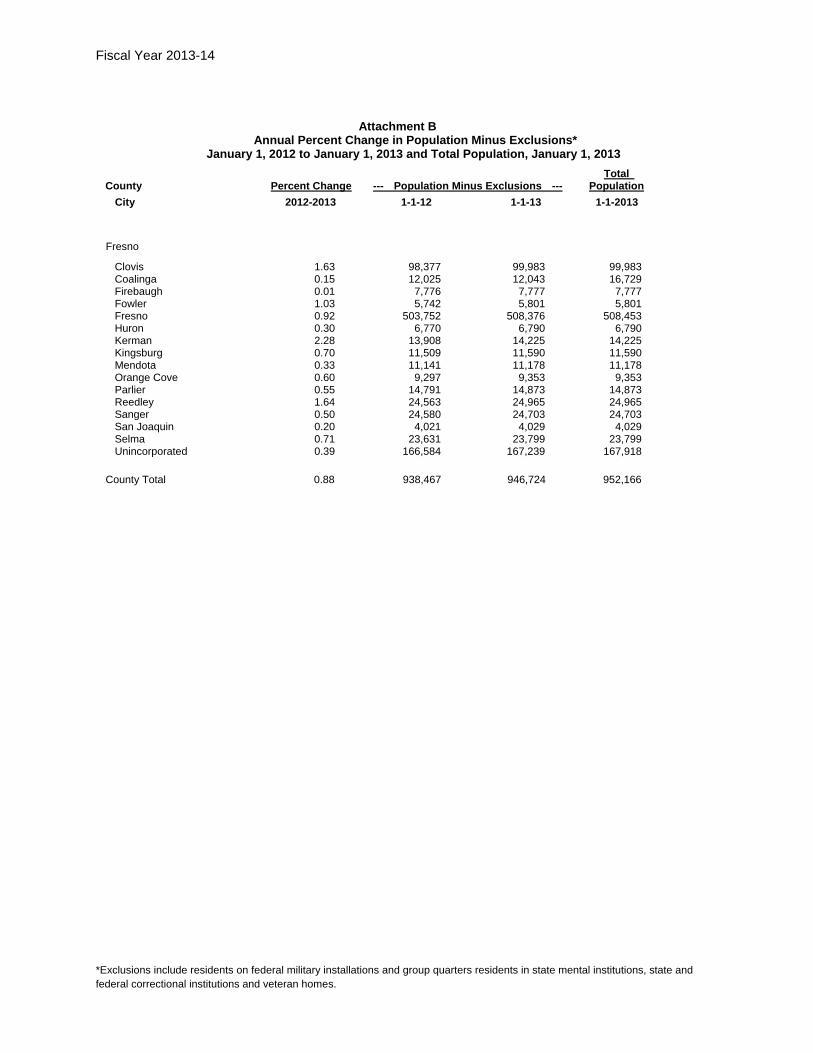
Fresno
Clovis 1.63 98,377 99,983 99,983 Coalinga 0.15 12,025 12,043 16,729 Firebaugh 0.01 7,776 7,777 7,777 Fowler 1.03 5,742 5,801 5,801 Fresno 0.92 503,752 508,376 508,453 Huron 0.30 6,770 6,790 6,790 Kerman 2.28 13,908 14,225 14,225 Kingsburg 0.70 11,509 11,590 11,590 Mendota 0.33 11,141 11,178 11,178 Orange Cove 0.60 9,297 9,353 9,353 Parlier 0.55 14,791 14,873 14,873 Reedley 1.64 24,563 24,965 24,965 Sanger 0.50 24,580 24,703 24,703 San Joaquin 0.20 4,021 4,029 4,029 Selma 0.71 23,631 23,799 23,799 Unincorporated 0.39 166,584 167,239 167,918
County Total 0.88 938,467 946,724 952,166

Fiscal Year 2013-14
*Exclusions include residents on federal military installations and group quarters residents in state mental institutions, state and federal correctional institutions and veteran homes.
Attachment B Annual Percent Change in Population Minus Exclusions* January 1, 2012 to January 1, 2013 and Total Population, January 1, 2013 Total County Percent Change --- Population Minus Exclusions --- Population City 2012-2013 1-1-12 1-1-13 1-1-2013
Glenn
Orland 0.75 7,569 7,626 7,626 Willows 0.52 6,129 6,161 6,161 Unincorporated 0.29 14,418 14,460 14,562
County Total 0.47 28,116 28,247 28,349

Fiscal Year 2013-14
*Exclusions include residents on federal military installations and group quarters residents in state mental institutions, state and federal correctional institutions and veteran homes.
Attachment B Annual Percent Change in Population Minus Exclusions* January 1, 2012 to January 1, 2013 and Total Population, January 1, 2013 Total County Percent Change --- Population Minus Exclusions --- Population City 2012-2013 1-1-12 1-1-13 1-1-2013
Humboldt
Arcata 0.38 17,769 17,836 17,836 Blue Lake 0.32 1,256 1,260 1,260 Eureka 0.12 26,988 27,021 27,021 Ferndale 0.15 1,364 1,366 1,366 Fortuna 0.27 11,853 11,885 11,885 Rio Dell 0.45 3,348 3,363 3,363 Trinidad 0.27 364 365 365 Unincorporated 0.49 71,564 71,914 72,113
County Total 0.37 134,506 135,010 135,209

Fiscal Year 2013-14
*Exclusions include residents on federal military installations and group quarters residents in state mental institutions, state and federal correctional institutions and veteran homes.
Attachment B Annual Percent Change in Population Minus Exclusions* January 1, 2012 to January 1, 2013 and Total Population, January 1, 2013 Total County Percent Change --- Population Minus Exclusions --- Population City 2012-2013 1-1-12 1-1-13 1-1-2013
Imperial
Brawley 0.72 25,721 25,906 25,906 Calexico 1.40 39,933 40,493 40,493 Calipatria 0.69 3,645 3,670 7,134 El Centro 1.14 43,827 44,327 44,327 Holtville 0.67 6,110 6,151 6,151 Imperial 4.13 15,508 16,148 16,148 Westmorland 0.70 2,293 2,309 2,309 Unincorporated 1.23 33,453 33,866 37,593
County Total 1.40 170,490 172,870 180,061

Fiscal Year 2013-14
*Exclusions include residents on federal military installations and group quarters residents in state mental institutions, state and federal correctional institutions and veteran homes.
Attachment B Annual Percent Change in Population Minus Exclusions* January 1, 2012 to January 1, 2013 and Total Population, January 1, 2013 Total County Percent Change --- Population Minus Exclusions --- Population City 2012-2013 1-1-12 1-1-13 1-1-2013
Inyo
Bishop 0.03 3,876 3,877 3,877 Unincorporated 0.22 14,555 14,587 14,696
County Total 0.18 18,431 18,464 18,573
Fiscal Year 2013-14
*Exclusions include residents on federal military installations and group quarters residents in state mental institutions, state and federal correctional institutions and veteran homes.
Attachment B Annual Percent Change in Population Minus Exclusions* January 1, 2012 to January 1, 2013 and Total Population, January 1, 2013 Total County Percent Change --- Population Minus Exclusions --- Population City 2012-2013 1-1-12 1-1-13 1-1-2013
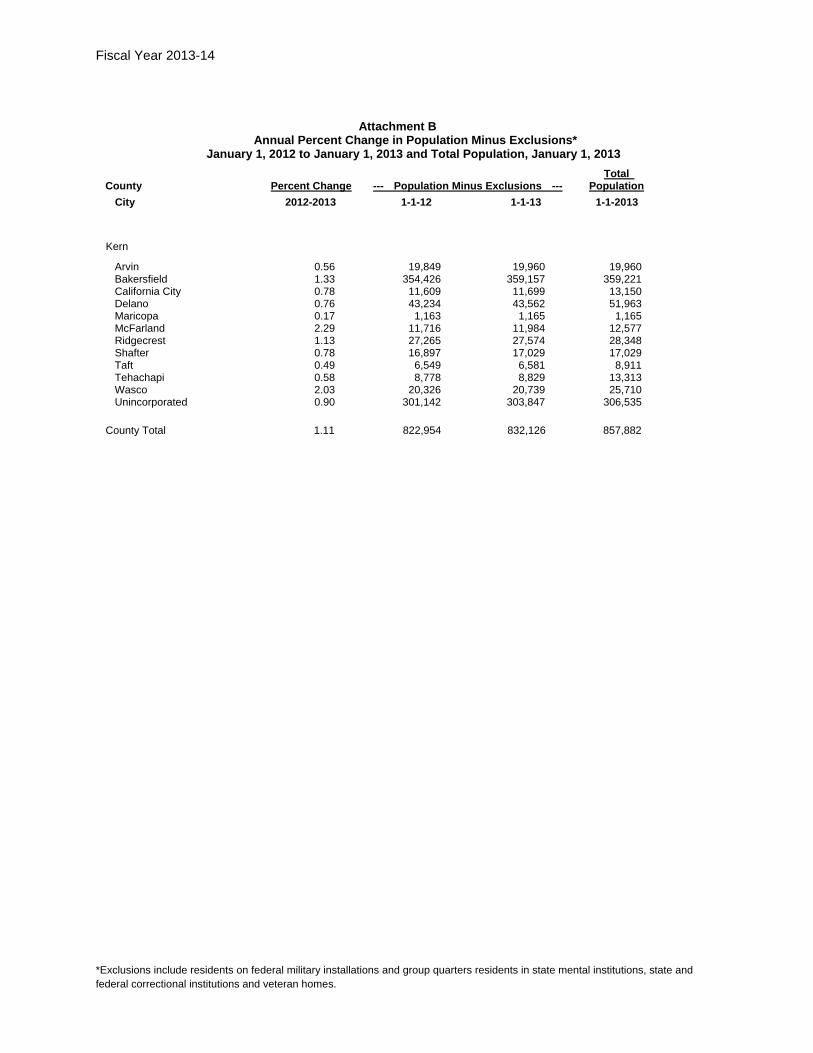
Kern
Arvin 0.56 19,849 19,960 19,960 Bakersfield 1.33 354,426 359,157 359,221 California City 0.78 11,609 11,699 13,150 Delano 0.76 43,234 43,562 51,963 Maricopa 0.17 1,163 1,165 1,165 McFarland 2.29 11,716 11,984 12,577 Ridgecrest 1.13 27,265 27,574 28,348 Shafter 0.78 16,897 17,029 17,029 Taft 0.49 6,549 6,581 8,911 Tehachapi 0.58 8,778 8,829 13,313 Wasco 2.03 20,326 20,739 25,710 Unincorporated 0.90 301,142 303,847 306,535
County Total 1.11 822,954 832,126 857,882

Fiscal Year 2013-14
*Exclusions include residents on federal military installations and group quarters residents in state mental institutions, state and federal correctional institutions and veteran homes.
Attachment B Annual Percent Change in Population Minus Exclusions* January 1, 2012 to January 1, 2013 and Total Population, January 1, 2013 Total County Percent Change --- Population Minus Exclusions --- Population City 2012-2013 1-1-12 1-1-13 1-1-2013
Kings
Avenal 0.95 9,165 9,252 14,225 Corcoran 0.33 12,787 12,829 23,154 Hanford 1.13 54,860 55,479 55,479 Lemoore 2.30 24,695 25,262 25,262 Unincorporated 0.84 26,909 27,134 33,887
County Total 1.20 128,416 129,956 152,007
Fiscal Year 2013-14
*Exclusions include residents on federal military installations and group quarters residents in state mental institutions, state and federal correctional institutions and veteran homes.
Attachment B Annual Percent Change in Population Minus Exclusions* January 1, 2012 to January 1, 2013 and Total Population, January 1, 2013 Total County Percent Change --- Population Minus Exclusions --- Population City 2012-2013 1-1-12 1-1-13 1-1-2013
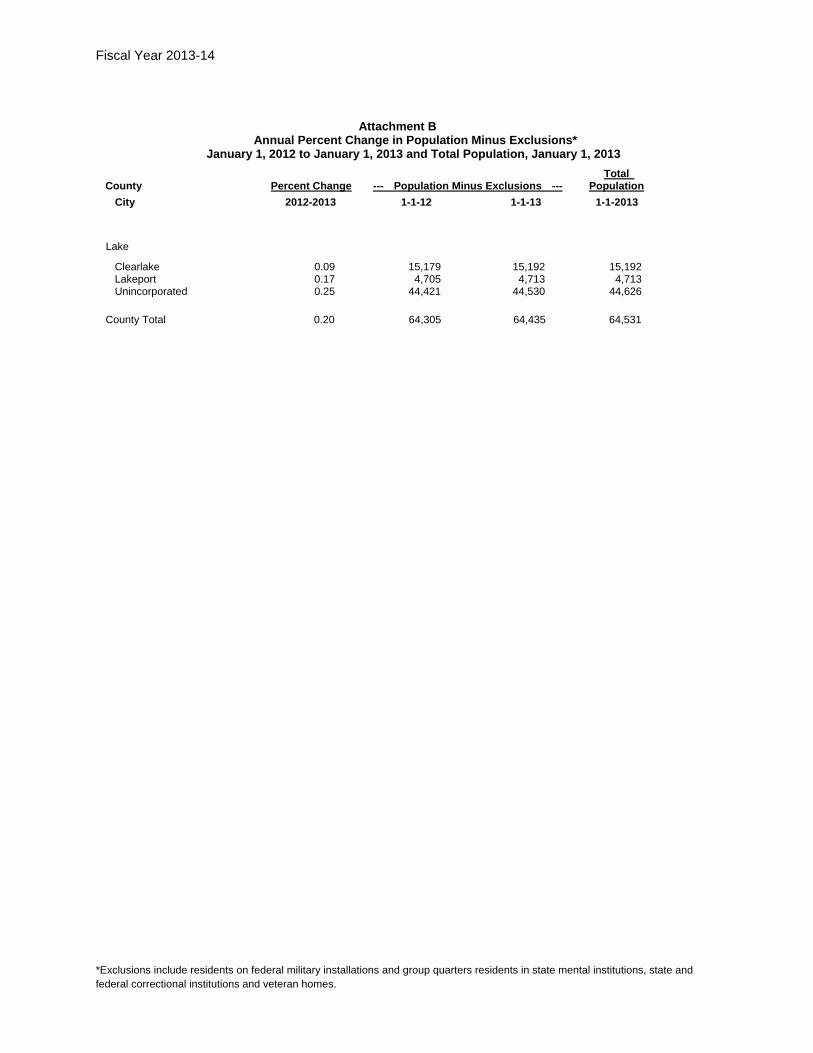
Lake
Clearlake 0.09 15,179 15,192 15,192 Lakeport 0.17 4,705 4,713 4,713 Unincorporated 0.25 44,421 44,530 44,626
County Total 0.20 64,305 64,435 64,531

Fiscal Year 2013-14
*Exclusions include residents on federal military installations and group quarters residents in state mental institutions, state and federal correctional institutions and veteran homes.
Attachment B Annual Percent Change in Population Minus Exclusions* January 1, 2012 to January 1, 2013 and Total Population, January 1, 2013 Total County Percent Change --- Population Minus Exclusions --- Population City 2012-2013 1-1-12 1-1-13 1-1-2013
Lassen
Susanville 2.06 9,304 9,496 15,978 Unincorporated 1.76 15,322 15,591 17,444
County Total 1.87 24,626 25,087 33,422
Fiscal Year 2013-14
*Exclusions include residents on federal military installations and group quarters residents in state mental institutions, state and federal correctional institutions and veteran homes.
Attachment B Annual Percent Change in Population Minus Exclusions* January 1, 2012 to January 1, 2013 and Total Population, January 1, 2013 Total County Percent Change --- Population Minus Exclusions --- Population City 2012-2013 1-1-12 1-1-13 1-1-2013
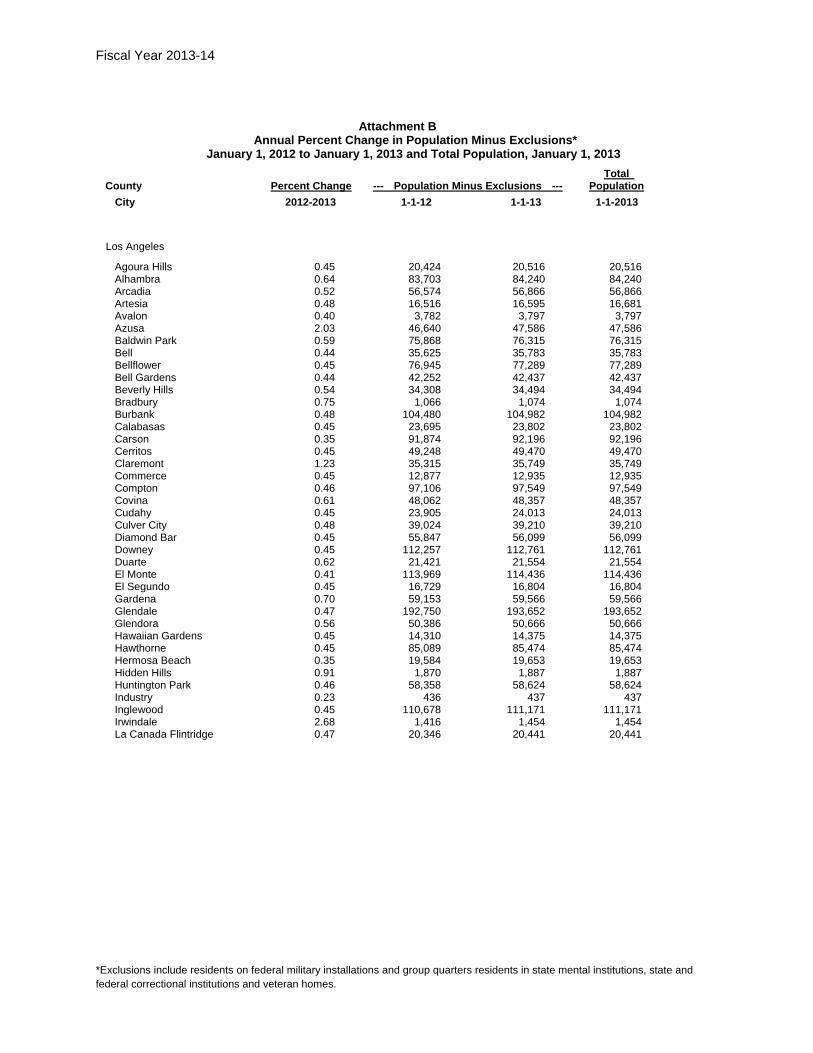
Los Angeles
Agoura Hills 0.45 20,424 20,516 20,516 Alhambra 0.64 83,703 84,240 84,240 Arcadia 0.52 56,574 56,866 56,866 Artesia 0.48 16,516 16,595 16,681 Avalon 0.40 3,782 3,797 3,797 Azusa 2.03 46,640 47,586 47,586 Baldwin Park 0.59 75,868 76,315 76,315 Bell 0.44 35,625 35,783 35,783 Bellflower 0.45 76,945 77,289 77,289 Bell Gardens 0.44 42,252 42,437 42,437 Beverly Hills 0.54 34,308 34,494 34,494 Bradbury 0.75 1,066 1,074 1,074 Burbank 0.48 104,480 104,982 104,982 Calabasas 0.45 23,695 23,802 23,802 Carson 0.35 91,874 92,196 92,196 Cerritos 0.45 49,248 49,470 49,470 Claremont 1.23 35,315 35,749 35,749 Commerce 0.45 12,877 12,935 12,935 Compton 0.46 97,106 97,549 97,549 Covina 0.61 48,062 48,357 48,357 Cudahy 0.45 23,905 24,013 24,013 Culver City 0.48 39,024 39,210 39,210 Diamond Bar 0.45 55,847 56,099 56,099 Downey 0.45 112,257 112,761 112,761 Duarte 0.62 21,421 21,554 21,554 El Monte 0.41 113,969 114,436 114,436 El Segundo 0.45 16,729 16,804 16,804 Gardena 0.70 59,153 59,566 59,566 Glendale 0.47 192,750 193,652 193,652 Glendora 0.56 50,386 50,666 50,666 Hawaiian Gardens 0.45 14,310 14,375 14,375 Hawthorne 0.45 85,089 85,474 85,474 Hermosa Beach 0.35 19,584 19,653 19,653 Hidden Hills 0.91 1,870 1,887 1,887 Huntington Park 0.46 58,358 58,624 58,624 Industry 0.23 436 437 437 Inglewood 0.45 110,678 111,171 111,171 Irwindale 2.68 1,416 1,454 1,454 La Canada Flintridge 0.47 20,346 20,441 20,441
Fiscal Year 2013-14
*Exclusions include residents on federal military installations and group quarters residents in state mental institutions, state and federal correctional institutions and veteran homes.
Attachment B Annual Percent Change in Population Minus Exclusions* January 1, 2012 to January 1, 2013 and Total Population, January 1, 2013 Total County Percent Change --- Population Minus Exclusions --- Population City 2012-2013 1-1-12 1-1-13 1-1-2013
La Habra Heights 0.45 5,355 5,379 5,379 Lakewood 0.45 80,418 80,781 80,781 La Mirada 0.43 48,720 48,930 48,930 Lancaster 0.56 152,868 153,717 158,630 La Puente 0.53 40,008 40,222 40,222 La Verne 1.80 31,476 32,041 32,041 Lawndale 0.46 32,907 33,058 33,058 Lomita 0.54 20,406 20,516 20,516 Long Beach 0.59 464,784 467,538 467,646 Los Angeles 0.95 3,824,199 3,860,719 3,863,839 Lynwood 1.02 69,931 70,645 70,645 Malibu 0.48 12,706 12,767 12,767 Manhattan Beach 0.47 35,257 35,423 35,423 Maywood 0.45 27,486 27,610 27,610 Monrovia 0.54 36,745 36,943 36,943 Montebello 0.47 62,889 63,184 63,184 Monterey Park 0.43 61,184 61,445 61,445 Norwalk 0.29 105,132 105,439 106,093 Palmdale 0.49 153,785 154,535 154,535 Palos Verdes Estates 0.49 13,523 13,589 13,589 Paramount 0.42 54,395 54,624 54,624 Pasadena 0.52 139,291 140,020 140,020 Pico Rivera 0.53 63,199 63,534 63,534 Pomona 0.66 149,729 150,724 150,942 Rancho Palos Verdes 0.47 41,901 42,097 42,114 Redondo Beach 0.53 67,041 67,396 67,396 Rolling Hills 0.43 1,876 1,884 1,884 Rolling Hills Estates 0.49 8,101 8,141 8,141 Rosemead 0.49 54,199 54,464 54,464 San Dimas 0.51 33,516 33,686 33,686 San Fernando 1.33 23,764 24,079 24,079 San Gabriel 0.52 39,945 40,153 40,153 San Marino 0.33 13,202 13,246 13,246 Santa Clarita 15.44 177,534 204,951 204,951 Santa Fe Springs 1.77 16,479 16,771 16,816 Santa Monica 0.86 90,267 91,040 91,040 Sierra Madre 0.49 10,969 11,023 11,023 Signal Hill 0.75 11,135 11,218 11,218 South El Monte 0.55 20,200 20,312 20,312 South Gate 0.79 94,367 95,115 95,115 South Pasadena 0.47 25,737 25,857 25,857

Fiscal Year 2013-14
*Exclusions include residents on federal military installations and group quarters residents in state mental institutions, state and federal correctional institutions and veteran homes.
Attachment B Annual Percent Change in Population Minus Exclusions* January 1, 2012 to January 1, 2013 and Total Population, January 1, 2013 Total County Percent Change --- Population Minus Exclusions --- Population City 2012-2013 1-1-12 1-1-13 1-1-2013
Temple City 0.52 35,766 35,952 35,952 Torrance 0.46 146,188 146,860 146,860 Vernon 0.83 120 121 121 Walnut 0.91 29,676 29,947 29,947 West Covina 0.45 106,766 107,248 107,248 West Hollywood 0.45 34,698 34,853 34,853 Westlake Village 0.45 8,304 8,341 8,341 Whittier 0.46 85,696 86,093 86,093 Unincorporated -2.09 1,061,526 1,039,366 1,040,390
County Total 0.69 9,879,254 9,947,906 9,958,091

Fiscal Year 2013-14
*Exclusions include residents on federal military installations and group quarters residents in state mental institutions, state and federal correctional institutions and veteran homes.
Attachment B Annual Percent Change in Population Minus Exclusions* January 1, 2012 to January 1, 2013 and Total Population, January 1, 2013 Total County Percent Change --- Population Minus Exclusions --- Population City 2012-2013 1-1-12 1-1-13 1-1-2013
Madera
Chowchilla 2.42 11,872 12,159 17,462 Madera 0.67 62,622 63,040 63,040 Unincorporated 0.48 71,866 72,209 72,209
County Total 0.72 146,360 147,408 152,711

Fiscal Year 2013-14
*Exclusions include residents on federal military installations and group quarters residents in state mental institutions, state and federal correctional institutions and veteran homes.
Attachment B Annual Percent Change in Population Minus Exclusions* January 1, 2012 to January 1, 2013 and Total Population, January 1, 2013 Total County Percent Change --- Population Minus Exclusions --- Population City 2012-2013 1-1-12 1-1-13 1-1-2013
Marin
Belvedere 0.38 2,078 2,086 2,086 Corte Madera 0.25 9,297 9,320 9,320 Fairfax 0.27 7,479 7,499 7,499 Larkspur 0.27 11,989 12,021 12,021 Mill Valley 0.40 14,091 14,147 14,147 Novato 0.76 51,806 52,200 52,554 Ross 0.70 2,429 2,446 2,446 San Anselmo 0.28 12,396 12,431 12,431 San Rafael 0.34 57,982 58,182 58,182 Sausalito 0.27 7,097 7,116 7,116 Tiburon 0.27 9,007 9,031 9,031 Unincorporated 0.34 62,957 63,173 67,174
County Total 0.42 248,608 249,652 254,007

Fiscal Year 2013-14
*Exclusions include residents on federal military installations and group quarters residents in state mental institutions, state and federal correctional institutions and veteran homes.
Attachment B Annual Percent Change in Population Minus Exclusions* January 1, 2012 to January 1, 2013 and Total Population, January 1, 2013 Total County Percent Change --- Population Minus Exclusions --- Population City 2012-2013 1-1-12 1-1-13 1-1-2013
Mariposa
Unincorporated 0.44 17,852 17,931 18,026
County Total 0.44 17,852 17,931 18,026

Fiscal Year 2013-14
*Exclusions include residents on federal military installations and group quarters residents in state mental institutions, state and federal correctional institutions and veteran homes.
Attachment B Annual Percent Change in Population Minus Exclusions* January 1, 2012 to January 1, 2013 and Total Population, January 1, 2013 Total County Percent Change --- Population Minus Exclusions --- Population City 2012-2013 1-1-12 1-1-13 1-1-2013
Mendocino
Fort Bragg 0.33 7,287 7,311 7,311 Point Arena 0.22 448 449 449 Ukiah 0.22 16,030 16,065 16,065 Willits 0.29 4,879 4,893 4,893 Unincorporated 0.49 59,106 59,394 59,573
County Total 0.41 87,750 88,112 88,291
Fiscal Year 2013-14
*Exclusions include residents on federal military installations and group quarters residents in state mental institutions, state and federal correctional institutions and veteran homes.
Attachment B Annual Percent Change in Population Minus Exclusions* January 1, 2012 to January 1, 2013 and Total Population, January 1, 2013 Total County Percent Change --- Population Minus Exclusions --- Population City 2012-2013 1-1-12 1-1-13 1-1-2013
Merced
Atwater 0.76 28,714 28,931 28,931 Dos Palos 0.72 5,000 5,036 5,036 Gustine 0.88 5,577 5,626 5,626 Livingston 0.81 13,433 13,542 13,542 Los Banos 0.78 36,732 37,017 37,017 Merced 1.09 79,727 80,599 80,599 Unincorporated 0.94 89,308 90,147 91,727
County Total 0.93 258,491 260,898 262,478
Fiscal Year 2013-14
*Exclusions include residents on federal military installations and group quarters residents in state mental institutions, state and federal correctional institutions and veteran homes.
Attachment B Annual Percent Change in Population Minus Exclusions* January 1, 2012 to January 1, 2013 and Total Population, January 1, 2013 Total County Percent Change --- Population Minus Exclusions --- Population City 2012-2013 1-1-12 1-1-13 1-1-2013
Modoc
Alturas -0.54 2,769 2,754 2,754 Unincorporated -0.05 6,664 6,661 6,768
County Total -0.19 9,433 9,415 9,522
Fiscal Year 2013-14
*Exclusions include residents on federal military installations and group quarters residents in state mental institutions, state and federal correctional institutions and veteran homes.
Attachment B Annual Percent Change in Population Minus Exclusions* January 1, 2012 to January 1, 2013 and Total Population, January 1, 2013 Total County Percent Change --- Population Minus Exclusions --- Population City 2012-2013 1-1-12 1-1-13 1-1-2013
Mono
Mammoth Lakes 0.45 8,270 8,307 8,307 Unincorporated 0.70 6,012 6,054 6,186
County Total 0.55 14,282 14,361 14,493
Fiscal Year 2013-14
*Exclusions include residents on federal military installations and group quarters residents in state mental institutions, state and federal correctional institutions and veteran homes.
Attachment B Annual Percent Change in Population Minus Exclusions* January 1, 2012 to January 1, 2013 and Total Population, January 1, 2013 Total County Percent Change --- Population Minus Exclusions --- Population City 2012-2013 1-1-12 1-1-13 1-1-2013
Monterey
Carmel-By-The-Sea 0.59 3,753 3,775 3,775 Del Rey Oaks 0.61 1,638 1,648 1,648 Gonzales 0.59 8,247 8,296 8,296 Greenfield 1.60 16,465 16,729 16,729 King City 0.62 12,992 13,073 13,073 Marina 0.64 19,945 20,073 20,073 Monterey 0.72 23,820 23,991 28,252 Pacific Grove 0.59 15,178 15,268 15,268 Salinas 0.80 151,994 153,215 153,215 Sand City 0.60 336 338 338 Seaside 1.08 28,902 29,214 33,312 Soledad 1.13 15,867 16,047 25,430 Unincorporated 0.70 100,793 101,500 102,085
County Total 0.81 399,930 403,167 421,494
Fiscal Year 2013-14
*Exclusions include residents on federal military installations and group quarters residents in state mental institutions, state and federal correctional institutions and veteran homes.
Attachment B Annual Percent Change in Population Minus Exclusions* January 1, 2012 to January 1, 2013 and Total Population, January 1, 2013 Total County Percent Change --- Population Minus Exclusions --- Population City 2012-2013 1-1-12 1-1-13 1-1-2013
Napa
American Canyon 0.65 19,734 19,862 19,862 Calistoga 0.25 5,181 5,194 5,194 Napa 0.47 77,513 77,881 77,881 St Helena 0.29 5,837 5,854 5,854 Yountville 0.00 1,997 1,997 2,983 Unincorporated 0.43 25,277 25,386 26,609
County Total 0.47 135,539 136,174 138,383

Fiscal Year 2013-14
*Exclusions include residents on federal military installations and group quarters residents in state mental institutions, state and federal correctional institutions and veteran homes.
Attachment B Annual Percent Change in Population Minus Exclusions* January 1, 2012 to January 1, 2013 and Total Population, January 1, 2013 Total County Percent Change --- Population Minus Exclusions --- Population City 2012-2013 1-1-12 1-1-13 1-1-2013
Nevada
Grass Valley -0.04 12,662 12,657 12,657 Nevada City 0.03 3,068 3,069 3,069 Truckee -0.19 15,949 15,918 15,918 Unincorporated -0.47 65,600 65,294 65,375
County Total -0.35 97,279 96,938 97,019
Fiscal Year 2013-14
*Exclusions include residents on federal military installations and group quarters residents in state mental institutions, state and federal correctional institutions and veteran homes.
Attachment B Annual Percent Change in Population Minus Exclusions* January 1, 2012 to January 1, 2013 and Total Population, January 1, 2013 Total County Percent Change --- Population Minus Exclusions --- Population City 2012-2013 1-1-12 1-1-13 1-1-2013
Orange
Aliso Viejo 0.92 49,025 49,477 49,477 Anaheim 0.62 344,000 346,144 346,161 Brea 1.06 40,960 41,394 41,394 Buena Park 0.54 81,515 81,953 81,953 Costa Mesa 0.50 110,448 110,996 111,358 Cypress 0.50 48,305 48,547 48,547 Dana Point 0.51 33,690 33,863 33,863 Fountain Valley 0.60 55,847 56,180 56,180 Fullerton 0.49 137,572 138,251 138,251 Garden Grove 0.18 172,763 173,075 173,075 Huntington Beach 0.50 192,654 193,616 193,616 Irvine 3.24 223,870 231,117 231,117 Laguna Beach 0.54 22,981 23,105 23,105 Laguna Hills 0.45 30,564 30,703 30,703 Laguna Niguel 0.52 63,734 64,065 64,065 Laguna Woods 0.44 16,427 16,500 16,500 La Habra 0.48 60,912 61,202 61,202 Lake Forest 0.53 78,089 78,501 78,501 La Palma 0.68 15,711 15,818 15,818 Los Alamitos 0.53 11,565 11,626 11,626 Mission Viejo 0.60 94,262 94,824 94,824 Newport Beach 0.45 86,048 86,436 86,436 Orange 0.50 138,100 138,792 138,792 Placentia 1.29 51,119 51,776 51,776 Rancho Santa Margarita 0.49 48,311 48,550 48,550 San Clemente 0.45 64,252 64,542 64,542 San Juan Capistrano 0.78 35,046 35,321 35,321 Santa Ana 0.59 327,988 329,915 329,915 Seal Beach 0.47 23,810 23,921 24,487 Stanton 0.62 38,524 38,764 38,764 Tustin 1.78 76,618 77,983 77,983 Villa Park 0.49 5,871 5,900 5,900 Westminster 0.47 90,738 91,169 91,169 Yorba Linda 0.94 65,821 66,437 66,437 Unincorporated 0.52 119,779 120,396 120,396
County Total 0.78 3,056,919 3,080,859 3,081,804
Fiscal Year 2013-14
*Exclusions include residents on federal military installations and group quarters residents in state mental institutions, state and federal correctional institutions and veteran homes.
Attachment B Annual Percent Change in Population Minus Exclusions* January 1, 2012 to January 1, 2013 and Total Population, January 1, 2013 Total County Percent Change --- Population Minus Exclusions --- Population City 2012-2013 1-1-12 1-1-13 1-1-2013
Placer
Auburn -0.20 13,473 13,446 13,446 Colfax -0.40 1,977 1,969 1,969 Lincoln 0.53 43,587 43,818 43,818 Loomis -0.14 6,502 6,493 6,493 Rocklin 0.29 58,316 58,484 58,484 Roseville 1.15 122,104 123,514 123,514 Unincorporated 0.22 109,496 109,739 109,739
County Total 0.56 355,455 357,463 357,463

Fiscal Year 2013-14
*Exclusions include residents on federal military installations and group quarters residents in state mental institutions, state and federal correctional institutions and veteran homes.
Attachment B Annual Percent Change in Population Minus Exclusions* January 1, 2012 to January 1, 2013 and Total Population, January 1, 2013 Total County Percent Change --- Population Minus Exclusions --- Population City 2012-2013 1-1-12 1-1-13 1-1-2013
Plumas
Portola -0.44 2,048 2,039 2,039 Unincorporated -0.26 17,650 17,604 17,604
County Total -0.28 19,698 19,643 19,643
Fiscal Year 2013-14
*Exclusions include residents on federal military installations and group quarters residents in state mental institutions, state and federal correctional institutions and veteran homes.
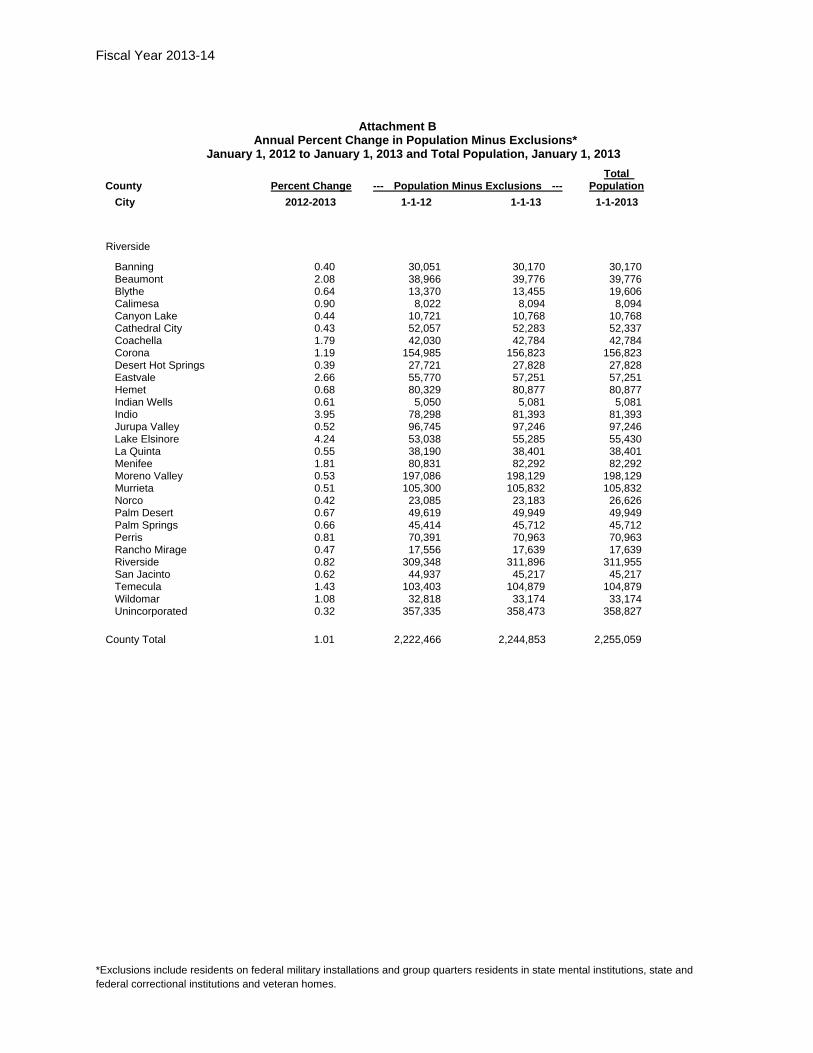
Attachment B Annual Percent Change in Population Minus Exclusions* January 1, 2012 to January 1, 2013 and Total Population, January 1, 2013 Total County Percent Change --- Population Minus Exclusions --- Population City 2012-2013 1-1-12 1-1-13 1-1-2013
Riverside
Banning 0.40 30,051 30,170 30,170 Beaumont 2.08 38,966 39,776 39,776 Blythe 0.64 13,370 13,455 19,606 Calimesa 0.90 8,022 8,094 8,094 Canyon Lake 0.44 10,721 10,768 10,768 Cathedral City 0.43 52,057 52,283 52,337 Coachella 1.79 42,030 42,784 42,784 Corona 1.19 154,985 156,823 156,823 Desert Hot Springs 0.39 27,721 27,828 27,828 Eastvale 2.66 55,770 57,251 57,251 Hemet 0.68 80,329 80,877 80,877 Indian Wells 0.61 5,050 5,081 5,081 Indio 3.95 78,298 81,393 81,393 Jurupa Valley 0.52 96,745 97,246 97,246 Lake Elsinore 4.24 53,038 55,285 55,430 La Quinta 0.55 38,190 38,401 38,401 Menifee 1.81 80,831 82,292 82,292 Moreno Valley 0.53 197,086 198,129 198,129 Murrieta 0.51 105,300 105,832 105,832 Norco 0.42 23,085 23,183 26,626 Palm Desert 0.67 49,619 49,949 49,949 Palm Springs 0.66 45,414 45,712 45,712 Perris 0.81 70,391 70,963 70,963 Rancho Mirage 0.47 17,556 17,639 17,639 Riverside 0.82 309,348 311,896 311,955 San Jacinto 0.62 44,937 45,217 45,217 Temecula 1.43 103,403 104,879 104,879 Wildomar 1.08 32,818 33,174 33,174 Unincorporated 0.32 357,335 358,473 358,827
County Total 1.01 2,222,466 2,244,853 2,255,059

Fiscal Year 2013-14
*Exclusions include residents on federal military installations and group quarters residents in state mental institutions, state and federal correctional institutions and veteran homes.
Attachment B Annual Percent Change in Population Minus Exclusions* January 1, 2012 to January 1, 2013 and Total Population, January 1, 2013 Total County Percent Change --- Population Minus Exclusions --- Population City 2012-2013 1-1-12 1-1-13 1-1-2013
Sacramento
Citrus Heights 0.66 83,788 84,345 84,345 Elk Grove 2.13 155,763 159,074 159,074 Folsom 1.35 66,531 67,429 72,294 Galt 0.57 24,049 24,185 24,185 Isleton 0.62 810 815 815 Rancho Cordova 1.45 65,973 66,927 66,927 Sacramento 0.65 470,437 473,509 473,509 Unincorporated 0.85 559,911 564,657 564,657
County Total 0.96 1,427,262 1,440,941 1,445,806

Fiscal Year 2013-14
*Exclusions include residents on federal military installations and group quarters residents in state mental institutions, state and federal correctional institutions and veteran homes.
Attachment B Annual Percent Change in Population Minus Exclusions* January 1, 2012 to January 1, 2013 and Total Population, January 1, 2013 Total County Percent Change --- Population Minus Exclusions --- Population City 2012-2013 1-1-12 1-1-13 1-1-2013
San Benito
Hollister 1.04 35,738 36,108 36,108 San Juan Bautista 0.80 1,866 1,881 1,881 Unincorporated 0.79 18,533 18,680 18,680
County Total 0.95 56,137 56,669 56,669
Fiscal Year 2013-14
*Exclusions include residents on federal military installations and group quarters residents in state mental institutions, state and federal correctional institutions and veteran homes.
Attachment B Annual Percent Change in Population Minus Exclusions* January 1, 2012 to January 1, 2013 and Total Population, January 1, 2013 Total County Percent Change --- Population Minus Exclusions --- Population City 2012-2013 1-1-12 1-1-13 1-1-2013
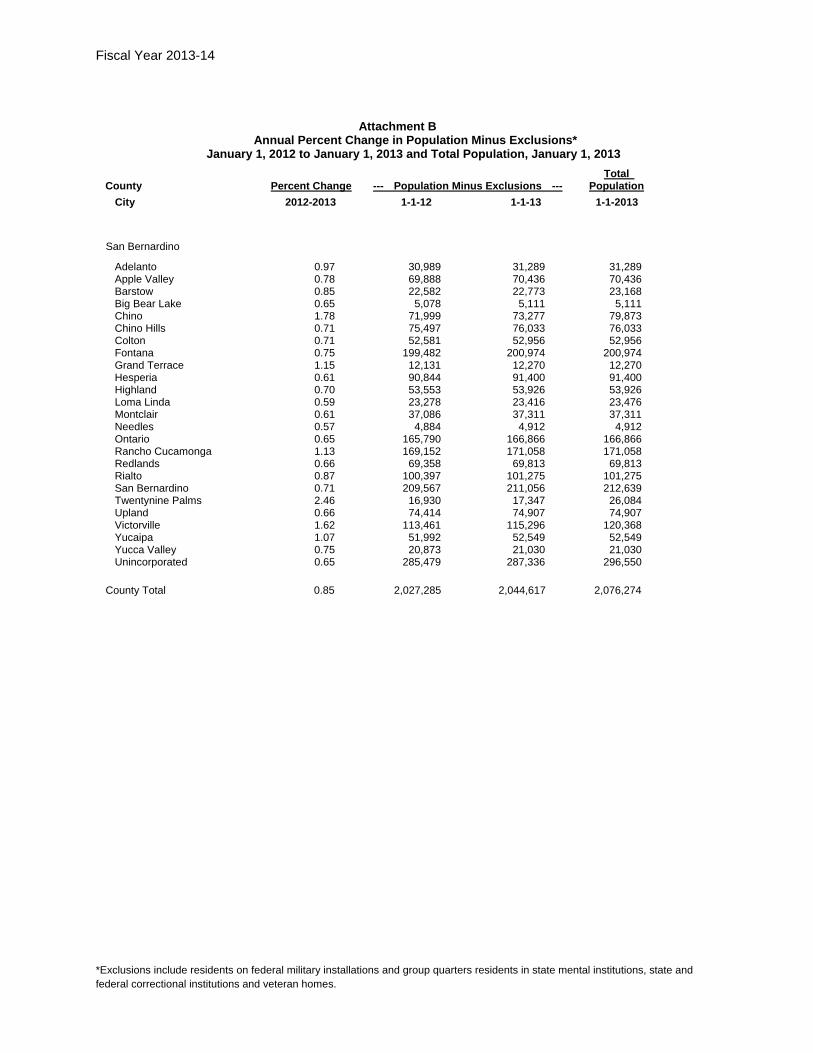
San Bernardino
Adelanto 0.97 30,989 31,289 31,289 Apple Valley 0.78 69,888 70,436 70,436 Barstow 0.85 22,582 22,773 23,168 Big Bear Lake 0.65 5,078 5,111 5,111 Chino 1.78 71,999 73,277 79,873 Chino Hills 0.71 75,497 76,033 76,033 Colton 0.71 52,581 52,956 52,956 Fontana 0.75 199,482 200,974 200,974 Grand Terrace 1.15 12,131 12,270 12,270 Hesperia 0.61 90,844 91,400 91,400 Highland 0.70 53,553 53,926 53,926 Loma Linda 0.59 23,278 23,416 23,476 Montclair 0.61 37,086 37,311 37,311 Needles 0.57 4,884 4,912 4,912 Ontario 0.65 165,790 166,866 166,866 Rancho Cucamonga 1.13 169,152 171,058 171,058 Redlands 0.66 69,358 69,813 69,813 Rialto 0.87 100,397 101,275 101,275 San Bernardino 0.71 209,567 211,056 212,639 Twentynine Palms 2.46 16,930 17,347 26,084 Upland 0.66 74,414 74,907 74,907 Victorville 1.62 113,461 115,296 120,368 Yucaipa 1.07 51,992 52,549 52,549 Yucca Valley 0.75 20,873 21,030 21,030 Unincorporated 0.65 285,479 287,336 296,550
County Total 0.85 2,027,285 2,044,617 2,076,274
Fiscal Year 2013-14
*Exclusions include residents on federal military installations and group quarters residents in state mental institutions, state and federal correctional institutions and veteran homes.
Attachment B Annual Percent Change in Population Minus Exclusions* January 1, 2012 to January 1, 2013 and Total Population, January 1, 2013 Total County Percent Change --- Population Minus Exclusions --- Population City 2012-2013 1-1-12 1-1-13 1-1-2013
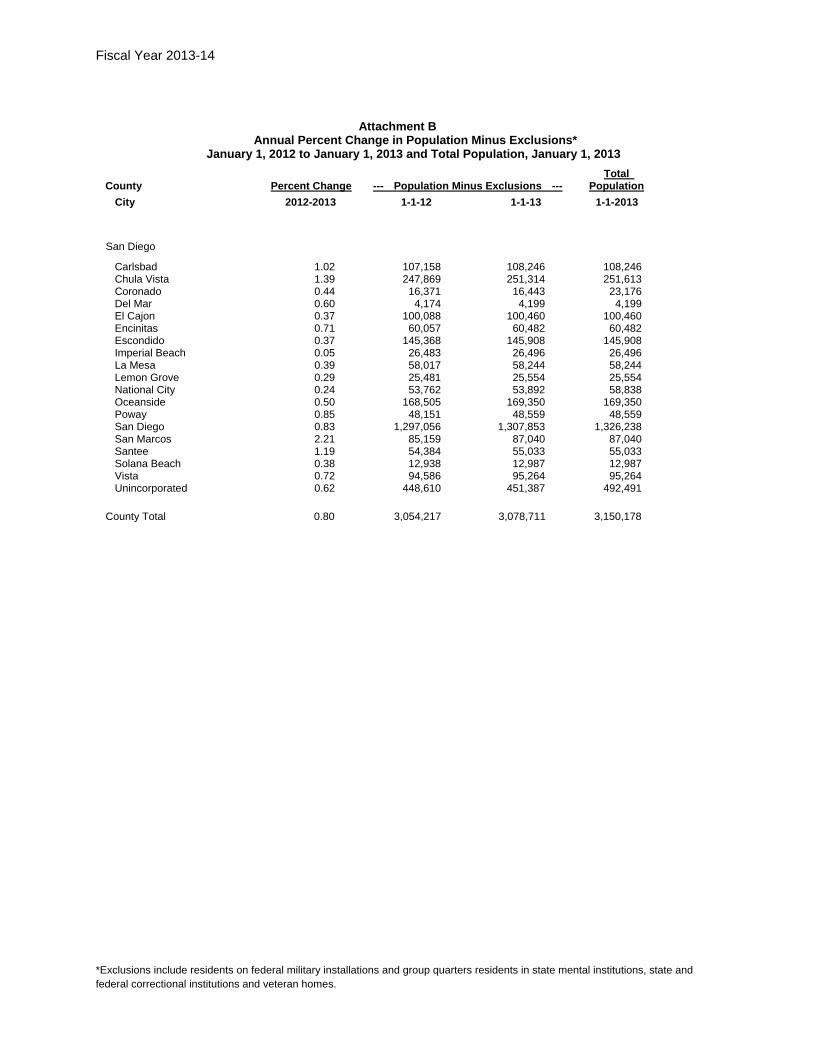
San Diego
Carlsbad 1.02 107,158 108,246 108,246 Chula Vista 1.39 247,869 251,314 251,613 Coronado 0.44 16,371 16,443 23,176 Del Mar 0.60 4,174 4,199 4,199 El Cajon 0.37 100,088 100,460 100,460 Encinitas 0.71 60,057 60,482 60,482 Escondido 0.37 145,368 145,908 145,908 Imperial Beach 0.05 26,483 26,496 26,496 La Mesa 0.39 58,017 58,244 58,244 Lemon Grove 0.29 25,481 25,554 25,554 National City 0.24 53,762 53,892 58,838 Oceanside 0.50 168,505 169,350 169,350 Poway 0.85 48,151 48,559 48,559 San Diego 0.83 1,297,056 1,307,853 1,326,238 San Marcos 2.21 85,159 87,040 87,040 Santee 1.19 54,384 55,033 55,033 Solana Beach 0.38 12,938 12,987 12,987 Vista 0.72 94,586 95,264 95,264 Unincorporated 0.62 448,610 451,387 492,491
County Total 0.80 3,054,217 3,078,711 3,150,178
Fiscal Year 2013-14
*Exclusions include residents on federal military installations and group quarters residents in state mental institutions, state and federal correctional institutions and veteran homes.
Attachment B Annual Percent Change in Population Minus Exclusions* January 1, 2012 to January 1, 2013 and Total Population, January 1, 2013 Total County Percent Change --- Population Minus Exclusions --- Population City 2012-2013 1-1-12 1-1-13 1-1-2013
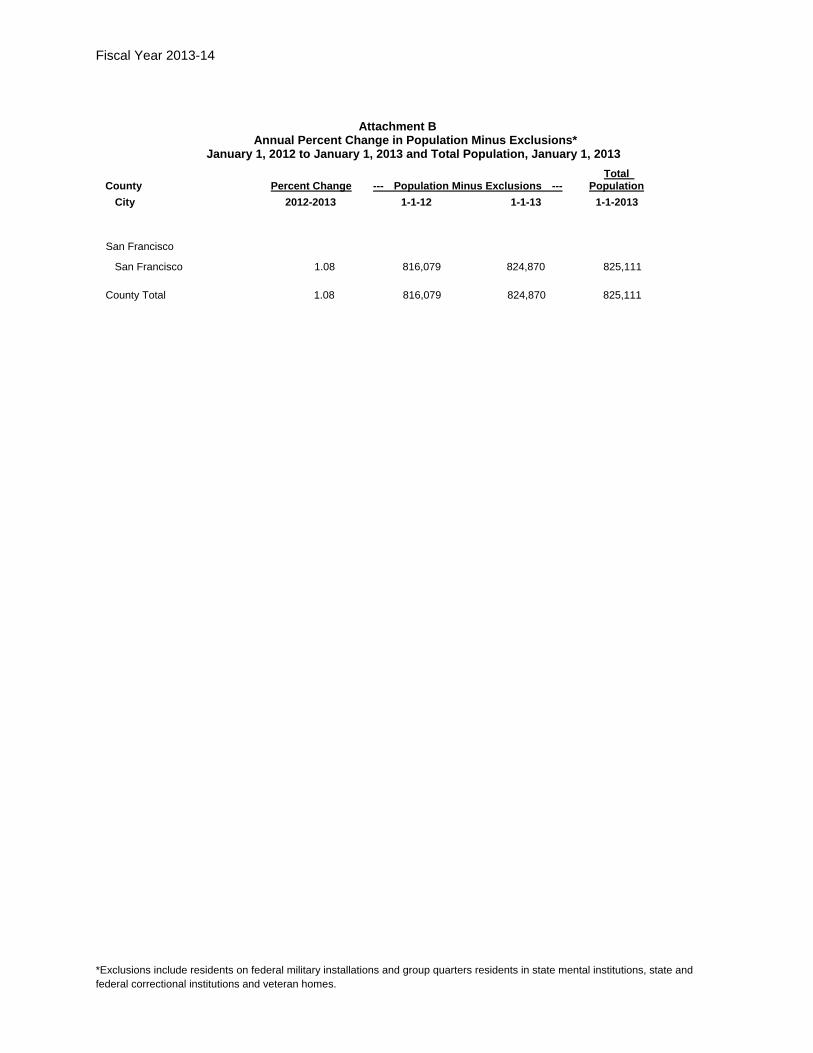
San Francisco
San Francisco 1.08 816,079 824,870 825,111
County Total 1.08 816,079 824,870 825,111
Fiscal Year 2013-14
*Exclusions include residents on federal military installations and group quarters residents in state mental institutions, state and federal correctional institutions and veteran homes.
Attachment B Annual Percent Change in Population Minus Exclusions* January 1, 2012 to January 1, 2013 and Total Population, January 1, 2013 Total County Percent Change --- Population Minus Exclusions --- Population City 2012-2013 1-1-12 1-1-13 1-1-2013
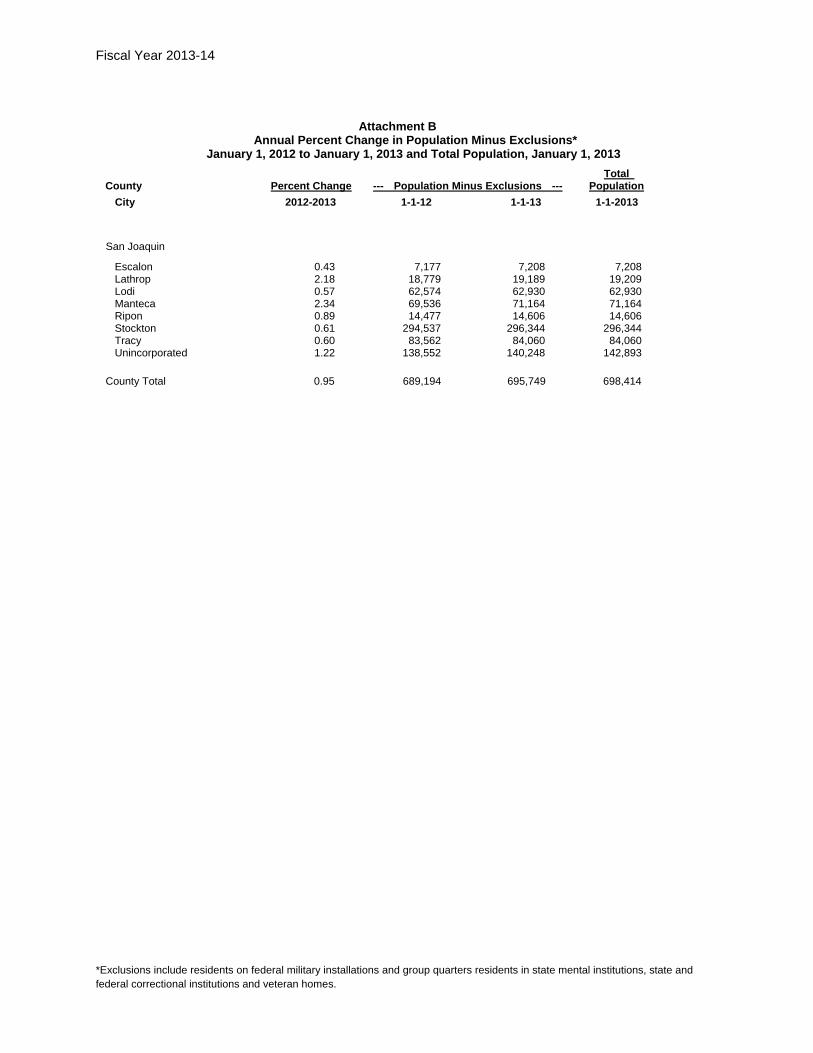
San Joaquin
Escalon 0.43 7,177 7,208 7,208 Lathrop 2.18 18,779 19,189 19,209 Lodi 0.57 62,574 62,930 62,930 Manteca 2.34 69,536 71,164 71,164 Ripon 0.89 14,477 14,606 14,606 Stockton 0.61 294,537 296,344 296,344 Tracy 0.60 83,562 84,060 84,060 Unincorporated 1.22 138,552 140,248 142,893
County Total 0.95 689,194 695,749 698,414
Fiscal Year 2013-14
*Exclusions include residents on federal military installations and group quarters residents in state mental institutions, state and federal correctional institutions and veteran homes.
Attachment B Annual Percent Change in Population Minus Exclusions* January 1, 2012 to January 1, 2013 and Total Population, January 1, 2013 Total County Percent Change --- Population Minus Exclusions --- Population City 2012-2013 1-1-12 1-1-13 1-1-2013
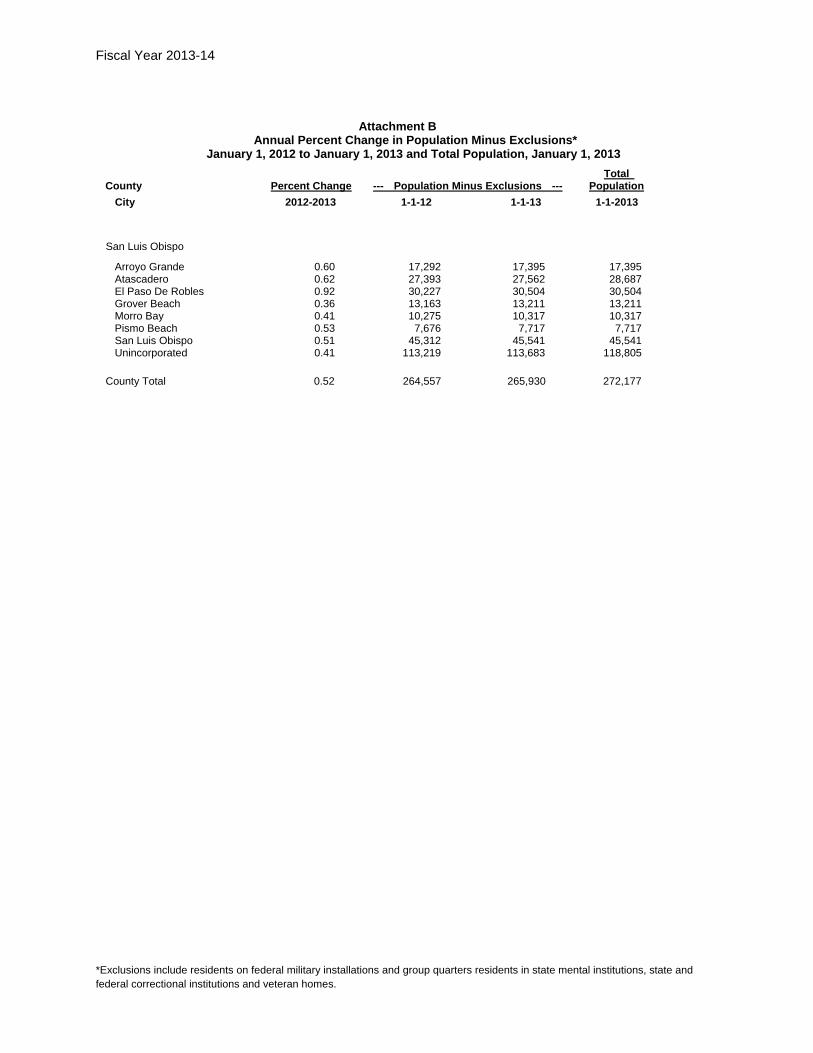
San Luis Obispo
Arroyo Grande 0.60 17,292 17,395 17,395 Atascadero 0.62 27,393 27,562 28,687 El Paso De Robles 0.92 30,227 30,504 30,504 Grover Beach 0.36 13,163 13,211 13,211 Morro Bay 0.41 10,275 10,317 10,317 Pismo Beach 0.53 7,676 7,717 7,717 San Luis Obispo 0.51 45,312 45,541 45,541 Unincorporated 0.41 113,219 113,683 118,805
County Total 0.52 264,557 265,930 272,177

Fiscal Year 2013-14
*Exclusions include residents on federal military installations and group quarters residents in state mental institutions, state and federal correctional institutions and veteran homes.
Attachment B Annual Percent Change in Population Minus Exclusions* January 1, 2012 to January 1, 2013 and Total Population, January 1, 2013 Total County Percent Change --- Population Minus Exclusions --- Population City 2012-2013 1-1-12 1-1-13 1-1-2013
San Mateo
Atherton 0.29 6,873 6,893 6,893 Belmont 0.96 26,065 26,316 26,316 Brisbane 0.97 4,337 4,379 4,379 Burlingame 1.33 29,041 29,426 29,426 Colma 0.97 1,444 1,458 1,458 Daly City 1.02 102,308 103,347 103,347 East Palo Alto 0.96 28,402 28,675 28,675 Foster City 0.96 30,824 31,120 31,120 Half Moon Bay 1.13 11,452 11,581 11,581 Hillsborough 1.22 10,981 11,115 11,115 Menlo Park 0.90 32,194 32,485 32,679 Millbrae 0.95 22,019 22,228 22,228 Pacifica 1.00 37,572 37,948 37,948 Portola Valley 1.07 4,401 4,448 4,448 Redwood City 1.29 78,068 79,074 79,074 San Bruno 1.12 42,355 42,828 42,828 San Carlos 0.97 28,654 28,931 28,931 San Mateo 1.00 98,076 99,061 99,061 South San Francisco 1.51 64,161 65,127 65,127 Woodside 1.25 5,374 5,441 5,441 Unincorporated 1.04 62,947 63,603 63,603
County Total 1.09 727,548 735,484 735,678

Fiscal Year 2013-14
*Exclusions include residents on federal military installations and group quarters residents in state mental institutions, state and federal correctional institutions and veteran homes.
Attachment B Annual Percent Change in Population Minus Exclusions* January 1, 2012 to January 1, 2013 and Total Population, January 1, 2013 Total County Percent Change --- Population Minus Exclusions --- Population City 2012-2013 1-1-12 1-1-13 1-1-2013
Santa Barbara
Buellton 0.33 4,847 4,863 4,863 Carpinteria 0.37 13,051 13,099 13,099 Goleta 0.33 29,863 29,962 29,962 Guadalupe 0.27 7,081 7,100 7,100 Lompoc 0.68 39,064 39,328 42,730 Santa Barbara 0.89 88,866 89,661 89,681 Santa Maria 0.33 99,976 100,306 100,306 Solvang 0.42 5,270 5,292 5,292 Unincorporated 1.07 131,202 132,604 136,167
County Total 0.71 419,220 422,215 429,200
Fiscal Year 2013-14
*Exclusions include residents on federal military installations and group quarters residents in state mental institutions, state and federal correctional institutions and veteran homes.
Attachment B Annual Percent Change in Population Minus Exclusions* January 1, 2012 to January 1, 2013 and Total Population, January 1, 2013 Total County Percent Change --- Population Minus Exclusions --- Population City 2012-2013 1-1-12 1-1-13 1-1-2013
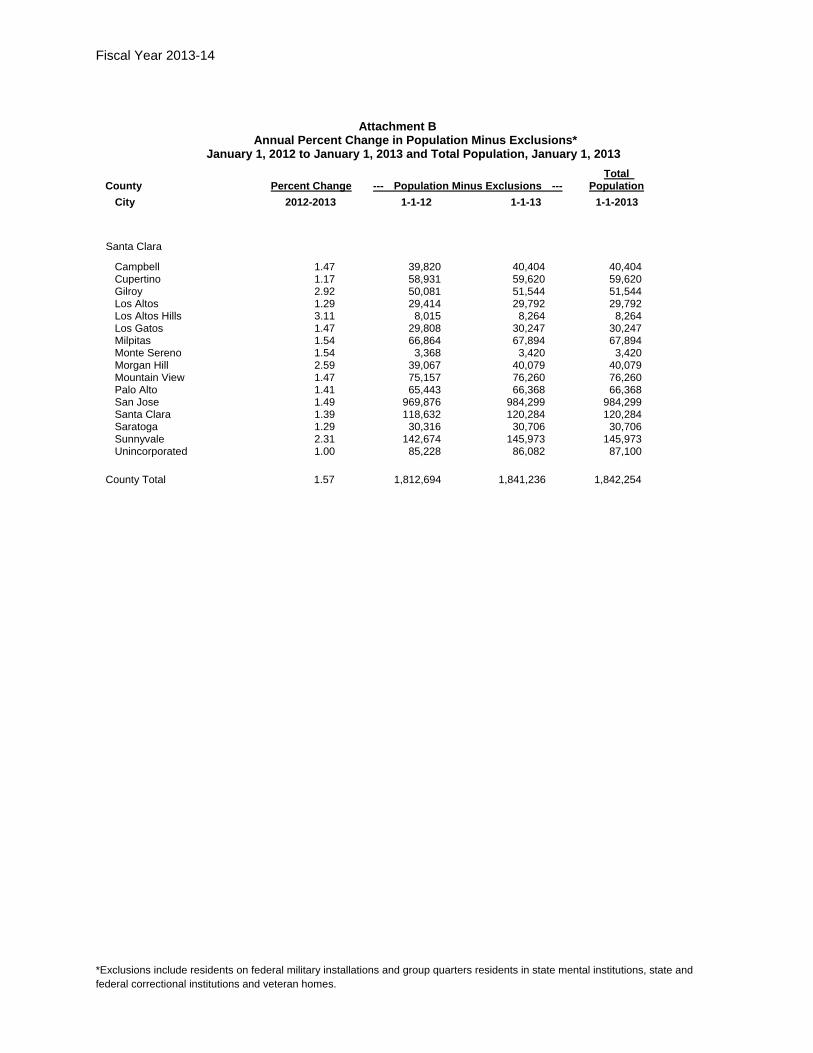
Santa Clara
Campbell 1.47 39,820 40,404 40,404 Cupertino 1.17 58,931 59,620 59,620 Gilroy 2.92 50,081 51,544 51,544 Los Altos 1.29 29,414 29,792 29,792 Los Altos Hills 3.11 8,015 8,264 8,264 Los Gatos 1.47 29,808 30,247 30,247 Milpitas 1.54 66,864 67,894 67,894 Monte Sereno 1.54 3,368 3,420 3,420 Morgan Hill 2.59 39,067 40,079 40,079 Mountain View 1.47 75,157 76,260 76,260 Palo Alto 1.41 65,443 66,368 66,368 San Jose 1.49 969,876 984,299 984,299 Santa Clara 1.39 118,632 120,284 120,284 Saratoga 1.29 30,316 30,706 30,706 Sunnyvale 2.31 142,674 145,973 145,973 Unincorporated 1.00 85,228 86,082 87,100
County Total 1.57 1,812,694 1,841,236 1,842,254
Fiscal Year 2013-14
*Exclusions include residents on federal military installations and group quarters residents in state mental institutions, state and federal correctional institutions and veteran homes.
Attachment B Annual Percent Change in Population Minus Exclusions* January 1, 2012 to January 1, 2013 and Total Population, January 1, 2013 Total County Percent Change --- Population Minus Exclusions --- Population City 2012-2013 1-1-12 1-1-13 1-1-2013
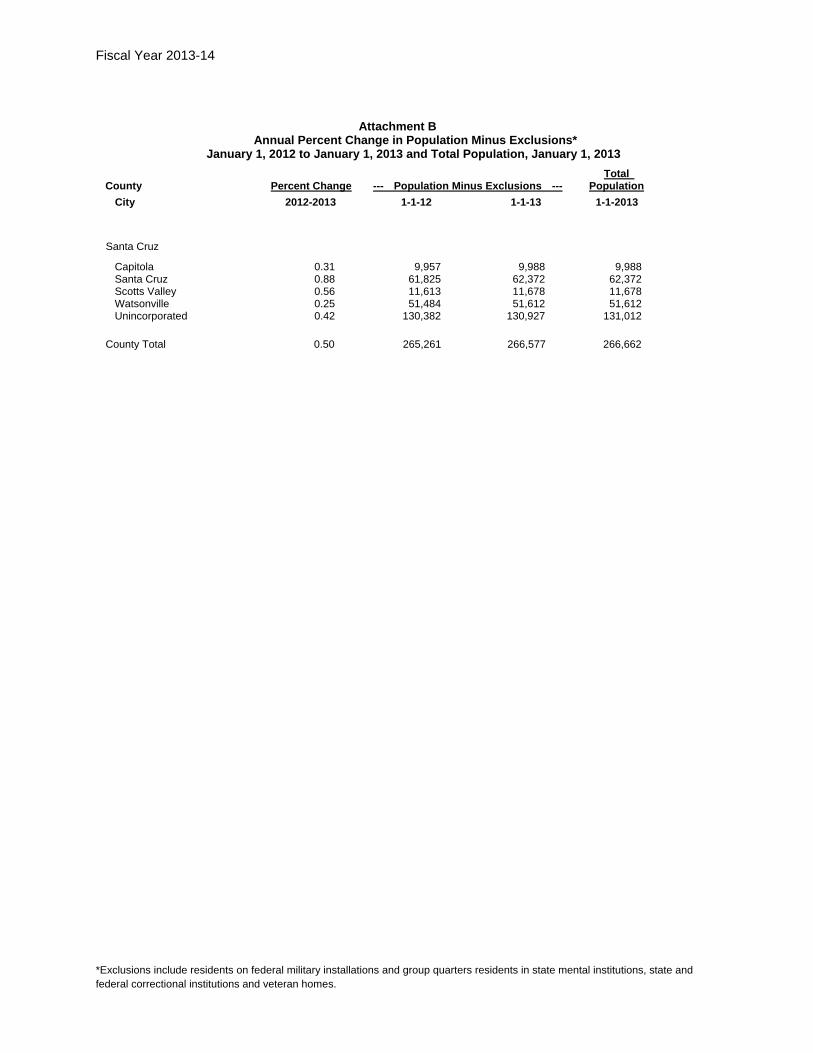
Santa Cruz
Capitola 0.31 9,957 9,988 9,988 Santa Cruz 0.88 61,825 62,372 62,372 Scotts Valley 0.56 11,613 11,678 11,678 Watsonville 0.25 51,484 51,612 51,612 Unincorporated 0.42 130,382 130,927 131,012
County Total 0.50 265,261 266,577 266,662

Fiscal Year 2013-14
*Exclusions include residents on federal military installations and group quarters residents in state mental institutions, state and federal correctional institutions and veteran homes.
Attachment B Annual Percent Change in Population Minus Exclusions* January 1, 2012 to January 1, 2013 and Total Population, January 1, 2013 Total County Percent Change --- Population Minus Exclusions --- Population City 2012-2013 1-1-12 1-1-13 1-1-2013
Shasta
Anderson 0.54 10,212 10,267 10,267 Redding 0.36 90,342 90,670 90,670 Shasta Lake 0.06 10,094 10,100 10,100 Unincorporated 0.18 67,337 67,456 67,564
County Total 0.29 177,985 178,493 178,601
Fiscal Year 2013-14
*Exclusions include residents on federal military installations and group quarters residents in state mental institutions, state and federal correctional institutions and veteran homes.
Attachment B Annual Percent Change in Population Minus Exclusions* January 1, 2012 to January 1, 2013 and Total Population, January 1, 2013 Total County Percent Change --- Population Minus Exclusions --- Population City 2012-2013 1-1-12 1-1-13 1-1-2013
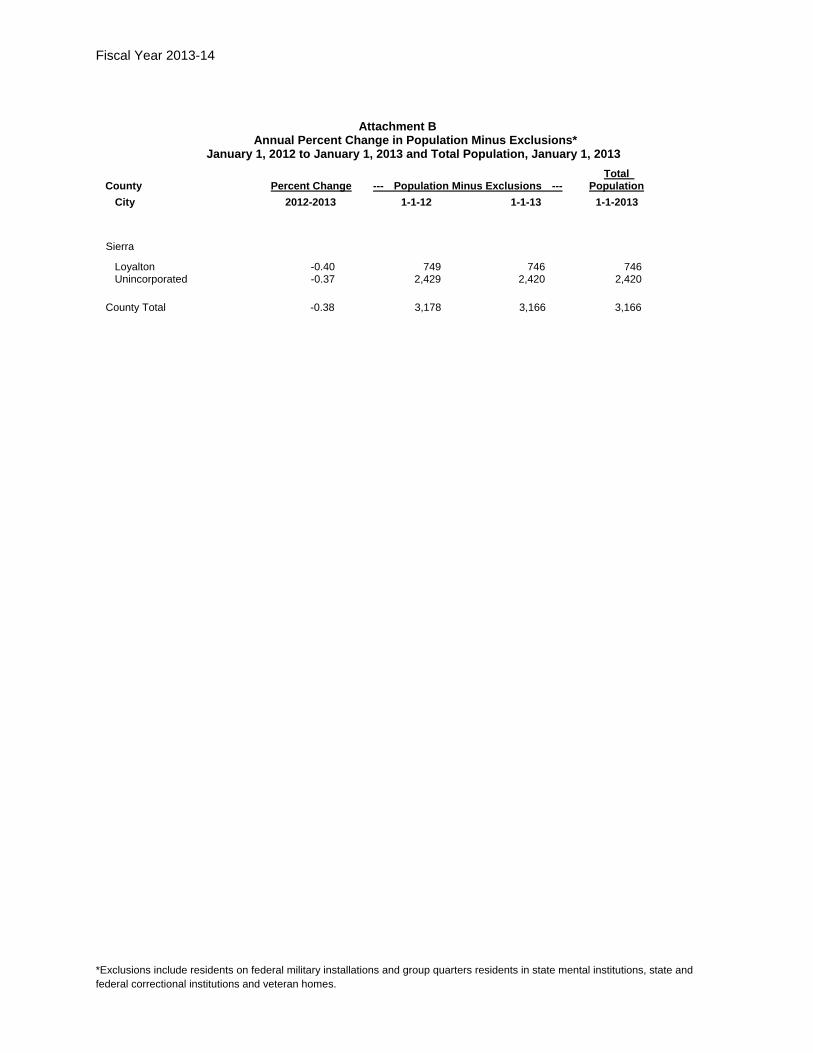
Sierra
Loyalton -0.40 749 746 746 Unincorporated -0.37 2,429 2,420 2,420
County Total -0.38 3,178 3,166 3,166

Fiscal Year 2013-14
*Exclusions include residents on federal military installations and group quarters residents in state mental institutions, state and federal correctional institutions and veteran homes.
Attachment B Annual Percent Change in Population Minus Exclusions* January 1, 2012 to January 1, 2013 and Total Population, January 1, 2013 Total County Percent Change --- Population Minus Exclusions --- Population City 2012-2013 1-1-12 1-1-13 1-1-2013
Siskiyou
Dorris -0.21 931 929 929 Dunsmuir -0.18 1,633 1,630 1,630 Etna -0.27 733 731 731 Fort Jones 0.40 746 749 749 Montague -0.07 1,429 1,428 1,428 Mount Shasta -0.21 3,367 3,360 3,360 Tulelake -0.20 1,002 1,000 1,000 Weed -0.20 2,970 2,964 2,964 Yreka -0.12 7,780 7,771 7,771 Unincorporated 0.12 24,130 24,158 24,234
County Total 0.00 44,721 44,720 44,796

Fiscal Year 2013-14
*Exclusions include residents on federal military installations and group quarters residents in state mental institutions, state and federal correctional institutions and veteran homes.
Attachment B Annual Percent Change in Population Minus Exclusions* January 1, 2012 to January 1, 2013 and Total Population, January 1, 2013 Total County Percent Change --- Population Minus Exclusions --- Population City 2012-2013 1-1-12 1-1-13 1-1-2013
Solano
Benicia 0.41 27,053 27,163 27,163 Dixon 0.41 18,373 18,449 18,449 Fairfield 1.28 102,271 103,581 108,207 Rio Vista 1.93 7,455 7,599 7,599 Suisun City 0.42 28,117 28,234 28,234 Vacaville 0.80 85,520 86,205 92,677 Vallejo 0.53 116,496 117,112 117,112 Unincorporated 0.47 18,063 18,148 18,946
County Total 0.78 403,348 406,491 418,387

Fiscal Year 2013-14
*Exclusions include residents on federal military installations and group quarters residents in state mental institutions, state and federal correctional institutions and veteran homes.
Attachment B Annual Percent Change in Population Minus Exclusions* January 1, 2012 to January 1, 2013 and Total Population, January 1, 2013 Total County Percent Change --- Population Minus Exclusions --- Population City 2012-2013 1-1-12 1-1-13 1-1-2013
Sonoma
Cloverdale 0.32 8,641 8,669 8,669 Cotati 0.33 7,286 7,310 7,310 Healdsburg 0.45 11,458 11,509 11,509 Petaluma 0.96 58,245 58,804 58,804 Rohnert Park 0.32 40,902 41,034 41,034 Santa Rosa 0.61 169,070 170,093 170,093 Sebastopol 0.40 7,415 7,445 7,445 Sonoma 0.48 10,680 10,731 10,731 Windsor 0.34 27,041 27,132 27,132 Unincorporated 0.55 145,560 146,364 147,696
County Total 0.57 486,298 489,091 490,423
Fiscal Year 2013-14
*Exclusions include residents on federal military installations and group quarters residents in state mental institutions, state and federal correctional institutions and veteran homes.
Attachment B Annual Percent Change in Population Minus Exclusions* January 1, 2012 to January 1, 2013 and Total Population, January 1, 2013 Total County Percent Change --- Population Minus Exclusions --- Population City 2012-2013 1-1-12 1-1-13 1-1-2013
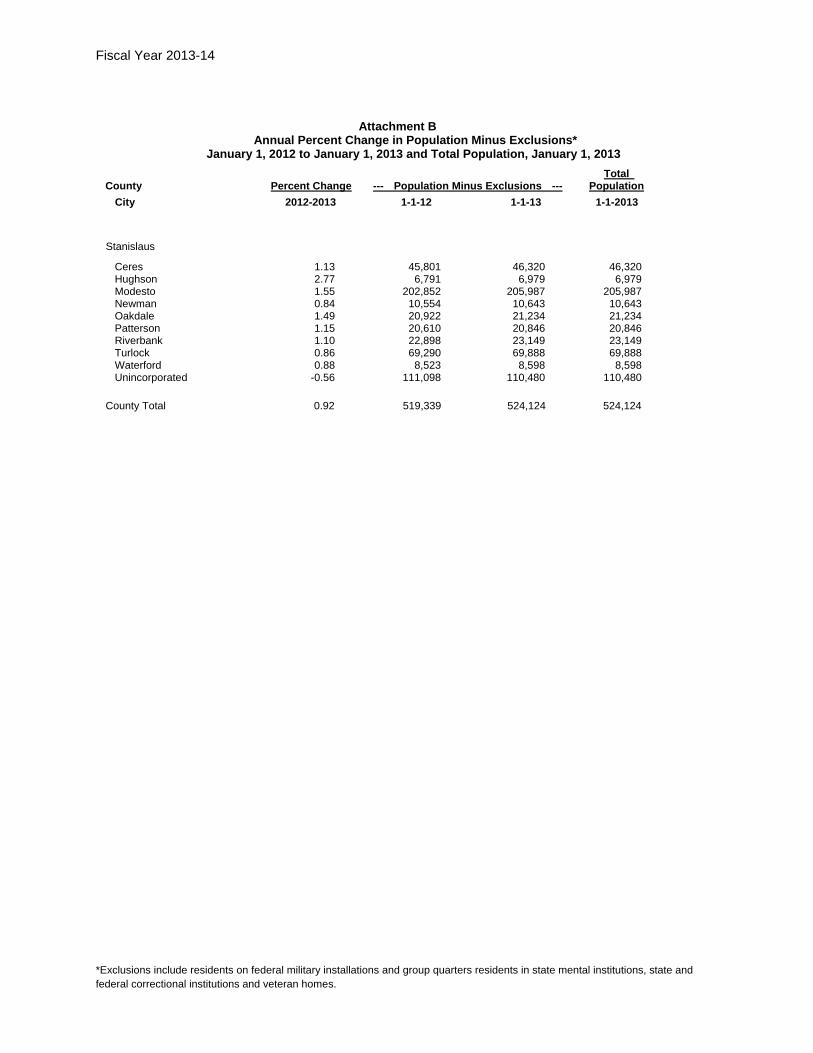
Stanislaus
Ceres 1.13 45,801 46,320 46,320 Hughson 2.77 6,791 6,979 6,979 Modesto 1.55 202,852 205,987 205,987 Newman 0.84 10,554 10,643 10,643 Oakdale 1.49 20,922 21,234 21,234 Patterson 1.15 20,610 20,846 20,846 Riverbank 1.10 22,898 23,149 23,149 Turlock 0.86 69,290 69,888 69,888 Waterford 0.88 8,523 8,598 8,598 Unincorporated -0.56 111,098 110,480 110,480
County Total 0.92 519,339 524,124 524,124

Fiscal Year 2013-14
*Exclusions include residents on federal military installations and group quarters residents in state mental institutions, state and federal correctional institutions and veteran homes.
Attachment B Annual Percent Change in Population Minus Exclusions* January 1, 2012 to January 1, 2013 and Total Population, January 1, 2013 Total County Percent Change --- Population Minus Exclusions --- Population City 2012-2013 1-1-12 1-1-13 1-1-2013
Sutter
Live Oak 1.08 8,252 8,341 8,341 Yuba City 0.77 65,336 65,841 65,841 Unincorporated 0.64 21,531 21,669 21,669
County Total 0.77 95,119 95,851 95,851

Fiscal Year 2013-14
*Exclusions include residents on federal military installations and group quarters residents in state mental institutions, state and federal correctional institutions and veteran homes.
Attachment B Annual Percent Change in Population Minus Exclusions* January 1, 2012 to January 1, 2013 and Total Population, January 1, 2013 Total County Percent Change --- Population Minus Exclusions --- Population City 2012-2013 1-1-12 1-1-13 1-1-2013
Tehama
Corning 0.16 7,617 7,629 7,629 Red Bluff 0.70 14,087 14,186 14,186 Tehama 0.24 418 419 419 Unincorporated 0.62 41,084 41,339 41,538
County Total 0.58 63,206 63,573 63,772
Fiscal Year 2013-14
*Exclusions include residents on federal military installations and group quarters residents in state mental institutions, state and federal correctional institutions and veteran homes.
Attachment B Annual Percent Change in Population Minus Exclusions* January 1, 2012 to January 1, 2013 and Total Population, January 1, 2013 Total County Percent Change --- Population Minus Exclusions --- Population City 2012-2013 1-1-12 1-1-13 1-1-2013
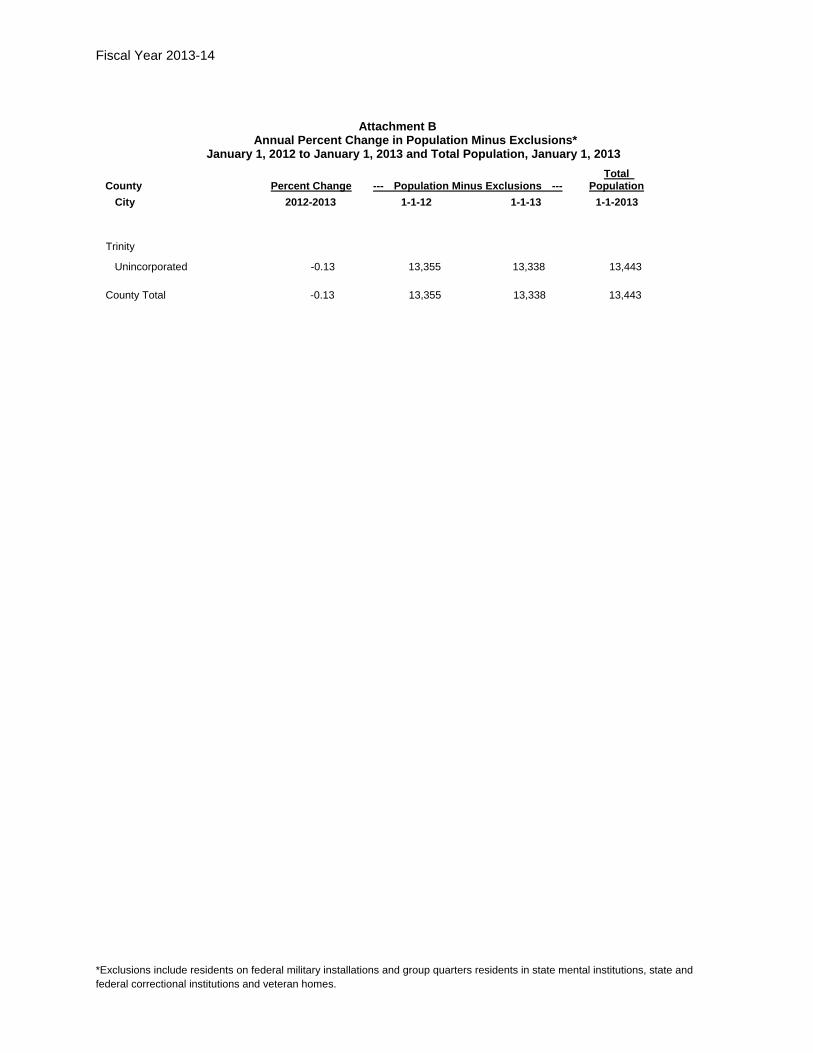
Trinity
Unincorporated -0.13 13,355 13,338 13,443
County Total -0.13 13,355 13,338 13,443

Fiscal Year 2013-14
*Exclusions include residents on federal military installations and group quarters residents in state mental institutions, state and federal correctional institutions and veteran homes.
Attachment B Annual Percent Change in Population Minus Exclusions* January 1, 2012 to January 1, 2013 and Total Population, January 1, 2013 Total County Percent Change --- Population Minus Exclusions --- Population City 2012-2013 1-1-12 1-1-13 1-1-2013
Tulare
Dinuba 1.91 22,649 23,082 23,082 Exeter 0.46 10,439 10,487 10,487 Farmersville 0.42 10,841 10,886 10,886 Lindsay 0.77 12,281 12,376 12,376 Porterville 0.65 54,681 55,038 55,490 Tulare 0.79 60,722 61,199 61,199 Visalia 1.09 127,061 128,443 128,443 Woodlake 3.75 7,388 7,665 7,665 Unincorporated 0.70 144,867 145,885 145,971
County Total 0.92 450,929 455,061 455,599

Fiscal Year 2013-14
*Exclusions include residents on federal military installations and group quarters residents in state mental institutions, state and federal correctional institutions and veteran homes.
Attachment B Annual Percent Change in Population Minus Exclusions* January 1, 2012 to January 1, 2013 and Total Population, January 1, 2013 Total County Percent Change --- Population Minus Exclusions --- Population City 2012-2013 1-1-12 1-1-13 1-1-2013
Tuolumne
Sonora -0.06 4,850 4,847 4,847 Unincorporated 0.18 46,393 46,475 49,513
County Total 0.15 51,243 51,322 54,360

Fiscal Year 2013-14
*Exclusions include residents on federal military installations and group quarters residents in state mental institutions, state and federal correctional institutions and veteran homes.
Attachment B Annual Percent Change in Population Minus Exclusions* January 1, 2012 to January 1, 2013 and Total Population, January 1, 2013 Total County Percent Change --- Population Minus Exclusions --- Population City 2012-2013 1-1-12 1-1-13 1-1-2013
Ventura
Camarillo 0.51 66,094 66,428 66,428 Fillmore 0.67 15,074 15,175 15,175 Moorpark 0.70 34,660 34,904 34,904 Ojai 0.64 7,500 7,548 7,548 Oxnard 0.71 199,446 200,855 200,855 Port Hueneme 1.06 19,466 19,673 22,024 San Buenaventura 1.53 106,608 108,234 108,294 Santa Paula 0.71 29,741 29,953 29,953 Simi Valley 0.67 124,725 125,558 125,558 Thousand Oaks 0.56 127,431 128,143 128,143 Unincorporated 0.35 93,854 94,181 96,554
County Total 0.73 824,599 830,652 835,436

Fiscal Year 2013-14
*Exclusions include residents on federal military installations and group quarters residents in state mental institutions, state and federal correctional institutions and veteran homes.
Attachment B Annual Percent Change in Population Minus Exclusions* January 1, 2012 to January 1, 2013 and Total Population, January 1, 2013 Total County Percent Change --- Population Minus Exclusions --- Population City 2012-2013 1-1-12 1-1-13 1-1-2013
Yolo
Davis 1.05 65,783 66,471 66,471 West Sacramento 1.21 49,855 50,460 50,460 Winters 0.81 6,918 6,974 6,974 Woodland 1.12 56,275 56,908 56,908 Unincorporated -1.30 25,518 25,186 25,186
County Total 0.81 204,349 205,999 205,999

Fiscal Year 2013-14
*Exclusions include residents on federal military installations and group quarters residents in state mental institutions, state and federal correctional institutions and veteran homes.
Attachment B Annual Percent Change in Population Minus Exclusions* January 1, 2012 to January 1, 2013 and Total Population, January 1, 2013 Total County Percent Change --- Population Minus Exclusions --- Population City 2012-2013 1-1-12 1-1-13 1-1-2013
Yuba
Marysville 1.17 12,108 12,250 12,250 Wheatland 0.66 3,470 3,493 3,493 Unincorporated 1.14 55,391 56,023 57,696
County Total 1.12 70,969 71,766 73,439
Fiscal Year 2013-14
*Exclusions include residents on federal military installations and group quarters residents in state mental institutions, state and federal correctional institutions and veteran homes.
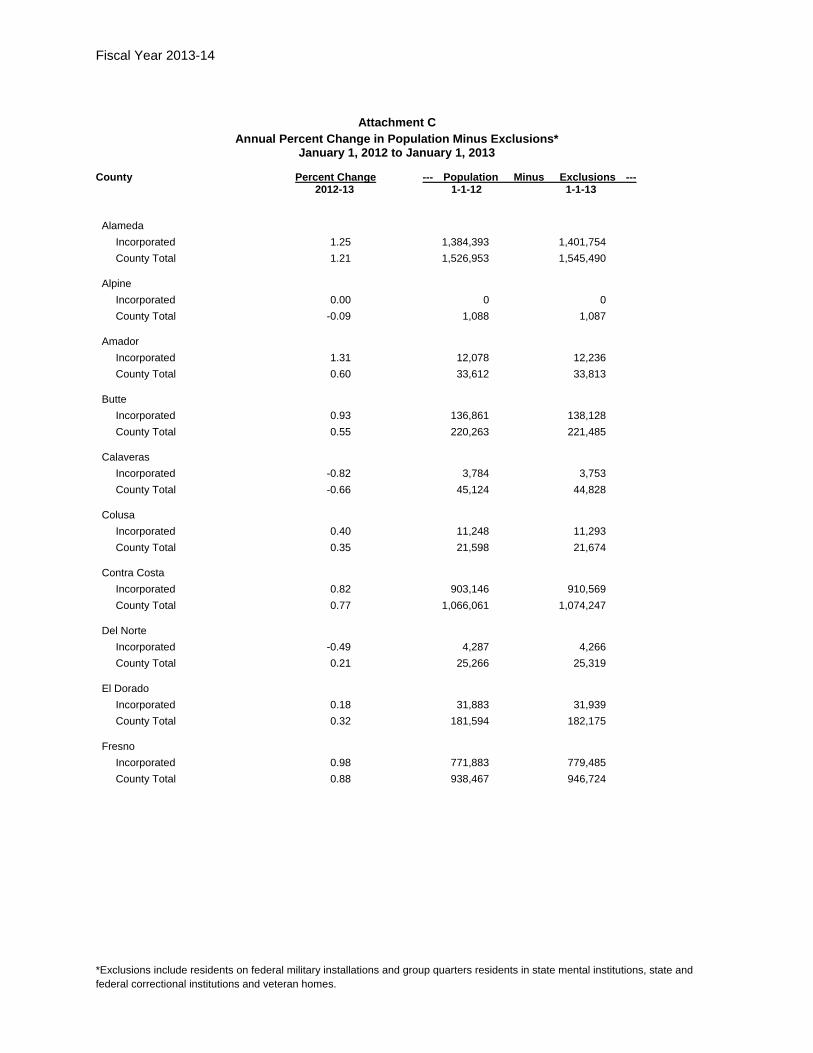
Attachment C Annual Percent Change in Population Minus Exclusions* January 1, 2012 to January 1, 2013
County Percent Change --- Population Minus Exclusions --- 2012-13 1-1-12 1-1-13
Alameda Incorporated 1.25 1,384,393 1,401,754 County Total 1.21 1,526,953 1,545,490
Alpine Incorporated 0.00 0 0 County Total -0.09 1,088 1,087
Amador Incorporated 1.31 12,078 12,236 County Total 0.60 33,612 33,813
Butte Incorporated 0.93 136,861 138,128 County Total 0.55 220,263 221,485
Calaveras Incorporated -0.82 3,784 3,753 County Total -0.66 45,124 44,828
Colusa Incorporated 0.40 11,248 11,293 County Total 0.35 21,598 21,674
Contra Costa Incorporated 0.82 903,146 910,569 County Total 0.77 1,066,061 1,074,247
Del Norte Incorporated -0.49 4,287 4,266 County Total 0.21 25,266 25,319
El Dorado Incorporated 0.18 31,883 31,939 County Total 0.32 181,594 182,175
Fresno Incorporated 0.98 771,883 779,485 County Total 0.88 938,467 946,724
Fiscal Year 2013-14
*Exclusions include residents on federal military installations and group quarters residents in state mental institutions, state and federal correctional institutions and veteran homes.
Attachment C Annual Percent Change in Population Minus Exclusions* January 1, 2012 to January 1, 2013
County Percent Change --- Population Minus Exclusions --- 2012-13 1-1-12 1-1-13
Glenn Incorporated 0.65 13,698 13,787 County Total 0.47 28,116 28,247
Humboldt Incorporated 0.24 62,942 63,096 County Total 0.37 134,506 135,010
Imperial Incorporated 1.44 137,037 139,004 County Total 1.40 170,490 172,870
Inyo Incorporated 0.03 3,876 3,877 County Total 0.18 18,431 18,464
Kern Incorporated 1.24 521,812 528,279 County Total 1.11 822,954 832,126
Kings Incorporated 1.30 101,507 102,822 County Total 1.20 128,416 129,956
Lake Incorporated 0.11 19,884 19,905 County Total 0.20 64,305 64,435
Lassen Incorporated 2.06 9,304 9,496 County Total 1.87 24,626 25,087
Los Angeles Incorporated 1.03 8,817,728 8,908,540 County Total 0.69 9,879,254 9,947,906
Madera Incorporated 0.95 74,494 75,199 County Total 0.72 146,360 147,408
Fiscal Year 2013-14
*Exclusions include residents on federal military installations and group quarters residents in state mental institutions, state and federal correctional institutions and veteran homes.
Attachment C Annual Percent Change in Population Minus Exclusions* January 1, 2012 to January 1, 2013
County Percent Change --- Population Minus Exclusions --- 2012-13 1-1-12 1-1-13
Marin Incorporated 0.45 185,651 186,479 County Total 0.42 248,608 249,652
Mariposa Incorporated 0.00 0 0 County Total 0.44 17,852 17,931
Mendocino Incorporated 0.26 28,644 28,718 County Total 0.41 87,750 88,112
Merced Incorporated 0.93 169,183 170,751 County Total 0.93 258,491 260,898
Modoc Incorporated -0.54 2,769 2,754 County Total -0.19 9,433 9,415
Mono Incorporated 0.45 8,270 8,307 County Total 0.55 14,282 14,361
Monterey Incorporated 0.85 299,137 301,667 County Total 0.81 399,930 403,167
Napa Incorporated 0.48 110,262 110,788 County Total 0.47 135,539 136,174
Nevada Incorporated -0.11 31,679 31,644 County Total -0.35 97,279 96,938
Orange Incorporated 0.79 2,937,140 2,960,463 County Total 0.78 3,056,919 3,080,859
Fiscal Year 2013-14
*Exclusions include residents on federal military installations and group quarters residents in state mental institutions, state and federal correctional institutions and veteran homes.
Attachment C Annual Percent Change in Population Minus Exclusions* January 1, 2012 to January 1, 2013
County Percent Change --- Population Minus Exclusions --- 2012-13 1-1-12 1-1-13
Placer Incorporated 0.72 245,959 247,724 County Total 0.56 355,455 357,463
Plumas Incorporated -0.44 2,048 2,039 County Total -0.28 19,698 19,643
Riverside Incorporated 1.14 1,865,131 1,886,380 County Total 1.01 2,222,466 2,244,853
Sacramento Incorporated 1.03 867,351 876,284 County Total 0.96 1,427,262 1,440,941
San Benito Incorporated 1.02 37,604 37,989 County Total 0.95 56,137 56,669
San Bernardino Incorporated 0.89 1,741,806 1,757,281 County Total 0.85 2,027,285 2,044,617
San Diego Incorporated 0.83 2,605,607 2,627,324 County Total 0.80 3,054,217 3,078,711
San Francisco Incorporated 1.08 816,079 824,870 County Total 1.08 816,079 824,870
San Joaquin Incorporated 0.88 550,642 555,501 County Total 0.95 689,194 695,749
San Luis Obispo Incorporated 0.60 151,338 152,247 County Total 0.52 264,557 265,930
Fiscal Year 2013-14
*Exclusions include residents on federal military installations and group quarters residents in state mental institutions, state and federal correctional institutions and veteran homes.
Attachment C Annual Percent Change in Population Minus Exclusions* January 1, 2012 to January 1, 2013
County Percent Change --- Population Minus Exclusions --- 2012-13 1-1-12 1-1-13
San Mateo Incorporated 1.10 664,601 671,881 County Total 1.09 727,548 735,484
Santa Barbara Incorporated 0.55 288,018 289,611 County Total 0.71 419,220 422,215
Santa Clara Incorporated 1.60 1,727,466 1,755,154 County Total 1.57 1,812,694 1,841,236
Santa Cruz Incorporated 0.57 134,879 135,650 County Total 0.50 265,261 266,577
Shasta Incorporated 0.35 110,648 111,037 County Total 0.29 177,985 178,493
Sierra Incorporated -0.40 749 746 County Total -0.38 3,178 3,166
Siskiyou Incorporated -0.14 20,591 20,562 County Total 0.00 44,721 44,720
Solano Incorporated 0.79 385,285 388,343 County Total 0.78 403,348 406,491
Sonoma Incorporated 0.58 340,738 342,727 County Total 0.57 486,298 489,091
Stanislaus Incorporated 1.32 408,241 413,644 County Total 0.92 519,339 524,124

Fiscal Year 2013-14
*Exclusions include residents on federal military installations and group quarters residents in state mental institutions, state and federal correctional institutions and veteran homes.
Attachment C Annual Percent Change in Population Minus Exclusions* January 1, 2012 to January 1, 2013
County Percent Change --- Population Minus Exclusions --- 2012-13 1-1-12 1-1-13
Sutter Incorporated 0.81 73,588 74,182 County Total 0.77 95,119 95,851
Tehama Incorporated 0.51 22,122 22,234 County Total 0.58 63,206 63,573
Trinity Incorporated 0.00 0 0 County Total -0.13 13,355 13,338
Tulare Incorporated 1.02 306,062 309,176 County Total 0.92 450,929 455,061
Tuolumne Incorporated -0.06 4,850 4,847 County Total 0.15 51,243 51,322
Ventura Incorporated 0.78 730,745 736,471 County Total 0.73 824,599 830,652
Yolo Incorporated 1.11 178,831 180,813 County Total 0.81 204,349 205,999
Yuba Incorporated 1.06 15,578 15,743 County Total 1.12 70,969 71,766