Embed Size (px)
Citation preview

Dear colleagues,
This is a real-virtual presentation, as I am not presentand apologize for this.
Many thanks to Stephane for presenting to youthis short overview of the OISO project that could beassociated to KEOPS next year.
If you have any question or comment regarding theOISO results, please send me a mail.
I wish you an interesting and productive meeting
A bientotNicolas
around 50S, here near Kerfix,, the ocean is not always calm as we wish(font screen, as of 19/1/04) and oceanographic operations have to be stopped)
Réunion KEOPS, 2-3 Mars 2004, Endoume
OISO, recall objectivessome are also underlined in KEOPS
Climatology of the Carbon Cycle: C3
Study of the pCO2, DIC, TA, C13... variability (seasonal to interannual)Estimate the air-sea CO2 fluxes at regional and large scalesEstimate the anthropogenic carbon in the oceanToward a robust validation of ocean carbon models (IGBP/OCMIP)Contraints for atmospheric inversions (e.g. frame of Kyoto Protocole)
Coupling Carbon Cycle and Climate Change: C5
Study of the decadal air-sea CO2 fluxes and anthropogenic evolutionUnderstanding processes that explain ocean CO2 variability associated to climatic signal(e.g. warm/cold events)
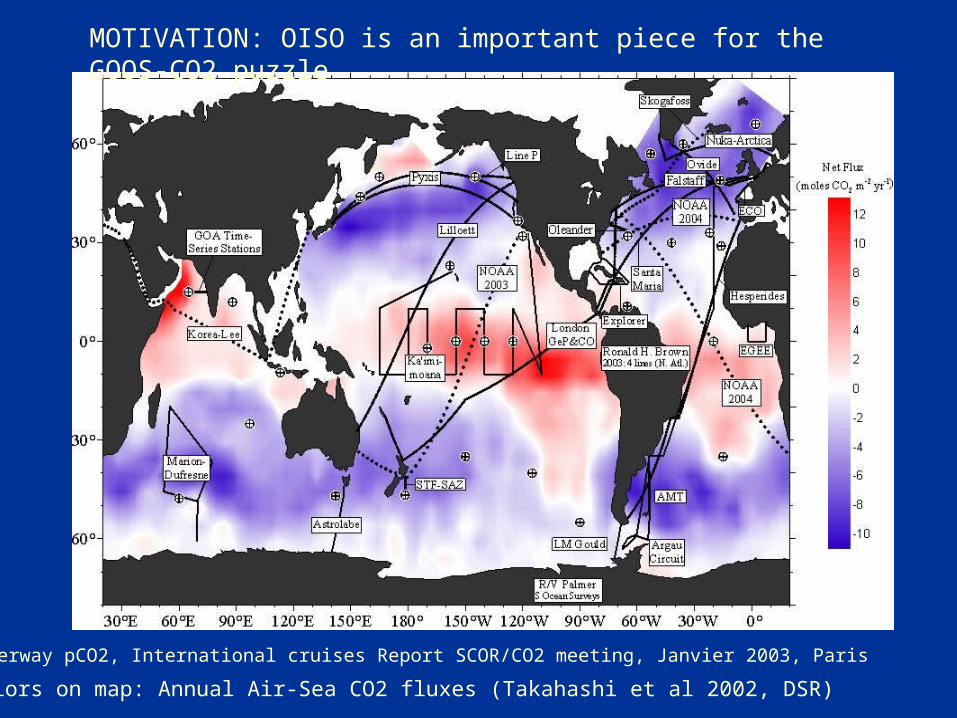
MOTIVATION: OISO is an important piece for the GOOS-CO2 puzzle
Underway pCO2, International cruises Report SCOR/CO2 meeting, Janvier 2003, Paris
Colors on map: Annual Air-Sea CO2 fluxes (Takahashi et al 2002, DSR)

MOTIVATION: Futur Long-term variations of air-sea CO2 fluxa view from a coupled model IPSL:
OPA-HAMOCC3-LMD-SLAVE -IS92a (L.Bopp)
2090-1990
Large changes would occur in the Southern Ocean; why ?
Diff Air-Sea Flux in mol/m2/year

-15
-10
-5
0
5
10
15
0 2 4 6 8 10 12 14
Month
Mo
d C
O2
Flu
x (
mm
ol/m
2/d
)
-0,08
-0,04
0,00
0,04
0,08
AIM
CO
2 f
lux
(P
gC
/mo
nth
)Mod-W92
Mod-WM99
AIM-90/97
OISO observations in summer and winter, and biogeochemical model indicate thatthe Southern Ocean is a CO2 sink during austral summer but a CO2 source during winter (Metzl et al., 2001, 2003).Therefore, the annual sink of 0.5 mol/m2/yr is low compared to previous estimates This explains why the CO2 sink is always low in the S.O. when calculation is based on atmospheric data (e.g. inversions, using GlobalView, Bousquet et al., 2000; Gurney et al 2002)
Comparing the view from the ocean (observations and models)and the view from the atmospheric inversion.
AIR-SEA CO2 FLUXES IN THE SOUTHERN OCEAN
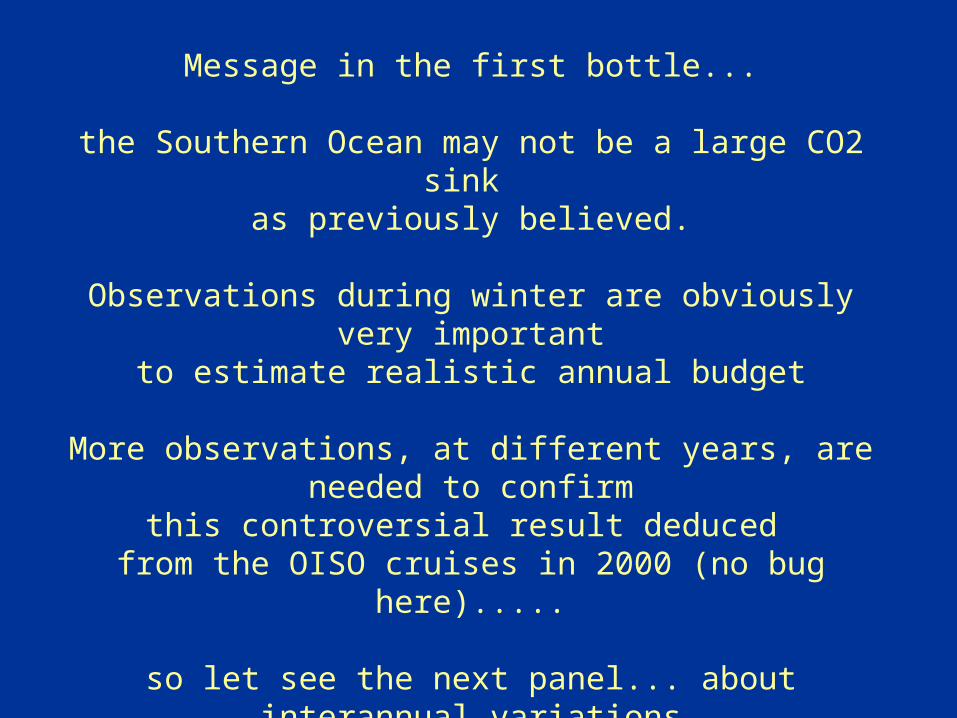
Message in the first bottle...
the Southern Ocean may not be a large CO2 sink as previously believed.
Observations during winter are obviously very importantto estimate realistic annual budget
More observations, at different years, are needed to confirmthis controversial result deduced
from the OISO cruises in 2000 (no bug here).....
so let see the next panel... about interannual variations
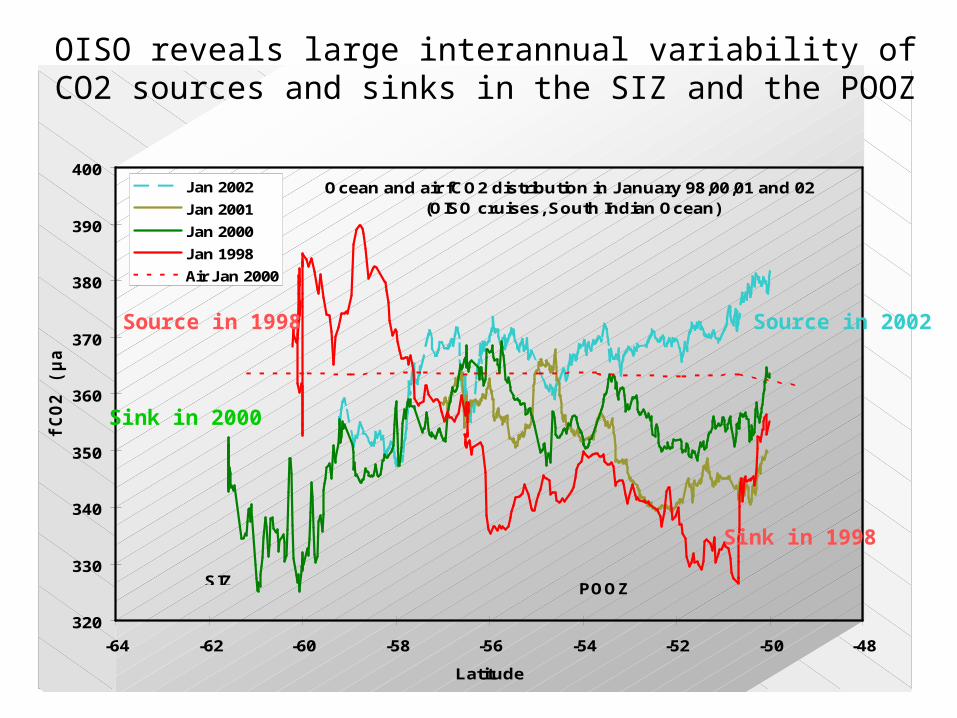
Ocean and air fCO2 distribution in January 98,00,01 and 02 (OISO cruises, South Indian Ocean)
320
330
340
350
360
370
380
390
400
-64 -62 -60 -58 -56 -54 -52 -50 -48
Latitude
fCO
2 (
µa
tm)
Jan 2002
Jan 2001
Jan 2000
Jan 1998
Air Jan 2000
POOZSIZ
Sink in 1998
Source in 2002
OISO reveals large interannual variability of CO2 sources and sinks in the SIZ and the POOZ
Sink in 2000
Source in 1998
Message in the second bottle...
The Southern Ocean may be a source, even during summer (e.g. 2002)
The large CO2 sink in 1998 in the POOZ was controled by high productivity and associated to a warm anomaly
(maybe related to 1997-ENSO through atmospheric bridge).
Very low silicates (<2 µM) and low CO2 around 50-57Ssuggests that production may not be limited in the POOZ
if clouds (and light) conditions are good enough: is the S.O. always HNLC ? not certain...
Keops and OISO in 2005 may help to understand this paradox.
For detail on this analysis see Jabaud-Jan et al, GBC in pressjust send me a couriel

Meso-scale processes: coupling SST, Fluo, fCO2 and ADCP datavery interesting to explain the air-sea CO2 flux variability
(Track Reunion-60°S, OISO-6, January 2001)
-100
-50
0
50
100
150
200
250
-60 -55 -50 -45 -40 -35
AD
CP
(U
)
0
50
100
150
200
flu
o
in the jet, fluo is low
north ker and south of the jet fluo is high
-100
-50
0
50
100
150
200
250
-60 -55 -50 -45 -40 -35
Latitude
AD
CP
(U
)
150
200
250
300
350
400
fCO
2s
(µ
atm
)
north ker and south of the jet fCO2 is low just south of the jet, fCO2 is high
-100
-50
0
50
100
150
200
250
-60 -55 -50 -45 -40 -35
AD
CP
(U
)
0
5
10
15
20
SS
T (
°C)
A strong jet, up to 2 m/s observed in the SAF
Message in the third bottle...
In the circumpolar front zone, the meso-scale dynamic (eddies, meanders, filament...) is certainly governing the high
variability of air-sea CO2 fluxes:
in Global Ocean models or in Climatologies,this scale is not resolved !
Details observations during several days in the same region,as will be performed during KEOPS, will help to understand the
relevant scales to parameterize the coupling of physical and biogeochemical processes.
we ’ll see more about this with the most recent observations....

Actualities..
Original painting, C.Verdier
OISO-11, in the frame of VIGO cruise: 2 January-10 February 2004
Original Paiting, Seawifs Chla Jan-04

Coupling dynamics, production and air-sea CO2 fluxes:During OISO-11, strong signals in the 40-45°S band
for both sea level anomaly and Chla
Sea-level anomaly, Jan 04SeaWIFS Chla, Jan 04
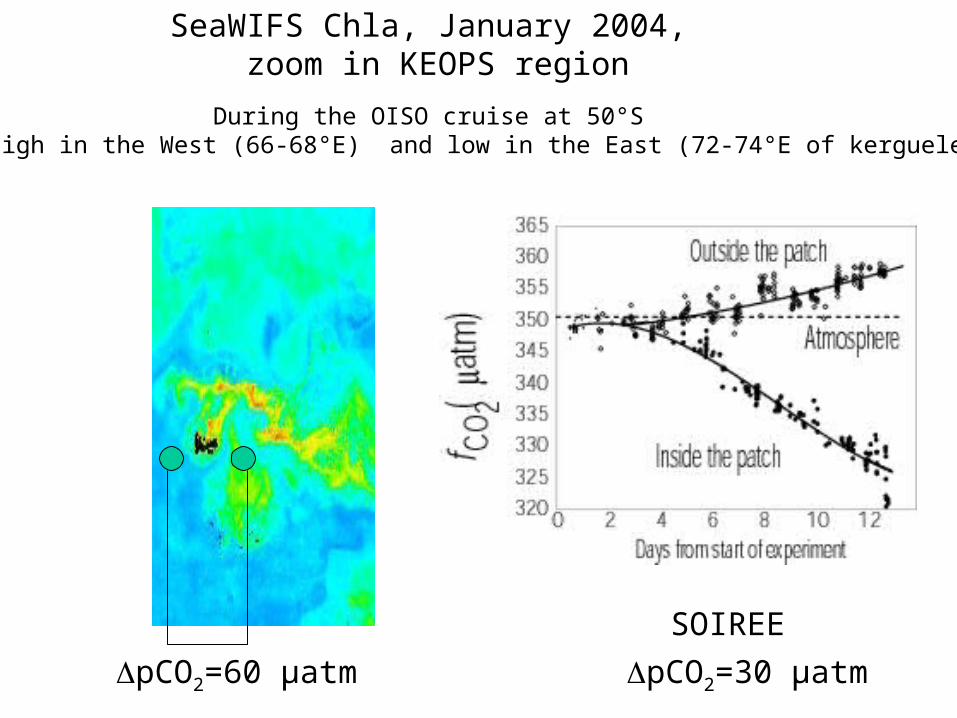
SeaWIFS Chla, January 2004, zoom in KEOPS region
During the OISO cruise at 50°S CO2 was high in the West (66-68°E) and low in the East (72-74°E of kerguelen
pCO2=60 µatm
SOIREE
pCO2=30 µatm

260
280
300
320
340
360
380
400
420
-65 -60 -55 -50 -45 -40 -35 -30 -25 -20 -15 -10
Latitude
fCO
2b
(µ
atm
)
0
10
20
30
40
50
60
70
80
Flu
o. (
rel.
un
it)
fCO2s btcorr
f luobrut
air env. 370
The large SLA and Chla signals around 40-45°Sare also clearly observed in all properties
measured onboard at the same period (Jan 1004)
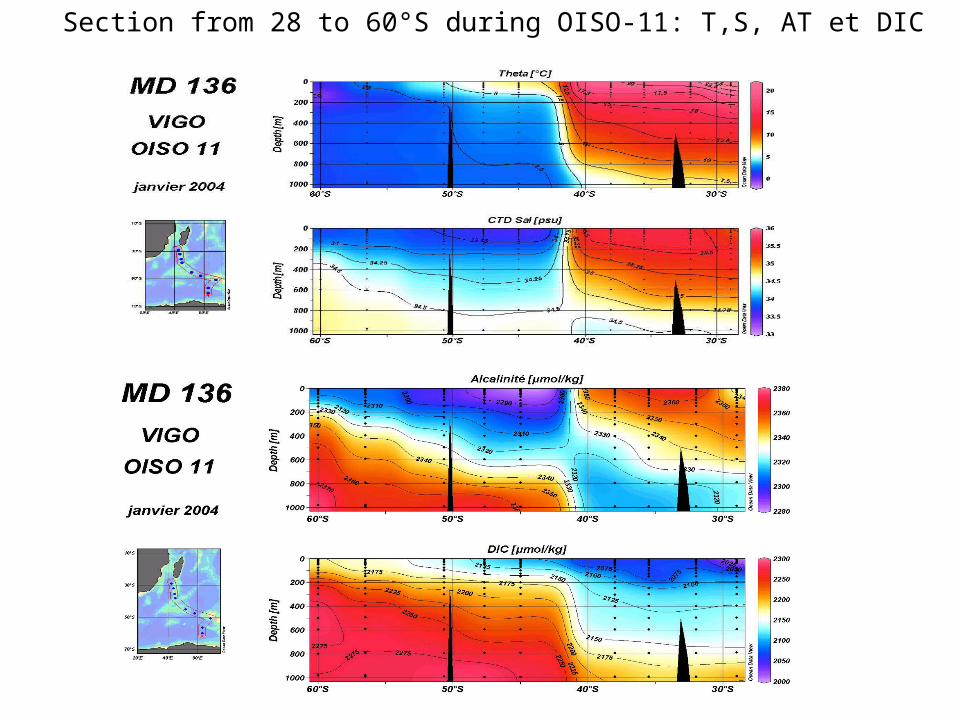
Section from 28 to 60°S during OISO-11: T,S, AT et DIC

Message in the fourth bottle...
Coupling in-situ and satellite data (altimetry and color of the sea)is a very important tool to understand what creates andmaintain the regional characteristics of ocean biogeochemistry
During KEOPS in January 2005, the availibility of bothaltimetry and sea-color onboard would be very helpful.
(the bloom South-East off Kerguelen, is not always present in the same sector)
Have a nice day,see you in Kerguelen...