Embed Size (px)
Citation preview
DEALTRACKER SERVICES DRIVING GROWTH
AUSTRALIAN M&A AND IPO MARKET INSIGHTS 2016
CONTENTS
3 INTRODUCTION
4 M&A DEAL VOLUMES
5 TOP 10 DEALS
7 AUSTRALIA’S M&A CORE
8 SECTOR COMPOSITION
10 THE BUYERS
12 TOP FIVE CROSS-BORDER INBOUND DEALS
13 INVESTMENT MANAGERS
14 VALUATION MULTIPLES: BY TARGET SIZE
16 VALUATION MULTIPLES: BY SECTOR
18 VALUATION MULTIPLES: DOMESTIC V INTERNATIONAL
19 VALUATION MULTIPLES: CORPORATE V INVESTMENT MANAGER
20 LISTED COMPANIES: SHARE PRICE PERFORMANCE
21 LISTED COMPANIES: EV/EBITDA TRADING MULTIPLES
22 IPO ACTIVITY: IN AUSTRALIA
23 IPO ACTIVITY: TRENDS AND VALUES
24 IPO ACTIVITY: LISTINGS
25 IPO SIZE BY SECTOR
26 TOP IPOS/SECTOR: SIX MONTHS TO 31 DECEMBER 2015
27 LISTING MULTIPLES AND IMMEDIATE PRICE RETURNS
28 PRIVATE EQUITY STORY
29 TIME TO SELL? GETTING MAXIMUM VALUE FOR YOUR BUSINESS
30 ABOUT GRANT THORNTON
32 ABOUT GRANT THORNTON CORPORATE FINANCE
34 METHODOLOGY
35 CONTACT GRANT THORNTON
Dealtracker 2016 3
WELCOME TO THE FOURTH EDITION OF DEALTRACKER, GRANT THORNTON AUSTRALIA’S ANALYSIS OF THE AUSTRALIAN MERGERS AND ACQUISITION (M&A) AND EQUITY MARKETS COVERING TRANSACTIONS DURING AN 18 MONTH PERIOD FROM 1 JULY 2014 TO 31 DECEMBER 2015, WITH ADDITIONAL ANALYSIS TO 31 MARCH 2016.
INTRODUCTION
While compiling this report, we’ve been able to reflect on what makes companies successful and ripe for acquisition. The data has shown that companies that have high growth and services, products or IP that is valuable on a global scale will receive above average EBITDA multiples on sale. This trend has been demonstrated this reporting period, with marginally higher multiples than recent years, driven by outperformance in the consumer discretionary, consumer staples and financial sectors.
Overseas buyers are also willing to pay higher multiples to secure premium assets. Australian food and beverage companies, in particular, are being acquired by international corporates for extremely strong valuation multiples as food security increases as a global concern.
Other themes revealed by the data are outlined briefly here, while further information is available in the body of the report.
STRONG DEAL ACTIVITY BUT WITH RECENT HEADWINDS
There was strong M&A activity from investment managers and corporate acquirers for the majority of the report period although Q12016 deal activity has contracted considerably. The surge in activity was driven by increases in the consumer discretionary and information technology sectors which have both benefited from the economic uptick and growth in capital expenditures.
GLOBAL AND DOMESTIC PLAYERS
The US and Canada were the largest offshore acquirers, with 41 per cent of all cross-border inbound transactions concentrated mainly on information and technology businesses. European buyers (32 per cent of transactions) sought Australian-based intellectual property (mainly industrial) while inbound Asian acquisitions accounted for 24 per cent of transactions (again, predominantly industrials). Consumer staples (10 per cent of transactions) expanded on the theme of Asian corporates acquiring Australian IP and expertise to leverage in their growing middle-class markets.
DOMESTIC BUYERS/TARGETS
As food security increases as a global concern, M&A in the consumer staples sector is growing. Notable mid-market deals were Tassal’s acquisition of GC & AC Holdings (formerly De Costi Seafoods), and Warrnambool Cheese and Butter Factory’s acquisition of Lion Dairy’s everyday cheese business unit.
Of the targets, the purchase of Five:AM Life (an organic yoghurt business) by PZ Cussons in August 2014, a London-based consumer products company, represents a further move into the Australian food mid-market for this LSE-listed business. Nudie Foods’ acquisition by Monde Nissin in early 2015 for $80 million adds to that company’s portfolio of Australian mid-market companies. Like many Asian companies buying into Australia, Monde plans to leverage its Asian distribution systems by taking these market-leading Australian brands into new markets. Lastly, Seafolly, a premium Australian fashion brand, was bought by L Capital Asia LLC a private equity fund for $100 million in late 2014. The deal will see Seafolly leverage the international reach of L Capital.
Meanwhile, the IPO markets have been buoyant up until 31 December 2015, with a 51 per cent increase in listed companies and a 26 per cent increase in the total value of funds raised compared to the prior period. However, this situation has been tempered by a more volatile equity market in Q1 2016 and the tightening of listing requirements by the ASX in recent weeks, which may lead to more subdued activity into CY2016.
Enjoy this latest edition of Dealtracker, and should further queries arise, contact your Grant Thornton advisor or those key contacts listed at the back of this report.
Dealtracker 20164
M&A DEAL VOLUMES
DEAL VOLUMES REMAIN STRONG AGAINST POST-GFC AVERAGES BUT RECENT ACTIVITY SEES THIS TREND MODERATING, DRIVEN BY RECENT ECONOMIC VOLATILITY AND AN UNCERTAIN BUSINESS ENVIRONMENT.
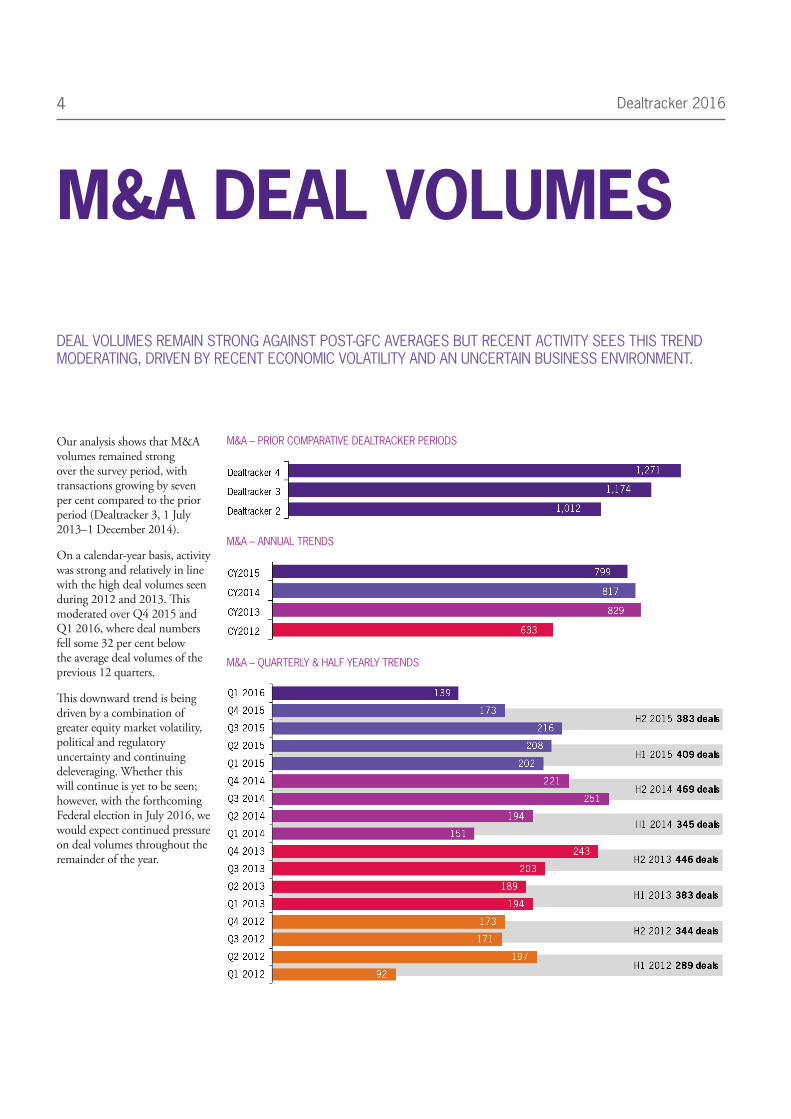
Our analysis shows that M&A volumes remained strong over the survey period, with transactions growing by seven per cent compared to the prior period (Dealtracker 3, 1 July 2013–1 December 2014).
On a calendar-year basis, activity was strong and relatively in line with the high deal volumes seen during 2012 and 2013. This moderated over Q4 2015 and Q1 2016, where deal numbers fell some 32 per cent below the average deal volumes of the previous 12 quarters.
This downward trend is being driven by a combination of greater equity market volatility, political and regulatory uncertainty and continuing deleveraging. Whether this will continue is yet to be seen; however, with the forthcoming Federal election in July 2016, we would expect continued pressure on deal volumes throughout the remainder of the year.
M&A – PRIOR COMPARATIVE DEALTRACKER PERIODS
M&A – ANNUAL TRENDS
M&A – QUARTERLY & HALF YEARLY TRENDS
Dealtracker 2016 5
TOP 10 DEALS
1
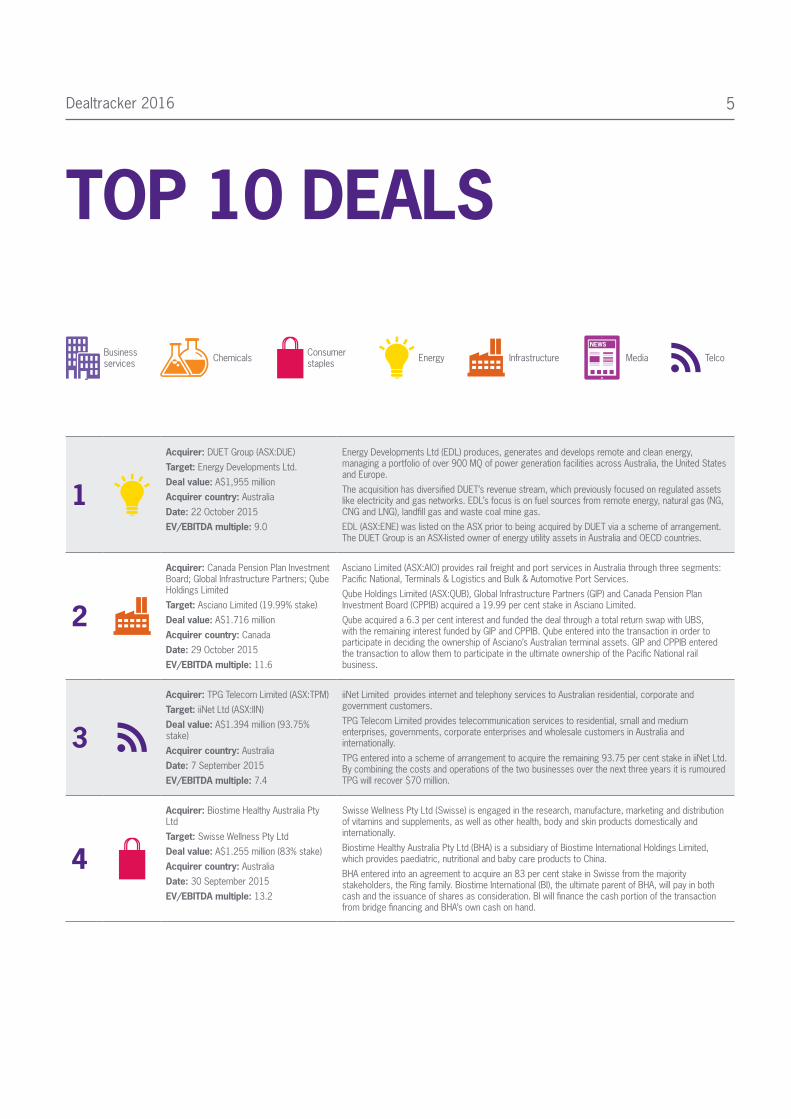
Acquirer: DUET Group (ASX:DUE)
Target: Energy Developments Ltd.
Deal value: A$1,955 million
Acquirer country: Australia
Date: 22 October 2015
EV/EBITDA multiple: 9.0
Energy Developments Ltd (EDL) produces, generates and develops remote and clean energy, managing a portfolio of over 900 MQ of power generation facilities across Australia, the United States and Europe.
The acquisition has diversified DUET’s revenue stream, which previously focused on regulated assets like electricity and gas networks. EDL’s focus is on fuel sources from remote energy, natural gas (NG, CNG and LNG), landfill gas and waste coal mine gas.
EDL (ASX:ENE) was listed on the ASX prior to being acquired by DUET via a scheme of arrangement. The DUET Group is an ASX-listed owner of energy utility assets in Australia and OECD countries.
2
Acquirer: Canada Pension Plan Investment Board; Global Infrastructure Partners; Qube Holdings Limited
Target: Asciano Limited (19.99% stake)
Deal value: A$1.716 million
Acquirer country: Canada
Date: 29 October 2015
EV/EBITDA multiple: 11.6
Asciano Limited (ASX:AIO) provides rail freight and port services in Australia through three segments: Pacific National, Terminals & Logistics and Bulk & Automotive Port Services.
Qube Holdings Limited (ASX:QUB), Global Infrastructure Partners (GIP) and Canada Pension Plan Investment Board (CPPIB) acquired a 19.99 per cent stake in Asciano Limited.
Qube acquired a 6.3 per cent interest and funded the deal through a total return swap with UBS, with the remaining interest funded by GIP and CPPIB. Qube entered into the transaction in order to participate in deciding the ownership of Asciano’s Australian terminal assets. GIP and CPPIB entered the transaction to allow them to participate in the ultimate ownership of the Pacific National rail business.
3
Acquirer: TPG Telecom Limited (ASX:TPM)
Target: iiNet Ltd (ASX:IIN)
Deal value: A$1.394 million (93.75% stake)
Acquirer country: Australia
Date: 7 September 2015
EV/EBITDA multiple: 7.4
iiNet Limited provides internet and telephony services to Australian residential, corporate and government customers.
TPG Telecom Limited provides telecommunication services to residential, small and medium enterprises, governments, corporate enterprises and wholesale customers in Australia and internationally.
TPG entered into a scheme of arrangement to acquire the remaining 93.75 per cent stake in iiNet Ltd. By combining the costs and operations of the two businesses over the next three years it is rumoured TPG will recover $70 million.
4
Acquirer: Biostime Healthy Australia Pty Ltd
Target: Swisse Wellness Pty Ltd
Deal value: A$1.255 million (83% stake)
Acquirer country: Australia
Date: 30 September 2015
EV/EBITDA multiple: 13.2
Swisse Wellness Pty Ltd (Swisse) is engaged in the research, manufacture, marketing and distribution of vitamins and supplements, as well as other health, body and skin products domestically and internationally.
Biostime Healthy Australia Pty Ltd (BHA) is a subsidiary of Biostime International Holdings Limited, which provides paediatric, nutritional and baby care products to China.
BHA entered into an agreement to acquire an 83 per cent stake in Swisse from the majority stakeholders, the Ring family. Biostime International (BI), the ultimate parent of BHA, will pay in both cash and the issuance of shares as consideration. BI will finance the cash portion of the transaction from bridge financing and BHA’s own cash on hand.
Business services Chemicals
Consumer staples
Energy InfrastructureNEWS
Media Telco

Dealtracker 20166
5
Acquirer: Vocus Communications Limited (ASX:VOC)
Target: Amcom Telecommunications Ltd
Deal value: A$785 million (This appears to be the full total but only the remaining 90% stake was purchased.)
Acquirer country: Australia
Date: 8 July 2015
EV/EBITDA multiple: 16.8
Amcom Telecommunications Limited (Amcom) operates as an IT and telecommunications company in Australia.
Vocus Communications Limited (Vocus) provides internet, fibre, data centre and unified communications in Australia and New Zealand. It owns and operates a global telecommunications network connecting Australia and New Zealand to the United States.
Vocus purchased the remaining 90 per cent of Amcom not previously owned through a scheme of arrangement. TPG had tried to block the scheme by taking a 19.9 per cent stake during negotiations but shareholders voted against the move.
The deal was funded through a group debt refinanced through a syndicated debt facility and underwritten by the Commonwealth Bank of Australia.
6NEWS
Acquirer: Village Roadshow Limited; Falcon Investment Advisors, LLC; Vine Alternative Investments LLC
Target: Village Roadshow Entertainment Group USA Inc
Deal value: A$677 million
Acquirer country: United States
Date: 14 September 2015
EV/EBITDA multiple: N/A
Village Roadshow Entertainment Group USA Inc (VRI) engages in movie and music production.
VRI received $480 million in its recapitalisation round of funding. The transaction consisted of preferred equity for proceeds of $155 million and subordinated debt for proceeds of $325 million.
A consortium of worldwide investors participated, including Vine Alternative Investments Group LLC and returning investors Falcon Investment Advisors LLC and Village Roadshow Limited (VRL).
Of the $325 million corporate debt financing, $25 million was subordinated debt financing repayable by September 2021. VRL invested $15 million.
The company converted existing VRL non-voting redeemable shares to preferred equity, with VRL retaining a 47.12 per cent stake in the company.
7NEWS
Acquirer: Affinity Equity Partners
Target: TEG Live (Nine Live Pty Ltd)
Deal value: A$640 million
Acquirer country: Hong Kong
Date: 31 July 2015
EV/EBITDA multiple: N/A
Affinity Equity Partners (Affinity) is a private equity firm specialising in leveraged buyouts, growth capital, the middle market and management buy-ins/outs.
Funds managed by Affinity acquired Nine Live Pty Ltd. from Nine Entertainment Co. Holdings Limited (Nine) (ASX:NEC). Under the terms of the agreement, Affinity and Nine also entered into contractual arrangements for preserving the respective commercial relationships and benefits that were obtained during Nine’s ownership of the Nine Live business.
The proceeds will be used to reduce group debt and fund an ongoing capital management program.
8
Acquirer: Programmed Maintenance Services Ltd (ASX:PRG)
Target: SKILLED Group Limited (ASX:SKE)
Deal value: A$582 million (97.6%)
Acquirer country: Australia
Date: 16 October 2015
EV/EBITDA multiple: 6.4
SKILLED Group Ltd (SKE) provides staffing and related solutions to the public and private sectors.
Programmed Maintenance Services Ltd (PRG) provides staffing, maintenance and facility management services primarily in Australia and New Zealand.
PRG entered into a scheme implementation agreement to acquire SKE, where SKE will own 2.4 per cent of the combined entity post-transaction.
9
Acquirer: Yara Australia Pty Ltd
Target: Apache Fertilisers Pty Ltd (NYSE:APA)
Deal value: A$552 million
Acquirer country: Australia
Date: 28 October 2015
EV/EBITDA multiple: N/A
Apache Fertilisers Pty Ltd (AF) is a subsidiary of Apache Corporation (Apache).
Yara Australia Pty Ltd (Yara) manufactures and markets mineral fertilisers for agricultural, horticultural and greenhouse applications and is a subsidiary of Norwegian-based Yara International.
Yara acquired AF, the final piece of Apache’s exit from Australia.
10
Acquirer: Crescent Capital Partners
Target: Cardno Limited (ASX:CDD) (41.09% stake)
Deal value: A$546 million
Acquirer country: Australia
Date: 2 November 2014
EV/EBITDA multiple: N/A
Cardno Limited (Cardno) is an infrastructure and environmental services company that provides professional services for the development and improvement of communities’ physical and social infrastructure.
Crescent Capital Partners Management Pty Ltd. is a private equity and venture capital firm specialising in middle market investments.
Crescent purchased Cardno to consolidate a previously held 19.9 per cent stake in Cardno. Crescent restructured the board as part of the deal and is likely to pursue further restructuring in the future.
Dealtracker 2016 7
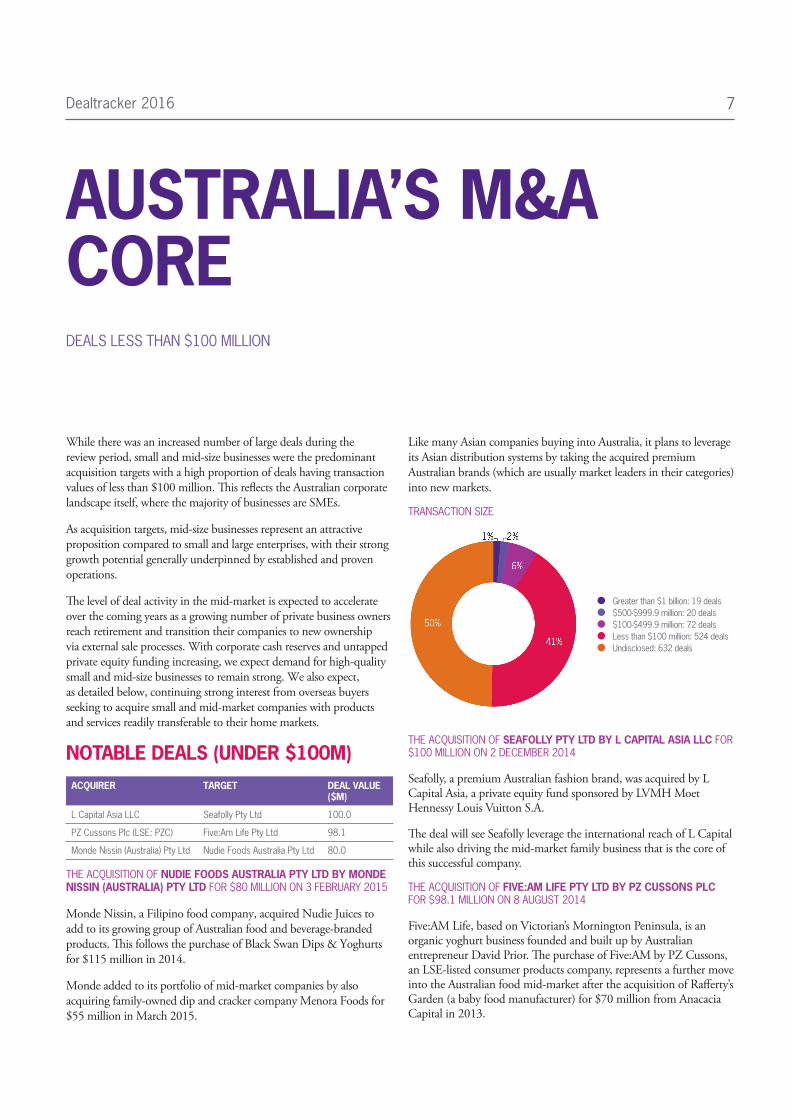
While there was an increased number of large deals during the review period, small and mid-size businesses were the predominant acquisition targets with a high proportion of deals having transaction values of less than $100 million. This reflects the Australian corporate landscape itself, where the majority of businesses are SMEs.
As acquisition targets, mid-size businesses represent an attractive proposition compared to small and large enterprises, with their strong growth potential generally underpinned by established and proven operations.
The level of deal activity in the mid-market is expected to accelerate over the coming years as a growing number of private business owners reach retirement and transition their companies to new ownership via external sale processes. With corporate cash reserves and untapped private equity funding increasing, we expect demand for high-quality small and mid-size businesses to remain strong. We also expect, as detailed below, continuing strong interest from overseas buyers seeking to acquire small and mid-market companies with products and services readily transferable to their home markets.
NOTABLE DEALS (UNDER $100M)ACQUIRER TARGET DEAL VALUE
($M)
L Capital Asia LLC Seafolly Pty Ltd 100.0
PZ Cussons Plc (LSE: PZC) Five:Am Life Pty Ltd 98.1
Monde Nissin (Australia) Pty Ltd Nudie Foods Australia Pty Ltd 80.0
THE ACQUISITION OF NUDIE FOODS AUSTRALIA PTY LTD BY MONDE NISSIN (AUSTRALIA) PTY LTD FOR $80 MILLION ON 3 FEBRUARY 2015
Monde Nissin, a Filipino food company, acquired Nudie Juices to add to its growing group of Australian food and beverage-branded products. This follows the purchase of Black Swan Dips & Yoghurts for $115 million in 2014.
Monde added to its portfolio of mid-market companies by also acquiring family-owned dip and cracker company Menora Foods for $55 million in March 2015.
AUSTRALIA’S M&A COREDEALS LESS THAN $100 MILLION
Like many Asian companies buying into Australia, it plans to leverage its Asian distribution systems by taking the acquired premium Australian brands (which are usually market leaders in their categories) into new markets.
TRANSACTION SIZE
Greater than $1 billion: 19 deals $500-$999.9 million: 20 deals $100-$499.9 million: 72 deals Less than $100 million: 524 deals Undisclosed: 632 deals
THE ACQUISITION OF SEAFOLLY PTY LTD BY L CAPITAL ASIA LLC FOR $100 MILLION ON 2 DECEMBER 2014
Seafolly, a premium Australian fashion brand, was acquired by L Capital Asia, a private equity fund sponsored by LVMH Moet Hennessy Louis Vuitton S.A.
The deal will see Seafolly leverage the international reach of L Capital while also driving the mid-market family business that is the core of this successful company.
THE ACQUISITION OF FIVE:AM LIFE PTY LTD BY PZ CUSSONS PLC FOR $98.1 MILLION ON 8 AUGUST 2014
Five:AM Life, based on Victorian’s Mornington Peninsula, is an organic yoghurt business founded and built up by Australian entrepreneur David Prior. The purchase of Five:AM by PZ Cussons, an LSE-listed consumer products company, represents a further move into the Australian food mid-market after the acquisition of Rafferty’s Garden (a baby food manufacturer) for $70 million from Anacacia Capital in 2013.

Dealtracker 20168
M&A – DEAL COMPOSITION BY SECTOR
Utilities Telecommunication
services Materials
Information technology Industrials Healthcare Financials
Energy Consumer staples Consumer discretionary
THE EXPECTED DECLINE IN RESOURCE SECTOR M&A HAS BEEN MORE THAN OFFSET BY STRONG GROWTH IN THE SERVICE RELATED SECTORS OF IT, CONSUMER DISCRETIONARY AND FINANCIAL SERVICES
Consistent with prior periods, the industrial sector remained the main focus of activity with 26 per cent of total deal flow, although this figure has since fallen.
The materials sector also saw a sharp decline in M&As, falling from 11 per cent of total deal volumes in the prior period to less than 3 per cent in the current period. This dropping off is closely linked to the depreciation of commodity prices over the same period and uncertainty surrounding future demand. Looking ahead, we expect the materials sector M&A to rebound as opportunistic corporates take advantage of low valuations and consolidate the market. We similarly expect private equity players to increasingly enter the market, looking for assets at reasonable prices as they decide that the market has finally bottomed. It should be noted, however, that the expected increase in activity will be muted compared to the 2011 rebound.
By way of contrast, the information technology and consumer discretionary sectors saw the greatest comparative increases, comprising 18 per cent and 23 per cent respectively of total M&A activity, compared to 15 per cent and 18 per cent in the prior period. This uplift correlates with the solid sector growth underway and the ongoing consolidation of what remains highly fragmented sectors.
Deal flow in the financial sector has also increased, albeit at a slower pace, driven by regulatory divestment of non-core assets, insurance sector shake-ups and an active fintech sub-sector. Together with new market entrants and consolidation, activity is expected to accelerate over the coming period.
THE CHANGING COMPOSITION OF M&A ACTIVITY REFLECTS THE ECONOMIC REBALANCING UNDERWAY, FROM RESOURCE-RELIANT TO DIVERSIFIED AND SERVICE-BASED.
SECTOR COMPOSITION
Dealtracker 2016 9
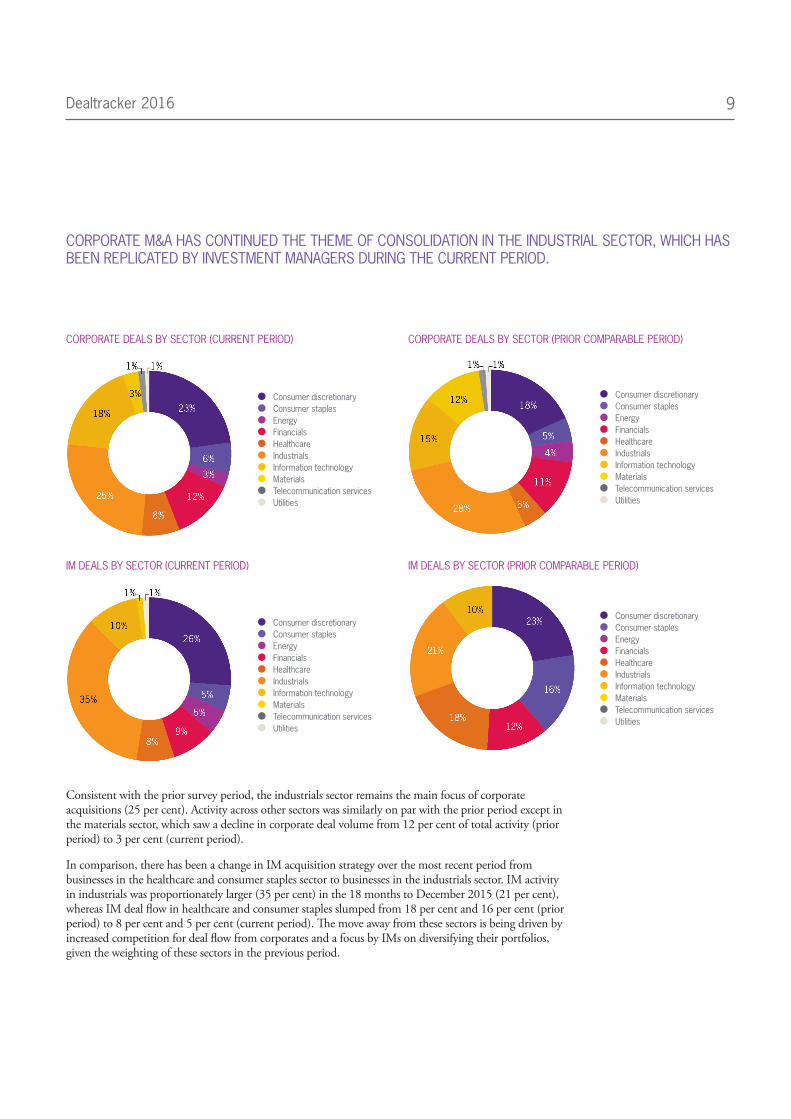
CORPORATE M&A HAS CONTINUED THE THEME OF CONSOLIDATION IN THE INDUSTRIAL SECTOR, WHICH HAS BEEN REPLICATED BY INVESTMENT MANAGERS DURING THE CURRENT PERIOD.
CORPORATE DEALS BY SECTOR (CURRENT PERIOD)
Consumer discretionary Consumer staples Energy Financials Healthcare Industrials Information technology Materials Telecommunication services Utilities
CORPORATE DEALS BY SECTOR (PRIOR COMPARABLE PERIOD)
Consumer discretionary Consumer staples Energy Financials Healthcare Industrials Information technology Materials Telecommunication services Utilities
IM DEALS BY SECTOR (CURRENT PERIOD)
Consumer discretionary Consumer staples Energy Financials Healthcare Industrials Information technology Materials Telecommunication services Utilities
IM DEALS BY SECTOR (PRIOR COMPARABLE PERIOD)
Consumer discretionary Consumer staples Energy Financials Healthcare Industrials Information technology Materials Telecommunication services Utilities
Consistent with the prior survey period, the industrials sector remains the main focus of corporate acquisitions (25 per cent). Activity across other sectors was similarly on par with the prior period except in the materials sector, which saw a decline in corporate deal volume from 12 per cent of total activity (prior period) to 3 per cent (current period).
In comparison, there has been a change in IM acquisition strategy over the most recent period from businesses in the healthcare and consumer staples sector to businesses in the industrials sector. IM activity in industrials was proportionately larger (35 per cent) in the 18 months to December 2015 (21 per cent), whereas IM deal flow in healthcare and consumer staples slumped from 18 per cent and 16 per cent (prior period) to 8 per cent and 5 per cent (current period). The move away from these sectors is being driven by increased competition for deal flow from corporates and a focus by IMs on diversifying their portfolios, given the weighting of these sectors in the previous period.
Dealtracker 201610
THE NUMBER OF ACTIVE INVESTMENT MANAGERS INCREASED OVER THE RECENT PERIOD OFF THE BACK OF STRONG DIVESTMENT ACTIVITY DURING 2014 AND 2015 AND THE CONTINUED AVAILABILITY OF FUNDING FOR SELECT MANAGERS.
THE BUYERS
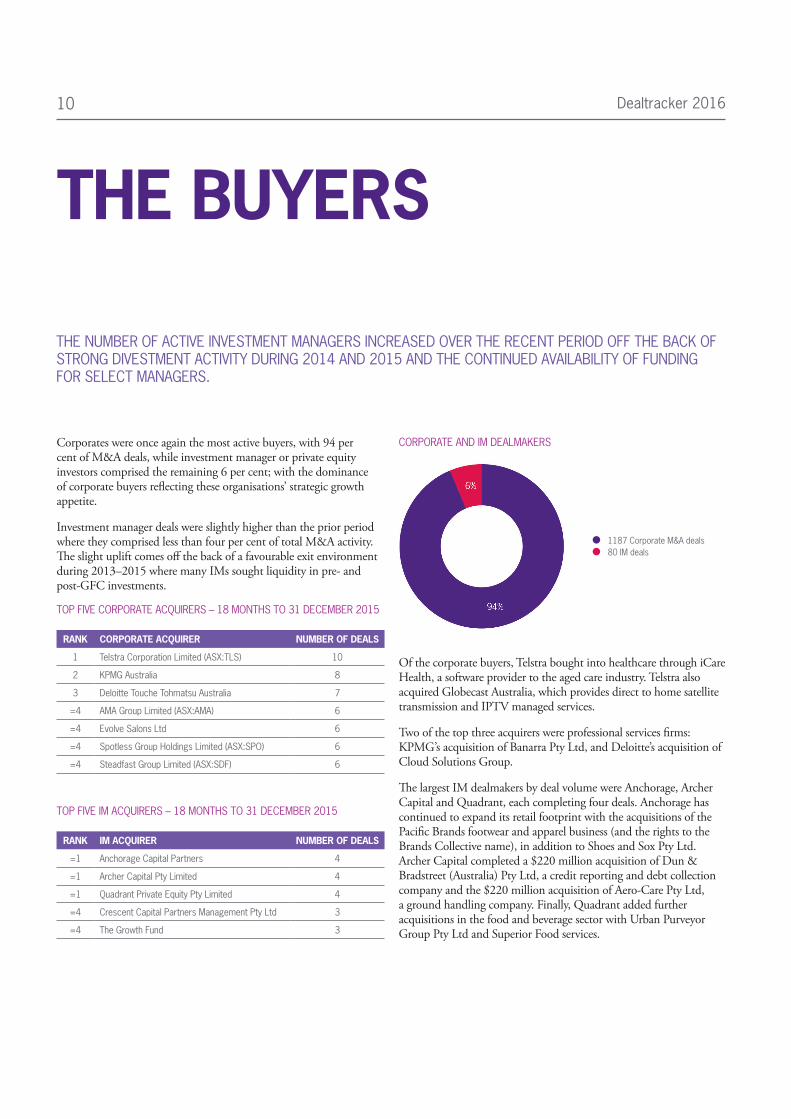
Corporates were once again the most active buyers, with 94 per cent of M&A deals, while investment manager or private equity investors comprised the remaining 6 per cent; with the dominance of corporate buyers reflecting these organisations’ strategic growth appetite.
Investment manager deals were slightly higher than the prior period where they comprised less than four per cent of total M&A activity. The slight uplift comes off the back of a favourable exit environment during 2013–2015 where many IMs sought liquidity in pre- and post-GFC investments.
TOP FIVE CORPORATE ACQUIRERS – 18 MONTHS TO 31 DECEMBER 2015
RANK CORPORATE ACQUIRER NUMBER OF DEALS
1 Telstra Corporation Limited (ASX:TLS) 10
2 KPMG Australia 8
3 Deloitte Touche Tohmatsu Australia 7
=4 AMA Group Limited (ASX:AMA) 6
=4 Evolve Salons Ltd 6
=4 Spotless Group Holdings Limited (ASX:SPO) 6
=4 Steadfast Group Limited (ASX:SDF) 6
TOP FIVE IM ACQUIRERS – 18 MONTHS TO 31 DECEMBER 2015
RANK IM ACQUIRER NUMBER OF DEALS
=1 Anchorage Capital Partners 4
=1 Archer Capital Pty Limited 4
=1 Quadrant Private Equity Pty Limited 4
=4 Crescent Capital Partners Management Pty Ltd 3
=4 The Growth Fund 3
CORPORATE AND IM DEALMAKERS
1187 Corporate M&A deals 80 IM deals
Of the corporate buyers, Telstra bought into healthcare through iCare Health, a software provider to the aged care industry. Telstra also acquired Globecast Australia, which provides direct to home satellite transmission and IPTV managed services.
Two of the top three acquirers were professional services firms: KPMG’s acquisition of Banarra Pty Ltd, and Deloitte’s acquisition of Cloud Solutions Group.
The largest IM dealmakers by deal volume were Anchorage, Archer Capital and Quadrant, each completing four deals. Anchorage has continued to expand its retail footprint with the acquisitions of the Pacific Brands footwear and apparel business (and the rights to the Brands Collective name), in addition to Shoes and Sox Pty Ltd. Archer Capital completed a $220 million acquisition of Dun & Bradstreet (Australia) Pty Ltd, a credit reporting and debt collection company and the $220 million acquisition of Aero-Care Pty Ltd, a ground handling company. Finally, Quadrant added further acquisitions in the food and beverage sector with Urban Purveyor Group Pty Ltd and Superior Food services.

Dealtracker 2016 11
OF TOTAL TRANSACTIONS WERE CROSS-BORDER CONDUCTED BY AN INTERNATIONAL ACQUIRER
26%International investment into Australia represented 26 per cent of total deal flow, which was on par with the prior period. The sustained interest from offshore buyers comes despite a comparative weakening of the Australian economy against other developed regions and the transition away from a resources-led economy. Despite these headwinds, Australia boasts relatively high stability and a low dollar against most major currencies, which continues to attract investors seeking growth.
INBOUND ACQUIRERS BY REGION
Asia Pacific: 79 deals Europe: 104 deals US and Canada: 134 deals Other: 11 deals
DEAL SECTOR BY ACQUIRER REGION
ALL DEALS
US & CANADA
EUROPE ASIA PACIFIC
Consumer discretionary 23% 24% 22% 24%
Consumer staples 6% 1% 6% 10%
Energy 3% 1% 4% 3%
Financials 12% 10% 5% 8%
Healthcare 7% 7% 9% 6%
Industrials 26% 24% 33% 32%
Information technology 18% 24% 16% 10%
Materials 3% 5% 6% 4%
Telco services 1% 1% - 1%
Utilities 1% 1% - 3%
Total 100% 100% 100% 100%
DOMESTIC Vs CROSS-BORDER TRANSACTIONS
Cross-border inbound: 329 deals Domestic: 909 deals Undisclosed: 29 deals
MEDIAN ENTERPRISE VALUE – DOMESTIC
$63MMEDIAN ENTERPRISE VALUE – CROSS-BORDER INBOUND
$149M
By individual region, the United States and Canada were the largest offshore acquirers, with 134 deals representing 41 per cent of total cross-border inbound transactions against the prior period figure of 37 per cent. The incremental uplift in North American interest was supported by a depreciating Australian dollar particularly during CY2015 where the currency fell around 30 per cent.
American and Canadian dealmakers were more heavily focused on information and technology businesses, with some 24 per cent of US and Canadian deals occurring in this sector compared to 18 per cent for the Australian region as a whole. The growing interest in Australian IT businesses supports the economic rebalancing underway in Australia and the country’s growing reputation as a technology hub.
Europe was the second largest contributor to inbound activity with 104 deals or 32 per cent of total cross-border inbound transactions. This level of interest was in line with the prior comparable period where the region accounted for 34 per cent of inbound deals. Approximately one third of European activity involved industrial business compared to 26 per cent across the board, driven by European participants seeking Australian-based IP and access to higher-growth Asian markets.
Despite its proximity, inbound activity from Asia-Pacific ranked third with 79 deals or 24 per cent of total inbound transactions. This level of activity was on par with the prior comparable period. Asia-Pacific acquirers were heavily weighted to Australian industrial businesses (32 per cent of transactions) along with consumer staples (10 per cent of transactions). This continues the theme of Asian corporates looking to acquire Australian IP and expertise to leverage into their growing middle class consumer markets, with food security a notable theme.
Higher regional weightings when compared to the general market (all deals).
Dealtracker 201612
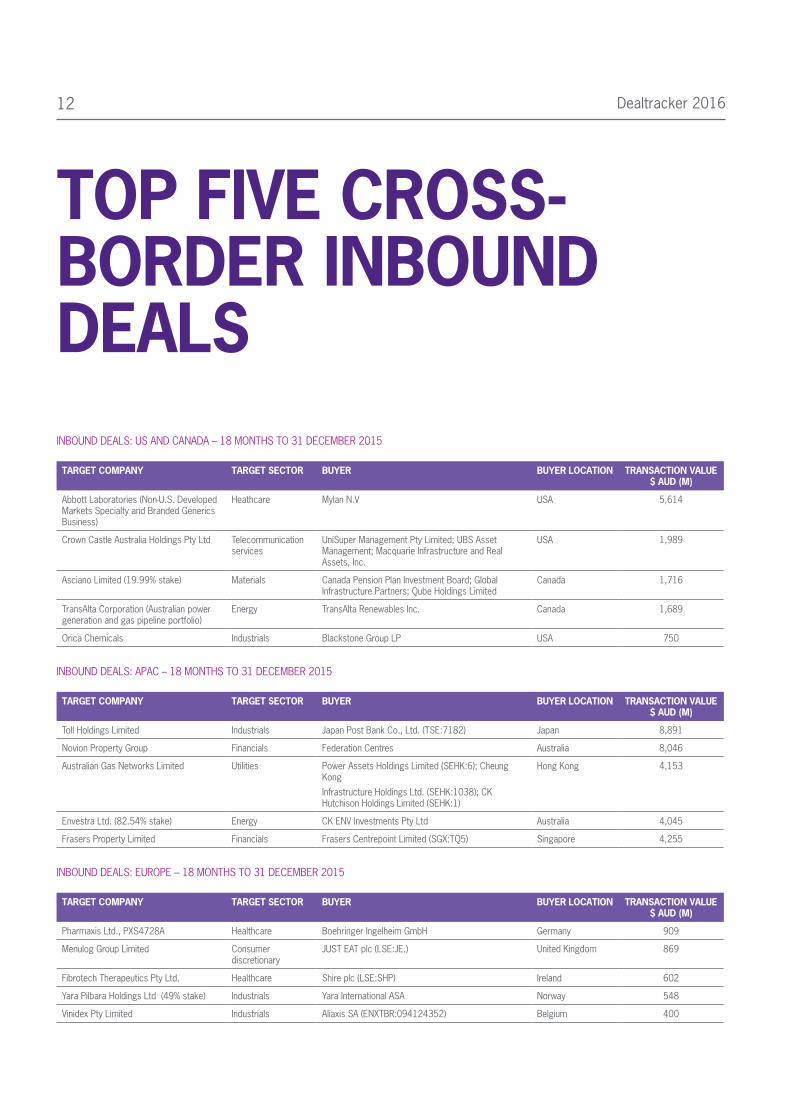
TOP FIVE CROSS-BORDER INBOUND DEALSINBOUND DEALS: US AND CANADA – 18 MONTHS TO 31 DECEMBER 2015
TARGET COMPANY TARGET SECTOR BUYER BUYER LOCATION TRANSACTION VALUE $ AUD (M)
Abbott Laboratories (Non-U.S. Developed Markets Specialty and Branded Generics Business)
Heathcare Mylan N.V USA 5,614
Crown Castle Australia Holdings Pty Ltd Telecommunication services
UniSuper Management Pty Limited; UBS Asset Management; Macquarie Infrastructure and Real Assets, Inc.
USA 1,989
Asciano Limited (19.99% stake) Materials Canada Pension Plan Investment Board; Global Infrastructure Partners; Qube Holdings Limited
Canada 1,716
TransAlta Corporation (Australian power generation and gas pipeline portfolio)
Energy TransAlta Renewables Inc. Canada 1,689
Orica Chemicals Industrials Blackstone Group LP USA 750
INBOUND DEALS: APAC – 18 MONTHS TO 31 DECEMBER 2015
TARGET COMPANY TARGET SECTOR BUYER BUYER LOCATION TRANSACTION VALUE $ AUD (M)
Toll Holdings Limited Industrials Japan Post Bank Co., Ltd. (TSE:7182) Japan 8,891
Novion Property Group Financials Federation Centres Australia 8,046
Australian Gas Networks Limited Utilities Power Assets Holdings Limited (SEHK:6); Cheung Kong
Infrastructure Holdings Ltd. (SEHK:1038); CK Hutchison Holdings Limited (SEHK:1)
Hong Kong 4,153
Envestra Ltd. (82.54% stake) Energy CK ENV Investments Pty Ltd Australia 4,045
Frasers Property Limited Financials Frasers Centrepoint Limited (SGX:TQ5) Singapore 4,255
INBOUND DEALS: EUROPE – 18 MONTHS TO 31 DECEMBER 2015
TARGET COMPANY TARGET SECTOR BUYER BUYER LOCATION TRANSACTION VALUE $ AUD (M)
Pharmaxis Ltd., PXS4728A Healthcare Boehringer Ingelheim GmbH Germany 909
Menulog Group Limited Consumer discretionary
JUST EAT plc (LSE:JE.) United Kingdom 869
Fibrotech Therapeutics Pty Ltd. Healthcare Shire plc (LSE:SHP) Ireland 602
Yara Pilbara Holdings Ltd (49% stake) Industrials Yara International ASA Norway 548
Vinidex Pty Limited Industrials Aliaxis SA (ENXTBR:094124352) Belgium 400

Dealtracker 2016 13
THE RECENT PERIOD COVERED BY THIS REPORT SAW IM DEAL ACTIVITY REBOUND FROM SUBDUED LEVELS IN CY2012 AND CY2013.
INVESTMENT MANAGERS
While the consolidation theme of local IM managers continues, a combination of more international funds, the emergence of deal-by-deal investor clubs and family office participants has increased IM activity. In addition, local closed-end fund participants have undertaken a number of successful capital raisings recently, following a flurry of exits in CY2013 and CY2014. Notwithstanding the increased activity levels in Q4 2015 and Q1 2016, IM entries have experienced a similar decline to wider market deal volumes, which we expect to be a theme for the remainder of CY2016.
IM ENTRIES – PRIOR DEALTRACKER PERIODS
IM ENTRIES - ANNUAL TRENDS
IM ENTRIES - QUARTERLY AND HALF-YEARLY TRENDS
Sources: S&P Capital IQ, Mergermarket
GIVEN THE CONTINUED AVAILABILITY OF CAPITAL AND THE INTERNATIONALISATION OF IM MANDATES, WE EXPECT IMs TO CONTINUE AS ACTIVE PARTICIPANTS IN LOCAL ACQUISITION OPPORTUNITIES.

Dealtracker 201614
OUR ANALYSIS SHOWS, ONCE AGAIN, THAT SIZE IS A DETERMINATE OF VALUE, WITH LARGER BUSINESSES GENERALLY TRANSACTING AT HIGHER MULTIPLES THAN SMALLER BUSINESSES. NOTWITHSTANDING THIS, EACH TARGET’S GROWTH PROSPECTS APPEARS TO BE THE KEY VALUE DRIVER, WITH BUSINESSES OPERATING IN WEAK INDUSTRIES TRADING AT SIGNIFICANTLY LOWER MULTIPLES THAN SMALLER BUSINESSES IN STRONG GROWTH SECTORS.
VALUATION MULTIPLES: BY TARGET SIZE
DISTRIBUTION OF DEALS WITH VALUATION MULTIPLES: 96 DEALS
REVENUE RANGE NUMBER OF DEALS
CURRENT DEALTRACKER
THIRD DEALTRACKER
SECOND DEALTRACKER
FIRST DEALTRACKER
MEDIAN EV/EBITDA MULTIPLES
Less than $20m 27 5.5 5.5 4.9 6.1
$20m to $50m 13 8.8 6.7 6.1 6.5
$50m to $100m 16 6.1 8.0 7.0 7.9
$100m to $200m 15 10.8 7.8 8.7 7.5
$200m to $500m 8 8.5 8.8 7.0 8.7
Over $500m 17 10.9 7.1 8.9 9.8
Median (overall) 7.8 7.3 7.5 7.5
Total 96
Businesses are often valued on a multiple of EBITDA. EBITDA is typically used as a measure of earnings for valuation purposes because it reflects the financial performance of the business prior to taking into account how it is funded.
A multiple of EBITDA provides an enterprise value (EV) of the business (i.e. the value of the business before deducting net debt). The multiples included in the above table are based on the most recent financial statements prior to the transaction and accordingly, don’t necessarily factor in forecast profit, which is built into deal valuations.
As expected, larger business achieved higher EBITDA multiples than smaller businesses. This is because larger businesses typically have a more stable and consistent earnings base compared to smaller businesses.
Dealtracker 2016 15
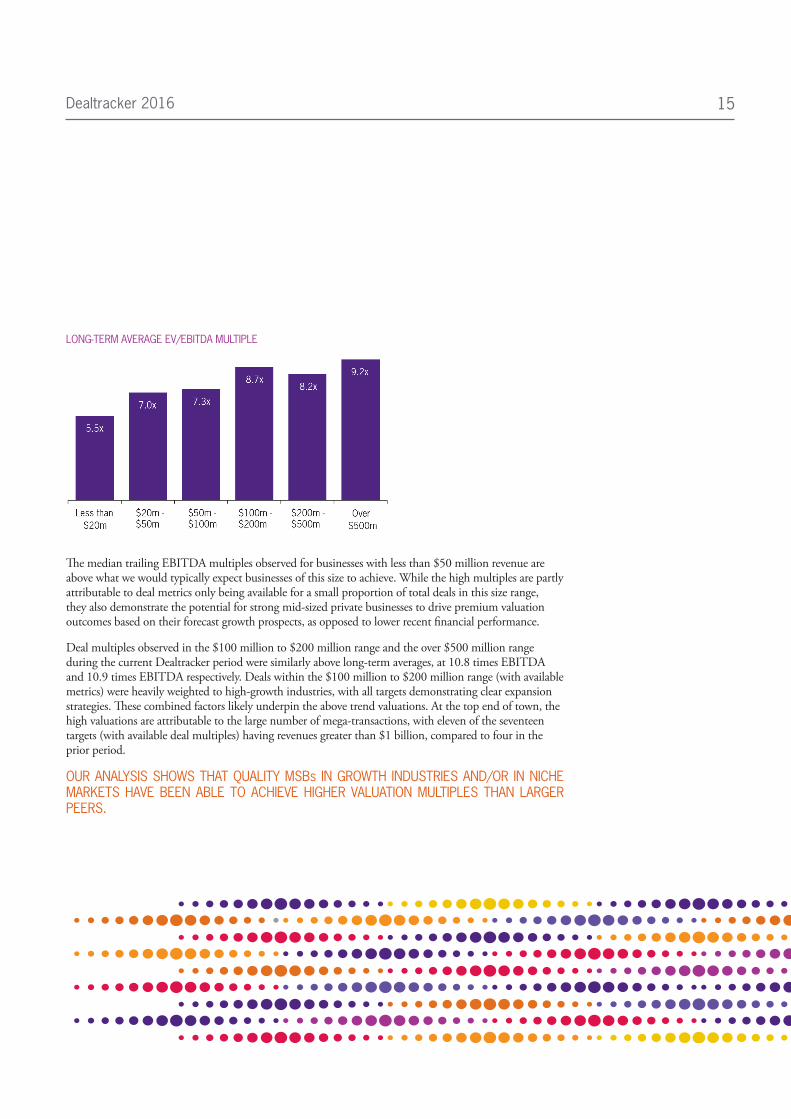
LONG-TERM AVERAGE EV/EBITDA MULTIPLE
The median trailing EBITDA multiples observed for businesses with less than $50 million revenue are above what we would typically expect businesses of this size to achieve. While the high multiples are partly attributable to deal metrics only being available for a small proportion of total deals in this size range, they also demonstrate the potential for strong mid-sized private businesses to drive premium valuation outcomes based on their forecast growth prospects, as opposed to lower recent financial performance.
Deal multiples observed in the $100 million to $200 million range and the over $500 million range during the current Dealtracker period were similarly above long-term averages, at 10.8 times EBITDA and 10.9 times EBITDA respectively. Deals within the $100 million to $200 million range (with available metrics) were heavily weighted to high-growth industries, with all targets demonstrating clear expansion strategies. These combined factors likely underpin the above trend valuations. At the top end of town, the high valuations are attributable to the large number of mega-transactions, with eleven of the seventeen targets (with available deal multiples) having revenues greater than $1 billion, compared to four in the prior period.
OUR ANALYSIS SHOWS THAT QUALITY MSBs IN GROWTH INDUSTRIES AND/OR IN NICHE MARKETS HAVE BEEN ABLE TO ACHIEVE HIGHER VALUATION MULTIPLES THAN LARGER PEERS.

Dealtracker 201616
OVERALL EV/EBITDA MULTIPLES OBSERVED DURING THIS DEALTRACKER PERIOD WERE MARGINALLY HIGHER THAN RECENT YEARS, DRIVEN BY OUTPERFORMANCE IN THE CONSUMER DISCRETIONARY, CONSUMER STAPLES AND FINANCIAL SECTORS.
VALUATION MULTIPLES: BY SECTOR
TRANSACTIONS AND VALUATION MULTIPLES PER TARGET SECTOR: 96 DEALS
REVENUE RANGE NUMBER OF DEALS
MEDIAN EV MEDIAN TARGET
REVENUE
MEDIAN TARGET EBITDA
CURRENT DEALTRACKER
THIRD DEALTRACKER
SECOND DEALTRACKER
FIRST DEALTRACKER
(A$MILLION) MEDIAN EV/EBITDA MULTIPLES
Consumer discretionary 20 31 77 5 8.7x 6.9x 7.5x 8.9x
Consumer staples 8 117 163 17 14.2x 10.9x 9.8x 8.5x
Energy 3 1,139 507 121 12.2x 6.3x 5.1x 6.4x
Financial 8 334 120 31 10.7x 9.0x 10.8x 7.4x
Healthcare 10 47 25 6 8.3x 8.5x 8.6x 10.9x
Industrials 26 47 53 8 5.1x 5.7x 6.1x 7.9x
Information technology 12 23 31 3 6.9x 7.3x 7.7x 5.6x
Materials 3 750 1,145 98 7.7x 5.9x 8.1x 7.5x
Telecommunication services 3 763 168 46 7.4x 12.6x 7.0x 5.7x
Utilities 3 1,916 540 213 11.7x 19.5x 6.2x 7.9x
Median (overall) 68 70 7 7.8x 7.3x 7.5x 7.5x
Total 96
The largest median valuation multiple was in consumer staples with a median EV/EBITDA multiple of 14.2. Significant transactions in the sector that attracted above-average multiples were food and beverage businesses including:
• Warrnambool Cheese and Butter Factory’s acquisition of Lion Dairy’s everyday cheese business unit for $137 million at a valuation of 15.3 times EBITDA. The everyday cheese unit comprises cutting, wrapping, distribution and sales of dairy food products.
• Casella Wines’ acquisition of wine producer and distributer, Peter Lehman Wines for $69 million at a valuation multiple of 15.8 times EBITDA.
• PZ Cussons’ acquisition of Five:AM Life for $96 million at a valuation of 15.6 times EBITDA. Five:AM Life produces organic yoghurt and granola.
Notably, all of the above were mid-market private businesses with turnover in the range of $50 to $150 million.
Dealtracker 2016 17
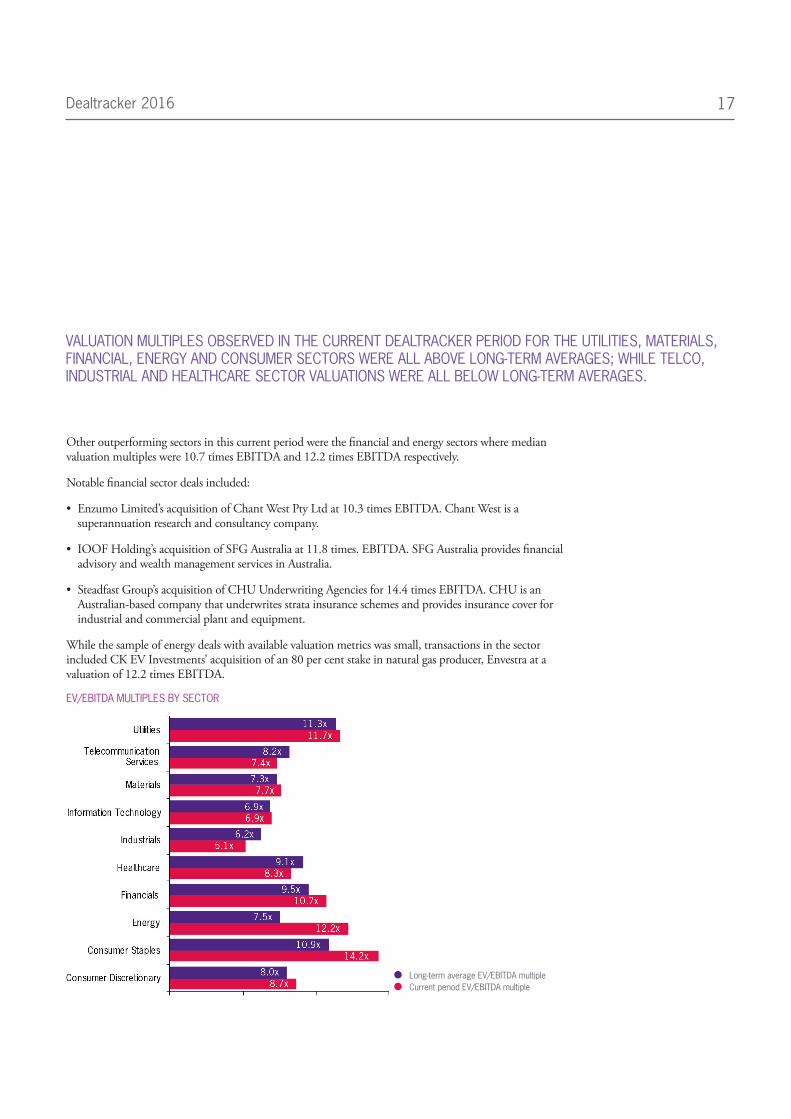
VALUATION MULTIPLES OBSERVED IN THE CURRENT DEALTRACKER PERIOD FOR THE UTILITIES, MATERIALS, FINANCIAL, ENERGY AND CONSUMER SECTORS WERE ALL ABOVE LONG-TERM AVERAGES; WHILE TELCO, INDUSTRIAL AND HEALTHCARE SECTOR VALUATIONS WERE ALL BELOW LONG-TERM AVERAGES.
Other outperforming sectors in this current period were the financial and energy sectors where median valuation multiples were 10.7 times EBITDA and 12.2 times EBITDA respectively.
Notable financial sector deals included:
• Enzumo Limited’s acquisition of Chant West Pty Ltd at 10.3 times EBITDA. Chant West is a superannuation research and consultancy company.
• IOOF Holding’s acquisition of SFG Australia at 11.8 times. EBITDA. SFG Australia provides financial advisory and wealth management services in Australia.
• Steadfast Group’s acquisition of CHU Underwriting Agencies for 14.4 times EBITDA. CHU is an Australian-based company that underwrites strata insurance schemes and provides insurance cover for industrial and commercial plant and equipment.
While the sample of energy deals with available valuation metrics was small, transactions in the sector included CK EV Investments’ acquisition of an 80 per cent stake in natural gas producer, Envestra at a valuation of 12.2 times EBITDA.
EV/EBITDA MULTIPLES BY SECTOR
Long-term average EV/EBITDA multiple Current period EV/EBITDA multiple
Dealtracker 201618
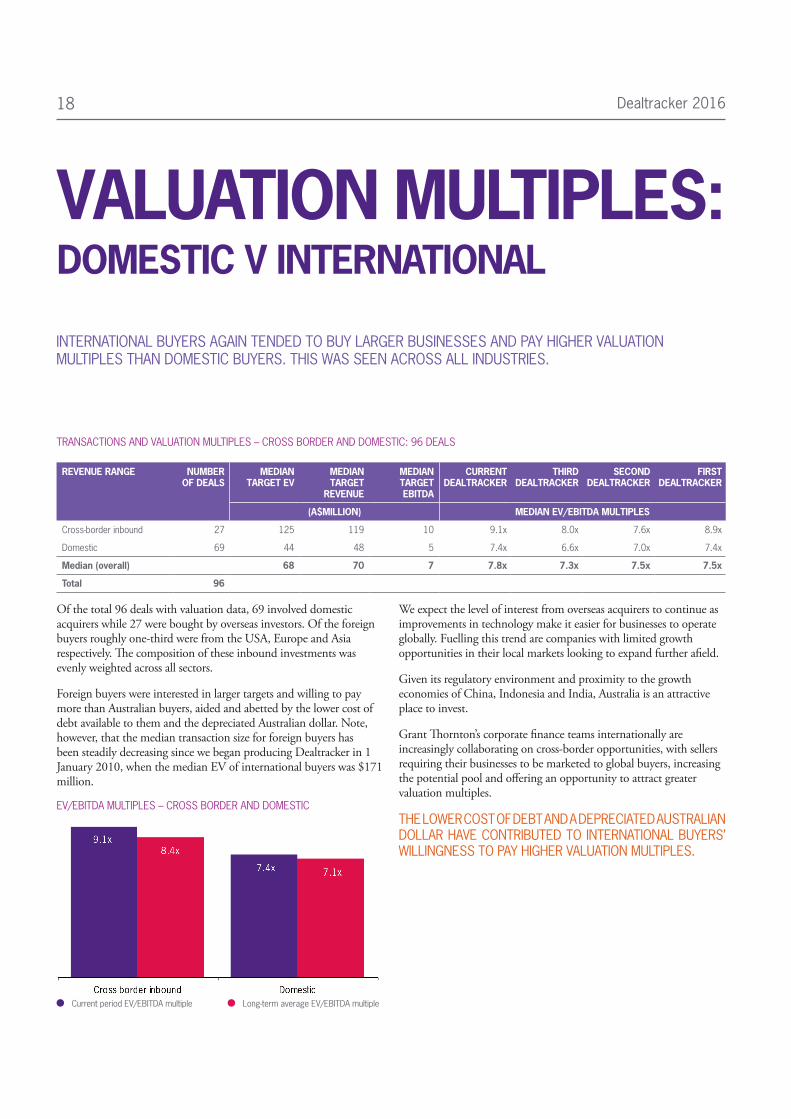
INTERNATIONAL BUYERS AGAIN TENDED TO BUY LARGER BUSINESSES AND PAY HIGHER VALUATION MULTIPLES THAN DOMESTIC BUYERS. THIS WAS SEEN ACROSS ALL INDUSTRIES.
VALUATION MULTIPLES: DOMESTIC V INTERNATIONAL
TRANSACTIONS AND VALUATION MULTIPLES – CROSS BORDER AND DOMESTIC: 96 DEALS
REVENUE RANGE NUMBER OF DEALS
MEDIAN TARGET EV
MEDIAN TARGET
REVENUE
MEDIAN TARGET EBITDA
CURRENT DEALTRACKER
THIRD DEALTRACKER
SECOND DEALTRACKER
FIRST DEALTRACKER
(A$MILLION) MEDIAN EV/EBITDA MULTIPLES
Cross-border inbound 27 125 119 10 9.1x 8.0x 7.6x 8.9x
Domestic 69 44 48 5 7.4x 6.6x 7.0x 7.4x
Median (overall) 68 70 7 7.8x 7.3x 7.5x 7.5x
Total 96
Of the total 96 deals with valuation data, 69 involved domestic acquirers while 27 were bought by overseas investors. Of the foreign buyers roughly one-third were from the USA, Europe and Asia respectively. The composition of these inbound investments was evenly weighted across all sectors.
Foreign buyers were interested in larger targets and willing to pay more than Australian buyers, aided and abetted by the lower cost of debt available to them and the depreciated Australian dollar. Note, however, that the median transaction size for foreign buyers has been steadily decreasing since we began producing Dealtracker in 1 January 2010, when the median EV of international buyers was $171 million.
EV/EBITDA MULTIPLES – CROSS BORDER AND DOMESTIC
Current period EV/EBITDA multiple Long-term average EV/EBITDA multiple
We expect the level of interest from overseas acquirers to continue as improvements in technology make it easier for businesses to operate globally. Fuelling this trend are companies with limited growth opportunities in their local markets looking to expand further afield.
Given its regulatory environment and proximity to the growth economies of China, Indonesia and India, Australia is an attractive place to invest.
Grant Thornton’s corporate finance teams internationally are increasingly collaborating on cross-border opportunities, with sellers requiring their businesses to be marketed to global buyers, increasing the potential pool and offering an opportunity to attract greater valuation multiples.
THE LOWER COST OF DEBT AND A DEPRECIATED AUSTRALIAN DOLLAR HAVE CONTRIBUTED TO INTERNATIONAL BUYERS’ WILLINGNESS TO PAY HIGHER VALUATION MULTIPLES.
Dealtracker 2016 19
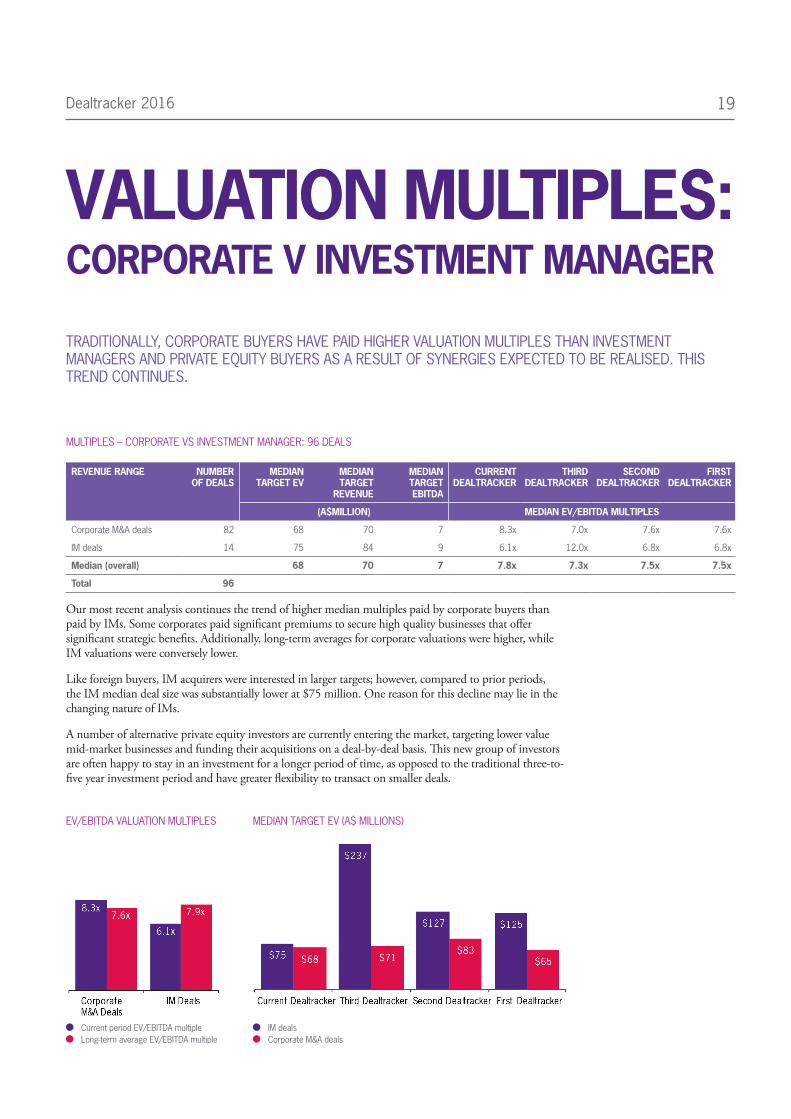
TRADITIONALLY, CORPORATE BUYERS HAVE PAID HIGHER VALUATION MULTIPLES THAN INVESTMENT MANAGERS AND PRIVATE EQUITY BUYERS AS A RESULT OF SYNERGIES EXPECTED TO BE REALISED. THIS TREND CONTINUES.
VALUATION MULTIPLES: CORPORATE V INVESTMENT MANAGER
MULTIPLES – CORPORATE VS INVESTMENT MANAGER: 96 DEALS
REVENUE RANGE NUMBER OF DEALS
MEDIAN TARGET EV
MEDIAN TARGET
REVENUE
MEDIAN TARGET EBITDA
CURRENT DEALTRACKER
THIRD DEALTRACKER
SECOND DEALTRACKER
FIRST DEALTRACKER
(A$MILLION) MEDIAN EV/EBITDA MULTIPLES
Corporate M&A deals 82 68 70 7 8.3x 7.0x 7.6x 7.6x
IM deals 14 75 84 9 6.1x 12.0x 6.8x 6.8x
Median (overall) 68 70 7 7.8x 7.3x 7.5x 7.5x
Total 96
Our most recent analysis continues the trend of higher median multiples paid by corporate buyers than paid by IMs. Some corporates paid significant premiums to secure high quality businesses that offer significant strategic benefits. Additionally, long-term averages for corporate valuations were higher, while IM valuations were conversely lower.
Like foreign buyers, IM acquirers were interested in larger targets; however, compared to prior periods, the IM median deal size was substantially lower at $75 million. One reason for this decline may lie in the changing nature of IMs.
A number of alternative private equity investors are currently entering the market, targeting lower value mid-market businesses and funding their acquisitions on a deal-by-deal basis. This new group of investors are often happy to stay in an investment for a longer period of time, as opposed to the traditional three-to-five year investment period and have greater flexibility to transact on smaller deals.
Current period EV/EBITDA multiple Long-term average EV/EBITDA multiple
EV/EBITDA VALUATION MULTIPLES MEDIAN TARGET EV (A$ MILLIONS)
IM deals Corporate M&A deals
Dealtracker 201620
OVERALL MEDIAN LISTED VALUATION MULTIPLES OVER THE LAST 18 MONTHS TO 31 DECEMBER 2015 REACHED THEIR HIGHEST POINT SINCE THE GFC, DRIVEN BY THE CONSUMER-ORIENTATED SECTORS OF CONSUMER DISCRETIONARY AND STAPLES, IT, TELECOMMUNICATIONS AND FINANCE.
LISTED COMPANIES: SHARE PRICE PERFORMANCE
ASX MEDIAN EV/EBITDA MULTIPLES BY SECTOR
MEDIAN EV/EBITDA AS AT: 30/06/07 30/06/08 30/06/09 30/06/10 30/06/11 30/06/12 31/12/12 30/06/13 31/12/13 30/06/14 31/12/14 30/06/15 31/12/15 31/03/16
Consumer discretionary 11.9 6.9 6.6 7.5 7.4 6.7 7.6 7.5 9.6 9.7 10.2 10.2 10.6 8.8
Consumer staples 12.1 9.9 8.2 8.3 8.2 8.2 8.7 9.8 10.2 10.2 10.8 10.8 10.3 9.7
Energy 12.0 10.7 8.0 6.4 9.3 5.9 7.7 3.8 5.5 6.4 4.3 4.2 5.1 6.5
Financial 17.2 11.1 11.8 9.8 9.8 9.4 10.6 12.7 13.1 13.2 12.5 12.7 12.0 10.2
Healthcare 13.3 9.3 7.8 7.0 7.0 9.6 11.2 12.8 16.8 15.0 13.1 12.6 11.8 12.6
Industrials 10.8 6.9 5.7 6.7 7.4 6.0 5.7 5.5 6.4 7.0 6.3 6.3 6.9 6.7
Information technology 12.0 6.9 4.8 7.3 5.9 6.5 8.6 9.3 12.0 12.5 12.6 12.6 13.8 10.9
Materials 9.9 8.1 7.6 8.5 7.4 5.2 5.1 2.2 3.5 7.1 4.7 4.7 4.4 6.4
Telcos 10.7 5.7 3.9 6.2 5.8 6.7 9.8 10.7 10.8 9.5 9.2 9.2 15.6 8.9
Utilities 13.8 12.4 11.4 9.5 9.4 10.5 11.1 9.5 8.7 9.1 9.6 9.6 11.6 10.6
Overall 12.5 8.4 7.1 7.6 7.8 6.8 7.6 7.0 8.2 9.5 8.9 8.8 8.8 8.6
SECTORS WITH THE HIGHEST VALUATION MULTIPLESTELECOMMUNICATION SERVICES
The telecommunication sector has seen a significant increase in valuation, from being the lowest-valued sector on a multiples basis during the GFC to the highest by 31 December 2015. The recent increase has been a result of highly valued IPOs like Amaysim Australia (25.4x) and an industry-wide consolidation that included acquisitions of Amcom telecommunications and iiNet.
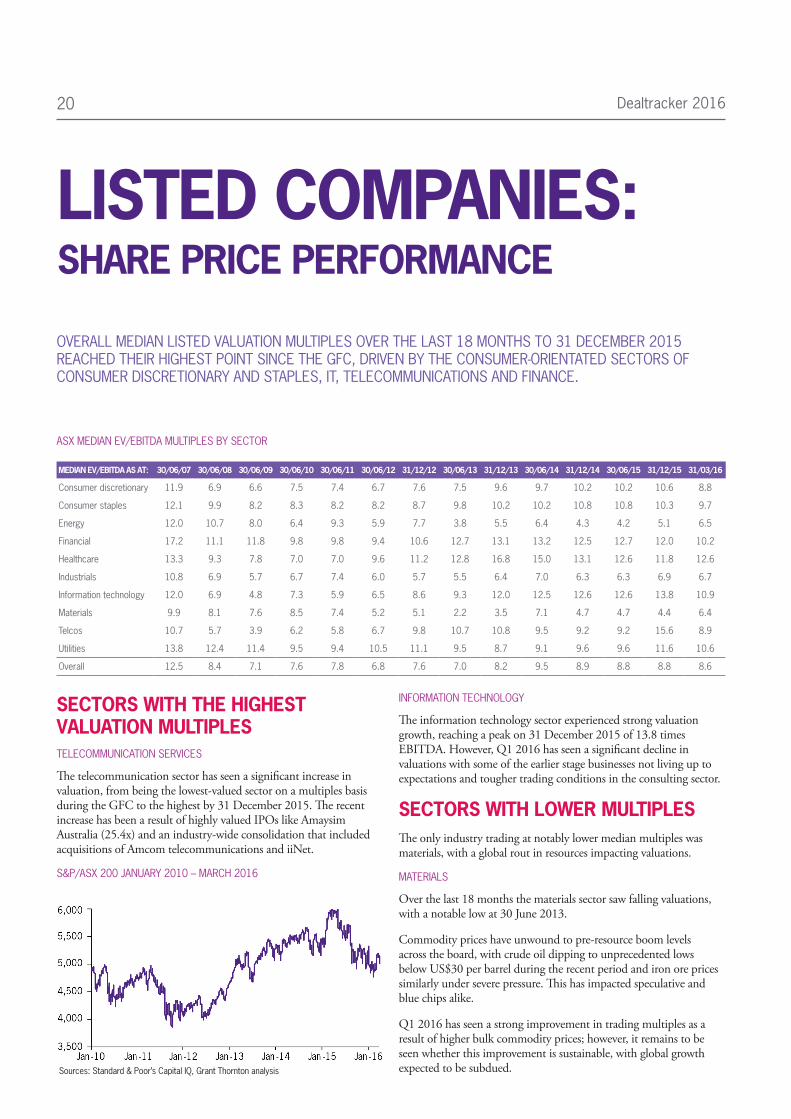
S&P/ASX 200 JANUARY 2010 – MARCH 2016
Sources: Standard & Poor’s Capital IQ, Grant Thornton analysis
INFORMATION TECHNOLOGY
The information technology sector experienced strong valuation growth, reaching a peak on 31 December 2015 of 13.8 times EBITDA. However, Q1 2016 has seen a significant decline in valuations with some of the earlier stage businesses not living up to expectations and tougher trading conditions in the consulting sector.
SECTORS WITH LOWER MULTIPLESThe only industry trading at notably lower median multiples was materials, with a global rout in resources impacting valuations.
MATERIALS
Over the last 18 months the materials sector saw falling valuations, with a notable low at 30 June 2013.
Commodity prices have unwound to pre-resource boom levels across the board, with crude oil dipping to unprecedented lows below US$30 per barrel during the recent period and iron ore prices similarly under severe pressure. This has impacted speculative and blue chips alike.
Q1 2016 has seen a strong improvement in trading multiples as a result of higher bulk commodity prices; however, it remains to be seen whether this improvement is sustainable, with global growth expected to be subdued.
Dealtracker 2016 21
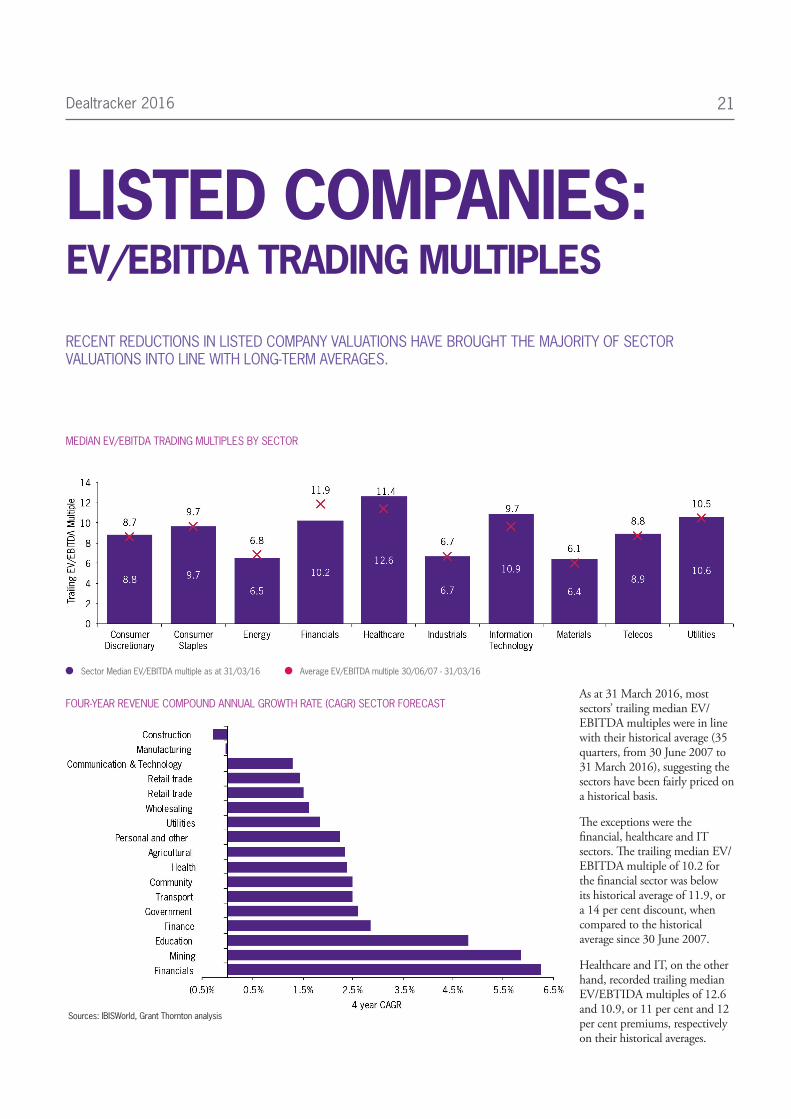
RECENT REDUCTIONS IN LISTED COMPANY VALUATIONS HAVE BROUGHT THE MAJORITY OF SECTOR VALUATIONS INTO LINE WITH LONG-TERM AVERAGES.
LISTED COMPANIES: EV/EBITDA TRADING MULTIPLES
MEDIAN EV/EBITDA TRADING MULTIPLES BY SECTOR
Sector Median EV/EBITDA multiple as at 31/03/16 Average EV/EBITDA multiple 30/06/07 - 31/03/16
FOUR-YEAR REVENUE COMPOUND ANNUAL GROWTH RATE (CAGR) SECTOR FORECAST
Sources: IBISWorld, Grant Thornton analysis
As at 31 March 2016, most sectors’ trailing median EV/EBITDA multiples were in line with their historical average (35 quarters, from 30 June 2007 to 31 March 2016), suggesting the sectors have been fairly priced on a historical basis.
The exceptions were the financial, healthcare and IT sectors. The trailing median EV/EBITDA multiple of 10.2 for the financial sector was below its historical average of 11.9, or a 14 per cent discount, when compared to the historical average since 30 June 2007.
Healthcare and IT, on the other hand, recorded trailing median EV/EBTIDA multiples of 12.6 and 10.9, or 11 per cent and 12 per cent premiums, respectively on their historical averages.
Dealtracker 201622
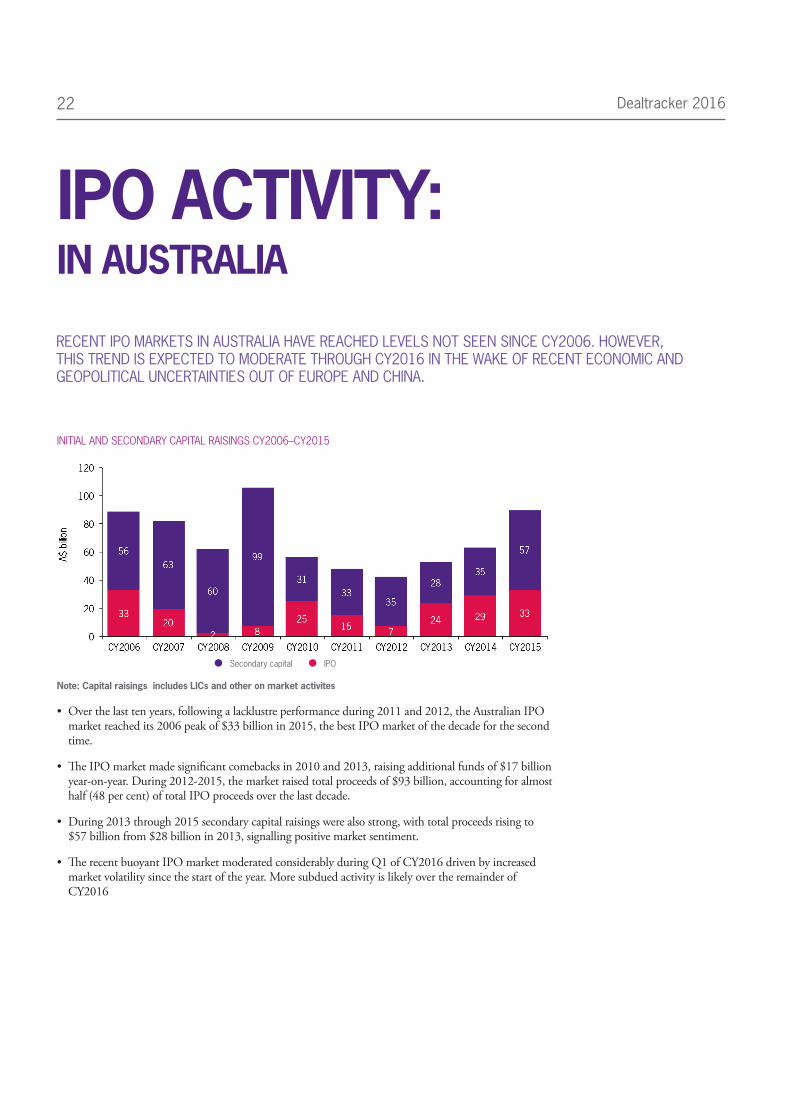
RECENT IPO MARKETS IN AUSTRALIA HAVE REACHED LEVELS NOT SEEN SINCE CY2006. HOWEVER, THIS TREND IS EXPECTED TO MODERATE THROUGH CY2016 IN THE WAKE OF RECENT ECONOMIC AND GEOPOLITICAL UNCERTAINTIES OUT OF EUROPE AND CHINA.
IPO ACTIVITY: IN AUSTRALIA
INITIAL AND SECONDARY CAPITAL RAISINGS CY2006–CY2015
Secondary capital IPO
Note: Capital raisings includes LICs and other on market activites
• Over the last ten years, following a lacklustre performance during 2011 and 2012, the Australian IPO market reached its 2006 peak of $33 billion in 2015, the best IPO market of the decade for the second time.
• The IPO market made significant comebacks in 2010 and 2013, raising additional funds of $17 billion year-on-year. During 2012-2015, the market raised total proceeds of $93 billion, accounting for almost half (48 per cent) of total IPO proceeds over the last decade.
• During 2013 through 2015 secondary capital raisings were also strong, with total proceeds rising to $57 billion from $28 billion in 2013, signalling positive market sentiment.
• The recent buoyant IPO market moderated considerably during Q1 of CY2016 driven by increased market volatility since the start of the year. More subdued activity is likely over the remainder of CY2016
Dealtracker 2016 23
IPO ACTIVITY: TRENDS AND VALUES
QUARTERLY IPO TRENDS FY2012–FY2016
QUARTERLY IPO TRENDS FY2012–FY2016
QUARTERLY IPO TRENDS FY2012–FY2016
Average IPO value (ex. $1bn+deals)* Average IPO value
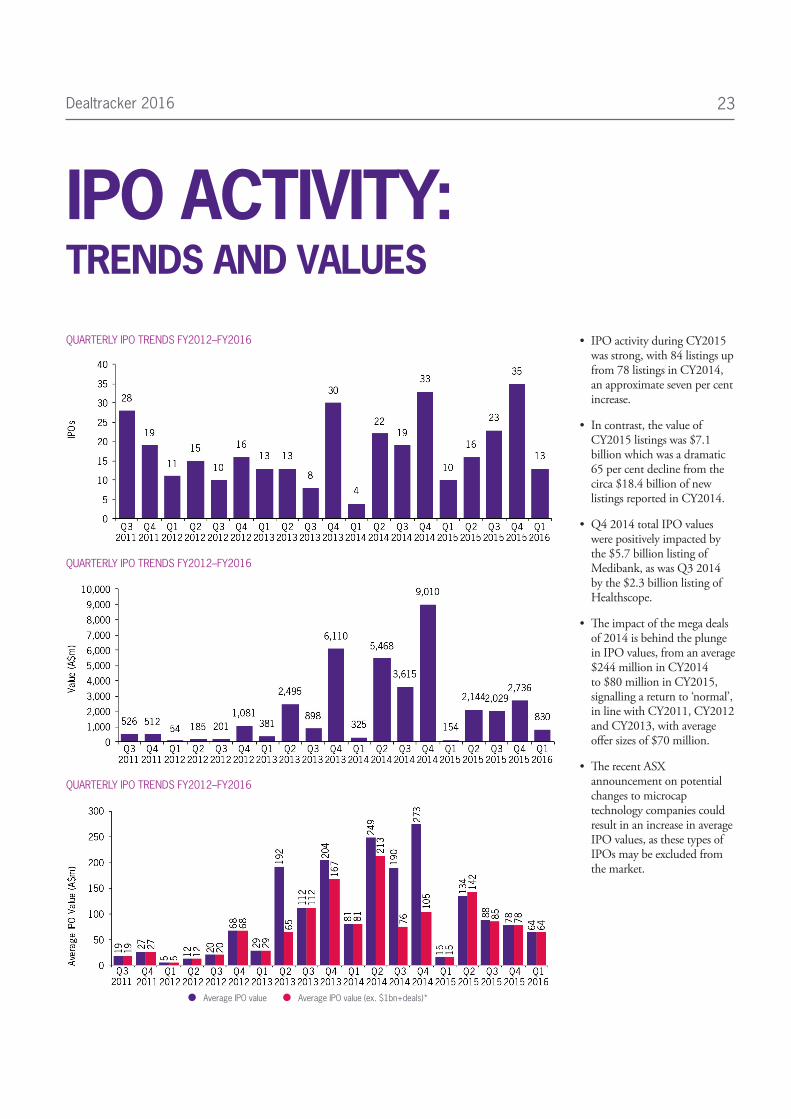
• IPO activity during CY2015 was strong, with 84 listings up from 78 listings in CY2014, an approximate seven per cent increase.
• In contrast, the value of CY2015 listings was $7.1 billion which was a dramatic 65 per cent decline from the circa $18.4 billion of new listings reported in CY2014.
• Q4 2014 total IPO values were positively impacted by the $5.7 billion listing of Medibank, as was Q3 2014 by the $2.3 billion listing of Healthscope.
• The impact of the mega deals of 2014 is behind the plunge in IPO values, from an average $244 million in CY2014 to $80 million in CY2015, signalling a return to ‘normal’, in line with CY2011, CY2012 and CY2013, with average offer sizes of $70 million.
• The recent ASX announcement on potential changes to microcap technology companies could result in an increase in average IPO values, as these types of IPOs may be excluded from the market.
Dealtracker 201624
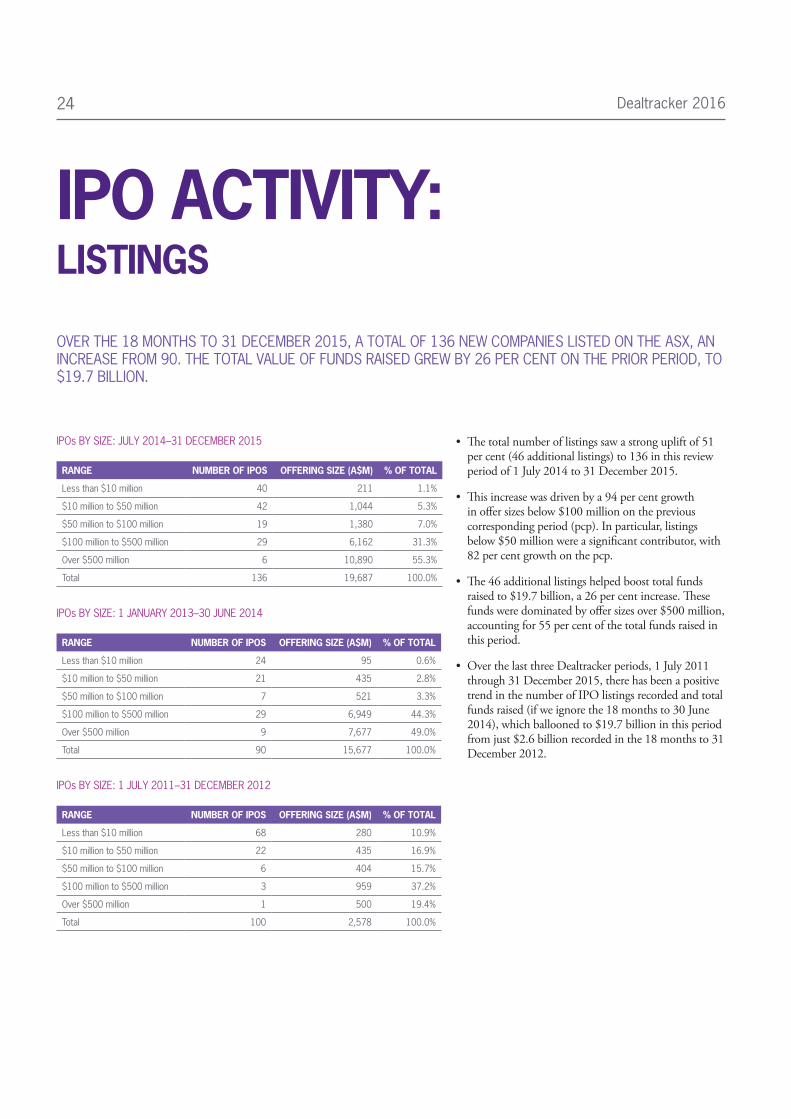
OVER THE 18 MONTHS TO 31 DECEMBER 2015, A TOTAL OF 136 NEW COMPANIES LISTED ON THE ASX, AN INCREASE FROM 90. THE TOTAL VALUE OF FUNDS RAISED GREW BY 26 PER CENT ON THE PRIOR PERIOD, TO $19.7 BILLION.
IPO ACTIVITY: LISTINGS
IPOs BY SIZE: JULY 2014–31 DECEMBER 2015
RANGE NUMBER OF IPOS OFFERING SIZE (A$M) % OF TOTAL
Less than $10 million 40 211 1.1%
$10 million to $50 million 42 1,044 5.3%
$50 million to $100 million 19 1,380 7.0%
$100 million to $500 million 29 6,162 31.3%
Over $500 million 6 10,890 55.3%
Total 136 19,687 100.0%
IPOs BY SIZE: 1 JANUARY 2013–30 JUNE 2014
RANGE NUMBER OF IPOS OFFERING SIZE (A$M) % OF TOTAL
Less than $10 million 24 95 0.6%
$10 million to $50 million 21 435 2.8%
$50 million to $100 million 7 521 3.3%
$100 million to $500 million 29 6,949 44.3%
Over $500 million 9 7,677 49.0%
Total 90 15,677 100.0%
IPOs BY SIZE: 1 JULY 2011–31 DECEMBER 2012
RANGE NUMBER OF IPOS OFFERING SIZE (A$M) % OF TOTAL
Less than $10 million 68 280 10.9%
$10 million to $50 million 22 435 16.9%
$50 million to $100 million 6 404 15.7%
$100 million to $500 million 3 959 37.2%
Over $500 million 1 500 19.4%
Total 100 2,578 100.0%
• The total number of listings saw a strong uplift of 51 per cent (46 additional listings) to 136 in this review period of 1 July 2014 to 31 December 2015.
• This increase was driven by a 94 per cent growth in offer sizes below $100 million on the previous corresponding period (pcp). In particular, listings below $50 million were a significant contributor, with 82 per cent growth on the pcp.
• The 46 additional listings helped boost total funds raised to $19.7 billion, a 26 per cent increase. These funds were dominated by offer sizes over $500 million, accounting for 55 per cent of the total funds raised in this period.
• Over the last three Dealtracker periods, 1 July 2011 through 31 December 2015, there has been a positive trend in the number of IPO listings recorded and total funds raised (if we ignore the 18 months to 30 June 2014), which ballooned to $19.7 billion in this period from just $2.6 billion recorded in the 18 months to 31 December 2012.
Dealtracker 2016 25
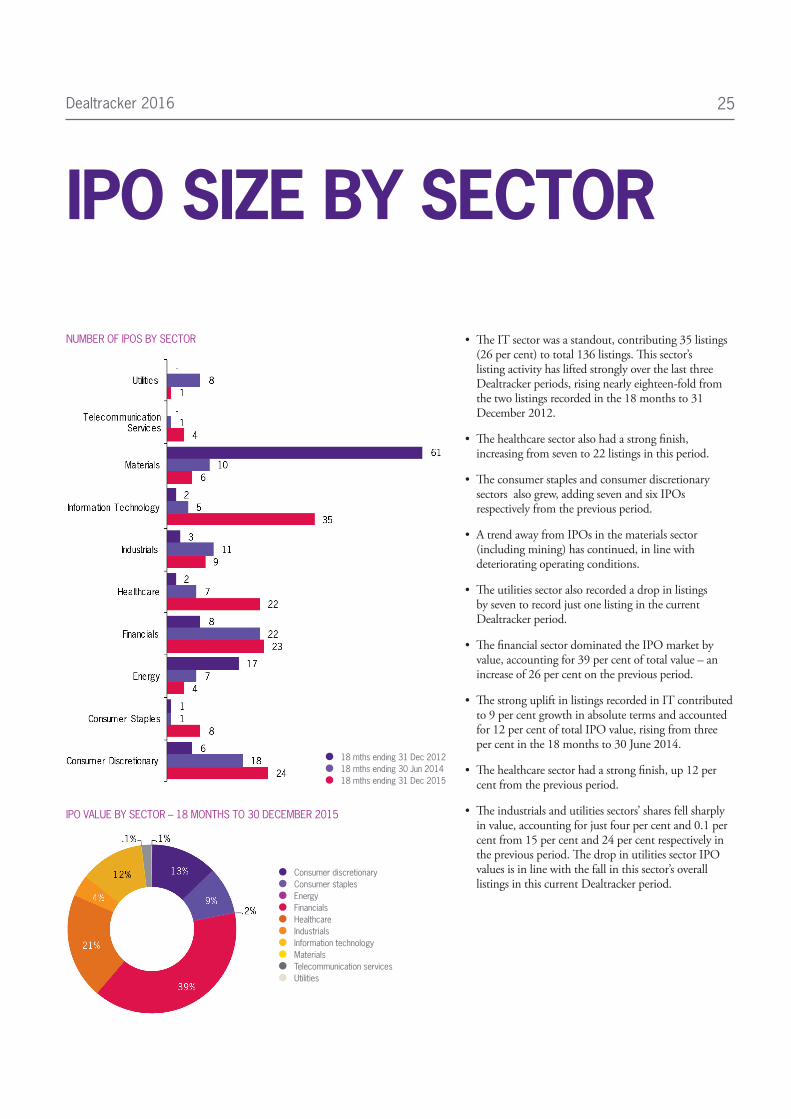
IPO SIZE BY SECTOR
NUMBER OF IPOS BY SECTOR
18 mths ending 31 Dec 2012 18 mths ending 30 Jun 2014 18 mths ending 31 Dec 2015
IPO VALUE BY SECTOR – 18 MONTHS TO 30 DECEMBER 2015
Consumer discretionary Consumer staples Energy Financials Healthcare Industrials Information technology Materials Telecommunication services Utilities
• The IT sector was a standout, contributing 35 listings (26 per cent) to total 136 listings. This sector’s listing activity has lifted strongly over the last three Dealtracker periods, rising nearly eighteen-fold from the two listings recorded in the 18 months to 31 December 2012.
• The healthcare sector also had a strong finish, increasing from seven to 22 listings in this period.
• The consumer staples and consumer discretionary sectors also grew, adding seven and six IPOs respectively from the previous period.
• A trend away from IPOs in the materials sector (including mining) has continued, in line with deteriorating operating conditions.
• The utilities sector also recorded a drop in listings by seven to record just one listing in the current Dealtracker period.
• The financial sector dominated the IPO market by value, accounting for 39 per cent of total value – an increase of 26 per cent on the previous period.
• The strong uplift in listings recorded in IT contributed to 9 per cent growth in absolute terms and accounted for 12 per cent of total IPO value, rising from three per cent in the 18 months to 30 June 2014.
• The healthcare sector had a strong finish, up 12 per cent from the previous period.
• The industrials and utilities sectors’ shares fell sharply in value, accounting for just four per cent and 0.1 per cent from 15 per cent and 24 per cent respectively in the previous period. The drop in utilities sector IPO values is in line with the fall in this sector’s overall listings in this current Dealtracker period.

Dealtracker 201626
TOP IPOs/SECTOR: SIX MONTHS TO 31 DECEMBER 2015
SECTOR ISSUER OFFER SIZE IPO PRICE PRICE AT 31DEC15 PRICE CHANGE
Industrials IVE Group Limited (ASX:IGL) A$76 million A$2.00 A$2.00 -
Utilities Genex Power Limited (ASX:GNX) A$8 million A$0.20 A$0.16 -20.0%
Consumer Staples Costa Group Holdings Limited (ASX:CGC) A$551 million A$2.25 A$2.72 +20.9%
Financials Pepper Group Limited (ASX:PEP) A$145 million A$2.60 A$3.50 +34.6%
Healthcare Integral Diagnostics Limited (ASX:IDX) A$134 million A$1.91 A$1.66 -13.4%
Information Technology Link Administration Holdings Pty Limited (ASX:LNK) A$76 million A$6.37 A$7.45 +17.0%
Consumer discretionary IDP Education Limited (ASX:IEL) A$332 million A$2.65 A$3.33 +25.7%
Dealtracker 2016 27
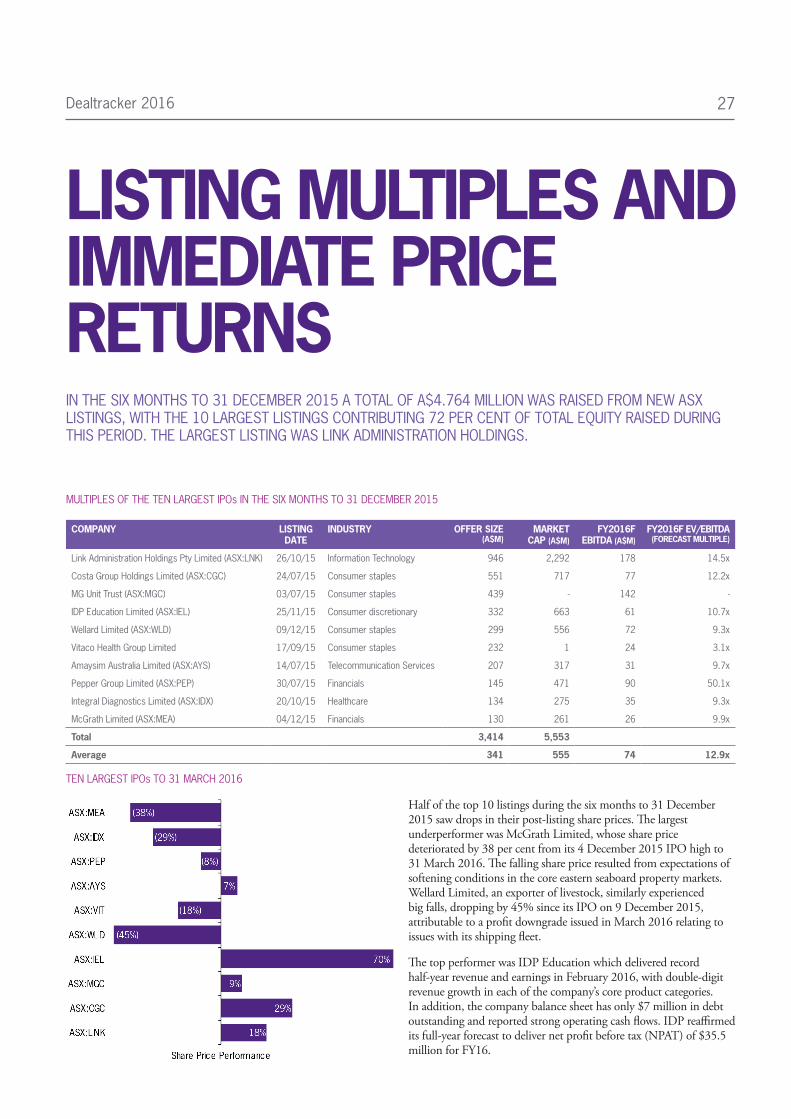
MULTIPLES OF THE TEN LARGEST IPOs IN THE SIX MONTHS TO 31 DECEMBER 2015
COMPANY LISTING DATE
INDUSTRY OFFER SIZE (A$M)
MARKET CAP (A$M)
FY2016F EBITDA (A$M)
FY2016F EV/EBITDA (FORECAST MULTIPLE)
Link Administration Holdings Pty Limited (ASX:LNK) 26/10/15 Information Technology 946 2,292 178 14.5x
Costa Group Holdings Limited (ASX:CGC) 24/07/15 Consumer staples 551 717 77 12.2x
MG Unit Trust (ASX:MGC) 03/07/15 Consumer staples 439 - 142 -
IDP Education Limited (ASX:IEL) 25/11/15 Consumer discretionary 332 663 61 10.7x
Wellard Limited (ASX:WLD) 09/12/15 Consumer staples 299 556 72 9.3x
Vitaco Health Group Limited 17/09/15 Consumer staples 232 1 24 3.1x
Amaysim Australia Limited (ASX:AYS) 14/07/15 Telecommunication Services 207 317 31 9.7x
Pepper Group Limited (ASX:PEP) 30/07/15 Financials 145 471 90 50.1x
Integral Diagnostics Limited (ASX:IDX) 20/10/15 Healthcare 134 275 35 9.3x
McGrath Limited (ASX:MEA) 04/12/15 Financials 130 261 26 9.9x
Total 3,414 5,553
Average 341 555 74 12.9x
TEN LARGEST IPOs TO 31 MARCH 2016
Half of the top 10 listings during the six months to 31 December 2015 saw drops in their post-listing share prices. The largest underperformer was McGrath Limited, whose share price deteriorated by 38 per cent from its 4 December 2015 IPO high to 31 March 2016. The falling share price resulted from expectations of softening conditions in the core eastern seaboard property markets. Wellard Limited, an exporter of livestock, similarly experienced big falls, dropping by 45% since its IPO on 9 December 2015, attributable to a profit downgrade issued in March 2016 relating to issues with its shipping fleet.
The top performer was IDP Education which delivered record half-year revenue and earnings in February 2016, with double-digit revenue growth in each of the company’s core product categories. In addition, the company balance sheet has only $7 million in debt outstanding and reported strong operating cash flows. IDP reaffirmed its full-year forecast to deliver net profit before tax (NPAT) of $35.5 million for FY16.
IN THE SIX MONTHS TO 31 DECEMBER 2015 A TOTAL OF A$4.764 MILLION WAS RAISED FROM NEW ASX LISTINGS, WITH THE 10 LARGEST LISTINGS CONTRIBUTING 72 PER CENT OF TOTAL EQUITY RAISED DURING THIS PERIOD. THE LARGEST LISTING WAS LINK ADMINISTRATION HOLDINGS.
LISTING MULTIPLES AND IMMEDIATE PRICE RETURNS

Dealtracker 201628
DESPITE THE RECENT MEDIA ATTENTION AROUND PRIVATE EQUITY-BACKED IPOs, THE PERFORMANCE OF THE OVERWHELMING MAJORITY OF THESE FLOATS DEMONSTRATES THE VALUE CONTRIBUTED BY THE SECTOR OVER THE PAST FIVE YEARS. AROUND 80 PER CENT OF THESE COMPANIES EXPERIENCED POSITIVE SHARE GROWTH, WITH 25 PER CENT DOUBLING IN VALUE SINCE LISTING. NOTABLY, QUADRANT PRIVATE EQUITY HAS PRODUCED THREE OF THE TOP SIX PERFORMERS DURING THIS PERIOD.
PRIVATE EQUITY STORY
PRIVATE EQUITY-BACKED IPOs – PERFORMANCE TO DATE MONTHS SINCE LISTING
Dealtracker 2016 29
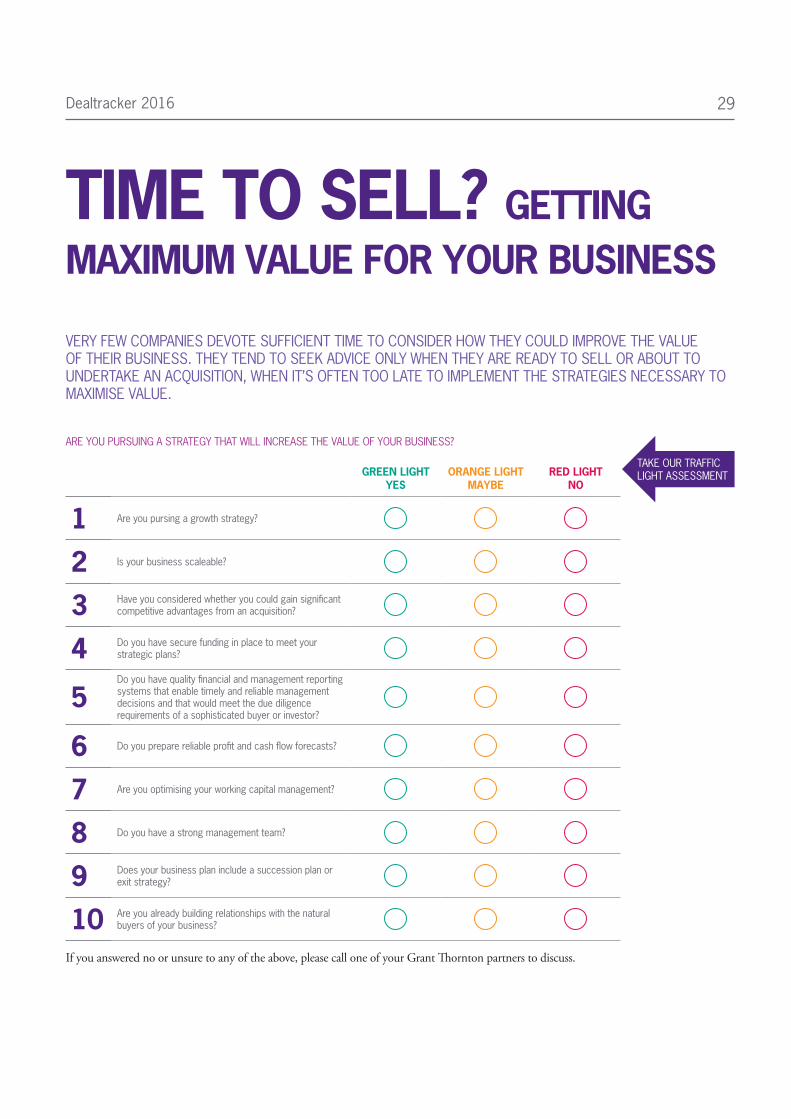
VERY FEW COMPANIES DEVOTE SUFFICIENT TIME TO CONSIDER HOW THEY COULD IMPROVE THE VALUE OF THEIR BUSINESS. THEY TEND TO SEEK ADVICE ONLY WHEN THEY ARE READY TO SELL OR ABOUT TO UNDERTAKE AN ACQUISITION, WHEN IT’S OFTEN TOO LATE TO IMPLEMENT THE STRATEGIES NECESSARY TO MAXIMISE VALUE.
TIME TO SELL? GETTING MAXIMUM VALUE FOR YOUR BUSINESS
ARE YOU PURSUING A STRATEGY THAT WILL INCREASE THE VALUE OF YOUR BUSINESS?
GREEN LIGHTYES
ORANGE LIGHTMAYBE
RED LIGHTNO
1 Are you pursing a growth strategy?
2 Is your business scaleable?
3 Have you considered whether you could gain significant competitive advantages from an acquisition?
4 Do you have secure funding in place to meet your strategic plans?
5Do you have quality financial and management reporting systems that enable timely and reliable management decisions and that would meet the due diligence requirements of a sophisticated buyer or investor?
6 Do you prepare reliable profit and cash flow forecasts?
7 Are you optimising your working capital management?
8 Do you have a strong management team?
9 Does your business plan include a succession plan or exit strategy?
10 Are you already building relationships with the natural buyers of your business?
If you answered no or unsure to any of the above, please call one of your Grant Thornton partners to discuss.
TAKE OUR TRAFFIC LIGHT ASSESSMENT
Dealtracker 201630
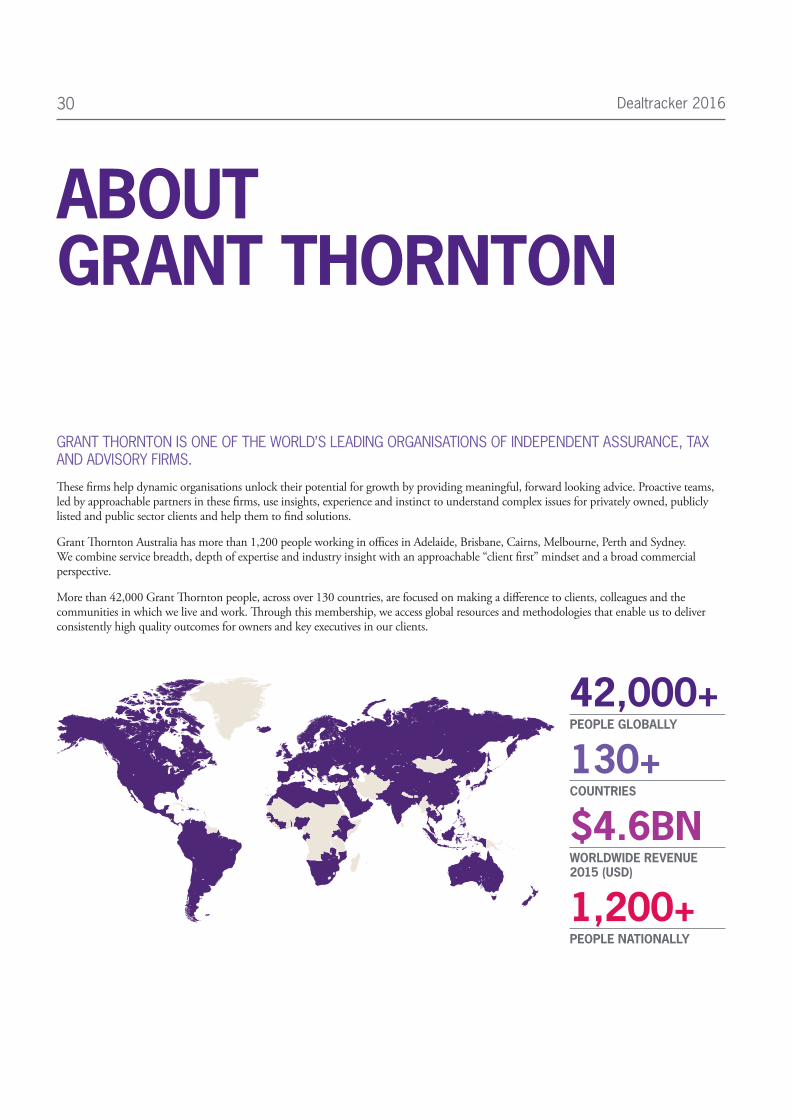
GRANT THORNTON IS ONE OF THE WORLD’S LEADING ORGANISATIONS OF INDEPENDENT ASSURANCE, TAX AND ADVISORY FIRMS.
These firms help dynamic organisations unlock their potential for growth by providing meaningful, forward looking advice. Proactive teams, led by approachable partners in these firms, use insights, experience and instinct to understand complex issues for privately owned, publicly listed and public sector clients and help them to find solutions.
Grant Thornton Australia has more than 1,200 people working in offices in Adelaide, Brisbane, Cairns, Melbourne, Perth and Sydney. We combine service breadth, depth of expertise and industry insight with an approachable “client first” mindset and a broad commercial perspective.
More than 42,000 Grant Thornton people, across over 130 countries, are focused on making a difference to clients, colleagues and the communities in which we live and work. Through this membership, we access global resources and methodologies that enable us to deliver consistently high quality outcomes for owners and key executives in our clients.
ABOUT GRANT THORNTON
42,000+PEOPLE GLOBALLY
130+COUNTRIES
$4.6BNWORLDWIDE REVENUE 2015 (USD)
1,200+PEOPLE NATIONALLY
Dealtracker 2016 31
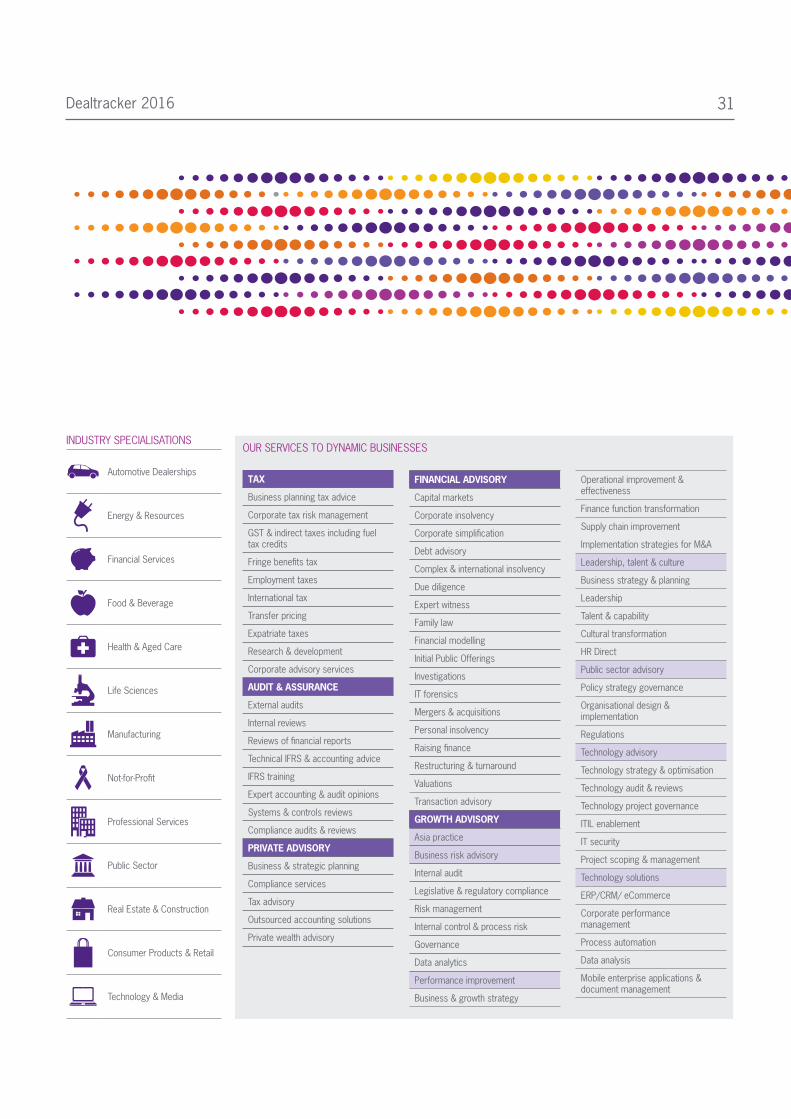
INDUSTRY SPECIALISATIONS
Automotive Dealerships
Energy & Resources
Financial Services
Food & Beverage
Health & Aged Care
Life Sciences
Manufacturing
Not-for-Profit
Professional Services
Public Sector
Real Estate & Construction
Consumer Products & Retail
Technology & Media
OUR SERVICES TO DYNAMIC BUSINESSES
TAX
Business planning tax advice
Corporate tax risk management
GST & indirect taxes including fuel tax credits
Fringe benefits tax
Employment taxes
International tax
Transfer pricing
Expatriate taxes
Research & development
Corporate advisory services
AUDIT & ASSURANCE
External audits
Internal reviews
Reviews of financial reports
Technical IFRS & accounting advice
IFRS training
Expert accounting & audit opinions
Systems & controls reviews
Compliance audits & reviews
PRIVATE ADVISORY
Business & strategic planning
Compliance services
Tax advisory
Outsourced accounting solutions
Private wealth advisory
FINANCIAL ADVISORY
Capital markets
Corporate insolvency
Corporate simplification
Debt advisory
Complex & international insolvency
Due diligence
Expert witness
Family law
Financial modelling
Initial Public Offerings
Investigations
IT forensics
Mergers & acquisitions
Personal insolvency
Raising finance
Restructuring & turnaround
Valuations
Transaction advisory
GROWTH ADVISORY
Asia practice
Business risk advisory
Internal audit
Legislative & regulatory compliance
Risk management
Internal control & process risk
Governance
Data analytics
Performance improvement
Business & growth strategy
Operational improvement & effectiveness
Finance function transformation
Supply chain improvement
Implementation strategies for M&A
Leadership, talent & culture
Business strategy & planning
Leadership
Talent & capability
Cultural transformation
HR Direct
Public sector advisory
Policy strategy governance
Organisational design & implementation
Regulations
Technology advisory
Technology strategy & optimisation
Technology audit & reviews
Technology project governance
ITIL enablement
IT security
Project scoping & management
Technology solutions
ERP/CRM/ eCommerce
Corporate performance management
Process automation
Data analysis
Mobile enterprise applications & document management
Dealtracker 201632
UNDERTAKING A MERGER OR ACQUISITION CAN BE A WATERSHED EVENT IN A COMPANY’S EVOLUTION. THE HIGHLY SKILLED AND ENTREPRENEURIAL M&A TEAM AT GRANT THORNTON HAVE THE EXPERIENCE AND EXPERTISE YOU NEED.
ABOUT GRANT THORNTON CORPORATE FINANCE
SELLING A BUSINESSWhen considering selling your business you want to be sure that you’ll achieve the highest possible value with the best terms and that the sales process will be as smooth as possible. Our team focuses on advising you how to maximise the value of your business sale. By understanding your objectives and exploring all the options available to you, we can help you decide on the most suitable sales strategy. We will support you through every step of the sale process, including valuing your business, drafting the information memorandum and working with our tax colleagues and sector specialists to strengthen and accentuate your position in the market. We help to identify and evaluate potential purchasers, including exploring overseas opportunities and will lead or support in the negotiations, right through to completion of the transaction. Throughout the sales process we’ll work with you to ensure as smooth a transaction as possible. Our deal statistics show that our national team consistently exceeds our clients’ expectations.
RAISING FINANCEIn the current economic climate, raising finance can prove a major challenge for your organisation. As a result, businesses are increasingly looking for innovative ways of raising finance. We are experienced in helping management teams, corporates and private shareholders raise private equity and/or debt finance to support growth, release value or refinance. We can help you explore the numerous options open to you in terms of raising finance, highlighting the advantages and disadvantages of each method for your business based on our expertise and experience.
Grant Thornton’s Australia’s Corporate Finance offering is truly integrated. We provide access to a full spectrum of transaction specialists and an international network of M&A experts. Whether buying a business, selling a business, experiencing mergers, management buy ins/outs or raising finance to support your business plans, our team will guide you through the process.
We specialise in transactions of between $10 million and $200 million in value. Through empowered client service teams, approachable partners and shorter decision-making chains, we provide a wider of point of view and operate in a way that’s as fast and agile as our dynamic mid-market clients. This results in meaningful and forward-looking advice that can help our clients unlock their potential for growth.
Grant Thornton’s specific areas of expertise include the following.
ACQUIRING A BUSINESSFor businesses looking to grow through acquisition, our Corporate Finance Advisory team takes a hands-on approach to helping you find the perfect match for your business objectives. The process starts with research and identification of target businesses, both in Australia and internationally, drawing on the knowledge of our team of in-house researchers and sector specialists. Once a target is identified we help our clients through every step of the process. We approach and then negotiate with the target on your behalf, as well as develop the offer, from valuations and funding requirements through to negotiating documentation. We also undertake due diligence and provide tax planning, before seeing the negotiations through to a smooth completion.
Dealtracker 2016 33
PUBLIC COMPANY ADVISORYOur Public Company Advisory team helps companies float on the ASX or other international markets. Our team of highly experienced professionals have a depth and breadth of expertise, providing strategic, commercial, financial, regulatory and operational advice to public companies, their boards of directors and shareholders. We offer integrated solutions on a diverse range of corporate finance matters to dynamic, publicly listed companies, private companies aspiring to a listing, private equity houses and family offices, as well as shareholders of public and private companies. We tap into specialists from other teams across Advisory and the wider firm to deliver a range of services to public companies and those seeking to go public. We pride ourselves on developing deep business relationships with our clients based on trust, as well as our proactive and pragmatic advice.
TRANSACTION ADVISORY SERVICESWe have a national team of advisers who apply their strong experience and capabilities in a very hands-on way. Our business is built on long-term working relationships, and we endeavour to develop a deep understanding of our clients’ businesses. Our services have been developed to meet the needs of the mid-market sector including vendor, acquisition, commercial, technology and operational due diligence, bid support, vendor assistance (exit readiness, preparation for due diligence and completion mechanism advice) and public company transaction work. We identify key business issues through our rigorous and tailored risk and business analysis process and report findings to suit your business and funders’ needs and your preferred medium. Our team then works closely with you and your other advisers to find practical solutions that resolve these issues, with a reporting method designed to suit your business.
OPERATIONAL DEAL SERVICESOperational Deal Services is a specialist team focused on providing practical operational insight and advice to corporate and private equity clients to help achieve their deal goals. We operate across the whole deal cycle and our team members have experience of working on over 300 transactions. We offer solutions and advice in integration and 100-day planning, carve out (preparation for sales/ separation), operations due diligence, technology assessment and integration, synergy review and planning, and performance improvement.

Dealtracker 201634
THE DATA WAS COMPILED FROM MULTIPLE SOURCES INCLUDING S&P CAPITAL IQ, THE AUSTRALIAN SECURITIES EXCHANGE, MERGERMARKET, IBISWORLD, TRANSACTION SURVEYS, COMPANY ANNOUNCEMENTS AND OTHER PUBLICLY AVAILABLE DOCUMENTS, SUPPLEMENTED BY OUR OWN PROPRIETARY SOURCES.
METHODOLOGY
In preparing this publication, we have relied on the following key sources of information: Standard & Poor’s Capital IQ, the Australian Securities Exchange, MergerMarket, IBISWorld, company announcements and other publicly available information. We have considered transactions during the period 1 January 2011 to 31 March 2016 where the target company’s primary sector was resident in Australia and the acquirer gained control of the company.
Our analysis is based on the assumption that the information derived from the different sources mentioned above is correct and that no material information is missing. While all reasonable actions have been observed to ensure that the information in this report is not false or misleading, Grant Thornton does not accept any liability for damage incurred as a result of facts or deficiencies in this report. Conclusions and judgements reflect our assessment at the time of the publication’s completion.
The survey is limited to going concern business sales excluding significant real estate, with valuation multiples based on reported historical earnings where available.
Dealtracker 2016 35
CONTACT GRANT THORNTON
KEY CONTRIBUTORS
PAUL GOOLEYT +61 2 8297 2586E [email protected]
JON BUCCERIT +61 2 8297 2780E [email protected]
CORPORATE FINANCE CONTACTS
ADELAIDELevel 167 Greenhill RoadWayville SA 5034
JUSTIN HUMPHREY T +61 8 8372 6621 E [email protected]
BRISBANEKing George CentralLevel 18, 145 Ann StreetBrisbane QLD 4000
JOHN DOWELLT +61 7 3222 0313E [email protected]
GRAHAM MCMANUST +61 7 3222 0224E [email protected]
HARLEY MITCHELLT +61 7 3222 0309E [email protected]
CAIRNSCairns Corporate TowerLevel 13, 15 Lake StreetCairns QLD 4870
TONY JONSSON T +61 7 4046 8850 E tony.jonsson @au.gt.com
MELBOURNEThe Rialto, Level 30525 Collins StreetMelbourne VIC 3000
CAMERON BACONT +61 3 8663 6366E [email protected]
PETER THORNELYT +61 3 8663 6229E [email protected]
PERTHLevel 110 Kings Park RoadWest Perth WA 6005
MITESH RAMJIT +61 8 9480 2110E [email protected]
SYDNEYLevel 17383 Kent StreetSydney NSW 2000
NEIL COOKET +61 2 8297 2521E [email protected]
ANDREA DE CIANT +61 2 8297 2706E [email protected]
TIM GOODMANT +61 2 8297 2772E [email protected]
PAUL GOOLEYT +61 2 8297 2586E [email protected]
HOLLY STILEST +61 2 8297 2487E [email protected]
Grant Thornton Australia Limited ABN 41 127 556 389 ACN 127 556 389
‘Grant Thornton’ refers to the brand under which the Grant Thornton member firms provide assurance, tax and advisory services to their clients and/or refers to one or more member firms, as the context requires. Grant Thornton Australia Ltd is a member firm of Grant Thornton International Ltd (GTIL). GTIL and the member firms are not a worldwide partnership. GTIL and each member firm is a separate legal entity. Services are delivered by the member firms. GTIL does not provide services to clients. GTIL and its member firms are not agents of, and do not obligate one another and are not liable for one another’s acts or omissions. In the Australian context only, the use of the term ‘Grant Thornton’ may refer to Grant Thornton Australia Limited ABN 41 127 556 389 and its Australian subsidiaries and related entities. GTIL is not an Australian related entity to Grant Thornton Australia Limited.
Liability limited by a scheme approved under Professional Standards Legislation. Liability is limited in those States where a current scheme applies.
www.grantthornton.com.au