Embed Size (px)
Citation preview
February 12, 2015 Industry Report
Ralph Garcea, MBA, P.Eng. [email protected] 416-849-5004
Sales/Trading —Toronto: (416) 363-5757, (866) 442-4485
See disclosure and a description of our recommendation structure at the end of this report.
Eq
uit
y R
ese
arc
h
DEALER’S CHOICE Initiating Coverage on Amaya (BUY, TP $50.00) and NYX Gaming (BUY, TP $7.00)
According to a report by Global Betting and Gaming Consultants (GBGC), global gambling revenue (GGR) was ~US$451B in 2013 (+4.4% yoy). We estimate that the market will grow at a CAGR of 3.5%, reaching ~US$540B by 2020 (assuming a US$/€ exchange rate of 1.25). In addition, GBGC estimates that online gambling reached ~US$40B in 2013 or ~9% of GGR. We estimate that the online market will grow at a CAGR of 9%, reaching ~US$65B (or ~12% of GGR) by 2020 (assuming a US$/€ exchange rate of 1.25).
Based on data from H2 Gambling Capital, we estimate that for 2014, the online gambling market by segment was: Sportsbook (42%), Casino (23%), Poker (8%), Bingo (6%) and Skills/Lotteries (21%). By 2020, Sportsbook and Casino should be ~65-70% of the global online market.
We believe investors should own AYA and NYX. Both have great management teams that have experience in doing M&A transactions. Amaya will be looking to divest of some assets to help pay down debt, and may look at a Sportsbook transaction to gain scale quickly in the largest segment of the online gambling market. NYX Gaming went public in late December 2014 with a successful IPO, has already acquired the Ongame Network assets from Amaya, and has its sights set on acquiring Amaya’s Chartwell/Cryptologic assets.
Canadian Gambling Stocks: Global, Land-Based, Mobile and Online
Source: Cantor Fitzgerald Canada, FactSet
Price Rating Target Market Cap. LTM Revenue EV/Sales EV/EBITDA P/E
Ticker (Local) (Local) (US$) (US$) 2015 2016 2015 2016 2015 2016
Amaya Inc. AYA-CA 31.25 BUY 50.00 3,281 330 5.6 5.0 13.1 10.9 16.4 11.6
NYX Gaming Group Limited NYX-CA 4.75 BUY 7.00 127 24 3.4 2.8 17.0 7.7 50.8 21.6

Technology – Online Gambling February 12, 2015
Ralph Garcea, MBA, P.Eng. 416-849-5004 2 of 36
TABLE OF CONTENTS
Global Gambling Industry Overview .......................................................................... 3 Online Gambling in the U.S. ........................................................................................ 4 Increasing Taxes On Online Gambling ...................................................................... 5 Mobile Penetration ......................................................................................................... 5 Consolidation Continues ............................................................................................... 6 How To Play This In Canada…. .................................................................................. 6 AMAYA INC. ................................................................................................................. 8 Introduction ..................................................................................................................... 9 Investment Thesis ........................................................................................................... 9
Transformational Acquisition World’s Largest Poker Business ................ 9 Divestitures to Pay Down Debt and Share Buyback ......................................... 9 Growth Includes Casino and Mobile ................................................................... 9 What about Sportsbook? ........................................................................................ 9 Strong Board Drives Compliance and Transparency ........................................ 9
Catalysts ..........................................................................................................................10 Divestitures .............................................................................................................10 Q4/14 Results ........................................................................................................10 Dual Listing ............................................................................................................10
Risks ................................................................................................................................10 Company Overview ......................................................................................................11 Products and Services...................................................................................................12
PokerStars/Full Tilt Poker ...................................................................................12 Casino ......................................................................................................................13 Sportsbook .............................................................................................................13 Mobile......................................................................................................................13
Competitors ...................................................................................................................13 Financial Forecast .........................................................................................................14 Recommendation and Valuation ................................................................................16 Appendix 1: Management and Board of Directors .................................................17 Appendix 2: Financial Statements ..............................................................................18 NYX GAMING GROUP LTD. ...............................................................................22 Introduction ...................................................................................................................23 Investment thesis ..........................................................................................................23
Full Suite of Products Built on an Open Technology Platform ....................23 Recurring Revenue Business Model ...................................................................23 Blue-Chip Customer Base ....................................................................................23 Experienced Management Team ........................................................................23
Catalysts ..........................................................................................................................24 Acquisition of Amaya’s B2B assets ....................................................................24 Leveraging the Ongame Networks Acquisition ...............................................24
Risks ................................................................................................................................24 Company Overview ......................................................................................................24 Products and Services...................................................................................................26 Competitors ...................................................................................................................27 Business Model ..............................................................................................................27 Financial Forecast .........................................................................................................29 Recommendation and Valuation ................................................................................30 Appendix 1: Management and Board of Directors .................................................31 Appendix 2: Financial Statements ..............................................................................32
Technology – Online Gambling February 12, 2015
Ralph Garcea, MBA, P.Eng. 416-849-5004 3 of 36
GLOBAL GAMBLING INDUSTRY OVERVIEW
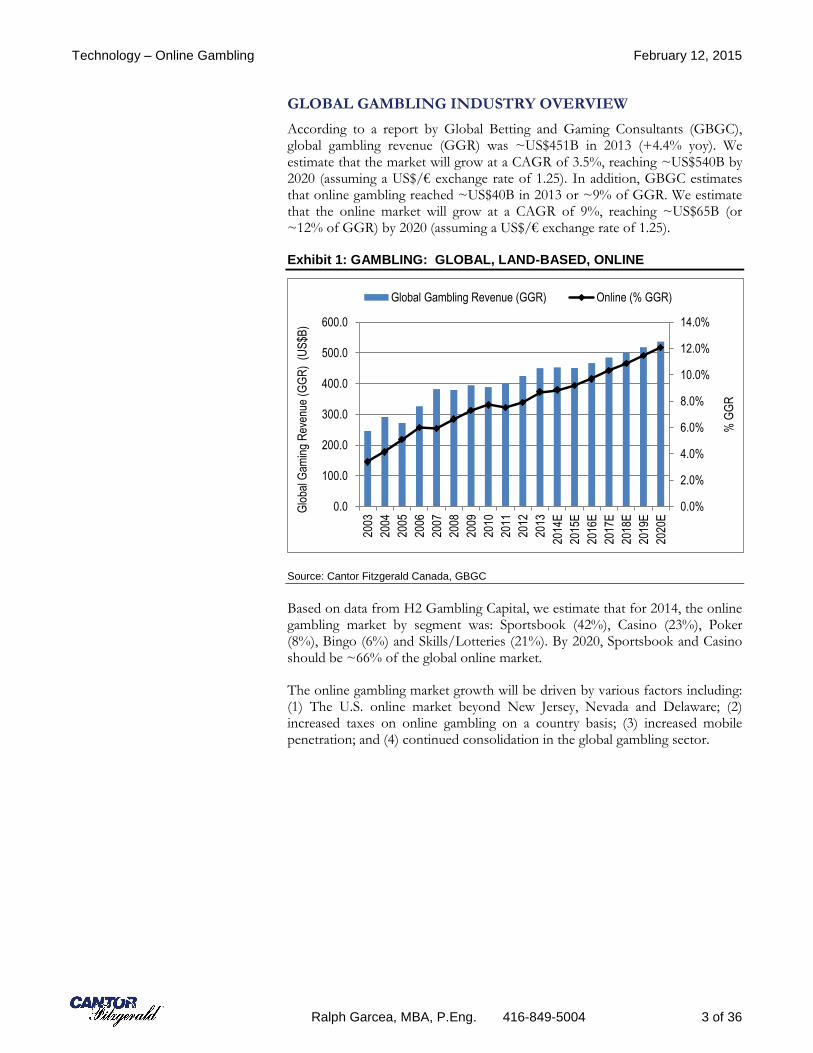
According to a report by Global Betting and Gaming Consultants (GBGC), global gambling revenue (GGR) was ~US$451B in 2013 (+4.4% yoy). We estimate that the market will grow at a CAGR of 3.5%, reaching ~US$540B by 2020 (assuming a US$/€ exchange rate of 1.25). In addition, GBGC estimates that online gambling reached ~US$40B in 2013 or ~9% of GGR. We estimate that the online market will grow at a CAGR of 9%, reaching ~US$65B (or ~12% of GGR) by 2020 (assuming a US$/€ exchange rate of 1.25).
Exhibit 1: GAMBLING: GLOBAL, LAND-BASED, ONLINE
Source: Cantor Fitzgerald Canada, GBGC
Based on data from H2 Gambling Capital, we estimate that for 2014, the online gambling market by segment was: Sportsbook (42%), Casino (23%), Poker (8%), Bingo (6%) and Skills/Lotteries (21%). By 2020, Sportsbook and Casino should be ~66% of the global online market.
The online gambling market growth will be driven by various factors including: (1) The U.S. online market beyond New Jersey, Nevada and Delaware; (2) increased taxes on online gambling on a country basis; (3) increased mobile penetration; and (4) continued consolidation in the global gambling sector.
0.0%
2.0%
4.0%
6.0%
8.0%
10.0%
12.0%
14.0%
0.0
100.0
200.0
300.0
400.0
500.0
600.0
2003
2004
2005
2006
2007
2008
2009
2010
2011
2012
2013
2014
E
2015
E
2016
E
2017
E
2018
E
2019
E
2020
E
% G
GR
Glo
bal G
amin
g R
even
ue (
GG
R)
(U
S$B
)Global Gambling Revenue (GGR) Online (% GGR)

Technology – Online Gambling February 12, 2015
Ralph Garcea, MBA, P.Eng. 416-849-5004 4 of 36
Exhibit 2: GLOBAL ONLINE GAMBLING – BY SEGMENT
Source: Cantor Fitzgerald Canada, H2 Gambling Capital
ONLINE GAMBLING IN THE U.S.
The U.S. online gambling market has been a disappointment to date, with New Jersey (NJ), Nevada and Delaware the only states to legalize Internet gaming. In NJ, Internet Gaming Win (IGW) for December 2014 came in at $10.7M (+23% m/m and +64% y/y). For the year, NJ’s IGW came in at ~$123M – driven by Borgata (36%), Caesars Interactive (27%), Tropicana (18%), Golden Nugget (9%) and the discontinued Trump operations (10%).
Exhibit 3: NEW JERSEY ONLINE GAMING (~$123M in 2014)
Source: Cantor Fitzgerald Canada, New Jersey Office of the Attorney General (Division of Gaming Enforcement)
0%
10%
20%
30%
40%
50%
60%
70%
80%
90%
100%
Betting Casino Poker Bingo Skill, Lotteries
0
100,000
200,000
300,000
400,000
500,000
600,000
0
2,000
4,000
6,000
8,000
10,000
12,000
14,000
Num
ber
of A
ccou
nts
Rev
enue
(U
S$0
00s)
Internet Gross Revenue Internet Gaming Accounts

Technology – Online Gambling February 12, 2015
Ralph Garcea, MBA, P.Eng. 416-849-5004 5 of 36
California AB-167. The real opportunity in the US online market lies in California where Assemblyman Reggie Jones-Sawyer recently reintroduced an online poker bill with significant changes to the so-called “bad actor” clause (which would allow for PokerStars participation) and the inclusion of horse racing tracks. In addition, the bill removed the language preventing agreements to pool players with other states. While Internet poker was first discussed in the California state legislature in 2008, there remains a lot of work to be done to get the bill passed.
Washington and Mississippi Say No to Online Poker. The Washington State online poker bill (HB 1114) which was presented to the state legislature in early January 2015, did not get enough support to move forward in the current session. Note that Washington is the only state in the U.S. where playing online
poker is actually illegal! For a third consecutive year, Mississippi’s “Lawful Internet Gaming Act” failed to gather enough support to make it into the legislature session.
INCREASING TAXES ON ONLINE GAMBLING
U.K. POC Tax. According to GBGC, several markets (U.K., Italy, Spain, France, Denmark) have begun regulating online gambling and offering domestic licences to private companies to prevent offshore leakage of tax revenues. The U.K. introduced a new bill on December 1, 2014 which brought into play a 15% Point of Consumption (POC) tax on offshore gambling operators vs the previous tax on Point of Supply (POS) where offshore operators benefitted from low tax rates in such jurisdictions as Gibraltar, Isle of Man and Malta. According to GBGC, the higher gambling taxes may increase GGR as operators have to increase margins or rake percentages to cover the higher taxes.
New EU VAT Directive. On January 1, 2015, the European Union (EU) imposed new rules regarding the application of a value-added tax (VAT) to businesses providing telecommunications, broadcasting or electronically supplied services to customers in EU Member States (another POC-type tax, with VAT’s varying by country). Online gambling had traditionally been exempt from VAT but that decision has now been left to individual markets – Germany does not provide this exemption. According to a KPMG report, the changes will not affect businesses supplying services on a business-to-business (B2B) basis. Bwin.party is one of the first publically-traded online gambling operators to report an impact from the new EU VAT directive. BWIN has warned that the new law could cost the company an extra €15M in 2015 as Germany (~25% of revs) is charging a 19% VAT on BWIN’s casino and poker revenue from the country vs a 0% VAT previously as BWIN is based in Gibraltar and the VAT was POS-based previously.
MOBILE PENETRATION
The increase in mobile penetration for online gambling has been driven by the continued expansion of high-speed wireless broadband (3G/4G) and the growth in smartphone/tablet shipments. According to a GBGC report, gross gaming revenue (GGR) from mobile devices is expected to grow from US$1B (<5% of online total) in 2006 to ~US$21B (~32% of online total) in 2020.

Technology – Online Gambling February 12, 2015
Ralph Garcea, MBA, P.Eng. 416-849-5004 6 of 36
CONSOLIDATION CONTINUES
There were some large acquisitions in 2014, led by the GTECH/IGT (Pending), Amaya/Rational Group and Scientific Games/Bally Technologies transactions. The land-based vendors were consolidating amongst themselves (Bally/SHFL, GTECH/IGT) to gain scale and cut costs, and to move into other physical markets (Aristocrat/VGT, GCA/MGAM). Intertain Group closed two acquisitions (Mandalay Media/Vera&John) that delivered immediate scale in the Bingo and Casino markets. We expect the consolidation to continue, and for Amaya, Intertain and NYX to be active participants.
Exhibit 4: RECENT TRANSACTIONS IN THE GAMBLING SECTOR
Source: Cantor Fitzgerald Canada, FactSet, Bloomberg
HOW TO PLAY THIS IN CANADA….
We believe investors should own AYA and NYX. Both have great management teams that have experience in doing M&A transactions. Amaya will be looking to divest of some assets to help pay down debt, and may look at a Sportsbook transaction to gain scale quickly in the largest segment of the online gambling market. NYX Gaming went public in late December 2014 with a successful IPO, has already acquired the Ongame Network assets from Amaya, and has its sights set on acquiring Amaya’s Chartwell/Cryptologic assets.
Closing Date Acquirer Target Ent. Value (US$M) EV/REV EV/EBITDA
Pending Intertain Group Gamesys (Jackpotjoy) $682.5 3.4x 6.4x
Pending GTECH S.p.A. International Game Technology $6,385.9 2.8x 12.6x
12/23/2014 Intertain Group Dumarca / Vera&John $118.7 3.2x 11.0x
12/19/2014 Global Cash Access Multimedia Games $1,112.1 5.1x 10.2x
11/21/2014 Scientific Games Bally $4,978.1 4.4x 14.5x
10/21/2014 Aristocrat Video Gaming Tech $1,283.0 5.4x 8.2x
08/01/2014 Amaya Gaming Rational Group $4,900.0 4.9x 11.7x
07/14/2014 Intertain Group Mandalay Media $100.4 3.4x 6.9x
06/05/2014 Bally Dragonplay $100.0
11/25/2013 Bally SHFL $1,283.5 4.7x 15.4x
03/20/2013 William Hill Sporting Bet $656.40 2.2x
01/31/2013 Scientific Games WMS $1,549.7 2.3x 7.1x
11/20/2012 Boyd Gaming Peninsula Gaming $1,444.0 4.1x 13.2x
11/05/2012 Amaya Gaming Cadillac Jack $167.0 2.1x 4.2x
11/01/2012 Amaya Gaming Ongame Network $19.3
02/23/2012 Bally Chiligaming
01/12/2012 International Game Technology DoubleDown $420.0 4.2x 16.8x
05/05/2011 International Game Technology Entraction $90.6 1.7x 17.0x
04/26/2011 Scientific Games Barcrest $54.0
07/29/2010 PartyGaming Bwin $1,055.2 2.6x 10.6x
AVERAGES: 3.5x 11.0x

Technology – Online Gambling February 12, 2015
Ralph Garcea, MBA, P.Eng. 416-849-5004 7 of 36
Exhibit 5. Global Gambling Comparables
Source: Cantor Fitzgerald Canada, FactSet
Price Rating Target Market Cap. LTM Revenue EV/Sales EV/EBITDA P/E
Ticker (Local) (Local) (US$) (US$) 2015 2016 2015 2016 2015 2016
Amaya Inc. AYA-CA 31.25 BUY 50.00 3,281 330 5.6 5.0 13.1 10.9 16.4 11.6
NYX Gaming Group Limited NYX-CA 4.75 BUY 7.00 127 24 3.4 2.8 17.0 7.7 50.8 21.6
Great Canadian Gaming Corporation GC-CA 19.40 1,055 399 3.4 3.3 8.4 8.1 17.7 16.7
Pollard Banknote Limited PBL-CA 6.00 112 184 9.7 12.1 9.1 7.9 18.8 15.0
Imperus Technologies Corp. LAB-CA 0.58 34 - - - - - - -
DEQ Systems Corp. DEQ-CA 0.15 8 7 - - - - - -
Poydras Gaming Finance Corp PYD-CA 0.08 4 - - - - - - -
Contagious Gaming Inc. CNS-CA 0.41 11 - - - - - - -
Las Vegas From Home.com Entertainment Inc.LVH-CA 0.04 4 0 - - - - - -
International Game Technology IGT 17.15 4,265 1,968 2.9 2.7 9.3 7.7 15.2 13.3
Scientific Games Corporation Class A SGMS 12.79 1,085 1,622 1.4 1.4 3.7 3.4 -4.1 -5.8
Global Cash Access Holdings, Inc. GCA 6.67 437 581 0.6 0.6 3.0 2.2 6.6 5.7
William Hill PLC WMH-GB 3.85 5,148 2,508 2.4 2.3 10.7 10.0 15.3 14.0
Paddy Power Plc PAP-GB 68.57 3,794 1,034 3.0 2.7 14.5 12.8 24.2 21.4
Ladbrokes plc LAD-GB 1.19 1,677 1,857 1.3 1.3 8.6 8.0 14.5 12.6
Playtech plc PTEC-GB 7.19 3,219 549 5.0 4.7 11.5 10.7 16.2 15.1
bwin.party digital entertainment Plc BPTY-GB 1.01 1,267 851 1.6 1.5 9.8 9.1 21.4 19.3
Betfair Group plc BET-GB 15.88 2,242 732 2.5 2.4 13.0 11.4 26.0 21.5
Rank Group Plc RNK-GB 1.84 1,098 1,127 1.1 1.1 6.4 6.2 12.7 11.9
888 Holdings Plc 888-GB 1.72 931 425 1.7 1.7 11.6 10.5 20.4 17.7
32Red Plc TTR-GB 0.49 55 36 0.9 - 6.9 - 9.2 -
GVC Holdings PLC GVC-GB 4.54 424 273 1.8 1.7 8.0 7.6 9.0 8.8
Sportech PLC SPO-GB 0.64 200 172 1.0 1.0 4.5 4.4 13.8 13.2
GTECH S.p.A. GTK-IT 16.90 3,343 4,118 1.9 1.9 4.9 4.5 10.4 9.7
Unibet GRoup Plc Shs Swedish Depository ReceiptsUNIB-SE 473.00 1,608 510 2.6 2.4 11.3 11.1 14.9 16.0
Kambi Group plc Class B KAMBI-SE 72.50 257 42 3.6 NM 9.2 NM 19.6 NM
Net Entertainment NE AB Class B NET.B-SE 272.50 1,296 119 10.1 8.6 21.6 18.0 34.6 28.0
Mr Green & Co. AB MRG-SE 37.40 160 94 1.4 1.0 6.4 4.7 10.4 7.9
Aristocrat Leisure Limited ALL-AU 7.10 3,471 708 2.6 2.4 7.4 6.6 17.5 16.4
Ainsworth Game Technology Limited AGI-AU 2.75 683 224 2.8 2.6 7.6 6.8 12.5 11.5
AVERAGES: 2.5 2.3 9.0 8.2 15.2 13.6

February 12, 2015 Research Update
Ralph Garcea, MBA, P.Eng. [email protected] (416) 849-5004
Sales/Trading — Toronto: (416) 363-5757, (866) 442-4485
See disclosure and a description of our recommendation structure at the end of this report. 8 of 36
Company profile: Amaya is the owner of Rational Group (PokerStars/Full Tilt Poker) which runs the largest poker business in the world. Amaya also provides B2B interactive and physical gaming solutions to the regulated gaming industry.
Eq
uit
y R
ese
arc
h
AMAYA INC. What’s Next after the PokerStars/Full Tilt Poker Acquisition?
EVENT
We are initiating coverage of Amaya with a BUY recommendation, and a DCF-based one-year target price of $50.00 per share.
BOTTOM LINE
PokerStars was Transformative – What’s Next? With some of the gambling world’s biggest brands (including PokerStars and Full Tilt Poker), Amaya has amassed the largest poker business in the world (land-based, online and mobile). We expect growth to include the leveraging of the Casino assets on the PokerStars platform, as well as the move to mobile. At the end of Q3/14, PokerStars registered user base had grown to 95M from 90M in the previous quarter – Amaya is now a customer acquisition and cross-selling of products story.
FOCUS POINTS
▪ Divestitures to help pay back debt. Amaya has announced its intentions to divest of B2B assets including Cadillac Jack, Diamond Game Enterprises (DGE) and the Chartwell/ Cryptologic software development group.
▪ What about Sportsbook? Sportsbook represents ~40% of the global online gambling market. Amaya announced it will roll out its own solution in Q1/15, ahead of schedule. What if another acquisition is in the works to accelerate its move?
▪ Blue Sky Scenario. With a growing PokerStars base, a Casino roll out and a nascent Sportsbook, we could see 2016 revs of $2B and EBITDA of $900M+.
Recommendation: BUY
Symbol/Exchange: AYA/TSX
Sector: Technology - Online Gambling
All dollar values in C$ unless otherwise noted.
Current price: C$31.25
One-year target: C$50.00
Dividend / Yield ---/---
Target return 60%
Financial summary
Source: Cantor Fitzgerald Canada
Shares O/S (M) 132.56 52-Week Range $5.61 - $39.25
Market Cap ($M) 4,142.5 Avg. Weekly Volume (M) 3.15
Net Cash ($M) (2,854.2) Fiscal Year End 31-Dec
C$M 2013 2014E 2015E 2016E
Revenue 154.5 712.7 1,644.0 1,890.6
Revenue (YoY % ) 102.2% 361.2% 130.7% 15.0%
EBITDA 57.9 281.5 682.3 841.3
EBITDA margin 37.4% 39.5% 41.5% 44.5%
GAAP EPS (Diluted) (0.22) 0.85 1.35 2.77
Adjusted EPS (Diluted) (0.22) 1.04 1.99 2.85
Shares O/S 89.5 121.6 132.6 132.6
EV / Revenue 45.3x 9.8x 4.3x 3.7x
EV / EBITDA 120.9x 24.9x 10.3x 8.3x
P/E (adj. EPS) NMF 29.9x 15.7x 11.0x
0
1
2
3
4
5
$0
$10
$20
$30
$40
$50
Feb/14 Apr/14 Jun/14 Aug/14 Oct/14 Dec/14 Feb/15
Vol
ume
(M)
Pric
e ($
)
Amaya Inc. February 12, 2015
Ralph Garcea, MBA, P. Eng. 416-849-5004 9 of 36
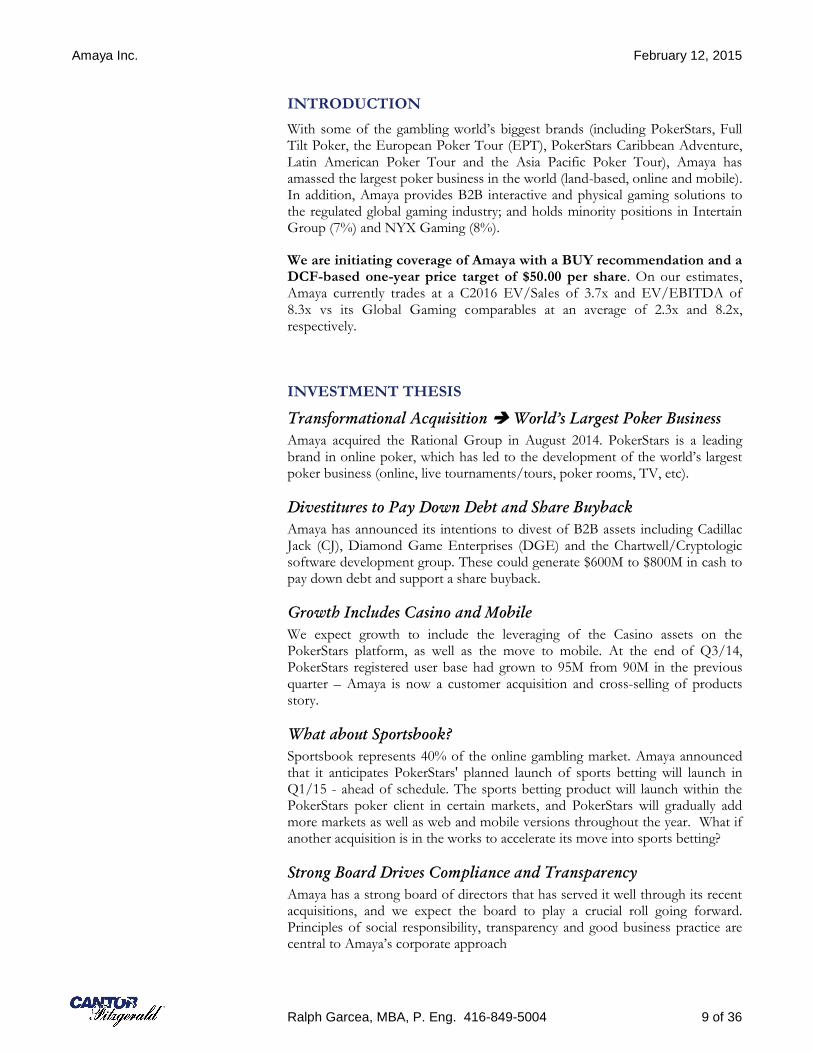
INTRODUCTION
With some of the gambling world’s biggest brands (including PokerStars, Full Tilt Poker, the European Poker Tour (EPT), PokerStars Caribbean Adventure, Latin American Poker Tour and the Asia Pacific Poker Tour), Amaya has amassed the largest poker business in the world (land-based, online and mobile). In addition, Amaya provides B2B interactive and physical gaming solutions to the regulated global gaming industry; and holds minority positions in Intertain Group (7%) and NYX Gaming (8%).
We are initiating coverage of Amaya with a BUY recommendation and a DCF-based one-year price target of $50.00 per share. On our estimates, Amaya currently trades at a C2016 EV/Sales of 3.7x and EV/EBITDA of 8.3x vs its Global Gaming comparables at an average of 2.3x and 8.2x, respectively.
INVESTMENT THESIS
Transformational Acquisition World’s Largest Poker Business
Amaya acquired the Rational Group in August 2014. PokerStars is a leading brand in online poker, which has led to the development of the world’s largest poker business (online, live tournaments/tours, poker rooms, TV, etc).
Divestitures to Pay Down Debt and Share Buyback
Amaya has announced its intentions to divest of B2B assets including Cadillac Jack (CJ), Diamond Game Enterprises (DGE) and the Chartwell/Cryptologic software development group. These could generate $600M to $800M in cash to pay down debt and support a share buyback.
Growth Includes Casino and Mobile
We expect growth to include the leveraging of the Casino assets on the PokerStars platform, as well as the move to mobile. At the end of Q3/14, PokerStars registered user base had grown to 95M from 90M in the previous quarter – Amaya is now a customer acquisition and cross-selling of products story.
What about Sportsbook?
Sportsbook represents 40% of the online gambling market. Amaya announced that it anticipates PokerStars' planned launch of sports betting will launch in Q1/15 - ahead of schedule. The sports betting product will launch within the PokerStars poker client in certain markets, and PokerStars will gradually add more markets as well as web and mobile versions throughout the year. What if another acquisition is in the works to accelerate its move into sports betting?
Strong Board Drives Compliance and Transparency
Amaya has a strong board of directors that has served it well through its recent acquisitions, and we expect the board to play a crucial roll going forward. Principles of social responsibility, transparency and good business practice are central to Amaya’s corporate approach
Amaya Inc. February 12, 2015
Ralph Garcea, MBA, P. Eng. 416-849-5004 10 of 36
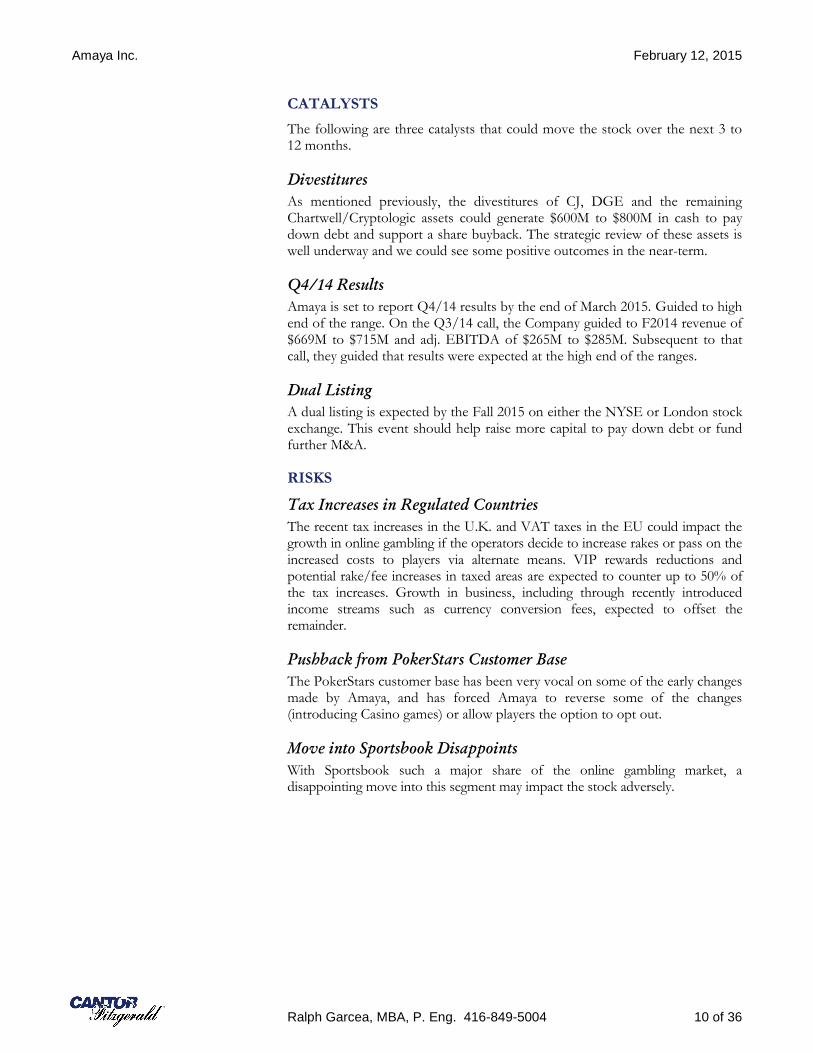
CATALYSTS
The following are three catalysts that could move the stock over the next 3 to 12 months.
Divestitures
As mentioned previously, the divestitures of CJ, DGE and the remaining Chartwell/Cryptologic assets could generate $600M to $800M in cash to pay down debt and support a share buyback. The strategic review of these assets is well underway and we could see some positive outcomes in the near-term.
Q4/14 Results
Amaya is set to report Q4/14 results by the end of March 2015. Guided to high end of the range. On the Q3/14 call, the Company guided to F2014 revenue of $669M to $715M and adj. EBITDA of $265M to $285M. Subsequent to that call, they guided that results were expected at the high end of the ranges.
Dual Listing
A dual listing is expected by the Fall 2015 on either the NYSE or London stock exchange. This event should help raise more capital to pay down debt or fund further M&A.
RISKS
Tax Increases in Regulated Countries
The recent tax increases in the U.K. and VAT taxes in the EU could impact the growth in online gambling if the operators decide to increase rakes or pass on the increased costs to players via alternate means. VIP rewards reductions and potential rake/fee increases in taxed areas are expected to counter up to 50% of the tax increases. Growth in business, including through recently introduced income streams such as currency conversion fees, expected to offset the remainder.
Pushback from PokerStars Customer Base
The PokerStars customer base has been very vocal on some of the early changes made by Amaya, and has forced Amaya to reverse some of the changes (introducing Casino games) or allow players the option to opt out.
Move into Sportsbook Disappoints
With Sportsbook such a major share of the online gambling market, a disappointing move into this segment may impact the stock adversely.

Amaya Inc. February 12, 2015
Ralph Garcea, MBA, P. Eng. 416-849-5004 11 of 36
COMPANY OVERVIEW
Company Description
Amaya was founded in 2004, and is headquartered in Montreal with a global presence across North America, Latin America, Europe, and Asia. Since its IPO in July 2010, the Company has raised over $5B in capital to execute on its “build and buy” strategy – culminating in the acquisition of the Rational Group (PokerStars) in August 2014.
Exhibit 1. How Did We Get Here?
Source: Cantor Fitzgerald Canada, Company Documents
Recent Corporate Events
Amaya recently provided a corporate update focusing on three main initiatives: (1) Exploring the divestiture of its B2B businesses to facilitate debt repayment and/or a share buyback (includes Cadillac Jack (CJ), Diamond Game Enterprises (DGE) and its online casino games supplier Amaya Online (CryptoLogic/Chartwell); (2) announcement of a normal course issuer bid (NCIB) to purchase and cancel up to 5,399,631 common shares over a one-year period, representing up to approximately 5% of the public float of Amaya's common shares as of January 9, 2015; and (3) pursue a dual listing for 2015 on either the New York or London stock exchanges. Other announcements include the following:
Date Target Announcement
July 2011 Acquired for C$22.4M.
Chartwell developed and licensed gaming software and online casino game content to leading online firms such as Partygaming and 888
April 2012
Acquired for C$35.8M.
CryptoLogic offered internet-based gaming content and electronic software products to licensees to create virtual casinos, and operated InterCasino
Nov 2012 Acquired for $177M.
Privately-owned Cadillac Jack is a leading supplier of electronic games and game systems for the global gaming market with gaming machine placements in more than 200 venues in the United States and Mexico.
Nov 2012
Acquired for up to €25M.
Ongame Network is a leading B2B online poker network provider.
Divested to games supplier partner NYX Gaming Group in Dec. 2014.
Feb 2014 Acquired for $25M.
Diamond Game was a designer and manufacturer of gaming related products for the global casino gaming and lottery industries with gaming machine placements in approximately 100 venues in the United States and Canada.
Feb 2014 Divested for C$70M less a closing working capital adjustment of C$7.5M to Intertain Group.
WagerLogic is an online casino operator that was a subsidiary of CryptoLogic.
Aug 2014
Acquired Oldford Group, parent of Rational Group, for $4.9B, including certain deferred payment subject to adjustment.
Rational Group is the owner and operator of PokerStars and Full Tilt, collectively majority market share leader in online poker.
Largest poker business in the world including largest producer of live poker events and poker programming.

Amaya Inc. February 12, 2015
Ralph Garcea, MBA, P. Eng. 416-849-5004 12 of 36
Exhibit 2. Recent Announcements
Date Announcement
Jan 21/2015 Appointed former Commissioner of the Ontario Provincial Police (OPP) Chris D. Lewis, as an advisor to its board of directors. It has also named George Sweny, a member of the Board of Directors of the Responsible Gambling Council of Canada and a gaming industry executive, as its Vice President of Strategic Ventures.
Mr. Lewis joins Ben Soave as an advisor to Amaya's board of directors. Mr. Soave, appointed in 2012, is a retired Chief Superintendent of the RCMP and internationally recognized innovator in the field of law enforcement, decorated by Canadian and foreign governments for his achievements combating organized crime and terrorism. Mr. Soave is also a member of Amaya's compliance committee.
Jan 15/2015 In December 2014 PokerStars completed the rollout of casino table games to players in eligible markets on PokerStars.com and certain domains sharing liquidity on the global network. The table games are available through the new PokerStars 7 platform, which is currently an optional download to players but which will become the sole poker client in the future. PokerStars will also launch web and mobile versions of its casino in 2015, supported by an aggressive consumer marketing campaign. Amaya announced that it anticipates PokerStars' planned launch of sports betting will launch in the first quarter of 2015, ahead of schedule. The sports betting product will launch within the PokerStars poker client in certain markets and PokerStars will gradually add more markets as well as web and mobile versions throughout the year.
Jan 12/2015 Amaya announced it intends to make a normal course issuer bid ("NCIB") to purchase and cancel up to 5,399,631 common shares over a one-year period, representing up to approximately 5% of the public float of Amaya's common shares as of January 9, 2015. The Corporation intends to fund such purchases through proceeds of certain divestments and cash on hand.
Further to Amaya's previously announced strategic review of its B2B land-based gaming solutions business, Cadillac Jack Inc., Amaya has received and is evaluating non-binding proposals from certain persons.
In the fourth calendar quarter of 2014, Amaya completed the divestiture of Ongame Network Limited, its B2B poker and platform provider, to NYX Gaming Group Ltd. ("NYX Gaming Group"), as discussed in the Corporation's November 14, 2014 earnings release. In connection with the divestiture, Amaya made a strategic investment in NYX Gaming Group via a subscription of an unsecured convertible debenture, which matures two years after the date of issuance and bears interest at 6.00% per annum, payable at maturity.
Source: Cantor Fitzgerald Canada, Company Documents
PRODUCTS AND SERVICES
PokerStars/Full Tilt Poker
For 2015, we estimate that PokerStars could generate ~$1.4B in revs and ~$600M in EBITDA. On average, the company deals 700 poker hands every second of every day with as many as 20,000 hands being played concurrently. It also runs 3,500 daily scheduled tournaments, which award more than $25 million of guaranteed prizes into the online accounts of hundreds of thousands of players each week. The company has had 481,488 players seated at the site at the same time.

Amaya Inc. February 12, 2015
Ralph Garcea, MBA, P. Eng. 416-849-5004 13 of 36
Casino
Amaya launched its Casino offering on Full Tilt Poker with table games, slots and Live Dealer. More than 30% of active poker players were playing casino games (where permitted) showing the cross-selling leverage of the strategy. In addition, 50% of Full Tilt casino players do not leave to play on other casino sites. On the PokerStars platform, table games were launched in Spain in Q3/14 achieving double-digit market share. Other casino games will be launched in Spain in 2015. According to management, the casino launches have been successful in reactivating dormant users and increasing net player deposits, with a negligible impact on poker spend. Management expects Casino customer yields to be 1.5-2.5x poker yields.
Sportsbook
Sportsbook represents 40% of the online gambling market. Amaya announced that it anticipates PokerStars' planned launch of sports betting will launch in Q1/15 - ahead of schedule. The sports betting product will launch within the PokerStars poker client in certain markets, and PokerStars will gradually add more markets as well as web and mobile versions throughout the year. What if another acquisition is in the works to accelerate its move into sports betting? From Exhibit 3 below, we see that 888, Unibet, Betsson and Betfair would all fit nicely within the Amaya fold.
Mobile
In Q3/14, mobile represented >50% of new worldwide registrations vs ~40% yoy. In the U.K., mobile represented ~66% of new registrations. The fast-paced Spin & Go application has added boost to mobile growth. We note that Casino and Sportsbook verticals respond well to a mobile offering.
COMPETITORS
In the poker market, it’s liquidity that matters most and PokerStars has the highest liquidity and tournament payouts in the world. Greater liquidity attracts more players, which translates to bigger tournaments, larger payouts and lower probability of player collusion.
Exhibit 3. Competitive Landscape – Who Has the Greatest Liquidity is Key for Poker
Source: Cantor Fitzgerald Canada, Company documents, www.PokerScout.com (as of Feb 5/2015)
Site Cash Game 7-day Average Liquidity
PokerStars.com 21,000
888poker 2,700
iPoker 2,100
Bodog 1,800
PokerStars.it 1,600
Full Tilt 1,600
PartyPoker 1,500
PokerStars.es 1,200
Winamax.fr 1,150
PokerStars.fr 950
Poker Casino Bingo Sportsbook
Amaya 100% --- --- ---
BWIN 18% 35% 9% 38%
888 29% 58% 13% ---
Unibet 5% 53% --- 42%
Betsson 5% 67% --- 38%
Betfair --- 20% --- 80%
Playtech 4% 52% 5% 8%

Amaya Inc. February 12, 2015
Ralph Garcea, MBA, P. Eng. 416-849-5004 14 of 36
FINANCIAL FORECAST
Amaya is expected to report Q4/14 results by the end of March 2015. The company has provided FY2014 guidance for revenue of $669M - $715M, and adj EBITDA of $265M - $285M, with results expected at the high end of the range.
Exhibit 4. Summary of Estimates
Source: Cantor Fitzgerald Canada, Company Documents
Exhibit 5. CFCC Estimates vs Consensus
Source: Cantor Fitzgerald Canada, Company Documents
Longer term we are looking for rev growth of 10%-15% and EBITDA to approach 45% margins.
Exhibit 6. Revenue and EBITDA margins
Source: Cantor Fitzgerald Canada, Company Documents
Forecasts Q214 Q314 Q414E Q414 %Diff. 2014E 2015E
Revenue ($M) $42.45 $238.96 $390.09 - - $712.70 $1,644.04
Adj. EBITDA $14.34 $108.39 $143.94 - - $281.54 $682.28
Adj. EPS (FD) $0.13 $0.43 $0.45 - - $1.04 $1.99
Adj. EPS (basic) $0.13 $0.59 $0.65 - - $1.40 $2.85
CFPS ($0.02) $0.85 ($1.07) - - ($0.41) $4.15
2014E 2015E 2016E
CFCC Consensus CFCC Consensus CFCC Consensus
Revenue $ 712.7 $ 716.3 $ 1,644.0 $ 1,631.0 $ 1,890.6 $ 1,831.6
Revenue (YoY %) 361.2% 363.5% 130.7% 127.7% 15.0% 12.3%
EBITDA $ 281.5 $ 286.0 $ 682.3 $ 699.4 $ 841.3 $ 840.4
EBITDA (%) 39.5% 39.9% 41.5% 42.9% 44.5% 45.9%
EPS, diluted $ 0.85 $ 0.52 $ 1.35 $ 1.43 $ 2.77 $ 2.18
Adj. EPS, diluted $ 1.04 $ 0.95 $ 1.99 $ 1.89 $ 2.85 $ 2.65
0.0%
5.0%
10.0%
15.0%
20.0%
25.0%
30.0%
35.0%
40.0%
45.0%
50.0%
0.0
100.0
200.0
300.0
400.0
500.0
600.0
Q113 Q213 Q313 Q413 Q114 Q214 Q314 Q414E Q115E Q215E Q315E Q415E Q116E Q216E Q316E Q416E
Rev
enue
($M
)
Revenue Adj EBITDA %

Amaya Inc. February 12, 2015
Ralph Garcea, MBA, P. Eng. 416-849-5004 15 of 36
CFOPS should grow to ~$700M per year, providing enough support to pay down debt, execute on the share buyback, and pursue further M&A.
Exhibit 7. CFOPS supports Debt repayment and M&A
Source: Cantor Fitzgerald Canada, Company Documents
-50
0
50
100
150
200
250
300
350
400
-500
0
500
1,000
1,500
2,000
2,500
3,000
3,500
4,000
Q113 Q213 Q313 Q413 Q114 Q214 Q314 Q414E Q115E Q215E Q315E Q415E Q116E Q216E Q316E Q416E
Css
h fr
om O
pera
tions
($M
)
Tot
al D
ebt (
$M)
Total Debt Total Cash Provided By Operating Activities

Amaya Inc. February 12, 2015
Ralph Garcea, MBA, P. Eng. 416-849-5004 16 of 36
RECOMMENDATION AND VALUATION
We are initiating coverage of Amaya with a BUY recommendation and a DCF-based one-year price target of $50.00 per share. On our estimates, Amaya currently trades at a C2016 EV/Sales of 3.7x and EV/EBITDA of 8.3x vs its Global Gaming comparables at an average of 2.3x and 8.2x, respectively.
Exhibit 8. Discounted Cash Flow Analysis
Source: Cantor Fitzgerald Canada, Company Documents
Exhibit 9. Sensitivity Analysis
Source: Cantor Fitzgerald Canada, Company Documents
AMAYA GAMING (AYA-V) CAGR
Discounted Cash Flow Analysis 2011 2012 2013 2014E 2015E 2016E 2017E 12 - 16
Revenue 18,375,249 76,435,009 154,529,443 712,698,137 1,644,042,160 1,890,648,484 2,174,245,756 123.0%
Revenue Growth 203.8% 316.0% 102.2% 361.2% 130.7% 15.0% 15.0%
EBITDA (adj.) (1,726,140) 18,870,426 57,857,871 169,785,272 682,277,496 841,338,575 1,076,251,649 158.4%
EBITDA Growth (258.3% ) (1193.2%) 206.6% 193.5% 301.8% 23.3% 27.9%
Adj. EBITDA Margin -9.4% 24.7% 37.4% 23.8% 41.5% 44.5% 49.5%
Depreciation and Amortization 2,160,005 9,958,778 33,819,451 64,221,822 52,042,628 66,620,254 82,734,227
EBIT ($) -3,886,145 8,911,648 24,038,420 105,563,450 630,234,869 774,718,322 993,517,422
NOPAT 1,907,333 (12,671,603) (926,718,702) 135,481,499 553,105,579 682,319,770 879,659,729
Unlevered Free Cash Flow ($) (1,216,547) (31,503,775) (916,617,126) (73,082,360) 854,525,568 669,576,219 953,175,715
PV of Unlevered FCFs ($) (1,590,414) (37,775,880) (1,008,355,011) (73,758,413) 791,220,552 568,647,956 742,659,827
Valuation Assumptions:
Discount Rate 9.0%
Terminal Multiple 11.00
Valuation Analysis: 1-Yr Target
Total PV of FCFs ($) 1,904,723,197
Terminal Value ($) 11,838,768,142
PV of Terminal Value ($) 10,054,256,870
Net (debt) cash position (2,305,852,026)
Total Value ($) 9,653,128,042
DCF Value/Share $50.84
FD Shares O/S 189,881,171
Terminal EV/EBITDA Multiple
$50.85 7.00 8.00 9.00 10.00 11.00 12.00 13.00
5.0% 34.84 40.01 45.17 50.34 55.51 60.68 65.85
7.0% 33.17 38.16 43.14 48.13 53.12 58.10 63.09
Discount Rate 9.0% 31.59 36.41 41.22 46.04 50.85 55.67 60.48
11.0% 30.10 34.75 39.40 44.06 48.71 53.36 58.01
13.0% 28.69 33.18 37.68 42.18 46.68 51.17 55.67
15.0% 27.35 31.70 36.05 40.40 44.75 49.10 53.45
Amaya Inc. February 12, 2015
Ralph Garcea, MBA, P. Eng. 416-849-5004 17 of 36
APPENDIX 1: MANAGEMENT AND BOARD OF DIRECTORS
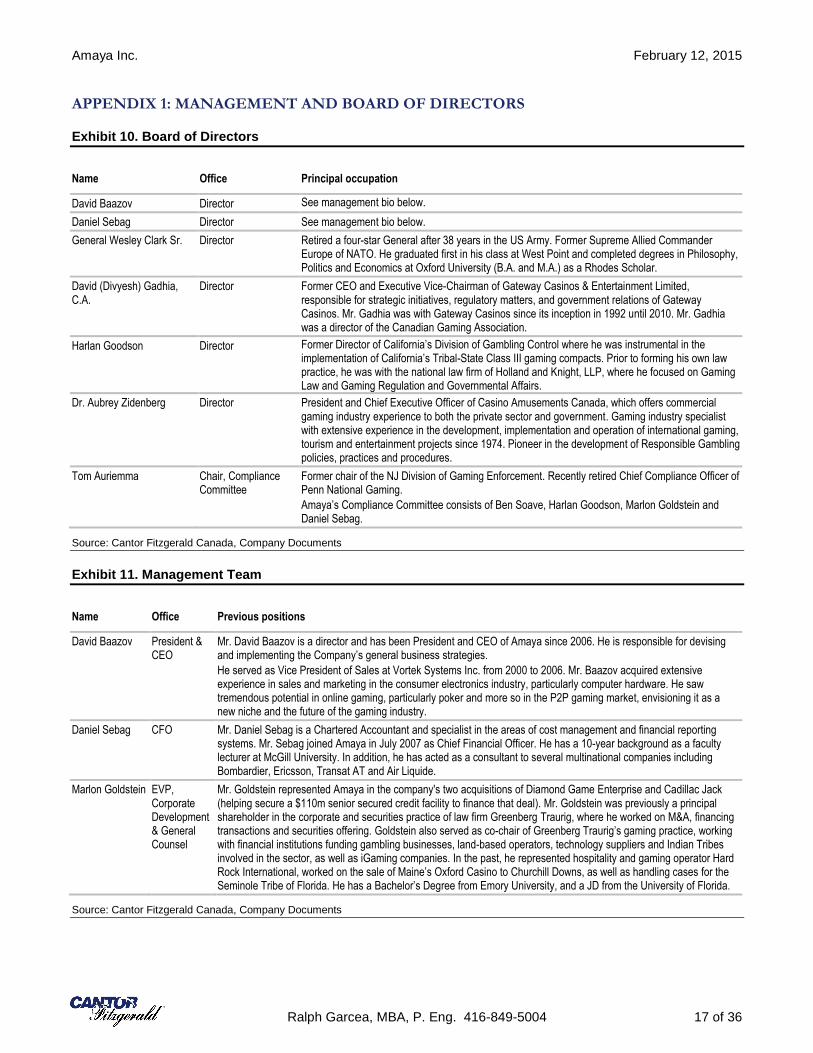
Exhibit 10. Board of Directors
Name Office Principal occupation
David Baazov Director See management bio below.
Daniel Sebag Director See management bio below.
General Wesley Clark Sr. Director Retired a four-star General after 38 years in the US Army. Former Supreme Allied Commander Europe of NATO. He graduated first in his class at West Point and completed degrees in Philosophy, Politics and Economics at Oxford University (B.A. and M.A.) as a Rhodes Scholar.
David (Divyesh) Gadhia, C.A.
Director Former CEO and Executive Vice-Chairman of Gateway Casinos & Entertainment Limited, responsible for strategic initiatives, regulatory matters, and government relations of Gateway Casinos. Mr. Gadhia was with Gateway Casinos since its inception in 1992 until 2010. Mr. Gadhia was a director of the Canadian Gaming Association.
Harlan Goodson Director Former Director of California’s Division of Gambling Control where he was instrumental in the implementation of California’s Tribal-State Class III gaming compacts. Prior to forming his own law practice, he was with the national law firm of Holland and Knight, LLP, where he focused on Gaming Law and Gaming Regulation and Governmental Affairs.
Dr. Aubrey Zidenberg Director President and Chief Executive Officer of Casino Amusements Canada, which offers commercial gaming industry experience to both the private sector and government. Gaming industry specialist with extensive experience in the development, implementation and operation of international gaming, tourism and entertainment projects since 1974. Pioneer in the development of Responsible Gambling policies, practices and procedures.
Tom Auriemma Chair, Compliance Committee
Former chair of the NJ Division of Gaming Enforcement. Recently retired Chief Compliance Officer of Penn National Gaming.
Amaya’s Compliance Committee consists of Ben Soave, Harlan Goodson, Marlon Goldstein and Daniel Sebag.
Source: Cantor Fitzgerald Canada, Company Documents
Exhibit 11. Management Team
Name Office Previous positions
David Baazov President & CEO
Mr. David Baazov is a director and has been President and CEO of Amaya since 2006. He is responsible for devising and implementing the Company’s general business strategies.
He served as Vice President of Sales at Vortek Systems Inc. from 2000 to 2006. Mr. Baazov acquired extensive experience in sales and marketing in the consumer electronics industry, particularly computer hardware. He saw tremendous potential in online gaming, particularly poker and more so in the P2P gaming market, envisioning it as a new niche and the future of the gaming industry.
Daniel Sebag CFO Mr. Daniel Sebag is a Chartered Accountant and specialist in the areas of cost management and financial reporting systems. Mr. Sebag joined Amaya in July 2007 as Chief Financial Officer. He has a 10-year background as a faculty lecturer at McGill University. In addition, he has acted as a consultant to several multinational companies including Bombardier, Ericsson, Transat AT and Air Liquide.
Marlon Goldstein EVP, Corporate Development & General Counsel
Mr. Goldstein represented Amaya in the company's two acquisitions of Diamond Game Enterprise and Cadillac Jack (helping secure a $110m senior secured credit facility to finance that deal). Mr. Goldstein was previously a principal shareholder in the corporate and securities practice of law firm Greenberg Traurig, where he worked on M&A, financing transactions and securities offering. Goldstein also served as co-chair of Greenberg Traurig’s gaming practice, working with financial institutions funding gambling businesses, land-based operators, technology suppliers and Indian Tribes involved in the sector, as well as iGaming companies. In the past, he represented hospitality and gaming operator Hard Rock International, worked on the sale of Maine’s Oxford Casino to Churchill Downs, as well as handling cases for the Seminole Tribe of Florida. He has a Bachelor’s Degree from Emory University, and a JD from the University of Florida.
Source: Cantor Fitzgerald Canada, Company Documents

Amaya Inc. February 12, 2015
Ralph Garcea, MBA, P. Eng. 416-849-5004 18 of 36
APPENDIX 2: FINANCIAL STATEMENTS
Exhibit 12. Income Statement
Source: Cantor Fitzgerald Canada, Company Documents
Income Statement (in C$000) (YE Dec 31) 2013 2014E 2015E 2016E 2017E
Total Revenue 154,529 712,698 1,644,042 1,890,648 2,174,246
Total Cost of Goods Sold 5,980 14,249 24,661 28,360 32,614
Total Gross Profit 148,549 698,449 1,619,382 1,862,289 2,141,632
Selling Expenses 14,590 80,304 115,083 113,439 130,455
G&A 132,585 437,256 854,902 945,324 978,411
Financial 19,569 25,794 0 0 0
Acquisition related costs 1,332 21,934 0 0 0
Amortization of Property & Equipment 12,734 8,876 52,043 66,620 82,734
Amortization of Intangibles 19,361 0 0 0 0
Amortization of deferred development costs 1,725 0 0 0 0
Total Operating Expenses 168,076 574,163 1,022,028 1,125,383 1,191,600
Operating Income (19,527) 124,286 597,354 736,905 950,033
Interest Expense 0 (33,940) (186,378) (148,615) (111,221)
Total Other Income 9,673 11,280 (186,378) (148,615) (111,221)
EBT (9,854) 135,566 410,976 588,291 838,812
Income Taxes (9,646) 11,203 (32,878) (47,063) (67,105)
Total Comprehensive Income (Loss) to Company (19,500) 102,739 378,098 541,227 771,707
Minority Interest 0 0 0 0 0
Net Income to Common Shareholder (19,500) 102,739 378,098 541,227 771,707
EPS - Excluding Non-Recurring Items
Basic EPS - GAAP 0.08 1.40 2.85 4.08 5.82
Basic EPS - ex-non-recurring items 0.08 1.04 1.99 2.85 4.06
Shares Outstanding
Basic 89,491 121,559 132,559 132,559 132,559
Diluted 89,838 164,021 189,881 189,881 189,881
Operating Metrics
Gross Profit 148,549 698,449 1,619,382 1,862,289 2,141,632
Adj EBITDA 57,858 281,536 682,277 841,339 1,076,252
EBITDA 37,394 169,785 682,277 841,339 1,076,252
EBIT (19,527) 124,286 597,354 736,905 950,033
EBT (9,854) 135,566 410,976 588,291 838,812
Net Income (ex-non-recurring items) (19,500) 146,768 378,098 541,227 771,707

Amaya Inc. February 12, 2015
Ralph Garcea, MBA, P. Eng. 416-849-5004 19 of 36
Exhibit 13. Balance Sheet
Source: Cantor Fitzgerald Canada, Company Documents
Balance Sheet (in C$000) (YE Dec 31) 2013 2014E 2015E 2016E 2017E
Current Assets
Cash 93,640 210,169 308,234 249,642 420,428
Trade & Other Receivables 47,460 387,777 199,929 229,918 264,406
Oldford acq. Receivables & Other current assets 0 0 0 0
Investment tax credit - current 112 176 176 176 176
Capital Assets 38,369 0 0 0 0
Investment in marketable securities 0 368,910 368,910 368,910 368,910
Current maturity of rec. under finance lease 4,865 4,095 4,095 4,095 4,095
Inventories 7,595 61,517 55,365 63,670 73,220
Income taxes recoverable 520 8,687 8,687 8,687 8,687
Prepaid Expenses 4,173 13,873 12,486 14,359 16,513
Total Current Assets 196,735 1,055,204 957,882 939,457 1,156,435
Non-Current Assets
Restricted Cash 131 42,945 42,945 42,945 42,945
Investments 10,582 38,646 38,646 38,646 38,646
Vendor Takeback 0 29,805 29,805 29,805 29,805
Property & Equipment 40,521 104,460 127,891 157,391 199,961
Deferred Tax Assets 13,330 60,969 60,969 60,969 60,969
Deferred development costs 3,818 8,722 8,722 8,722 8,722
Receivable under finance lease 10,004 6,960 6,960 6,960 6,960
Investment tax credit receivable long-term 2,673 12,881 12,881 12,881 12,881
Goodwill 79,975 5,555,588 5,555,588 5,555,588 5,555,588
Intangible Assets 83,062 0 0 0 0
Total Assets 440,831 6,916,180 6,842,289 6,853,363 7,112,913
Current Liabilities
Trade & Other Payables 27,477 247,775 376,789 433,308 498,304
Oldford acq. Accounts payable and accrued liabilities 0
FX contracts 0 0 0 0 0
Provisions 3,685 41,967 41,967 41,967 41,967
Income taxes payable 1,763 19,059 19,059 19,059 19,059
Short-Term Debt 0 0 0 0 0
Held for Sale 4,638 0 0 0 0
Customer Deposits 4,453 676,111 676,111 676,111 676,111
Unearned Revenue 0 2,248 2,697 3,102 3,567
Promissory Notes 0 0 0 0 0
Current Portion of Long-Term Debt 2,388 86,295 114,397 121,997 131,914
Current Portion of Ob. Under Capital Lease 1,133 1,395 1,395 1,395 1,395
Total Current Liabilities 45,537 1,074,850 1,232,416 1,296,939 1,372,318
Non-Current Liabilities
Deferred Revenue 249 1,985 1,985 1,985 1,985
Other payable 0 14,466 14,466 14,466 14,466
Holdback 0 7,840 7,840 7,840 7,840
Employee future benefits 0 0 0 0 0
Provisions 1,547 392,081 392,081 392,081 392,081
Income taxes payable 0 0 0 0 0
Deferred Income Tax Liabilities 5,802 33,432 33,432 33,432 33,432
Convertible debentures 0 0 0 0 0
Long-Term Debt 192,799 3,239,801 2,597,365 1,964,876 1,333,855
Deferred Purchase Price 0 0 0 0
Obligations Under Capital Lease 551 0 0 0 0
Total Liabilities 246,484 4,764,456 4,279,585 3,711,619 3,155,977
Shareholders' Equity
Capital Stock 220,683 1,640,562 1,640,562 1,640,562 1,640,562
Contributed Surplus 4,214 383,211 416,092 453,905 497,389
Deficit (39,388) 0 0 0 0
Non-controlling interest 0 (133) (133) (133) (133)
Other comprehensive loss 8,838 62,345 62,345 62,345 62,345
Retained Earnings 0 65,740 443,838 985,065 1,756,772
Total Shareholders Equity 194,347 2,151,724 2,562,704 3,141,744 3,956,935
Total Liabilities & Shareholders Equity 440,831 6,916,180 6,842,289 6,853,363 7,112,913

Amaya Inc. February 12, 2015
Ralph Garcea, MBA, P. Eng. 416-849-5004 20 of 36
Exhibit 14. Cash Flow Statement
Source: Cantor Fitzgerald Canada, Company Documents
Cash Flow Statement (in C$000) (YE Dec 31) 2013 2014E 2015E 2016E 2017E
Cash Provided By Operating Activities
Net Income (29,173) 104,994 378,098 541,227 771,707
Depreciation 33,819 64,222 52,043 66,620 82,734
Deferred Income Tax (553) (26,611) 0 0 0
Interest Accretion on Special Warrants 1,493 3,657 0 0 0
R&D tax credits 256 0 0 0 0
Interest Paid 0 2,954 0 0 0
Stock-Based Compensation 2,030 10,829 32,881 37,813 43,485
Investment in lease (9,303) 2,286 0 0 0
Unrealized Loss (Gain) on FX (2,542) (6,915) 0 0 0
Change in Non-Cash Working Capital
Trade & Other Receivables 6,129 (220,556) 187,848 (29,989) (34,488)
Work in Process 0 0 0 0 0
Income Taxes Receivable 4,270 3,222 0 0 0
Inventories 1,812 (50,188) 6,152 (8,305) (9,550)
Trade & Other Payables (6,967) 20,290 129,014 56,518 64,996
Unrealised Exchange (Gain) Loss 0 0 0 0 0
Unearned Revenue 77 1,523 450 405 465
Total Cash Provided By Operating Activities (60) (66,521) 787,873 662,417 917,195
Investing Activities
Purchase of Property & Equipment (17,430) (28,442) (75,474) (96,120) (125,305)
Proceeds from Sale of Property & Equipment 352 (2,147) 0 0 0
Purchase of Intangibles (18,736) (6,554) 0 0 0
Invest. in marketable sec./business acqs. 0 7,850 0 0 0
Asset acquisition 14,418 (4,577,054) 0 0 0
Deferred Development costs (11,025) (9,294) 0 0 0
Total Cash From Investing Activities (57,422) (4,615,641) (75,474) (96,120) (125,305)
Financing Activities
Proceeds from Common Shares/Units/Bonds 43,711 1,846,169 0 0 0
Repayment of Bal. of Payable to Former Shlders 0 0 0 0 0
Trans. costs related to capital stock issuance (4,846) (99,502) 0 0 0
Issuance of capital stock 43,711 7,132 0 0 0
Net Variation in Bank Advances 0 0 0 0 0
Proceeds from Promissory Notes 0 0 0 0 0
Repayment of Obligations Under Promisory Notes 0 0 0 0 0
Addition of Long-Term Debt 193,337 3,150,238 0 0 0
Repayment of Long-Term Debt (114,114) (70,110) (614,334) (624,889) (621,104)
Total Cash From Financing Activities 114,844 4,826,795 (614,334) (624,889) (621,104)
Effect of exchange rates on cash 4,950 14,712 0 0 0
Net Increase in cash 62,313 159,345 98,065 (58,592) 170,786
Beginning Cash 31,328 93,640 253,114 351,179 292,587
Ending Cash 93,640 253,114 351,179 292,587 463,373

Amaya Inc. February 12, 2015
Ralph Garcea, MBA, P. Eng. 416-849-5004 21 of 36
This page is intentionally left blank.

February 12, 2015 Research Update
Ralph Garcea, MBA, P.Eng. [email protected] 416-849-5004
Sales/Trading — Toronto: (416) 363-5757, (866) 442-4485
See disclosure and a description of our recommendation structure at the end of this report. 22 of 36
Eq
uit
y R
ese
arc
h
Company profile: NYX Gaming Group provides flexible
gaming solutions to some of the largest lotteries, casinos, poker rooms and I-gaming operators across the globe.
NYX GAMING GROUP LTD. The New Kid on the Block
EVENT
We are initiating coverage of NYX Gaming with a BUY recommendation, and a DCF-based one-year target price of $7.00 per share.
BOTTOM LINE
Content is King. NYX Gaming is a digital gaming software supplier engaged in the design, development, manufacture, and distribution of digital gaming solutions for interactive, social, land-based and mobile gaming worldwide. With an exclusive focus on content and technology development, thus reducing potential conflicts with its customers, NYX’s platform has 350+ proprietary, and 550+ third-party supplied, lottery, bingo, and casino products developed to address the multi-channel content and distribution strategies of its customers. In addition, NYX is creating 25-50 new games annually.
FOCUS POINTS
▪ Recurring Revenue Model. With over 90% of revs recurring in nature, NYX provides good visibility into its long term forecasts.
▪ Blue chip customer base, with low concentration. NYX has 100+ customers such as Amaya, 888, bwin.party and many more global players. Top 10 represent only ~55% of revs, with only 2 customers above 10%.
▪ Experienced M&A Team. NYX has completed three acquisitions to date: NYX Interactive AB, Zen Entertainment, and Ongame Networks. We expect NYX to continue on the M&A trail.
Recommendation: BUY
Symbol/Exchange: NYX/TSX-V
Sector: Technology - Online Gambling
All dollar values in C$ unless otherwise noted.
Current price: C$4.75
One-year target: C$7.00
Dividend / Yield ---/---
Target return: 47.4%
Financial summary
Source: Company documents, Cantor Fitzgerald Canada
Shares O/S (M) 33.8 52-Week Range $3.25 - $5
Market Cap ($M) 160.5 Avg. Weekly Volume (M) 2.82
Net Cash ($M) (33.4) Fiscal Year End 31-Dec
C$M 2013 2014E 2015E 2016E
Revenue 18.7 26.6 36.7 47.4
Revenue (YoY % ) 39.5% 42.0% 38.1% 29.1%
Adj. EBITDA 2.7 7.6 8.5 13.3
Adj. EBITDA margin 14.6% 28.6% 23.2% 28.0%
GAAP EPS (Diluted) (0.07) 0.05 0.12 0.25
Adjusted EPS (Diluted) (0.07) 0.05 0.12 0.25
Shares O/S 25.7 29.5 33.8 33.8
EV / Revenue 6.8x 4.8x 3.5x 2.7x
EV / EBITDA NMF 16.7x 15.0x 9.6x
P/E (adj. EPS) NMF 87.1x 40.9x 19.0x
0
1
2
3
4
5
$0
$1
$2
$3
$4
$5
$6
Dec/14 Jan/15 Jan/15 Jan/15 Jan/15 Feb/15
Vol
ume
(M)
Pric
e ($
)

NYX Gaming Group Ltd. February 12, 2015
Ralph Garcea, MBA, P. Eng. 416-849-5004 23 of 36
INTRODUCTION
NYX Gaming is a digital gaming software supplier engaged in the design, development, manufacture, and distribution of digital gaming solutions for interactive, social and mobile gaming worldwide. With 270+ employees (including over 24 contract employees) and 100+ B2B customers, NYX has a registered office in Guernsey and principal offices in the U.S., Sweden, and Australia. With an exclusive focus on content and technology development, thus reducing potential conflicts with its customers, NYX’s platform has more than 350 proprietary, and over 550 third-party supplied, lottery, bingo, and casino products developed to address the multi-channel content and distribution strategies of its customers.
We are initiating coverage of NYX Gaming with a BUY recommendation and a DCF-based one-year price target of $7.00 per share. On our estimates, NYX currently trades at a C2016 EV/Sales of 2.7x and EV/EBITDA of 9.6x vs its Global Gaming comparables at an average of 2.3x and 8.2x, respectively.
INVESTMENT THESIS
Full Suite of Products Built on an Open Technology Platform
NYX has developed a proprietary content library of 350+ gaming titles within a portfolio of slots, bingo, lottery, poker and other casino games. Through NYX Open Gaming System (“OGS”), NYX provides access to 550+ games through its integrated third-party content suppliers. NYX’s open technology platform and partnerships with leading content providers and 30+ payment processors, provides flexibility in game content delivery, payment processing, geolocation technology, fraud prevention, affiliate management, and business analytical tools, allowing its customers to respond to market changes and select products and services that directly address their evolving needs.
Recurring Revenue Business Model
With over 90% of revs recurring in nature, NYX provides good visibility into its long term forecasts.
Blue-Chip Customer Base
NYX has 100+ customers, including Amaya, Intertain, 888, bwin.party, Mr. Green, William Hill and many more on and off-line gaming operators, state-regulated lotteries, media and entertainment firms, and land-based casinos. Most customers sign long-term deals, and the average relationship with its top ten customers is five years. NYX has a low customer concentration as its top ten customers represent only 55% of revenues and no single customer represented more than 12% of revenues for the nine months ended September 30, 2014.
Experienced Management Team
The Company has completed two acquisitions since its inception – NYX Interactive AB and Zen Entertainment. In addition, NYX recently acquired Ongame Networks from Amaya. We expect NYX to continue doing acquisitions to supplement its growth strategy. Note that management owns ~35% of the company.
NYX Gaming Group Ltd. February 12, 2015
Ralph Garcea, MBA, P. Eng. 416-849-5004 24 of 36
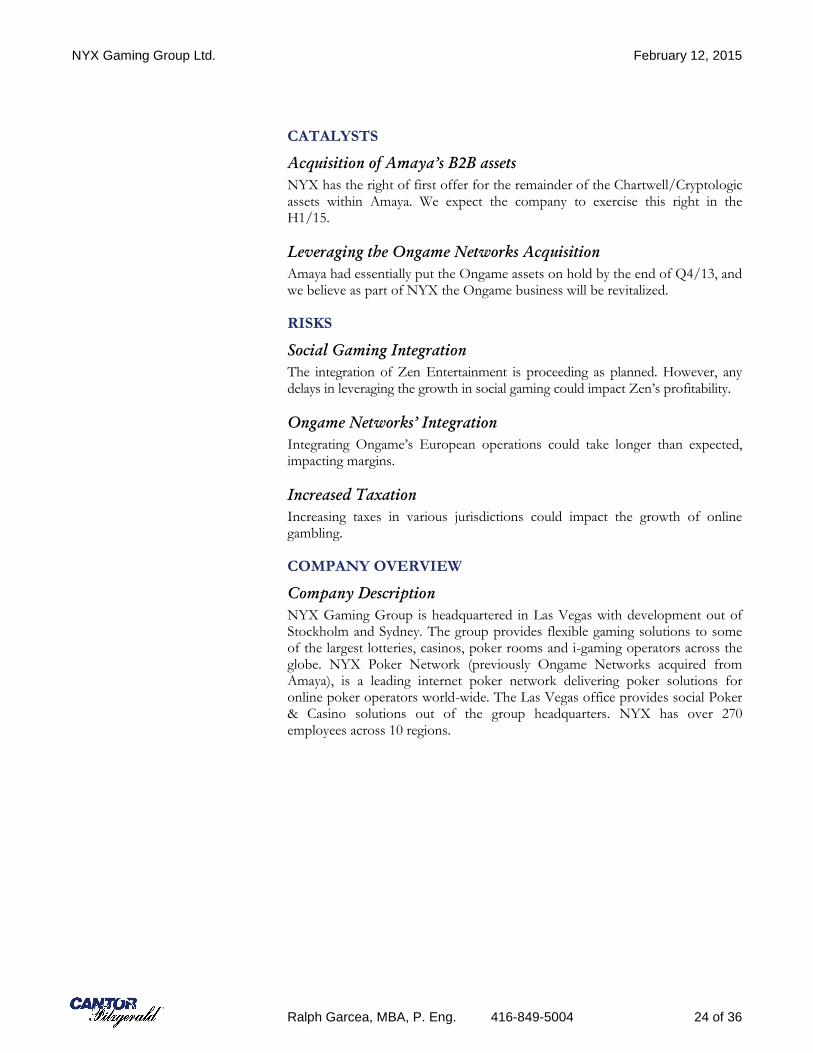
CATALYSTS
Acquisition of Amaya’s B2B assets
NYX has the right of first offer for the remainder of the Chartwell/Cryptologic assets within Amaya. We expect the company to exercise this right in the H1/15.
Leveraging the Ongame Networks Acquisition
Amaya had essentially put the Ongame assets on hold by the end of Q4/13, and we believe as part of NYX the Ongame business will be revitalized.
RISKS
Social Gaming Integration
The integration of Zen Entertainment is proceeding as planned. However, any delays in leveraging the growth in social gaming could impact Zen’s profitability.
Ongame Networks’ Integration
Integrating Ongame’s European operations could take longer than expected, impacting margins.
Increased Taxation
Increasing taxes in various jurisdictions could impact the growth of online gambling.
COMPANY OVERVIEW
Company Description
NYX Gaming Group is headquartered in Las Vegas with development out of Stockholm and Sydney. The group provides flexible gaming solutions to some of the largest lotteries, casinos, poker rooms and i-gaming operators across the globe. NYX Poker Network (previously Ongame Networks acquired from Amaya), is a leading internet poker network delivering poker solutions for online poker operators world-wide. The Las Vegas office provides social Poker & Casino solutions out of the group headquarters. NYX has over 270 employees across 10 regions.

NYX Gaming Group Ltd. February 12, 2015
Ralph Garcea, MBA, P. Eng. 416-849-5004 25 of 36
Exhibit 1. A Global Footprint Supports Further Acquisitions
Source: Cantor Fitzgerald Canada, Company Documents
Exhibit 2. How Did We Get Here?
Source: Cantor Fitzgerald Canada, Company Documents
Date Event
1999
NextGen Gaming was founded in Sydney, Australia
2006
NYX Interactive launched in Stockholm, Sweden
Launched the NYX Open Platform System (OPS)
2008
Nordic Ventures (now known as Verdane Capital) made initial equity investment, with subsequent investments totalling €10M.
2009
Launched Game Development Module (GDM)
2010 NextGen Gaming was reorganized as RNG Holdings Guernsey
2011 NYX Gaming Group formed through the merger of RNG Holdings Guernsey and NYX Interactive.
2012
Expanded into the U.S. through the formation of NextGen Gaming (USA) in Nevada
Launched NYX Open Gaming System (OGS)
Launched NYX Move, a mobile gaming and social application providing a portfolio of games for social networks
2013
Entered B2C Social Gaming industry through the acquisition of Zen Entertainment.
Expanded presence in the U.S. online gaming market through a joint venture with Sportech Plc and formed SNG Interactive.
2014
Signed first partner in U.S. market – Resorts Casino
Completed successful IPO on the TSX-V; started trading on Dec 30/14
Acquired Ongame Network for a consideration equal to 8.0x 2015 EBITDA; rebranded as NYX Poker
Raised an additional $10M through a convertible debenture issued to Amaya

NYX Gaming Group Ltd. February 12, 2015
Ralph Garcea, MBA, P. Eng. 416-849-5004 26 of 36
Recent corporate events
NYX completed its initial public offering, and started trading on the Toronto Venture Exchange, on December 30, 2014 at an initial price of $3.50. As part of the IPO process, NYX acquired Ongame Network from Amaya. Post the IPO, we have seen several announcements from the Company.
Exhibit 3. Recent Announcements from NYX
Date Announcement
Feb 6/15 NextGen Gaming announced a partnership with Lightning Box Games (LBG) to create and distribute online LBG’s traditionally land based slot games.
Feb 5/15 NYX entered new regulated markets with the launch of NYX OGS and the signing of its NYX Poker product with Iveriabet.
Feb 3/15 NYX announced the signing of White Hat Gaming for its NYX Poker product, formerly Ongame Network.
Jan 30/15 NYX announced the appointment of Mr. Hamish Brown as Group Chief Operating Officer (COO). Mr. Brown has 18 years of experience in the gaming industry in various operational and commercial roles at IGT (Australia), Aristocrat and Tabcorp, before transitioning to iGaming in 2008 as NextGen Gaming's COO and General Manager in Sydney, Australia.
Jan 22/15 NextGen Gaming announced the debut of its slot games on paddypower.com, with the dual mobile and desktop launch of smash hit Merlin's Millions Superbet™.
Jan 12/15 NextGen Gaming to release Psycho under agreement with Universal Partnerships & Licensing. The online slot is due to be released in Q1/15.
Source: Cantor Fitzgerald Canada, Company Documents
PRODUCTS AND SERVICES
NYX has developed a modular open architecture that is flexible to adapt to both regulatory and operational requirements.
Exhibit 4. Open Architecture Platform and Technology
Source: Cantor Fitzgerald Canada, Company Documents
NYX Gaming is a digital gaming software supplier engaged in the design, development, manufacture, and distribution of digital gaming solutions for

NYX Gaming Group Ltd. February 12, 2015
Ralph Garcea, MBA, P. Eng. 416-849-5004 27 of 36
interactive, social, land-based and mobile gaming worldwide. NYX also offers a fully-hosted Social casino, GDM integration and free-to-play poker platform.
Exhibit 5. Content is King
Multi-platform products
Source: Cantor Fitzgerald Canada, Company Documents
COMPETITORS
NYX’s competitors range from small private software studios to large publicly listed companies and vary significantly depending on the jurisdiction and customer base. NYX’s open platform allows it to aggregate its own proprietary content (350+ games) as well as 550+ games from best-of-breed third party content including Amaya, GTECH, Scientific Games, Aristrocrat and Net Entertainment.
BUSINESS MODEL
NYX generates revenue from many streams, with the many segments being Content Development (51% of revs), Platform/Technology (39%) and Social Gaming (10%).
Exhibit 6. NYX Business Model
Source: Cantor Fitzgerald Canada, Company Documents

NYX Gaming Group Ltd. February 12, 2015
Ralph Garcea, MBA, P. Eng. 416-849-5004 28 of 36
On a more granular level, the splits are roughly as follows:
Exhibit 7. Revenue by Segment
Segment % of Revs Recurring
Royalties/Licensing Fees ~80% Yes
Advertising/Virtual Currency ~10% Yes
Maintenance/Support Fees <5% Yes
Upfront Development Fees ~5% No
Professional Services Fees <5% No
Source: Cantor Fitzgerald Canada, Company Documents
NYX Gaming Group Ltd. February 12, 2015
Ralph Garcea, MBA, P. Eng. 416-849-5004 29 of 36
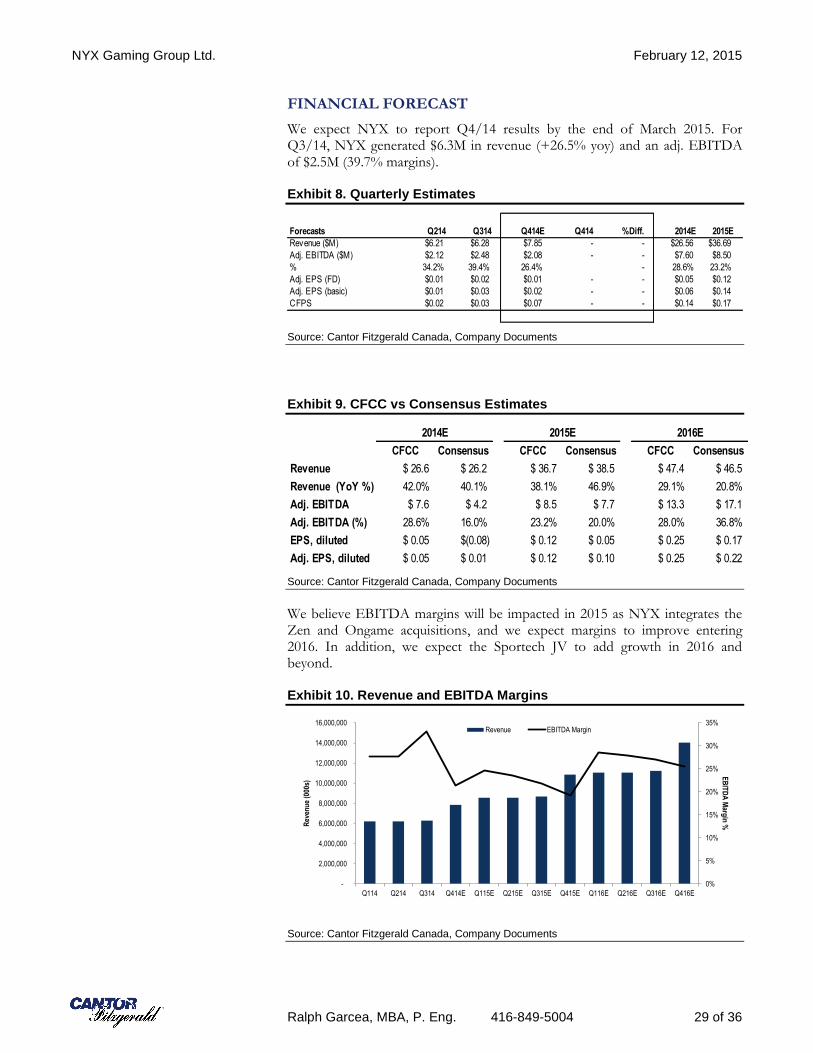
FINANCIAL FORECAST
We expect NYX to report Q4/14 results by the end of March 2015. For Q3/14, NYX generated $6.3M in revenue (+26.5% yoy) and an adj. EBITDA of $2.5M (39.7% margins).
Exhibit 8. Quarterly Estimates
Source: Cantor Fitzgerald Canada, Company Documents
Exhibit 9. CFCC vs Consensus Estimates
Source: Cantor Fitzgerald Canada, Company Documents
We believe EBITDA margins will be impacted in 2015 as NYX integrates the Zen and Ongame acquisitions, and we expect margins to improve entering 2016. In addition, we expect the Sportech JV to add growth in 2016 and beyond.
Exhibit 10. Revenue and EBITDA Margins
Source: Cantor Fitzgerald Canada, Company Documents
Forecasts Q214 Q314 Q414E Q414 %Diff. 2014E 2015E
Revenue ($M) $6.21 $6.28 $7.85 - - $26.56 $36.69
Adj. EBITDA ($M) $2.12 $2.48 $2.08 - - $7.60 $8.50
% 34.2% 39.4% 26.4% - 28.6% 23.2%
Adj. EPS (FD) $0.01 $0.02 $0.01 - - $0.05 $0.12
Adj. EPS (basic) $0.01 $0.03 $0.02 - - $0.06 $0.14
CFPS $0.02 $0.03 $0.07 - - $0.14 $0.17
2014E 2015E 2016E
CFCC Consensus CFCC Consensus CFCC Consensus
Revenue $ 26.6 $ 26.2 $ 36.7 $ 38.5 $ 47.4 $ 46.5
Revenue (YoY %) 42.0% 40.1% 38.1% 46.9% 29.1% 20.8%
Adj. EBITDA $ 7.6 $ 4.2 $ 8.5 $ 7.7 $ 13.3 $ 17.1
Adj. EBITDA (%) 28.6% 16.0% 23.2% 20.0% 28.0% 36.8%
EPS, diluted $ 0.05 $(0.08) $ 0.12 $ 0.05 $ 0.25 $ 0.17
Adj. EPS, diluted $ 0.05 $ 0.01 $ 0.12 $ 0.10 $ 0.25 $ 0.22
0%
5%
10%
15%
20%
25%
30%
35%
-
2,000,000
4,000,000
6,000,000
8,000,000
10,000,000
12,000,000
14,000,000
16,000,000
Q114 Q214 Q314 Q414E Q115E Q215E Q315E Q415E Q116E Q216E Q316E Q416E
EB
ITD
A M
argin
% R
even
ue
(000
s)
Revenue EBITDA Margin

NYX Gaming Group Ltd. February 12, 2015
Ralph Garcea, MBA, P. Eng. 416-849-5004 30 of 36
RECOMMENDATION AND VALUATION
We are initiating coverage of NYX Gaming with a BUY recommendation and a DCF-based one-year price target of $7.00 per share. On our estimates, NYX currently trades at a C2016 EV/Sales of 2.7x and EV/EBITDA of 9.6x vs its Global Gaming comparables at an average of 2.3x and 8.2x, respectively.
Exhibit 11. Discounted Cash Flow Analysis
Source: Cantor Fitzgerald Canada, Company Documents
Exhibit 12. Sensitivity Analysis
Source: Cantor Fitzgerald Canada, Company Documents
NYX GAMING GROUP LIMITED CAGR
Discounted Cash Flow Analysis F2011 F2012 F2013 F2014E F2015E F2016E F2017E F12 - F17
Revenue 7,407,727 12,238,301 18,704,946 26,563,326 36,687,202 47,367,418 56,840,902 36.0%
Revenue Growth #DIV/0! 65.2% 52.8% 42.0% 38.1% 29.1% 20.0%
EBITDA -1,755,116 -2,699,743 -2,237,393 7,199,120 8,098,458 12,857,935 19,348,862
EBITDA Growth #DIV/0! 53.8% (17.1% ) (421.8% ) 12.5% 58.8% 50.5%
EBITDA Margin -23.7% -22.1% -12.0% 27.1% 22.1% 27.1% 34.0%
Depreciation and Amortization 1,583,118 3,814,627 4,275,960 4,558,385 3,700,529 2,577,211 1,798,529
EBIT ($) -3,338,234 -6,514,370 -6,513,353 2,640,735 4,397,930 10,280,724 17,550,333
NOPAT -1,634,530 -2,298,209 -1,833,767 4,351,969 5,484,566 10,280,724 13,500,257
Plus Amortization ($) 1,583,118 3,814,627 4,275,960 4,558,385 3,700,529 2,577,211 1,798,529
Less Capital Expenditures ($) -1,353,114 -308,189 -149,370 -129,872 -39,610 -41,416 -40,596
Capital Intensity 18.3% 2.5% 0.8% 0.5% 0.1% 0.1% 0.1%
Net Working Capital Changes -1,029,438 688,111 -825,239 -1,236,376 -1,522,680 -3,264,907 -1,029,641
EPS (ex-non-recurring items) (0.07) (0.08) (0.07) 0.05 0.12 0.25 0.31
Unlevered Free Cash Flow ($) -2,433,964 1,896,340 1,467,584 7,544,107 7,622,805 9,551,613 14,228,548 49.6%
PV of Unlevered FCFs ($) -3,276,186 2,319,875 1,632,145 7,627,300 7,006,242 7,978,861 10,805,183 36.0%
Valuation Assumptions:
Discount Rate 10.0%
Terminal Multiple 11.00x
Valuation Analysis: 1-Yr Target
Total PV of FCFs ($) 22,287,165
Terminal Value ($) 212,837,482
PV of Terminal Value ($) 195,622,327
Net (debt) cash position 51,767,219
Total Value ($) 269,676,711
DCF Value/Share $6.78
FD Shares O/S 39,753,537
Terminal EV/EBITDA Multiplier
$6.78 8.00 9.00 10.00 11.00 12.00 13.00 14.00
6.0% 5.61 6.07 6.53 7.00 7.46 7.92 8.38
8.0% 5.52 5.98 6.43 6.89 7.34 7.80 8.25
Discount Rate 10.0% 5.44 5.89 6.34 6.78 7.23 7.68 8.13
12.0% 5.36 5.80 6.24 6.68 7.12 7.56 8.00
14.0% 5.29 5.72 6.15 6.59 7.02 7.46 7.89
16.0% 5.22 5.64 6.07 6.50 6.92 7.35 7.78

NYX Gaming Group Ltd. February 12, 2015
Ralph Garcea, MBA, P. Eng. 416-849-5004 31 of 36
APPENDIX 1: MANAGEMENT AND BOARD OF DIRECTORS
Exhibit 13. Board of Directors
Name Office Principal occupation
James Lanthier Toronto,Ontario
Chairman CEO of RAM Equity Former COO, CFO and Vice Chairman of Mood Media
Matt Davey Las Vegas, NV
Director See management bio below.
Roger Buckeridge
Australia
Director Former owner of venture capital fund manager
Involved in 50+ start-up technology-based companies
Eric Matejevich
United States
Director Former COO of Atlantic Club Casino (formerly Atlantic City Hilton)
Former CFO for entities of Resorts International Holdings
Staffan Lindgren
Stockholm, Sweden
Director Founder and former CEO of NYX Interactive with 20+ years
of experience in technology and finance sectors
Source: Cantor Fitzgerald Canada, Company Documents
Exhibit 14. Senior Management
Name Office Previous positions
Matt Davey CEO Mr. Davey joined NextGen in 2000 as the VP of Technology, was appointed to Executive Director in 2003, and was named CEO in 2005. Mr. Davey has over 20 years of experience in the gaming industry, having worked in both the private and public sectors as a gaming regulator as well as a consultant and gaming industry executive. Mr. Davey’s core competencies include regulatory compliance, sales and marketing, international relations, and corporate strategy and governance. Mr. Davey received a Bachelor of Engineering from Northern Territory University, Australia.
Staffan Lindgren Sales Director of Lotteries, NYX Interactive AB
Mr. Lindgren has been in the technology and finance sector for more than 20 years. Mr. Lindgren was one of the founders of NYX Interactive AB in 2006 and was the Chief Executive Officer of NYX Interactive AB from 2006 through 2010, until he joined the Board of Directors in 2011. Following the acquisition of NYX Interactive AB by the Company, Mr. Lindgren was appointed to his current position as Sales Director, Lotteries. Prior to his tenure with NYX Interactive AB, Mr. Lindgren co-founded TSG AB, a company focused on solutions for high intensive transaction environments.
Matthew J. Stafford
General Counsel
From 2009 until July 2014, Mr. Stafford was with Aruze Gaming America Inc., where he most recently served as Assistant General Counsel. During his tenure at Aruze, one of the fastest growing slot machine and video table game companies in the world, Mr. Stafford secured over 150 gaming licenses in North America and other major global gaming jurisdictions, and negotiated gaming contracts with some of the major land-based operators around the world. Mr. Stafford received a Bachelor of Arts in Political Science from the University of New Mexico and a Juris Doctor from the William S. Boyd School of Law, University of Nevada, Las Vegas, and was admitted to practice by the State Bar of Nevada and the United States District Court, District of Nevada.
Arthur Elliott Hamilton IV
CFO Prior to joining the company in July 2014, Mr. Hamilton served as Chief Accounting Officer and Executive Vice President for Spectrum Group International. Mr. Hamilton served as Senior Manager, Internal Audit, for Franklin Templeton Investments from 2009 to May 2010, and as Internal Audit Manager from 2003 to 2006. Mr. Hamilton also served as Director of Internal Audit for MGM Resorts International from 2006 to 2008, and as Director of Compliance and Treasury for Fontainebleau Resorts, LLC. during 2008 and 2009. Mr. Hamilton received a Bachelor of Science in Accounting and Business from the University of Baltimore and a Masters of Business Administration from Northwestern University Kellogg School of Management, and is a Certified Public Accountant in Maryland.
Vladislav Aizenstadt
CTO Prior to joining the Company in May 2013, Mr. Aizenstadt briefly served as Director of Poker Development at Caesars Interactive, overseeing online poker. In 2012, Mr. Aizenstadt served as Vice President of Software Development of Amaya Gaming Group Inc. From 2001 to 2012, Mr. Aizenstadt served multiple roles with CryptoLogic Inc., with his most recent position as Director of Platform and Games Development. Mr. Aizenstadt has over 25 years of technology experience, over 14 years of experience in the gaming industry, and over three years of experience in the retail gaming industry. Mr. Aizenstadt received a Bachelor of Science in Applied Mathematics from Kiev Technology University.
Hamish Brown COO Mr. Brown has 18 years of experience in the gaming industry in various operational and commercial roles at IGT (Australia), Aristocrat and Tabcorp, before transitioning to iGaming in 2008 as NextGen Gaming's COO and General Manager in Sydney, Australia.
Source: Cantor Fitzgerald Canada, Company Documents
NYX Gaming Group Ltd. February 12, 2015
Ralph Garcea, MBA, P. Eng. 416-849-5004 32 of 36
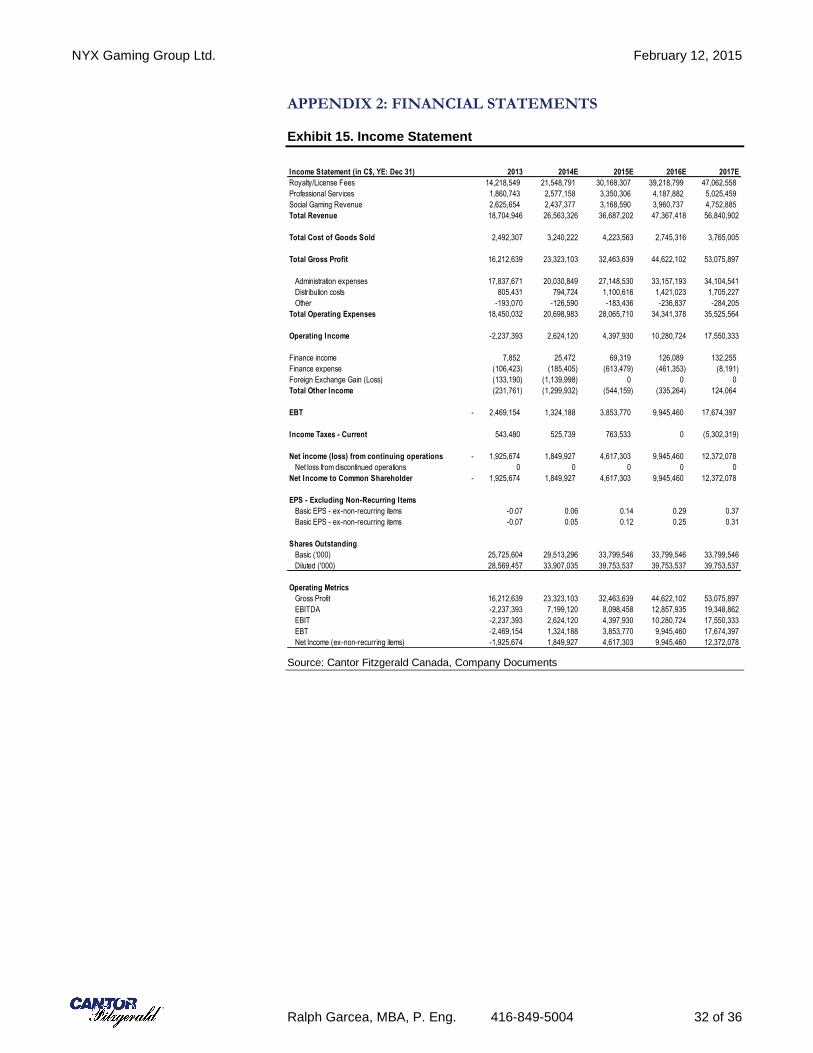
APPENDIX 2: FINANCIAL STATEMENTS
Exhibit 15. Income Statement
Source: Cantor Fitzgerald Canada, Company Documents
Income Statement (in C$, YE: Dec 31) 2013 2014E 2015E 2016E 2017E
Royalty/License Fees 14,218,549 21,548,791 30,168,307 39,218,799 47,062,558
Professional Services 1,860,743 2,577,158 3,350,306 4,187,882 5,025,459
Social Gaming Revenue 2,625,654 2,437,377 3,168,590 3,960,737 4,752,885
Total Revenue 18,704,946 26,563,326 36,687,202 47,367,418 56,840,902
Total Cost of Goods Sold 2,492,307 3,240,222 4,223,563 2,745,316 3,765,005
Total Gross Profit 16,212,639 23,323,103 32,463,639 44,622,102 53,075,897
Administration expenses 17,837,671 20,030,849 27,148,530 33,157,193 34,104,541
Distribution costs 805,431 794,724 1,100,616 1,421,023 1,705,227
Other -193,070 -126,590 -183,436 -236,837 -284,205
Total Operating Expenses 18,450,032 20,698,983 28,065,710 34,341,378 35,525,564
Operating Income -2,237,393 2,624,120 4,397,930 10,280,724 17,550,333
Finance income 7,852 25,472 69,319 126,089 132,255
Finance expense (106,423) (185,405) (613,479) (461,353) (8,191)
Foreign Exchange Gain (Loss) (133,190) (1,139,998) 0 0 0
Total Other Income (231,761) (1,299,932) (544,159) (335,264) 124,064
EBT 2,469,154- 1,324,188 3,853,770 9,945,460 17,674,397
Income Taxes - Current 543,480 525,739 763,533 0 (5,302,319)
Net income (loss) from continuing operations 1,925,674- 1,849,927 4,617,303 9,945,460 12,372,078
Net loss from discontinued operations 0 0 0 0 0
Net Income to Common Shareholder 1,925,674- 1,849,927 4,617,303 9,945,460 12,372,078
EPS - Excluding Non-Recurring Items
Basic EPS - ex-non-recurring items -0.07 0.06 0.14 0.29 0.37
Basic EPS - ex-non-recurring items -0.07 0.05 0.12 0.25 0.31
Shares Outstanding
Basic ('000) 25,725,604 29,513,296 33,799,546 33,799,546 33,799,546
Diluted ('000) 28,569,457 33,907,035 39,753,537 39,753,537 39,753,537
Operating Metrics
Gross Profit 16,212,639 23,323,103 32,463,639 44,622,102 53,075,897
EBITDA -2,237,393 7,199,120 8,098,458 12,857,935 19,348,862
EBIT -2,237,393 2,624,120 4,397,930 10,280,724 17,550,333
EBT -2,469,154 1,324,188 3,853,770 9,945,460 17,674,397
Net Income (ex-non-recurring items) -1,925,674 1,849,927 4,617,303 9,945,460 12,372,078

NYX Gaming Group Ltd. February 12, 2015
Ralph Garcea, MBA, P. Eng. 416-849-5004 33 of 36
Exhibit 16. Balance sheet
Source: Cantor Fitzgerald Canada, Company Documents
Balance Sheet (in C$, As at Dec 31) 2013 2014E 2015E 2016E 2017E
Current Assets
Cash 3,555,518 34,059,378 40,689,555 39,832,565 52,894,261
Trade & Other Receivables 3,981,182 5,160,833 7,137,201 9,221,185 11,065,422
Investment Tax Credit - Current - - - - -
Inventories - - - - -
Deferred Tax Asset - - - - -
Prepaid Expenses & Other Curent Assets 1,251,548 1,921,507 2,220,019 1,443,012 1,978,988
Total Current Assets 8,788,248 41,141,718 50,046,775 50,496,762 65,938,672
Non-Current Assets
Investment Tax Credit - - - - -
Property & Equipment 320,458 328,751 332,202 336,974 340,459
Deferred Tax Assets -
Goodwill 10,711,099 9,937,125 9,937,125 9,937,125 9,937,125
Intangible Assets 14,301,269 11,948,374 8,284,004 5,743,436 3,982,018
Total Assets 34,121,074 64,144,236 69,388,373 67,302,566 80,986,542
Current Liabilities
Trade & Other Payables 3,206,859 4,841,885 5,594,085 3,636,155 4,986,727
Billings in Excess of Costs and Anticipated Profits - - - - -
Provisions - - - - -
Income Taxes Payable 609,665 542,279 542,279 542,279 542,279
Current Portion of Loans Payable - 1,159,576 973,300 798,000 586,407
Total Current Liabilities 4,959,306 6,825,055 7,390,979 5,257,749 6,396,728
Non-Current Liabilities
Employee future benefits - - - - -
Loans Payable 1,870,267 293,719 210,418 126,187 75,674
Obligations Under Capital Lease - - - - -
Total Liabilities 7,956,952 17,780,350 18,262,974 6,045,513 7,133,979
Shareholders' Equity
Capital Stock 47,277,401 66,079,751 66,079,751 66,079,751 66,079,751
Treasury Stock 0 0 0 0 0
Additional Paid-in Capital - 30,873 175,085 361,278 584,710
Retained Earnings/Deficit (22,896,728) (21,046,801) (16,429,498) (6,484,038) 5,888,040
Share Purchase Options / Warrants 546,447 619,713 619,713 619,713 619,713
Non-controlling Interest - - - - -
Other Comprehensive Loss / FX Reserves 1,237,002 680,349 680,349 680,349 680,349
Total Shareholders Equity 26,164,122 46,363,885 51,125,399 61,257,053 73,852,563
Total Liabilities & Shareholders Equity 34,121,074 64,144,236 69,388,373 67,302,566 80,986,542

NYX Gaming Group Ltd. February 12, 2015
Ralph Garcea, MBA, P. Eng. 416-849-5004 34 of 36
Exhibit 17. Cash flow statement
Source: Cantor Fitzgerald Canada, Company Documents
Cash Flow Statement (in C$, YE: Dec 31) 2013 2014E 2015E 2016E 2017E
Cash Provided By Operating Activities
Net Income (1,925,674) 1,849,927 4,617,303 9,945,460 12,372,078
Depreciation 4,275,960 4,558,385 3,700,529 2,577,211 1,798,529
Gain on disposal of assets (397,094) 0 0 0 0
Deferred Income Tax (558,029) (434,052) 0 0 0
Investment tax credits recoverable 0 0 0 0 0
Goodwill impairment 1,358,778 0 0 0 0
Non-cash portion of debt retirement costs 0 0 0 0 0
Stock-Based Compensation 193,398 104,139 144,211 186,193 223,432
Unrealized Loss (Gain) on Derivatives 0 0 0 0 0
Change in Non-Cash Working Capital
Trade & Other Receivables 0 (1,422,416) (1,976,369) (2,083,984) (1,844,237)
Inventories 0 0 0 0 0
Restricted Cash 0 0 0 0 0
Prepaid Expenses (472,743) (614,755) (298,512) 777,007 (535,976)
Trade & Other Payables 1,555,597 892,795 752,201 (1,957,930) 1,350,572
Total Cash Provided By Operating Activities 2,151,337 4,842,024 6,939,363 9,443,958 13,364,398
Investing Activities
Purchase of Property & Equipment (149,370) (129,872) (39,610) (41,416) (40,596)
Proceeds from Sale of Property & Equipment 0 0 0 0 0
Purchase of Intangibles 0 0 0 0 0
Total Cash From Investing Activities (3,869,645) (3,288,220) (39,610) (41,416) (40,596)
Financing Activities
Proceeds from Issuance of Common Shares/Units/Bonds 4,638,399 18,802,350 0 0 0
Purchase of Treasury Stock 0 0 0 0 0
Addition of Long-Term Debt 0 10,000,000 0 (10,000,000) 0
Repayment of Long-Term Debt 0 (478,191) (269,577) (259,531) (262,106)
Total Cash From Financing Activities 4,638,399 28,324,159 (269,577) (10,259,531) (262,106)
Effect of exchange rates on cash (157,384) 625,897 0 0 0
Net Increase in cash 2,762,707 30,503,860 6,630,177 856,989- 13,061,696
Beginning Cash 792,810 3,555,518 34,059,378 40,689,555 39,832,565
Ending Cash 3,555,518 34,059,378 40,689,555 39,832,565 52,894,261

NYX Gaming Group Ltd. February 12, 2015
Ralph Garcea, MBA, P. Eng. 416-849-5004 35 of 36
This page is intentionally left blank.

Technology – Online Gambling February 12, 2015
Ralph Garcea, MBA, P.Eng. (416) 849-5004 36 of 36
DISCLAIMERS AND DISCLOSURE
Disclaimers
The opinions, estimates and projections contained in this report are those of Cantor Fitzgerald Inc. (“Cantor”) as of the date hereof and are subject to change without notice. Cantor makes every effort to ensure that the contents have been compiled or derived from sources believed to be reliable and that contain information and opinions that are accurate and complete; however, Cantor makes no representation or warranty, express or implied, in respect thereof, takes no responsibility for any errors and omissions which may be contained herein and accepts no liability whatsoever for any loss arising from any use of or reliance on this report or its contents. Information may be available to Cantor that is not herein.
This report is provided, for informational purposes only, to institutional investor clients of Cantor Fitzgerald Inc. Canada, and does not constitute an offer or solicitation to buy or sell any securities discussed herein in any jurisdiction where such offer or solicitation would be prohibited. This report is issued and approved for distribution in Canada, Cantor Fitzgerald Inc., a member of the Investment Industry Regulatory Organization of Canada ("IIROC"), the Toronto Stock Exchange, the TSX Venture Exchange and the CIPF. This report is has not been reviewed or approved by Cantor Fitzgerald USA., a member of FINRA. This report is intended for distribution in the United States only to Major Institutional Investors (as such term is defined in SEC 15a-6 and Section 15 of the Securities Exchange Act of 1934, as amended) and is not intended for the use of any person or entity that is not a major institutional investor. Major Institutional Investors receiving this report should effect transactions in securities discussed in the report through Cantor Fitzgerald USA.
Non US Broker Dealer 15a-6 disclosure: This report is being distributed by (CF Canada/CF Europe/CF Hong Kong) in the United States and is intended for distribution in the United States solely to “major U.S. institutional investors” (as such term is defined in Rule15a-6 of the U.S. Securities Exchange Act of 1934 and applicable interpretations relating thereto) and is not intended for the use of any person or entity that is not a major institutional investor. This material is intended solely for institutional investors and investors who Cantor reasonably believes are institutional investors. It is prohibited for distribution to non-institutional clients including retail clients, private clients and individual investors. Major Institutional Investors receiving this report should effect transactions in securities discussed in this report through Cantor Fitzgerald & Co. This report has been prepared in whole or in part by research analysts employed by non-US affiliates of Cantor Fitzgerald & Co that are not registered as broker-dealers in the United States. These non-US research analysts are not registered as associated persons of Cantor Fitzgerald & Co. and are not licensed or qualified as research analysts with FINRA or any other US regulatory authority and, accordingly, may not be subject (among other things) to FINRA’s restrictions regarding communications by a research analyst with a subject company, public appearances by research analysts, and trading securities held by a research analyst account.
Potential conflicts of interest
The author of this report is compensated based in part on the overall revenues of Cantor, a portion of which are generated by investment banking activities. Cantor may have had, or seek to have, an investment banking relationship with companies mentioned in this report. Cantor and/or its officers, directors and employees may from time to time acquire, hold or sell securities mentioned herein as principal or agent. Although Cantor makes every effort possible to avoid conflicts of interest, readers should assume that a conflict might exist, and therefore not rely solely on this report when evaluating whether or not to buy or sell the securities of subject companies.
Disclosures as of February 12, 2015
Cantor has not provided investment banking services or received investment banking related compensation from any of the covered companies within this report, within the past 12 months.
The analyst responsible for this research report does not have, either directly or indirectly, a long or short position in the shares or options of any of the covered companies within this report.
The analyst responsible for this report has visited the material operations of each of the covered companies within this report. No payment or reimbursement was received for the related travel costs.
Analyst certification
The research analyst whose name appears on this report hereby certifies that the opinions and recommendations expressed herein accurately reflect his personal views about the securities, issuers or industries discussed herein.
Definitions of recommendations
BUY: The stock is attractively priced relative to the company’s fundamentals and we expect it to appreciate significantly from the current price over the next 6 to 12 months.
BUY (Speculative): The stock is attractively priced relative to the company’s fundamentals, however investment in the security carries a higher degree of risk.
HOLD: The stock is fairly valued, lacks a near term catalyst, or its execution risk is such that we expect it to trade within a narrow range of the current price in the next 6 to 12 months. The longer term fundamental value of the company may be materially higher, but certain milestones/catalysts have yet to be fully realized.
SELL: The stock is overpriced relative to the company’s fundamentals, and we expect it to decline from the current price over the next 6 to 12 months.
TENDER: We believe the offer price by the acquirer is fair and thus recommend investors tender their shares to the offer.
UNDER REVIEW: We are temporarily placing our recommendation under review until further information is disclosed.
Member-Canadian Investor Protection Fund. Customers' accounts are protected by the Canadian Investor
Protection Fund within specified limits. A brochure describing the nature and limits of coverage is available upon request