Embed Size (px)
Citation preview
De Vocht, F., Brown, J., Beard, E., West, R., Michie, S., Campbell, R., &Hickman, M. (2018). Motivation to reduce alcohol consumption andsubsequent attempts at reduction and changes in consumption in increasingand higher-risk drinkers in England: a prospective population survey.Addiction, 113(5), 817-827. https://doi.org/10.1111/add.14132
Publisher's PDF, also known as Version of record
License (if available):CC BY-NC
Link to published version (if available):10.1111/add.14132
Link to publication record in Explore Bristol ResearchPDF-document
University of Bristol - Explore Bristol ResearchGeneral rights
This document is made available in accordance with publisher policies. Please cite only the publishedversion using the reference above. Full terms of use are available:http://www.bristol.ac.uk/pure/about/ebr-terms
Motivation to reduce alcohol consumption andsubsequent attempts at reduction and changes inconsumption in increasing and higher-risk drinkers inEngland: a prospective population survey
Frank de Vocht1,2 , Jamie Brown1,3,4 , Emma Beard1,3,4 , Robert West4 , Susan Michie1,3 ,Rona Campbell1,2 & Matthew Hickman1,2
NIHR School for Public Health Research (SPHR), Newcastle upon Tyne, UK,1 Population Health Sciences, Bristol Medical School, University of Bristol, Bristol, UK,2
Department of Clinical, Educational and Health Psychology, University College London, London, UK3 and Department of Behavioural Science and Health, UniversityCollege London, London, UK4
ABSTRACT
Aims To assess how farmotivation to reduce alcohol consumption in increasing and higher-risk drinkers in England pre-dicts self-reported attempts to reduce alcohol consumption and changes in alcohol intake during the following 6 months.
Methods This study used self-reported data from2928 higher-risk drinkers in the Alcohol Toolkit Study (ATS): a series ofmonthly cross-sectional household surveys of adults aged 16+ years of age in England. Alcohol consumption wasmeasured in an initial survey and in a 6-month telephone follow-up interview using the Alcohol Use DisordersIdentification Test (AUDIT)-C questionnaire. Motivationwasmeasured in the initial survey using theMotivation to ReduceAlcohol Consumption (MRAC) scale. Attempts to reduce alcohol consumption during the past 6 months were recorded atfollow-up. Data were analysed using repeated-measures difference-in-differences and logistic regression models.
Results Participants with higher initial motivation to reduce alcohol consumption were more likely to report that theyhad made an attempt to reduce consumption at follow-up [adjusted odds ratio (ORadj) = 2.39, 95% confidence interval(CI) = 1.75–3.29]. There was an overall reduction in alcohol consumption between initial survey and follow-up(ORadj = 0.72, 95% CI = 0.65–0.79), but there was insufficient evidence of an additional effect of motivation to reduceconsumption on subsequent changes in alcohol consumption, with the difference-in-differences effect instead suggestingan average increase (ORadj = 1.37, 95% CI = 1.00–1.88). Conclusions Increasing and higher-risk drinkers in Englandwho report greater motivation to reduce their consumption are more likely to report making an attempt to reduce duringthe next 6 months, but this may not be associated with a reduction in alcohol consumption.
Keywords Alcohol, Alcohol Toolkit Study, ATS, audit, behaviour, consumption, motivation.
Correspondence to: Frank de Vocht, Population Health Sciences, Bristol Medical School, University of Bristol, Canynge Hall, 39Whatley Road, Bristol BS8 2PS,
UK. E-mail: [email protected] 13 June 2017; initial review completed 18 September 2017; final version accepted 1 December 2017
INTRODUCTION
Hazardous alcohol consumption results in a considerableburden for society globally [1]. In the United Kingdomthe external costs (i.e. those not directly borne by thedrinker) have been estimated at £21 billion annually andcould be as high as £49 billion if all social costs to societyare included [2]. Reduction, especially from hazardouslevels, is beneficial to people’s health [3] as well as to soci-ety [1]. In order to realize this public health potential, there
is a need for valid and appropriate measures to understandimportant antecedents of alcohol reduction, including themotivation to reduce consumption.
The term ‘motivation’ refers typically to those brainprocesses that energize and direct behaviour [4]. Althoughmotivation to change a behaviour pattern such as alcoholconsumption is important to initiating it [5,6], it may notachieve it if others factors outweigh it on a moment-to-moment basis [7,8]. The assessment of motivation toreduce alcohol consumption can be useful if it provides
This is an open access article under the terms of the Creative CommonsAttribution-NonCommercial License, which permits use, distribution and reproductionin any medium, provided the original work is properly cited and is not used for commercial purposes.
© 2017 The Authors. Addiction published by John Wiley & Sons Ltd on behalf of Society for the Study of Addiction. Addiction, 113, 817–827
RESEARCH REPORT doi:10.1111/add.14132
an understanding of how and why changes in behaviouroccurred, while it can also allow for the detection of smallereffects of population-level interventions than would be pos-sible with a distal outcome.
Most studies investigating motivation with respect toalcohol consumption have been conducted in patientsor problem drinkers, with relatively little research in thegeneral population. A recent general population studyin England based on the same survey as the currentstudy found that there is a clear temporal pattern in at-tempts to reduce alcohol consumption, with a peak inJanuary, but little evidence of any changes in actual con-sumption [7]. In the same sample, the strongest motiva-tions for cutting down included weight, fitness, the costof alcohol, concerns about future health problems andadvice from others [9]. Close to a quarter of high-riskdrinkers also stated that there was no reason for cuttingdown or that they did not know why they were cuttingdown, indicating that a clear motive may not always benecessary for behaviour change.
The current study investigates whether, for increasingrisk and higher-risk drinkers in the general population, ini-tial motivation to reduce alcohol consumption is associatedprospectively with reported attempts to cut down and sub-sequent reduced consumption.
METHODS
Sample
This study made use of self-reported data reported in theAlcohol Toolkit Study (ATS) (version December 2016).The methodology for the ATS has been described in detailby Beard et al. [10]. Briefly, the ATS is a monthly cross-sectional household survey of approximately 1700 adultsaged 16 years of age or older per month (wave) in England.Areas are allocated randomly to interviewers who thenvisit households within the locality and conductcomputer-assisted face-to-face interviews with one mem-ber of a household in those areas until a pre-specified quotais fulfilled. This form of sampling has distinct benefits overconventional quota sampling, because the allocation ofsmall areas to interviewers reduces the impact of selectionbias resulting from the selection of properties, but as a re-sult response rates cannot be calculated [11]. A subgroupof the people included in the cross-sectional survey wereinterviewed again 6 months later by telephone. Peoplewere eligible for follow-up after 6 months if their AlcoholUse Disorders Identification Test (AUDIT)-C score at theinitial survey was > 4 and/or their full AUDIT score > 7(indicating higher-risk drinking) [12,13], and of these2930 were followed-up successfully. Two of these wereremoved prior to analysis because of missing outcomeinformation, resulting in a study sample of 2928.
Design
We conducted a repeated-measures difference-in-differences analyses to investigate whether self-reportedmotivation to reduce alcohol consumption has, on aver-age, resulted in actual reduction in self-reported consump-tion 6 months later, and supplemented this with across-sectional analysis to assess whether motivation atthe initial survey had led subsequently to self-reportedattempts to reduce consumption.
Outcomes
‘Consumption’ was measured by the AUDIT-C summaryscore at the initial survey and follow-up, and the individualquestions were used to assess frequency of drinking alco-hol, quantity consumed on a typical day and frequency ofbinge drinking occasions (defined as number of occasionsonwhich six ormore standard drinks were consumed) sep-arately (similar to previous work [7]); Supporting informa-tion, Table S1. At both the initial survey and follow-up,respondents were asked to consider their drinking duringthe last 6months before answering the AUDIT-C questions.
Secondly, ‘attempts to reduce alcohol consumption’was defined based on two different metrics collected asyes/no in the follow-up interview and that were analysedseparately: (1) having had ‘at least one attempt to cutdown drinking in previous 6 months’ and (2) having had‘at least one SERIOUS attempt to cut down drinking in pre-vious 6 months’.
The key exposure or explanatory factor of interest was‘motivation to reduce alcohol consumption’ at the initialsurvey, which was measured using a ‘Reduce AlcoholConsumption’ scale (MRAC), based on the ‘Motivationto Stop Scale’ (MTSS) [14]. Answers to this question wererecoded to ‘motivated to reduce intake now’, defined as aparticipant who answered that they ‘REALLY want to cutdown on drinking alcohol and intend to in the nextmonth’ or ‘REALLY want to cut down on drinking alco-hol and intend to in the next 3 months’ or ‘I want tocut down on drinking alcohol and hope to soon’ to theMRAC, or to ‘not motivated to reduce consumption inthe near future, defined as ‘I REALLY want to cut downon drinking alcohol but I don’t know when I will’, or ‘Iwant to cut down on drinking alcohol but haven’tthought about when’, or ‘I think I should cut down ondrinking alcohol but don’t really want to’, ‘I don’t wantto cut down on drinking alcohol’, ‘don’t know’ or if theyrefused to answer the MRAC.
Ethics approval for the STS was granted originally bythe UCL Ethics Committee (ID 0498/001) and approvalfor the ATS was granted by the same committee as anextension of the STS. All respondents provided informedconsent.
818 Frank de Vocht et al.
© 2017 The Authors. Addiction published by John Wiley & Sons Ltd on behalf of Society for the Study of Addiction. Addiction, 113, 817–827
Statistical analyses
We investigated the hypothesis that being motivated toreduce alcohol consumption at the initial survey was asso-ciated with actual attempts during the 6 months to follow-up using logistic regression, and the hypothesis that initialmotivation was associated with changes in consumptionat follow-up by a difference-in-differences (DID) model.The DID model was specified as a repeated-measures ordi-nal regression with random-intercepts to adjust themodels for consumption at the initial survey and toaccount for repeated measurements of individuals (i.e. atinitial survey and at 6-month follow-up). The DID interac-tion term between time and motivation defined the addi-tional impact of being motivated to reduce consumptionon consumption over and above the average populationchange over time.
Models were adjusted for interview wave, season ofinterview or follow-up, sex, age, social position, life stage(single, pre-family, family, post-family), ethnic group, qual-ification and history of trying to reduce consumption at ini-tial survey and/or had ‘at least one serious attempt to cutdown drinking in previous 6 months’. As a result of miss-ing covariate data, 22 observations were removed in themultivariable models. Results are reported as parameterestimates or odds ratios (OR), 95% profile likelihood confi-dence intervals (CI) and P-values (where 0.05 is regardedas the threshold for statistical significance), while inaddition approximate Bayes factors h1 versus h0 (BF10)were calculated based on Bayesian information criterion(BIC) values following the methodology in Wagenmakers[15]. Relative effects were estimated using least squaresmean contrasts of the mean AUDIT-C score for the DIDeffect = 0 versus 1, relative to the AUDIT-C score at DID = 0at follow-up.
All analyses were conducted in R (version 3.2.4) usingthe survey (version 3.31) and ordinal (version 2015.6.28)packages. Evaluation of different link functions did not indi-cate any reason to deviate from the standard logit linkfunction. The assumption of proportional odds was testedfor all models using log-likelihood tests and was only metfor a proportion of models. However, this is not unlikely,given that the test is overly conservative and has beenshown to nearly always reject the assumption where thereare a large number of explanatory variables, a large samplesize and/or a continuous explanatory variable in themodel[16,17], all of which is the case here. Therefore, instead weevaluated changes in model parameters and standard er-rors (SE) using partial proportional odds models relativeto the full proportional odds models, and which indicatedminimal changes (< ± 5.7%) in estimates and < ± 1.8%for corresponding SE (Supporting information, Table S2).Least squares means were calculated using the R lsmeanspackage (version 2.27).
We conducted additional subgroup analysis of ‘increas-ing risk’ (AUDIT between 8 and 15; n= 1330) and ‘higher-risk and possible dependent’ (AUDIT > 15; n = 168)drinkers. Sensitivity analyses including only those partici-pants who indicated that they were not trying to restricttheir alcohol consumption at the time of the initial inter-view (but who may have indicated they planned to reduceconsumption soon) were conducted, to minimize con-founding from the association between motivation andsubsequent consumption by people already trying to re-duce consumption at the initial survey. Further sensitivityanalyses aimed to explore exposure–response associationsby, in the sensitivity analysis sample above, to define athree-level variable defined as ‘motivated to reduce intakein the next 3 months’ (defined as an answer of ‘REALLYwant to cut down on drinking alcohol and intend to inthe next month’ or ‘REALLYwant to cut down on drinkingalcohol and intend to in the next 3 months’), ‘motivated toreduce intake sometime in the future’ (defined as an an-swer of ‘I REALLY want to cut down on drinking alcoholbut I don’t know when I will’ or ‘I want to cut down ondrinking alcohol but haven’t thought about when’) and‘no intention to reduce intake’ otherwise (defined as ananswer of ‘I think I should cut down on drinking alcoholbut don’t really want to’, ‘I don’t want to cut down ondrinking alcohol’, ‘don’t know’ or if they refused to answerthe question).
RESULTS
The initial sample characteristics are given in Table 1. Haz-ardous drinkers (AUDIT-C score ≥ 4)make up 38.3% of thewhole sample and, because of the criteria for follow-up,more than 99% of the subsample who were followed-upwere AUDIT-C-positive. The subsample that was followed-up included slightly older (55+) individuals than the initialsample, but otherwise was comparable in terms of socialposition, academic qualifications, ethnicity and regionaldistribution.
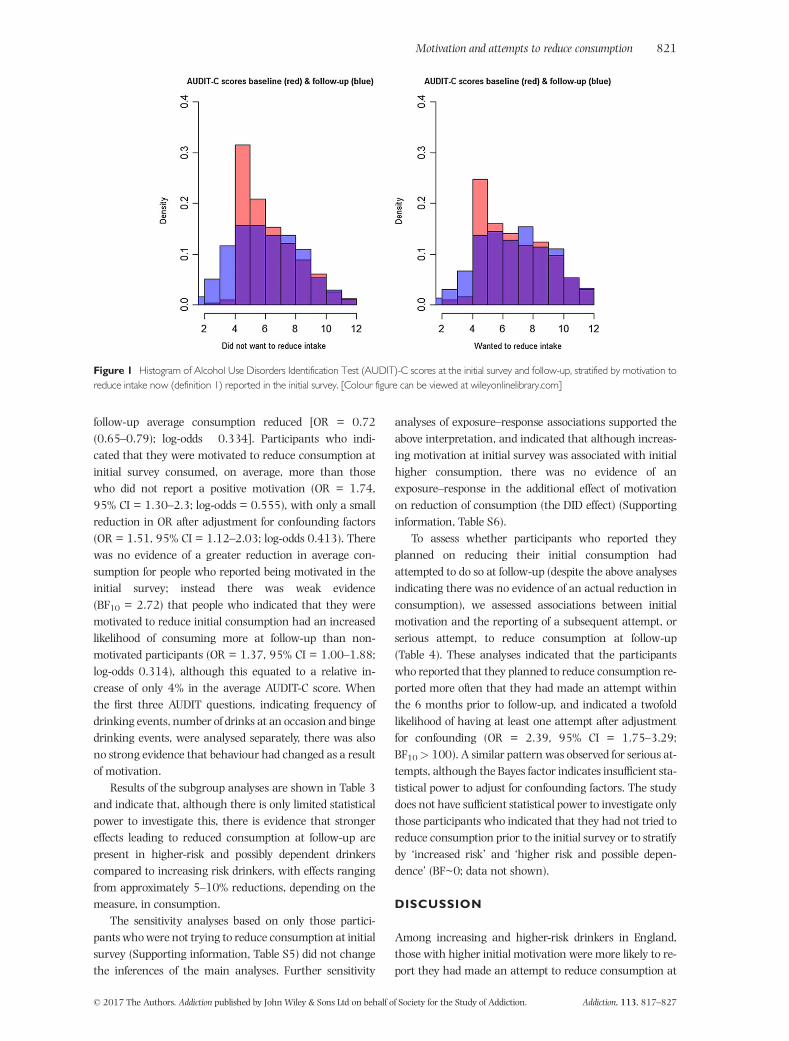
The distribution of motivation in this sample is shownin Supporting information, Table S3 and the correspondingdistribution of AUDIT-C scores and individual item re-sponses in Supporting information, Table S4. Alcohol con-sumption as measured by the AUDIT-C tool was differentfor those who did not want to reduce their intake at the ini-tial survey, with lower average consumption at follow-up(P < 0.01), but for those who wanted to reduce theirintake there was no difference between baseline or follow-up (P~0.70) (Fig. 1).
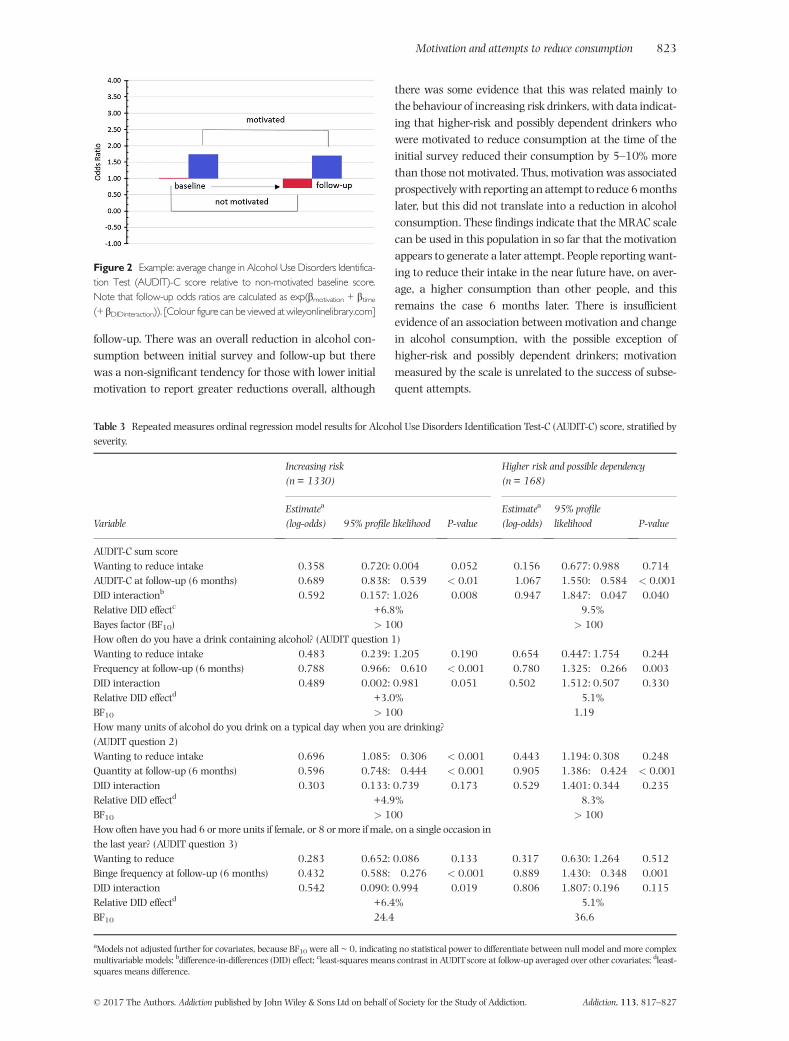
Table 2 shows the associations between initial alcoholconsumption and follow-up stratified by motivation to re-duce consumption at initial survey, and Fig. 2 illustrateshow these translate into overall changes in consumptionfor the first model in Table 2. Between initial survey and
Motivation and attempts to reduce consumption 819
© 2017 The Authors. Addiction published by John Wiley & Sons Ltd on behalf of Society for the Study of Addiction. Addiction, 113, 817–827
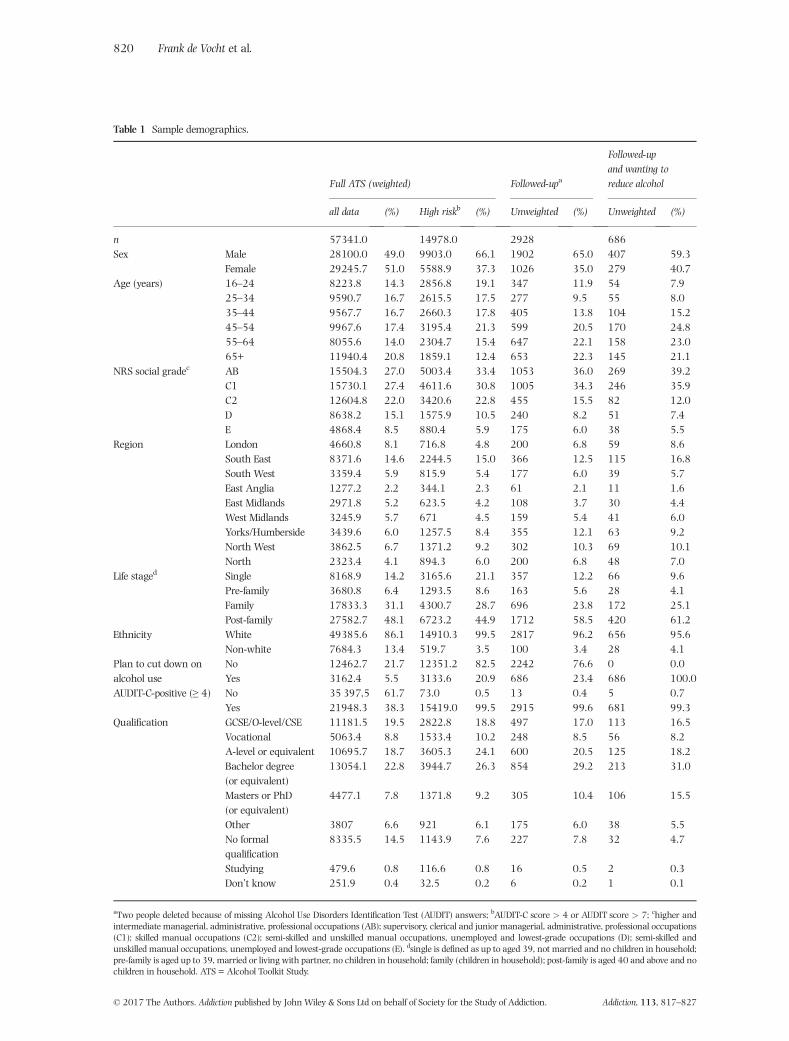
Table 1 Sample demographics.
Full ATS (weighted) Followed-upa
Followed-upand wanting toreduce alcohol
all data (%) High riskb (%) Unweighted (%) Unweighted (%)
n 57341.0 14978.0 2928 686Sex Male 28100.0 49.0 9903.0 66.1 1902 65.0 407 59.3
Female 29245.7 51.0 5588.9 37.3 1026 35.0 279 40.7Age (years) 16–24 8223.8 14.3 2856.8 19.1 347 11.9 54 7.9
25–34 9590.7 16.7 2615.5 17.5 277 9.5 55 8.035–44 9567.7 16.7 2660.3 17.8 405 13.8 104 15.245–54 9967.6 17.4 3195.4 21.3 599 20.5 170 24.855–64 8055.6 14.0 2304.7 15.4 647 22.1 158 23.065+ 11940.4 20.8 1859.1 12.4 653 22.3 145 21.1
NRS social gradec AB 15504.3 27.0 5003.4 33.4 1053 36.0 269 39.2C1 15730.1 27.4 4611.6 30.8 1005 34.3 246 35.9C2 12604.8 22.0 3420.6 22.8 455 15.5 82 12.0D 8638.2 15.1 1575.9 10.5 240 8.2 51 7.4E 4868.4 8.5 880.4 5.9 175 6.0 38 5.5
Region London 4660.8 8.1 716.8 4.8 200 6.8 59 8.6South East 8371.6 14.6 2244.5 15.0 366 12.5 115 16.8South West 3359.4 5.9 815.9 5.4 177 6.0 39 5.7East Anglia 1277.2 2.2 344.1 2.3 61 2.1 11 1.6East Midlands 2971.8 5.2 623.5 4.2 108 3.7 30 4.4West Midlands 3245.9 5.7 671 4.5 159 5.4 41 6.0Yorks/Humberside 3439.6 6.0 1257.5 8.4 355 12.1 63 9.2North West 3862.5 6.7 1371.2 9.2 302 10.3 69 10.1North 2323.4 4.1 894.3 6.0 200 6.8 48 7.0
Life staged Single 8168.9 14.2 3165.6 21.1 357 12.2 66 9.6Pre-family 3680.8 6.4 1293.5 8.6 163 5.6 28 4.1Family 17833.3 31.1 4300.7 28.7 696 23.8 172 25.1Post-family 27582.7 48.1 6723.2 44.9 1712 58.5 420 61.2
Ethnicity White 49385.6 86.1 14910.3 99.5 2817 96.2 656 95.6Non-white 7684.3 13.4 519.7 3.5 100 3.4 28 4.1
Plan to cut down onalcohol use
No 12462.7 21.7 12351.2 82.5 2242 76.6 0 0.0Yes 3162.4 5.5 3133.6 20.9 686 23.4 686 100.0
AUDIT-C-positive (≥ 4) No 35 397,5 61.7 73.0 0.5 13 0.4 5 0.7Yes 21948.3 38.3 15419.0 99.5 2915 99.6 681 99.3
Qualification GCSE/O-level/CSE 11181.5 19.5 2822.8 18.8 497 17.0 113 16.5Vocational 5063.4 8.8 1533.4 10.2 248 8.5 56 8.2A-level or equivalent 10695.7 18.7 3605.3 24.1 600 20.5 125 18.2Bachelor degree(or equivalent)
13054.1 22.8 3944.7 26.3 854 29.2 213 31.0
Masters or PhD(or equivalent)
4477.1 7.8 1371.8 9.2 305 10.4 106 15.5
Other 3807 6.6 921 6.1 175 6.0 38 5.5No formalqualification
8335.5 14.5 1143.9 7.6 227 7.8 32 4.7
Studying 479.6 0.8 116.6 0.8 16 0.5 2 0.3Don’t know 251.9 0.4 32.5 0.2 6 0.2 1 0.1
aTwo people deleted because of missing Alcohol Use Disorders Identification Test (AUDIT) answers; bAUDIT-C score > 4 or AUDIT score > 7; chigher andintermediate managerial, administrative, professional occupations (AB); supervisory, clerical and junior managerial, administrative, professional occupations(C1); skilled manual occupations (C2); semi-skilled and unskilled manual occupations, unemployed and lowest-grade occupations (D); semi-skilled andunskilled manual occupations, unemployed and lowest-grade occupations (E). dsingle is defined as up to aged 39, not married and no children in household;pre-family is aged up to 39, married or living with partner, no children in household; family (children in household); post-family is aged 40 and above and nochildren in household. ATS = Alcohol Toolkit Study.
820 Frank de Vocht et al.
© 2017 The Authors. Addiction published by John Wiley & Sons Ltd on behalf of Society for the Study of Addiction. Addiction, 113, 817–827
follow-up average consumption reduced [OR = 0.72(0.65–0.79); log-odds �0.334]. Participants who indi-cated that they were motivated to reduce consumption atinitial survey consumed, on average, more than thosewho did not report a positive motivation (OR = 1.74,95% CI = 1.30–2.3; log-odds = 0.555), with only a smallreduction in OR after adjustment for confounding factors(OR = 1.51, 95% CI = 1.12–2.03; log-odds 0.413). Therewas no evidence of a greater reduction in average con-sumption for people who reported being motivated in theinitial survey; instead there was weak evidence(BF10 = 2.72) that people who indicated that they weremotivated to reduce initial consumption had an increasedlikelihood of consuming more at follow-up than non-motivated participants (OR = 1.37, 95% CI = 1.00–1.88;log-odds 0.314), although this equated to a relative in-crease of only 4% in the average AUDIT-C score. Whenthe first three AUDIT questions, indicating frequency ofdrinking events, number of drinks at an occasion and bingedrinking events, were analysed separately, there was alsono strong evidence that behaviour had changed as a resultof motivation.
Results of the subgroup analyses are shown in Table 3and indicate that, although there is only limited statisticalpower to investigate this, there is evidence that strongereffects leading to reduced consumption at follow-up arepresent in higher-risk and possibly dependent drinkerscompared to increasing risk drinkers, with effects rangingfrom approximately 5–10% reductions, depending on themeasure, in consumption.
The sensitivity analyses based on only those partici-pants whowere not trying to reduce consumption at initialsurvey (Supporting information, Table S5) did not changethe inferences of the main analyses. Further sensitivity
analyses of exposure–response associations supported theabove interpretation, and indicated that although increas-ing motivation at initial survey was associated with initialhigher consumption, there was no evidence of anexposure–response in the additional effect of motivationon reduction of consumption (the DID effect) (Supportinginformation, Table S6).
To assess whether participants who reported theyplanned on reducing their initial consumption hadattempted to do so at follow-up (despite the above analysesindicating there was no evidence of an actual reduction inconsumption), we assessed associations between initialmotivation and the reporting of a subsequent attempt, orserious attempt, to reduce consumption at follow-up(Table 4). These analyses indicated that the participantswho reported that they planned to reduce consumption re-ported more often that they had made an attempt withinthe 6 months prior to follow-up, and indicated a twofoldlikelihood of having at least one attempt after adjustmentfor confounding (OR = 2.39, 95% CI = 1.75–3.29;BF10> 100). A similar pattern was observed for serious at-tempts, although the Bayes factor indicates insufficient sta-tistical power to adjust for confounding factors. The studydoes not have sufficient statistical power to investigate onlythose participants who indicated that they had not tried toreduce consumption prior to the initial survey or to stratifyby ‘increased risk’ and ‘higher risk and possible depen-dence’ (BF~0; data not shown).
DISCUSSION
Among increasing and higher-risk drinkers in England,those with higher initial motivation were more likely to re-port they had made an attempt to reduce consumption at
Figure 1 Histogram of Alcohol Use Disorders Identification Test (AUDIT)-C scores at the initial survey and follow-up, stratified by motivation toreduce intake now (definition 1) reported in the initial survey. [Colour figure can be viewed at wileyonlinelibrary.com]
Motivation and attempts to reduce consumption 821
© 2017 The Authors. Addiction published by John Wiley & Sons Ltd on behalf of Society for the Study of Addiction. Addiction, 113, 817–827
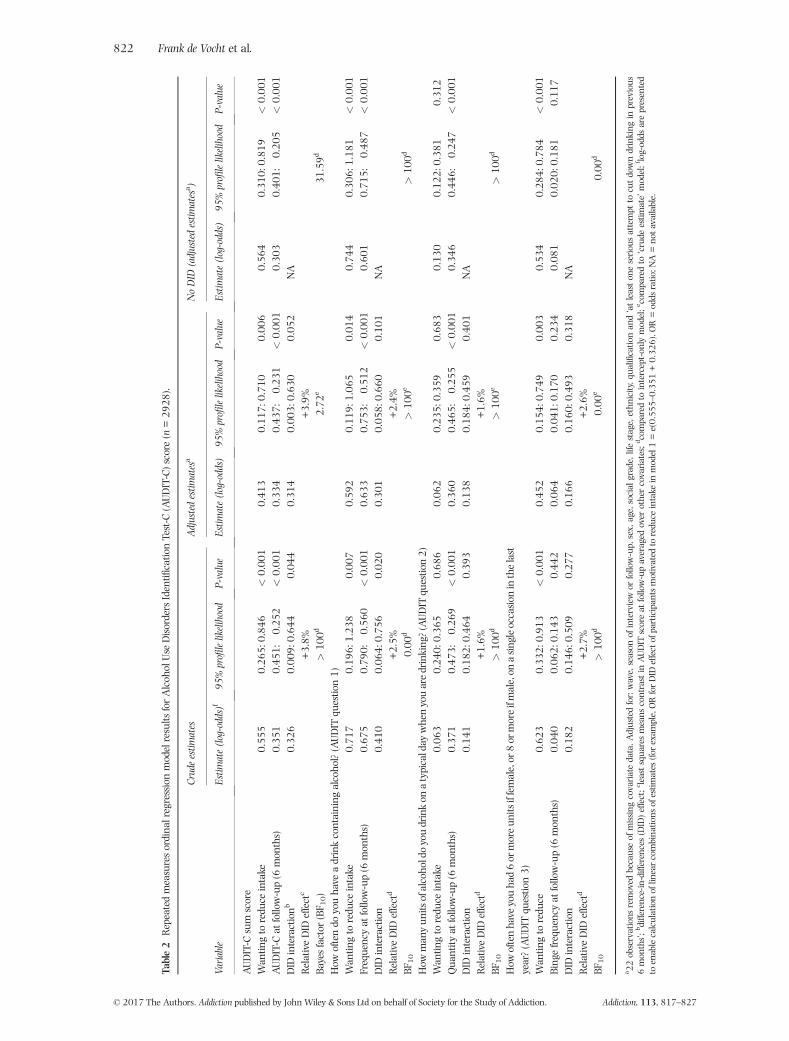
Table2
Repeatedmeasuresordina
lregressionmodelresults
forAlcoh
olUse
DisordersIdentifi
catio
nTest-C
(AUDIT-C)score(n
=29
28).
Variable
Crudeestim
ates
Adjustedestim
atesa
NoDID
(adjustedestim
atesa )
Estim
ate(log-odds)f
95%profilelikelihood
P-value
Estim
ate(log-odds)
95%profilelikelihood
P-value
Estim
ate(log-odds)
95%profilelikelihood
P-value
AUDIT-C
sum
score
Wan
tingto
redu
ceintake
0.55
50.26
5:0.84
6<
0.00
10.41
30.11
7:0.71
00.00
60.56
40.31
0:0.81
9<
0.00
1AUDIT-C
atfollow-up(6
mon
ths)
�0.351
�0.451
:�0.25
2<
0.00
1�0
.334
�0.437
:�0.23
1<
0.00
1�0
.303
�0.401
:�0.20
5<
0.00
1DID
interactionb
0.32
60.00
9:0.64
40.04
40.31
4�0
.003
:0.630
0.05
2NA
RelativeDID
effectc
+3.8%
+3.9%
Bayesfactor
(BF 1
0)
>10
0d2.72
e31
.59d
How
oftendo
youha
veadrinkcontaining
alcoho
l?(AUDIT
questio
n1)
Wan
tingto
redu
ceintake
0.71
70.19
6:1.23
80.00
70.59
20.11
9:1.06
50.01
40.74
40.30
6:1.18
1<
0.00
1Frequencyat
follow-up(6
mon
ths)
�0.675
�0.790
:�0.56
0<
0.00
1�0
.633
�0.753
:�0.51
2<
0.00
1�0
.601
�0.715
:�0.48
7<
0.00
1DID
interaction
0.41
00.06
4:0.75
60.02
00.30
1�0
.058
:0.660
0.10
1NA
RelativeDID
effectd
+2.5%
+2.4%
BF10
0.00
d>
100e
>10
0d
How
man
yun
itsofalcoho
ldoyoudrinkon
atypicalday
whenyouaredrinking
?(AUDIT
questio
n2)
Wan
tingto
redu
ceintake
0.06
3�0
.240
:0.365
0.68
60.06
2�0
.235
:0.359
0.68
30.13
0�0
.122
:0.381
0.31
2Qua
ntity
atfollow-up(6
mon
ths)
�0.371
�0.473
:�0.26
9<
0.00
1�0
.360
�0.465
:�0.25
5<
0.00
1�0
.346
�0.446
:�0.24
7<
0.00
1DID
interaction
0.14
1�0
.182
:0.464
0.39
30.13
8�0
.184
:0.459
0.40
1NA
RelativeDID
effectd
+1.6%
+1.6%
BF10
>10
0d>
100e
>10
0d
How
oftenha
veyouha
d6or
moreun
itsiffemale,or
8or
moreifmale,on
asing
leoccasion
inthelast
year?(AUDIT
questio
n3)
Wan
tingto
redu
ce0.62
30.33
2:0.91
3<
0.00
10.45
20.15
4:0.74
90.00
30.53
40.28
4:0.78
4<
0.00
1Bing
efrequencyat
follow-up(6
mon
ths)
0.04
0�0
.062
:0.143
0.44
20.06
4�0
.041
:0.170
0.23
40.08
1�0
.020
:0.181
0.11
7DID
interaction
0.18
2�0
.146
:0.509
0.27
70.16
6�0
.160
:0.493
0.31
8NA
RelativeDID
effectd
+2.7%
+2.6%
BF10
>10
0d0.00
e0.00
d
a 22observations
removed
becauseof
missing
covariatedata.A
djustedfor:wave,season
ofinterview
orfollow-up,
sex,
age,social
grade,lifestage,ethn
icity,q
ualificatio
nan
d‘atleaston
eseriou
sattempt
tocutdowndrinking
inprevious
6mon
ths’;bdifference-in-differences(DID)effect;cleastsqua
resmeans
contrastin
AUDIT
scoreat
follow-upaveraged
over
othercovariates;dcomparedto
intercept-on
lymodel;ecomparedto
‘crude
estim
ate’model;flog-odds
arepresented
toenablecalculationof
linearcombina
tions
ofestim
ates
(forexam
ple,ORforDID
effect
ofparticipan
tsmotivated
toredu
ceintake
inmodel1=e(0.55
5–0.35
1+0.32
6).O
R=odds
ratio
;NA=no
tavailable.
822 Frank de Vocht et al.
© 2017 The Authors. Addiction published by John Wiley & Sons Ltd on behalf of Society for the Study of Addiction. Addiction, 113, 817–827
follow-up. There was an overall reduction in alcohol con-sumption between initial survey and follow-up but therewas a non-significant tendency for those with lower initialmotivation to report greater reductions overall, although
there was some evidence that this was related mainly tothe behaviour of increasing risk drinkers, with data indicat-ing that higher-risk and possibly dependent drinkers whowere motivated to reduce consumption at the time of theinitial survey reduced their consumption by 5–10% morethan those not motivated. Thus, motivation was associatedprospectivelywith reportinganattempt to reduce 6monthslater, but this did not translate into a reduction in alcoholconsumption. These findings indicate that the MRAC scalecan be used in this population in so far that the motivationappears to generate a later attempt. People reportingwant-ing to reduce their intake in the near future have, on aver-age, a higher consumption than other people, and thisremains the case 6 months later. There is insufficientevidence of an association betweenmotivation and changein alcohol consumption, with the possible exception ofhigher-risk and possibly dependent drinkers; motivationmeasured by the scale is unrelated to the success of subse-quent attempts.
Figure 2 Example: average change in Alcohol Use Disorders Identifica-tion Test (AUDIT)-C score relative to non-motivated baseline score.Note that follow-up odds ratios are calculated as exp(βmotivation + βtime(+ βDIDinteraction)). [Colour figure can be viewed at wileyonlinelibrary.com]
Table 3 Repeated measures ordinal regression model results for Alcohol Use Disorders Identification Test-C (AUDIT-C) score, stratified byseverity.
Variable
Increasing risk(n = 1330)
Higher risk and possible dependency(n = 168)
Estimatea
(log-odds) 95% profile likelihood P-valueEstimatea
(log-odds)95% profilelikelihood P-value
AUDIT-C sum scoreWanting to reduce intake �0.358 �0.720: 0.004 0.052 0.156 �0.677: 0.988 0.714AUDIT-C at follow-up (6 months) �0.689 �0.838:�0.539 < 0.01 �1.067 �1.550:�0.584 < 0.001DID interactionb 0.592 0.157: 1.026 0.008 �0.947 �1.847:�0.047 0.040Relative DID effectc +6.8% �9.5%Bayes factor (BF10) > 100 > 100How often do you have a drink containing alcohol? (AUDIT question 1)Wanting to reduce intake 0.483 �0.239: 1.205 0.190 0.654 �0.447: 1.754 0.244Frequency at follow-up (6 months) �0.788 �0.966:�0.610 < 0.001 �0.780 �1.325:�0.266 0.003DID interaction 0.489 �0.002: 0.981 0.051 �0.502 �1.512: 0.507 0.330Relative DID effectd +3.0% �5.1%BF10 > 100 1.19How many units of alcohol do you drink on a typical day when you are drinking?(AUDIT question 2)Wanting to reduce intake �0.696 �1.085:�0.306 < 0.001 �0.443 �1.194: 0.308 0.248Quantity at follow-up (6 months) �0.596 �0.748:�0.444 < 0.001 �0.905 �1.386:�0.424 < 0.001DID interaction 0.303 �0.133: 0.739 0.173 �0.529 �1.401: 0.344 0.235Relative DID effectd +4.9% �8.3%BF10 > 100 > 100Howoften have you had 6 or more units if female, or 8 ormore if male, on a single occasion inthe last year? (AUDIT question 3)Wanting to reduce �0.283 �0.652: 0.086 0.133 0.317 �0.630: 1.264 0.512Binge frequency at follow-up (6 months) �0.432 �0.588:�0.276 < 0.001 �0.889 �1.430:�0.348 0.001DID interaction 0.542 0.090: 0.994 0.019 �0.806 �1.807: 0.196 0.115Relative DID effectd +6.4% �5.1%BF10 24.4 36.6
aModels not adjusted further for covariates, because BF10 were all ~ 0, indicating no statistical power to differentiate between null model and more complexmultivariable models; bdifference-in-differences (DID) effect; cleast-squares means contrast in AUDIT score at follow-up averaged over other covariates; dleast-squares means difference.
Motivation and attempts to reduce consumption 823
© 2017 The Authors. Addiction published by John Wiley & Sons Ltd on behalf of Society for the Study of Addiction. Addiction, 113, 817–827
Previous studies have found similarly that thosereporting motivators to cut down (e.g. cost, health andadvice from others) tend to be more dependent than thosereporting that there were no reasons for reducing theiralcohol consumption [9]. The results from this study con-firm findings from our previous assessment of temporaltrends in consumption and motivation in the Englishpopulation [7]. It is, however, important to put thesefindings into context in that, on average, at an individuallevel consumption during the 6-month period betweeninitial survey and follow-up interview had reduced.Overall we investigated a downwards shift in the distribu-tion of consumption rather than a change in number ofunits directly; this is the consequence of the use of AUDIT
questions in the ATS which require ordinal regressionanalyses (i.e. the probability of shifting a category inAUDIT-C).
These analyses indicate that increasing and higher-risk drinkers who are highlymotivated to reduce consump-tion also tend to consume more than the average atthe initial survey, and do not reduce their consumptiondespite their reported motivation and attempts tocut down.
We have previously reported a related finding: temporalchanges in attempts to cut down in the English populationappear unrelated to trends in alcohol consumption [7],but in the wider literature the results are mixed and maydepend upon the specific population [5,6,18,19]. We
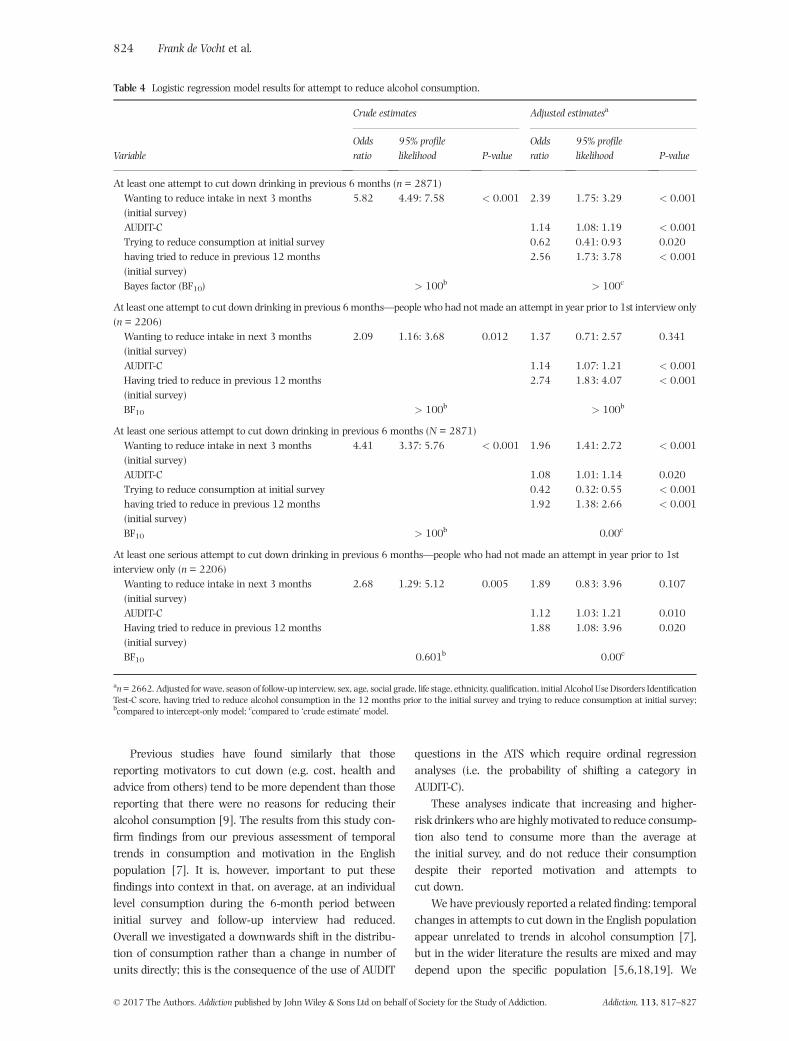
Table 4 Logistic regression model results for attempt to reduce alcohol consumption.
Variable
Crude estimates Adjusted estimatesa
Oddsratio
95% profilelikelihood P-value
Oddsratio
95% profilelikelihood P-value
At least one attempt to cut down drinking in previous 6 months (n = 2871)Wanting to reduce intake in next 3 months(initial survey)
5.82 4.49: 7.58 < 0.001 2.39 1.75: 3.29 < 0.001
AUDIT-C 1.14 1.08: 1.19 < 0.001Trying to reduce consumption at initial survey 0.62 0.41: 0.93 0.020having tried to reduce in previous 12 months(initial survey)
2.56 1.73: 3.78 < 0.001
Bayes factor (BF10) > 100b > 100c
At least one attempt to cut down drinking in previous 6 months—people who had not made an attempt in year prior to 1st interview only(n = 2206)Wanting to reduce intake in next 3 months(initial survey)
2.09 1.16: 3.68 0.012 1.37 0.71: 2.57 0.341
AUDIT-C 1.14 1.07: 1.21 < 0.001Having tried to reduce in previous 12 months(initial survey)
2.74 1.83: 4.07 < 0.001
BF10 > 100b > 100b
At least one serious attempt to cut down drinking in previous 6 months (N = 2871)Wanting to reduce intake in next 3 months(initial survey)
4.41 3.37: 5.76 < 0.001 1.96 1.41: 2.72 < 0.001
AUDIT-C 1.08 1.01: 1.14 0.020Trying to reduce consumption at initial survey 0.42 0.32: 0.55 < 0.001having tried to reduce in previous 12 months(initial survey)
1.92 1.38: 2.66 < 0.001
BF10 > 100b 0.00c
At least one serious attempt to cut down drinking in previous 6 months—people who had not made an attempt in year prior to 1stinterview only (n = 2206)Wanting to reduce intake in next 3 months(initial survey)
2.68 1.29: 5.12 0.005 1.89 0.83: 3.96 0.107
AUDIT-C 1.12 1.03: 1.21 0.010Having tried to reduce in previous 12 months(initial survey)
1.88 1.08: 3.96 0.020
BF10 0.601b 0.00c
an=2662. Adjusted for wave, season of follow-up interview, sex, age, social grade, life stage, ethnicity, qualification, initial Alcohol Use Disorders IdentificationTest-C score, having tried to reduce alcohol consumption in the 12 months prior to the initial survey and trying to reduce consumption at initial survey;bcompared to intercept-only model; ccompared to ‘crude estimate’ model.
824 Frank de Vocht et al.
© 2017 The Authors. Addiction published by John Wiley & Sons Ltd on behalf of Society for the Study of Addiction. Addiction, 113, 817–827
evaluated the predictive power of motivation and self-efficacy in relation to attempts and reduced consumptionat follow-up. Previous research indicated that bothconstructs can be important [6], but also that they havevariable predictive validity in relation to drinking outcomes[6,20]. This begs the question as to how useful self-reported questions on motivation to reduce alcohol con-sumption really are; something also already highlightedby others [6]. However, others have argued that the processfrom motivating to an attempt to change a behaviour andsucceeding can be distinct, and determined by differentfactors [21]. The motivation scale in this study wasadapted from the ‘Motivation to Stop Smoking Scale’developed and validated in relation to smoking cessation[14,22–25]. Consistent with the current findings,motivation to stop smoking is related typically to cessationattempts but unrelated to the success of attempts [26].
This study has several limitations. Although this studywas based on a relatively large sample size (n= 2928), onlyapproximately 10%of participants indicated that theywereplanning to reduce their intake within the subsequent3 months (n = 298); this gives limited power of the studyto investigate between-group differences and conduct sub-group analyses. However, given that the current studywas able to detect minimal increased odds for the DID esti-mator in the order of 35%, it is questionable whethersmaller effects are meaningful. Moreover, a further limita-tion was that only 20% (n = 2928) of all increasing andhigher-risk drinkers (n = 14978) could be followed-up.
Problems with the validity of self-reported alcohol con-sumption are well documented (for example [27–29]), andin this repeated-measures sample there is some evidence ofreporting bias. Reported consumption in this sample re-duced from the initial survey to follow-up, regardless ofmo-tivation to change, whereas there is evidence in this of a(small) opposite effect in the temporal analyses of the fullATS survey [7]. In the absence of an unbiased estimationof consumption at both time-points, it remains unknownhow much reporting bias may have impacted our results.
The lack of an effect of motivation to reduce consump-tion at the initial survey on an actual reduction in con-sumption of alcohol observed in this study can have twoexplanations: the lack of effect is correct, or the instrumentused to measure consumption is not sensitive enough. TheAUDIT tool used here to measure alcohol consumptiondoes not include questions referring specifically to currentconsumption, nor does it stipulate a time-frame for whichparticipants are asked to estimate consumption. It has,however, been demonstrated that AUDIT questions reflectcurrent consumption and can be used to assess temporalchanges [7,30–32], and in this study we similarly observean overall decrease in individual self-reported consumptionduring a 6-month period. This indicates that the lack of anassociation between motivation and consumption can
most probably not be ascribed to the use of the measure-ment tool.
We assessed the impact of direct self-reported motiva-tion at aggregated population-level only. There will, ofcourse, have been individuals in this study sample whoplanned to reduce their consumption at the initial surveyand had successfully done so at follow-up, while other indi-vidual factors such as, for example, the indirect effects ofsocial networks [18], were not included.
The main strength of the current study is that the ATSmethodology is firmly established and based on the longer-running Smoking Toolkit Study [33]. This study has thebenefit that initial survey and follow-up measures ofthe same individuals were conducted using the samemethodology allowing for a within-subject repeated-measures design.
Furthermore, seasonal variation in both motivationand consumption which have been reported for theUnited Kingdom and elsewhere [7,34,35] could be takeninto account both through the use of individual-levelrepeated-measures models and additional adjustment fortime (i.e. month) and season.
In summary, this study indicated that, in an Englishpopulation of increasing and higher-risk drinkers, approxi-mately 20% reported they were planning to cut down theirconsumption of alcohol in the near future, and that ahigher proportion of these reported an attempt or seriousattempt during the subsequent 6 months compared withthose who did not plan to reduce consumption. However,6 months later there was no evidence that the groupmotivated to cut down initial consumption had succeededin reducing their alcohol consumption compared withthose reporting less motivation during the initial survey,with the possible exception of higher-risk and possiblydependent drinkers. Our findings suggest that beingmotivated to reduce alcohol consumption is insufficient toachieve measurable change in consumption, implying thatinterventions may focus more usefully upon other factorsimportant to drinking reduction, and that motivation isnot a reliable outcome of intervention effectiveness.
Author contributions
F.V., J.B. and M.H. conceived the study. J.B., E.B. and S.M.managed data collection. F.V. conducted the statisticalanalyses. All authors were involved in the interpretationof the results. F.V. wrote the first draft, and all authorscommented on this and subsequent iterations. All authorsread and approved the final version.
Declaration of interests
E.B. and J.B. have received unrestricted research fundingfrom Pfizer for the Smoking Toolkit Study, a sister study
Motivation and attempts to reduce consumption 825
© 2017 The Authors. Addiction published by John Wiley & Sons Ltd on behalf of Society for the Study of Addiction. Addiction, 113, 817–827
to the ATS. F.D.V. has received grant funding from AlcoholResearch UK, unrelated to this work.
Acknowledgements
This work was funded by the National Institute for HealthResearch School for Public Health Research (NIHR SPHR).NIHR SPHR is a partnership between the Universities ofSheffield, Bristol, Cambridge, Exeter and UCL; the LondonSchool for Hygiene and Tropical Medicine; the LiLaC col-laboration between the Universities of Liverpool and Lan-caster and Fuse; the Centre for Translational Research inPublic Health, a collaboration between Newcastle, Dur-ham, Northumbria, Sunderland and Teesside Universities.The views expressed are those of the author(s) and not nec-essarily those of the NHS, the NIHR or the Department ofHealth. CRUK also supported data collection (C1417/A22962) and J.B., E.B. and R.W. all receive salary supportfrom CRUK (C1417/A22962). J.B., E.B., S.M., and R.W. arepart of UKCTAS. Please contact J.B. ([email protected]) to discuss availability of data.
References
1. Rehm J., Mathers C., Popova S., Thavorncharoensap M.,Teerawattananon Y., Patra J. Global burden of disease and in-jury and economic cost attributable to alcohol use andalcohol-use disorders. Lancet 2009; 373: 2223–33.
2. Bhattacharya A. Which cost of alcohol? What should wecompare it against? Addiction 2017; 112: 559–65.
3. Ellison R. C. Balancing the risks and benefits of moderatedrinking. Ann NYAcad Sci 2002; 957: 1–6.
4. West R., Brown J. Theory of Addiction. Chichester, UK: JohnWiley & Sons; 2013.
5. Bertholet N., Horton N. J., Saitz R. Improvements in readinessto change and drinking in primary care patients with un-healthy alcohol use: a prospective study. BMC Public Health2009; 9: 101.
6. Kuerbis A., Armeli S., Muench F., Morgenstern J. Motivationand self-efficacy in the context of moderated drinking: globalself-report and ecological momentary assessment. Psychol Ad-dict Behav 2013; 27: 934–43.
7. de Vocht F., Brown J., Beard E., Angus C., Brennan A., MichieS. et al. Temporal patterns of alcohol consumption and at-tempts to reduce alcohol intake in England. BMC PublicHealth 2016; 16: 917.
8. Williams E. C., Horton N. J., Samet J. H. Do brief measures ofreadiness to change predict alcohol consumption and conse-quences in primary care patients with unhealthy alcoholuse? Alcohol Clin Exp Res 2007; 31: 428–35.
9. Beard E., Brown J., Kaner E., West R., Michie S. Predictors ofand reasons for attempts to reduce alcohol intake: a popula-tion survey of adults in England. PLOS ONE 2017; 12:e0173458.
10. Beard E., Brown J., West R., Acton C., Brennan A., Drum-mond C. et al. Protocol for a national monthly survey ofalcohol use in England with 6-month follow-up: ‘the alcoholtoolkit study’. BMC Public Health 2015; 15: 230.
11. de Vaus D. Findinga sample. In: der Vaus D., editor. Surveys inSocial Research, 5th edn. London: Routledge; 2002, pp. 69–90.
12. Babor T., Higgins-Biddle J., Saunders J., Monteiro M. AUDIT.The Alcohol Use Disorders Identification Test, Guidelines for Usein Primary Care, 2nd edn. Geneva, Switzerland: World HealthOrganization (WHO); 2001.
13. Bohn M. J., Babor T. F., Kranzler H. R. The alcohol use disor-ders identification test (AUDIT): validation of a screeninginstrument for use in medical settings. J Stud Alcohol 1995;56: 423–32.
14. Kotz D., Brown J., West R. Predictive validity of the motivationto stop scale (MTSS): a single-item measure of motivation tostop smoking. Drug Alcohol Depend 2013; 128: 15–9.
15. Wagenmakers E. J. A practical solution to the pervasiveproblems of p values. Psychon Bull Rev 2007; 14: 779–804.
16. Allisson P. Comparing logit and probit coefficients acrossgroups. Sociol Methods Res 1999; 28: 186–208.
17. Brant R. Assessing proportionality in the proportional oddsmodel for ordinal logistic regression. Biometrics 1990; 46:1171–8.
18. Hunter-Reel D., McCrady B. S., Hildebrandt T., Epstein E. E.Indirect effect of social support for drinking on drinkingoutcomes: the role of motivation. J Stud Alcohol Drugs 2010;71: 930–7.
19. Kuerbis A., Armeli S., Muench F., Morgenstern J. Profiles ofconfidence and commitment to change as predictors ofmoderated drinking: a person-centered approach. PsycholAddict Behav 2014; 28: 1065–76.
20. Kavanagh D. J., Sitharthan T., Sayer G. P. Prediction of resultsfrom correspondence treatment for controlled drinking.Addiction 1996; 91: 1539–45.
21. Zhou X., Nonnemaker J., Sherrill B., Gilsenan A. W., Coste F.,West R. Attempts to quit smoking and relapse: factors associ-ated with success or failure from the ATTEMPT cohort study.Addict Behav 2009; 34: 365–73.
22. Hummel K., Brown J., Willemsen M. C., West R., Kotz D.External validation of the motivation to stop scale (MTSS):findings from the international tobacco control (ITC)Netherlands survey. Eur J Public Health 2017; 27: 129–34.
23. Brown J., Michie S., Raupach T., West R. Prevalence andcharacteristics of smokers interested in internet-basedsmoking cessation interventions: cross-sectional findingsfrom a national household survey. J Med Internet Res 2013;15: e50.
24. Hitchman S. C., Brose L. S., Brown J., Robson D., McNeill A.Associations between e-cigarette type, frequency of use,and quitting smoking: findings from a longitudinal onlinepanel survey in great Britain. Nicotine Tob Res 2015; 17:1187–94.
25. Tombor I., Shahab L., Brown J., West R. Positive smoker iden-tity as a barrier to quitting smoking: findings from a nationalsurveyof smokers in England.Drug Alcohol Depend 2013; 133:740–5.
26. Vangeli E., Stapleton J., Smit E. S., Borland R., West R. Predic-tors of attempts to stop smoking and their success in adultgeneral population samples: a systematic review. Addiction2011; 106: 2110–21.
27. Ekholm O., Strandberg-Larsen K., Christensen K., GronbaekM. Comparison of assessment methods for self-reportedalcohol consumption in health interview surveys. Eur J ClinNutr 2008; 62: 286–91.
28. Greenfield T. K., Kerr W. C. Alcohol measurement methodol-ogy in epidemiology: recent advances and opportunities.Addiction 2008; 103: 1082–99.
29. Stockwell T., Donath S., Cooper-Stanbury M., Chikritzhs T.,Catalano P.,Mateo C. Under-reportingof alcohol consumption
826 Frank de Vocht et al.
© 2017 The Authors. Addiction published by John Wiley & Sons Ltd on behalf of Society for the Study of Addiction. Addiction, 113, 817–827
in household surveys: a comparison of quantity–frequency,graduated-frequency and recent recall. Addiction 2004; 99:1024–33.
30. Hahn J. A., Fatch R., Wanyenze R. K., Baveewo S., Kamya M.R., Bangsberg D. R. et al. Decreases in self-reported alcoholconsumption following HIV counseling and testing at Mulagohospital, Kampala, Uganda. BMC Infect Dis 2014; 14: 403.
31. Noble N., Paul C., Conigrave K., Lee K., Blunden S., Turon H.et al. Does a retrospective seven-day alcohol diary reflectusual alcohol intake for a predominantly disadvantagedAustralian aboriginal population? Subst Use Misuse 2015;50: 308–19.
32. Shakeshaft A. P., Bowman J. A., Sanson-Fisher R. W. Compar-ison of three methods to assess binge consumption: one-weekretrospective drinking diary, AUDIT, and quantity/frequency.Subst Abuse 1998; 19: 191–203.
33. Fidler J. A., Shahab L., West O., Jarvis M. J., McEwen A.,Stapleton J. A. et al. ‘The Smoking Toolkit Study’: a nationalstudy of smoking and smoking cessation in England. BMCPublic Health 2011; 11: 479.
34. Cho Y. I., Johnson T. P., FendrichM.Monthly variations in self-reports of alcohol consumption. J Stud Alcohol 2001; 62:268–72.
35. Knudsen A. K., Skogen J. C. Monthly variations in self-reportof time-specified and typical alcohol use: the Nord-Trondelag e_k; health study (HUNT3). BMC Public Health2015; 15: 172.
Supporting Information
Additional Supporting Information may be found online inthe supporting information tab for this article.
Table S1 AUDIT-c scores used in the Alcohol Toolkit Study.Table S2 Sensitivity analysis of proportional odds assump-tion.Table S3 Distribution of answers to motivation to reducealcohol consumption (at baseline).Table S4 Median AUDIT scores in follow-up group.Table S5 Repeated measures ordinal regression model re-sults for AUDIT-c score people answering no to ’are youcurrently trying to reduce your consumption (n = 2,242).Table S6 Repeated measures ordinal regression model re-sults for AUDIT-c score people answering no to ’are youcurrently trying to reduce your consumption(n = 2,242): 3-level motivational scale.
Motivation and attempts to reduce consumption 827
© 2017 The Authors. Addiction published by John Wiley & Sons Ltd on behalf of Society for the Study of Addiction. Addiction, 113, 817–827