Embed Size (px)
Citation preview
8 May 2013
0
Table of Contents
1. Project Overview ................................................................................................................... 3 1.1 Project Summary ............................................................................................................ 3
1.2 Scientific Objectives ....................................................................................................... 4
1.3 Regional analysis and numerical weather prediction ............................................... 5
1.4 Storm-environment feedbacks ..................................................................................... 9
2. Experimental Design and Deployment Strategies ......................................................... 11 2.1 Morning Dropsonde and MTP Strategies ................................................................. 11
2.2 Afternoon Upsonde Strategies ................................................................................... 14
2.3 Meteorological Case Selection Criteria (IOPs) ........................................................ 18
3. Forecasting, Nowcasting, and Modeling ......................................................................... 20 3.1 Forecasting and Nowcasting ...................................................................................... 20
3.2 Modeling ......................................................................................................................... 24
4. Project Organization (Weisman)....................................................................................... 26 5. Schedule (Weisman) .......................................................................................................... 27
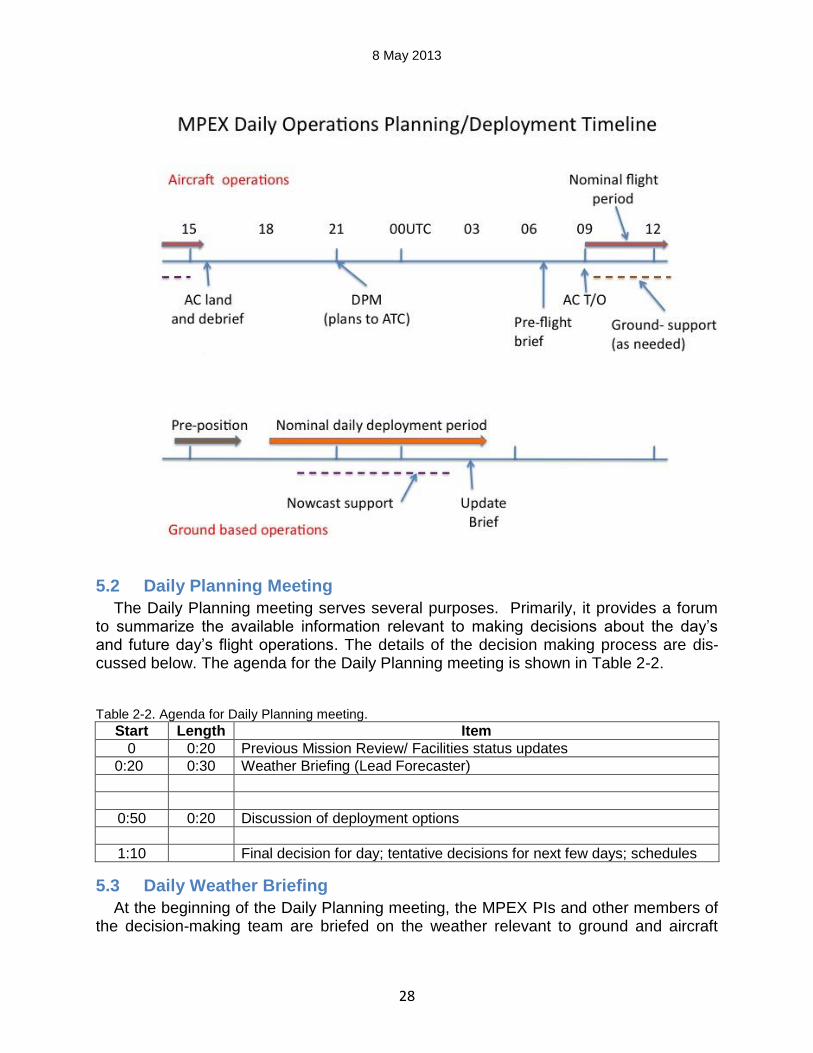
5.1 Nominal Daily Schedules ............................................................................................ 27
5.2 Daily Planning Meeting ................................................................................................ 28
MPEX Operations Plan 7 May 2013 DRAFT
8 May 2013
1
5.3 Daily Weather Briefing ................................................................................................. 28
5.4 Pre-flight Aircraft Briefing............................................................................................. 29
5.5 Evening Weather Forecast Update ............................................................................ 29
5.6 Post-flight Aircraft Debriefing ...................................................................................... 29
5.7 RAF Personnel Scheduling ......................................................................................... 29
6. Decision Making .................................................................................................................. 30 6.1 Decision Making for Flight Operations ...................................................................... 30
6.2 Decision Making during Flight Operations ................................................................ 31
6.3 Contingency Plans ........................................................................................................ 32
6.4 Non Flight Days............................................................................................................. 33
7. Operations Bases (Moore) ................................................................................................ 34 8. Project Communications (Moore) ..................................................................................... 34
8.1 Operations Bases ......................................................................................................... 35
8.2 Mobile sounding Crews ............................................................................................... 35
8.3 Aircraft ............................................................................................................................ 36
9. Aircraft Operations .............................................................................................................. 36 9.1 Capabilities, Payloads, Constraints, Safety .............................................................. 36
9.2 Aircraft Functions .......................................................................................................... 38
9.3 Aircraft Instrumentation Functions ............................................................................. 38
9.4 Aircraft Flight Plans ...................................................................................................... 39
9.5 Test flights and Shake-down flights ........................................................................... 39
10. MPEX Instrumentation ...................................................................................................... 39 10.1 AVAPS ......................................................................................................................... 39
10.1.1 Mini Sonde Description .................................................................................................. 40 10.1.2 Flight Characteristics ...................................................................................................... 42
10.1.3 System Capability .......................................................................................................... 44
10.1.4 Flight operations ......................................................................................................... 44
10.2 Microwave Temperature Profiler .............................................................................. 45
10.3 Upsondes ..................................................................................................................... 47
11. Data and Information Management ................................................................................. 47 11.1 Introduction .................................................................................................................. 47
11.2 Data Policy, Protocol, and Attribution ...................................................................... 48
11.3 Real-Time Data ........................................................................................................... 49
11.4 Data Archive and Access .......................................................................................... 50
12. Education and Outreach ................................................................................................... 51
8 May 2013
2
13. Appendices .......................................................................................................................... 51 Appendix A. PIs, Committees, and the Science Team .................................................... 51
Appendix B. Contact Information ......................................................................................... 51
Appendix C. Aircraft Payloads and Cabin Layouts ........................................................... 51
Appendix D. ReadyTalk Connection Information .............................................................. 52
Appendix E. MPEX and Related Websites ........................................................................ 52
Figures Figure 1-1. .................................................................................................................. 7
Tables Table 1-1. ................................................................................................................... 7
8 May 2013
3
Mesoscale Predictability Experiment (MPEX) Operations Plan
1. Project Overview
1.1 Project Summary
The Mesoscale Predictability Experiment (MPEX) will be conducted within the U.S. in-termountain region and high plains during the late spring/early summer of 2013 and will include the use of the NCAR GV, along with the new Airborne Vertical Atmospheric Pro-filing System (AVAPS) dropsonde system and the Microwave Temperature Profiling (MTP) system, as well as several ground-based mobile upsonde systems, for the field experiment which will take place during a 4-week time period from 15 May to 15 June 2013. MPEX is motivated by the basic question of whether experimental, sub-synoptic obser-vations can extend convective-scale predictability and otherwise enhance skill in re-gional numerical weather prediction over a roughly 6 to 24 hour time span. The experi-mental plan is guided by the following two scientific hypotheses: Hypothesis 1: Enhanced synoptic and sub-synoptic scale observations and their assimi-lation into convection-permitting models over the intermountain region during the early morning will significantly improve the forecast of the timing and location of convective initiation as well as convective morphology and evolution during the afternoon and evening to the lee of the mountains and over the High Plains. Hypothesis 2: Enhanced sub-synoptic scale observations in the late afternoon, over re-gions where the atmosphere has been/is being convectively disturbed, will significantly improve the 6-24 hr forecast of convection evolution and perhaps initiation in down-stream regions. Enhanced observations of convective storm-environmental feedbacks will correspondingly improve the synoptic-scale forecast. Basic operations will involve two missions a day: an early morning mission (~3:00 am -
10:00 am) primarily over the intermountain region, and an afternoon and early evening
mission to the lee of the mountains. The proposed project time period, from 15 May to
15 June 2013, due to the known high frequency of widespread, severe convective out-
breaks over the Great Plains region during this period (an average of 15 per year), and
also due to the fact that such outbreaks are still often associated with synoptic and sub-
synoptic features emanating from the intermountain regions.
The proposed observational strategy for each early morning mission will be to release 28 to 35 dropsondes from an altitude of about 40,000 ft over a grid of spacing ~ 75-200 km. MTP observations will continuously sample the temperature structure through the
8 May 2013
4
mid- and upper troposphere in conjunction with the dropsonde data, enhancing the rep-resentation of any mesoscale or sub-synoptic scale features along the plane's path. The dropsonde and will be incorporated into realtime and both the dropsonde and MTP data will be incorporated into retrospective data assimilation experiments using a variety of techniques (3DVAR, ENKF, etc.) to establish the potential benefits of such enhanced observations. For the afternoon missions, 2-3 mobile upsonde units will be positioned in the vicinity of convection to collect serial soundings as the storms develop and mature, thereby doc-umenting both the immediate pre-storm environmental conditions as well as any subse-quent storm-induced environmental modifications.
1.2 Scientific Objectives
The Mesoscale Predictability Experiment (MPEX) is a field program that aims to investi-gate the predictability of convective storms on the mesoscale. In particular, it seeks to address the basic question of whether experimental, sub-synoptic observations can ex-tend convective-scale predictability and otherwise enhance skill in regional numerical weather prediction over a roughly 6 to 24 hour time span. There are two complementary research foci for MPEX: Regional-scale numerical weather prediction (NWP) of convective storms. Analysis and prediction of the upstream, pre-storm mesoscale and sub-synoptic scale environment for regional scale convective forecasting. The feedbacks between deep convective storms and their environments. The upscaling effects of deep convective storms on their environment, and how these feed back to the convective-scale dynamics and predictability. Theoretical studies clearly suggest a decrease in predictability for decreasing scale of the phenomena in question, with predictability possibly extending out to several days for synoptic scale disturbances, perhaps 12 to 24 hours for mesoscale or sub-synoptic dis-turbances, down to mere hours for convective storms (e.g., Lilly 1990). Indeed, data assimilation studies to date suggest that the value of adding convective scale details to the initial forecast state, via the direct incorporation of radar data, the indirect use of diabatic heating to represent ongoing convection, and the like, is largely lost in the first six hours of a forecast. However, to the degree that convective storms are forced and constrained by larger-scale phenomena such as fronts, dry lines, jet streaks, etc., im-proving the representation of these forcing elements has the potential to significantly improve the predictability of the more regional aspects of convective weather as well. It is in this regard that we intend to use the dropsondes, upsondes and MTP data to ad-dress the predictability of convective weather.
8 May 2013
5
1.3 Regional analysis and numerical weather prediction
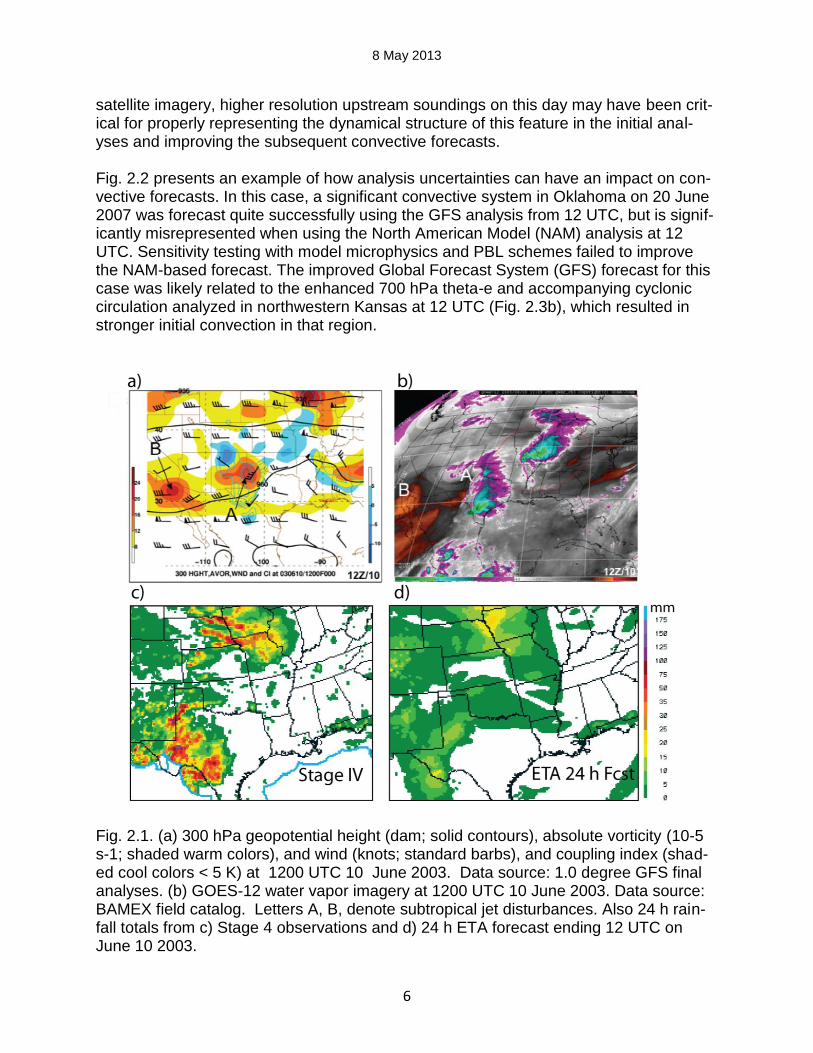
Explicit predictions of convective weather with numerical models that assimilate high-resolution observations are recognized as essential for improving warnings of hazard-ous weather associated with convective storms (tornadoes, other damaging winds, hail, lightning, and floods) and improving quantitative precipitation forecasts in general (Fritsch et al. 1998; Droegemeier et al. 2000; Dabbert et al. 2000; U.S. Dept. of Com-merce 1999). Various real-time experiments during the last decade have demonstrated that explicit prediction of convective storms (Lilly 1990; Droegemeier 1990; Droegemeier 1997) has now become a reality (e.g., Droegemeier et al. 1996; Xue and Martin 2006ab; Sun and Crook 2001; Crook and Sun 2002; Done et al. 2004; Kain et al., 2005, 2006, 2008; Weisman et al. 2008; Clark et al. 2012). Since 2003, experi-mental daily 24 to 48 h real-time explicit convective forecasts employing grid spacings between 1 and 4-km horizontal over the central U.S. have been evaluated as part of the NSSL-SPC Hazardous Weather Testbed (HWT) spring experiments, whereby forecast-ers and researchers from a variety of backgrounds have evaluated the applications of such high resolution guidance for operational severe storm forecasting (e.g., Weiss et al. 2004, 2007; Kain et al. 2005, 2006, 2008). These forecast exercises have demon-strated that increasing horizontal grid resolutions into the convectively-explicit regime leads to significant improvements in convective forecast guidance. Such forecasts often realistically represent the structure and evolution of mesoscale convective phenomena, such as supercells, squall lines, bow echoes, and mesoscale convective vortices (e.g., Weisman et al. 2008). On the other hand, significant errors in the timing and location of significant convective events are also frequently encountered. Numerous issues could contribute to these forecast errors, including errors in physical parameterization schemes, coarse horizontal and vertical resolution, poor representa-tion of atmospheric features crucial to storm initiation and evolution, and so on. While sensitivity studies considering resolution and model physics (e.g., PBL and microphys-ics) have generally not been able to explain errors in mesoscale convective organiza-tion, far more forecast sensitivity on the 6 to 48 h timescale is generally observed by varying initial conditions (e.g., initializing with the RUC versus NAM versus GFS), providing a larger spread of possible outcomes that seems to offer a better chance of encompassing the correct forecast (e.g., Weisman et al. 2008). Figure 2.1 provides an example of the type of upstream features that can have a signifi-cant impact on convective forecasts later in the day. In this case, from June 10, 2003 during BAMEX, a series of small-scale waves (labeled A and B in Fig. 2.2) were moving eastward within the subtropical jet stream. Of particular interest, wave A was not accu-rately represented in the initial analyses for either the operational NAM or an experi-mental WRF-ARW forecast, at either 00 UTC or 12 UTC. This wave subsequently initi-ated a large mesoscale convective system (MCS) with an associated mesoscale con-vective vortex (MCV) later that evening over central Oklahoma (not shown). Neither the NCEP operational regional model (ETA) or the WRF-ARW forecasts initialized from the ETA were able to capture this significant MCS. Although the precursor was apparent in
8 May 2013
6
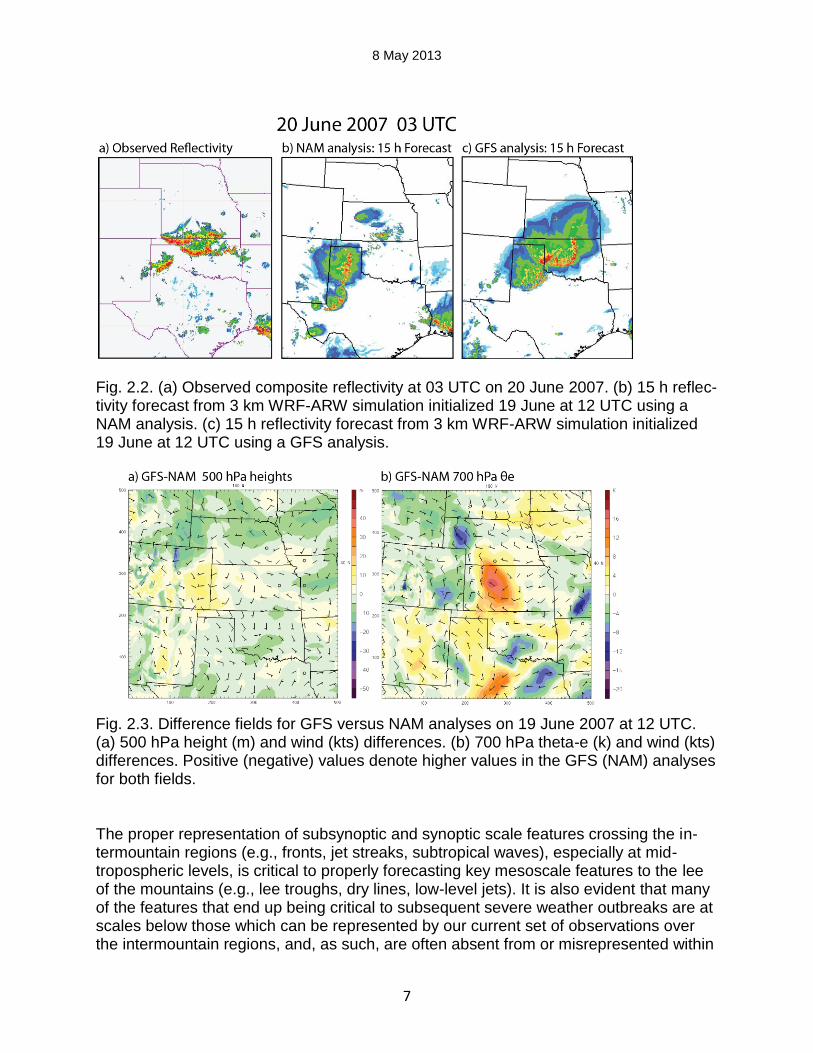
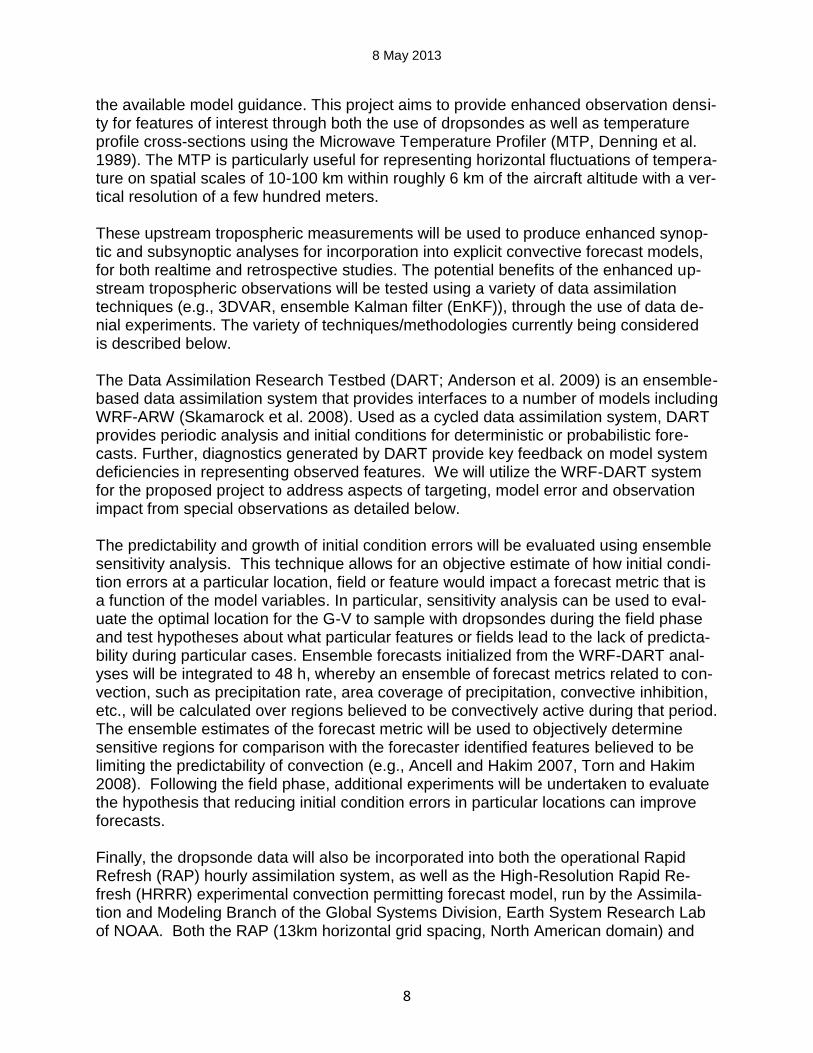
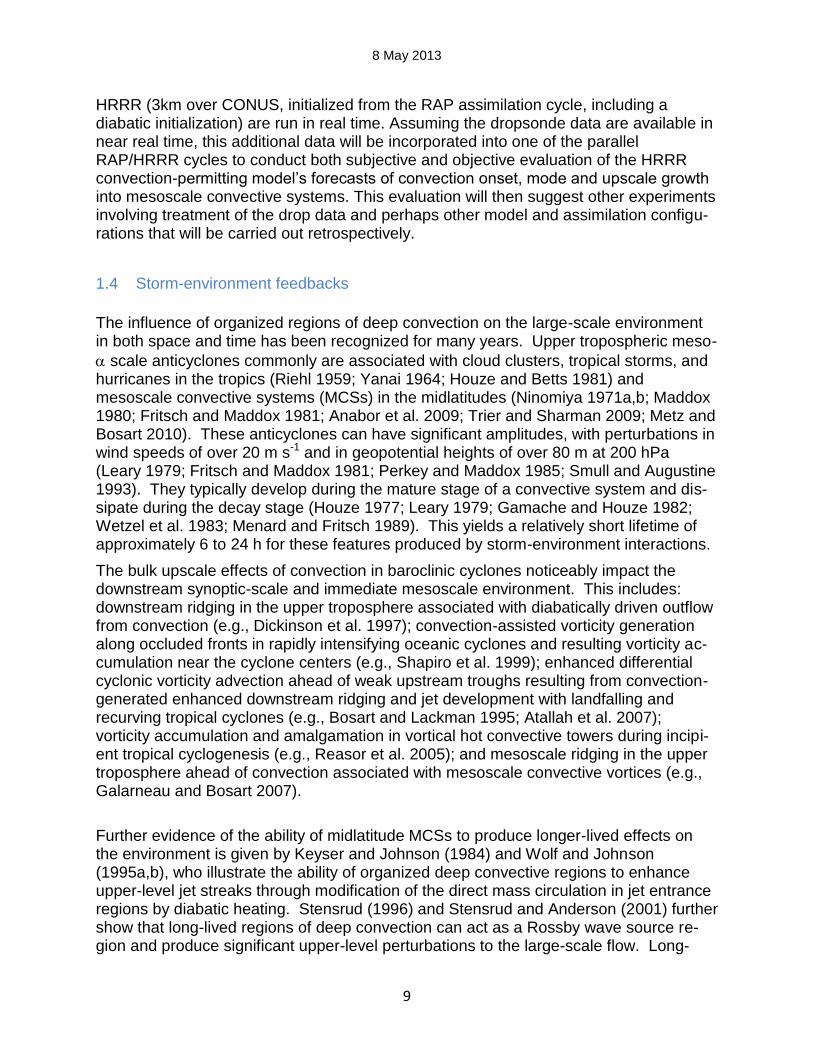
satellite imagery, higher resolution upstream soundings on this day may have been crit-ical for properly representing the dynamical structure of this feature in the initial anal-yses and improving the subsequent convective forecasts. Fig. 2.2 presents an example of how analysis uncertainties can have an impact on con-vective forecasts. In this case, a significant convective system in Oklahoma on 20 June 2007 was forecast quite successfully using the GFS analysis from 12 UTC, but is signif-icantly misrepresented when using the North American Model (NAM) analysis at 12 UTC. Sensitivity testing with model microphysics and PBL schemes failed to improve the NAM-based forecast. The improved Global Forecast System (GFS) forecast for this case was likely related to the enhanced 700 hPa theta-e and accompanying cyclonic circulation analyzed in northwestern Kansas at 12 UTC (Fig. 2.3b), which resulted in stronger initial convection in that region.
Fig. 2.1. (a) 300 hPa geopotential height (dam; solid contours), absolute vorticity (10-5 s-1; shaded warm colors), and wind (knots; standard barbs), and coupling index (shad-ed cool colors < 5 K) at 1200 UTC 10 June 2003. Data source: 1.0 degree GFS final analyses. (b) GOES-12 water vapor imagery at 1200 UTC 10 June 2003. Data source: BAMEX field catalog. Letters A, B, denote subtropical jet disturbances. Also 24 h rain-fall totals from c) Stage 4 observations and d) 24 h ETA forecast ending 12 UTC on June 10 2003.
8 May 2013
7
Fig. 2.2. (a) Observed composite reflectivity at 03 UTC on 20 June 2007. (b) 15 h reflec-tivity forecast from 3 km WRF-ARW simulation initialized 19 June at 12 UTC using a NAM analysis. (c) 15 h reflectivity forecast from 3 km WRF-ARW simulation initialized 19 June at 12 UTC using a GFS analysis.
Fig. 2.3. Difference fields for GFS versus NAM analyses on 19 June 2007 at 12 UTC. (a) 500 hPa height (m) and wind (kts) differences. (b) 700 hPa theta-e (k) and wind (kts) differences. Positive (negative) values denote higher values in the GFS (NAM) analyses for both fields. The proper representation of subsynoptic and synoptic scale features crossing the in-termountain regions (e.g., fronts, jet streaks, subtropical waves), especially at mid-tropospheric levels, is critical to properly forecasting key mesoscale features to the lee of the mountains (e.g., lee troughs, dry lines, low-level jets). It is also evident that many of the features that end up being critical to subsequent severe weather outbreaks are at scales below those which can be represented by our current set of observations over the intermountain regions, and, as such, are often absent from or misrepresented within
8 May 2013
8
the available model guidance. This project aims to provide enhanced observation densi-ty for features of interest through both the use of dropsondes as well as temperature profile cross-sections using the Microwave Temperature Profiler (MTP, Denning et al. 1989). The MTP is particularly useful for representing horizontal fluctuations of tempera-ture on spatial scales of 10-100 km within roughly 6 km of the aircraft altitude with a ver-tical resolution of a few hundred meters. These upstream tropospheric measurements will be used to produce enhanced synop-tic and subsynoptic analyses for incorporation into explicit convective forecast models, for both realtime and retrospective studies. The potential benefits of the enhanced up-stream tropospheric observations will be tested using a variety of data assimilation techniques (e.g., 3DVAR, ensemble Kalman filter (EnKF)), through the use of data de-nial experiments. The variety of techniques/methodologies currently being considered is described below. The Data Assimilation Research Testbed (DART; Anderson et al. 2009) is an ensemble-based data assimilation system that provides interfaces to a number of models including WRF-ARW (Skamarock et al. 2008). Used as a cycled data assimilation system, DART provides periodic analysis and initial conditions for deterministic or probabilistic fore-casts. Further, diagnostics generated by DART provide key feedback on model system deficiencies in representing observed features. We will utilize the WRF-DART system for the proposed project to address aspects of targeting, model error and observation impact from special observations as detailed below. The predictability and growth of initial condition errors will be evaluated using ensemble sensitivity analysis. This technique allows for an objective estimate of how initial condi-tion errors at a particular location, field or feature would impact a forecast metric that is a function of the model variables. In particular, sensitivity analysis can be used to eval-uate the optimal location for the G-V to sample with dropsondes during the field phase and test hypotheses about what particular features or fields lead to the lack of predicta-bility during particular cases. Ensemble forecasts initialized from the WRF-DART anal-yses will be integrated to 48 h, whereby an ensemble of forecast metrics related to con-vection, such as precipitation rate, area coverage of precipitation, convective inhibition, etc., will be calculated over regions believed to be convectively active during that period. The ensemble estimates of the forecast metric will be used to objectively determine sensitive regions for comparison with the forecaster identified features believed to be limiting the predictability of convection (e.g., Ancell and Hakim 2007, Torn and Hakim 2008). Following the field phase, additional experiments will be undertaken to evaluate the hypothesis that reducing initial condition errors in particular locations can improve forecasts. Finally, the dropsonde data will also be incorporated into both the operational Rapid Refresh (RAP) hourly assimilation system, as well as the High-Resolution Rapid Re-fresh (HRRR) experimental convection permitting forecast model, run by the Assimila-tion and Modeling Branch of the Global Systems Division, Earth System Research Lab of NOAA. Both the RAP (13km horizontal grid spacing, North American domain) and
8 May 2013
9
HRRR (3km over CONUS, initialized from the RAP assimilation cycle, including a diabatic initialization) are run in real time. Assuming the dropsonde data are available in near real time, this additional data will be incorporated into one of the parallel RAP/HRRR cycles to conduct both subjective and objective evaluation of the HRRR convection-permitting model’s forecasts of convection onset, mode and upscale growth into mesoscale convective systems. This evaluation will then suggest other experiments involving treatment of the drop data and perhaps other model and assimilation configu-rations that will be carried out retrospectively.
1.4 Storm-environment feedbacks
The influence of organized regions of deep convection on the large-scale environment in both space and time has been recognized for many years. Upper tropospheric meso-
scale anticyclones commonly are associated with cloud clusters, tropical storms, and hurricanes in the tropics (Riehl 1959; Yanai 1964; Houze and Betts 1981) and mesoscale convective systems (MCSs) in the midlatitudes (Ninomiya 1971a,b; Maddox 1980; Fritsch and Maddox 1981; Anabor et al. 2009; Trier and Sharman 2009; Metz and Bosart 2010). These anticyclones can have significant amplitudes, with perturbations in wind speeds of over 20 m s-1 and in geopotential heights of over 80 m at 200 hPa (Leary 1979; Fritsch and Maddox 1981; Perkey and Maddox 1985; Smull and Augustine 1993). They typically develop during the mature stage of a convective system and dis-sipate during the decay stage (Houze 1977; Leary 1979; Gamache and Houze 1982; Wetzel et al. 1983; Menard and Fritsch 1989). This yields a relatively short lifetime of approximately 6 to 24 h for these features produced by storm-environment interactions.
The bulk upscale effects of convection in baroclinic cyclones noticeably impact the downstream synoptic-scale and immediate mesoscale environment. This includes: downstream ridging in the upper troposphere associated with diabatically driven outflow from convection (e.g., Dickinson et al. 1997); convection-assisted vorticity generation along occluded fronts in rapidly intensifying oceanic cyclones and resulting vorticity ac-cumulation near the cyclone centers (e.g., Shapiro et al. 1999); enhanced differential cyclonic vorticity advection ahead of weak upstream troughs resulting from convection-generated enhanced downstream ridging and jet development with landfalling and recurving tropical cyclones (e.g., Bosart and Lackman 1995; Atallah et al. 2007); vorticity accumulation and amalgamation in vortical hot convective towers during incipi-ent tropical cyclogenesis (e.g., Reasor et al. 2005); and mesoscale ridging in the upper troposphere ahead of convection associated with mesoscale convective vortices (e.g., Galarneau and Bosart 2007).
Further evidence of the ability of midlatitude MCSs to produce longer-lived effects on the environment is given by Keyser and Johnson (1984) and Wolf and Johnson (1995a,b), who illustrate the ability of organized deep convective regions to enhance upper-level jet streaks through modification of the direct mass circulation in jet entrance regions by diabatic heating. Stensrud (1996) and Stensrud and Anderson (2001) further show that long-lived regions of deep convection can act as a Rossby wave source re-gion and produce significant upper-level perturbations to the large-scale flow. Long-
8 May 2013
10
lived regions of deep convection also tend to increase the low-level inflow of warm, moist air that helps sustain the convection (Stensrud 1996). Similarly, buoyancy bores emanating from deep convection act to further enhance nearby low-level vertical mo-tion, making new convection initiation more likely (Mapes 1993), although interactions between nearby convection also can occur within several vertical layers and actually suppress convection (Stensrud and Maddox 1988). Bretherton (1993) further indicates that the gravity wave response near the heat source region can be quite complex, with mean flow and wind shear capable of altering the propagation of the long gravity waves that produce adjustment (Lin 1987).
On the smaller scale, closer to the region of deep convection in both space and time, Brooks et al. (1994) show changes in the convective available potential energy (CAPE) and storm-relative environmental helicity surrounding a simulated supercell thunder-storm. The supercell enhances both CAPE and helicity in the inflow region within 2 hours after initiation, with the changes extending out 10-20 km from the storm core. These changes likely assist supercell maintenance and may increase storm severity. Thus, even isolated, short-lived thunderstorms influence the nearby environment.
While these past studies clearly document the influences of thunderstorms and MCSs on the large-scale environment, both nearby the convection and more distant, a careful comparison of the upscale response to convection from model simulations with envi-ronmental observations has not been conducted. It is plausible to propose that a large region of deep diabatic heating due to convection would lead to the production of an upper-level anticyclone while simultaneously strengthening the low-level flow around the convective region. This is a first-order effect and it is expected that numerical models with even crude approximations of convective processes would be able to reproduce this behavior. With the improved capability of NWP models at convection-allowing grid spacing (1 – 4 km), however, it is time to examine the details of how deep convection modifies the surrounding environment in much greater detail.
The improvements in NWP models at convection-allowing grid spacing also provides an opportunity to examine the predictability of convective forecasts. Current convection-allowing NWP models can be quite skillful in predicting convection, but their forecast skill generally decreases rapidly within a few hours (Weygandt et al. 2004, Kain et al. 2010, Stratman et al. 2012). One important reason for this rapid degradation in skill is analysis error in the environment. It is well known that the characteristics of convective storms are strongly tied to the environment in which they develop, thus it is important to represent the initial environment accurately to be able to forecast convection accurately (Benjamin et al. 2010, Wandishin et al. 2010).
Recent studies show this may be true even for convection-allowing grids and when ob-servations of precipitation and radial wind from Doppler radar data are assimilated. For example, Fabry (2010) shows that radiosonde temperature, wind and humidity observa-tions (midlevel humidity in particular) all have a large positive impact on 0 – 6 h fore-casts of precipitation on 4-km grids. Stensrud and Gao (2010) show that a horizontally inhomogeneous background environment derived from an assimilation of surface ob-servations drastically improves 1-h forecasts of a tornadic thunderstorm on 1 - 3-km grids over those provided by horizontally homogeneous initial conditions. For the suc-
8 May 2013
11
cessful prediction of a squall line on a 4-km grid, Sun and Zhang (2008) show that as-similation of wind observations from a nearby environmental sounding are very im-portant. Schenkman et al. (2011) show that 1 – 2 h forecasts of a MCS on a 2-km grid and an embedded vortex are impacted positively and significantly by the assimilation of surface mesonet data. Although the abovementioned studies show the importance of representing the environment accurately for short-term convective forecasts, they are limited in scope. A careful examination of the impact of multiple radiosonde observa-tions at mesoscale space and time scales on the short-term (0 – 6 h) prediction of con-vection has not been done.
As a way of summarizing the preceding review of storm-environment feedbacks, we ask the following:
How does the upscale feedback relate to the mode of convection, and to other characteristics, such as the numbers and relative sizes of the convective cells?
Are simulations with convection-permitting models able to produce the environ-mental warming/cooling due to convection over the same vertical depths as indi-cated by observations? How well do these model simulation reproduce the mois-ture and wind structures nearby deep convection?
Is the rapid decrease in the skill of convective forecasts influenced by the accu-racy of model environmental forecasts in regions just outside of active deep con-vection?
Accordingly, these and related research questions under Hypothesis 2 can be divided into three complementary parts to be pursued during MPEX:
Quantification of observed upscale feedbacks from deep convection
Model simulations of upscale feedbacks from deep convection
Predictability of convectively disturbed atmosphere
2. Experimental Design and Deployment Strategies
2.1 Morning Dropsonde and MTP Strategies
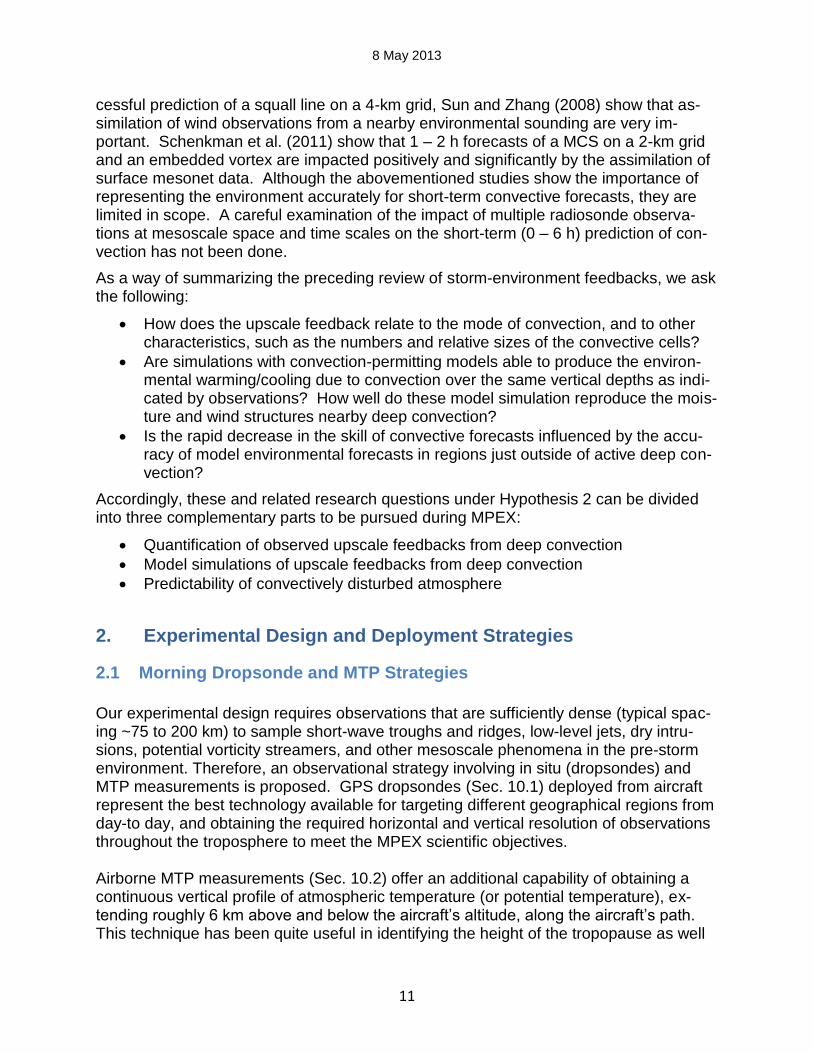
Our experimental design requires observations that are sufficiently dense (typical spac-ing ~75 to 200 km) to sample short-wave troughs and ridges, low-level jets, dry intru-sions, potential vorticity streamers, and other mesoscale phenomena in the pre-storm environment. Therefore, an observational strategy involving in situ (dropsondes) and MTP measurements is proposed. GPS dropsondes (Sec. 10.1) deployed from aircraft represent the best technology available for targeting different geographical regions from day-to day, and obtaining the required horizontal and vertical resolution of observations throughout the troposphere to meet the MPEX scientific objectives. Airborne MTP measurements (Sec. 10.2) offer an additional capability of obtaining a continuous vertical profile of atmospheric temperature (or potential temperature), ex-tending roughly 6 km above and below the aircraft’s altitude, along the aircraft’s path. This technique has been quite useful in identifying the height of the tropopause as well
8 May 2013
12
as identifying mid-tropospheric baroclinic zones (e.g., Fig. 3.1). During PREDICT, it was shown that MTP observations could also identify more subtle (e.g., 1-2 K) temperature variations (Chris Davis, personal communication), as might be critical for identifying the type of weaker mid- and upper-tropospheric mesoscale features thought to be important for convective triggering. As such, MTP data will significantly enhance the characteriza-tion of atmospheric structure between dropsondes, thereby increasing the effective res-olution of the observational data set even further. In conjunction with this, we also take advantage of d-value mapping of the difference between pressure altitude and GPS, to provide further fine scale measurements of the pressure field along the flight path. Accessing MTP and the d-value data in realtime will be especially useful for identifying regions of special interest and for intercomparison with the dropsonde data. The dropsonde and MTP deployments will occur for all days for which widespread (se-vere) convection with an identifiable upstream precursor is forecast, based on opera-tional and experimental convectively explicit forecast guidance as well as the Storm Prediction Center convective outlooks (e.g., Sec. 2.3.1). The deployment strategy is described in detail below.
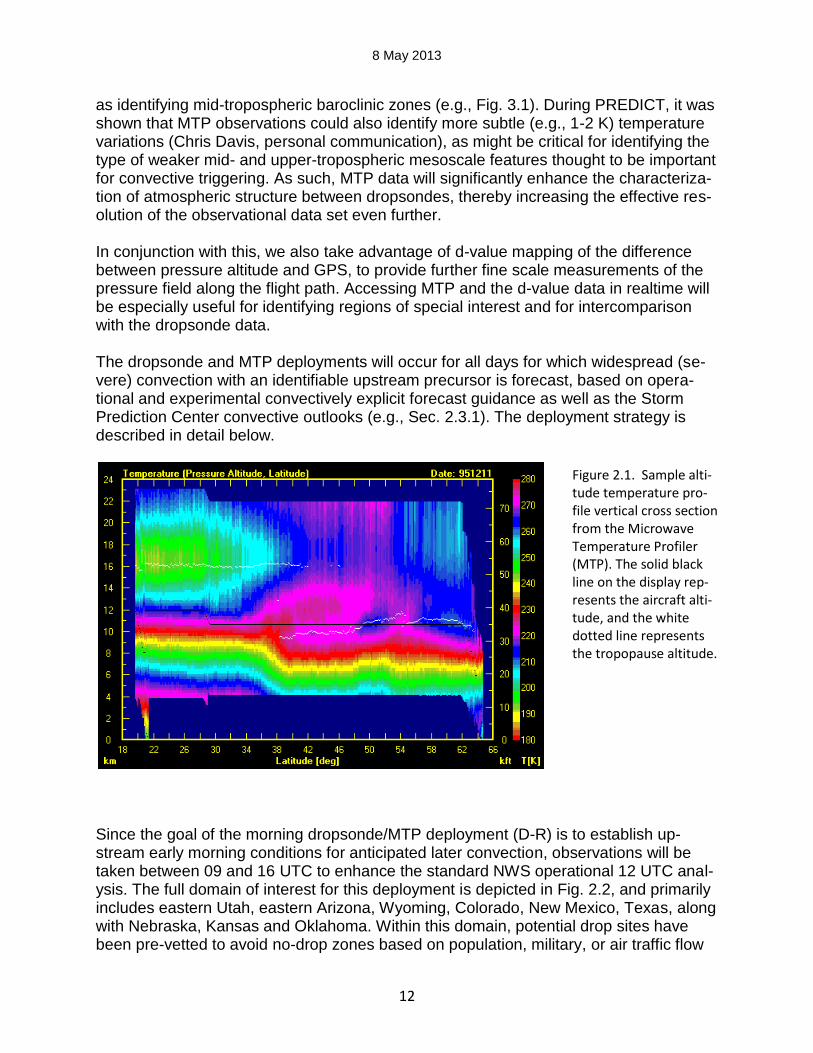
Since the goal of the morning dropsonde/MTP deployment (D-R) is to establish up-stream early morning conditions for anticipated later convection, observations will be taken between 09 and 16 UTC to enhance the standard NWS operational 12 UTC anal-ysis. The full domain of interest for this deployment is depicted in Fig. 2.2, and primarily includes eastern Utah, eastern Arizona, Wyoming, Colorado, New Mexico, Texas, along with Nebraska, Kansas and Oklahoma. Within this domain, potential drop sites have been pre-vetted to avoid no-drop zones based on population, military, or air traffic flow
Figure 2.1. Sample alti-tude temperature pro-file vertical cross section from the Microwave Temperature Profiler (MTP). The solid black line on the display rep-resents the aircraft alti-tude, and the white dotted line represents the tropopause altitude.
8 May 2013
13
constraints. Also, drop sites have been chosen so as to not overlap with existing NWS sites to maximize the value-added of the deployment strategy. The current anticipated set of “approved” dropsites is included on Fig. 2.2. A sub-domain of roughly 600 by 1000 km (Fig. 2.3) will be chosen for each typical one day Intensive Observing Period (IOP) depending on the meteorological scenario as well as the identification of any specific features of interest (e.g., Sec. 2.3.1). It is anticipated that 28-32 sondes will be dropped within the specified sub-domain per IOP, with the drop spacing ranging between 75 and 250 km, with the highest density of dropsonde observations being centered on a targeted subsynoptic feature of interest. A 75-km grid spacing for dropsondes will nominally be able to resolve features with a scale of 300 km or greater, which is much finer than is allowed by the existing observational NWS sounding network over the region of interest (e.g., Fig. 2.3). The addition of MTP data will help to further refine the thermodynamic structure of any features of importance along the aircraft path (e.g., Fig. 2.1).
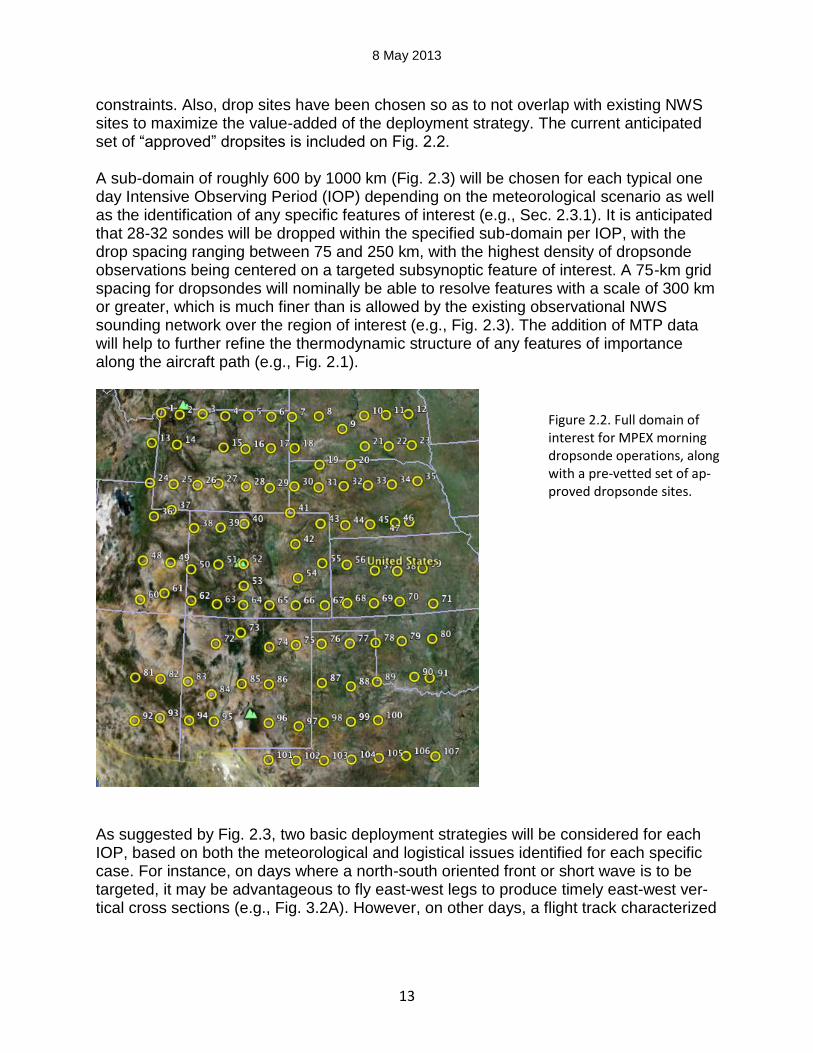
As suggested by Fig. 2.3, two basic deployment strategies will be considered for each IOP, based on both the meteorological and logistical issues identified for each specific case. For instance, on days where a north-south oriented front or short wave is to be targeted, it may be advantageous to fly east-west legs to produce timely east-west ver-tical cross sections (e.g., Fig. 3.2A). However, on other days, a flight track characterized
Figure 2.2. Full domain of interest for MPEX morning dropsonde operations, along with a pre-vetted set of ap-proved dropsonde sites.
8 May 2013
14
by
north-south legs beginning on the east side of the domain may be preferred, both to avoid busy airports later in the morning as well as to enlarge the effective sampling do-main westward (e.g., assuming west-to-east moving systems). These, and other poten-tial flight path options will be decided upon in consultation between the MPEX PIs and aircraft personnel. A flight altitude of ~12 km (40000 ft) is anticipated for all drops to allow for the sampling of deep-layer shear, stability, and moisture, as well as to characterize upper/mid tropo-spheric features that may be important for subsequent convective initiation. Given a 600 x 1000 km grid and an aircraft speed of 440 kt, the proposed distance covered would be about 5000 km, and would take approximately 6.5 h to complete (plus approximately 2 hours for takeoff, ferry, and landing). The requested drop increment generally ranges from 6 min for specific targeted features to 20 min for the coarser drop regions, as noted above.
2.2 Afternoon Upsonde Strategies
GPS upsondes (i.e., balloon-borne radiosondes) will be used to characterize the mesoscale environment over regions of anticipated convection initiation (CI) as well as the mesoscale environment that has been disturbed by the subsequent convective storms.
Figure 2.3. Example flight patterns and GPS dropsonde locations for typical morning dropsonde deployments, depicting A) an east-west deployment strategy and B) a north-south deployment strategy. Stars represent the location of current NWS rawinsonde sites, which generally launch twice a day, at 00:00 UTC and 12:00 UTC.
8 May 2013
15
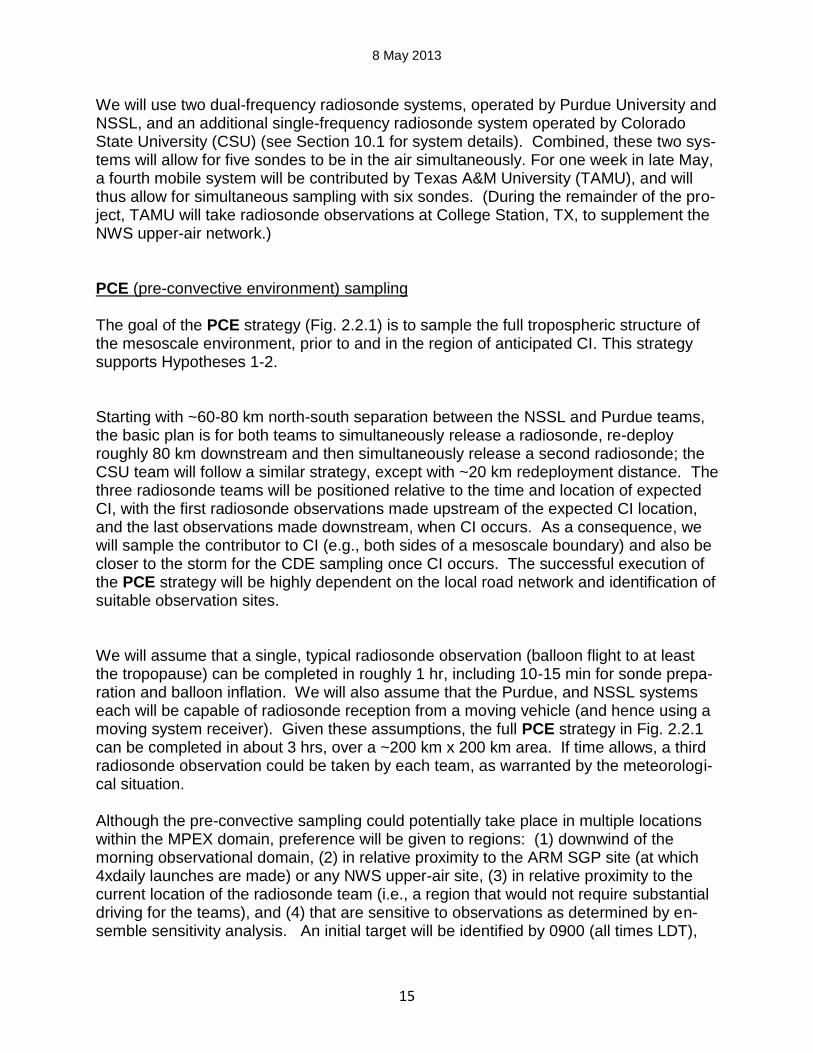
We will use two dual-frequency radiosonde systems, operated by Purdue University and NSSL, and an additional single-frequency radiosonde system operated by Colorado State University (CSU) (see Section 10.1 for system details). Combined, these two sys-tems will allow for five sondes to be in the air simultaneously. For one week in late May, a fourth mobile system will be contributed by Texas A&M University (TAMU), and will thus allow for simultaneous sampling with six sondes. (During the remainder of the pro-ject, TAMU will take radiosonde observations at College Station, TX, to supplement the NWS upper-air network.) PCE (pre-convective environment) sampling The goal of the PCE strategy (Fig. 2.2.1) is to sample the full tropospheric structure of the mesoscale environment, prior to and in the region of anticipated CI. This strategy supports Hypotheses 1-2. Starting with ~60-80 km north-south separation between the NSSL and Purdue teams, the basic plan is for both teams to simultaneously release a radiosonde, re-deploy roughly 80 km downstream and then simultaneously release a second radiosonde; the CSU team will follow a similar strategy, except with ~20 km redeployment distance. The three radiosonde teams will be positioned relative to the time and location of expected CI, with the first radiosonde observations made upstream of the expected CI location, and the last observations made downstream, when CI occurs. As a consequence, we will sample the contributor to CI (e.g., both sides of a mesoscale boundary) and also be closer to the storm for the CDE sampling once CI occurs. The successful execution of the PCE strategy will be highly dependent on the local road network and identification of suitable observation sites. We will assume that a single, typical radiosonde observation (balloon flight to at least the tropopause) can be completed in roughly 1 hr, including 10-15 min for sonde prepa-ration and balloon inflation. We will also assume that the Purdue, and NSSL systems each will be capable of radiosonde reception from a moving vehicle (and hence using a moving system receiver). Given these assumptions, the full PCE strategy in Fig. 2.2.1 can be completed in about 3 hrs, over a ~200 km x 200 km area. If time allows, a third radiosonde observation could be taken by each team, as warranted by the meteorologi-cal situation. Although the pre-convective sampling could potentially take place in multiple locations within the MPEX domain, preference will be given to regions: (1) downwind of the morning observational domain, (2) in relative proximity to the ARM SGP site (at which 4xdaily launches are made) or any NWS upper-air site, (3) in relative proximity to the current location of the radiosonde team (i.e., a region that would not require substantial driving for the teams), and (4) that are sensitive to observations as determined by en-semble sensitivity analysis. An initial target will be identified by 0900 (all times LDT),
8 May 2013
16
with data collection beginning between 1300 and 1400, but could be delayed to as late as 1500. If the teams cannot drive to the preferred region, based on (1) - (4), by early afternoon, the PCE sampling will be omitted in favor of allowing the teams to get into position for the CDE sampling.
Figure 2.2.1. Example upsonde locations (circles) for the PCE (pre-convective environment) sampling strategy.
CDE (convectively disturbed environment) sampling
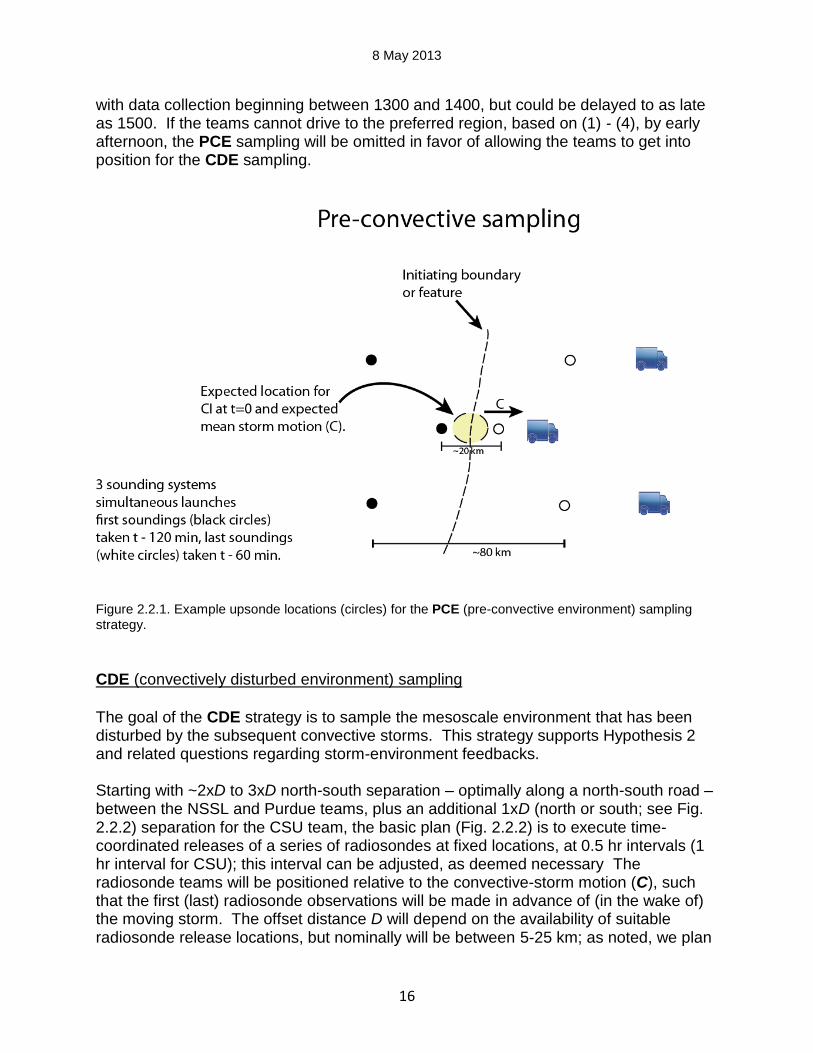
The goal of the CDE strategy is to sample the mesoscale environment that has been disturbed by the subsequent convective storms. This strategy supports Hypothesis 2 and related questions regarding storm-environment feedbacks. Starting with ~2xD to 3xD north-south separation – optimally along a north-south road –between the NSSL and Purdue teams, plus an additional 1xD (north or south; see Fig. 2.2.2) separation for the CSU team, the basic plan (Fig. 2.2.2) is to execute time-coordinated releases of a series of radiosondes at fixed locations, at 0.5 hr intervals (1 hr interval for CSU); this interval can be adjusted, as deemed necessary The radiosonde teams will be positioned relative to the convective-storm motion (C), such that the first (last) radiosonde observations will be made in advance of (in the wake of) the moving storm. The offset distance D will depend on the availability of suitable radiosonde release locations, but nominally will be between 5-25 km; as noted, we plan
8 May 2013
17
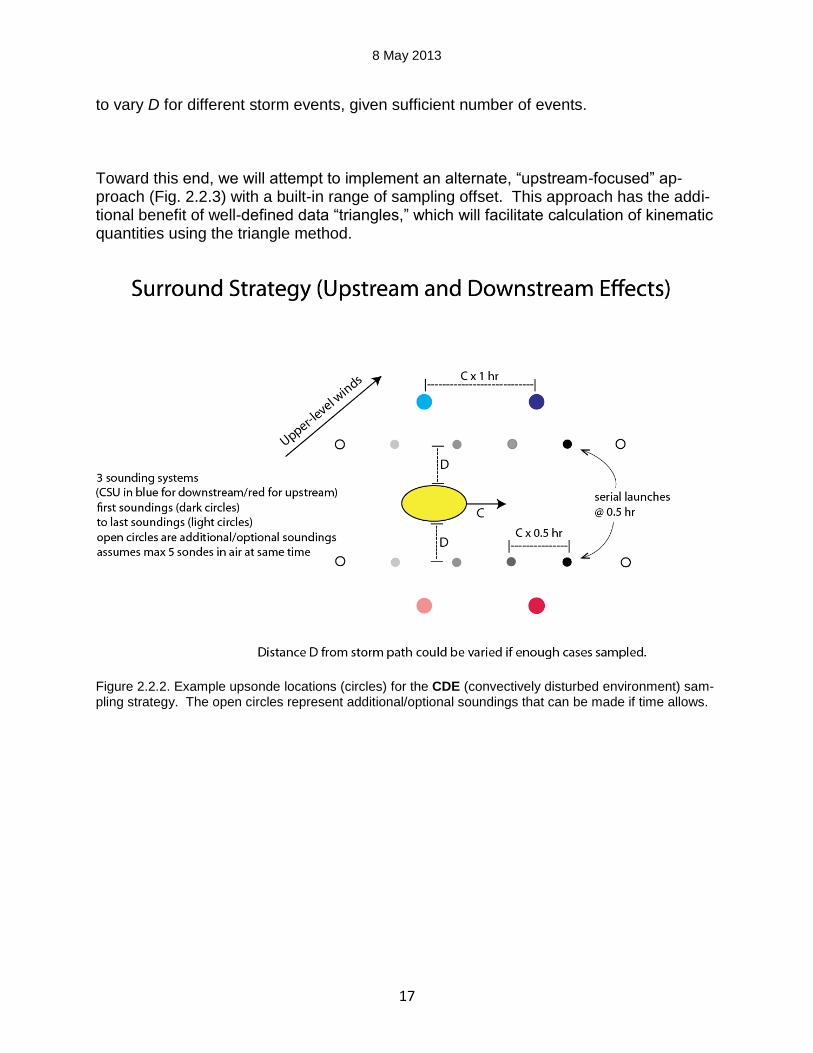
to vary D for different storm events, given sufficient number of events. Toward this end, we will attempt to implement an alternate, “upstream-focused” ap-proach (Fig. 2.2.3) with a built-in range of sampling offset. This approach has the addi-tional benefit of well-defined data “triangles,” which will facilitate calculation of kinematic quantities using the triangle method.
Figure 2.2.2. Example upsonde locations (circles) for the CDE (convectively disturbed environment) sam-pling strategy. The open circles represent additional/optional soundings that can be made if time allows.
8 May 2013
18
Figure 2.2.3. Alternative CDE (convectively disturbed environment) sampling strategy that focuses on the upstream effects. It should be possible to complete the CDE strategies within 2-3 hrs (unless additional radiosondes are released; see open circles in Figs. 2.2.2 and 2.2.3). The observation spacing and sampling domain will depend on C. Accordingly, one consideration in the decision on storm targets will be given to C (i.e., we would like to sample both relatively slow-moving and fast-moving storms). Other considerations for storm-target decisions include (1) convective mode (with a goal of sampling a range of intense, deep convec-tion), (2) convective-storm location relative to other storms (with the expectation that the southern-most storm would be the most isolated and suffer the least from upstream in-fluences), (3) relative proximity to the ARM SGP site (at which 4xdaily launches are made) or any NWS upper-air site, and (4) regional sensitivity to observations as deter-mined by ensemble sensitivity analysis.
2.3 Meteorological Case Selection Criteria (IOPs)
2.3.1 Morning dropsonde/MTP operations
MPEX dropsonde cases will be chosen based on the following general criteria:
1) Significant convection is being forecast within the MPEX region during the next af-ternoon or evening.

8 May 2013
19
“Significant convection” will be indicated by reasonably strong and/or widespread precipitation or explicit convection in the model forecasts, associated with project-ed CAPE magnitudes of 500 J/kg or greater. Additionally, a “slight risk” of severe weather or greater included in the SPC next-day guidance would likewise be con-sidered as a positive indicator.
2) Projected forcing for the convection is tied to a mid-to-upper-level “feature” propa-
gating in from the southwest-to-northwest corridor.
Candidate features should primarily include “upstream” short waves indicated by the operational and/or experimental forecast models, “upstream” cloud or moisture bands in satellite imagery, etc. However, if suitable upstream features cannot be identified, in situ surface or upper-level features may also be targeted. Subjective-based forecaster methods will be primarily used to identify the candidate-features or regions that will be targeted during the campaign. These forecaster identified features will then be evaluated against formal targeting techniques and subse-quent retrospective assimilation experiments can test the impact of the enhanced data on subsequent forecasts.
3) Significant uncertainty is noted in the model or human forecast guidance.
In the present context, forecast uncertainty can reflect uncertainty in the timing, lo-cation or intensity of potential convection. “Uncertainty” will be measured via the apparent level of disagreement between the various operational and experimental models and/or human forecasters as well as from the more formal sensitivity anal-yses produced from the WRF-DART high-resolution ensemble.
4) Coordination is possible with the downstream afternoon upsonde operations.
Once a case is considered a “go”, the following targeting strategies will be applied: Priority 1: Obtain good “regional” coverage of the area of interest. Priority 2: Obtain enhanced coverage for specific features, based on:
1) features evident from satellite 2) model-suggested sensitive regions 3) general intuition
2.3.2 Afternoon mobile upsonde operations
As discussed previously, upsonde operations will be based on:
1) relevance to (i.e., downwind of) the morning observational domain;
8 May 2013
20
2) anticipated convective mode (with a goal of sampling a range of intense, deep convection);
3) convective-storm location relative to other storms (with the expectation that the southern-most storm would be the most isolated and suffer the least from up-stream influences);
4) relative proximity of the convective storms to the ARM SGP site (at which 4xdaily launches are made) or any NWS upper-air site;
5) relative proximity of the convective storms to other special observing systems (wind profilers, surface mesonetworks, Doppler radars); and
6) regional sensitivity to observations as determined by ensemble sensitivity analy-sis.
Ultimately, the upsonde-operations decisions must be considered jointly with the current level of expendables (helium, sondes) and the current location of the teams. Regarding the latter, the geographic location of desired operations must be within reasonable driv-ing distance (less than 250 mi) for the teams.
3. Forecasting, Nowcasting, and Modeling
3.1 Forecasting and Nowcasting
Weather forecast discussions will occur every day during the MPEX field campaign.
The daily schedules are described in Section 5. There will be a weather discussion dur-ing the MPEX Daily Planning Meeting each afternoon and a pilot weather briefing 2 hours before take-off. During upsonde deployment days, nowcasting will occur from early afternoon to the end of upsonde operations, and additional support regarding morning positioning will be available, if requested.
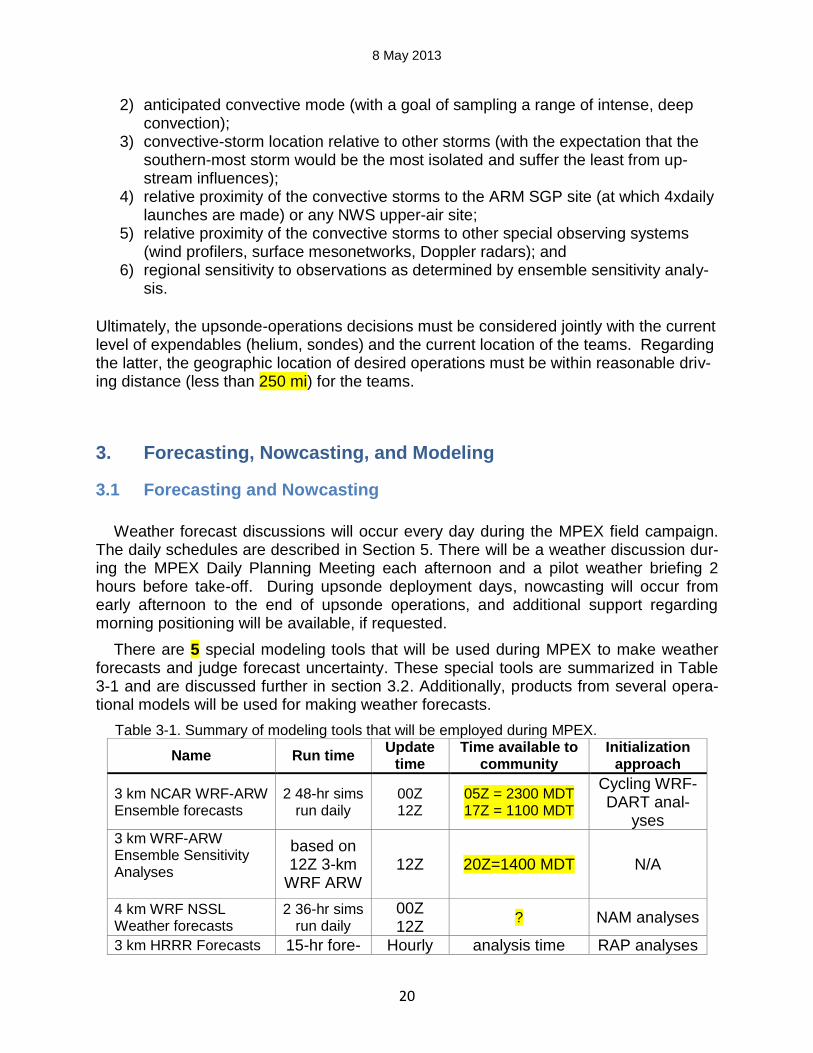
There are 5 special modeling tools that will be used during MPEX to make weather forecasts and judge forecast uncertainty. These special tools are summarized in Table 3-1 and are discussed further in section 3.2. Additionally, products from several opera-tional models will be used for making weather forecasts.
Table 3-1. Summary of modeling tools that will be employed during MPEX.
Name Run time Update
time Time available to
community Initialization
approach
3 km NCAR WRF-ARW Ensemble forecasts
2 48-hr sims run daily
00Z 12Z
05Z = 2300 MDT 17Z = 1100 MDT
Cycling WRF-DART anal-
yses 3 km WRF-ARW Ensemble Sensitivity Analyses
based on 12Z 3-km
WRF ARW 12Z 20Z=1400 MDT N/A
4 km WRF NSSL Weather forecasts
2 36-hr sims run daily
00Z 12Z
? NAM analyses
3 km HRRR Forecasts 15-hr fore- Hourly analysis time RAP analyses
8 May 2013
21
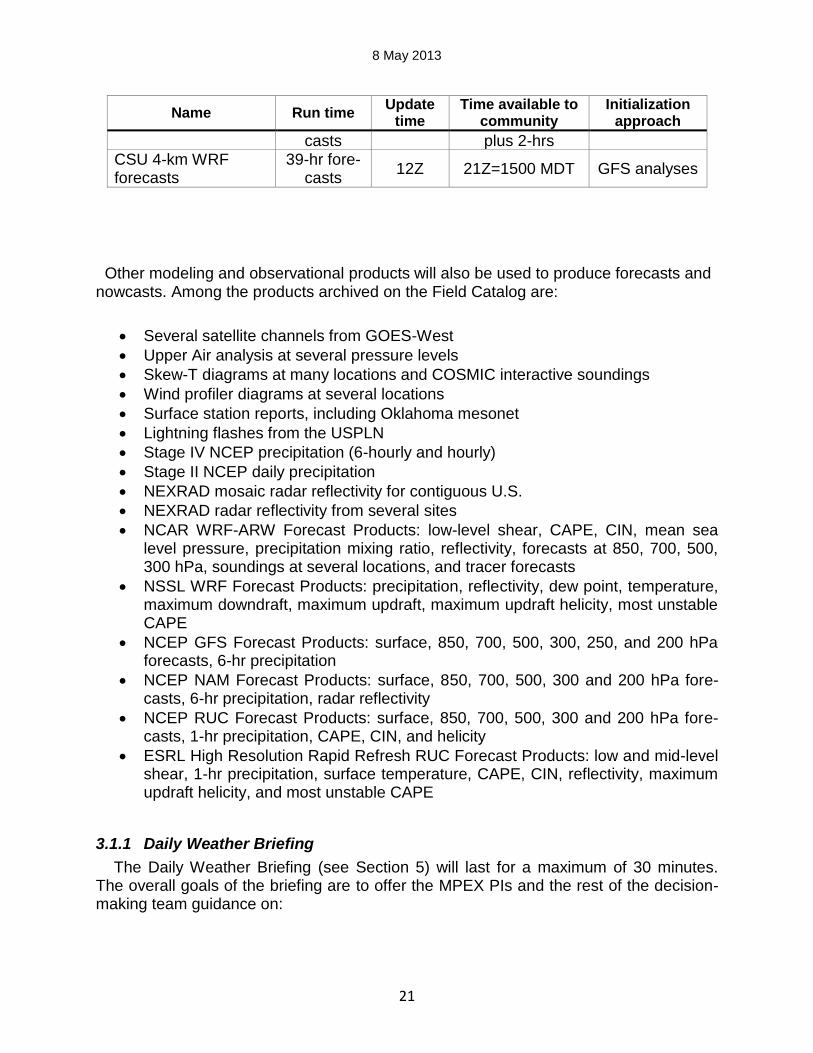
Name Run time Update
time Time available to
community Initialization
approach
casts plus 2-hrs CSU 4-km WRF forecasts
39-hr fore-casts
12Z 21Z=1500 MDT GFS analyses
Other modeling and observational products will also be used to produce forecasts and nowcasts. Among the products archived on the Field Catalog are:
Several satellite channels from GOES-West
Upper Air analysis at several pressure levels
Skew-T diagrams at many locations and COSMIC interactive soundings
Wind profiler diagrams at several locations
Surface station reports, including Oklahoma mesonet
Lightning flashes from the USPLN
Stage IV NCEP precipitation (6-hourly and hourly)
Stage II NCEP daily precipitation
NEXRAD mosaic radar reflectivity for contiguous U.S.
NEXRAD radar reflectivity from several sites
NCAR WRF-ARW Forecast Products: low-level shear, CAPE, CIN, mean sea level pressure, precipitation mixing ratio, reflectivity, forecasts at 850, 700, 500, 300 hPa, soundings at several locations, and tracer forecasts
NSSL WRF Forecast Products: precipitation, reflectivity, dew point, temperature, maximum downdraft, maximum updraft, maximum updraft helicity, most unstable CAPE
NCEP GFS Forecast Products: surface, 850, 700, 500, 300, 250, and 200 hPa forecasts, 6-hr precipitation
NCEP NAM Forecast Products: surface, 850, 700, 500, 300 and 200 hPa fore-casts, 6-hr precipitation, radar reflectivity
NCEP RUC Forecast Products: surface, 850, 700, 500, 300 and 200 hPa fore-casts, 1-hr precipitation, CAPE, CIN, and helicity
ESRL High Resolution Rapid Refresh RUC Forecast Products: low and mid-level shear, 1-hr precipitation, surface temperature, CAPE, CIN, reflectivity, maximum updraft helicity, and most unstable CAPE
3.1.1 Daily Weather Briefing
The Daily Weather Briefing (see Section 5) will last for a maximum of 30 minutes. The overall goals of the briefing are to offer the MPEX PIs and the rest of the decision-making team guidance on:
8 May 2013
22
The expected character of convection within the MPEX domain for the next day and several days beyond
The location, timing, and character of mid-upper level “features” that may be important for next-day convective initiation and evolution
Anticipated sources of forecast uncertainty
Four basic forecast-based decisions/issues will be considered as a result of the weather briefing:
1. Should MPEX aircraft conduct dropsonde operations tonight? 2. When and where should future dropsonde studies be conducted? 3. Should MPEX ground operations conduct operations tomorrow? 4. When and where should future ground operations be conducted?
Specific forecasting questions to consider:
1. Will there be convection within the MPEX domain tomorrow? 2. When and where will the convection initiate? 3. What will be the anticipated storm motion? 4. What will be the primary convective mode at onset (e.g., isolated, scattered,
supercellular, squall line)? 5. How will the convective mode evolve (e.g., isolated cells growing upscale into
squall line…. etc.)? Which direction will it move? 6. What adverse weather could be expected at the airfield? 7. What “features” are responsible for initiating convection? 8. How divergent is the model guidance? 9. Where are the greatest regions of model uncertainty?
3.1.2 Forecast Team Staffing Schedule and Responsibilities
All forecasting and nowcasting efforts will be coordinated and overseen by the MPEX Lead Forecaster at the Operations Center. The Lead Forecaster’s duty day will com-mence in the morning and continue through the early evening. The Lead Forecaster will give the Daily Weather Briefing, produce a “day 2” graphical forecast product (Fig. 3.1, below), and write a discussion for the Field Catalog. The Lead Forecaster will also pro-vide an afternoon update for the upsonde teams regarding day 2 positioning and Nowcasting support (if needed) during the late morning and early afternoon. The Lead Forecaster, in collaboration with the Operations Director, will also identify possible flight days and notify the NCAR/MMM modeling team when a 30-member ensemble forecast is desired.
The Nowcaster’s duty day will commence in the afternoon before the Daily Weather Briefing. Thereafter, on days with ground operations, Nowcasters will support the upsonde teams during their deployment. The Nowcaster is responsible for monitoring weather conditions in the vicinity of the ground crews, fostering good communication, coordination and safety, and offering direct input/feedback to the upsonde teams’ deci-
8 May 2013
23
sion making processes. It is anticipated that Nowcasting support will be most critical during upscale convective growth that may occur toward the end of daily ground opera-tions.
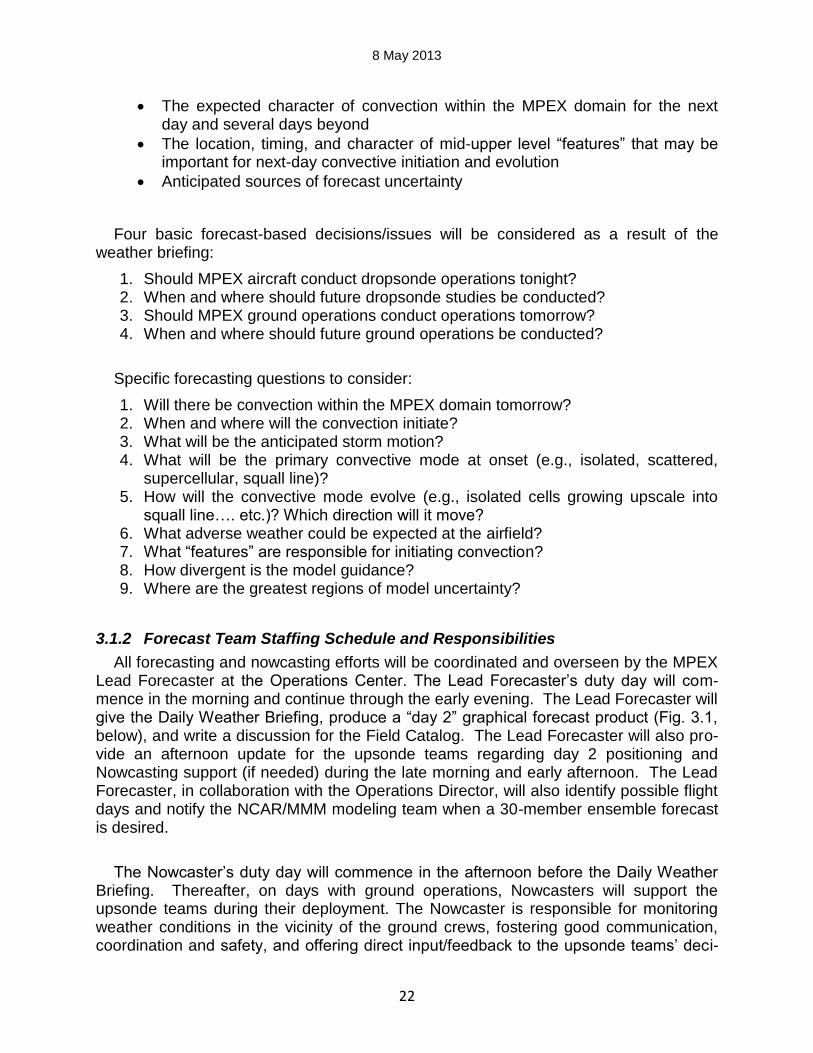
On nights with aircraft missions, Nowcasters will evaluate current weather conditions and consult newly-available 0000 UTC model guidance. The Nowcaster will produce an updated day-2 graphical forecast product (e.g., Fig. 3.1) and provide a discussion on
Fig. 3.1. Example of a “day 2” forecast product
by the Forecasters and Nowcasters. Valid from 18Z – 06Z. Meanings of
categorical risks to be determined.
the Field Catalog. Additionally, the Nowcaster will brief the Operations Director before flight takeoff and may suggest tweaks to the flight plan. The Nowcaster will also brief the pilots prior to takeoff.
3.1.3 Flight Operations Nowcasting
The Nowcasters will provide a weather briefing for the pilots and Operations Director two hours before takeoff. Nowcasting will not occur during the flights.
! " #$
%&' #$
8 May 2013
24
3.1.4 Terminal Forecasts and Severe Weather Updates
Forecasts and nowcasts will also be produced for the region around JEFFCO to help with decision-making in deploying the aircraft and returning the aircraft to the Opera-tions Base. These forecasts will be provided by the Nowcaster.
3.2 Modeling
3.2.1 Operational Model Output and Products
Standard operational models (GFS, NAM, RUC) provide various products that will be archived on the MPEX Field Catalog (see list in Section 9.1).
3.2.2 Special High Resolution Regional & Mesoscale Models
Real-time 3 km WRF-ARW Ensemble Forecasts
In addition to operational products, we will also have access to NCAR produced exper-imental ensemble WRF (Weather Research Forecast model) forecasts, initialized from an NCAR generated 50-member ensemble analysis system based on WRF-DART (DART – Data Assimilation Research Testbed). Each ensemble member forecast will include a CONUS mesoscale (15-km) and 2/3 CONUS nest (3-km), with forecast prod-ucts based on the explicit nest. 10 member ensemble forecasts extending through 48 h will be available twice daily (initialized from 00 and 12 UTC). On potential or designated operations days, the ensemble size will be increased to 30 members for the 12 UTC initialized forecasts to facilitate ensemble sensitivity analysis, as described below. Prob-abilistic forecast guidance from this system will be made available on the 2013 realtime forecast web site (http://www.image.ucar.edu/wrfdart/rt2013/ensf/index.html) as well as on the MPEX field catalog.
Real-time Ensemble Sensitivity Analyses
Ensemble sensitivity analysis (ESA) products will be available on days preceding pro-spective operations days as well as operations days. The former products will provide ensemble sensitivity of ~36 h forecast outcomes to the 24 h forecast state from 12 UTC ensemble forecasts. For operational days, ESA guidance will also be provided from 12 UTC ensemble forecasts for, e.g. 12 h forecast outcomes to the 6 h forecast state, to assist upsonde operations in sampling forecast sensitive regions. Products for multiple sensitive regions will be generated based on automated and manually selected regions of interest. Products will fall into three categories:
8 May 2013
25
o Sensitivity of precipitation forecasts to earlier forecast states, from 12 h prior to
time of forecast event every 3 h o Composites of the six highest and lowest precipitating forecast members differ-
ence from the mean state and difference between these composites, from 12 h prior to time of forecast event every 3 h
o Observation impact at dropsonde locations, 3 hrly from 9 UTC to 21 UTC Guidance products will be available on the field catalog and at the following web site: http://www.atmos.albany.edu/facstaff/torn/MPEX_sens/ Real-time Rapid Refresh and 3 km HRRR Forecasts In addition to the operational HRRR products, a parallel version of the Rapid Refresh (13-km) will assimilate manually QC’d research observations and provide initial condi-tions to an additional set of HRRR (3-km) hourly forecasts out to 15 h. The products from both analysis and forecast systems will be included in the MPEX field catalog on operations days. Real-time NSSL Forecasts
Explicit (4-km) deterministic 36 h forecasts will be available twice daily using the NSSL legacy WRF forecast system initialized from the operational NAM analysis. Further, daily from 00 UTC a similarly configured forecast will be initialized from the NSSL WRF-DART mesoscale (18-km) ensemble. The latter will use an hourly partial cycling strategy from 15-00 UTC daily, initialized from the 12 UTC NAM. Real-time CSU Forecasts and Synthetic Satellite Imagery Daily explicit (4-km) WRF model forecasts based on GFS initial conditions will be launched from 12 UTC. In addition to standard forecast products, synthetic satellite imagery will also be made available from the forecast runs. Products will be added to the field catalog and available on the web at: http://schumacher.atmos.colostate.edu/weather/csuwrf_4km.php Additional Analyses and Forecasts In addition to the above listed products, during operations we will also monitor the following experimental products:
NSSL WRF-DART 36-member mesoscale (18-km) ensemble system, hourly analysis from 15-00 UTC daily, full ensemble forecasts from 15, 17, and 19 UTC analysis through 03 UTC
Center for Analysis and Prediction of Storms (CAPS) convection permitting (4-km) en-semble system with 25-member 48 h forecasts from 00 UTC and 8-member 18 h fore-casts from 12 UTC, CAPS forecasts available on weekdays only
8 May 2013
26
4. Project Organization (Weisman)
The PIs have been and will continue to be advised by the MPEX Science Team. The
PIs make the decisions and take the actions necessary to carry out those decisions.
The day-to-day roles of various members of the MPEX Operations Team are summa-rized below.
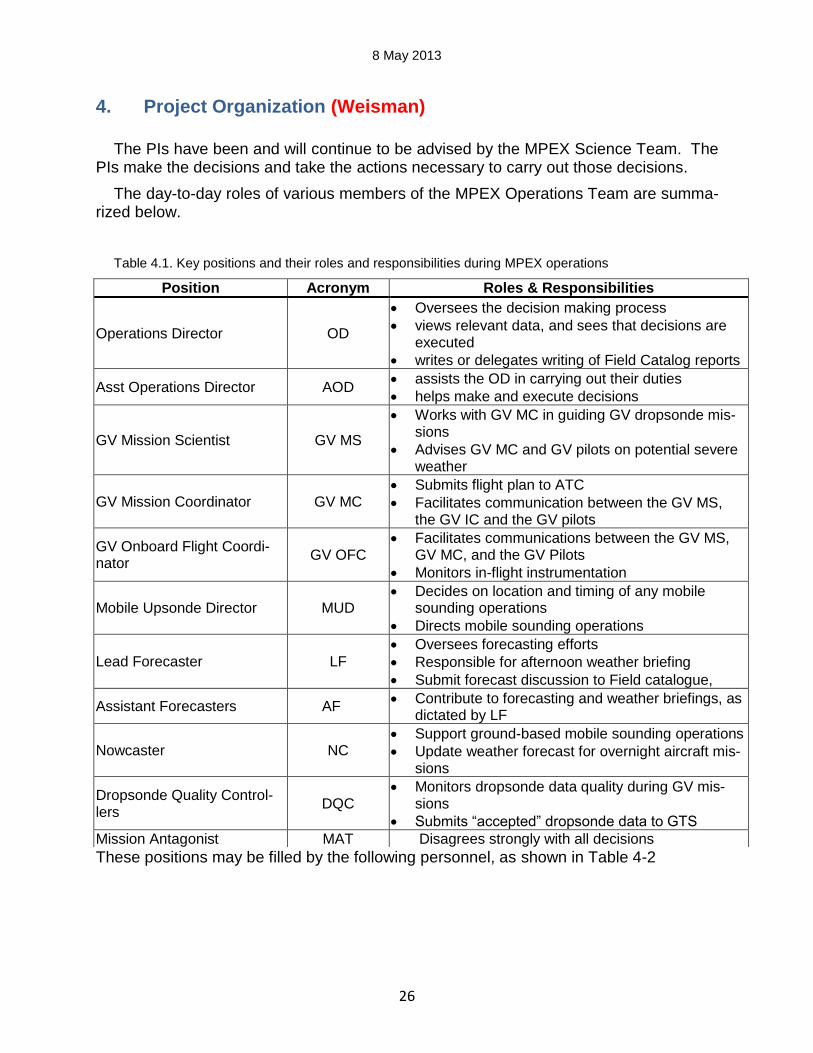
Table 4.1. Key positions and their roles and responsibilities during MPEX operations
These positions may be filled by the following personnel, as shown in Table 4-2
Position Acronym Roles & Responsibilities
Operations Director OD
Oversees the decision making process
views relevant data, and sees that decisions are executed
writes or delegates writing of Field Catalog reports
Asst Operations Director AOD assists the OD in carrying out their duties
helps make and execute decisions
GV Mission Scientist GV MS
Works with GV MC in guiding GV dropsonde mis-sions
Advises GV MC and GV pilots on potential severe weather
GV Mission Coordinator GV MC Submits flight plan to ATC
Facilitates communication between the GV MS, the GV IC and the GV pilots
GV Onboard Flight Coordi-nator
GV OFC Facilitates communications between the GV MS,
GV MC, and the GV Pilots
Monitors in-flight instrumentation
Mobile Upsonde Director MUD Decides on location and timing of any mobile
sounding operations
Directs mobile sounding operations
Lead Forecaster LF
Oversees forecasting efforts
Responsible for afternoon weather briefing
Submit forecast discussion to Field catalogue,
Assistant Forecasters AF Contribute to forecasting and weather briefings, as
dictated by LF
Nowcaster NC Support ground-based mobile sounding operations
Update weather forecast for overnight aircraft mis-sions
Dropsonde Quality Control-lers
DQC Monitors dropsonde data quality during GV mis-
sions
Submits “accepted” dropsonde data to GTS
Mission Antagonist MAT Disagrees strongly with all decisions
8 May 2013
27
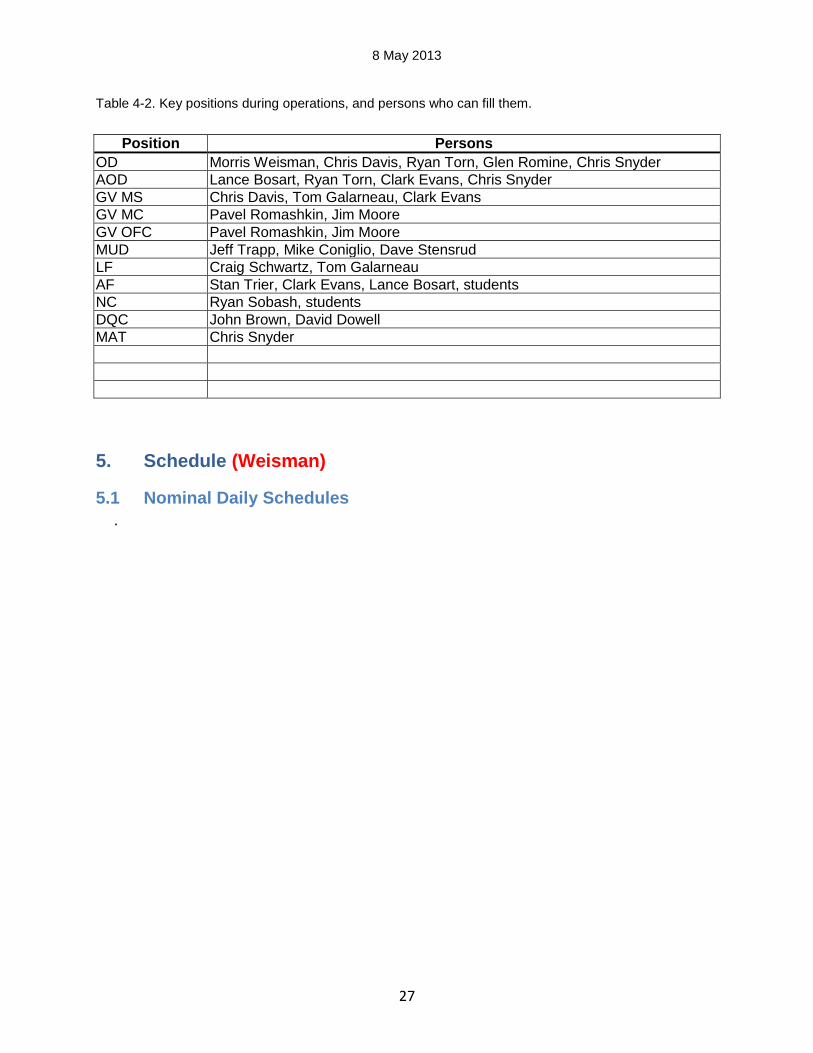
Table 4-2. Key positions during operations, and persons who can fill them.
Position Persons
OD Morris Weisman, Chris Davis, Ryan Torn, Glen Romine, Chris Snyder
AOD Lance Bosart, Ryan Torn, Clark Evans, Chris Snyder
GV MS Chris Davis, Tom Galarneau, Clark Evans
GV MC Pavel Romashkin, Jim Moore
GV OFC Pavel Romashkin, Jim Moore
MUD Jeff Trapp, Mike Coniglio, Dave Stensrud
LF Craig Schwartz, Tom Galarneau
AF Stan Trier, Clark Evans, Lance Bosart, students
NC Ryan Sobash, students
DQC John Brown, David Dowell
MAT Chris Snyder
5. Schedule (Weisman)
5.1 Nominal Daily Schedules
.
8 May 2013
28
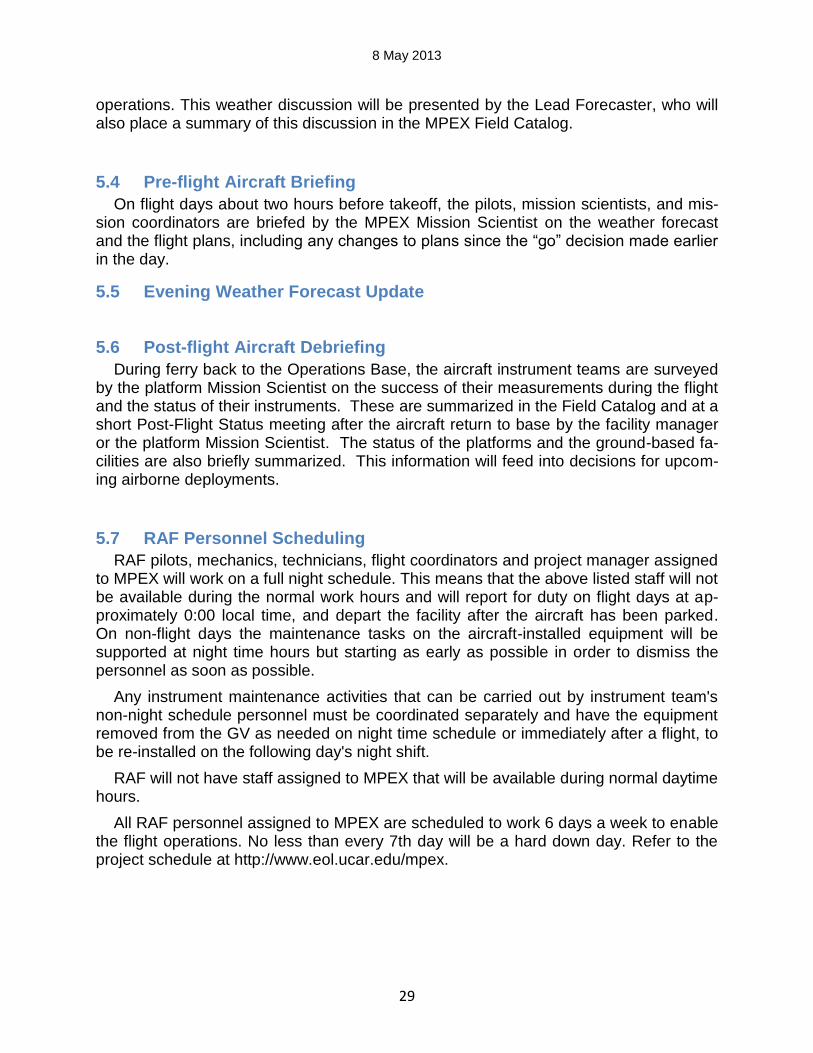
5.2 Daily Planning Meeting
The Daily Planning meeting serves several purposes. Primarily, it provides a forum to summarize the available information relevant to making decisions about the day’s and future day’s flight operations. The details of the decision making process are dis-cussed below. The agenda for the Daily Planning meeting is shown in Table 2-2.
Table 2-2. Agenda for Daily Planning meeting.
Start Length Item
0 0:20 Previous Mission Review/ Facilities status updates
0:20 0:30 Weather Briefing (Lead Forecaster)
0:50 0:20 Discussion of deployment options
1:10 Final decision for day; tentative decisions for next few days; schedules
5.3 Daily Weather Briefing
At the beginning of the Daily Planning meeting, the MPEX PIs and other members of the decision-making team are briefed on the weather relevant to ground and aircraft
8 May 2013
29
operations. This weather discussion will be presented by the Lead Forecaster, who will also place a summary of this discussion in the MPEX Field Catalog.
5.4 Pre-flight Aircraft Briefing
On flight days about two hours before takeoff, the pilots, mission scientists, and mis-sion coordinators are briefed by the MPEX Mission Scientist on the weather forecast and the flight plans, including any changes to plans since the “go” decision made earlier in the day.
5.5 Evening Weather Forecast Update
5.6 Post-flight Aircraft Debriefing
During ferry back to the Operations Base, the aircraft instrument teams are surveyed by the platform Mission Scientist on the success of their measurements during the flight and the status of their instruments. These are summarized in the Field Catalog and at a short Post-Flight Status meeting after the aircraft return to base by the facility manager or the platform Mission Scientist. The status of the platforms and the ground-based fa-cilities are also briefly summarized. This information will feed into decisions for upcom-ing airborne deployments.
5.7 RAF Personnel Scheduling
RAF pilots, mechanics, technicians, flight coordinators and project manager assigned to MPEX will work on a full night schedule. This means that the above listed staff will not be available during the normal work hours and will report for duty on flight days at ap-proximately 0:00 local time, and depart the facility after the aircraft has been parked. On non-flight days the maintenance tasks on the aircraft-installed equipment will be supported at night time hours but starting as early as possible in order to dismiss the personnel as soon as possible.
Any instrument maintenance activities that can be carried out by instrument team's non-night schedule personnel must be coordinated separately and have the equipment removed from the GV as needed on night time schedule or immediately after a flight, to be re-installed on the following day's night shift.
RAF will not have staff assigned to MPEX that will be available during normal daytime hours.
All RAF personnel assigned to MPEX are scheduled to work 6 days a week to enable the flight operations. No less than every 7th day will be a hard down day. Refer to the project schedule at http://www.eol.ucar.edu/mpex.
8 May 2013
30
6. Decision Making
In the field, it must be decided on a daily basis whether the projected convective out-look for the next day(s) warrants dropsonde or upsonde deployments. These decisions are based on evaluation of:
weather forecasts readiness of the aircraft in consultation with the facility managers readiness of aircraft instrumentation readiness of ground-based upsonde crews aircraft flight hours and study days remaining.
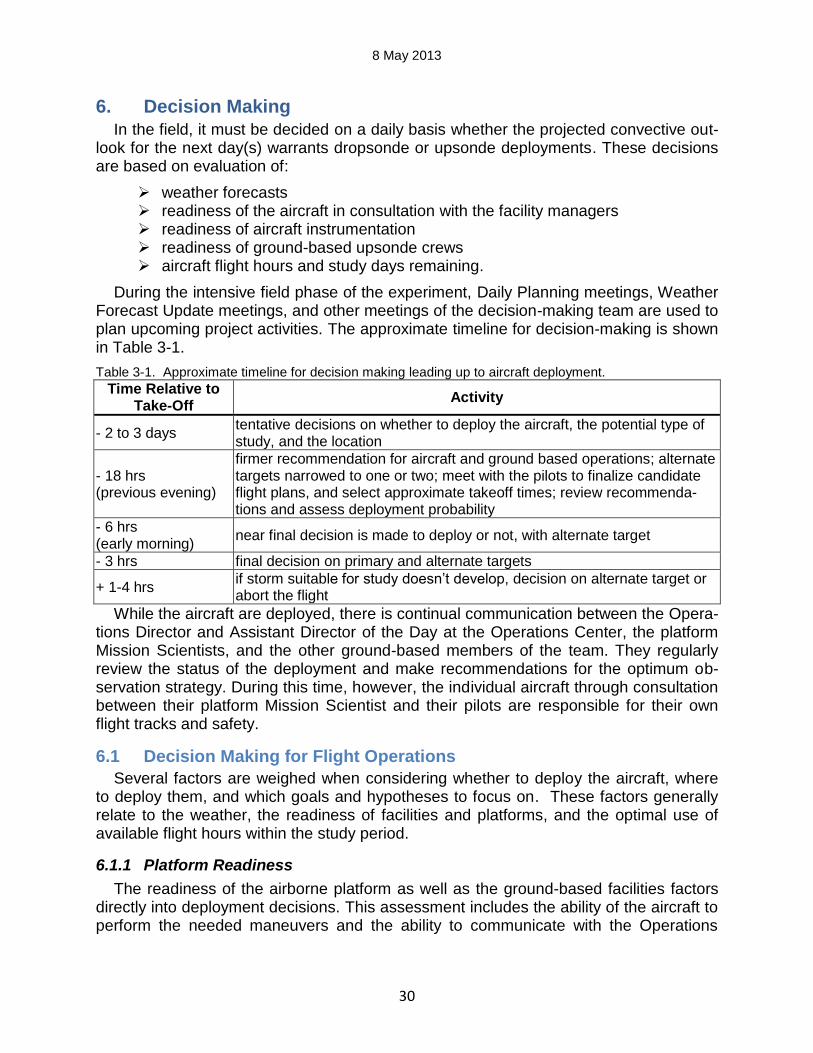
During the intensive field phase of the experiment, Daily Planning meetings, Weather Forecast Update meetings, and other meetings of the decision-making team are used to plan upcoming project activities. The approximate timeline for decision-making is shown in Table 3-1.
Table 3-1. Approximate timeline for decision making leading up to aircraft deployment.
Time Relative to Take-Off
Activity
- 2 to 3 days tentative decisions on whether to deploy the aircraft, the potential type of study, and the location
- 18 hrs (previous evening)
firmer recommendation for aircraft and ground based operations; alternate targets narrowed to one or two; meet with the pilots to finalize candidate flight plans, and select approximate takeoff times; review recommenda-tions and assess deployment probability
- 6 hrs (early morning)
near final decision is made to deploy or not, with alternate target
- 3 hrs final decision on primary and alternate targets
+ 1-4 hrs if storm suitable for study doesn’t develop, decision on alternate target or abort the flight
While the aircraft are deployed, there is continual communication between the Opera-tions Director and Assistant Director of the Day at the Operations Center, the platform Mission Scientists, and the other ground-based members of the team. They regularly review the status of the deployment and make recommendations for the optimum ob-servation strategy. During this time, however, the individual aircraft through consultation between their platform Mission Scientist and their pilots are responsible for their own flight tracks and safety.
6.1 Decision Making for Flight Operations
Several factors are weighed when considering whether to deploy the aircraft, where to deploy them, and which goals and hypotheses to focus on. These factors generally relate to the weather, the readiness of facilities and platforms, and the optimal use of available flight hours within the study period.
6.1.1 Platform Readiness
The readiness of the airborne platform as well as the ground-based facilities factors directly into deployment decisions. This assessment includes the ability of the aircraft to perform the needed maneuvers and the ability to communicate with the Operations
8 May 2013
31
Base. The assessment of platform readiness will be made by the respective Facility Managers in consultation with the pilots, mechanics and other team members.
6.1.2 Instrument Readiness
It is unlikely that all of the instruments on the airborne platforms will work 100% of the time. Some of them are critical to addressing MPEX goals and hypotheses while others provide supporting or confirming information. The readiness of each instrument will be provided by the corresponding instrument PI or team member to the Mission Scientist or respective platform Facility Manager.
The critical no-flight instrument for most MPEX flights is the AVAPS. In case of AVAPS failure the repair process and flight schedule will be discussed immediately be-tween the AVAPS team, RAF PM and the Mission Scientist.
MTP is generally not mission critical and any failure of it will be discussed in the con-text of the favorable weather conditions, with repair time scheduled as needed and fit between the flights. MTP may become mission critical for daytime flights, if any; such change will be discussed separately between the science team, RAF PM and MTP Sci-entist.
The ops web site maintained by the RAF (http://www.eol.ucar.edu/mpex) will also in-clude the project schedule; GV floor plan; flight hours balance (current within 1-2 days).
6.2 Decision Making during Flight Operations
In addition to decisions made on when and where to deploy aircraft, continual deci-
sions must be made during flight operations. These decisions are based on factors that include many of the issues discussed in Section 4.1. In order to make such decisions with the best information, it is critical for the most needed data to be transferred to the Operations Base as quickly as possible. These data include radar, lightning, and profile information from the ground-based facilities, measurements (which might be raw volt-ages proportional to the target species) from the aircraft platforms, and a variety of op-erational observation and modeling products. The overall capabilities of these facilities are discussed in Sections 6 (aircraft) and 7 (ground-based).
These data will be collected into the MPEX Field Catalog and a subset will be availa-ble for viewing on the Mission Coordinator display. These data will be used for deci-sion-making and future planning only. They are not to be viewed as data submitted by the instrument teams. The data will be retained until Field data (for research facilities) is available (see Section 10) and then will be purged.
The aircraft products to be sent to the Field Catalog during flight operations are shown in Figure 3-7. These lists may evolve, but the intent is to have approximately equal information from each of the airborne platforms.
Decision making process for the dropsonde release is an integral part of the MPEX flight operations. The safety of other aircraft and objects and people on the ground are
8 May 2013
32
of paramount importance for the project, and several steps are being taken to ensure that safety.
The main part of the dropsonde release coordination will be carried out by the Ground Coordinator and the Onboard Flight Coordinator. The ground coordinator will have access to the real-time information about the position of all airplanes in the vicinity of the region of operations, and will monitor their altitude, airspeed and the direction of travel. Equipped with the knowledge of the typical dropsonde fall speed and of the cur-rent prevailing wind direction, the Ground Coordinator will inform the Onboard Coordina-tor if it is safe for the GV to release a sonde before the GV reaches a release point. In case of a traffic conflict, the Ground Coordinator will instruct the Flight Coordinator to not release the sonde. At this time the Flight Coordinator will discuss with the pilots and Mission Scientist whether or not the GV should reverse course and return to the missed drop point several minutes later once the airspace conflict has cleared.
Additionally, the Ground Coordinator will post periodic airspace awareness screen shots that will be available to the Flight Coordinator and the ops center staff, most likely through the field catalog.
Further situational awareness and check of the release clearance will be carried out by the pilots using the cockpit TCAS display and any relevant ATC instructions. NOTE: the ATC will not be notified of individual releases. The de-conflicting with other aircraft is the responsibility of the Ground Coordinator, Onboard Coordinator and the GV flight crew.
6.3 Contingency Plans
Storm behavior predictions are subject to location and timing uncertainties. Also, the airborne platforms could develop problems and severe weather could move into the JEFFCO region. These issues could require adjusting the flight plans, reducing flight duration, and/or making use of alternate airports. Contingency plans have been devel-oped for such situations to aid in decision-making.
6.3.1 Aircraft Problems
Aircraft maintenance issues are usually those that will cause a no-flight condition. RAF has staff on site prepared to address such occurrences and contracts in place to bring in repair personnel and parts as necessary to provide expedient repairs and return the GV to service as soon as possible.
The GV is in good working order has been verified operational for MPEX
6.3.2 Severe Weather at Operations Base
In the unlikely event of the weather severe enough to prevent safe landing of the GV at Jeffco several contingency plans exist:
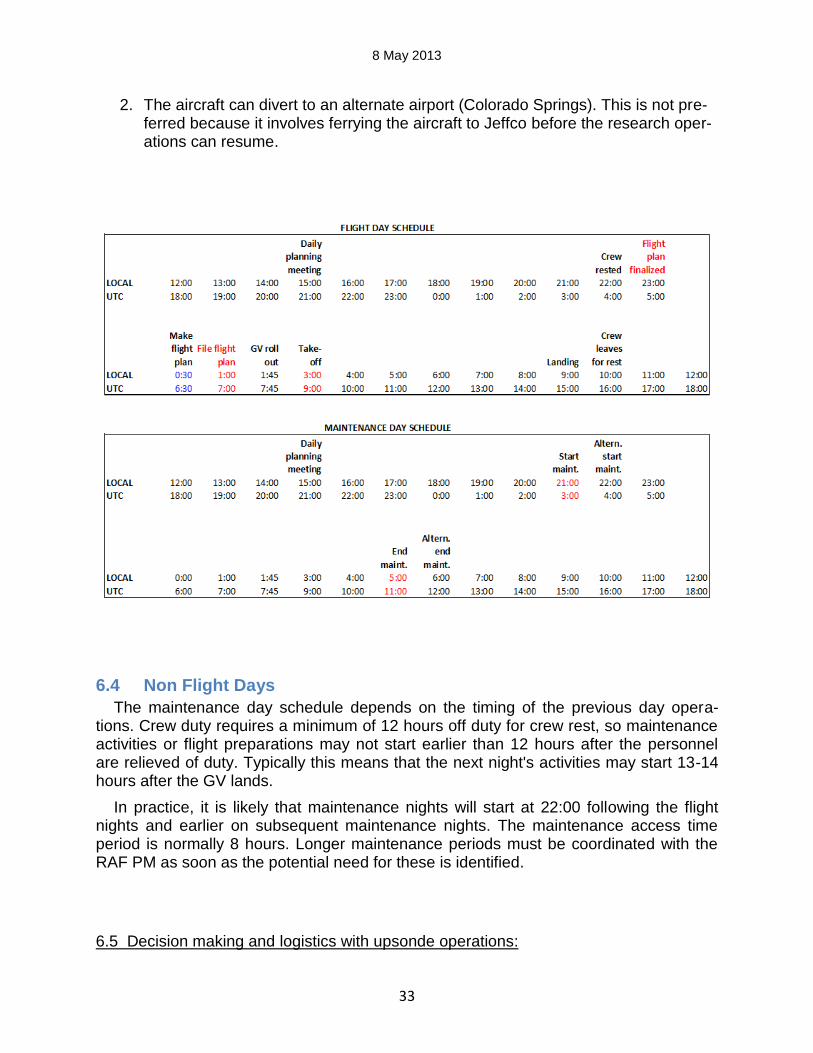
1. The aircraft can enter the holding pattern to wait for the weather to move out
8 May 2013
33
2. The aircraft can divert to an alternate airport (Colorado Springs). This is not pre-ferred because it involves ferrying the aircraft to Jeffco before the research oper-ations can resume.
6.4 Non Flight Days
The maintenance day schedule depends on the timing of the previous day opera-tions. Crew duty requires a minimum of 12 hours off duty for crew rest, so maintenance activities or flight preparations may not start earlier than 12 hours after the personnel are relieved of duty. Typically this means that the next night's activities may start 13-14 hours after the GV lands.
In practice, it is likely that maintenance nights will start at 22:00 following the flight nights and earlier on subsequent maintenance nights. The maintenance access time period is normally 8 hours. Longer maintenance periods must be coordinated with the RAF PM as soon as the potential need for these is identified.
6.5 Decision making and logistics with upsonde operations:
8 May 2013
34
Each team will designate a “spotter” to look for aircraft (general aviation as well as commercial) before balloon release
Balloon releases near airports should be avoided
If the release site is known a priori, the team leader should provide a courtesy phone call to the local airport (air traffic control tower) o issuance of a NOTAMS should be considered, if time allows and if it is
deemed appropriate
Lodging is to be decided upon daily, based on the afternoon nowcast information and the 0300 UTC update briefing. Teams will rotate responsibility for identifica-tion of hotels.
Maximum distance between current location and location of desired upsonde op-erations is 250 miles;
Daily meetings between the upsonde teams will be held nominally at 1500 UTC, to make decisions on operations and observational strategies. The meetings will be followed (immediately, if warranted) by team departure, so that the teams can preposition and then commence the PCE strategy by roughly 1800 UTC.
Each team vehicle should be equipped with a first aid kit, rain gear, emergency roadside kits and assistance information, contact information for each participant, etc.
7. Operations Bases (Moore)
The aircraft operations base for MPEX is the Rocky Mountain Metropolitan Airport (formerly known and commonly referred to as Jeffco).
The project science and operations center base is located at the NCAR Foothills Lab.
The upsonde teams will not have a fixed base of operations, but instead will be con-tinuously deployed throughout the field campaign. Lodging (and hence second-day po-sitioning) decisions for each day will be made based on the afternoon nowcast infor-mation and the 0300 UTC update briefing.
8. Project Communications (Moore)
Communications between participants, facilities, and team members are critical to
MPEX operations. These communications range from virtual attendance at planning meetings to direction of aircraft flight patterns to interactions with ground-based facility teams. MPEX will make heavy use of internet exchange of data, visuals, and chat ca-pability.
As part of the project communications plan a list of cell phone numbers will be com-piled for all group leads and provided to these group leads. It is the responsibility of group leads to disseminate any information they receive according to the procedures
8 May 2013
35
established within each group. Project PIs and PMs will not contact every individual in-volved in the projects with every update they may release.
The project will have a hotline, 303-497-1040, set up. The hotline will be updated dai-ly with the operations plan for the upcoming day. Voicemail left at the hotline is not checked. All information on the hotline will be duplicated with daily ops update distribut-ed via E-mail and on the project ops web site under "Work Schedule".
8.1 Operations Bases
The Operations Bases at JEFFCO and FL1 is configured with high bandwidth internet
connectivity that includes wired and WiFi access. Telephone connections (VOIP) are also available.
Most meetings will be operated with ReadyTalk allowing virtual attendance. Audio will be transmitted via telephone, and video via the web at www.readytalk.com. The connectivity information is given in Appendix G.
During flight operations, Xchat will be used to communicate between the airborne platforms, the ground facilities, and the Operations Base. Various chat rooms will be set up for specific communication purposes (see section 10.4.2).
To keep team members informed of the day-to-day decisions and changes to those decisions, brief broadcast messages will be sent via email, Twitter, made available on a telephone call-in line, and posted on the MPEX project website (www.eol.ucar.edu/mpex).
The internet will be used to access information needed by the decision-making team, such as research model output, operational model output, data from aircraft instruments and ground-based facilities, and other types of information. The main repository for such information is the MPEX Field Catalog: catalog.eol.ucar.edu/_2012/index.html (see section 10.4).
8.2 Mobile sounding Crews
The mobile upsonde teams will communicate via cellular phones and Xchat. Both will be used by the Mobile Upsonde Director for team positioning and coordination. Each team will also have some level of weather information (e.g., GRLevel2 radar software), which will allow the teams to operate autonomously, if necessary, once an observational strategy (and domain) has been determined. Note that an objective for the upsonde strategies (PCE and CDE) is to have time-coordinated radionsonde observations. The primary means of achieving this objective with the CDE strategy will be to release sondes at predefined times (e.g., top or bottom of each hour). The PCE strat-egy requires redeployment, and because redeployment carries some uncertainty (e.g., time to
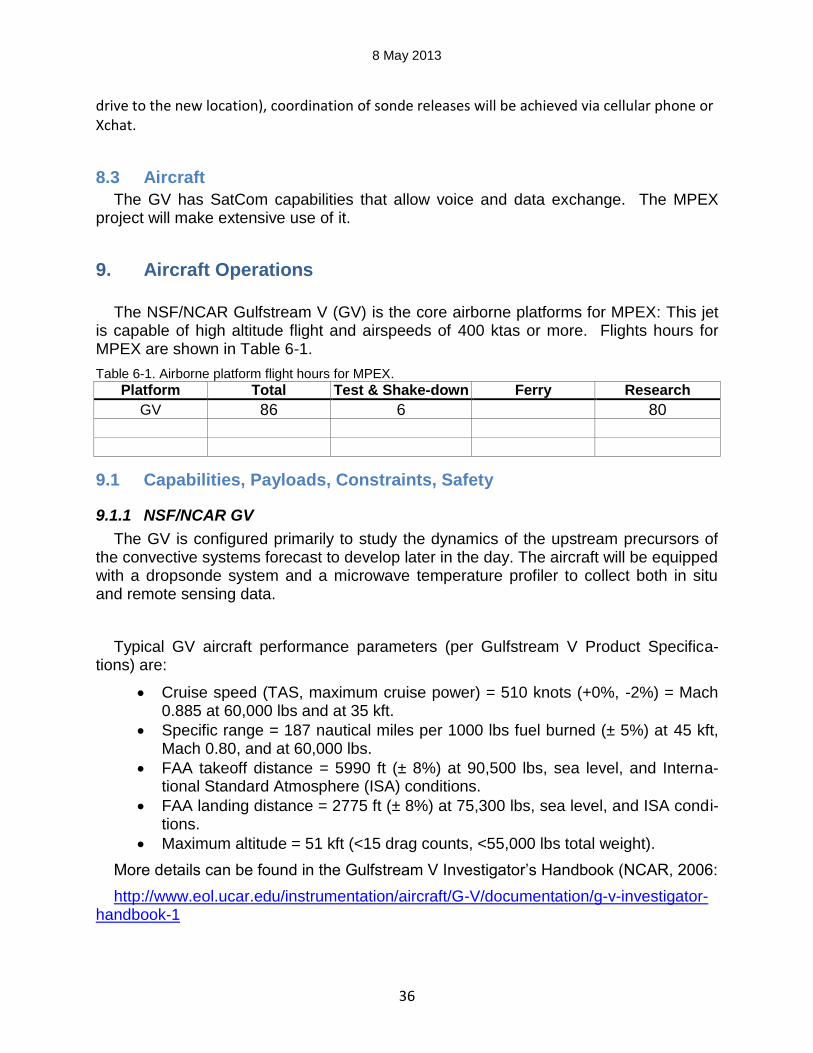
8 May 2013
36
drive to the new location), coordination of sonde releases will be achieved via cellular phone or Xchat.
8.3 Aircraft
The GV has SatCom capabilities that allow voice and data exchange. The MPEX project will make extensive use of it.
9. Aircraft Operations
The NSF/NCAR Gulfstream V (GV) is the core airborne platforms for MPEX: This jet
is capable of high altitude flight and airspeeds of 400 ktas or more. Flights hours for MPEX are shown in Table 6-1.
Table 6-1. Airborne platform flight hours for MPEX.
Platform Total Test & Shake-down Ferry Research
GV 86 6 80
9.1 Capabilities, Payloads, Constraints, Safety
9.1.1 NSF/NCAR GV
The GV is configured primarily to study the dynamics of the upstream precursors of the convective systems forecast to develop later in the day. The aircraft will be equipped with a dropsonde system and a microwave temperature profiler to collect both in situ and remote sensing data.
Typical GV aircraft performance parameters (per Gulfstream V Product Specifica-tions) are:
Cruise speed (TAS, maximum cruise power) = 510 knots (+0%, -2%) = Mach 0.885 at 60,000 lbs and at 35 kft.
Specific range = 187 nautical miles per 1000 lbs fuel burned (± 5%) at 45 kft, Mach 0.80, and at 60,000 lbs.
FAA takeoff distance = 5990 ft (± 8%) at 90,500 lbs, sea level, and Interna-tional Standard Atmosphere (ISA) conditions.
FAA landing distance = 2775 ft (± 8%) at 75,300 lbs, sea level, and ISA condi-tions.
Maximum altitude = 51 kft (<15 drag counts, <55,000 lbs total weight).
More details can be found in the Gulfstream V Investigator’s Handbook (NCAR, 2006:
http://www.eol.ucar.edu/instrumentation/aircraft/G-V/documentation/g-v-investigator-handbook-1
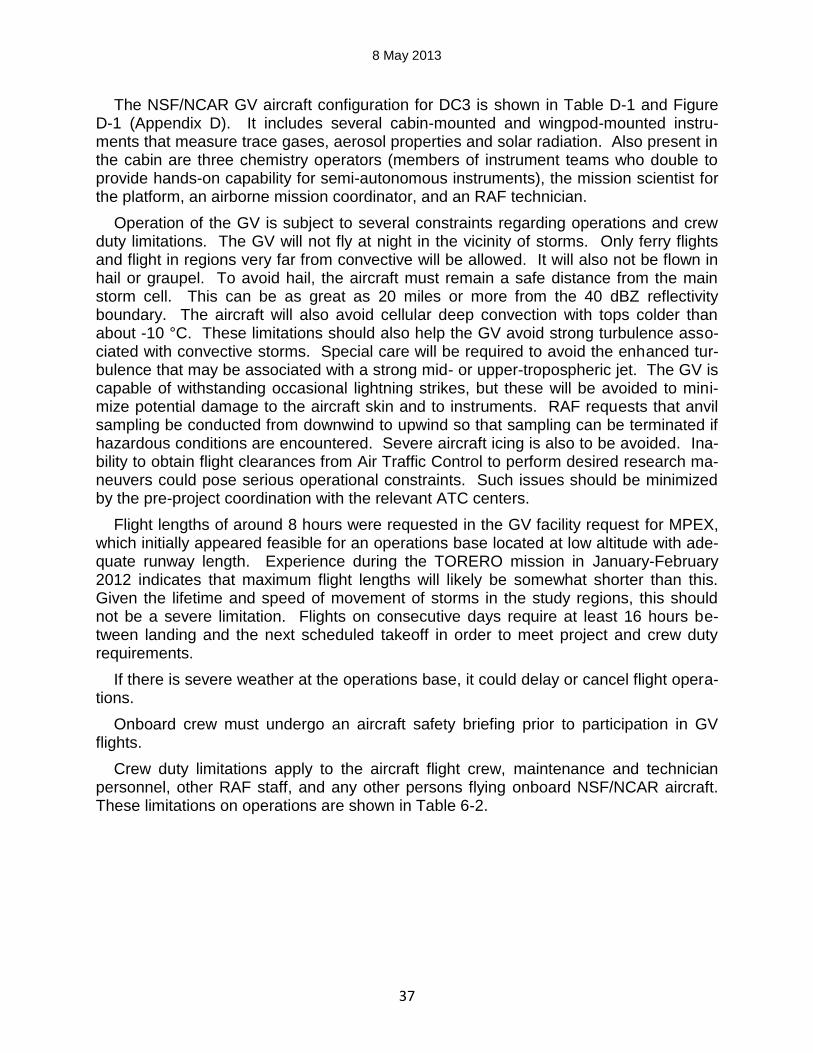
8 May 2013
37
The NSF/NCAR GV aircraft configuration for DC3 is shown in Table D-1 and Figure D-1 (Appendix D). It includes several cabin-mounted and wingpod-mounted instru-ments that measure trace gases, aerosol properties and solar radiation. Also present in the cabin are three chemistry operators (members of instrument teams who double to provide hands-on capability for semi-autonomous instruments), the mission scientist for the platform, an airborne mission coordinator, and an RAF technician.
Operation of the GV is subject to several constraints regarding operations and crew duty limitations. The GV will not fly at night in the vicinity of storms. Only ferry flights and flight in regions very far from convective will be allowed. It will also not be flown in hail or graupel. To avoid hail, the aircraft must remain a safe distance from the main storm cell. This can be as great as 20 miles or more from the 40 dBZ reflectivity boundary. The aircraft will also avoid cellular deep convection with tops colder than about -10 °C. These limitations should also help the GV avoid strong turbulence asso-ciated with convective storms. Special care will be required to avoid the enhanced tur-bulence that may be associated with a strong mid- or upper-tropospheric jet. The GV is capable of withstanding occasional lightning strikes, but these will be avoided to mini-mize potential damage to the aircraft skin and to instruments. RAF requests that anvil sampling be conducted from downwind to upwind so that sampling can be terminated if hazardous conditions are encountered. Severe aircraft icing is also to be avoided. Ina-bility to obtain flight clearances from Air Traffic Control to perform desired research ma-neuvers could pose serious operational constraints. Such issues should be minimized by the pre-project coordination with the relevant ATC centers.
Flight lengths of around 8 hours were requested in the GV facility request for MPEX, which initially appeared feasible for an operations base located at low altitude with ade-quate runway length. Experience during the TORERO mission in January-February 2012 indicates that maximum flight lengths will likely be somewhat shorter than this. Given the lifetime and speed of movement of storms in the study regions, this should not be a severe limitation. Flights on consecutive days require at least 16 hours be-tween landing and the next scheduled takeoff in order to meet project and crew duty requirements.
If there is severe weather at the operations base, it could delay or cancel flight opera-tions.
Onboard crew must undergo an aircraft safety briefing prior to participation in GV flights.
Crew duty limitations apply to the aircraft flight crew, maintenance and technician personnel, other RAF staff, and any other persons flying onboard NSF/NCAR aircraft. These limitations on operations are shown in Table 6-2.
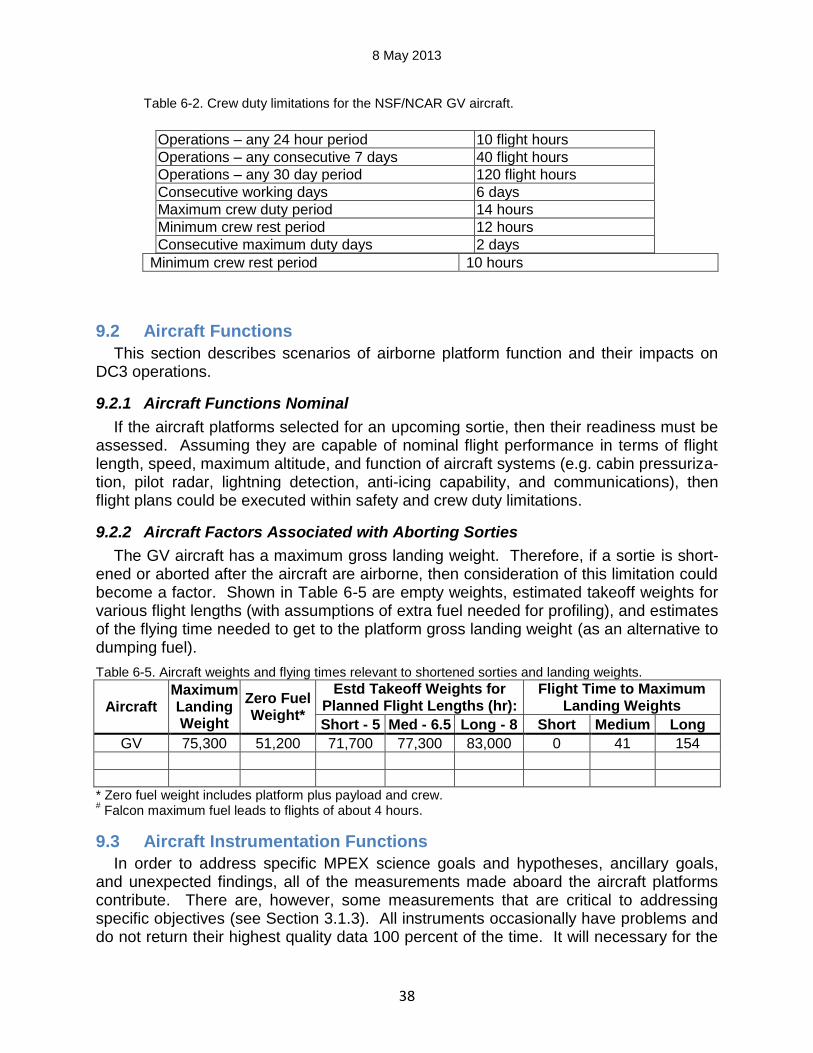
8 May 2013
38
Table 6-2. Crew duty limitations for the NSF/NCAR GV aircraft.
Operations – any 24 hour period 10 flight hours
Operations – any consecutive 7 days 40 flight hours
Operations – any 30 day period 120 flight hours
Consecutive working days 6 days
Maximum crew duty period 14 hours
Minimum crew rest period 12 hours
Consecutive maximum duty days 2 days
Minimum crew rest period 10 hours
9.2 Aircraft Functions
This section describes scenarios of airborne platform function and their impacts on DC3 operations.
9.2.1 Aircraft Functions Nominal
If the aircraft platforms selected for an upcoming sortie, then their readiness must be assessed. Assuming they are capable of nominal flight performance in terms of flight length, speed, maximum altitude, and function of aircraft systems (e.g. cabin pressuriza-tion, pilot radar, lightning detection, anti-icing capability, and communications), then flight plans could be executed within safety and crew duty limitations.
9.2.2 Aircraft Factors Associated with Aborting Sorties
The GV aircraft has a maximum gross landing weight. Therefore, if a sortie is short-ened or aborted after the aircraft are airborne, then consideration of this limitation could become a factor. Shown in Table 6-5 are empty weights, estimated takeoff weights for various flight lengths (with assumptions of extra fuel needed for profiling), and estimates of the flying time needed to get to the platform gross landing weight (as an alternative to dumping fuel).
Table 6-5. Aircraft weights and flying times relevant to shortened sorties and landing weights.
Aircraft Maximum Landing Weight
Zero Fuel Weight*
Estd Takeoff Weights for Planned Flight Lengths (hr):
Flight Time to Maximum Landing Weights
Short - 5 Med - 6.5 Long - 8 Short Medium Long
GV 75,300 51,200 71,700 77,300 83,000 0 41 154
* Zero fuel weight includes platform plus payload and crew. # Falcon maximum fuel leads to flights of about 4 hours.
9.3 Aircraft Instrumentation Functions
In order to address specific MPEX science goals and hypotheses, ancillary goals, and unexpected findings, all of the measurements made aboard the aircraft platforms contribute. There are, however, some measurements that are critical to addressing specific objectives (see Section 3.1.3). All instruments occasionally have problems and do not return their highest quality data 100 percent of the time. It will necessary for the
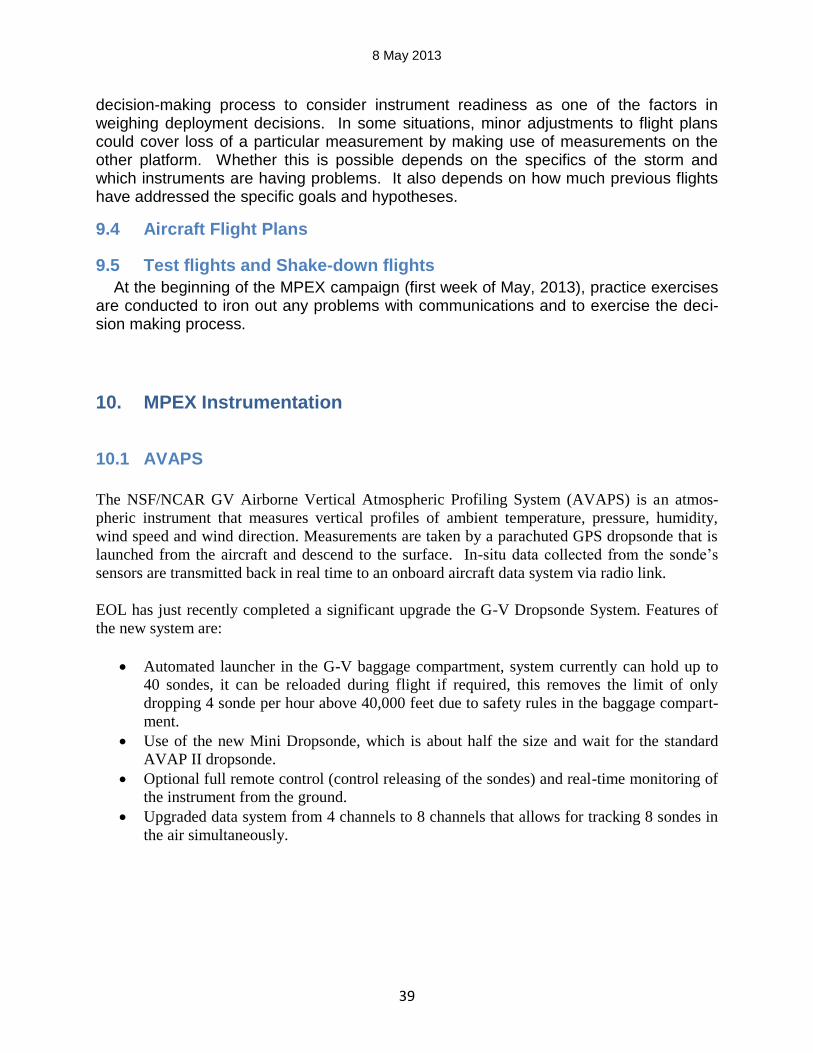
8 May 2013
39
decision-making process to consider instrument readiness as one of the factors in weighing deployment decisions. In some situations, minor adjustments to flight plans could cover loss of a particular measurement by making use of measurements on the other platform. Whether this is possible depends on the specifics of the storm and which instruments are having problems. It also depends on how much previous flights have addressed the specific goals and hypotheses.
9.4 Aircraft Flight Plans
9.5 Test flights and Shake-down flights
At the beginning of the MPEX campaign (first week of May, 2013), practice exercises are conducted to iron out any problems with communications and to exercise the deci-sion making process.
10. MPEX Instrumentation
10.1 AVAPS
The NSF/NCAR GV Airborne Vertical Atmospheric Profiling System (AVAPS) is an atmos-
pheric instrument that measures vertical profiles of ambient temperature, pressure, humidity,
wind speed and wind direction. Measurements are taken by a parachuted GPS dropsonde that is
launched from the aircraft and descend to the surface. In-situ data collected from the sonde’s
sensors are transmitted back in real time to an onboard aircraft data system via radio link.
EOL has just recently completed a significant upgrade the G-V Dropsonde System. Features of
the new system are:
Automated launcher in the G-V baggage compartment, system currently can hold up to
40 sondes, it can be reloaded during flight if required, this removes the limit of only
dropping 4 sonde per hour above 40,000 feet due to safety rules in the baggage compart-
ment.
Use of the new Mini Dropsonde, which is about half the size and wait for the standard
AVAP II dropsonde.
Optional full remote control (control releasing of the sondes) and real-time monitoring of
the instrument from the ground.
Upgraded data system from 4 channels to 8 channels that allows for tracking 8 sondes in
the air simultaneously.
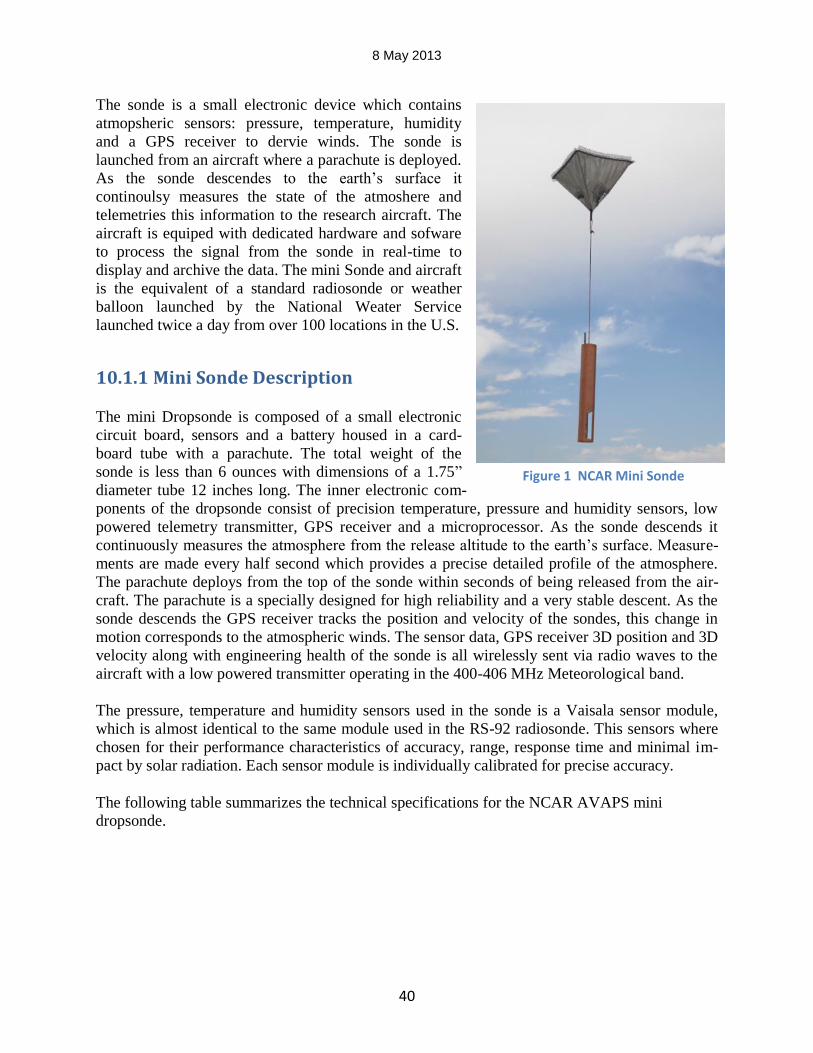
8 May 2013
40
The sonde is a small electronic device which contains
atmopsheric sensors: pressure, temperature, humidity
and a GPS receiver to dervie winds. The sonde is
launched from an aircraft where a parachute is deployed.
As the sonde descendes to the earth’s surface it
continoulsy measures the state of the atmoshere and
telemetries this information to the research aircraft. The
aircraft is equiped with dedicated hardware and sofware
to process the signal from the sonde in real-time to
display and archive the data. The mini Sonde and aircraft
is the equivalent of a standard radiosonde or weather
balloon launched by the National Weater Service
launched twice a day from over 100 locations in the U.S.
10.1.1 Mini Sonde Description The mini Dropsonde is composed of a small electronic
circuit board, sensors and a battery housed in a card-
board tube with a parachute. The total weight of the
sonde is less than 6 ounces with dimensions of a 1.75”
diameter tube 12 inches long. The inner electronic com-
ponents of the dropsonde consist of precision temperature, pressure and humidity sensors, low
powered telemetry transmitter, GPS receiver and a microprocessor. As the sonde descends it
continuously measures the atmosphere from the release altitude to the earth’s surface. Measure-
ments are made every half second which provides a precise detailed profile of the atmosphere.
The parachute deploys from the top of the sonde within seconds of being released from the air-
craft. The parachute is a specially designed for high reliability and a very stable descent. As the
sonde descends the GPS receiver tracks the position and velocity of the sondes, this change in
motion corresponds to the atmospheric winds. The sensor data, GPS receiver 3D position and 3D
velocity along with engineering health of the sonde is all wirelessly sent via radio waves to the
aircraft with a low powered transmitter operating in the 400-406 MHz Meteorological band.
The pressure, temperature and humidity sensors used in the sonde is a Vaisala sensor module,
which is almost identical to the same module used in the RS-92 radiosonde. This sensors where
chosen for their performance characteristics of accuracy, range, response time and minimal im-
pact by solar radiation. Each sensor module is individually calibrated for precise accuracy.
The following table summarizes the technical specifications for the NCAR AVAPS mini
dropsonde.
Figure 1 NCAR Mini Sonde
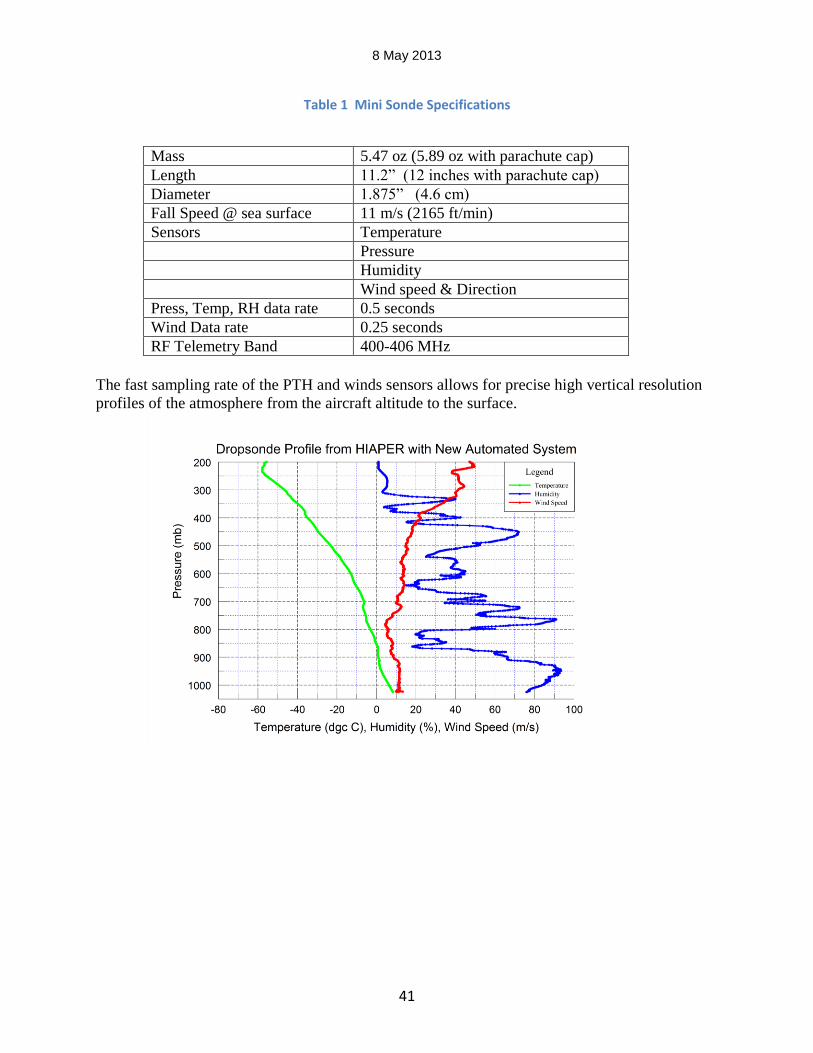
8 May 2013
41
Table 1 Mini Sonde Specifications
Mass 5.47 oz (5.89 oz with parachute cap)
Length 11.2” (12 inches with parachute cap)
Diameter 1.875” (4.6 cm)
Fall Speed @ sea surface 11 m/s (2165 ft/min)
Sensors Temperature
Pressure
Humidity
Wind speed & Direction
Press, Temp, RH data rate 0.5 seconds
Wind Data rate 0.25 seconds
RF Telemetry Band 400-406 MHz
The fast sampling rate of the PTH and winds sensors allows for precise high vertical resolution
profiles of the atmosphere from the aircraft altitude to the surface.
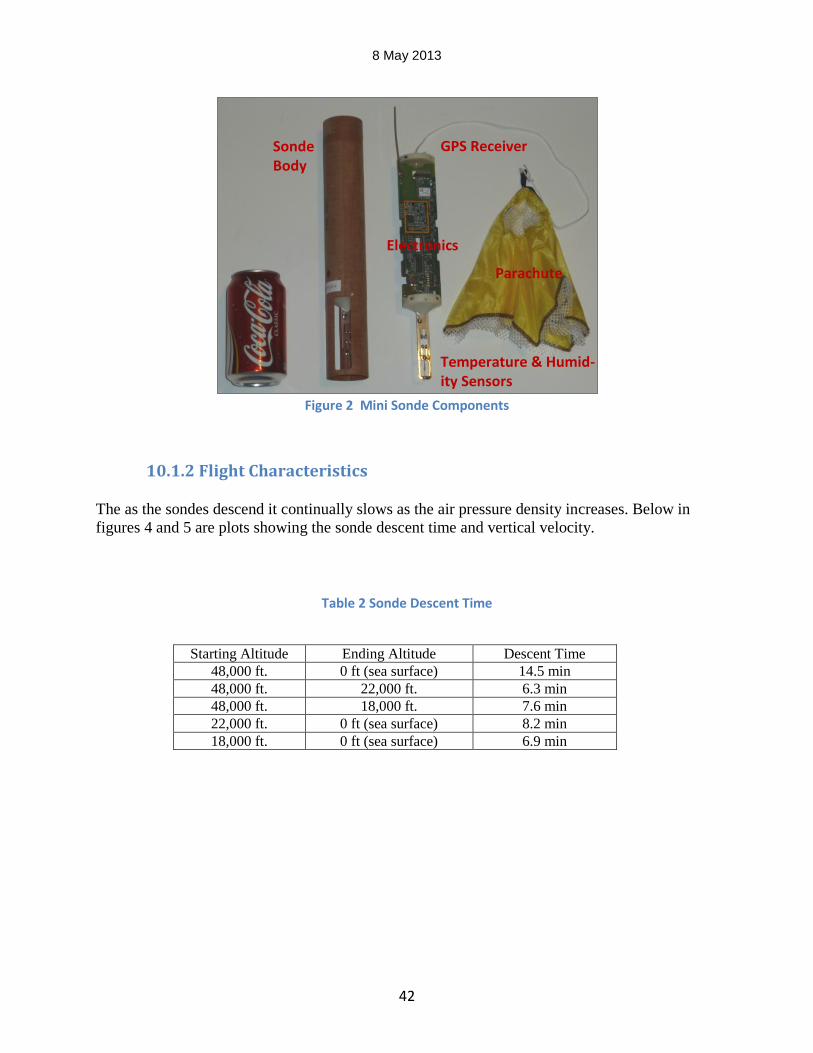
8 May 2013
42
Figure 2 Mini Sonde Components
10.1.2 Flight Characteristics The as the sondes descend it continually slows as the air pressure density increases. Below in
figures 4 and 5 are plots showing the sonde descent time and vertical velocity.
Table 2 Sonde Descent Time
Starting Altitude Ending Altitude Descent Time
48,000 ft. 0 ft (sea surface) 14.5 min
48,000 ft. 22,000 ft. 6.3 min
48,000 ft. 18,000 ft. 7.6 min
22,000 ft. 0 ft (sea surface) 8.2 min
18,000 ft. 0 ft (sea surface) 6.9 min
Sonde Body
Temperature & Humid-ity Sensors
Parachute
Electronics
GPS Receiver
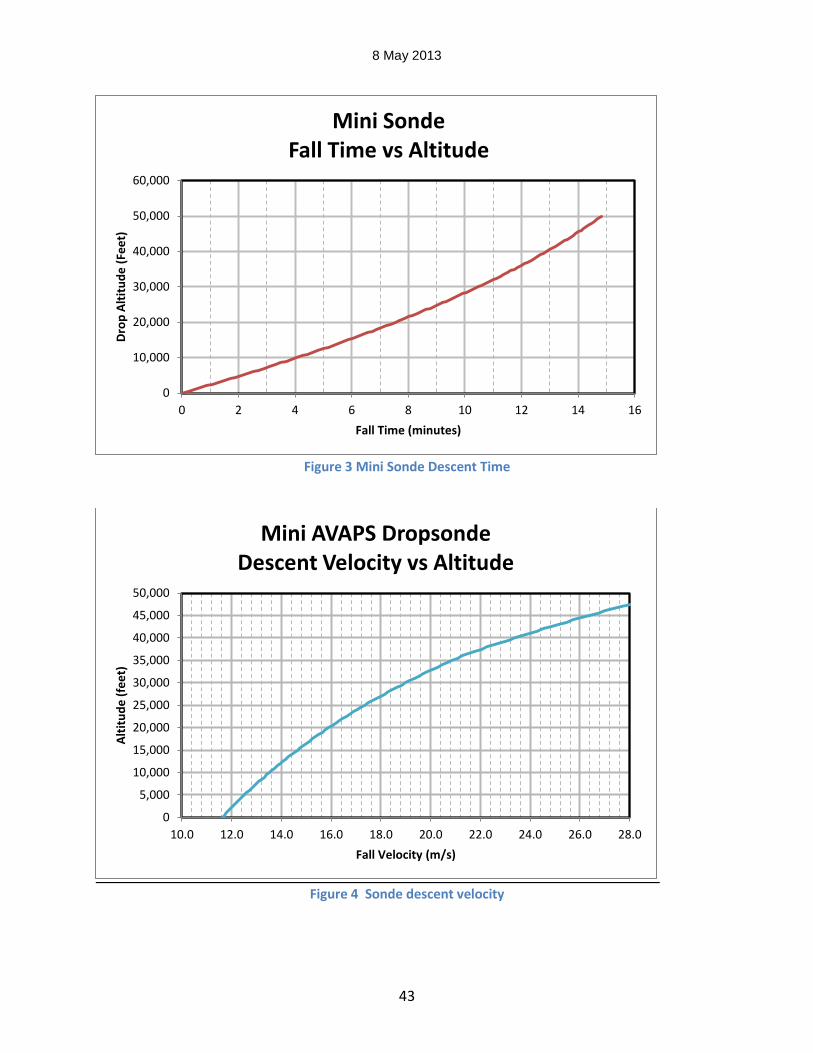
8 May 2013
43
Figure 3 Mini Sonde Descent Time
Figure 4 Sonde descent velocity
0
10,000
20,000
30,000
40,000
50,000
60,000
0 2 4 6 8 10 12 14 16
Dro
p A
ltit
ud
e (
Fee
t)
Fall Time (minutes)
Mini Sonde Fall Time vs Altitude
0
5,000
10,000
15,000
20,000
25,000
30,000
35,000
40,000
45,000
50,000
10.0 12.0 14.0 16.0 18.0 20.0 22.0 24.0 26.0 28.0
Alt
itu
de
(fe
et)
Fall Velocity (m/s)
Mini AVAPS Dropsonde Descent Velocity vs Altitude
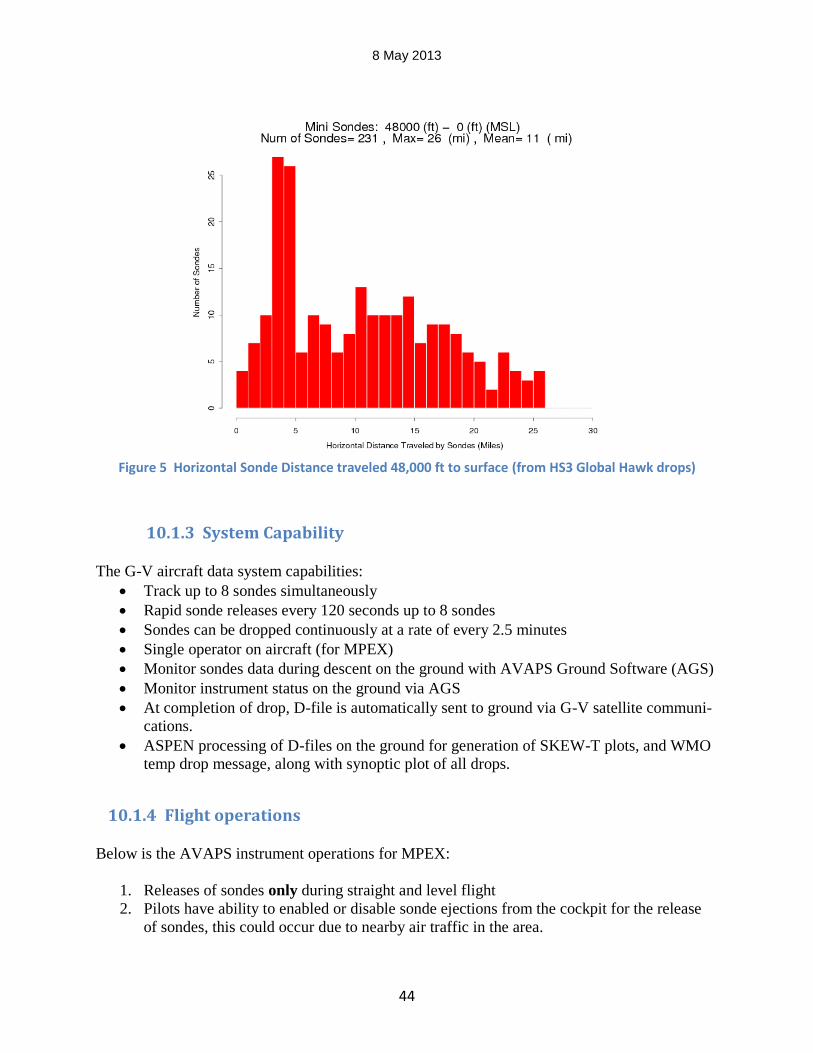
8 May 2013
44
Figure 5 Horizontal Sonde Distance traveled 48,000 ft to surface (from HS3 Global Hawk drops)
10.1.3 System Capability The G-V aircraft data system capabilities:
Track up to 8 sondes simultaneously
Rapid sonde releases every 120 seconds up to 8 sondes
Sondes can be dropped continuously at a rate of every 2.5 minutes
Single operator on aircraft (for MPEX)
Monitor sondes data during descent on the ground with AVAPS Ground Software (AGS)
Monitor instrument status on the ground via AGS
At completion of drop, D-file is automatically sent to ground via G-V satellite communi-
cations.
ASPEN processing of D-files on the ground for generation of SKEW-T plots, and WMO
temp drop message, along with synoptic plot of all drops.
10.1.4 Flight operations Below is the AVAPS instrument operations for MPEX:
1. Releases of sondes only during straight and level flight
2. Pilots have ability to enabled or disable sonde ejections from the cockpit for the release
of sondes, this could occur due to nearby air traffic in the area.
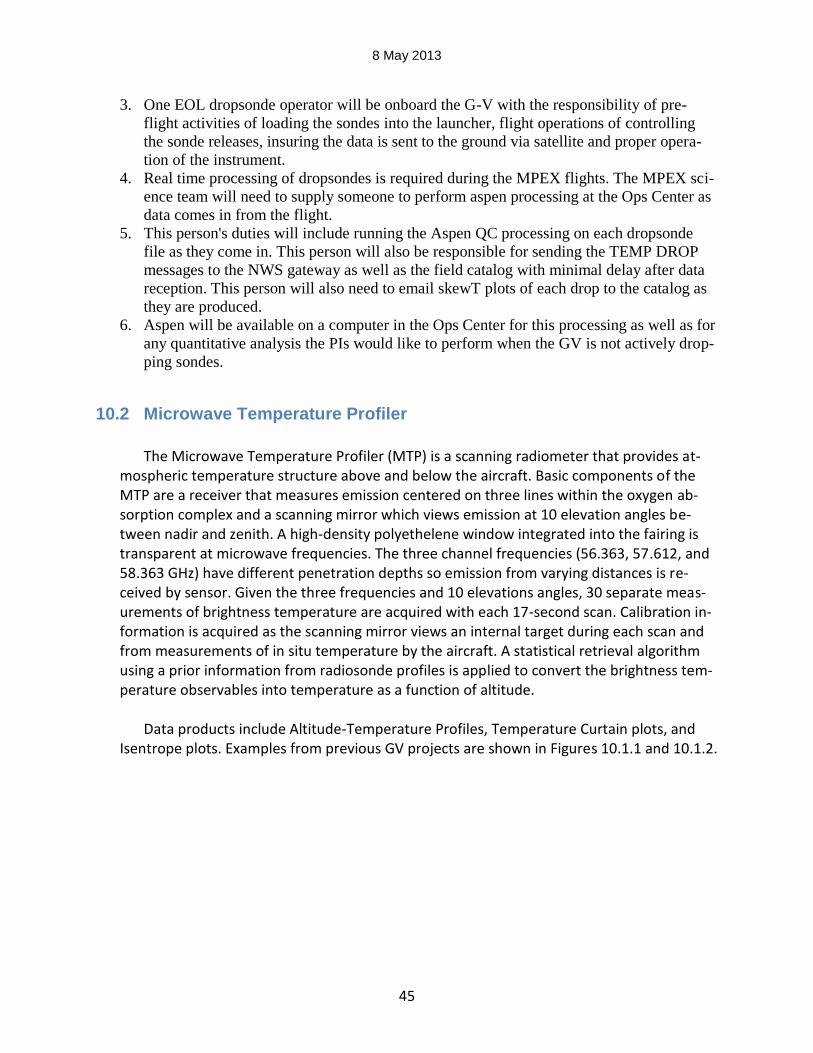
8 May 2013
45
3. One EOL dropsonde operator will be onboard the G-V with the responsibility of pre-
flight activities of loading the sondes into the launcher, flight operations of controlling
the sonde releases, insuring the data is sent to the ground via satellite and proper opera-
tion of the instrument.
4. Real time processing of dropsondes is required during the MPEX flights. The MPEX sci-
ence team will need to supply someone to perform aspen processing at the Ops Center as
data comes in from the flight.
5. This person's duties will include running the Aspen QC processing on each dropsonde
file as they come in. This person will also be responsible for sending the TEMP DROP
messages to the NWS gateway as well as the field catalog with minimal delay after data
reception. This person will also need to email skewT plots of each drop to the catalog as
they are produced.
6. Aspen will be available on a computer in the Ops Center for this processing as well as for
any quantitative analysis the PIs would like to perform when the GV is not actively drop-
ping sondes.
10.2 Microwave Temperature Profiler
The Microwave Temperature Profiler (MTP) is a scanning radiometer that provides at-
mospheric temperature structure above and below the aircraft. Basic components of the MTP are a receiver that measures emission centered on three lines within the oxygen ab-sorption complex and a scanning mirror which views emission at 10 elevation angles be-tween nadir and zenith. A high-density polyethelene window integrated into the fairing is transparent at microwave frequencies. The three channel frequencies (56.363, 57.612, and 58.363 GHz) have different penetration depths so emission from varying distances is re-ceived by sensor. Given the three frequencies and 10 elevations angles, 30 separate meas-urements of brightness temperature are acquired with each 17-second scan. Calibration in-formation is acquired as the scanning mirror views an internal target during each scan and from measurements of in situ temperature by the aircraft. A statistical retrieval algorithm using a prior information from radiosonde profiles is applied to convert the brightness tem-perature observables into temperature as a function of altitude.
Data products include Altitude-Temperature Profiles, Temperature Curtain plots, and
Isentrope plots. Examples from previous GV projects are shown in Figures 10.1.1 and 10.1.2.
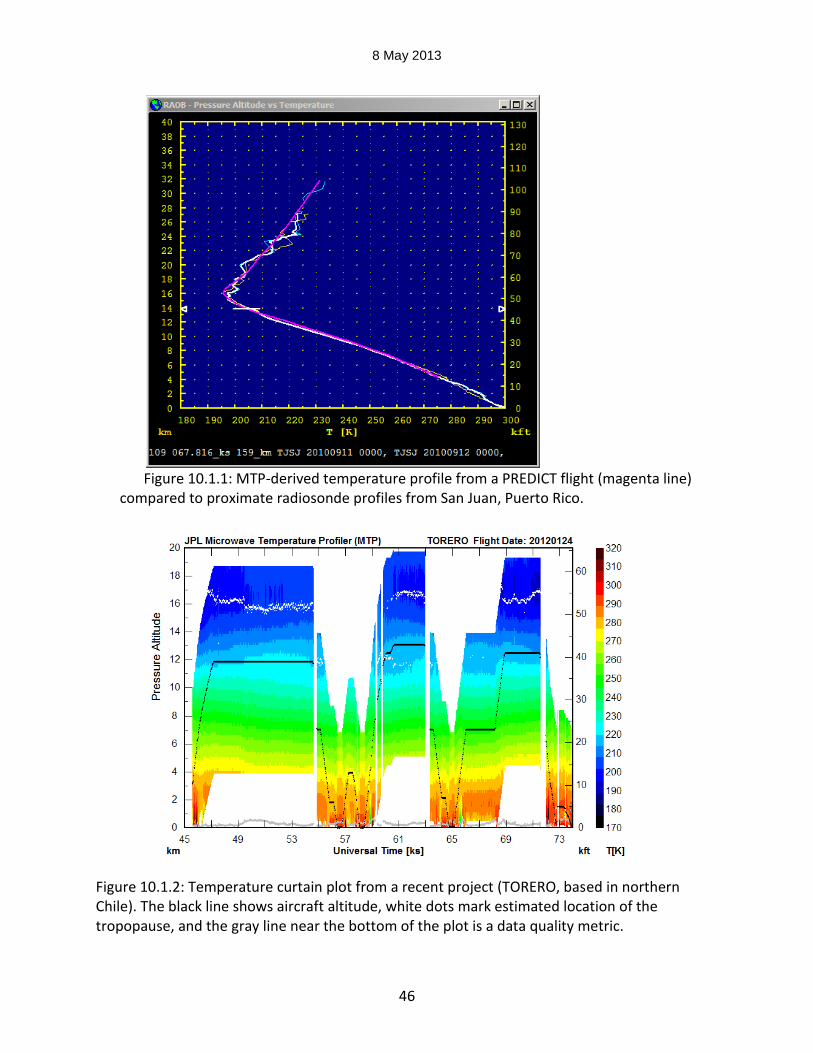
8 May 2013
46
Figure 10.1.1: MTP-derived temperature profile from a PREDICT flight (magenta line)
compared to proximate radiosonde profiles from San Juan, Puerto Rico.
Figure 10.1.2: Temperature curtain plot from a recent project (TORERO, based in northern Chile). The black line shows aircraft altitude, white dots mark estimated location of the tropopause, and the gray line near the bottom of the plot is a data quality metric.
8 May 2013
47
10.3 Upsondes
The Purdue and NSSL systems are comprised of the iMet-3050 and iMet-3150 403 MHz GPS radiosonde receiver and antenna (manufactured by International Met Sys-tems). Laptop computers running the iMETOS will be used to process the radiosonde data, which will be collected using iMet-1-AB 403 MHz GPS radiosondes with a pres-sure sensor; pre-flight calibration is not needed with the iMet-1-ABs. The sondes will be suspended from 200-gm latex balloons, with a de-reeler and 30-m string. The CSU system is a Digicora MW21 using Vaisala RS92 sondes with a GC25 (Ground Check system). It uses a GPS antenna for wind finding and a UHF antenna operating around 400 Hz for transmitting the signal from the sonde to the ground system. Similar-ly, a laptop computer running the Digicora software will be used to process the radiosonde data. As with the NSSL and Purdue systems, the sondes will be suspended from 200-gm latex balloons, with a de-reeler and 30-m string. Near the beginning of the project we plan to conduct one to two inter-comparison flights with these two radiosonde systems. These will involve either simultaneous flights with separate balloons, or single flights with both sondes suspended from a single (larger) balloon. Because of the planned rapid succession of balloon releases, and the associated near-continuous data collection during IOPs, we do not anticipate an ability to perform a real-time quality control of the data. Hence, we will be unable to make the soundings avail-able in real time, but the sounding data will be included in an MPEX Data Archive Cen-ter, following the MPEX Data Management Policy (see Section 11).
11. Data and Information Management
11.1 Introduction
The development and maintenance of a comprehensive and accurate data archive is a critical step in meeting the scientific objectives of MPEX. The overall guiding philoso-phy for the MPEX data management is to make the completed data set available to the scientific community as soon as possible following the MPEX Field Phase, while provid-ing ample time to the MPEX Principle Investigators (PIs) and project participants to pro-cess, quality control, and analyze their data before providing open access.
The MPEX data will be available to the scientific community through a number of des-ignated distributed MPEX Data Archive Centers (MDACs) coordinated by the NCAR/EOL. The EOL coordination activities fall into three major areas: (1) determine the data requirements of the MPEX scientific community and develop them into a com-prehensive MPEX Data Management Plan through input received from the MPEX Sci-entific Steering Committee (SSC), project participants, and other tools such as the data questionnaire; (2) development and implementation of an on-line Field Catalog to pro-
8 May 2013
48
vide in-field support and project summaries/updates for the PIs and project participants to insure optimum data collection; and (3) establishment of a coordinated distributed archive system and providing data access/support of both research and operational da-ta sets for the MPEX PIs and the scientific community. To accomplish these goals, EOL will also be responsible for the establishment and maintenance of the MPEX Data Man-agement Portal. These web pages provide "one-stop" access to all distributed MPEX data sets, documentation, on-line Field Catalog products, collaborating project data ar-chives, and other relevant data links. EOL will make arrangements to ensure that "or-phan" data sets (i.e. smaller regional and local networks) will be archived and made available through the MPEX archive.
11.2 Data Policy, Protocol, and Attribution
In general, users will have free and open access to all the MPEX data, subject to pro-cedures to be put into place at the various MDACs. The following is a summary of the MPEX Data Management Policy by which all MPEX participants, data providers, and data users are requested to abide by:
1. All investigators participating in MPEX agree to promptly submit their quality con-trolled data to the MPEX Data Archive Center (MDAC) by 15 December 2013 at the latest (six months after the end of the field campaign) to facilitate inter-comparison of results, quality control checks and inter-calibrations, as well as an integrated interpretation of the combined data set.
2. During the initial data analysis period, defined as a one-year period following the agreed submission deadline to the MPEX archive, MPEX PIs will have exclusive access to this data. This initial analysis period is designed to provide an oppor-tunity to quality control the combined data set as well as to provide the investiga-tors ample time to publish their results.
3. All data will be considered public domain one year after the agreed submission deadline to the MPEX archive (i.e., on 16 December 2014 and thereafter). A data set within the MPEX archive can be opened to the public domain earlier at the discretion of the data provider for this particular data set.
4. All data shall be promptly provided to other MPEX investigators upon request. All MPEX investigators will have equal access to all data. A list of MPEX investiga-tors will be maintained by NCAR/EOL and will include the Principal Investigators (PIs) directly participating in the field experiment as well as collaborating scien-tists who have provided guidance in the planning and analysis of MPEX data.
5. During the initial data analysis period, the investigator(s) who collected the data must be notified first of the intent to use the data, in particular if data is to be pro-vided to a third party (e.g., journal articles, presentations, research proposals, other investigators). It is strongly encouraged that PIs responsible for acquisition of data be invited to become collaborators and co-authors on any projects, publi-cations and presentations. If the contribution of the data product is significant to the publication, the PIs responsible for generating a measurement or a data product should be offered the right of co-authorship. Any use of the data should
8 May 2013
49
include an acknowledgment (i.e., citation). In all circumstances, the PIs responsi-ble for acquisition of data should be acknowledged appropriately.
6. The following acknowledgement is suggested: The xxxx data was collected as
part of the Mesoscale Predictability Experiment (MPEX). The primary sponsor of
MPEX is the US National Science Foundation (NSF). The involvement of the
NSF-sponsored Lower Atmospheric Observing Facilities, managed and operated
by the National Center for Atmospheric Research (NCAR) Earth Observing La-
boratory (EOL), is acknowledged. The acquisition of the xxx data was carried out
by Dr. Yyyyy using the zzzz instrument and was funded by wwww (if pertinent).
The data was downloaded from the MPEX Data Archive, which is maintained by
NCAR EOL.
11.3 Real-Time Data
11.3.1 MPEX Field Catalog
NCAR/EOL will implement and maintain a web-based MPEX on-line Field Catalog that will be operational during the MPEX field phase to support the field operational planning, product display, and documentation (e.g. facility status, daily operations sum-maries, weather forecasts, and mission reports) as well as provide a project summary and “browse” tool for use by researchers in the post-field analysis phase. Data collec-tion products (both operational and research) will be ingested into the catalog in near real time beginning the week of 6 May 2013. The Field Catalog will permit data entry (data collection details, field summary notes, certain operational data etc.), data brows-ing (listings, plots) and limited catalog information distribution. A Daily Operations Summary will be prepared and contain information regarding operations (aircraft flight times, major instrument systems sampling times, weather forecasts and synopses, etc.). These summaries will be entered into the Field Catalog either electronically (via a web interface and/or e-mail) or manually. It is important and desirable for the PIs to contrib-ute product graphics (e.g., plots in gif, jpg, png, or pdf format) and/or preliminary data to the Field Catalog whenever possible. Although the Field Catalog will be publically available, access to preliminary data will be restricted to project participants only. Up-dates of the status of data collection and instrumentation (on a daily basis or more often depending on the platforms and other operational requirements) will be available. Pub-lic access to the on-line Field Catalog is located at http://catalog.eol.ucar.edu/mpex/ . The Field Data Catalog User's Guide (with specific instructions for submitting reports and data products) is located at: http://catalog.eol.ucar.edu/mpex/tools/user/user_guide .
EOL will monitor and maintain the field catalog through the duration of the field de-ployment and also provide in-field support and training to MPEX project participants. Following the MPEX field phase, this Field Catalog will continue to be available on-line (as part of the long-term archive) to assist researchers with access to project products, summaries, information, and documentation. Preliminary data will not be retained as part of the Field Catalog, but final data will be submitted and available through the MPEX archive.
8 May 2013
50
11.3.2 Field Catalog Components, Services and Related Displays
The field catalog will be the central web site for all activities related to the field cam-paign. As such it will contain products and reports related to project operations as well as forms for entering/editing reports, uploading new products, data files, photos or re-ports. The field catalog will also provide a preliminary data sharing area, a missions table to highlight major project operations, links to related project information and help pages to familiarize users with the various features of the catalog interface. The MPEX Field Catalog front page will be customized to provide pertinent project information, rap-id access to the most popular catalog features and will include access to the GIS dis-play tools like Catalog Maps and the Mission Coordinator displays as well as the way-point calculator. Access to project chatrooms will be provided through the Field Catalog with a link on the front page as well.
GIS Display tools
The Mission Coordinator and Catalog Maps displays are the main GIS display tools that will be provided by EOL for the MPEX campaign. The Mission Coordinator display is a real-time tool for situational awareness and decision-making aboard the NCAR GV aircraft. This display will contain a small subset of products pertinent to aircraft opera-tions from the Field Catalog that can be displayed along with GV and other aircraft tracks. The Mission Coordinator display is also accessible to forecasters and aircraft coordinators on the ground. The Catalog Maps display is a GIS tool that is integrated into the Field Catalog and provides access to a larger number of real-time products as well as an ability to replay products from any previous day during the campaign. For MPEX, a mobile version of the Catalog Maps tool is also being fielded that will provide access to real-time products and instrument locations for those operating mobile facili-ties on the ground.
11.4 Data Archive and Access
The MPEX will take advantage of the capabilities at existing MDACs to implement a distributed data management system. This system will provide “one-stop” single point access (Project Portal) at EOL using the web for search and order of MPEX data from MDACs operated by different agencies/groups with the capability to transfer data sets electronically from the respective MDAC to the user. Access to the data archive will be provided through a Data Management Section in the MPEX Project page (http://www.eol.ucar.edu/projects/mpex/). This Data Management Section will contain direct links to the data and status (archive/access), data submission instructions, da-taset documentation guidelines, and links to related programs and projects. Parts of the website will be password protected and access restricted, as appropriate (as described in the Data Policy, Section 11.2).
EOL will be responsible for the long-term data stewardship of MPEX data and metadata. This includes ensuring that “orphan” datasets are properly collected and ar-chived, verifying that data at the various MDACs will be archived and available in the long-term, and that all supporting information (e.g. Field Catalog) are included in the archive.
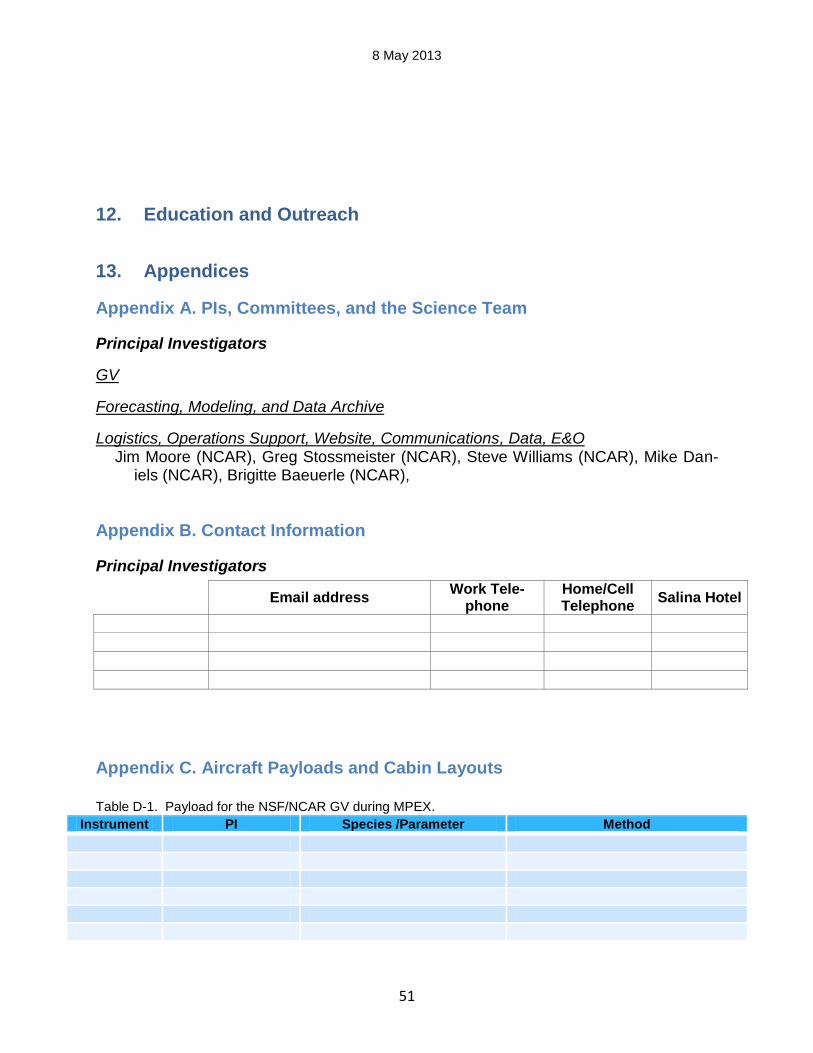
8 May 2013
51
12. Education and Outreach
13. Appendices
Appendix A. PIs, Committees, and the Science Team
Principal Investigators
GV
Forecasting, Modeling, and Data Archive
Logistics, Operations Support, Website, Communications, Data, E&O Jim Moore (NCAR), Greg Stossmeister (NCAR), Steve Williams (NCAR), Mike Dan-
iels (NCAR), Brigitte Baeuerle (NCAR),
Appendix B. Contact Information
Principal Investigators
Email address Work Tele-
phone Home/Cell Telephone
Salina Hotel
Appendix C. Aircraft Payloads and Cabin Layouts
Table D-1. Payload for the NSF/NCAR GV during MPEX.
Instrument PI Species /Parameter Method
8 May 2013
52
Crew:
Appendix D. ReadyTalk Connection Information
To participate in MPEX meetings using ReadyTalk, use the following information:
Audio Dial-In:
Access Code:
Visual via web browser:
http://www.readytalk.com
“Join a meeting” code:
Please mute your telephone to avoid extraneous noise.
Appendix E. MPEX and Related Websites
Project & Logistics: Science: E&O: MPEX Field Catalog: Aircraft
GV:

8 May 2013
53