Embed Size (px)
Citation preview
DEVELOPMENT COMMITTEE (Joint Ministerial Committee
of the Boards of Governors of the Bank and the Fund
on the Transfer of Real Resources to Developing Countries)
DC2011-0002 April 4, 2011
RESPONDING TO GLOBAL FOOD PRICE VOLATILITY
AND ITS IMPACT ON FOOD SECURITY
Attached for the April 16, 2011, Development Committee Meeting is a document entitled “Responding to Global Food Price Volatility and Its Impact on Food Security,” prepared by the staff of the World Bank.
* * *

Acronyms
AFR Africa Region ASEAN Association of Southeast Asian Nations CAADP Comprehensive Africa Agriculture Development Programme CGIAR Consultative Group on International Agricultural Research CSOs Civil Society Organizations DFID Department for International Development EAP East Asia and the Pacific Region ECA Europe and Central Asia Region EU European Union FAO Food and Agriculture Organization FAOSTAT Food and Agriculture Organization Statistical Database FY Fiscal Year G20 The Group of Twenty Finance Ministers and Central Bank Governors GAFSP Global Agriculture and Food Security Program HLTF United Nations High-Level Task Force on the Global Food Security Crisis GDP Gross Domestic Product GFRP Global Food Crisis Response Program IBRD International Bank for Reconstruction and Development IDA International Development Association IFAD International Fund for Agricultural Development IFC International Finance Corporation IMF International Monetary Fund JSDF Japan Social Development Fund LCR Latin America and the Caribbean Region MNA Middle East and North Africa Region M&E Monitoring and Evaluation MT Metric Ton NGO Non-Governmental Organization OECD Organization for Economic Co-operation and Development OECS Organization of Eastern Caribbean States PNG Papua New Guinea RSR Rapid Social Response Program RSRC Rapid Social Response Catalytic Trust Fund SAFANSI South Asia Food and Nutrition Security Initiative SAR South Asia Region SDR Special Drawing Rights SPS Sanitary and Phytosanitary Standards SUN Scaling-up Nutrition TF Trust Fund UK United Kingdom UN United Nations UNCTAD United Nation Conference on Trade and Development US United States of America US$ United States Dollar USDA United States Department of Agriculture WBG World Bank Group WFP World Food Programme

CONTENTS
EXECUTIVE SUMMARY ................................................................................................................................... i
I. GLOBAL FOOD PRICE VOLATILITY ................................................................................................... 1
II. DRIVERS OF FOOD PRICES ................................................................................................................. 2
III. IMPACT ON FOOD SECURITY ............................................................................................................. 9
IV. WORLD BANK EMERGENCY AND SHORT-TERM RESPONSES TO FOOD CRISES ............................... 15
V. WORLD BANK LONGER-TERM AND STRATEGIC RESPONSE ............................................................ 19
VI. LEVERAGING AND STRENGTHENING PARTNERSHIPS ...................................................................... 27
VII. QUESTIONS FOR POSSIBLE DISCUSSION BY THE DEVELOPMENT COMMITTEE .............................. 30
LIST OF FIGURES
Figure 1: Food commodity price spikes since 2004...................................................................................... 1
Figure 2: Higher world grain consumption, variable supply, and stock draw downs have contributed to the consecutive grain price spikes ...................................................................................................... 3
Figure 3: Fertilizer prices spike along with crude oil prices ......................................................................... 5
Figure 4: Significant rise in reported droughts, floods, and extreme temperature ........................................ 6
Figure 5: Variability of maize and wheat exports from the Black Sea region and Latin America are more variable than from traditional exporters ....................................................................................... 8
Figure 6: Countries’ vulnerability to global food price shocks tracked by share of cereal imports in domestic consumption and food share in household expenditure .............................................. 13
Figure 7: GFRP support has been higher in regions where food accounts for a large share of household spending ...................................................................................................................................... 16
LIST OF BOXES
Box 1: Market smart fertilizer subsidies as a short-term response ............................................................. 18 Box 2: Responsible Agro-Investment ......................................................................................................... 20 Box 3: Managing risks and coping with shocks and new crises ................................................................. 22 Box 4: Management of public grain reserves ............................................................................................. 23

i
EXECUTIVE SUMMARY 1. International food prices are spiking again for the second time in three years, igniting concerns about a repeat of the 2008 food price crisis and its consequences for the poor. In February 2011, the World Bank Food Price Index reached its 2008 peak, after rising by 47 percent since June 2010. In addition to higher prices, the variability of international grain prices (around its mean) doubled during the period between 2005 and 2010 relative to the period between 1990 and 2005, sugar price variability tripled, and rice variability is four times higher. Price volatility is now back to similar levels experienced in the 1970s. Variability in prices is problematic when variations are large and unpredictable, as they pose fundamental food security risks for consumers and governments, while discouraging needed investment in agriculture for development through increased financial risks for producers and traders1. They are occurring now in a period when expanding the supply of food is if anything more difficult than in the period following commodity price volatility in the 1970s. 2. The current global food price situation has both similarities and differences with 2008. It is similar in four respects. First, global grain stocks are low. Second, higher oil prices have impacted agricultural commodity prices, and the recent events in the Middle East and North Africa add to the current uncertainty. Third, depreciation of the dollar in 2008 against most currencies led to the perception of a larger increase of US$-denominated food prices compared to prices in other major currencies. Fourth, financial investment in agricultural commodities remains high. Yet the current situation differs in several critical respects. First, recent international price increases are more widespread across agricultural commodities than in 2008. Second, weather induced production shortfalls are also more of a factor now. Third, policy responses have further raised the amplitude of the grain price spikes in 2011, but not nearly as much as in 2008 when policy greatly exacerbated shortages. 3. The drivers of food prices have become more complex, extending beyond traditional factors of supply and demand. The average levels of food prices are driven by long-term demand (population expansion, income growth, and changing diets) and supply (resource use and technology). Short-term variations in prices are influenced by weather variability, trade policies, more volatile oil prices (including through biofuels based on agricultural feedstock), macroeconomic policy, financial investments, and short-run market sentiment influenced by all of the above. These short-term factors, as discussed in the paper, are manifesting themselves more frequently and are likely to continue to produce short-run food price volatility, especially when global food stocks are low. Even though these short-term factors are likely to persist, a key message is that actions to mitigate both short-run food price volatility and sudden rises in average food price levels that produce hardship and unrest need to focus on long-term fundamental drivers of food prices; this is fundamental to addressing the growing underlying problems. Higher and more volatile agricultural commodity prices are likely to persist in the foreseeable future,
largely due to continuing uncertainty on the supply side, against projected rising demand 4. Supply side uncertainty is reflected in the current price spike for cereals which was driven by a series of weather shocks in developed countries that ended up lowering their grain production in 2010 by an estimated 8 percent and their stocks by nearly 25 percent. As developed countries account for about 70 percent of world cereals trade, the decline in production and stocks contributed to global food price increases. Good weather in the next growing season could lead to higher production, but long-term trends in tightening land and water constraints and climate change add to supply side uncertainty. Furthermore, a growing share of grain exports is being produced in Eastern Europe and
1 Actions to address food security need to seek a balance between agriculture-focused and household-focused action. While this paper discusses both, emphasis is on options for addressing food security through management of food price volatility given the recent spikes in food prices.
ii
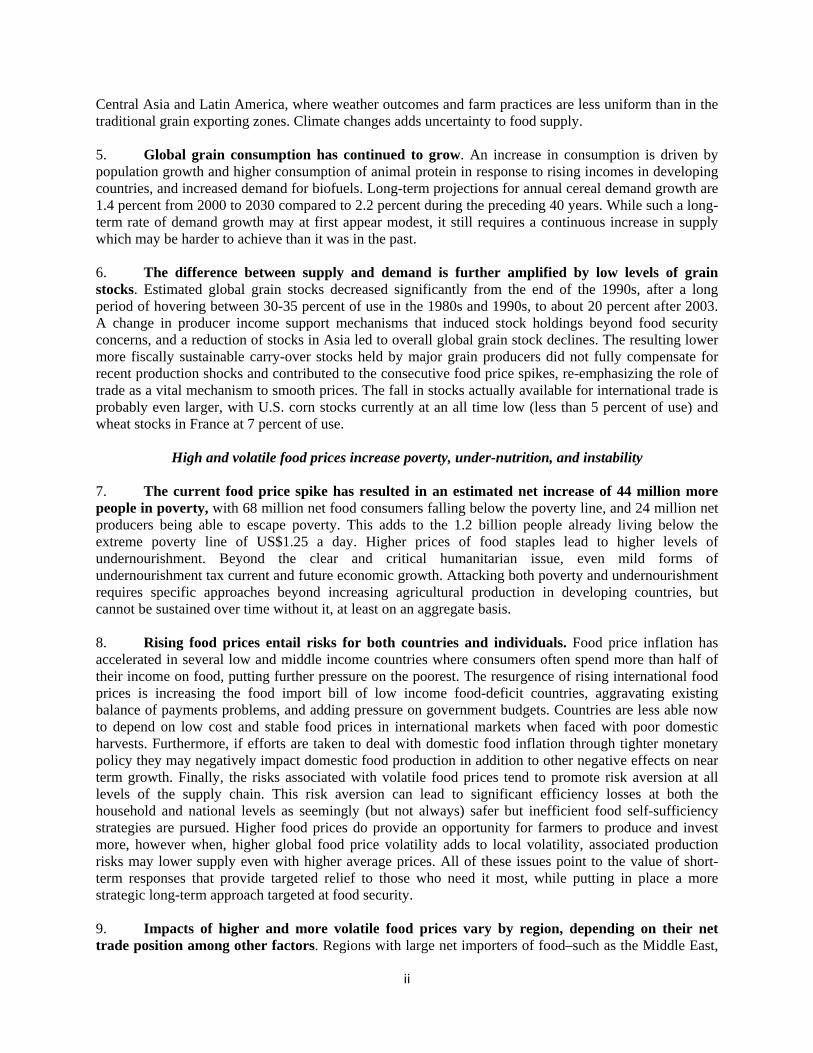
Central Asia and Latin America, where weather outcomes and farm practices are less uniform than in the traditional grain exporting zones. Climate changes adds uncertainty to food supply. 5. Global grain consumption has continued to grow. An increase in consumption is driven by population growth and higher consumption of animal protein in response to rising incomes in developing countries, and increased demand for biofuels. Long-term projections for annual cereal demand growth are 1.4 percent from 2000 to 2030 compared to 2.2 percent during the preceding 40 years. While such a long-term rate of demand growth may at first appear modest, it still requires a continuous increase in supply which may be harder to achieve than it was in the past. 6. The difference between supply and demand is further amplified by low levels of grain stocks. Estimated global grain stocks decreased significantly from the end of the 1990s, after a long period of hovering between 30-35 percent of use in the 1980s and 1990s, to about 20 percent after 2003. A change in producer income support mechanisms that induced stock holdings beyond food security concerns, and a reduction of stocks in Asia led to overall global grain stock declines. The resulting lower more fiscally sustainable carry-over stocks held by major grain producers did not fully compensate for recent production shocks and contributed to the consecutive food price spikes, re-emphasizing the role of trade as a vital mechanism to smooth prices. The fall in stocks actually available for international trade is probably even larger, with U.S. corn stocks currently at an all time low (less than 5 percent of use) and wheat stocks in France at 7 percent of use.
High and volatile food prices increase poverty, under-nutrition, and instability 7. The current food price spike has resulted in an estimated net increase of 44 million more people in poverty, with 68 million net food consumers falling below the poverty line, and 24 million net producers being able to escape poverty. This adds to the 1.2 billion people already living below the extreme poverty line of US$1.25 a day. Higher prices of food staples lead to higher levels of undernourishment. Beyond the clear and critical humanitarian issue, even mild forms of undernourishment tax current and future economic growth. Attacking both poverty and undernourishment requires specific approaches beyond increasing agricultural production in developing countries, but cannot be sustained over time without it, at least on an aggregate basis. 8. Rising food prices entail risks for both countries and individuals. Food price inflation has accelerated in several low and middle income countries where consumers often spend more than half of their income on food, putting further pressure on the poorest. The resurgence of rising international food prices is increasing the food import bill of low income food-deficit countries, aggravating existing balance of payments problems, and adding pressure on government budgets. Countries are less able now to depend on low cost and stable food prices in international markets when faced with poor domestic harvests. Furthermore, if efforts are taken to deal with domestic food inflation through tighter monetary policy they may negatively impact domestic food production in addition to other negative effects on near term growth. Finally, the risks associated with volatile food prices tend to promote risk aversion at all levels of the supply chain. This risk aversion can lead to significant efficiency losses at both the household and national levels as seemingly (but not always) safer but inefficient food self-sufficiency strategies are pursued. Higher food prices do provide an opportunity for farmers to produce and invest more, however when, higher global food price volatility adds to local volatility, associated production risks may lower supply even with higher average prices. All of these issues point to the value of short-term responses that provide targeted relief to those who need it most, while putting in place a more strategic long-term approach targeted at food security. 9. Impacts of higher and more volatile food prices vary by region, depending on their net trade position among other factors. Regions with large net importers of food–such as the Middle East,
iii
North Africa, and West Africa–face higher import bills, reduced fiscal space, and greater transmission of world prices to local prices for imported goods such as rice and wheat. Countries with high shares of household expenditure on food (most of Africa and Asia, for example) could experience significant hardship and possible unrest if food prices rise suddenly. Those countries with large net exports in Latin America and Eastern Europe stand to benefit from higher export revenues and farmer incomes, but may also face higher internal pressure to impose export bans when domestic food prices spike.
A priority for action is protecting the poor and vulnerable 10. The World Bank Group’s (WBG) Post-Crisis Directions paper (2010)2 stresses the importance of creating opportunities for growth through promotion of agriculture and food security, and of helping clients manage risk and prepare for crises. The WBG is responding with both short-term rapid response and a longer-term scale-up of investment in agricultural public goods, tailored to differing client desires, needs, and circumstances. Priority action on food price volatility is on protecting the poor and vulnerable. An integrated policy and investment approach for agriculture, health and nutrition, climate change and natural resource management is essential to achieving sustainable food security and good nutrition for all, focusing on household demand, food supply, and risk management. The instruments include: grant funding for rapid response in the poorest and most vulnerable countries and expedited use of IDA and IBRD funds under programs such as the Global Food Crisis Response Program (GFRP); facilitation of long-term aid effectiveness programs in agriculture and food security in IDA countries through the creation and hosting of the Global Agriculture and Food Security Program (GAFSP) in 2010; and–in coordination at the country-level with all the above–a scaled-up regular program of IBRD and IDA lending, policy advice and technical assistance for long-term results. IFC further closes the loop through its various programs for lending to the private sector, including the set up of a private sector window for GAFSP and a planned Global Agriculture Price Risk Management Facility.
Short-term action should focus on preserving access to food for the poor and vulnerable without undermining longer term farm incentives to invest and produce more
11. The WBG’s short-term emergency food crisis response is in place, drawing on lessons from the 2008 food price crisis response, and complements the WBG’s core focus on the longer-term agenda. Short-term responses must focus on speed of provision of resources and advice. The GFRP provided a rapid response to the most vulnerable countries, starting at the height of the 2008 food price spike. GFRP has reached the most vulnerable regions, with more than half of the support going to Sub-Saharan Africa. Short-term responses have focused on fiscal support, safety nets for the most vulnerable, and stimulating short-term food production to avoid further problems in the next harvest cycle. The GFRP program has allocated US$1.5 billion for support to 44 countries to date, with nearly 40 million people benefiting. Presently the GFRP is authorized to expedite processing of up to US$760 million of existing IDA/IBRD funds through the end of FY11. Due to persistent uncertainty in food prices, World Bank Management will ask for approval from the Board of Executive Directors to extend authority to expedite processing of IDA/IBRD to the end of FY12.
Longer-term actions should focus on climate resilient production, trade, and social protection 12. The WBG’s longer-term food production and distribution response, reflected in the WBG Agriculture Action Plan FY10-12, is scaling up support for agriculture to improve longer term resilience to climate change and tightening land and water constraints, helping dampen the supply shocks associated with price volatility. The longer-term response accounted for 85 percent of the WBG
2 World Bank (2010): New World, New World Bank Group: (I) Post-Crisis Directions. Development Committee. Washington, D.C.
iv
program for agriculture and related sectors in FY09 (GFRP accounted for 15 percent of the program), and continues to account for the greatest share of support for agriculture and food security. This reinforces the importance the WBG places on longer-term investments to improve food security. Longer-term responses must support a country-led strategic vision and build the capacity for sustainability. The focus of support in the agricultural area is on five thematic areas: agricultural productivity growth, trade facilitation and better linking farmers to markets, assisting in better managing risks and vulnerabilities, support for rural non-farm income and sustainable social safety nets to diversify incomes, and enhancing environmental services and sustainability. The World Bank’s parallel scale-up of nutrition support is helping to further improve resilience of the most vulnerable groups. The Agriculture Action Plan projects an increase in WBG lending from US$4.1 billion annually in FY06-08 to between US$6.2 billion and US$8.3 billion annually over FY10-12. Actual lending in FY10 was US$6.1 billion (with approved IDA/IBRD projects in 51 countries). Over three quarters of support has focused on Africa, and South and East Asia.
Global actions are essential to enhance national level responses 13. Coordinated multilateral action is essential to face the long-term food and agriculture challenges, especially to increase and improve investment in increasing smallholder agricultural productivity in sustainable ways, access to markets, and options for risk management at the national level. The WBG is strengthening its partnerships in these areas building on existing institutions. One example, on smallholder productivity and resilience, is support to the reformed Consultative Group on International Agricultural Research (CGIAR), which now provides more results-oriented, longer-term strategic funding through CGIAR Research Programs. Another example is the establishment of the Global Agriculture and Food Security Program, which has already allocated US$321 million for recipient executed grants in eight countries, including significant further support for assistance in implementation, monitoring, and evaluation. Sustained and higher support for these global programs is vital. The Bank has been a major supporter of the United Nations High Level Task Force on the Global Food Security Crisis since its inception in 2008. It has also been a member of the Food and Water Security Working Group of the Multilateral Development Banks. 14. The World Bank continues a robust program of policy advocacy for improvement of food security of the poor and undernourished in poor countries. The World Bank has been involved since 2007 in directly responding to the interest of the G8 and the G20 in promoting better food security for the poor. The World Bank created the GAFSP at the express request of the G20 in Pittsburgh in 2009. More recently, the World Bank has proposed for the consideration of the current G20 a set of nine concrete actions that strengthen market-based solutions and require collective action for impact, including collaboration by a variety of multilateral institutions according to their areas of comparative advantage and expertise:
(i) increase the timeliness, accuracy, and ease of public access to information on the quantity and quality of grain stocks (with the Food and Agricultural Organization (FAO) of the UN and others);
(ii) improve weather forecasting and monitoring, especially in Africa (with World Meteorological Organization and others);
(iii) deepen the understanding of the relationship between international prices and local food prices with a view to improving food security risk management options available to countries (with FAO, the Organization for Economic Coordination and Development (OECD), the International Food Policy Research Institute, and others);
(iv) establish a small regional humanitarian reserve in disaster-prone, infrastructure poor areas (with the World Food Programme (WFP) and others);
(v) agree on a code of conduct to exempt humanitarian food aid from export bans (with WFP, the World Trade Organization and others);
v
(vi) give countries access to fast-disbursing food-oriented support as an alternative to food export bans or price fixing (under discussion with the International Fund for Agricultural Development (IFAD), and the Regional Development Banks, and with the International Monetary Fund);
(vii) develop a robust set of risk management products (in partnership with a variety of donors and discussions with private sector institutions);
(viii) ensure effective social safety nets that include a focus on nutritional outcomes (through the Scaling-Up Nutrition and other collaborations); and
(ix) help smallholder farmers become a bigger part of the global solution to food security through support of strategic, evidence-based, and inclusive country-led agricultural investment plans that come out of existing country-level aid effectiveness processes (through the World Bank’s regular program and in partnership via GAFSP with bilateral donors, recipient representatives, civil society representatives, Multilateral Development Banks, and the Rome-based United Nations Food Agencies).
15. The World Bank is pursuing these discussions with partners directly and through participation in the relevant agricultural and food security working groups drafting recommendations for the G20 at the request of the French Presidency. Some examples of the World Bank’s engagement in these working groups include: the International Organizations Food Price Volatility Working Group, the Development Working Group, and the Finance Commodity Study Group. 16. A number of questions are posed to the Development Committee for possible discussion.
Given the magnitude and importance of the long-term issues related to food security, what other innovative and risk management approaches can the international community explore to help address these challenges?
Addressing short- and long-term food security, including strengthening the productivity and resiliency of the smallholder agricultural systems that dominate developing country agriculture, will be critical to an effective response. How can donors, the World Bank Group, and the international community support countries to achieve sustained results in this area?
1
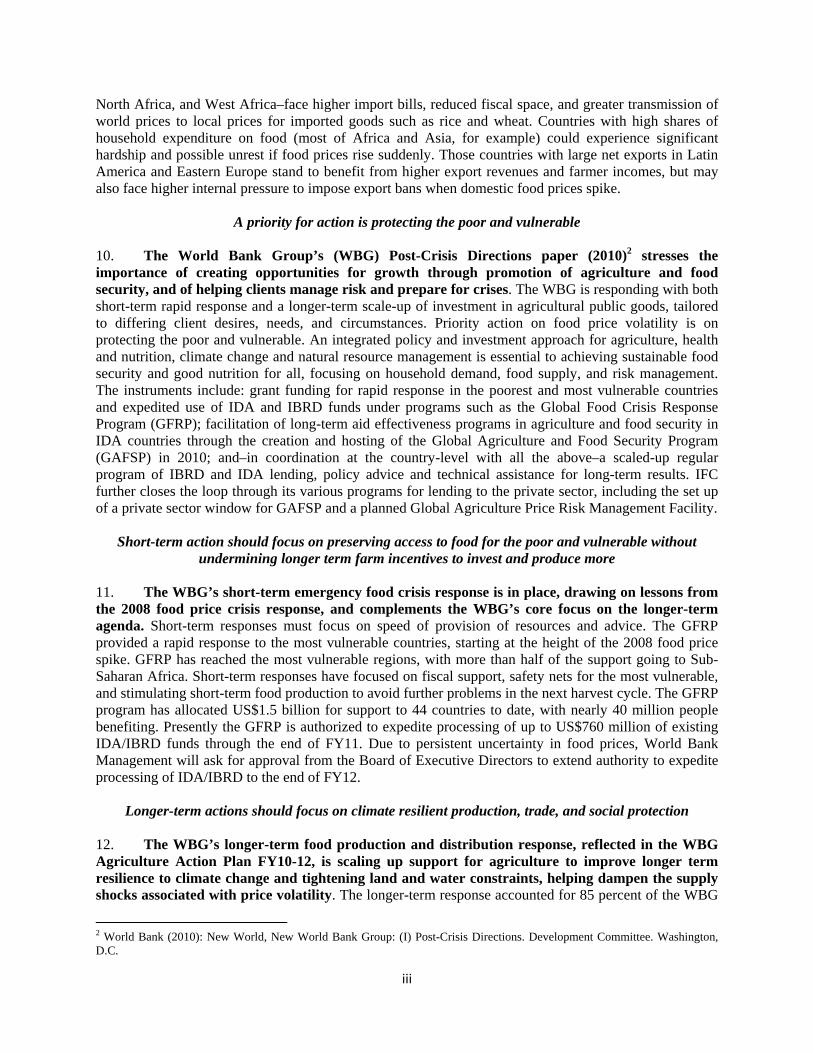
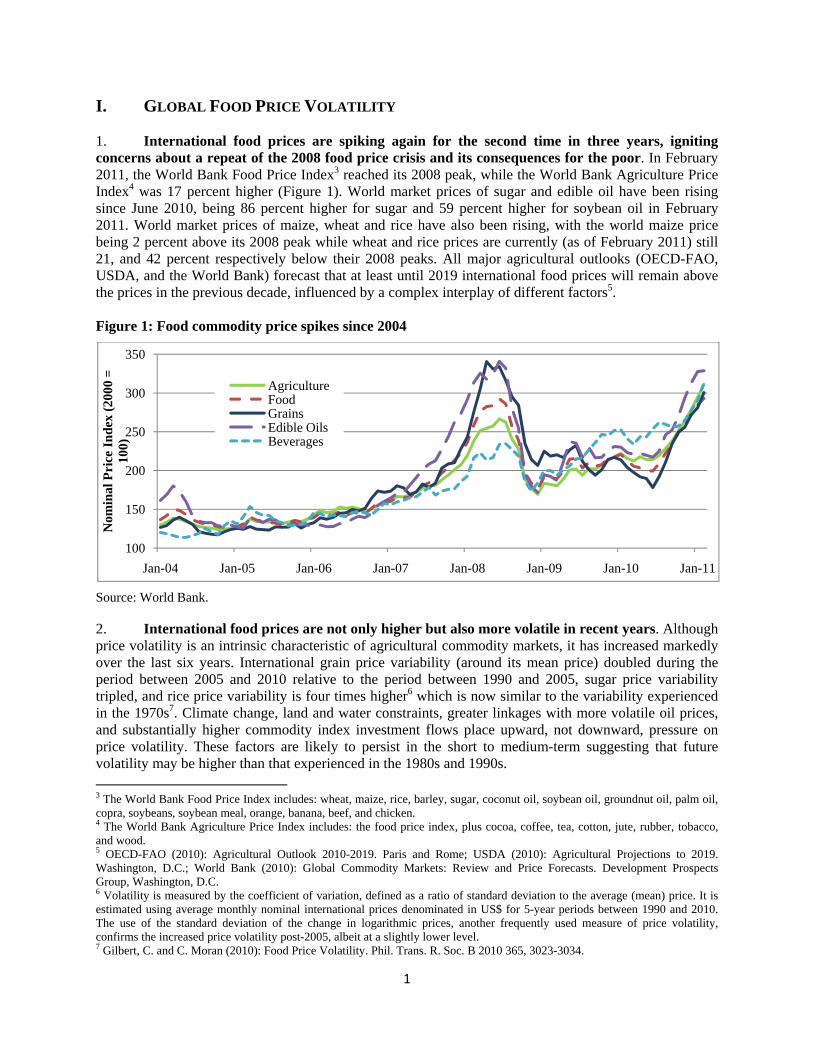
I. GLOBAL FOOD PRICE VOLATILITY 1. International food prices are spiking again for the second time in three years, igniting concerns about a repeat of the 2008 food price crisis and its consequences for the poor. In February 2011, the World Bank Food Price Index3 reached its 2008 peak, while the World Bank Agriculture Price Index4 was 17 percent higher (Figure 1). World market prices of sugar and edible oil have been rising since June 2010, being 86 percent higher for sugar and 59 percent higher for soybean oil in February 2011. World market prices of maize, wheat and rice have also been rising, with the world maize price being 2 percent above its 2008 peak while wheat and rice prices are currently (as of February 2011) still 21, and 42 percent respectively below their 2008 peaks. All major agricultural outlooks (OECD-FAO, USDA, and the World Bank) forecast that at least until 2019 international food prices will remain above the prices in the previous decade, influenced by a complex interplay of different factors5. Figure 1: Food commodity price spikes since 2004
Source: World Bank. 2. International food prices are not only higher but also more volatile in recent years. Although price volatility is an intrinsic characteristic of agricultural commodity markets, it has increased markedly over the last six years. International grain price variability (around its mean price) doubled during the period between 2005 and 2010 relative to the period between 1990 and 2005, sugar price variability tripled, and rice price variability is four times higher6 which is now similar to the variability experienced in the 1970s7. Climate change, land and water constraints, greater linkages with more volatile oil prices, and substantially higher commodity index investment flows place upward, not downward, pressure on price volatility. These factors are likely to persist in the short to medium-term suggesting that future volatility may be higher than that experienced in the 1980s and 1990s. 3 The World Bank Food Price Index includes: wheat, maize, rice, barley, sugar, coconut oil, soybean oil, groundnut oil, palm oil, copra, soybeans, soybean meal, orange, banana, beef, and chicken. 4 The World Bank Agriculture Price Index includes: the food price index, plus cocoa, coffee, tea, cotton, jute, rubber, tobacco, and wood. 5 OECD-FAO (2010): Agricultural Outlook 2010-2019. Paris and Rome; USDA (2010): Agricultural Projections to 2019. Washington, D.C.; World Bank (2010): Global Commodity Markets: Review and Price Forecasts. Development Prospects Group, Washington, D.C. 6 Volatility is measured by the coefficient of variation, defined as a ratio of standard deviation to the average (mean) price. It is estimated using average monthly nominal international prices denominated in US$ for 5-year periods between 1990 and 2010. The use of the standard deviation of the change in logarithmic prices, another frequently used measure of price volatility, confirms the increased price volatility post-2005, albeit at a slightly lower level. 7 Gilbert, C. and C. Moran (2010): Food Price Volatility. Phil. Trans. R. Soc. B 2010 365, 3023-3034.
100
150
200
250
300
350
Jan-04 Jan-05 Jan-06 Jan-07 Jan-08 Jan-09 Jan-10 Jan-11
Nom
inal
Pri
ce I
nd
ex (
2000
=
100)
AgricultureFoodGrainsEdible OilsBeverages
2
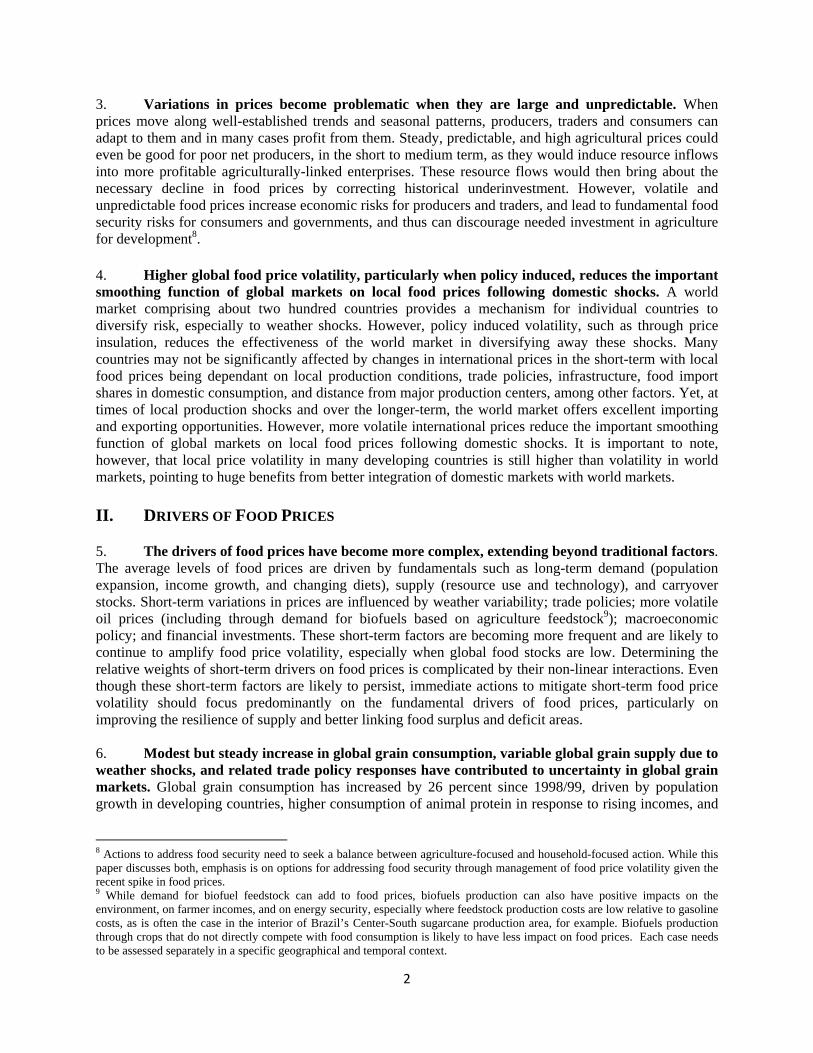
3. Variations in prices become problematic when they are large and unpredictable. When prices move along well-established trends and seasonal patterns, producers, traders and consumers can adapt to them and in many cases profit from them. Steady, predictable, and high agricultural prices could even be good for poor net producers, in the short to medium term, as they would induce resource inflows into more profitable agriculturally-linked enterprises. These resource flows would then bring about the necessary decline in food prices by correcting historical underinvestment. However, volatile and unpredictable food prices increase economic risks for producers and traders, and lead to fundamental food security risks for consumers and governments, and thus can discourage needed investment in agriculture for development8.
4. Higher global food price volatility, particularly when policy induced, reduces the important smoothing function of global markets on local food prices following domestic shocks. A world market comprising about two hundred countries provides a mechanism for individual countries to diversify risk, especially to weather shocks. However, policy induced volatility, such as through price insulation, reduces the effectiveness of the world market in diversifying away these shocks. Many countries may not be significantly affected by changes in international prices in the short-term with local food prices being dependant on local production conditions, trade policies, infrastructure, food import shares in domestic consumption, and distance from major production centers, among other factors. Yet, at times of local production shocks and over the longer-term, the world market offers excellent importing and exporting opportunities. However, more volatile international prices reduce the important smoothing function of global markets on local food prices following domestic shocks. It is important to note, however, that local price volatility in many developing countries is still higher than volatility in world markets, pointing to huge benefits from better integration of domestic markets with world markets. II. DRIVERS OF FOOD PRICES 5. The drivers of food prices have become more complex, extending beyond traditional factors. The average levels of food prices are driven by fundamentals such as long-term demand (population expansion, income growth, and changing diets), supply (resource use and technology), and carryover stocks. Short-term variations in prices are influenced by weather variability; trade policies; more volatile oil prices (including through demand for biofuels based on agriculture feedstock9); macroeconomic policy; and financial investments. These short-term factors are becoming more frequent and are likely to continue to amplify food price volatility, especially when global food stocks are low. Determining the relative weights of short-term drivers on food prices is complicated by their non-linear interactions. Even though these short-term factors are likely to persist, immediate actions to mitigate short-term food price volatility should focus predominantly on the fundamental drivers of food prices, particularly on improving the resilience of supply and better linking food surplus and deficit areas. 6. Modest but steady increase in global grain consumption, variable global grain supply due to weather shocks, and related trade policy responses have contributed to uncertainty in global grain markets. Global grain consumption has increased by 26 percent since 1998/99, driven by population growth in developing countries, higher consumption of animal protein in response to rising incomes, and
8 Actions to address food security need to seek a balance between agriculture-focused and household-focused action. While this paper discusses both, emphasis is on options for addressing food security through management of food price volatility given the recent spike in food prices. 9 While demand for biofuel feedstock can add to food prices, biofuels production can also have positive impacts on the environment, on farmer incomes, and on energy security, especially where feedstock production costs are low relative to gasoline costs, as is often the case in the interior of Brazil’s Center-South sugarcane production area, for example. Biofuels production through crops that do not directly compete with food consumption is likely to have less impact on food prices. Each case needs to be assessed separately in a specific geographical and temporal context.
3
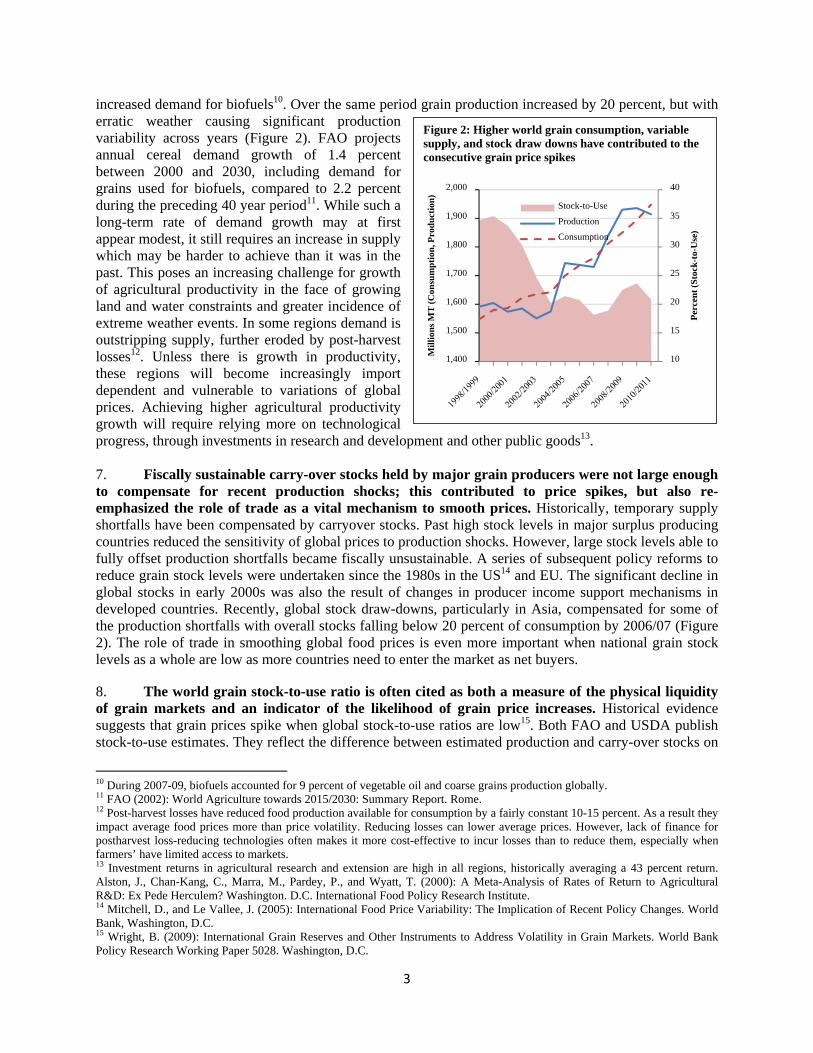
increased demand for biofuels10. Over the same period grain production increased by 20 percent, but with erratic weather causing significant production variability across years (Figure 2). FAO projects annual cereal demand growth of 1.4 percent between 2000 and 2030, including demand for grains used for biofuels, compared to 2.2 percent during the preceding 40 year period11. While such a long-term rate of demand growth may at first appear modest, it still requires an increase in supply which may be harder to achieve than it was in the past. This poses an increasing challenge for growth of agricultural productivity in the face of growing land and water constraints and greater incidence of extreme weather events. In some regions demand is outstripping supply, further eroded by post-harvest losses12. Unless there is growth in productivity, these regions will become increasingly import dependent and vulnerable to variations of global prices. Achieving higher agricultural productivity growth will require relying more on technological progress, through investments in research and development and other public goods13. 7. Fiscally sustainable carry-over stocks held by major grain producers were not large enough to compensate for recent production shocks; this contributed to price spikes, but also re-emphasized the role of trade as a vital mechanism to smooth prices. Historically, temporary supply shortfalls have been compensated by carryover stocks. Past high stock levels in major surplus producing countries reduced the sensitivity of global prices to production shocks. However, large stock levels able to fully offset production shortfalls became fiscally unsustainable. A series of subsequent policy reforms to reduce grain stock levels were undertaken since the 1980s in the US14 and EU. The significant decline in global stocks in early 2000s was also the result of changes in producer income support mechanisms in developed countries. Recently, global stock draw-downs, particularly in Asia, compensated for some of the production shortfalls with overall stocks falling below 20 percent of consumption by 2006/07 (Figure 2). The role of trade in smoothing global food prices is even more important when national grain stock levels as a whole are low as more countries need to enter the market as net buyers. 8. The world grain stock-to-use ratio is often cited as both a measure of the physical liquidity of grain markets and an indicator of the likelihood of grain price increases. Historical evidence suggests that grain prices spike when global stock-to-use ratios are low15. Both FAO and USDA publish stock-to-use estimates. They reflect the difference between estimated production and carry-over stocks on
10 During 2007-09, biofuels accounted for 9 percent of vegetable oil and coarse grains production globally. 11 FAO (2002): World Agriculture towards 2015/2030: Summary Report. Rome. 12 Post-harvest losses have reduced food production available for consumption by a fairly constant 10-15 percent. As a result they impact average food prices more than price volatility. Reducing losses can lower average prices. However, lack of finance for postharvest loss-reducing technologies often makes it more cost-effective to incur losses than to reduce them, especially when farmers’ have limited access to markets. 13 Investment returns in agricultural research and extension are high in all regions, historically averaging a 43 percent return. Alston, J., Chan-Kang, C., Marra, M., Pardey, P., and Wyatt, T. (2000): A Meta-Analysis of Rates of Return to Agricultural R&D: Ex Pede Herculem? Washington. D.C. International Food Policy Research Institute. 14 Mitchell, D., and Le Vallee, J. (2005): International Food Price Variability: The Implication of Recent Policy Changes. World Bank, Washington, D.C. 15 Wright, B. (2009): International Grain Reserves and Other Instruments to Address Volatility in Grain Markets. World Bank Policy Research Working Paper 5028. Washington, D.C.
Figure 2: Higher world grain consumption, variable supply, and stock draw downs have contributed to the consecutive grain price spikes
10
15
20
25
30
35
40
1,400
1,500
1,600
1,700
1,800
1,900
2,000
Per
cen
t (S
tock
-to-
Use
)
Mil
lion
s M
T (
Con
sum
pti
on, P
rod
uct
ion
)
Stock-to-Use
Production
Consumption

4
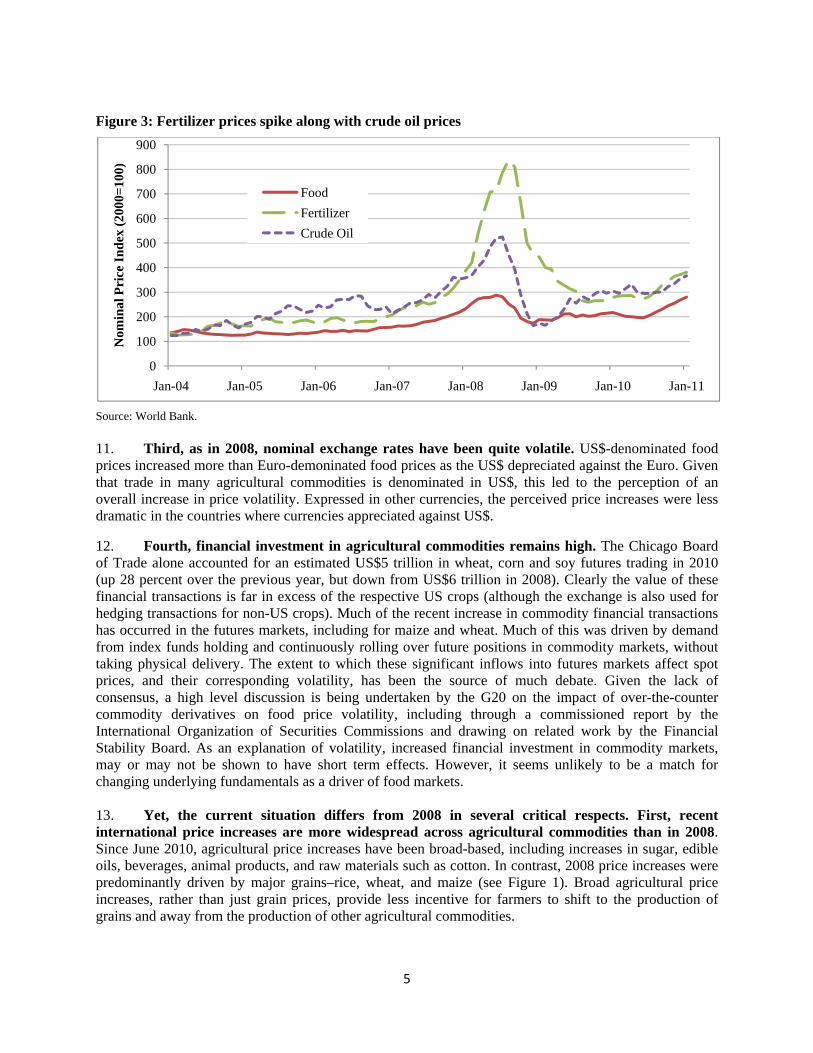
the one hand, and estimated consumption and trade on the other. The stock-to-use measure thus includes (conceptually) all commercial, public and household stocks, whether or not the stocks in question are actually available for international sale. Over half of global stocks of rice and wheat are estimated to be held by China and India, where public sector stocks play a major role16. There is global uncertainty as to the triggers for release or build up of these stocks, their actual magnitudes, and their condition, and it is not clear whether perceptions of these factors are adequately reflected in international prices. International markets, however, are clearly very sensitive to changes in perceptions of stocks likely to be available for sale. When USDA downsized its estimates of US corn production in the Fall of 2010, the upward impact on global corn prices was sharp and immediate. 9. For the time being, stock-to-use ratios for major individual exporters tend to be a better indicator of grain price volatility than global stock-to-use measures. The US, for example, which accounts for 55 percent of global exports of corn, presently has a domestic corn stock-to-use ratio of 5 percent, an all-time low17. This can be compared with a published–and historically ample–global corn stock-to-use ratio of 20 percent. For wheat, France, a major exporter to North Africa, has a 7 percent stock-to-use ratio, which is very low compared to the global stock-to-use ratio of 26 percent. Weather related production disruptions reduced cereal stocks in developed countries by an estimated 25 percent between 2009/10 and 2010/11, in contrast to an increase in stocks in developing countries18. The bottom line is that improvements in understanding of which stocks will actually influence international prices more may themselves help increase market price predictability (see Section VI). 10. The current global grain market situation is similar to 2007-2008 in four respects. First, stocks were lower in both periods, driven by lower production (see Figure 2). Second, higher oil prices have impacted agricultural commodities in both instances. Energy prices, in particular crude oil (which experienced a large price spike in 2008), are rising again. Crude oil prices underpin production costs of agricultural products relying on fertilizers and petroleum, in particular in developed and emerging economies19, and transport costs in many developing countries20. Energy based farm input prices tend to be positively correlated with oil prices. For example, when crude oil prices doubled from January 2005 to July 2008, the world market prices of urea and di-ammonium phosphate increased by 3 and 4.5 times, respectively. The same relationship held from July 2008 to June 2010, when crude oil prices declined by 44 percent, and urea and di-ammonium phosphate prices decreased by about 65 percent. While still much lower than in 2008, prices of major fertilizers (urea, di-ammonium phosphate, and phosphate rock) in February 2011 were at least twice as high as in January 2005, and they have increased along with the rising crude oil price (Figure 3)21. Links between crude oil and agricultural markets have considerably strengthened since 2005, with the pass-through elasticity from crude oil prices to agricultural prices increasing from 0.22 for the pre-2005 period to 0.28 through 200922. Oil markets appear to be more strongly integrated with both agricultural and other major commodity markets. Oil prices have influenced grain prices in the past through production and transport costs and the emergence of demand for biofuels has added an important new channel of effect.
16 USDA made major revisions to its estimates of Chinese stocks in 2001, but this had little impact on global price behavior at the time, possibly because China in 2002/2003 was a significant grain exporter (see Wright 2009, op. cit) 17 USDA (2011): World Agricultural Supply and Demand Estimates, February. Washington, D.C. 18 FAO (2010): Food Prospects and Crop Situation. December 2010. Rome. 19 In US agriculture, the share of the energy-intensive inputs (fertilizers, chemicals and fuel) in total farm production costs increased from 22 percent to 35 percent for corn and from 19 percent to 28 percent for wheat between 1996-00 and 2006-09 (www.ers.usda.gov). 20 In most countries of Sub-Saharan Africa, a 1 percent increase in fuel costs increases transport costs by 0.5 percent, resulting in large increases in farm input costs and drops in farm output prices (see World Bank (2008): Transport Costs and Prices in Africa. Africa Infrastructure Country Diagnostic Working Paper 14, Washington, D.C.). 21 Baffes, J. (2010): More on the Energy/Nonenergy Price Link. Applied Economics Letters 17: 1555-1558. 22 Baffes, J. and T. Haniotis (2010): Placing the 2006/08 Commodity Price Boom into Perspective. The World Bank Policy Research Working Paper 5371, Washington, D.C.
5
Figure 3: Fertilizer prices spike along with crude oil prices
Source: World Bank. 11. Third, as in 2008, nominal exchange rates have been quite volatile. US$-denominated food prices increased more than Euro-demoninated food prices as the US$ depreciated against the Euro. Given that trade in many agricultural commodities is denominated in US$, this led to the perception of an overall increase in price volatility. Expressed in other currencies, the perceived price increases were less dramatic in the countries where currencies appreciated against US$.
12. Fourth, financial investment in agricultural commodities remains high. The Chicago Board of Trade alone accounted for an estimated US$5 trillion in wheat, corn and soy futures trading in 2010 (up 28 percent over the previous year, but down from US$6 trillion in 2008). Clearly the value of these financial transactions is far in excess of the respective US crops (although the exchange is also used for hedging transactions for non-US crops). Much of the recent increase in commodity financial transactions has occurred in the futures markets, including for maize and wheat. Much of this was driven by demand from index funds holding and continuously rolling over future positions in commodity markets, without taking physical delivery. The extent to which these significant inflows into futures markets affect spot prices, and their corresponding volatility, has been the source of much debate. Given the lack of consensus, a high level discussion is being undertaken by the G20 on the impact of over-the-counter commodity derivatives on food price volatility, including through a commissioned report by the International Organization of Securities Commissions and drawing on related work by the Financial Stability Board. As an explanation of volatility, increased financial investment in commodity markets, may or may not be shown to have short term effects. However, it seems unlikely to be a match for changing underlying fundamentals as a driver of food markets. 13. Yet, the current situation differs from 2008 in several critical respects. First, recent international price increases are more widespread across agricultural commodities than in 2008. Since June 2010, agricultural price increases have been broad-based, including increases in sugar, edible oils, beverages, animal products, and raw materials such as cotton. In contrast, 2008 price increases were predominantly driven by major grains–rice, wheat, and maize (see Figure 1). Broad agricultural price increases, rather than just grain prices, provide less incentive for farmers to shift to the production of grains and away from the production of other agricultural commodities.
0
100
200
300
400
500
600
700
800
900
Jan-04 Jan-05 Jan-06 Jan-07 Jan-08 Jan-09 Jan-10 Jan-11
Nom
inal
Pri
ce I
nd
ex (
2000
=10
0)
Food
Fertilizer
Crude Oil
6
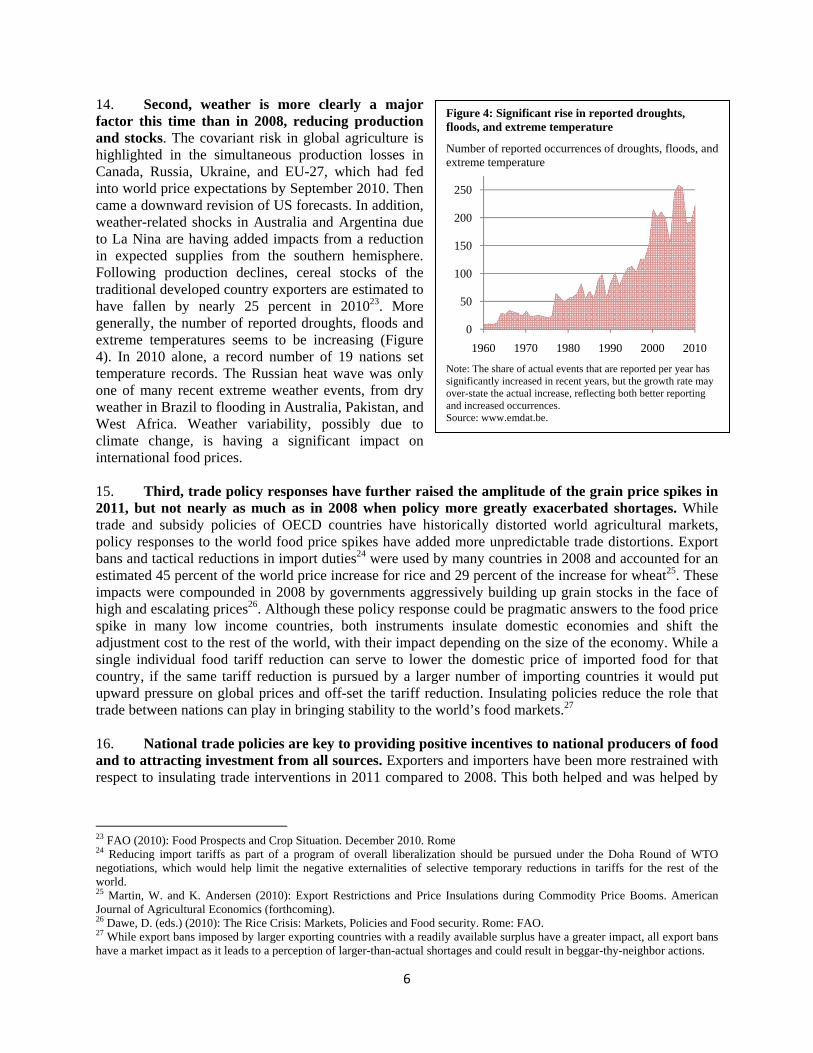
14. Second, weather is more clearly a major factor this time than in 2008, reducing production and stocks. The covariant risk in global agriculture is highlighted in the simultaneous production losses in Canada, Russia, Ukraine, and EU-27, which had fed into world price expectations by September 2010. Then came a downward revision of US forecasts. In addition, weather-related shocks in Australia and Argentina due to La Nina are having added impacts from a reduction in expected supplies from the southern hemisphere. Following production declines, cereal stocks of the traditional developed country exporters are estimated to have fallen by nearly 25 percent in 201023. More generally, the number of reported droughts, floods and extreme temperatures seems to be increasing (Figure 4). In 2010 alone, a record number of 19 nations set temperature records. The Russian heat wave was only one of many recent extreme weather events, from dry weather in Brazil to flooding in Australia, Pakistan, and West Africa. Weather variability, possibly due to climate change, is having a significant impact on international food prices. 15. Third, trade policy responses have further raised the amplitude of the grain price spikes in 2011, but not nearly as much as in 2008 when policy more greatly exacerbated shortages. While trade and subsidy policies of OECD countries have historically distorted world agricultural markets, policy responses to the world food price spikes have added more unpredictable trade distortions. Export bans and tactical reductions in import duties24 were used by many countries in 2008 and accounted for an estimated 45 percent of the world price increase for rice and 29 percent of the increase for wheat25. These impacts were compounded in 2008 by governments aggressively building up grain stocks in the face of high and escalating prices26. Although these policy response could be pragmatic answers to the food price spike in many low income countries, both instruments insulate domestic economies and shift the adjustment cost to the rest of the world, with their impact depending on the size of the economy. While a single individual food tariff reduction can serve to lower the domestic price of imported food for that country, if the same tariff reduction is pursued by a larger number of importing countries it would put upward pressure on global prices and off-set the tariff reduction. Insulating policies reduce the role that trade between nations can play in bringing stability to the world’s food markets.27 16. National trade policies are key to providing positive incentives to national producers of food and to attracting investment from all sources. Exporters and importers have been more restrained with respect to insulating trade interventions in 2011 compared to 2008. This both helped and was helped by
23 FAO (2010): Food Prospects and Crop Situation. December 2010. Rome 24 Reducing import tariffs as part of a program of overall liberalization should be pursued under the Doha Round of WTO negotiations, which would help limit the negative externalities of selective temporary reductions in tariffs for the rest of the world. 25 Martin, W. and K. Andersen (2010): Export Restrictions and Price Insulations during Commodity Price Booms. American Journal of Agricultural Economics (forthcoming). 26 Dawe, D. (eds.) (2010): The Rice Crisis: Markets, Policies and Food security. Rome: FAO. 27 While export bans imposed by larger exporting countries with a readily available surplus have a greater impact, all export bans have a market impact as it leads to a perception of larger-than-actual shortages and could result in beggar-thy-neighbor actions.
Figure 4: Significant rise in reported droughts, floods, and extreme temperature
Number of reported occurrences of droughts, floods, and extreme temperature
Note: The share of actual events that are reported per year has significantly increased in recent years, but the growth rate may over-state the actual increase, reflecting both better reporting and increased occurrences. Source: www.emdat.be.
0
50
100
150
200
250
1960 1970 1980 1990 2000 2010
7
higher production in developing countries so far avoiding a price spike in the very thin28 global market for rice and local staples markets in much of Africa, a major difference with 2008. Yet, mandates and other non-price-based policies such as quotas or export bans continue to contribute to price instability. Examples of helpful policies to explore might include tarrification of quantitative barriers or provisions to introduce flexibility in quantitative mandates for biofuels in the face of food price crises. 17. Land and water constraints are beginning to bite. While land and water constraints are not major drivers of price increases in the same sense as weather shocks, they are another long-term factor, like climate change and steady consumption growth that seems to be reducing the resiliency of food systems to cope with short-term shocks. Climate change puts additional pressure on land and water resources. The land frontier is closing across much of the developing world, except for parts of Eastern Europe, Latin America, and some countries in Sub-Saharan Africa. Globally, agricultural area use per person to produce food has declined from 1.30 to 0.72 hectares in the period 1967-0729. Water scarcity is becoming acute in much of the developing world, limiting the future expansion of irrigated agriculture. Countries such as Saudi Arabia have explicit policies to reduce the share of domestic food production, and rely more on imports, due to water constraints. Approximately 1.2 billion people live in river basins with absolute water scarcity30, with the Middle East and North Africa and Asia facing the greatest water shortages, although there are pockets of severe water scarcity in all other regions as well. With continuing demographic pressures, gains in land productivity, sustainable land management, and increased water use efficiency are fundamental to dealing with the drivers of food price volatility over time. 18. A larger share of world exports is being produced in more variable growing conditions. Major expansion of world grain exports in the last twenty years is in large part due to rapid increases in production for exports in the Southern Cone of Latin America, and for domestic use in Asia. More recently, world markets have become more dependent on supplies from the Black Sea region (Kazakhstan, Russia, and Ukraine)31. The world export shares of wheat from the Black Sea region and Latin America doubled from 14 percent to 28 percent in the period between 1990-95 and 2006-10. For corn, the share has more than tripled from 9 percent to 29 percent over the same period32. Yields in these newer export regions are less stable and overall supply and exports more variable than in the traditional breadbasket areas of the developed world where better natural conditions, applications of the most up-to-date technologies, and management practices have increased and stabilized yields (Figure 5). In addition, the increased use of grain for domestic purposes by traditional exporters is further reducing their world export shares. For instance the share of the US corn crop which was used for ethanol production increased from 31 percent in 2008 to a projected 40 percent in 2011 according to the USDA. With the changing geographic distribution of production away from traditional exporters, supply is likely to become more variable over time, contributing to potentially higher global price volatility.
28 Thin market refers to the small number of sellers and volumes traded. 29 Foresight Report (2011). The Future of Food and Farming. The Government Office for Science, London. 30 World Bank (2007): World Development Report 2008: Agriculture for Development. Washington, D.C. 31 Although Kazakhstan is located in Central Asia, for grain exports it is often said to belong to the Black Sea region due to its use of the sea port facilities in Russia and Ukraine for overseas exports. 32 Derived from USDA Production, Supply and Disappearance Database.

8
19. The bottom line is that agricultural commodity price uncertainty and volatility are likely to continue in the foreseeable future, largely due to the persistent uncertainty on the supply side against projected rising demand. The prevailing formal medium term outlook suggests the perpetuation of global prices higher than pre-2007 levels, along with continued high price volatility, driven by fundamental factors (FAO and OECD, with the collaboration of the US Department of Agriculture and the World Bank). More recently, it seems possible that unpredictable events in the Middle East and North Africa and elsewhere could further impact food price levels and their volatility. Over the longer term, it is likely that oil prices and total factor productivity will increasingly influence the fundamentals of food supply and demand and hence shape world food prices. Crude oil prices will exert upward pressure due to increased costs of energy based agricultural inputs, production, and transport, and through increased demand for biofuel feedstock when oil prices rise to levels that lift demand beyond mandated levels.
While biofuels offer a source of renewable energy and possible large new markets for agricultural producers, current biofuels programs have a mixed record of financial viability without subsidies. One recent case that was viable on a significant scale was the use of sugar cane for ethanol in Brazil in the mid-2000s. National biofuels strategies need to be based on a thorough assessment of these opportunities and costs. High input costs place a higher premium on improved farm management practices while inducing development of more cost-effective technologies. Increases in total factor productivity in agriculture will exert downward pressure on global food prices, but will require good business policies, open trade for both imports and exports, and greater investment in agricultural research and extension.
Figure 5: Variability of maize and wheat exports from the Black Sea region and Latin America are more variable than from traditional exporters
Source: USDA.
0
100
200
300
400
500
600
700
800
900
1000
1990/1991 1995/1996 2000/2001 2005/2006 2010/2011
Exp
ort
Vol
um
e In
dex
(19
90/9
1=10
0)
Maize
Black Sea region
Latin AmericaOECD exporters
0
50
100
150
200
250
300
350
400
450
500
1990/1991 1995/1996 2000/2001 2005/2006 2010/2011
Exp
ort
Vol
um
e In
dex
(19
90/9
1=10
0)
Wheat
Black Sea region
Latin America
OECD exporters
9
III. IMPACT ON FOOD SECURITY33 A. Multiple pathways for impact on food security 20. Higher and more volatile food prices hurt food security if they diminish the ability of individuals to access food when they need it. Sudden and strong food price increases make it difficult for households to adjust, eroding purchasing power, reducing calorie intake and nutrition, and pushing more people into poverty and hunger, making it even harder to achieve the first Millennium Development Goal. Higher prices are of the greatest benefit to farmers if they can be relativity certain about them and know about them in time to modify their production strategies, have access to inputs at a cost that is low enough to expand production profitably, and have the resources and knowledge to expand production beyond their own subsistence needs. This was not the case for many of the world’s smallholders in 200834. Rising food prices produced winners and losers among the poor35, and as most of the poor are net buyers of food, losers have outnumbered winners as reflected in recent estimates of the poverty impact of food price rises. The poor bear a disproportionate burden of demand adjustment to rising food prices, particularly women; they typically spend more than half their incomes on food and are the ones most likely to have to curtail consumption in the face of higher prices. 21. The current food price spike has resulted in an estimated net increase of 44 million more people in poverty, with 68 million net food buyers falling below the extreme poverty line, and 24 million net sellers being able to escape poverty36. This adds to the 1.2 billion people already living below the extreme poverty line of US$1.25 a day as they spend a large share of their meager incomes on food and because they have limited coping strategies. Impacts vary across counties. For instance, in Vietnam a net reduction in poverty is expected when food prices rise due to the large share of the rural poor who are net sellers of food. However, in most countries, especially those with large urban populations, the poor are net buyers of food and are adversely affected by price spikes. The impact of global price spikes also varies according to the extent these prices are transmitted locally. In Ethiopia, about 75 percent of food consumption is comprised of local staples that are not traded much internationally (such as sorghum, and teff) dampening the impacts of rising prices of imported cereals. However, some local staples, such as quinoa in Bolivia, that were not traded much internationally have recently become more internationally traded due to new demand from the US and Europe which has significantly increased local prices. Countries like Bangladesh, Cambodia and Zambia, where rice, wheat, maize, and beans comprise between 40 percent and 64 percent of food expenditures37, are more exposed to higher import food prices. Inland cities with poor links to ports and high transport costs are less exposed but their limited integration with world markets is not a solution to the problem either. While limited integration may reduce the impacts of world food price shocks on domestic net consumers during world price surges, it also reduces the pass-through of higher prices to net producers. In addition, domestic prices in isolated markets are typically even more volatile than world prices, exposing consumers to frequent shocks. 22. Impact on consumers: higher prices of food staples lead to higher levels of undernourishment as poor net consumers find themselves unable to purchase the minimum amount of
33 FAO defines food security as a situation that exists when all people, at all times, have physical, social and economic access to sufficient, safe and nutritious food that meets their dietary needs and food preferences for an active and healthy life (FAO (2001): State of Food Insecurity. Rome). 34 Ivanic, M. and W. Martin (2008): Implications of Higher Global Food Prices for Poverty in Low- Income Countries. Agricultural Economics 39:405-416. 35 Wodon, Q., C. Tsimpo, P. Backiny-Yetna, G. Joseph, F. Adoho and H. Coulumbe (2008): Potential Impact of Higher Food Prices on Poverty. World Bank Policy Research Working Paper 4745, Washington, D.C. 36 World Bank (2011): Food Price Watch. February 2011. Washington, D.C. 37 World Bank (2007): World Development Report 2008: Agriculture for Development. Washington, D.C.

10
calories, nutrients and proteins required for their day-to-day activities. Higher food prices have two main effects on net buyers of food: an income effect through decreases in purchasing power of poor households; and a substitution effect through shifts to less nutritious food. The poor have no choice but to reduce their overall food consumption in response to higher prices from levels that are already too low. For those households that are close to subsistence and are already consuming the cheapest sources of calories (e.g., less nutritious food), the substitution possibilities are more limited, and the most vulnerable suffer most. Intra-household discrimination against women and children disproportionately affect their access to food. The 2008 food price spike increased the number of undernourished by an estimated 63 million38. While the global number of undernourished people declined in 2009 from its peak of over 1 billion people in 2008 according to FAO, the recent price increase is again likely to push up the global number of undernourished. Many of the countries negatively impacted are those with high pre-existing levels of malnutrition. Higher food prices also typically induce lower spending on non-food items (such as education and health), lower food consumption, especially meat, dairy products and fish, and shifts to lower-priced and/or lower quality food. As the 2011 global food price increase is more broad-based than in 2008, the options to shift to lower-priced imported foods may be more limited, and the poorest households are likely already consuming the cheapest form of calories39. In addition to lower caloric intake, lower consumption of vitamins and minerals increases micronutrient deficiencies and adds to undernutrition. 23. Even mild forms of undernourishment taxes current and future economic growth. Undernourishment increases mortality and susceptibility to diseases and lowers adult productivity. The resulting declines in cognitive development in children, reduced school performance for school-aged children, increased susceptibility to infection and chronic diseases for children and adults alike, and diminished productivity undermine human capital development critical for future economic growth. Nutritional status during the first 1000 days of a child’s life (between pregnancy until 24 months of age) is critical, and nutritional deprivation in the early years of life have persistent long-term effects into adulthood which is often irreversible 40. Child malnutrition accounts for more than a third of the mortality burden of children under the age of five and malnutrition during pregnancy accounts for more than 20 percent of maternal mortality. A malnourished child has on average a 7 month delay in starting school, a 0.7 grade loss in schooling, and potentially a 10-17 percent reduction in lifetime earnings capacity, with damage to future human capital and potential national GDP losses of 2-3 percent41. Malnutrition is therefore not just a result of poverty, it also causes poverty; and improved nutrition could be a driver of economic growth42. 24. Impact on producers: higher food prices provide an opportunity to produce and invest more, an incentive weakened by higher price volatility and higher input costs. Concern about food security following events in 2008 appears to have led to increased public investment in agricultural public goods in developing countries, at least as measured by the client-driven expansion of the WBG’s agricultural portfolio since 200843. Since prices of staples remained on the order of 25-35 percent higher in many developing countries in 2009 compared to 2006 even when global prices fell44, many farmers had an incentive to increase production. Higher local production allowed developing countries in aggregate to
38 Tiwari, S. and H. Zaman (2010): The Impact of Economic Shocks on Global Undernourishment. World Bank Policy Research Working Paper 5215, Washington, D.C. 39 Skoufias, E., Tiwari, S. and H. Zaman (2011): Can We Rely on Cash Transfers to Protect Dietary Diversity During Crises? Estimates from Indonesia. World Bank Policy Research Working Paper 5548, Washington, D.C. 40 Maluccio, J. , J. Hoddinott, J. Behrman, R. Martorell, A. Quisumbing. and A. Stein (2009): The Impact of Improving Nutrition During Early Childhood on Education among Guatemalan Adults. Economic Journal, 119(537): 734-763. 41 World Bank (2006): Repositioning Nutrition as Central to Development. Washington, D.C. 42 Horton, S. and M. Shekar (2009): Scaling up Nutrition: What Will It Cost? Washington, D.C.: World Bank 43 World Bank (2009): Implementing Agriculture for Development, WBG Agriculture Action Plan 2010-2012. Washington, D.C. 44 World Bank: Food Price Watch. Various issues since January 2009. Washington, D.C.
11
enter 2010/11 with higher production (3.8 percent), higher stocks (3.4 percent), and more trade (5.4 percent) than in 2009/10 which dampened the pass-through of the recent world food price spike to local prices45. In addition, good harvests of domestic crops in many countries in Sub-Saharan Africa–such as maize, sorghum, millet and cassava–have limited the pass-through of higher global staple prices to local prices, and allowed for substitution away from imported wheat and rice in some of the most vulnerable countries. In Asia, good harvests in Vietnam and Thailand have dampened global rice price increases46. Higher developing country production and consequent stability in local prices in Africa, has so far led to about half the poverty impacts of the 2008 price spike (the net increase of 44 million more people in poverty following the current food price spike compared to 100 million people in 2008)47. Higher prices offer an opportunity for farmers to continue to produce more. However, if higher global food price volatility adds to local volatility, associated production risks may lower supply even with higher average prices48. 25. Links to inflation: food price inflation has accelerated in several low and middle income countries where consumers often spend more than half of their income on food, putting further pressure on the poorest. Food price inflation in the large Asian countries in 2010 ran in the 9-11 percent range, as opposed to non-food price inflation of between 0 and 3 percent49. More than one-third of the countries in Eastern Europe and Central Asia had more than 10 percent food inflation in 2010. The notable exception has been Sub-Saharan Africa, where inflation was mainly driven by non-food prices and where local food prices were kept relatively low by higher agricultural production levels50. Food prices typically account for one third to a half of the Consumer Price Index in developing countries, two to three times more than fuel. Food price rises have fed into overall inflation in several countries. Where this leads to second round effects on prices, countries may tighten monetary policy (as was done in Brazil, India, and China in early 2011), with a potentially negative impact on near term growth and social stability51.
26. Balance of payments impacts: the resurgence of international cereal prices will increase the food import bills of some low income food-deficit countries, putting pressure on their balance of payments. The low income food-deficit countries cereal import bill is projected to increase to US$29.6 billion in 2010/11 (an 11 percent increase over 2009/10), in spite of improved 2010 production and the lower volume of cereal imports required52. North Africa and the Pacific Islands will experience the largest negative impact since they would need to both pay higher prices and import more cereals to meet their required domestic demand. Although the forecasted cereal import bill of these food deficit countries would still be below the record level reached during the 2008 food crisis, the increase in cereal costs combined with that of other food and fertilizer imports by these countries is cause for concern. Countries with a high share of net food and energy imports face current account vulnerabilities.
45 FAO (2010): Food Prospects and Crop Situation. December 2010. Rome. 46 Ibid. 47 World Bank (2011): Food Price Watch. February 2011. Washington, D.C.; Ivanic, M. and W. Martin (2008): Implications of higher global food prices for poverty reduction in low-income countries. Agricultural Economics 39:405-416. The estimates are the poverty impacts due to the price increases. The 100 million estimate for 2008 does not reflect any subsequent reduction in poverty following the food price declines off their 2008 peak. 48 Increased price volatility increases the odds of a price bust, hindering the supply response of food producers given the sunk input costs involved in increasing production and their limited ability to repay debts when prices drop (see Dercon, S. and L. Christiansen: Consumption Risk, Technology Adoption and Poverty Traps. Journal of Development Economics (forthcoming)). 49 From October-November 2009 to October-November 2010, food vs. non-food inflation on average in China was 10.9 percent vs. 0.1 percent, in Indonesia 11.0 percent vs. 0.6 percent, in Bangladesh 9.1 percent vs. 2.9 percent. 50 From October-November 2009 to October-November 2010, food vs. non-food inflation on average in Ghana, for example, was 5.5 percent vs. 11.8 percent and in Uganda -3.7 percent vs. 10.3 percent. 51 International food price increase led to a significant deterioration of democratic intuitions in low income countries, evidenced by an increase in the likelihood of civil conflict and other forms of civil strife. Arezki, R. and M. Bruechner (2011): Food Price and Political Instability. IMF Working Paper, No 11/62. Washington D.C. 52 FAO (2010): Food Prospects and Crop Situation. December 2010. Rome.
12
27. Fiscal impacts: higher food prices can increase pressure on government budgets. Developing countries displayed considerable resilience during the 2008-2009 global food and financial crises in terms of preserving core spending on health, education and infrastructure, but this eroded much of the fiscal space that had been built over a number of years53. For many countries the macroeconomic space to mitigate the effects of the recurrent global food price surge has been reduced as public debt is higher now than it was in 2008 because of the global economic crisis and the countries’ associated response. The fiscal impact of food price increases depends on their impact on food tax revenue and the extent to which expenditures on mitigating measures—such as for social protection programs—are increased. Recurrent food crises are likely to put pressure on governments to shift away from capital accumulation spending to arguably less productive expenditures such as universal producer and consumer subsidies, which can be hard to reverse54. Subsidies in particular are hard to stop once in place, even when no longer needed. Revenue measures such as cuts in import tariffs and lower taxes on food entail further budget costs. B. Regional differentiation in outcomes
28. Aggregate impacts of higher and more volatile food prices vary by region depending on their net food trade position, among other things. Regions dominated by countries that are large net importers of food, such as in the Middle East and North Africa and West Africa, face higher import bills, reduced fiscal space, and greater transmission of world prices to local prices for imported goods such as rice and wheat (see Figure 6). Higher prices have a significant impact on consumers in countries with high shares of household expenditure on food (as in many African and Asian countries), but they don’t necessarily offer smallholders sufficient production incentives. Countries with larger net exports, as in Latin America and Eastern Europe and Central Asia, stand to benefit from higher export revenues and farmer incomes, but with the challenge of ensuring an environmentally sustainable supply response. In addition, net exporters with populations that spend significant shares of household budgets on food face internal pressure to impose export bans or to fix prices. 29. Sub-Saharan Africa (AFR). Cereal imports account for a high share of food consumption in many countries, particularly in West Africa. Sub-Saharan Africa imports about 45 percent of its rice consumption and 85 percent of its wheat consumption. Africa also still carries a high burden of pre-existing maternal and child malnutrition (38 percent of children are stunted) and food price hikes exacerbate the situation further. Ethiopia imports about 8 percent of its staple food consumption, but this accounts for roughly 16 percent of its foreign exchange earnings, leaving limited scope to accommodate higher food import costs55. The food share of household spending for most countries in the region is 50-70 percent, leaving households vulnerable to food price spikes. Recent good harvests, with cereal production increasing an estimated 11 percent in the last year, have so far contributed to making the continent less exposed to the 2011 global food price spike compared to 2008. This higher production continues an annual trend of increased cereal production in the region since the mid-2000s, driven increasingly by yield improvements rather than area expansion. Recent increases in public spending to support agricultural growth will need to be maintained to reduce the risk of production shortfalls when rains are less favorable than in 2010. Trade will continue to remain a vital mechanism to link food surplus and deficit areas in the region. Higher production and regional trade will further increase resilience, reduce dependence on international imports, and improve household incomes. Less energy intensive farm practices have also made production costs less susceptible to rising oil prices compared to middle and high income countries. Continued focus is needed to improve the productivity and competitiveness of smallholder agriculture, as well as to improve the coping strategies of poor households.
53 World Bank and IMF (2010): How Resilient Have Developing Countries Been During the Global Crisis? Development Committee Paper DC 2010-0015. 54 Delgado, C. et al. (2010): Food Security: The Need for Multilateral Action, in S. Fardoust, Y. Kim and C. Sepulveda, eds., Post-crisis Growth and Development: A Development Agenda for the G20. Washington, D.C.: The World Bank: 383-425. 55 World Bank (2007): World Development Report 2008: Agriculture for Development. Washington, D.C.

13
Figure 6: Countries’ vulnerability to global food price shocks tracked by share of cereal imports in domestic consumption and food share in household expenditure
Note: While the two dimensions reflected in the above figure are important contributors to vulnerability, other factors include whether a country has a safety net program in place and fiscal space to scale it up and mitigate impacts on the poor. Source: FAOSTAT for net cereals import as a share of consumption, and USDA for food share in household expenditure.
Albania
Angola
Argentina
Armenia
Australia
Austria
Azerbaijan
BangladeshBelarus
Belgium
BeninBolivia
Bosnia and Herzegovina
Botswana
Brazil
Brunei
Bulgaria
Burkina Faso
Burundi
Cambodia
Cameroon
Canada
Cape Verde
CAR
Chad
Chile
China
Colombia
Congo
Côte d'Ivoire
Croatia
Czech Republic
DRC
Denmark
EcuadorEgypt
Estonia
Ethiopia
Finland
France
Gabon
Gambia
Georgia
Germany
Ghana
Guinea
Guinea‐Bissau
Hungary
India
Indonesia
Iran Ireland
Israel
Italy
Japan
Jordan
Kazakhstan
Kenya
Kyrgyzstan
Laos
Latvia
Lebanon
Lesotho
Liberia
Lithuania
Luxembourg Madagascar Malawi
Malaysia
Mali
Malta
Mauritania
Mauritius
Mexico
Mongolia
Morocco
Mozambique
Namibia
Nepal
Netherlands
New Zealand
NigerNigeria
Norway
Pakistan
Paraguay
Peru
Philippines
Poland
PortugalRepublic of Korea
Moldova
Romania
Russia
Rwanda
Saudi Arabia
Senegal
Serbia
Sierra Leone
Slovakia
Slovenia
South Africa
Spain
Sri Lanka
Sudan
Swaziland
Sweden
Switzerland
Syria
Tajikistan
Thailand
Togo
Tunisia
Turkey
Uganda
Ukraine
United Kingdom
Tanzania
USA
Uruguay
Venezuela
Viet Nam
Yemen
ZambiaZimbabwe
‐200
‐150
‐100
‐50
0
50
100
0 10 20 30 40 50 60 70
Net Cereal Impo
rts a
s a Sha
re of C
onsumption (%
)
Food Share of Household Expenditure (%)
AFR
LCR
ECAASIA
MNA
(Developed Countries) (Developing Countries)
(Net Exporters)
(Net Im
porters)
14
30. South Asia and East Asia Regions. Both South and East Asia show remarkable consistency in terms of net cereal imports as a share of consumption and food share of household spending (Figure 6), resulting in one small cluster covering both regions. They are on average self-sufficient as a group in rice, thanks to the Green Revolution56, and the share of food in total expenditures remains high. It is important to remember that the small Asian cluster in Figure 6 accounts for about 55 percent of the world’s population. 31. Throughout South Asia (SAR), where the majority of the world’s poorest people reside, sudden and dramatic increases in food prices can have significant impacts at both the macroeconomic and household levels, as documented for the 2008 food price spike57. Loss of income, through terms of trade losses combined with higher inflation, adversely affected macroeconomic stability in 2008, via budgetary effects of growing subsidy burdens and safety net requirements, and balance of payments effects in net food importing countries. The share of food consumption in total expenditure is about 40 percent, leaving the large mass of poor households especially vulnerable to price spikes. A dual approach of raising agricultural productivity and earned income, coupled with targeted safety nets, is needed to deal with hunger. 32. East Asia and the Pacific (EAP) dominates the global rice market, with over 50 percent of global rice exports coming from Thailand and Vietnam, and with Indonesia and the Philippines having high risk of unpredictable and large imports. With this, the region includes both significant rice exporters (Thailand, Vietnam, Cambodia), and significant rice importers (Philippines, Indonesia, the Pacific Islands). China is largely self-sufficient in rice, but imports and exports grains from time to time, with noticeable impact on global markets in the case of imports and sometimes exports (as in 2002/03). The labor intensive industrial growth strategies common in East Asia are especially dependent for success on keeping the price of the main food items low, as they have been shown to drive relative labor costs and thus influence competitiveness58. The challenge is to shift to more environmentally sustainable production systems in the context of increasing land and water scarcity59. 33. Latin America and the Caribbean (LCR): While the region is more urbanized than others, it has favorable natural resource endowments, providing the potential to not only meet domestic demand, but also contribute to global food security by significantly expanding agricultural exports. However, the region’s agricultural production is affected by natural disasters. Just in January 2011, Mexico’s cold wave damaged 1.5 million hectares (or 4 million metric tons) of white corn (for tortillas) and over 80 percent of green vegetable crops for export. Households in the region spend a lower share of a higher income on food on average than in Asia and Africa. The extent of vulnerability is largely tracked by the net food trade situation that in this case also happens to be collinear with a country’s small size, weak fiscal position, and poverty. The most vulnerable countries (El Salvador, Grenada, Haiti, Suriname and St. Vincent and the Grenadines) are fiscally constrained, highly dependent on cereal imports, and have lower-quality social protection programs. In contrast, agricultural powerhouses (Argentina, Brazil, and Uruguay), benefiting from higher international food prices, are expected to provide a surplus. 34. Europe and Central Asia (ECA): Tajikistan, the Kyrgyz Republic, Albania, and Moldova are all grain importers with high food budget shares and, thus, vulnerable to rising international food prices. For example, in the Kyrgyz Republic and Tajikistan, local wheat prices in December 2010 were 54
56 Borluag, N. (2000): The Green Revolution Revisited and the Road Ahead. 30th Special Anniversary Lecture, Norwegian Nobel Institute, Oslo, September 8. 57 Ahmed, S. and Jansen, H. (2010): Managing Food Price Inflation in South Asia. The University Press. 58 Mellor, J. ed. (1995): Agriculture on the Road to Industrialization. Baltimore, MD: The Johns Hopkins University Press. 59 Christiansen, L. (2007): Special Focus: Agriculture for Development, East Asia and Pacific Update. November 2007, Washington, D.C.: The World Bank.

15
percent and 37 percent respectively higher than in June 2010. For large agricultural exporters (Kazakhstan, Russia, and Ukraine), the increase in commodity prices improves the terms of trade position; they can also further contribute to meeting global food demand. However, similar to net exporting countries from LAC, net exporters in ECA with populations that spend significant shares of household budgets on food, face continued internal pressure to impose export bans or to fix prices. 35. Middle East and North Africa (MNA): MNA is highly exposed to rising food prices, as countries in the region rely on food imports for at least 50 percent of domestic consumption. The most vulnerable countries are Jordan, Yemen, Djibouti, and Tunisia, countries with weak fiscal positions and a large dependence on food imports, facing both high food price and quantity risks. Countries such as Syria and Morocco face lower quantity risk due to higher domestic production levels. Oil exporters have the advantage that rises in oil prices pay for increases in food import bills, as the two prices tend to move together (see Figure 3). Recent events in the region add to the uncertainty. IV. WORLD BANK EMERGENCY AND SHORT-TERM RESPONSES TO FOOD CRISES 36. The World Bank’s Post-Crisis Directions paper (2010)60 stresses the importance for the WBG of helping clients manage risk and prepare for crises. Responses to the issues of food insecurity from high and volatile prices involve both short-term responses, including emergency assistance, and more strategic longer-term interventions. The present section focuses on the former, (specifically on Global Food Crisis Response Program, Rapid Social Response Program, Japan Social Development Fund targeted to low income countries), while the latter is dealt with in Sections V and VI. A. Global Food Crisis Response Program
37. The 2008 food price crisis provided an opportunity for the WBG to refocus on a set of issues that had not been at the forefront of urgent policy concerns since the mid 1970s. These short-term responses involved lowering the cost of food through cutting of import tariffs while maintaining key social sector programs, improving access to food through targeted cash and food aid transfers, and stimulating short-term food supply while dampening the effect of fuel and fertilizer price spikes that were twice as high as the grain price spikes. The objectives of WBG actions starting in 2008 were expressed in the Framework Document of the Global Food Crisis Response Program (GFRP), approved by the Board of Executive Directors on May 29, 200861. The objectives are:
(i) Reduce the negative impact of high and volatile food prices on the lives of the poor in a timely
manner. (ii) Support governments in the design of sustainable policies that mitigate the adverse impacts of
high and volatile food prices. (iii) Support broad-based growth in productivity and market participation in agriculture to ensure an
adequate supply response as part of a sustained improvement in food supply. 38. When established in May 2008, the GFRP was an institutional innovation in emergency response that built on prior experience in dealing with avian influenza. It focused on speed of response in providing policy advice and financial support. This was achieved through a set of expedited procedures for Board approval of projects. Identification and preparation of project responses needed to align to a pre-agreed “framework” that specified possible interventions. The Board approved an additional US$200 million in grant funds for the poorest and most vulnerable countries out of the IBRD Surplus
60 World Bank (2010): New World, New World Bank Group: (I) Post-Crisis Directions. Development Committee, Washington, D.C. 61 World Bank (2008): Framework Document for A Global food Crisis Response Program. Washington, D.C.
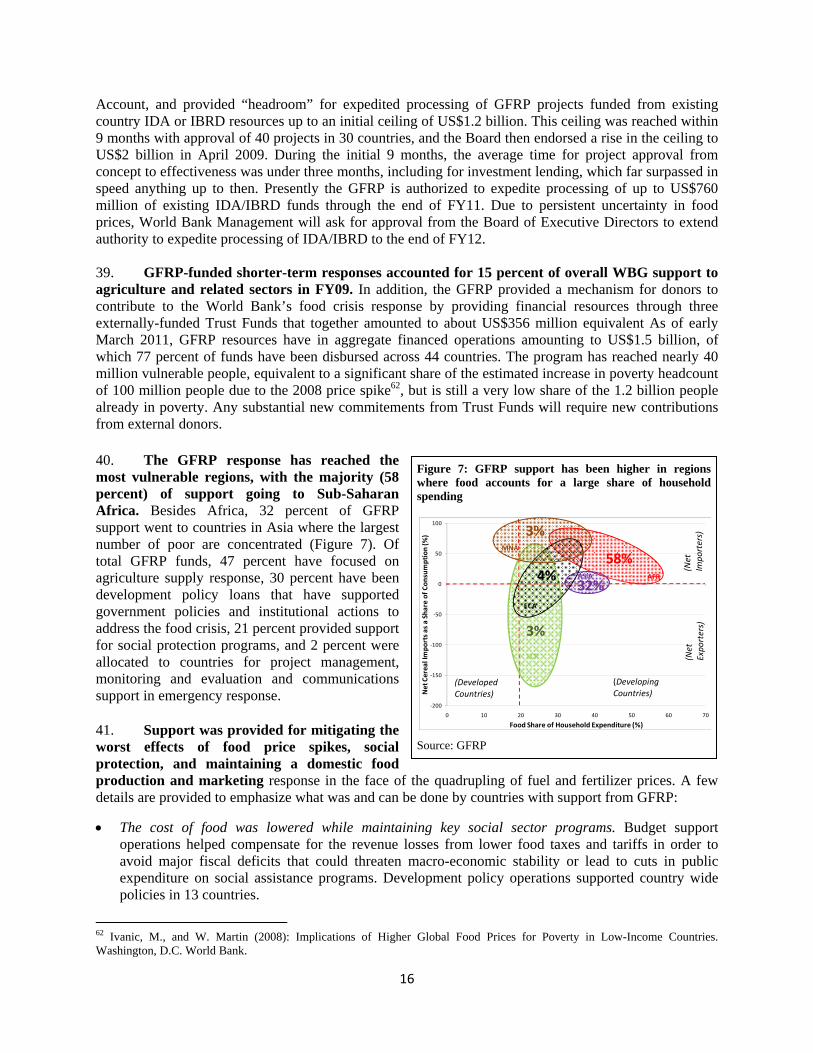
16
Account, and provided “headroom” for expedited processing of GFRP projects funded from existing country IDA or IBRD resources up to an initial ceiling of US$1.2 billion. This ceiling was reached within 9 months with approval of 40 projects in 30 countries, and the Board then endorsed a rise in the ceiling to US$2 billion in April 2009. During the initial 9 months, the average time for project approval from concept to effectiveness was under three months, including for investment lending, which far surpassed in speed anything up to then. Presently the GFRP is authorized to expedite processing of up to US$760 million of existing IDA/IBRD funds through the end of FY11. Due to persistent uncertainty in food prices, World Bank Management will ask for approval from the Board of Executive Directors to extend authority to expedite processing of IDA/IBRD to the end of FY12. 39. GFRP-funded shorter-term responses accounted for 15 percent of overall WBG support to agriculture and related sectors in FY09. In addition, the GFRP provided a mechanism for donors to contribute to the World Bank’s food crisis response by providing financial resources through three externally-funded Trust Funds that together amounted to about US$356 million equivalent As of early March 2011, GFRP resources have in aggregate financed operations amounting to US$1.5 billion, of which 77 percent of funds have been disbursed across 44 countries. The program has reached nearly 40 million vulnerable people, equivalent to a significant share of the estimated increase in poverty headcount of 100 million people due to the 2008 price spike62, but is still a very low share of the 1.2 billion people already in poverty. Any substantial new commitements from Trust Funds will require new contributions from external donors.
40. The GFRP response has reached the most vulnerable regions, with the majority (58 percent) of support going to Sub-Saharan Africa. Besides Africa, 32 percent of GFRP support went to countries in Asia where the largest number of poor are concentrated (Figure 7). Of total GFRP funds, 47 percent have focused on agriculture supply response, 30 percent have been development policy loans that have supported government policies and institutional actions to address the food crisis, 21 percent provided support for social protection programs, and 2 percent were allocated to countries for project management, monitoring and evaluation and communications support in emergency response.
41. Support was provided for mitigating the worst effects of food price spikes, social protection, and maintaining a domestic food production and marketing response in the face of the quadrupling of fuel and fertilizer prices. A few details are provided to emphasize what was and can be done by countries with support from GFRP:
The cost of food was lowered while maintaining key social sector programs. Budget support operations helped compensate for the revenue losses from lower food taxes and tariffs in order to avoid major fiscal deficits that could threaten macro-economic stability or lead to cuts in public expenditure on social assistance programs. Development policy operations supported country wide policies in 13 countries.
62 Ivanic, M., and W. Martin (2008): Implications of Higher Global Food Prices for Poverty in Low-Income Countries. Washington, D.C. World Bank.
Figure 7: GFRP support has been higher in regions where food accounts for a large share of household spending
Source: GFRP
‐200
‐150
‐100
‐50
0
50
100
0 10 20 30 40 50 60 70
Net Cereal Impo
rts as a Sha
re of C
onsumption (%
)
Food Share of Household Expenditure (%)
AFR
LCR
ECA
ASIA
MNA
(Developed Countries)
(Developing Countries)
(Net
Expo
rters)
(Net
Impo
rters)
58%
32%4%
3%
3%
17
Targeted cash and food transfers improved access to food. A total of 5.6 million people have been reached through social protection interventions. For example, a total of 381,874 people were employed as part of cash or food for work programs; 390,886 children benefitted from school feeding programs; 287,503 pregnant and lactating women received nutritional supplements and education; and 582,434 children received nutritional interventions. Income effects of cash transfers have been substantial.
Support for agricultural supply response. Support was provided to improve immediate farmer access to inputs, rehabilitation of irrigation, and farm advisory services (e.g. extension). In this context, 5.9 million farm households had improved access to inputs63.
Technical support was provided to countries: The food crisis provided an opportunity to engage on broader policy issues, including support for: (i) shifting to more sustainable support mechanisms; (ii) less distorting arrangements for food imports; and (iii) progress on the long-term social protection agenda.
42. The WBG short-term emergency response mechanisms are in place, drawing on lessons from the 2008 food price crisis response, complementing the WBG’s core focus on the longer-term agenda. The GFRP provided rapid response to the most vulnerable countries following the 2008 food price spike and is in place to provide support. Presently the GFRP is authorized to make new commitments through the end of FY11. The experience of the GFRP shows that the WBG can: (i) provide rapid response, (ii) target vulnerable households in vulnerable regions, (iii) initiate supply response, (iv) implement multi-sectoral programs across the Human Development, Sustainable Development, and Poverty Reduction and Economic Management Networks, and (v) mitigate the impacts of a crisis in a cost-effective way. Lessons from GFRP are being used to inform design of emergency response projects, which include:
Budget support. Soaring food and fuel prices in 2008 led to significant public revenue losses and pressure on the commitment to public spending on key social sector programs. Budget support operations, following the Bank policy on Development Policy Operations, provided the most rapid form of support to mitigate the impact of soaring food prices on the population, especially in more vulnerable countries64. Trade-offs between speed and targeting accuracy (and associated instrument choice) remain significant issues that can be partially addressed by better preparation ahead of crises.
Social protection. Significant attention must be given to targeting and scalability in program design, including working through existing programs and institutions, using existing databases on poverty, including its gender dimension, and knowledge of partners with deeper field presence. Given the emergency response nature of GFRP-type operations, targeting could not in many cases be as accurate as that for longer-term safety net programs, but the engagement of local civil society organizations to assist implementation of operations in a number of instances greatly improved GFRP targeting. Furthermore, monitoring systems helped determine if support was actually reaching the intended beneficiaries. During stable times, it is crucial to develop safety net systems capable of responding flexibly to shocks. In low-income countries the WBG should further accelerate institution building since a step by step process of simple but well-considered programs may be necessary to build the institutions that will serve the country over time. To expand the participation of women, cash or food for work programs must consider the culture of communities and the specific constraints on women’s physical abilities and time (including child care). Cash or food for work programs that
63 World Bank (2010): Global Food Crisis Response Program (GFRP): Fourth Progress Report. December 2010. Washington, D.C. 64 For example, budget support provided fiscal space that permitted up to a 20 percent reduction of tariffs on key food items in Sierria Leone; suspension of customs duties and taxes that reduced food costs by 32 percent in Burundi; and removal of a consumption tax which lowered the cost of food by 8 percent in Djibouti.
18
develop infrastructure should also consider implications for maintenance, and opportunities to develop skills in the types of work selected (e.g. road paving). Physical food transfers need to be exempted from arbitrary movement restrictions that tend to creep up in rural areas in times of crisis. Cash transfers combined with nutritional services are effective ways to mitigate the effects on the nutritional status of the poor. Results from a recent IEG survey indicate that only 16 percent of developing countries’ social safety nets were well positioned to respond to the food, fuel and financial crises by being able to identify and reach affected poor households. Currently, 80 percent of countries have plans to strengthen social safety nets to better respond to future crises.
Agricultural supply response. Given the seasonal nature of production, matching the timing of implementation to the agricultural season is critical but is not always easy to do with recipient executed projects that are time consuming to set up even under expedited procedures. Demand estimates for fertilizer and seeds need to be periodically reviewed in an environment of rapidly changing inputs prices to prevent waste from overestimates and constrained impacts from underestimates. Provision of inputs worked best when it mobilized the private sector (through vouchers, for example) and is complemented by regulations and investment, to reduce logistical overheads, especially in ports and on roads (Box 1). Reducing distribution costs proved essential to programs that underwrote part of the costs of fertilizers delivered to farmers, the prices of which quadrupled on international markets in 2008. As emergency response often requires rapid importation of seeds and fertilizers, sometimes across more than one international border, anticipating and enlisting policy support for dealing with potential bottlenecks that restrict delivery to the national border proved essential.
Box 1: Market smart fertilizer subsidies as a short-term response
In recent years, many governments in developing countries have increased their spending on fertilizer subsidies in order to raise food production. When subsidies are used as part of a broader strategy to address the binding constraints of food supply, well-designed market smart fertilizer subsidies could play a positive role in boosting short-term supply. Market smart fertilizer subsidies are designed to avoid the negative impacts often associated with past subsidy programs by: (i) contributing to the development of a viable and competitive private-sector-led fertilizer market; (ii) targeting resource-poor farmers unable to afford fertilizers to encourage their incremental use and prevent displacement of commercial sales; (iii) encouraging an economically efficient use of different inputs, by not distorting their relative prices; and (iv) ensuring a time-bound provision with a clear exit-strategy. Only those programs whose design meets the above requirements are considered a justified option to increase short-term supply while encouraging the development of sustainable input markets. Market smart fertilizer subsidy programs are at an early stage of implementation with ongoing monitoring to track the extent to which these design elements have been maintained during implementation, and to be sure that the governance risks are being adequately managed.
Cross-cutting lessons. Simple design greatly facilitates rapid response. Strong partnerships with other local actors, particularly in fragile settings, are important for rapid implementation (as demonstrated from the implementation of GFRP operations by CSOs in 16 countries, and UN agencies such as World Food Programme (WFP), UNICEF and FAO in 8 countries), but mutual obligations needs to be clearly defined upfront. Effective communication channels and a high level of government commitment is essential. Emergency operations also provided an opportunity for crafting longer-term responses to vulnerability.
Policy trade-offs. Response to emergencies should not undermine longer-term development objectives. Immediate interventions to lower domestic food prices through export bans or price fixing had a limited impact on domestic price levels, yet a significant negative effect on the earning
19
capacities of farmers and exporters. Poorly targeted safety nets or universal food subsidies had significant fiscal costs and probably did not help many needy people. On the other hand, targeted safety nets and well-designed programs to enhance agricultural production and crowd in private sector had a positive impact, and likely increased resilience to future shocks.
B. Rapid Social Response Program and Japan Social Development Fund Emergency Window
43. Rapid Social Response Program. Given the shared need to promote a global response to the social impact of the crisis in developing countries, the World Bank established the Rapid Social Response (RSR) Program in November 2009 as part of its overall crisis response framework. The objectives of the RSR Program are to safeguard lives and livelihoods during the global crises by promoting social protection measures such as social safety nets and maintaining access to basic health, education, and other vital services for communities, especially poor and vulnerable groups, in middle and low-income countries. The RSR Program leverages the World Bank’s own resources through IBRD and IDA, and donor resources through the RSR Multi-donor Trust Fund of US$58 million and the RSR Catalytic Trust Fund (DfID) of US$3 million. To date, US$40.6 million has been allocated under the two Trust Funds, of which US$6.5 million will support nutrition interventions (16 percent of total allocated amount) through operations in seven countries (Ethiopia, Gambia, Yemen, Haiti, India, Democratic Republic of Congo and Rwanda) and two technical assistance projects. 44. Japan Social Development Fund Emergency Window. This window was created in November 2009 to support activities aligned with the objectives of the GFRP and RSR. The window provides financing of US$200 million over 3 years (FY10-12), of which US$50 million was provided in FY10, US$50 million is available in FY11, and the remaining US$100 million will be provided in FY12. The maximum grant size is US$8 million and grants may be used to: (i) scale up or replicate successful JSDF-supported initiatives in areas associated with the RSR and/or GFRP; (ii) complement World Bank initiatives (IBRD/IDA loans, credits or grants) under the RSR and/or GFRP; and (iii) address RSR and/or GFRP associated issues in IBRD/IDA-eligible countries where there is no related IBRD/IDA-financed activity. To date, US$34 million has been approved under the JSDF Emergency Window, of which US$7 million in grants have been allocated to three GFRP aligned projects (20 percent of total JSDF Emergency Window approved amount), with the remainder allocated to projects responding to the economic crisis.
V. WORLD BANK LONGER-TERM AND STRATEGIC RESPONSE 45. The WBG's longer-term response to the 2008 food crisis drew on the experiences gleaned through the short-term programs above, the World Development Report 2008 on Agriculture for Development, and the evaluation of projects in the WBG regular program. The longer-term response accounted for 85 percent of the WBG program for agriculture and related sectors in FY09, and continues to account for the greatest share of support for agriculture and food security. This reinforces the importance the WBG places on longer-term investments to improve food security. Results of the WBG’s support are helping stimulate a sustainable supply response, improve country resilience, facilitate trade, and raise household incomes. FAO estimates, based on examination of a recent 10 year period, that 86 percent of food consumed in developing countries on average, is produced in the country of consumption65. This needs to be considered in the context of the fundamental premises discussed in Section II above–that food price volatility is (increasingly likely) driven by supply shocks from climate change and tighter natural resource constraints, against a background of modest but steady growth in demand, where the stocks of the main exporters are low. While a few of the big and technology intensive exporters such as the United States still retain significant capacity to expand production in the near to mid-term, there is no substitute for improving food production and marketing in most developing
65 FAO (2010): The State of World Food Insecurity 2009. Rome: FAO.
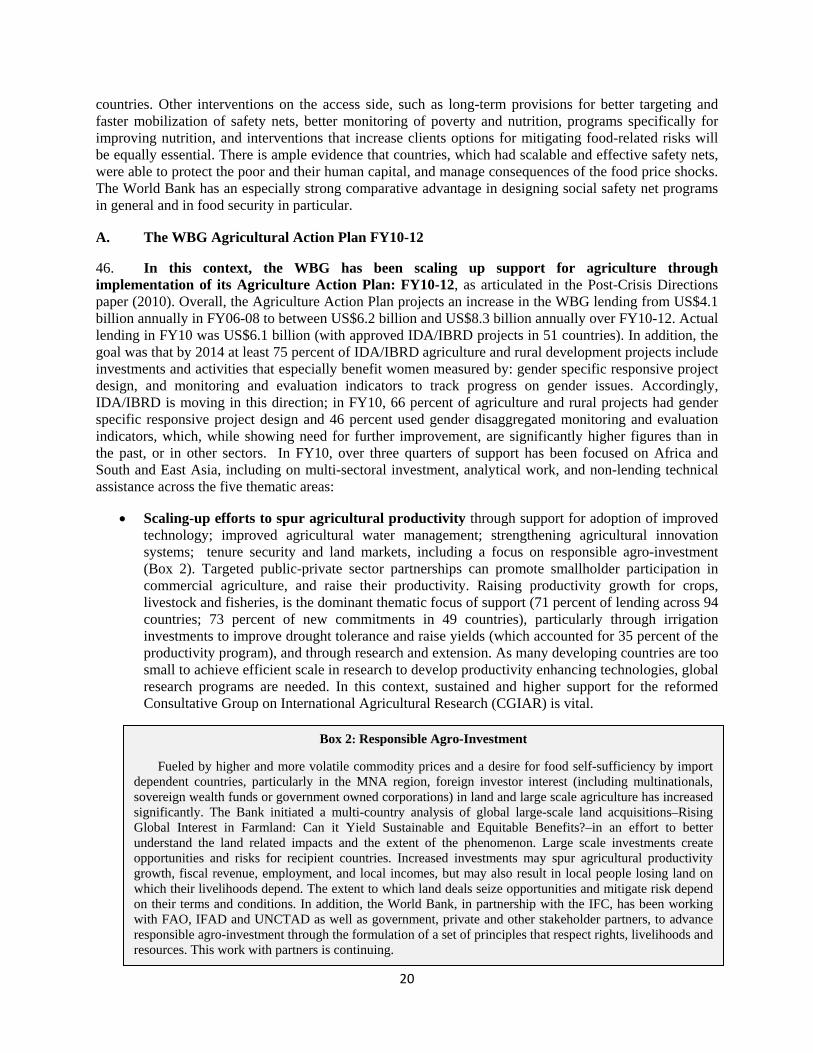
20
countries. Other interventions on the access side, such as long-term provisions for better targeting and faster mobilization of safety nets, better monitoring of poverty and nutrition, programs specifically for improving nutrition, and interventions that increase clients options for mitigating food-related risks will be equally essential. There is ample evidence that countries, which had scalable and effective safety nets, were able to protect the poor and their human capital, and manage consequences of the food price shocks. The World Bank has an especially strong comparative advantage in designing social safety net programs in general and in food security in particular. A. The WBG Agricultural Action Plan FY10-12 46. In this context, the WBG has been scaling up support for agriculture through implementation of its Agriculture Action Plan: FY10-12, as articulated in the Post-Crisis Directions paper (2010). Overall, the Agriculture Action Plan projects an increase in the WBG lending from US$4.1 billion annually in FY06-08 to between US$6.2 billion and US$8.3 billion annually over FY10-12. Actual lending in FY10 was US$6.1 billion (with approved IDA/IBRD projects in 51 countries). In addition, the goal was that by 2014 at least 75 percent of IDA/IBRD agriculture and rural development projects include investments and activities that especially benefit women measured by: gender specific responsive project design, and monitoring and evaluation indicators to track progress on gender issues. Accordingly, IDA/IBRD is moving in this direction; in FY10, 66 percent of agriculture and rural projects had gender specific responsive project design and 46 percent used gender disaggregated monitoring and evaluation indicators, which, while showing need for further improvement, are significantly higher figures than in the past, or in other sectors. In FY10, over three quarters of support has been focused on Africa and South and East Asia, including on multi-sectoral investment, analytical work, and non-lending technical assistance across the five thematic areas:
Scaling-up efforts to spur agricultural productivity through support for adoption of improved technology; improved agricultural water management; strengthening agricultural innovation systems; tenure security and land markets, including a focus on responsible agro-investment (Box 2). Targeted public-private sector partnerships can promote smallholder participation in commercial agriculture, and raise their productivity. Raising productivity growth for crops, livestock and fisheries, is the dominant thematic focus of support (71 percent of lending across 94 countries; 73 percent of new commitments in 49 countries), particularly through irrigation investments to improve drought tolerance and raise yields (which accounted for 35 percent of the productivity program), and through research and extension. As many developing countries are too small to achieve efficient scale in research to develop productivity enhancing technologies, global research programs are needed. In this context, sustained and higher support for the reformed Consultative Group on International Agricultural Research (CGIAR) is vital.
Box 2: Responsible Agro-Investment
Fueled by higher and more volatile commodity prices and a desire for food self-sufficiency by import dependent countries, particularly in the MNA region, foreign investor interest (including multinationals, sovereign wealth funds or government owned corporations) in land and large scale agriculture has increased significantly. The Bank initiated a multi-country analysis of global large-scale land acquisitions–Rising Global Interest in Farmland: Can it Yield Sustainable and Equitable Benefits?–in an effort to better understand the land related impacts and the extent of the phenomenon. Large scale investments create opportunities and risks for recipient countries. Increased investments may spur agricultural productivity growth, fiscal revenue, employment, and local incomes, but may also result in local people losing land on which their livelihoods depend. The extent to which land deals seize opportunities and mitigate risk depend on their terms and conditions. In addition, the World Bank, in partnership with the IFC, has been working with FAO, IFAD and UNCTAD as well as government, private and other stakeholder partners, to advance responsible agro-investment through the formulation of a set of principles that respect rights, livelihoods and resources. This work with partners is continuing.
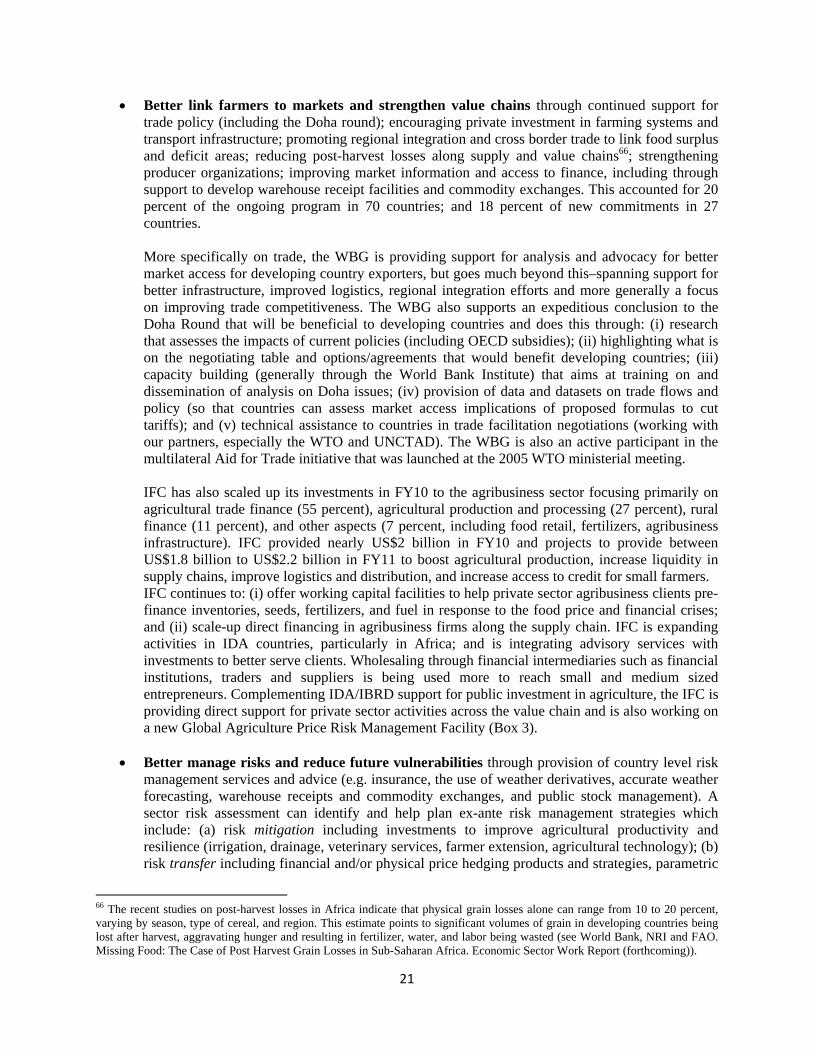
21
Better link farmers to markets and strengthen value chains through continued support for trade policy (including the Doha round); encouraging private investment in farming systems and transport infrastructure; promoting regional integration and cross border trade to link food surplus and deficit areas; reducing post-harvest losses along supply and value chains66; strengthening producer organizations; improving market information and access to finance, including through support to develop warehouse receipt facilities and commodity exchanges. This accounted for 20 percent of the ongoing program in 70 countries; and 18 percent of new commitments in 27 countries. More specifically on trade, the WBG is providing support for analysis and advocacy for better market access for developing country exporters, but goes much beyond this–spanning support for better infrastructure, improved logistics, regional integration efforts and more generally a focus on improving trade competitiveness. The WBG also supports an expeditious conclusion to the Doha Round that will be beneficial to developing countries and does this through: (i) research that assesses the impacts of current policies (including OECD subsidies); (ii) highlighting what is on the negotiating table and options/agreements that would benefit developing countries; (iii) capacity building (generally through the World Bank Institute) that aims at training on and dissemination of analysis on Doha issues; (iv) provision of data and datasets on trade flows and policy (so that countries can assess market access implications of proposed formulas to cut tariffs); and (v) technical assistance to countries in trade facilitation negotiations (working with our partners, especially the WTO and UNCTAD). The WBG is also an active participant in the multilateral Aid for Trade initiative that was launched at the 2005 WTO ministerial meeting. IFC has also scaled up its investments in FY10 to the agribusiness sector focusing primarily on agricultural trade finance (55 percent), agricultural production and processing (27 percent), rural finance (11 percent), and other aspects (7 percent, including food retail, fertilizers, agribusiness infrastructure). IFC provided nearly US$2 billion in FY10 and projects to provide between US$1.8 billion to US$2.2 billion in FY11 to boost agricultural production, increase liquidity in supply chains, improve logistics and distribution, and increase access to credit for small farmers. IFC continues to: (i) offer working capital facilities to help private sector agribusiness clients pre-finance inventories, seeds, fertilizers, and fuel in response to the food price and financial crises; and (ii) scale-up direct financing in agribusiness firms along the supply chain. IFC is expanding activities in IDA countries, particularly in Africa; and is integrating advisory services with investments to better serve clients. Wholesaling through financial intermediaries such as financial institutions, traders and suppliers is being used more to reach small and medium sized entrepreneurs. Complementing IDA/IBRD support for public investment in agriculture, the IFC is providing direct support for private sector activities across the value chain and is also working on a new Global Agriculture Price Risk Management Facility (Box 3).
Better manage risks and reduce future vulnerabilities through provision of country level risk
management services and advice (e.g. insurance, the use of weather derivatives, accurate weather forecasting, warehouse receipts and commodity exchanges, and public stock management). A sector risk assessment can identify and help plan ex-ante risk management strategies which include: (a) risk mitigation including investments to improve agricultural productivity and resilience (irrigation, drainage, veterinary services, farmer extension, agricultural technology); (b) risk transfer including financial and/or physical price hedging products and strategies, parametric
66 The recent studies on post-harvest losses in Africa indicate that physical grain losses alone can range from 10 to 20 percent, varying by season, type of cereal, and region. This estimate points to significant volumes of grain in developing countries being lost after harvest, aggravating hunger and resulting in fertilizer, water, and labor being wasted (see World Bank, NRI and FAO. Missing Food: The Case of Post Harvest Grain Losses in Sub-Saharan Africa. Economic Sector Work Report (forthcoming)).

22
and/or traditional insurance or derivative products, and (c) coping including contingent financing, disaster risk financing, fiscal provisioning, and establishment of targeted safety net programs (Box 3), as well as management of public grain reserves (Box 4).
Support for rural non-farm income and sustainable social safety nets to diversify incomes,
andencourage a shift from subsistence into more lucrative and volatile food markets, and greater trade diversification. Support is being provided to develop more innovative insurance products to better protect against recurrent shocks. Support will be aligned to the new World Bank Social Protection Strategy which emphasizes the need to build resilience by helping individuals and families smooth their consumption and handle shocks through: prevention against declines in
Box 3: Managing risks and coping with shocks and new crises
A number of risk management instruments have been developed to assist governments and private sector institutions to better manage their future risks. Included among these are: (i) risk transfer products and catastrophe risk financing solutions, (ii) modernization of meteorological services, and (iii) commodity hedging. In addition, IFC is currently developing a Global Agriculture Price Risk Management Facility.
o Risk transfer products and catastrophe risk financing solutions for governments based on the use of
parametric and other triggers (for example the weather derivative transaction for Malawi, Catastrophic Deferred Draw-down Option for Colombia) are being explored and developed by the World Bank.
o Modernization of meteorological services has been supported by the Bank as part of a broader support
for disaster reduction since the 1990s (e.g. Poland, the Caribbean countries, Turkey, Ecuador, Bangladesh, Kyrgyz Republic and Tajikistan). In addition, the World Meteorological Organization and the World Bank are helping improve national hydrological and meteorological services as part of a more general climate change adaptation strategy.
o Commodity hedging for governments. Since 1999, IBRD has included, as part of its product menu, an “IBRD Commodity Swap” that provides borrowers with the ability to structure repayment of an IBRD loan to a commodity price index. The Bank is exploring institutional interest in expanding the existing financial product line to include intermediation of stand-alone customized commodity hedge transactions on behalf of IBRD/IDA countries. Experience has shown that although many governments are aware of vulnerability to commodity price shocks, specific exposures, and particularly fiscal impacts, are often not properly assessed. To address this issue the World Bank Treasury Department offers customized advisory service to client countries on: (i) risk assessment to identify the specific price exposure and impact on the budget, (ii) analysis of the policy framework, (iii) strengthening the institutional framework, (iv) general review of commodity hedging products, including advantages and disadvantages of different approaches, (v) technical analysis of prototype hedging strategies, (vi) documenting and communicating what the hedging strategy can realistically do, (vii) building capacity of staff and decision-makers, and (viii) transaction execution, monitoring, and back-office support systems.
o IFC’s Global Agriculture Price Risk Management Facility is expected to be a risk sharing facility for over-the-counter price risk management products to be made available by a global financial intermediary to emerging market agriculture-related producers as well as consumer-related entities. In the absence of a facility of this nature, fewer such price risk management products might be available to the targeted clients who otherwise would typically not be large enough to hedge the relevant price risks via exchange-based derivatives. Once a pilot transaction for this product approach is approved by the Board, it would be tested and implemented with a global financial intermediary. Subsequently, we anticipate that the approach could be rolled out to a wider network of international market-makers. At that stage, IFC anticipates that other multilaterals might become involved to risk share in future projects involving the proposed approach, so that its impact could be magnified.
23
well-being from income and expenditure shocks; protection from destitution and losses of human capital (loss of health and education) and promotion of improved opportunities and livelihoods, notably through connection to better jobs and opportunities67.
Enhance environmental services and sustainability accounted for 14 percent of IDA/IBRD
lending and focused on better managed livestock intensification; improved rangeland, watershed, forestry and fisheries management; and support to link improved agricultural practices to carbon markets (to capture the ‘triple win’ of higher productivity, better resilience, and increased soil carbon sequestration).
47. The WBG recognizes the importance of analytical work, and non-lending technical assistance. A more strategic and selective approach to this work is being taken in the context of flat budgets and the significantly scaled up lending. ARD related analytical work and technical assistance is underway in 55 countries. Examples related to food price volatility include: the Initiative for Optimizing Wheat Import Supply Chains in Arab Countries; the recently completed work in South Asia on Managing Food Price Inflation; the ongoing work in ASEAN countries on Policy Reforms, Private Investment in Food Supply Chains, and Cross Border Trade Facilitation; and in Europe and Central Asia on International Grains Reserves and other instruments to address volatility in grain markets.
B. Nutrition 48. As agriculture is necessary68 but often not sufficient to achieve improved nutritional outcomes across all households, our complementary scale-up of nutrition support is helping to further improve resilience of the most vulnerable groups. The WBG is scaling up nutrition investments including on better nutrition education, prenatal and neonatal care, supplements where diets are insufficient, and biofortification. The target group is the highly vulnerable population of pregnant mothers and children under two years of age (the 1,000 most important days in a child’s life) in order to protect future human capital and in general promoting greater linkages between work on agriculture, nutrition and health. Substantial IDA investments in nutrition have been made in Nepal, Bangladesh, Ethiopia, Senegal, Tanzania, Ghana, Guatemala and Peru. Partially in response to the crisis, additional investments are in the pipeline in Bangladesh, Nepal, India, Pakistan, Burkina Faso, Malawi, and Mozambique among others.
67 Building Resilience and Opportunity. The World Bank’s Social Protection and Labor strategy 2011-2022. Concept Note. 68 World Bank (2007): From Agriculture to Nutrition: Pathways, Synergies and Outcomes. World Bank. Washington DC.
Box 4: Management of public grain reserves
Small emergency public grain reserves, related to the consumption needs of the most vulnerable, have an important role to play in alleviating the consequences of high and volatile prices, provided that they are well targeted to this specific purpose (most vulnerable people). In contrast, using stocks as an instrument of domestic price stabilization has proven difficult because of their high costs and governance issues related to when stock releases are made, what triggers them, to whom, and at what price. The unpredictability of releases made for administrative and political reasons has also discouraged private investment in storage. A related set of issues concerns technologies used for handling and storage that affect stock quality. Overall, stocking interventions are not a panacea for addressing variable production and prices. For cost and management reasons, low income countries cannot shield themselves from increased food price volatility primarily through stocking policies, even if they have an important role in targeted interventions for food security. Investments in climate resilient production, trade, and social protection remain essential tools for addressing food price volatility in most countries.
24
49. The Scaling up Nutrition (SUN), a global framework that was launched at the World Bank in Spring 2010, is now supported by more than 100 partner organizations from academia, CSOs, foundations, and bilateral partners such as the UK, US, Japan, Canada, Denmark, the Netherlands, France and others. The SUN’s global consensus document outlines a multi-sectoral approach to addressing malnutrition, targeting the first 1000 days of a child's life (the window of opportunity) and stressing the central role of country ownership to the process of successful scale-up. The SUN is focusing on scaling-up actions in high-burden malnutrition countries across all regions, with the greatest emphasis in Africa and South Asia. The Japan TF supported some of this work and complement the new South Asia Food and Nutrition Security Initiative (SAFANSI), a multi-donor trust fund for South Asia with seed funding from DfID of US$7.5 million and AusAid of at least US$2.9 million, as well as the World Bank’s existing work in Health Systems Strengthening. To date, twelve countries have self-selected as “early riser countries” under the SUN, and the World Bank has been identified as the convening donor in eight of these countries. D. Regional specificities 50. The five thematic areas of the Agriculture Action Plan described in Section A: agricultural productivity; linking farmers to markets and strengthening value chains; better managing risks and reducing future vulnerabilities; support for rural non-farm income and sustainable social safety nets; and enhancing environmental services and sustainability are all important for agricultural growth and food security. However, priorities among thematic areas vary by regions, and across countries within regions. 51. Sub-Saharan Africa: The focus is on two priority areas: improving smallholder competitiveness in high- and medium-potential areas, where returns to investment are highest; and selecting investments in agricultural technologies and natural resource management to improve livelihoods, food security, and environmental resilience in remote and risky environments. A balanced approach of transfers and investments for productivity growth is needed to achieve both national and household food security. This is reflected in the current ongoing IDA/IBRD program in the region with 75 percent focusing on agricultural productivity (with a dominant focus on agriculture research and extension–17 percent–and irrigation and drainage–9 percent). Further emphasis:
Be ready to continue short-term rapid response through GFRP to countries that experience signficant local food price spikes, when requested.
Continue focus on improving the productivity and resilience of smallholder agriculture through support for expansion of irrigated areas, improving rainfed systems, strengthening security of land rights, investing in agricultural research, and development of innovate risk management and financing products (see Box 3).
Continue to invest in logistics infrastructure (ports and rural roads) to better link farmers to markets to improve farmers’ access to inputs and to lower the overall cost of production.
Further efforts to support long-term coping strategies of poor households through sustainable and cost effective social safety nets and scaled-up nutrition programs for women and children, thereby protecting future human capital.
52. South Asia: The focus is on improving agriculture productivity and water management and on developing market chains that exploit new market opportunities. Accordingly, 72 percent of the current IDA/IBRD program in the region focuses on enhancing agricultural productivity (with a dominant focus on irrigation and drainage–40 percent–and on linking farmers to markets–16 percent).
25
Further emphasis: Continue to focus on increasing farm productivity and improving market efficiency to keep
consumer prices low while simultaneously providing adequate farmer incomes, reducing the need for subsidy transfers. Improve water use efficiency (including irrigation modernization and management) to enhance climate resilience.
Continue to support safety nets to protect the poor, including support for non-farm income opportunities through rural livelihoods programs and scaled-up nutrition programs, particularly in India that has the highest rate of malnutrition in the world.
Further efforts to improve the productivity of rainfed agriculture, especially in lagging regions, and to increase agricultural competitiveness with a strong marketing focus.
53. East Asia and the Pacific: While it remains necessary to sustain agricultural productivity in primary agriculture, it will be increasingly important to invest in modernizing farming systems and in improving value chain performance to both diversify smallholder farm income and production away from land intensive staples as urban incomes rise and diets change; and to promote the rural non-farm economy. This is reflected in the current IDA/IBRD program in the region with 60 percent focusing on increasing agricultural productivity (within the productivity program the dominant focus is on irrigation and drainage); 25 percent on improving infrastructure to support diversification of agriculture and of rural economies; and a total of 8 percent to promote rural non-farm income and agribusiness. Further emphasis:
For the emerging middle and high income countries (China, Malaysia, Thailand, Vietnam, Indonesia, and the Philippines): sustainably increase agricultural production and reduce post-harvest loss, increase efficiency of irrigation systems and agricultural product markets, food safety, support climate change mitigation and adaptation opportunities.
For the low income countries (Cambodia, Lao, Myanmar, PNG, Timor): improve the productivity of primary agriculture, better water management, improve the stability of food markets, and target emerging opportunities for agricultural exports to diversify incomes.
For the Pacific Islands: exploit niche opportunities in agriculture and provide assistance to cope with climate change and more volatile food prices.
Further efforts to engage in policy dialogue on options to better manage rice imports and public stocks, and on longer term food policy reforms relying more on trade and private sector involvement.
54. Latin America and the Caribbean: Given the regional diversity of Latin America described in Figure 6, the focus in this region follows a two-pronged approach. While attending to the immediate need of the most vulnerable countries, food producers and exporters will need to focus on enhancing their overall agriculture productivity and food export capacity, and their internal distributional aspects. In the short term, the focus would be on strengthening and expanding cash transfer programs, strengthening linkages between feeding and agriculture programs, management of food price shocks, price risk financing mechanisms such as derivatives and contingent lines of credit, fast track support for quick supply response, and policy dialogue to improve export tariffs and other restrictions. In the medium and long-term, focus will be given on food policy planning, enhancement of agriculture production and productivity, nutrition, building sustainable social safety nets, promoting climate smart agriculture and policy dialogue to facilitate trade expansion. This is in line with the current IDA/IBRD program in the region with 71 percent focusing on increasing agriculture productivity; 13 percent on improving infrastructure and a total of 11 percent to promote rural non-farm income and agribusiness.

26
Further emphasis: For vulnerable countries (Haiti, El Salvador, Grenada, Jamaica, Suriname, and OECS countries):
support food security investment and nutrition programs, enhance integration of local farmers to domestic value chains, improve effectiveness and efficiency of social safety nets, improve functioning of regional and international markets for agriculture commodities, and agriculture disaster response programs.
For the agricultural powerhouses and food producers (Argentina, Brazil, Uruguay): support the alignment of public spending for agricultural production to the current context (SPS, innovation, trade policies), improve trade infrastructure, support agriculture risk management, and promote environmentally sustainable and climate friendly agriculture. Strengthen safety nets to address internal distributional aspects and to reduce internal pressure for agricultural export bans and other export restrictions.
55. Europe and Central Asia: The focus is on making better use of under-utilized high potential land for rainfed production, as well as improving irrigation and drainage systems to improve agricultural productivity, and on better linking farmers to markets through improved standards. Seventy five percent of the current IDA/IBRD program in the region focuses on improving productivity (with the dominant areas being irrigation and drainage–21 percent, land administration–12 percent, and agriculture research and extension–6 percent, and on infrastructure to better link farmers to markets–17 percent).
Further emphasis: For the large agricultural exporters (Kazakhstan, Russia and Ukraine): deepen dialogue on food
policies, and climate change and risk management and support agricultural productivity enhancing investments to fully realize the agricultural potential of the region.
For countries with large cereal import bills and high pockets of poverty, mainly in Central Asia and Caucasus, the focus will continue on increasing resilience to the recurrent shocks through investments in irrigation and drainage, technology adoption, land administration, safety nets, and rural non-farm income and exit programs.
Further efforts on policy options to reduce the need for export restriction.
56. Middle East and North Africa: The dominant focus going forward is on strengthening safety nets, increasing agricultural and water productivity, and reducing vulnerability to international food price shocks through improved grain logistics, storage and handling. The focus of the ongoing IDA/IBRD program in the region is centered on enhancing productivity by improving irrigation efficiency and on managing water scarcity in the region (82 percent) of the program. This will remain of particular importance since water scarcity is projected to worsen due to climate change and the increasing demand of a growing population. Further emphasis:
For those countries highly dependent on cereal imports with fiscal deficits (Djibouti, Jordan, Lebanon, Tunisia, Yemen) priority will be given to strategies for improving safety nets and better managing exposure to market volatility, then to investments in agricultural research and development and rural livelihoods.
For those countries that are moderately dependent on cereal imports, but have fiscal deficits (Egypt, Morocco, Iran, Syria), the first priority is to better manage agricultural and water productivity; invest in agricultural research and development and rural livelihoods; and then to advise on better managing exposure to market volatility.
For those countries with a higher dependence on cereal imports, but with fiscal surpluses (Kuwait, Libya, Oman, Qatar, Saudi Arabia, United Arab Emirates, Algeria, and Bahrain), pro-active support is necessary on the better management of grain imports through reduction of
27
bottlenecks in critical infrastructure, strategic grain reserves, port facilities and roads, building on the on-going WBG technical assistance as a part of the Arab World Initiative.
Further efforts will be made to diversify incomes through creating opportunities for high value fruit and vegetable exports and through improved skills development, especially for rural youth.
VI. LEVERAGING AND STRENGTHENING PARTNERSHIPS
57. The challenges are large, the issues complex and the number of actors significant. The WBG must therefore leverage its partnerships in order to be most effective. Aid effectiveness considerations in the poorer client countries are especially pertinent to agriculture, as manifested for example in the key regional donor harmonization and alignment approach of the Comprehensive Africa Agriculture Development Program (CAADP). In all countries, there is increasing recognition of the multiplicity of potential actors–donors, civil society, the private sector whose capacities and efforts individually often match those of the WBG and in some cases far surpass it. South-South collaboration cooperation in trade, investment and knowledge exchange is also increasingly important69. 58. More specifically, fragmentation of development partner supported projects geographically, thematically, and in the use of financial management, accounting, and reporting systems raises transaction costs, diverts local capacity, and can undermine local systems. The fragmentation effect is strongest in countries where development partner support accounts for the major share of public spending in agriculture, particularly in Sub-Saharan Africa. Consistent with the Paris Declaration and Accra Agenda for Action, the WBG will continue to integrate support into government-led efforts, including leveraging joint financing of programs addressing food security, building on existing institutions. In particular, the WBG is working with partners on several efforts on agriculture and food security. In addition to co-ordination with the International Monetary Fund on addressing the macro-economic dimension of food price volatility, five examples of WBG leveraging partnerships in the agriculture and food security area are provided below. A. Setting up the Global Agriculture and Food Security Program (GAFSP)
59. The WBG has been working to improve multilateralism in support for agriculture, through working jointly with development partners at the country level, and through the establishment of the Global Agriculture and Food Security Program (GAFSP) at the global level. The latter was requested of the World Bank in September 2009 at the Pittsburgh Summit of the G20 that pledged US$22 billion in support for agriculture in low income countries. GAFSP was launched in April 2010. It provides pooled donor grant resources to help support country-led agriculture investment plans that are strategic, evidence-based, inclusive of civil society and the private sector, firmly aligned with national priorities and agreed with other partners active in supporting agriculture and food security in the country. Governance is through an external Steering Committee of donors and recipient representatives, with participation by civil society, potential supervising entities for projects, and the United Nations HLTF. Projects are ranked by an independent external Technical Advisory Committee composed of roughly equal parts of experts from developed and developing countries, covering a wide variety of areas of expertise. 60. Donors have pledged resources to the public and private sector windows. Donors have pledged US$925 million and delivered US$405 million to the public sector window of GAFSP; they include Australia, Canada, the Bill and Melinda Gates Foundation, Ireland, the Republic of Korea, Spain and the United States. IFC is setting up the private sector window of GAFSP which will offer financing across the capital structure in agribusiness firms, as well as advisory services focusing on small and 69 The World Bank established the South-South Experience Exchange Facility that provides small grants to facilitate quick and just-in-time knowledge and expertise exchanges between developing countries. Beyond this, the World Bank is committed to supporting further learning and forming a knowledge center of best practices in dealing with development challenges.
28
medium enterprises in IDA countries. In addition to donor pledges of US$75 million from Canada and the US, IFC expects to invest US$25 million of its own funds. 61. To date, eight countries (Bangladesh, Haiti, Rwanda, Sierra Leone, Togo, Mongolia, Niger, and Ethiopia) were awarded grants totaling US$321 million from the public sector window of GAFSP. For example, in Rwanda GAFSP support will scale up efforts to transform hillside agriculture by bolstering productivity while reducing erosion. In Mongolia, support will help to increase access to domestic and regional markets for livestock products and support producer groups. In Sierra Leone, support will help link farmers to markets and improve water use efficiency. However, current demand for GAFSP resources far outweighs remaining funds received to date. Seventeen country proposals for US$784 million have undergone a thorough independent technical review process that recommended immediate funding for over half of the proposals. GAFSP Steering Committee consideration to award financing to these proposals is pending due to the lack of funds. B. Support for the Comprehensive Africa Agriculture Development Program
62. The World Bank has been strengthening the capacity of the CAADP Secretariat to support the preparation of countries' investment plans for agricultural scale up in Africa. Capacity building and technical assistance is also provided to the CAADP leading institutions and regional economic communities, jointly with other donors. Overall, the Africa region of the World Bank has aligned its agricultural program around four complementary pillars of CAADP. As of January 2011, 22 countries have signed CAADP Compacts and prepared Investments Plans, with some of those Plans being already used to attract and underpin domestic and donor financing, as well as forming the basis for GAFSP proposals. The World Bank, through a grant from the Bill and Melinda Gates Foundation, is also helping to improve the quality of public expenditure reviews carried out for assessment of value for money of scaled agricultural investments, which further support the CAADP process. C. Supporting the newly reformed Consultative Group on International Agricultural Research
63. The World Bank supported the reform of the Consultative Group on International Agricultural Research (CGIAR) business model; it now provides more results-oriented funding through CGIAR Research Programs. To achieve scale of research across developing countries, and a focus on crop systems relevant for the poor and neglected by the private sector, (e.g., cassava, millet, and beans) investment in global research programs is needed. In this context, support for the reformed CGIAR is vital. The CGIAR is now better structured to effectively and efficiently implement a much longer term strategic research program supported by increased funding. A new CGIAR Multi-Donor Trust Fund was established to harmonize donor investments in key global challenges on agriculture and is being hosted and managed by the World Bank. At present, two new research programs have been approved that are results-oriented with clear pathways and M&E indicators and includes a broad group of partners: (i) the Global Rice Science Partnership is a US$600 million rice breeding program over five years that brings together scientists from three CGIAR centers focusing on producing better drought and flood tolerant rice varieties through use of genomics approaches; and (ii) the Climate Change, Agriculture and Food Security Program is a US$250 million program over three years that will identify and test a range of pro-poor climate change mitigation and adaptation policies and technologies. D. Coordination among Multilateral Agencies on Food Security Issues
64. The WBG has been actively engaged with the United Nations High-Level Task Force (HLTF) on the Global Food Security Crisis established in late April 2008 under the leadership of the UN Secretary-General, which brings together the Heads of the UN specialized agencies, funds, and programs and the Bretton Woods institutions. The HLTF has been an effective mechanism to ensure complementary and coordinated action among UN-specialized agencies, and bilateral and
29
multilateral institutions. The WBG has been providing financial support to the HLTF Secretariat through a Development Grant Facility of US$525,000 per year from FY10 to support its work. The HLTF Secretariat assisted in leveraging donor funding, including support to the establishment of the €1 billion European Food Facility of the European Commission in support of country-owned and country-driven action. The WBG, through the GFRP Secretariat, actively participated in the updating of the UN’s Comprehensive Framework for Action, which was adopted by the UN General Assembly in September 2008. E. Support for the G20 initiatives on food price volatility and food security
65. The World Bank is contributing to several agricultural and food security working groups drafting recommendations for the G20, at the request of the French Presidency. They include: food price volatility, agriculture and food security, agricultural productivity, and responsible agricultural investment. This follows on its support for food security at the request of the G20's Development Working Group under the Korean Presidency in 2010. The World Bank has proposed the following concrete actions and partnerships for inclusion in the joint International Organizations paper for the G20 (being drafted) on policy responses to food price volatility.70
Increase public access to information on the quantity and quality of grain stocks. The capacity of international and national food market information providers to monitor market developments and disseminate timely and accurate information in relation to food prices and food security should be strengthened. The World Bank is exploring the feasibility with FAO, WFP, OECD and IFAD, of launching a food market transparency initiative with broad involvement of countries, traders, CSO’s and other major stakeholders, to encourage information sharing, improve data reliability and enhance transparency in relation to production and storage of relevant commodities and relationships between local and global prices.
Improve weather forecasting and monitoring, especially in Africa. Better weather forecasting would enable people to plan ahead, and helps anticipate needs for assistance. The World Meteorological Organization and the World Bank are already helping improve national hydrological and meteorological services as part of a more general climate change adaptation strategy, but more is needed.
Deepen our understanding of the relationship between international prices and local prices in poor countries. Better monitoring and analysis of links between international, national, and sub-national food prices are required to improve the speed and targeting of responses to problems, and the tools available. The basis risk that arises from the lack of integration of markets in a target country makes it very difficult to obtain or design financial risk management tools for food prices. Improving access to information is an immediate entry point for the World Bank; another is to explore ways to better coordinate infrastructure interventions in rural areas with needs for agricultural trade flows.
Establish small regional humanitarian reserves in disaster-prone, infrastructure-poor areas. Large stocks can be costly, degrade easily and impede producers. But in places where food crises are likely to recur and transport links are weak such as the Horn of Africa, small, pre-positioned strategic reserves would get food to the hungry fast, probably at lower cost. The WFP has expressed interest in managing this system. The World Bank is assisting with technical assistance to WFP on financial management issues necessary for multi-year procurement of grain, processing, and carry-over.
70 See for example the Financial Times op-ed , “Free Markets Can Still Feed the World”, by President Zoellick on January 6, 2011.
30
Agree on a code of conduct to exempt humanitarian food aid from export bans. Export restrictions make food price volatility worse. Ideally countries would not impose any export bans; in 2011 they should at least agree that food for humanitarian purposes be exempted from imposition of movement restrictions. The World Bank is working with WTO, OECD, WFP and FAO to explore concrete options for formalizing an agreement on humanitarian food aid transfers across borders in times of crisis. This will be necessary for the success of efforts to procure and pre-position food aid supplies in good times in remote, poor areas, where volatile prices are a particular problem.
Give countries access to fast-disbursing support as an alternative to export bans or price fixing. To help countries avoid policies that harm their own farmers and neighbors, we need to provide reliable, fast alternatives customized to local needs. The GFRP is one of the World Bank’s main responses to this need since 2008, but development policy operations beyond GFRP have also played a role in providing assistance and advice on these alternatives. The IMF also has a fast-disbursing instrument–the Rapid Credit Facility–that provides concessional financial assistance to low-income countries facing an urgent balance-of-payments need71.
Develop a robust set of risk management products. One of the strengths of the World Bank is that its advice is not conditioned by the need to sell a specific product or sector. In some cases, the most useful tools for risk management might be weather insurance or rainfall index; in others, it could be a hedge on energy prices to keep transport and input costs low. The World Bank is also developing pilot risk transfer products for agriculture. An example is index-based crop insurance that uses different indices as proxies for loss, and thereby seeks to avoid the basis risk issues with traditional insurance referred to above. Further product development will be necessary, especially with climate change.
Ensure effective social safety nets that include a focus on nutritional outcomes. It is vital that we protect the most vulnerable populations, such as pregnant and lactating women and children under two. The WBG is working with all partners, including WFP, on this. The World Bank is an active participant in the creation and implementation of the multi-agency Scaling-Up Nutrition (SUN) initiative that targets improvement of nutrition of infants in the first 1,000 days of life.
Help smallholder farmers become a bigger part of the solution to food security. Expanded support to country-led efforts to bolster smallholder agriculture is critical. One concrete step would be for the G20 to help local farmers benefit from tenders from humanitarian purchasers such as the WFP. This may require flexibility to allow development benefits such as building local markets to be taken into account in sourcing decisions. More fundamentally, it will be essential to assure a more solid funding base to agricultural and food security aid effectiveness measures such as GAFSP.
VII. QUESTIONS FOR POSSIBLE DISCUSSION BY THE DEVELOPMENT COMMITTEE
66. The preceding analysis raises a number of questions that the Development Committee may wish to discuss. Given the magnitude and importance of the long-term issues related to food security, what
other innovative and risk management approaches can the international community explore to help address these challenges?
Addressing short- and long-term food security, including strengthening the productivity and resiliency of the smallholder agricultural systems that dominate developing country agriculture, will be critical to an effective response. How can donors, the World Bank Group, and the international community support countries to achieve sustained results in this area?
71 To date, four countries have received a total of SDR56.6 million under this facility.