Embed Size (px)
Citation preview
2143
Case Study
International Journal of Current Engineering and Technology ISSN 2277 - 4106
© 2013 INPRESSCO. All Rights Reserved.
Available at http://inpressco.com/category/ijcet
Day Length Estimation over India: A Case Study
GarimaTiwariȦ, V.K. Katiyar
Ȧ, C. K. Panday
Ċ * and A.K. Katiyar
Ḃ
ȦBrahmanand Post Graduate College, the Mall, Kanpur-208004, India ḂI.E.T, Sitapur Road Lucknow-226021, India
ĊM. I. T. S, Mohanlalganj, Raebareilly Road, Lucknow, India
Accepted 25 December 2013, Available online 30 December 2013, Vol.3, No.5 (December 2013)
Abstract
The day length So is the essential parameter for calculating the solar radiation data. In order to determine the day length,
two correlations have been developed by Cooper and Hay, and both correlations have been frequently used by different
researchers. The main objective of this study is to test the applicability of these two correlations available for computing
the day length value on horizontal surface in India. For this purpose, the developed correlations are employed to
estimate the day length values on horizontal surface for nine locations with latitude between 8.50
N to 28.630 N. The
performances of these correlations have been checked by it with the measured value. From this study, a close agreement
has been observed between the Cooper correlations and the measured data on the duration between sunrise and sunset.
Furthermore, in order to evaluate the accuracy of Cooper’s method reported in this paper for computing the day length
S0 for India, the developed correlations were then compared on the basis of statistical error indices such as root mean
square error (RMSE), mean bias error (MBE), relative percentage error, and t-statistics test. According to the results the
Cooper method showed the best estimation of day length values for nine Indian stations.
Keywords: Cooper, Hay, Day length
1. Introduction
1 The day length So, refers to the time each day from the
moment the upper limb of the sun's disk appears above the
horizon during sunrise to the moment when the upper limb
disappears below the horizon during sunset..Solar energy
engineers, architects, agriculturists, hydrologists etc. often
require a reasonably accurate knowledge of the availability
of the solar radiations for their relevant applications at
their local. Knowledge of solar radiation is essential for
the proper design of buildings, solar energy systems and a
good evaluation of thermal environment within buildings
(Lu Zet al, 1998, Machler MA et al, 1985, Trujillo JHS,
1998, ASHRAE handbook1999, Li DHW et al, 2000). It is
measured in terms of sunshine duration or in terms of
direct, diffuse and global radiation. In response to the
crucial needs of solar radiation data, some empirical
correlations have been developed by different researchers
for estimating direct, diffuse and global solar radiation.
The determination of solar energy capacity effectively
through the empirical models plays a key role in
developing solar energy technologies and sustainability of
natural resources (Karakoti et al, 2012).These empirical
can be mainly classified into four following categories
*Corresponding author. Email: C. K. Panday
based on employed meteorological parameters (Besharat F
et al, 2013)
1. Sunshine based models
2. Cloud based models
3. Temperature based models
4. Other meteorological parameters.
Among all such meteorological parameters, bright
sunshine hours are the most widely and commonly used to
predict global solar radiation. Most of the models for
estimating solar radiation that appear in the literature only
use sunshine ratio (S/So) for prediction of monthly average
daily global radiation, given as-Angstrom-Prescott model-
(Angstrom A, 1924, Prescott JA,1940), Glower and
McCulloch model (Glower J et al,1958), Page model
(Page JK, 1961), Rietveld model (Rietveld M, 1978),
Dogniaux and Lemoine model (Dogniaux R et al, 1983),
Kilic and Ozturk model (Kilic A et al, 1983), Benson et al.
model (Benson RB et al ,1984), Ogelman model
(Ogelman H et al, 1984), Bahel et al. model (Bahel V et
al, 1986), Zabara model (Zabara K, 1986), Bahel model
(Bahel V et al, 1987), Gopinathan model (Gopinathan KK,
1988), Newland model (Newland FJ, 1988), Monthly
specific Rietveld model (Soler A, 1990), Luhanga and
Andringa model (Luhanga PVC et al, 1990), Louche et al.
model (Louche A et al, 1991), Samuel model (Samuel
TDMA, 1991), Gopinathan and Soler model (Gopinathan
KK et al, 1992 ), Raja model (Raja IA, 1994), Coppolino
GarimaTiwari et al International Journal of Current Engineering and Technology, Vol.3, No.5 (December 2013)
2144
model (Coppolino S, 1994), Tiris et al. model (Tiris M et
al,1996), Ampratwum and Dorvlomodel (Ampratwum D
B et al, 1999), Klabzuba et al. model (Klabzuba J et al,
1999), Togrul et al (Togrul IT et al, 2000), Elagib and
Mansell model (Elagib N et al, 2000) Monthly specific
Elagib and Mansellmodel (Elagib N et al, 2000), Togrul
et al. (Togrul IT et al, 2000) Almorox and Hontoria model
(Almorox J et al, 2004), Jin et al. model (Jin Z et al,
2005), El-Metwally model (El-Metwally M, 2005),
Almorox model (Almorox J et al, 2005), Rensheng model
(Rensheng C et al, 2006), Sen model (Sen Z, 2007),
Bakirci model (Bakirci K, 2008), Bakirci model (Bakirci
K, 2009) and Katiyar .model (Katiyar VK et al, 2009).
Further diffuse solar radiation is the prime parameter
which directs the quality of global solar radiation and also
of direct normal irradiance which is input parameter for
concentrating solar power projects. Estimation of diffuse
solar radiation is essential for evaluation of thermal
performance of buildings and other thermal technologies.
The measured value of diffuse solar radiation is available
at only few locations of India. Hence, a number of
Empirical models have been developed to calculate diffuse
solar radiation using various parameters, such as global
solar radiation (Liu BYH et al, 1960, Al-Mohamad A,
2004, Diez-Mediavilla M et al, 2005, Tarhan S et al, 2005,
A ras H et al, 2006, Noorian AM et al, 2008, El-sebali AA
et al, 2010, Bolanda J et al, 2008, Jiang Y, 2009) and
sunshine duration (Tiris M et al, 1996, Barbaro S et al,
1981, Jain PC, 1990, Haydar A et al, 2006, Pandey CK et
al, 2009).
That is for the estimation of either global or diffuse
solar radiation, a crucial need of day length value. Cooper
(Cooper PI, 1969) proposed a method for calculating So
and that has been extensively used by different researchers
(Karakoti I et al, 2012, Besharat F et al, 2013, Zabara K,
1986, Gopinathan KK, 1988, Gopinathan KK et al, 1992,
Ampratwum DB et al, 1999, Togrul IT et al, 2000, Elagib
N et al, 2000, Almorox J et al, 2004, Jin Z et al, 2005,
Almorox J et al, 2005, Katiyar VK et al, 2009, Jiang Y,
2009, Pandey CK et al, 2009, Khorasanizadeh H et al,
2013) across the globe. Hay (Hay JE, 1979) modified
Cooper’s formula and found that data shows less
scattering with this modification for nine Canadian cities.
This is also frequently being used by different researchers
(Noorian AM et al, 2008, Wenxian L, 1988, Wenxian L et
al, 1996, Sambo AS, 1986, Feuillard T et al, 1989,Ma
CCY et al, 1984, Bashahu M, 2003).
The objective of the work reported in this paper is the
comparison of Cooper’s and Hay methods with the
measured data for estimating the day length value and then
to find out the most suitable correlation for computing the
day length So for locations under consideration in India.
2. Background and selected correlations
2.1. Cooper’s formula
The day length So, is defined as the time from sunrise to
sunset, can be calculated as follows (Cooper PI, 1969)
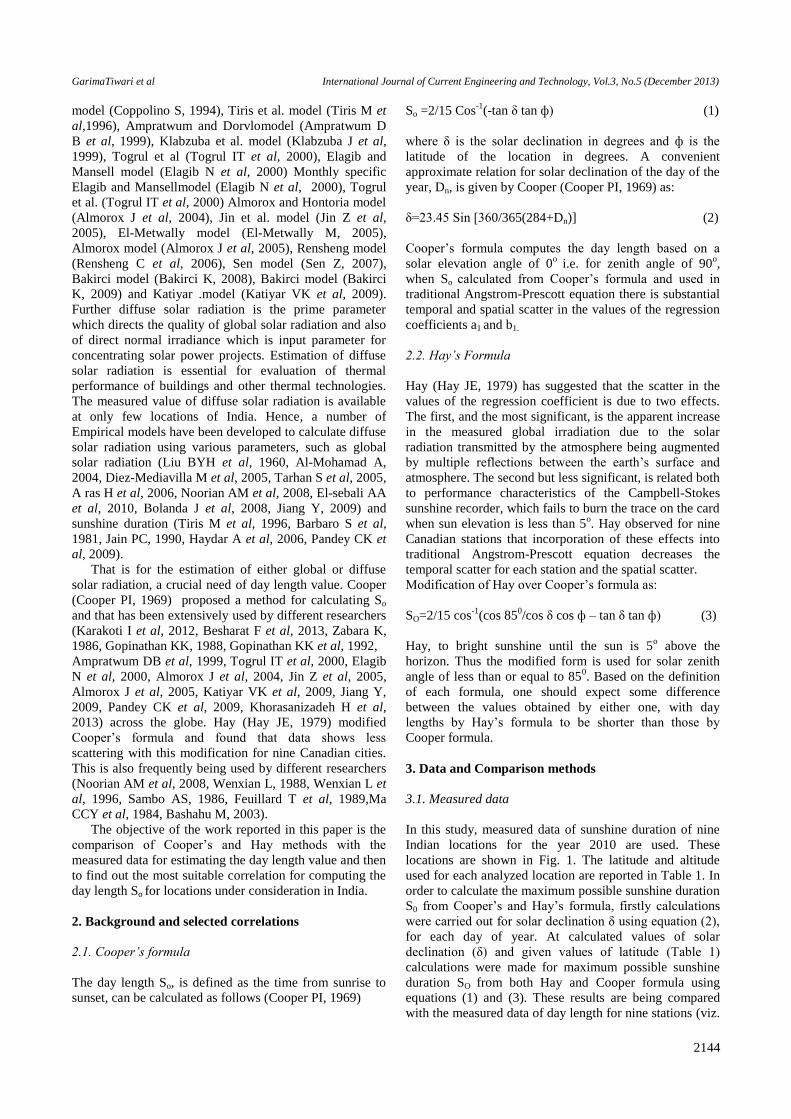
So =2/15 Cos-1
(-tan δ tan ф) (1)
where δ is the solar declination in degrees and ф is the
latitude of the location in degrees. A convenient
approximate relation for solar declination of the day of the
year, Dn, is given by Cooper (Cooper PI, 1969) as:
δ=23.45 Sin [360/365(284+Dn)] (2)
Cooper’s formula computes the day length based on a
solar elevation angle of 0o
i.e. for zenith angle of 90o,
when So calculated from Cooper’s formula and used in
traditional Angstrom-Prescott equation there is substantial
temporal and spatial scatter in the values of the regression
coefficients a1 and b1.
2.2. Hay’s Formula
Hay (Hay JE, 1979) has suggested that the scatter in the
values of the regression coefficient is due to two effects.
The first, and the most significant, is the apparent increase
in the measured global irradiation due to the solar
radiation transmitted by the atmosphere being augmented
by multiple reflections between the earth’s surface and
atmosphere. The second but less significant, is related both
to performance characteristics of the Campbell-Stokes
sunshine recorder, which fails to burn the trace on the card
when sun elevation is less than 5o. Hay observed for nine
Canadian stations that incorporation of these effects into
traditional Angstrom-Prescott equation decreases the
temporal scatter for each station and the spatial scatter.
Modification of Hay over Cooper’s formula as:
SO=2/15 cos-1
(cos 850/cos δ cos ф – tan δ tan ф) (3)
Hay, to bright sunshine until the sun is 5o above the
horizon. Thus the modified form is used for solar zenith
angle of less than or equal to 850. Based on the definition
of each formula, one should expect some difference
between the values obtained by either one, with day
lengths by Hay’s formula to be shorter than those by
Cooper formula.
3. Data and Comparison methods
3.1. Measured data
In this study, measured data of sunshine duration of nine
Indian locations for the year 2010 are used. These
locations are shown in Fig. 1. The latitude and altitude
used for each analyzed location are reported in Table 1. In
order to calculate the maximum possible sunshine duration
S0 from Cooper’s and Hay’s formula, firstly calculations
were carried out for solar declination δ using equation (2),
for each day of year. At calculated values of solar
declination (δ) and given values of latitude (Table 1)
calculations were made for maximum possible sunshine
duration SO from both Hay and Cooper formula using
equations (1) and (3). These results are being compared
with the measured data of day length for nine stations (viz.

GarimaTiwari et al International Journal of Current Engineering and Technology, Vol.3, No.5 (December 2013)
2145
New Delhi, Agra, Kanpur, Patna, Kolkata, Surat, Mumbai,
Chennai and Thiruavananthapuram). Trend analysis of day
length versus day for selected locations is given in Figs. 2-
10.
Fig.1Indian locations analyzed in the present study
Table 1 Summary of testing cities
Sr. No. Stations Latitude
(Degree)
Longitude(D
egrees)
1 New Delhi 28.63 77.20
2 Agra 27.16 78.01
3 Kanpur 26.45 80.31
4 Patna 25.61 85.13
5 Kolkata 22.56 88.36
6 Surat 21.17 72.83
7 Mumbai 18.91 72.82
8 Chennai 13.08 80.27
9 Thiruavanthapuram 8.50 76.90
GarimaTiwari et al International Journal of Current Engineering and Technology, Vol.3, No.5 (December 2013)
2146
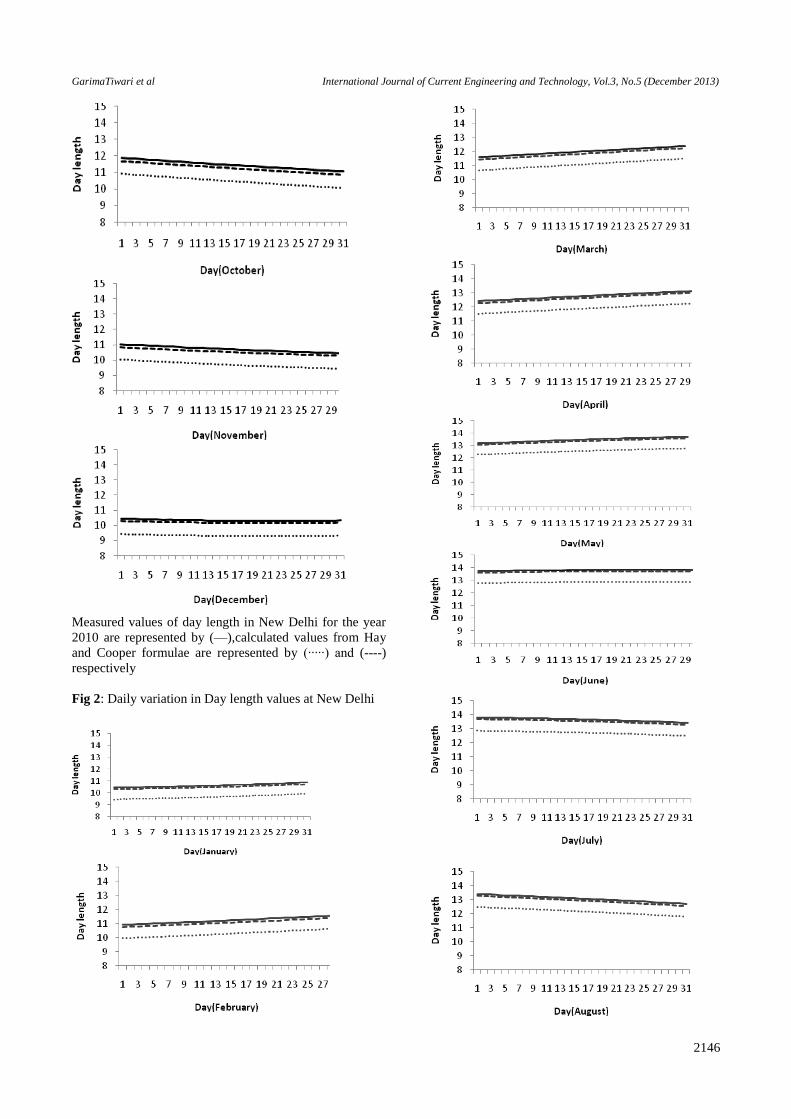
Measured values of day length in New Delhi for the year
2010 are represented by (—),calculated values from Hay
and Cooper formulae are represented by (∙∙∙∙∙) and (----)
respectively
Fig 2: Daily variation in Day length values at New Delhi
GarimaTiwari et al International Journal of Current Engineering and Technology, Vol.3, No.5 (December 2013)
2147
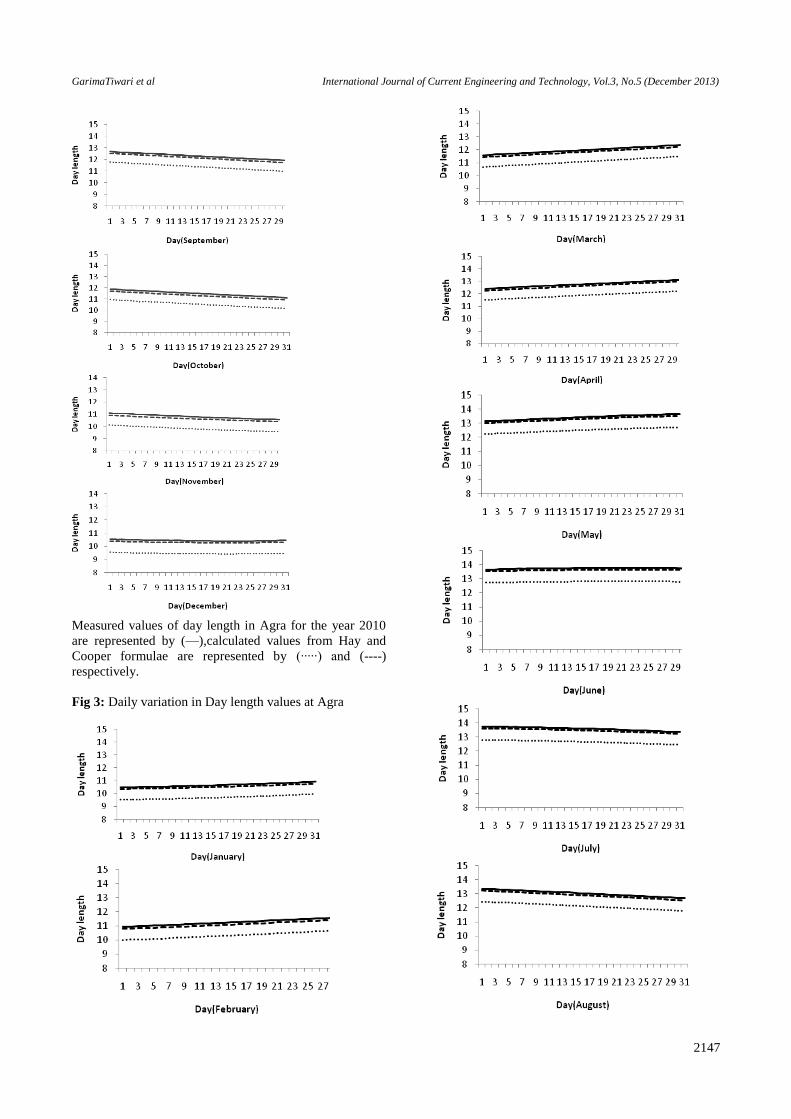
Measured values of day length in Agra for the year 2010
are represented by (—),calculated values from Hay and
Cooper formulae are represented by (∙∙∙∙∙) and (----)
respectively.
Fig 3: Daily variation in Day length values at Agra
GarimaTiwari et al International Journal of Current Engineering and Technology, Vol.3, No.5 (December 2013)
2148
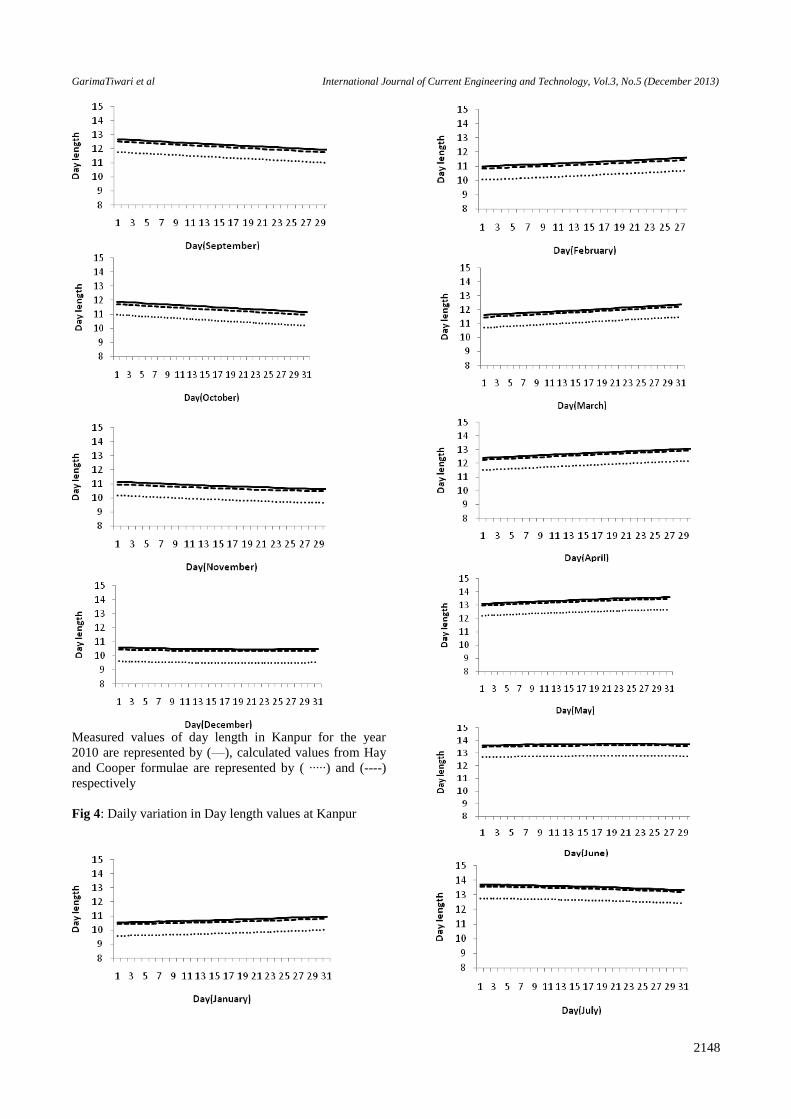
Measured values of day length in Kanpur for the year
2010 are represented by (—), calculated values from Hay
and Cooper formulae are represented by ( ∙∙∙∙∙) and (----)
respectively
Fig 4: Daily variation in Day length values at Kanpur
GarimaTiwari et al International Journal of Current Engineering and Technology, Vol.3, No.5 (December 2013)
2149
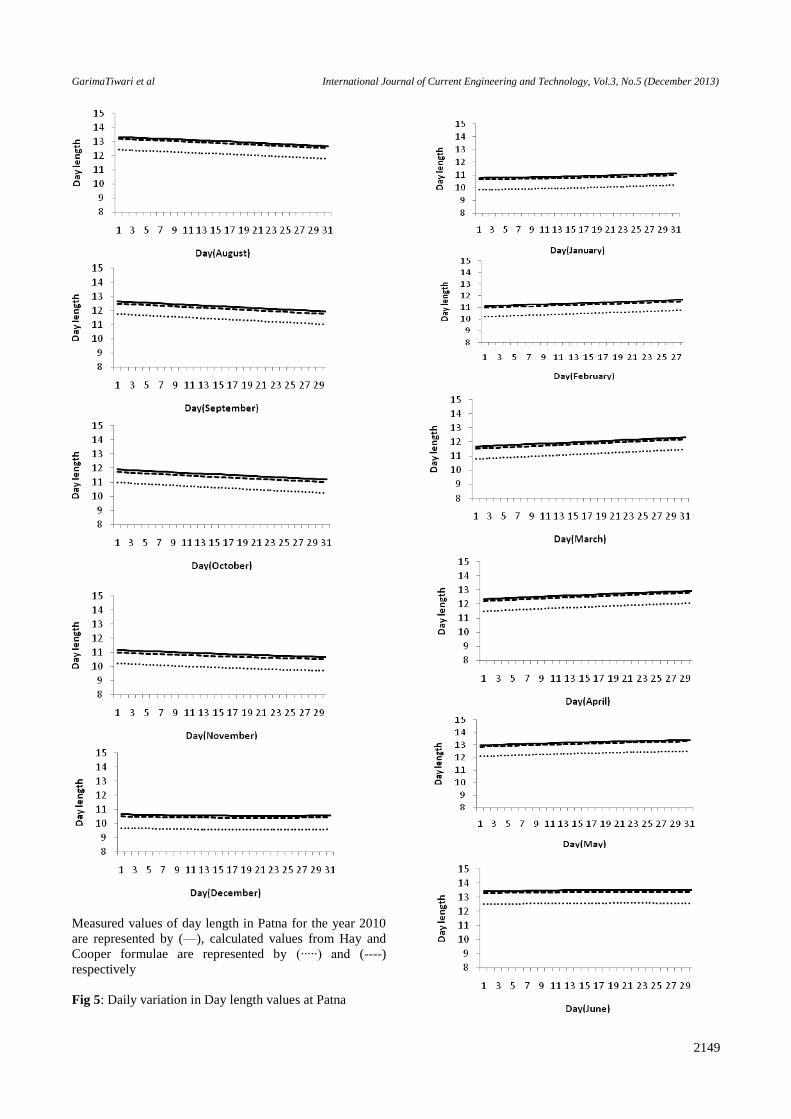
Measured values of day length in Patna for the year 2010
are represented by (—), calculated values from Hay and
Cooper formulae are represented by (∙∙∙∙∙) and (----)
respectively
Fig 5: Daily variation in Day length values at Patna
GarimaTiwari et al International Journal of Current Engineering and Technology, Vol.3, No.5 (December 2013)
2150
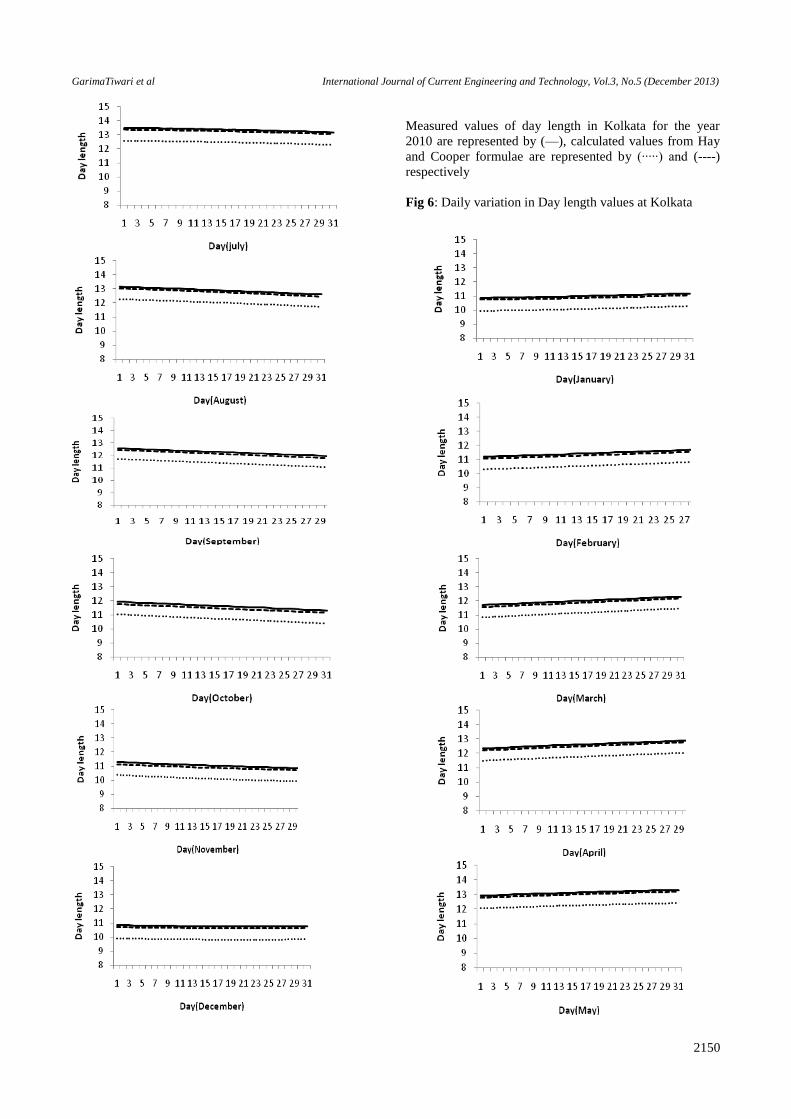
Measured values of day length in Kolkata for the year
2010 are represented by (—), calculated values from Hay
and Cooper formulae are represented by (∙∙∙∙∙) and (----)
respectively
Fig 6: Daily variation in Day length values at Kolkata
GarimaTiwari et al International Journal of Current Engineering and Technology, Vol.3, No.5 (December 2013)
2151
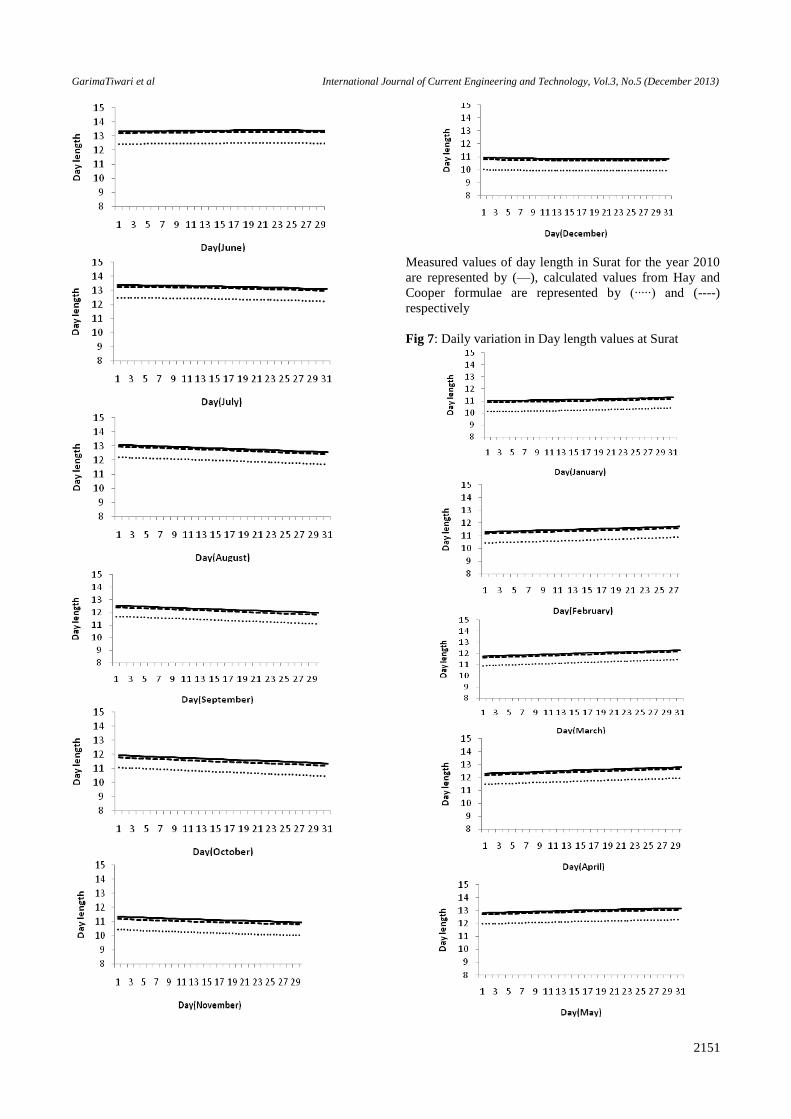
Measured values of day length in Surat for the year 2010
are represented by (—), calculated values from Hay and
Cooper formulae are represented by (∙∙∙∙∙) and (----)
respectively
Fig 7: Daily variation in Day length values at Surat
GarimaTiwari et al International Journal of Current Engineering and Technology, Vol.3, No.5 (December 2013)
2152
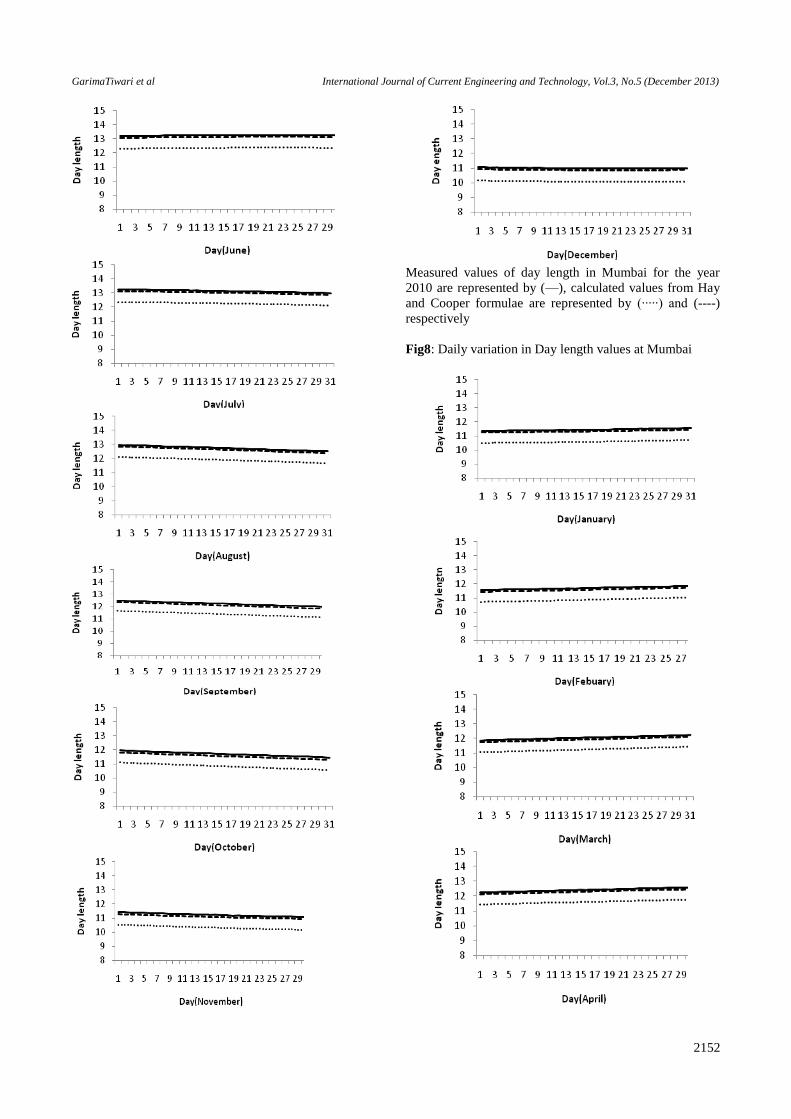
Measured values of day length in Mumbai for the year
2010 are represented by (—), calculated values from Hay
and Cooper formulae are represented by (∙∙∙∙∙) and (----)
respectively
Fig8: Daily variation in Day length values at Mumbai
GarimaTiwari et al International Journal of Current Engineering and Technology, Vol.3, No.5 (December 2013)
2153
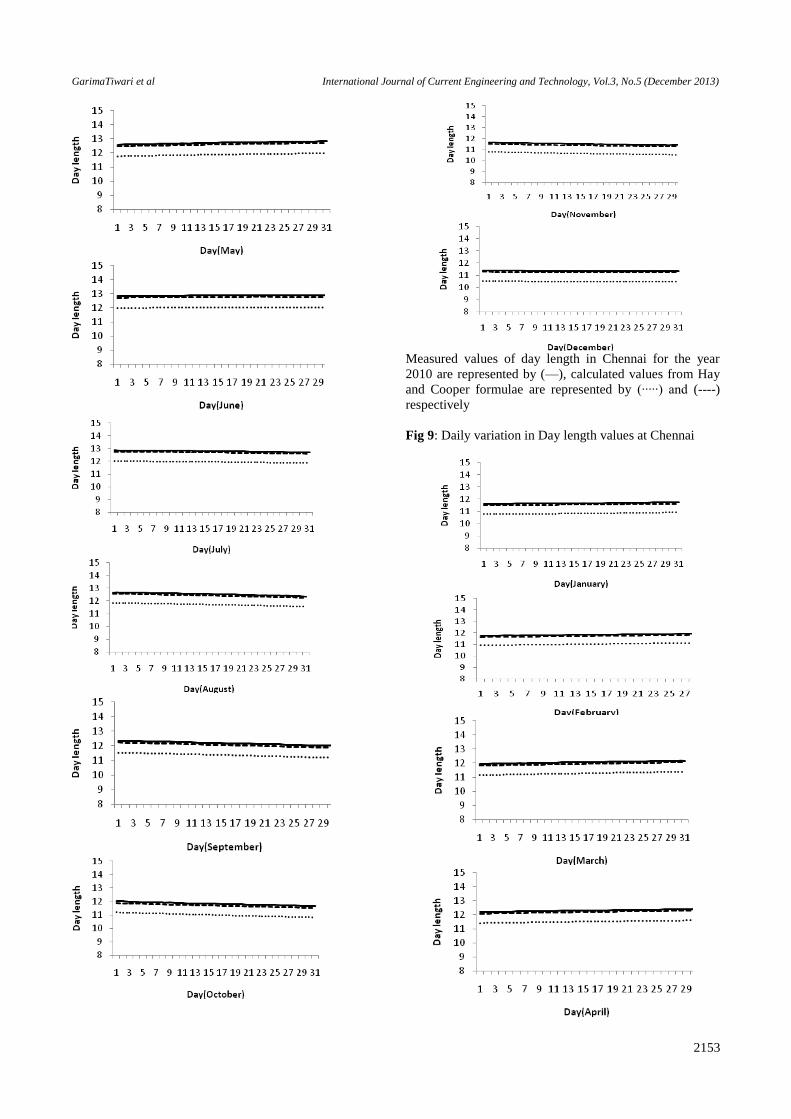
Measured values of day length in Chennai for the year
2010 are represented by (—), calculated values from Hay
and Cooper formulae are represented by (∙∙∙∙∙) and (----)
respectively
Fig 9: Daily variation in Day length values at Chennai
GarimaTiwari et al International Journal of Current Engineering and Technology, Vol.3, No.5 (December 2013)
2154
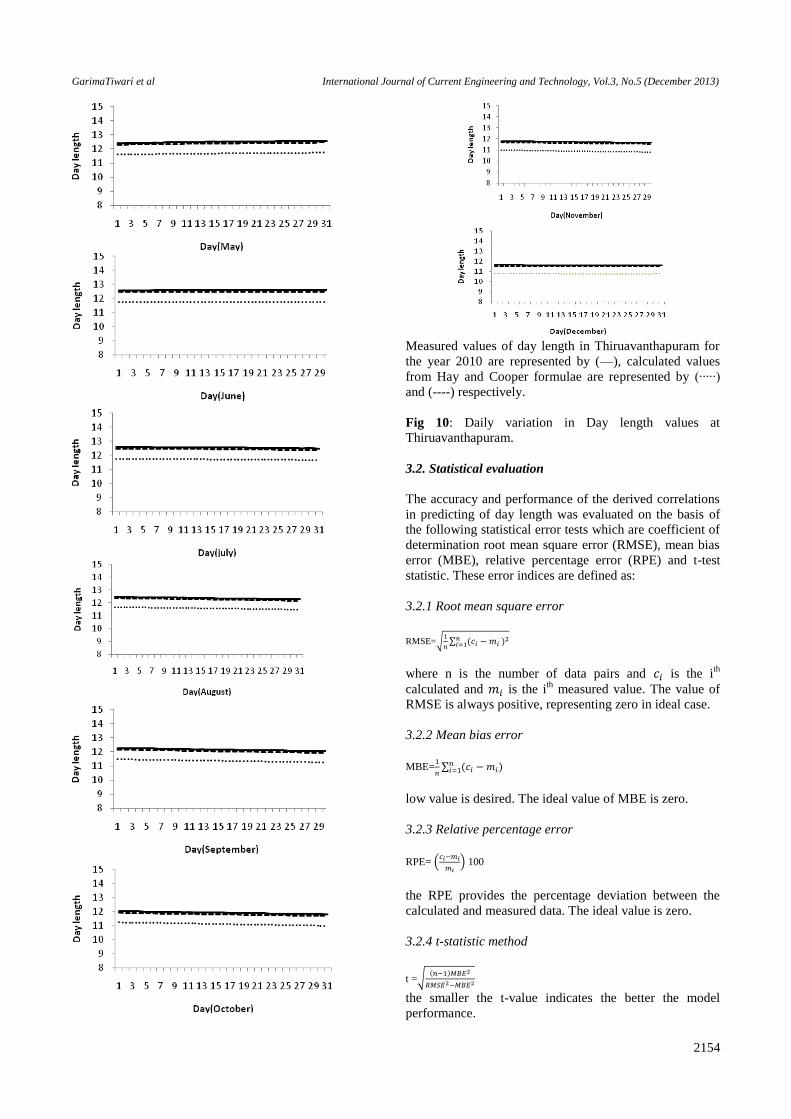
Measured values of day length in Thiruavanthapuram for
the year 2010 are represented by (—), calculated values
from Hay and Cooper formulae are represented by (∙∙∙∙∙)
and (----) respectively.
Fig 10: Daily variation in Day length values at
Thiruavanthapuram.
3.2. Statistical evaluation
The accuracy and performance of the derived correlations
in predicting of day length was evaluated on the basis of
the following statistical error tests which are coefficient of
determination root mean square error (RMSE), mean bias
error (MBE), relative percentage error (RPE) and t-test
statistic. These error indices are defined as:
3.2.1 Root mean square error
RMSE=√
∑
where n is the number of data pairs and is the ith
calculated and is the ith
measured value. The value of
RMSE is always positive, representing zero in ideal case.
3.2.2 Mean bias error
MBE=
∑
low value is desired. The ideal value of MBE is zero.
3.2.3 Relative percentage error
RPE= (
) 100
the RPE provides the percentage deviation between the
calculated and measured data. The ideal value is zero.
3.2.4 t-statistic method
t =√
the smaller the t-value indicates the better the model
performance.
GarimaTiwari et al International Journal of Current Engineering and Technology, Vol.3, No.5 (December 2013)
2155
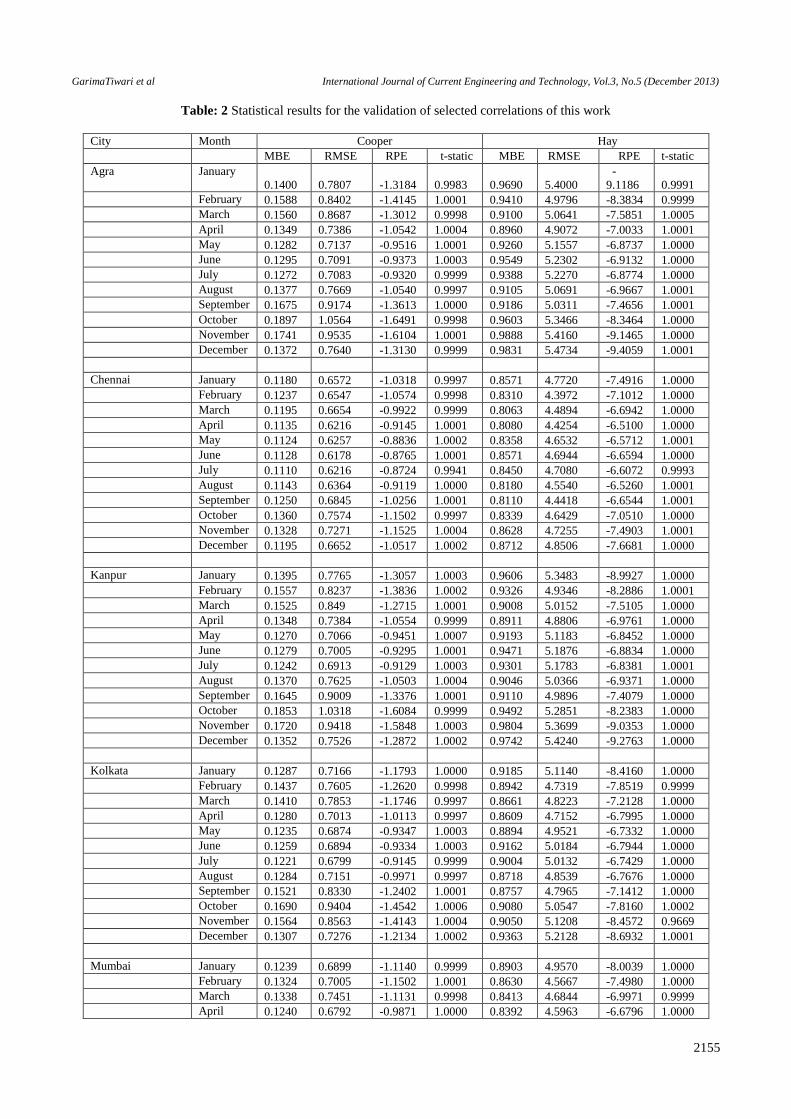
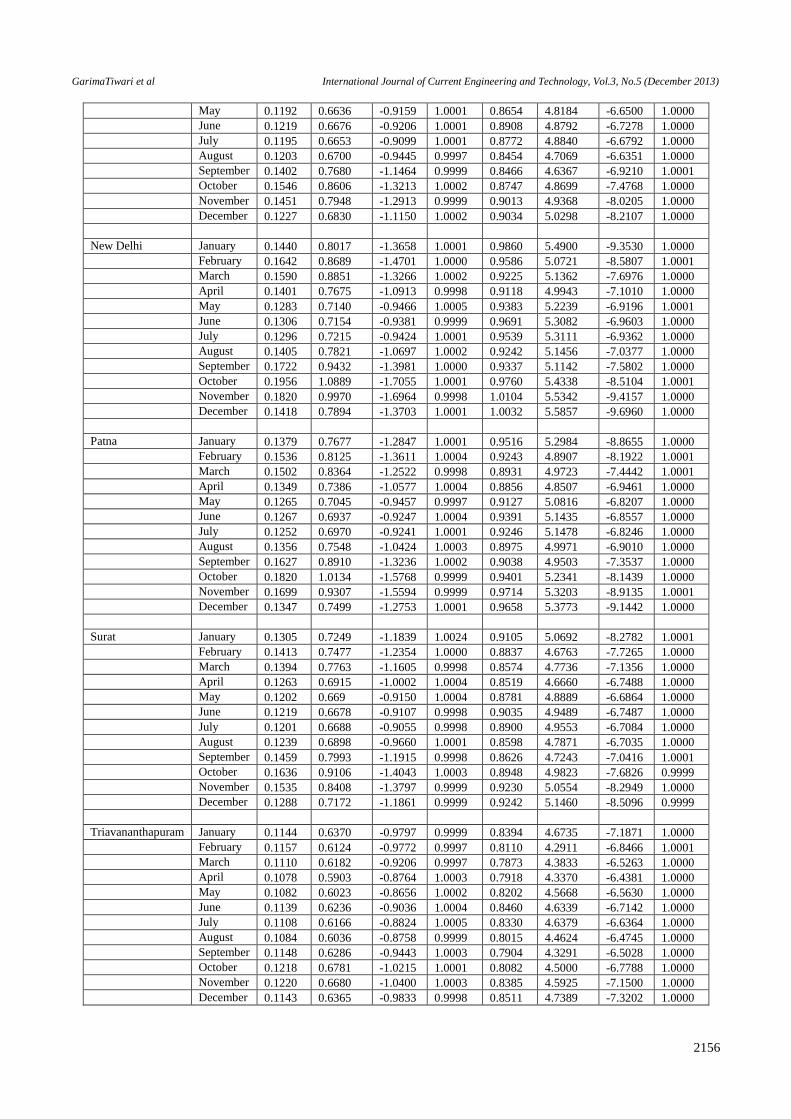
Table: 2 Statistical results for the validation of selected correlations of this work
City Month Cooper Hay
MBE RMSE RPE t-static MBE RMSE RPE t-static
Agra January
0.1400 0.7807 -1.3184 0.9983 0.9690 5.4000
-
9.1186 0.9991
February 0.1588 0.8402 -1.4145 1.0001 0.9410 4.9796 -8.3834 0.9999
March 0.1560 0.8687 -1.3012 0.9998 0.9100 5.0641 -7.5851 1.0005
April 0.1349 0.7386 -1.0542 1.0004 0.8960 4.9072 -7.0033 1.0001
May 0.1282 0.7137 -0.9516 1.0001 0.9260 5.1557 -6.8737 1.0000
June 0.1295 0.7091 -0.9373 1.0003 0.9549 5.2302 -6.9132 1.0000
July 0.1272 0.7083 -0.9320 0.9999 0.9388 5.2270 -6.8774 1.0000
August 0.1377 0.7669 -1.0540 0.9997 0.9105 5.0691 -6.9667 1.0001
September 0.1675 0.9174 -1.3613 1.0000 0.9186 5.0311 -7.4656 1.0001
October 0.1897 1.0564 -1.6491 0.9998 0.9603 5.3466 -8.3464 1.0000
November 0.1741 0.9535 -1.6104 1.0001 0.9888 5.4160 -9.1465 1.0000
December 0.1372 0.7640 -1.3130 0.9999 0.9831 5.4734 -9.4059 1.0001
Chennai January 0.1180 0.6572 -1.0318 0.9997 0.8571 4.7720 -7.4916 1.0000
February 0.1237 0.6547 -1.0574 0.9998 0.8310 4.3972 -7.1012 1.0000
March 0.1195 0.6654 -0.9922 0.9999 0.8063 4.4894 -6.6942 1.0000
April 0.1135 0.6216 -0.9145 1.0001 0.8080 4.4254 -6.5100 1.0000
May 0.1124 0.6257 -0.8836 1.0002 0.8358 4.6532 -6.5712 1.0001
June 0.1128 0.6178 -0.8765 1.0001 0.8571 4.6944 -6.6594 1.0000
July 0.1110 0.6216 -0.8724 0.9941 0.8450 4.7080 -6.6072 0.9993
August 0.1143 0.6364 -0.9119 1.0000 0.8180 4.5540 -6.5260 1.0001
September 0.1250 0.6845 -1.0256 1.0001 0.8110 4.4418 -6.6544 1.0001
October 0.1360 0.7574 -1.1502 0.9997 0.8339 4.6429 -7.0510 1.0000
November 0.1328 0.7271 -1.1525 1.0004 0.8628 4.7255 -7.4903 1.0001
December 0.1195 0.6652 -1.0517 1.0002 0.8712 4.8506 -7.6681 1.0000
Kanpur January 0.1395 0.7765 -1.3057 1.0003 0.9606 5.3483 -8.9927 1.0000
February 0.1557 0.8237 -1.3836 1.0002 0.9326 4.9346 -8.2886 1.0001
March 0.1525 0.849 -1.2715 1.0001 0.9008 5.0152 -7.5105 1.0000
April 0.1348 0.7384 -1.0554 0.9999 0.8911 4.8806 -6.9761 1.0000
May 0.1270 0.7066 -0.9451 1.0007 0.9193 5.1183 -6.8452 1.0000
June 0.1279 0.7005 -0.9295 1.0001 0.9471 5.1876 -6.8834 1.0000
July 0.1242 0.6913 -0.9129 1.0003 0.9301 5.1783 -6.8381 1.0001
August 0.1370 0.7625 -1.0503 1.0004 0.9046 5.0366 -6.9371 1.0000
September 0.1645 0.9009 -1.3376 1.0001 0.9110 4.9896 -7.4079 1.0000
October 0.1853 1.0318 -1.6084 0.9999 0.9492 5.2851 -8.2383 1.0000
November 0.1720 0.9418 -1.5848 1.0003 0.9804 5.3699 -9.0353 1.0000
December 0.1352 0.7526 -1.2872 1.0002 0.9742 5.4240 -9.2763 1.0000
Kolkata January 0.1287 0.7166 -1.1793 1.0000 0.9185 5.1140 -8.4160 1.0000
February 0.1437 0.7605 -1.2620 0.9998 0.8942 4.7319 -7.8519 0.9999
March 0.1410 0.7853 -1.1746 0.9997 0.8661 4.8223 -7.2128 1.0000
April 0.1280 0.7013 -1.0113 0.9997 0.8609 4.7152 -6.7995 1.0000
May 0.1235 0.6874 -0.9347 1.0003 0.8894 4.9521 -6.7332 1.0000
June 0.1259 0.6894 -0.9334 1.0003 0.9162 5.0184 -6.7944 1.0000
July 0.1221 0.6799 -0.9145 0.9999 0.9004 5.0132 -6.7429 1.0000
August 0.1284 0.7151 -0.9971 0.9997 0.8718 4.8539 -6.7676 1.0000
September 0.1521 0.8330 -1.2402 1.0001 0.8757 4.7965 -7.1412 1.0000
October 0.1690 0.9404 -1.4542 1.0006 0.9080 5.0547 -7.8160 1.0002
November 0.1564 0.8563 -1.4143 1.0004 0.9050 5.1208 -8.4572 0.9669
December 0.1307 0.7276 -1.2134 1.0002 0.9363 5.2128 -8.6932 1.0001
Mumbai January 0.1239 0.6899 -1.1140 0.9999 0.8903 4.9570 -8.0039 1.0000
February 0.1324 0.7005 -1.1502 1.0001 0.8630 4.5667 -7.4980 1.0000
March 0.1338 0.7451 -1.1131 0.9998 0.8413 4.6844 -6.9971 0.9999
April 0.1240 0.6792 -0.9871 1.0000 0.8392 4.5963 -6.6796 1.0000
GarimaTiwari et al International Journal of Current Engineering and Technology, Vol.3, No.5 (December 2013)
2156
May 0.1192 0.6636 -0.9159 1.0001 0.8654 4.8184 -6.6500 1.0000
June 0.1219 0.6676 -0.9206 1.0001 0.8908 4.8792 -6.7278 1.0000
July 0.1195 0.6653 -0.9099 1.0001 0.8772 4.8840 -6.6792 1.0000
August 0.1203 0.6700 -0.9445 0.9997 0.8454 4.7069 -6.6351 1.0000
September 0.1402 0.7680 -1.1464 0.9999 0.8466 4.6367 -6.9210 1.0001
October 0.1546 0.8606 -1.3213 1.0002 0.8747 4.8699 -7.4768 1.0000
November 0.1451 0.7948 -1.2913 0.9999 0.9013 4.9368 -8.0205 1.0000
December 0.1227 0.6830 -1.1150 1.0002 0.9034 5.0298 -8.2107 1.0000
New Delhi January 0.1440 0.8017 -1.3658 1.0001 0.9860 5.4900 -9.3530 1.0000
February 0.1642 0.8689 -1.4701 1.0000 0.9586 5.0721 -8.5807 1.0001
March 0.1590 0.8851 -1.3266 1.0002 0.9225 5.1362 -7.6976 1.0000
April 0.1401 0.7675 -1.0913 0.9998 0.9118 4.9943 -7.1010 1.0000
May 0.1283 0.7140 -0.9466 1.0005 0.9383 5.2239 -6.9196 1.0001
June 0.1306 0.7154 -0.9381 0.9999 0.9691 5.3082 -6.9603 1.0000
July 0.1296 0.7215 -0.9424 1.0001 0.9539 5.3111 -6.9362 1.0000
August 0.1405 0.7821 -1.0697 1.0002 0.9242 5.1456 -7.0377 1.0000
September 0.1722 0.9432 -1.3981 1.0000 0.9337 5.1142 -7.5802 1.0000
October 0.1956 1.0889 -1.7055 1.0001 0.9760 5.4338 -8.5104 1.0001
November 0.1820 0.9970 -1.6964 0.9998 1.0104 5.5342 -9.4157 1.0000
December 0.1418 0.7894 -1.3703 1.0001 1.0032 5.5857 -9.6960 1.0000
Patna January 0.1379 0.7677 -1.2847 1.0001 0.9516 5.2984 -8.8655 1.0000
February 0.1536 0.8125 -1.3611 1.0004 0.9243 4.8907 -8.1922 1.0001
March 0.1502 0.8364 -1.2522 0.9998 0.8931 4.9723 -7.4442 1.0001
April 0.1349 0.7386 -1.0577 1.0004 0.8856 4.8507 -6.9461 1.0000
May 0.1265 0.7045 -0.9457 0.9997 0.9127 5.0816 -6.8207 1.0000
June 0.1267 0.6937 -0.9247 1.0004 0.9391 5.1435 -6.8557 1.0000
July 0.1252 0.6970 -0.9241 1.0001 0.9246 5.1478 -6.8246 1.0000
August 0.1356 0.7548 -1.0424 1.0003 0.8975 4.9971 -6.9010 1.0000
September 0.1627 0.8910 -1.3236 1.0002 0.9038 4.9503 -7.3537 1.0000
October 0.1820 1.0134 -1.5768 0.9999 0.9401 5.2341 -8.1439 1.0000
November 0.1699 0.9307 -1.5594 0.9999 0.9714 5.3203 -8.9135 1.0001
December 0.1347 0.7499 -1.2753 1.0001 0.9658 5.3773 -9.1442 1.0000
Surat January 0.1305 0.7249 -1.1839 1.0024 0.9105 5.0692 -8.2782 1.0001
February 0.1413 0.7477 -1.2354 1.0000 0.8837 4.6763 -7.7265 1.0000
March 0.1394 0.7763 -1.1605 0.9998 0.8574 4.7736 -7.1356 1.0000
April 0.1263 0.6915 -1.0002 1.0004 0.8519 4.6660 -6.7488 1.0000
May 0.1202 0.669 -0.9150 1.0004 0.8781 4.8889 -6.6864 1.0000
June 0.1219 0.6678 -0.9107 0.9998 0.9035 4.9489 -6.7487 1.0000
July 0.1201 0.6688 -0.9055 0.9998 0.8900 4.9553 -6.7084 1.0000
August 0.1239 0.6898 -0.9660 1.0001 0.8598 4.7871 -6.7035 1.0000
September 0.1459 0.7993 -1.1915 0.9998 0.8626 4.7243 -7.0416 1.0001
October 0.1636 0.9106 -1.4043 1.0003 0.8948 4.9823 -7.6826 0.9999
November 0.1535 0.8408 -1.3797 0.9999 0.9230 5.0554 -8.2949 1.0000
December 0.1288 0.7172 -1.1861 0.9999 0.9242 5.1460 -8.5096 0.9999
Triavananthapuram January 0.1144 0.6370 -0.9797 0.9999 0.8394 4.6735 -7.1871 1.0000
February 0.1157 0.6124 -0.9772 0.9997 0.8110 4.2911 -6.8466 1.0001
March 0.1110 0.6182 -0.9206 0.9997 0.7873 4.3833 -6.5263 1.0000
April 0.1078 0.5903 -0.8764 1.0003 0.7918 4.3370 -6.4381 1.0000
May 0.1082 0.6023 -0.8656 1.0002 0.8202 4.5668 -6.5630 1.0000
June 0.1139 0.6236 -0.9036 1.0004 0.8460 4.6339 -6.7142 1.0000
July 0.1108 0.6166 -0.8824 1.0005 0.8330 4.6379 -6.6364 1.0000
August 0.1084 0.6036 -0.8758 0.9999 0.8015 4.4624 -6.4745 1.0000
September 0.1148 0.6286 -0.9443 1.0003 0.7904 4.3291 -6.5028 1.0000
October 0.1218 0.6781 -1.0215 1.0001 0.8082 4.5000 -6.7788 1.0000
November 0.1220 0.6680 -1.0400 1.0003 0.8385 4.5925 -7.1500 1.0000
December 0.1143 0.6365 -0.9833 0.9998 0.8511 4.7389 -7.3202 1.0000
GarimaTiwari et al International Journal of Current Engineering and Technology, Vol.3, No.5 (December 2013)
2157
Results and Discussion
A comparative analysis presents for daily day-length for
the twelve months, computed for the nine stations under
consideration by both formulae, Cooper’s and Hay's,
respectively. The figures show variation of difference of
Cooper over Hay formula for different months of the year
for different locations under consideration. Calculated data
of bright sunshine hours from both formulae have been
plotted for nine Indian cities along with the measured data
of entire year. The months of January to December, the
measured values are closer to Cooper than Hay. A slight
variation occurred for the months of September, October
and November which are reflected through Figs 2-10. The
deviation in Cooper formula than Hay is comparatively
less and could be used for the calculation of maximum
possible sunshine hours. If Hay formula is used the value
of SO will be much smaller than the measured values. So
on the basis of this calculation which has performed for
nine Indian locations, we give merit to Cooper formula
over Hay. Table 2 summarizes the results of the RMSE,
MBE, RPE and t value as computed for both correlations.
According to the results, Hay formula is not extremely
recommended for using to estimate S0 at stations of India.
Conclusion
The formulae developed by Hay and Cooper for
calculating day length give considerable different values,
when it is compared with the measured bright sunshine
hours. Cooper values close to the measured value even for
clear sky. And on the basis of all statistical tests : RMSE,
MBE, RPE and t test, the Cooper method showed the best
estimation of day length values for nine Indian stations.
Therefore, Cooper formula extremely recommended for
predicting day length at any location in India.
References
Lu Z,PledrahitaRH,Neto CDS.(1998),Generation of daily and
hourly solar radiation values for modeling water quality in
agriculture ponds, Transactions of the ASAE 41(6):1853-9.
Machler MA, Iqbal M. (1985), A modification of the ASHRAE
clear sky irradiation model, ASARE Transactions 9(1a):106-
15.
Trujillo JHS. (1998), Solar performance and shadow behavior in
building-case study with computer modeling of a building in
Loranca, Spain, Building and Environment 33(2-3):117-30.
ASHRAE handbook.(1999), HVAC applications. Atlanta (GA):
AHRAE.
Li DHW, Lam JC. (2000), Solar heat gain factors and the
implications for building design in subtropical regions, Energy
and buildings 32(1):47-55.
Karakoti I, Das PK and Singh SK. (2012), Predicting monthly
mean daily diffuse radiation for India, Applied Energy 91:412-
425.
Besharat F, Dehghan Ali A, Faghih Ahmad A.(2013),Empirical
models for estimating global solar radiation: A review and
case study, Renewable and Sustainable Energy Reviews
21:798-821.
Angstrom A. (1924), Solar and terrestrial radiation, Quarterly
Journal of Royal Meteorological society 50:121-5.
Prescott JA.(1940), Evaporation from water surface in relation to
solar radiation, Transactions of the Royal Society of Australia
46:114-8.
Glower J, McGulloch JSG. (1958), The empirical relation
between solar radiation and hours of sunshine, Quarterly
Journal of Royal Meteorological society 84:172.
Page JK. (1961), The estimation of monthly mean values of daily
total short wave radiation on vertical and inclined surfaces
from sunshine records for latitudes 40oN-40oS,In: Proceedings
of UN conference on new source of energy 378-90.
Rietveld M. (1978), A new method for estimating the regression
coefficients in the formula relating solar radiation to sunshine,
Agricultural Meteorology 19:243-52.
Dogniaux R, Lemoine M. (1983), Classification of radiation sites
in terms of different indices of atmospheric transparency,
Solar radiation data, Solar energy research and development in
the European community series F, 2:94-107.
Kilic A, Oztruck A. (1983), Solar energy, Kipas Distribution,
Istanbul, Turkey.
Benson RB, Paris MV, Sherry JE, Justus CG. (1984), Estimation
of daily and monthly direct diffuse and global solar radiation
from sunshine duration measurements, Solar Energy
32(4):523-35.
Ogelman H, Ecevit A, Tasdemiroglu E. (1984), A new method
for estimating solar radiation from bright sunshine data, Solar
Energy 33:619-25.
Bahel V, Srinivasan R, Bakhsh H. (1986), Solar radiation for
Dhahran, Saudi Arabia, Energy 11:985-9.
Zabara K. (1986), Estimation of the global solar radiation in
Greece, Solar and wind technology 3(4):267-72.
Bahel V, Srinivasan R, Bakhsh H. (1987), A correlation for
estimation of global solar radiation, Energy 12:131-5.
Gopinathan KK. (1988), A simple method for predicting global
solar radiation on a horizontal surface, Solar and Wind
Technology 5:581–3.
Newland FJ. (1988), A study of solar radiation models for the
coastal region of South China, Solar Energy 31:227–35.
Soler A. (1990), Monthly specific Rietveld’s correlations, Solar
and Wind Technology 7:305–8.
Luhanga PVC, Andringa J. (1990), Characteristic of solar
radiation at Sebele, Gaborone, Botswana, Solar Energy 44:71–
81.
Louche A, Notton G, Poggi P, Simonnot G. (1991), Correlations
for direct normal and global horizontal irradiation on a French
Mediterranean site, Solar Energy 46:261–6.
Samuel TDMA. (1991), Estimation of global radiation for Sri
Lanka, Solar Energy 47:333–7.
Gopinathan KK, Soler A. (1992), A sunshine dependent global
insolation model for latitudes between 60oN and 70oN,
RenewableEnergy 2(4/5):401–4.
Raja IA. (1994), Insolation sunshine relation with site elevation
and latitude, Solar Energy 53:53–6.
Coppolino S. (1994), A new correlation between clearness index
and relative sunshine, Renewable Energy 4(4):417–23.
Tiris M, Tiris C, Ture IE. (1996), Correlations of monthly-
average daily global diffuse and beam radiations with hours of
bright sunshine in Gebze, Turkey, Energy Conversion and
Management 37:1417–21.
Ampratwum DB, Dorvlo ASS. (1999), Estimation of solar
radiation from the number of sunshine hours, Applied Energy
63:161–7.
Klabzuba J, Bures R, Koznarova V. (1999), Model calculation of
daily sums of global radiation used in growth models, In:
Proceedings of the bioclimatology labour hours, Zvolen, p.
121–2.
GarimaTiwari et al International Journal of Current Engineering and Technology, Vol.3, No.5 (December 2013)
2158
Togrul IT, Togrul H, Evin D. (2000), Estimation of monthly
global solar radiation from sunshine duration measurements in
Elazig, Renewable Energy 19:587–95.
Elagib N, Mansell MG. (2000), New approaches for estimating
global solar radiation across Sudan, Energy Conversion and
Management 41:419–34.
Togrul IT, Togrul H, Evin D. (2000), Estimation of global solar
radiation under clear sky radiation in Turkey, Renewable
Energy 21:271–87.
Almorox J, Hontoria C. (2004), Global solar radiation estimation
using sunshine duration in Spain, Energy Conversion and
Management 45:1529–35.
Jin Z, Yezheng W, Gang Y. (2005), General Formula for
estimation of monthly average daily global solar radiation in
China, Energy Conversion and Management 46:257–68.
El-Metwally M. (2005), Sunshine and global solar radiation
estimation at different sites in Egypt, Journal of Atmospheric
and Solar-Terrestrial Physics 67:1331–42.
Almorox J, BenitoM, Hontoria C. (2005), Estimation of monthly
Angstrom–Prescott equation coefficients from measured daily
data in Toledo, Spain, Renewable Energy 30:931–6.
Rensheng C, Shihua L, Ersi K, Jianping Y, Xibin J. (2006),
Estimating daily global radiation using two types of revised
models in China, Energy Conversion and Management
47:865–78.
Sen Z. (2007), Simple nonlinear solar irradiation estimation
model, Renewable Energy 32:342–50.
Bakirci K. (2008), Correlations for estimation of solar radiation
on horizontal surface, Journal of Energy Engineering
134(4):130–4.
Bakirci K. (2009), Correlations for estimation of daily global
solar radiation with hours of bright sunshine in Turkey, Energy
34:485–501.
Katiyar VK, Katiyar AK, Srivastava SK. (2009), Empirical
relationship of sixth order to estimate global solar radiation
from hours of sunshine, Journal of Agrometeorology 11(2):97-
101.
Liu BYH, Jordan RC. (1960), The relationship and
characteristics distribution of direct diffuse and total radiation,
Solar Energy 4(3):1-19.
Al-Mohamad A. (2004), Global, direct and diffuse solar radiation
in Syria, Applied Energy 79(2):191-200.
Diez-Mediavilla M, Miguel AD, Bilbao J. (2005), Measurement
and comparison of diffuse solar irradiance models on inclined
surfaces in Valladolid (Spain), Energy conversion and
management 46(13-14):2075-92.
Tarhan S, Sari A. (2005), Model selection for global and diffuse
over the central Black Sea (CBS) region of Turkey, Energy
conversion and management 46(4): 605-13.
Aras H, Balli O, Hepbasli A. (2006), Estimating the Horizontal
diffuse solar radiation over the central Anatollio region of
Turkey, Energy conversion and management 47(15-16): 2240-
9.
Noorian AM, Moradi I, Kamali GA. (2008), Evaluation of 12
models to estimate hourly diffuse radiation on inclined
surfaces, Renewable Energy 33(6): 1406-12.
El-sebali AA, Al-Hazmi FS, Al-Ghamdi, Yaghmour SJ. (2010),
Global, direct and diffuse solar radiation on horizontal and
tilted surfaces in Jeddah, Saudi Arabia, Applied Energy 87:
568-76.
Bolanda J, Ridleya B, Brownb B. (2008), Models of diffuse solar
radiation, Renewable Energy 33: 575-584.
Jiang Y. (2009), Estimation of monthly mean daily diffuse
radiation in China, Applied Energy 86: 1458-1464.
TirisM,Tiris C, Ture IE. (1996), Correlations of monthly average
daily global diffuse and beam radiations with hours of bright
sunshine in Gebze, Turkey, Energy conversion and
management 37(9): 1417-21.
Barbaro S, Cannato G, Coppolina S, Leone C, Sinagra E. (1981),
Diffuse solar radiation statistics for Italy, Solar Energy 26:
429-35.
Jain PC. (1990), A model for diffuse and global irradiation on
horizontal surfaces, Solar Energy 45:301-8.
Haydar A, BalliO,Hepbasli A. (2006), Estimating the horizontal
diffuse solar radiation over the central Anatolia region of
Turkey, Energy conversion and management 47: 2240-9.\
Pandey CK, Katiyar AK. (2009), A comparative study to
estimate daily diffuse solar radiation over India, Energy 34:
1792–1796
Cooper PI. (1969), Solar Energy 12: 333-346.
Hay JE. (1979), Solar Energy 23(4): 301-307.
Khorasanizadeh H, Mohammadi K. (2013), Introducing the best
model for predicting the monthly mean global solar radiation
over six major cities of Iran, Energy 51:257-266
Wenxian L. (1988), A general correlation for estimating the
monthly average daily direct radiation incident on a horizontal
surface in Yannan Province, China, Solar Energy 41(1):1-3.
Wenxian L, Enrong L, Wenfeng G, Shaoxuan P and Tao L.
(1996), Distribution patterns of diffuse solar radiation in
Yannan Province, China, Energy Conversion and
Management37(5):553-560.
Sambo AS. (1986), Empirical models for the correlation of
global solar radiation with meteorological data for northern
Nigeria, Solar &Wind Technology3(2): 89-93.
Feuillard T, Abillon JM and Bonhomme R. (1989), Relationship
between global solar irradiation and sunshine duration in
Guadeloupe, Solar Energy43(6): 359-361.
Ma CCY, Iqbal M. (1984), Statistical comparison of solar
radiation correlations: monthly average global and diffuse
radiation on horizontal surfaces, Solar Energy 33(2): 143-148.
Bashahu M. (2003), Statistical comparison of models for
estimating the monthly average daily diffuse radiation at a
subtropical African site, Solar Energy 75: 43-51.