Embed Size (px)
Citation preview

VARIABLE ANNUITY (“VA”) PRODUCTS PRICING CHALLENGES AND ISSUES
10th Annual Equity Based Insurance Guarantee Conference (Chicago)
Session 1B: November 17, 2014 (1045 – 1215 hours)
Amit Ayer

Executive Summary Tactical challenges and issues with VA pricing
Elements of VA Pricing Framework - Tactical
Principle Description Impact Rider
Charge
Reserves
/ Capital Profitability Hedging
A Presence of
living benefit
Presence of living benefit rider places increased pressure on
adequate pricing framework
B Risk-neutral
and real-world
frameworks
VA pricing framework is cumbersome because it must be
performed using risk-neutral and real world frameworks
C Multiple risk
management
incentives
Heterogeneity in risk management incentives necessitates VA
pricing functions to be agile and flexible
D Accounting
asymmetries
on capital
Heterogeneity in accounting frameworks necessitates VA
pricing functions to be agile and flexible
E Projection of
hedging in
pricing
Reflecting hedging in pricing remains an arduous process with
a range of practices
F Pricing and
capital
markets
Even robust pricing of VAs cannot withstand prolonged
markets with high realized volatility
2 Significant impact to pricing Insignificant impact to pricing

Executive Summary Strategic challenges and issues with VA pricing
Elements of VA Pricing Framework - Strategic
Principle Description Impact Rider
Charge
Reserves
/ Capital Profitability Hedging
G Pricing
Metrics
Lack of convergence around pricing metrics makes VA pricing
process more difficult
H Scrutiny on
pricing
targets
VA writers are able to meet pricing targets, but greater scrutiny
on pricing targets is warranted
I VA
disclosures
The deficiencies in VA disclosures should be further
investigated and improved
J Volatility
managed
funds
Pricing of target volatility funds requires care and impact on
statutory requirements should be further analyzed
K VA Exchange
offers
Exchange offers have demonstrated success across VA
markets to eliminate liabilities from balance sheet through
various offers
L VA
reinsurance
market
Rejuvenated VA reinsurance market offers more flexibility with
regard to VA pricing frameworks
3 Significant impact to pricing Insignificant impact to pricing

Agenda
Interdependencies between VA pricing components
Challenges and Issues with VA pricing
Lack of convergence around VA pricing metrics and anomalous
pricing results
Shortcomings with GAAP/IFRS ROE profitability metrics
Reactions to VA pricing difficulties
Questions and answers
4

INTERDEPENDENCIES BETWEEN VA PRICING COMPONENTS

Interdependencies between VA pricing components require an optimal risk-return balance
Background Traditional product pricing exercise searches for premium rate that meets desired profit target
Despite same fundamental objective for variable annuities, VA pricing exercise is much more
complicated because of presence of living benefit rider
Four elements of VA pricing process are intertwined and influence each other
• Hedging implemented to reduce
economic risk, and directly affects
the reserve / capital requirements
and profitability
• Warrants analysis of not just
expected value but also tail events
• Economic, GAAP and statutory
considerations
• Sensitive to market conditions and
policyholder behavior
• Warrants analysis of not just
expected value but also tail events
• Profitability affected by interest
earned on reserves / capital and
changes in reserves / capital levels
• Many companies opt for stochastic
projections of reserves / capital
• Rider charge set with long-term view
• Industry unlikely to factor to re-
setting GLB rider charge on
frequent basis
Reserves / Capital Hedging
Rider charge
Profitability
6

CHALLENGES AND ISSUES WITH VA PRICING

Presence of living benefit rider places increased pressure on adequate pricing framework
Living benefit rider materially changes risk profile of base VA contract
Dimension VA Base Contract Living Benefit Rider
Contribution
to risk of
rider
1 Profitability • Without the living benefit rider, profitability
relates to accruing fees that are adequate
to cover expenses and death claims
• Driven primarily by performance of underlying
investments
2 Risk profile
• Roughly equivlavalent probability of upside
loss and gain since base product passes
most of investment risk to policyholders
• No embedded derivatives
• Increases risk of making large guaranteed payments,
with low upside gain
• Embedded derivatives
3 Drag on separate
account value
• M&E fee only, with no volatility in separate
accounts
• Increased drag on account value from rider fees and
potential downward movements in separate
accounts
4 Policyholder
behavior • Minimal
• Living benefit rider contributes higher degree of
uncertainty around policyholder behavior
5 Reserve and
capital
requirements
• Dependent on equity long term expected
volatilities for reserve and capital charges
• AG43 and C3 Phase-II requirements (while
principles based) are higher in presence of living
benefit rider
6 Risk
Management • Typically not hedged
• Cost of hedging (economic, GAAP, statutory, or
combination)
Significant impact to risk profile Insignificant impact to risk profile
A B C D E F

VA pricing framework is cumbersome because it must be performed using risk-neutral and real world frameworks (1/2)
Common approach to risk neutral pricing in VA pricing (illustrative)
9
0
20
40
60
80
100
120
140
160
180
Ba
sis
Po
ints
(b
ps
)
Real world pricing
(reserves / capital)
Cost of Hedging
PAD / Profit
VA
pro
du
ct
(rid
er
fee
an
d b
as
e c
on
tra
ct)
1
2
3
4
Risk neutral valuation
• Almost all companies make a provision for the risk
neutral cost of the rider in pricing
• Business can be priced at today’s market conditions, the
product could be sold for up to two years
– Profitability results for business priced today are
by definition already stale tomorrow
1
Note – reflection of hedging in VA pricing is covered in Issue #5
A B C D E F
Risk Neutral Pricing /
“Economic Hedge
Cost”
Observations
• Two primary approaches in generating risk-neutral
scenarios
– Use current market conditions to develop risk-
neutral scenarios to calculate rider cost
– Use long-term estimates to generate risk-neutral
scenarios to calculate the rider cost
• Three methods used to set implied volatility for later
tenors
– Grade from longest-credible market-observable
tenor to target value
– Hold level at longest-credible market-observable
tenor
– Use level volatility throughout (e.g., long term
estimates)

VA pricing framework is cumbersome because it must be performed using risk-neutral and real world frameworks (2/2)
Common approach to real-world pricing in VA pricing (illustrative)
10
0
20
40
60
80
100
120
140
160
180
Ba
sis
Po
ints
(b
ps
)
Real world pricing
(reserves / capital)
Cost of Hedging
PAD / Profit
VA
pro
du
ct
(rid
er
fee
an
d b
as
e c
on
tra
ct)
1
2
3
4
Real-world pricing
Cost of hedging is calculated using a variety of methods,
implemented as en expense throughout base product
pricing (cannot lock in hedging costs today)
PADs are an additional buffer for deviations away from
expected loss (i.e., unexpected losses, which is
consistent with definition of capital)
Reserves / Capital Description
1 Less refined • Develop set of factors that may vary on product
feature, duration, ITM
2 More refined
• Real-world scenarios to project reserve / capital
requirements
• Open considerations: number of scenarios, time
steps
3
Note – reflection of hedging in VA pricing is covered in Issue #5
4
A B C D E F
Risk Neutral Pricing /
“Economic Hedge
Cost”
“Expense”
items Description
1 Economic
Hedge Cost
• Incorporated as an “expense” in base product pricing
through real-world scenarios
2 Hedge
Effectiveness
• Provision for hedge ineffectiveness by allowing portion
of real-world claims to flow through their integrated base
product and rider pricing
2a
2b
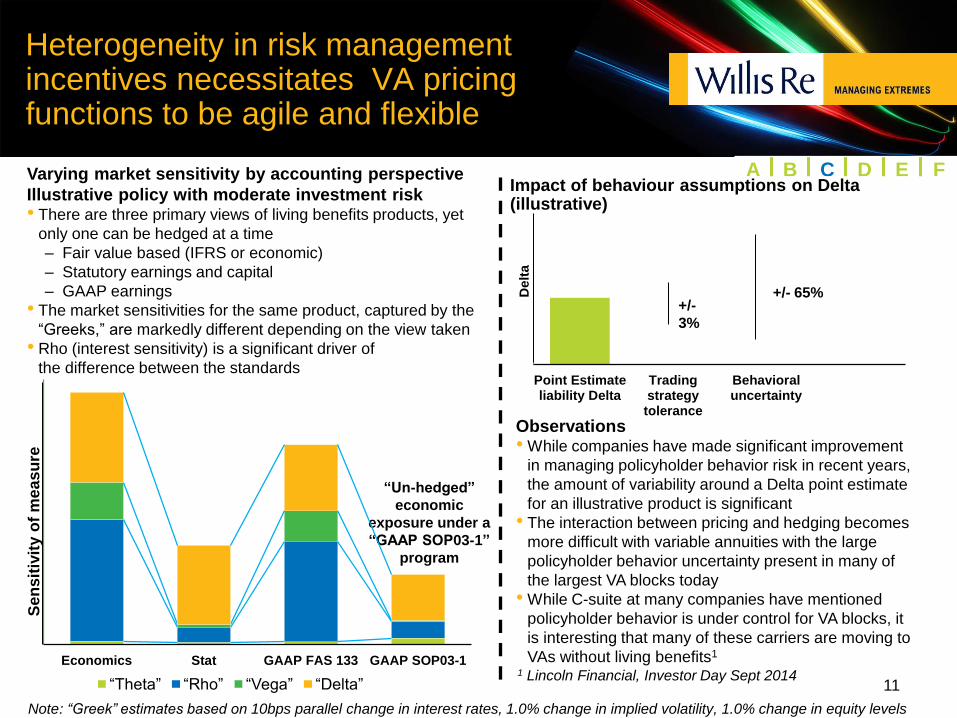
Varying market sensitivity by accounting perspective
Illustrative policy with moderate investment risk • There are three primary views of living benefits products, yet
only one can be hedged at a time
– Fair value based (IFRS or economic)
– Statutory earnings and capital
– GAAP earnings
• The market sensitivities for the same product, captured by the
“Greeks,” are markedly different depending on the view taken
• Rho (interest sensitivity) is a significant driver of
the difference between the standards
Heterogeneity in risk management incentives necessitates VA pricing functions to be agile and flexible
11
A B C D E F
Note: “Greek” estimates based on 10bps parallel change in interest rates, 1.0% change in implied volatility, 1.0% change in equity levels
“Un-hedged”
economic
exposure under a
“GAAP SOP03-1”
program
Point Estimateliability Delta
Tradingstrategytolerance
Behavioraluncertainty
Delt
a
+/-
3%
+/- 65%
Observations • While companies have made significant improvement
in managing policyholder behavior risk in recent years,
the amount of variability around a Delta point estimate
for an illustrative product is significant
• The interaction between pricing and hedging becomes
more difficult with variable annuities with the large
policyholder behavior uncertainty present in many of
the largest VA blocks today
• While C-suite at many companies have mentioned
policyholder behavior is under control for VA blocks, it
is interesting that many of these carriers are moving to
VAs without living benefits1
1 Lincoln Financial, Investor Day Sept 2014 Economics Stat GAAP FAS 133 GAAP SOP03-1
Se
nsit
ivit
y o
f m
ea
su
re
“Theta” “Rho” “Vega” “Delta”
Impact of behaviour assumptions on Delta (illustrative)
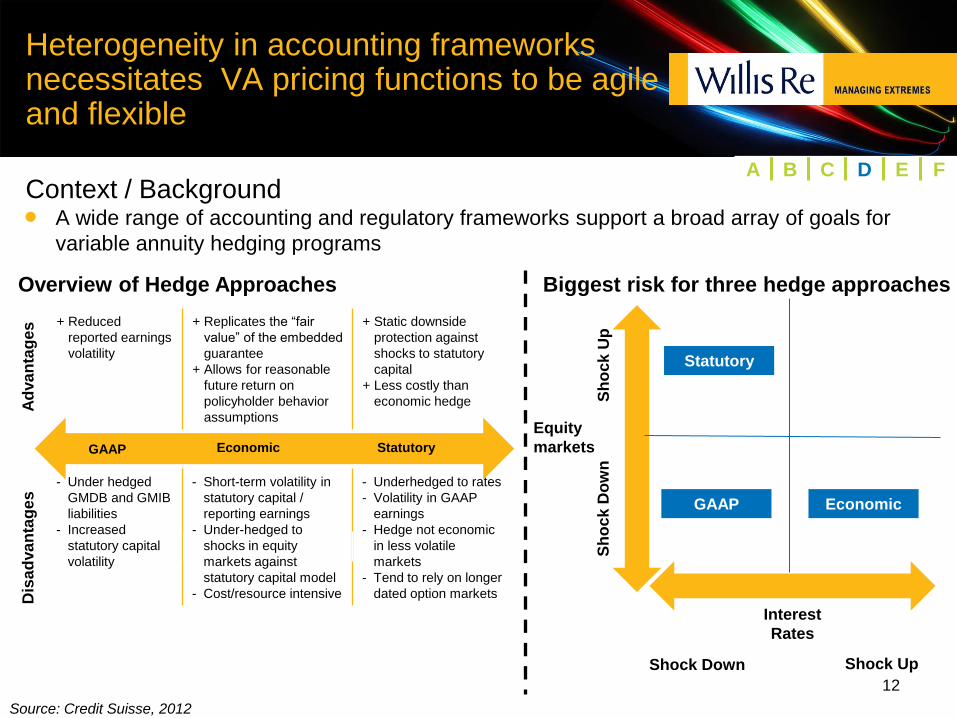
Heterogeneity in accounting frameworks necessitates VA pricing functions to be agile and flexible
Context / Background A wide range of accounting and regulatory frameworks support a broad array of goals for
variable annuity hedging programs
12
Overview of Hedge Approaches
GAAP Economic Statutory
+ Reduced
reported earnings
volatility
+ Replicates the “fair
value” of the embedded
guarantee
+ Allows for reasonable
future return on
policyholder behavior
assumptions
+ Static downside
protection against
shocks to statutory
capital
+ Less costly than
economic hedge
Ad
va
nta
ges
- Under hedged
GMDB and GMIB
liabilities
- Increased
statutory capital
volatility
- Short-term volatility in
statutory capital /
reporting earnings
- Under-hedged to
shocks in equity
markets against
statutory capital model
- Cost/resource intensive
- Underhedged to rates
- Volatility in GAAP
earnings
- Hedge not economic
in less volatile
markets
- Tend to rely on longer
dated option markets Dis
ad
va
nta
ge
s
Source: Credit Suisse, 2012
Biggest risk for three hedge approaches
Equity
markets
Sh
ock
Up
S
ho
ck
Do
wn
Shock Down Shock Up
Statutory
GAAP Economic
A B C D E F
Interest
Rates

FAS
SOP
Insurer A Insurer B
Additional
capital
Accounting differences for same product can create pricing pressures due to distortions in capital outcomes
Context Two variable annuity contracts with same liabilities
One is accounted for using FAS 133
Other is accounted for using SOP 03-1
13
Hypothetical GAAP liability under
interest rate stress scenario
GAAP Liability value
FAS 133: carrying at fair value
SOP 03-1: carrying at “least present value” of
cash flows
FAS 133: market interest rate assumption
SOP 03-1: “real world” interest rate
assumptions
SOP 03-1 improves capital position SOP 03-1 reduces interest rate sensitivity
FAS
SOP
Insurer A Insurer B
Additional
liabilities in
stress scenario
A B C D E F

Reflecting hedging in pricing remains an arduous process with a range of practices
Reflection of hedging in pricing models is not uniform across
insurers Hedging approach generally impacted by a number of factors, including:
– Accuracy of results
– Complexity of implementation, validation, inputs and analysis
– Computational demands (software and hardware)
14
Range of
practices Description Sophistication Accuracy
1 Reinsurance • Assume that portion of claims along real world projection is reinsured
2 Change in
Liabilities • Hedge payoff is some assumed percentage of change in liability
3 Proxy of hedge
transactions
• Make Black-Scholes approximation on value of hedge assets along
real world scenario
4 Explicit projection
of hedging
Transactions
• Full nested stochastic projection
A B C D E F

Even robust pricing of VAs cannot withstand prolonged markets with high realized volatility
Disconnect exists between real world scenarios used to project
statutory balance sheet items and risk neutral scenarios used to project
change in market value of hedges
Higher implied volatility levels will increase the cost of hedging
associated with Delta hedging
15
A B C D E F
Statutory requirements for GMAB policy – impact of dynamic hedging with index futures
0
20
40
60
80
100
120
140
Unhedged 10% vol 15% vol 20% vol 25% vol 30% vol 35% vol
Sta
tuto
ry r
eq
uir
em
en
t
AG43 Reserves Required Capital
Observations • AG43 requirement increases
with Delta hedging strategy, requiring no required capital.
• AG43 requirement with a Delta hedging strategy displays high sensitivity to implied volatilities, as Delta positions are sensitive to changes in implied volatility.

LACK OF CONVERGENCE AROUND VA PRICING METRICS AND
ANOMALOUS PRICING RESULTS

Lack of convergence around pricing metrics makes VA pricing process more difficult
General observations Rider cost coverage, statutory IRR, and statutory VNB margins are the most prevalent
primary metrics
Statutory earning / capital strain and return on assets (ROA) are other significant metrics
While there is not one “correct” VA pricing metric, the variability of metrics across the industry
is expansive
17
Source: Towers Watson 2013 Pricing Survey
0
2
4
6
8
10
12
Rider costcoverage
Statutory IRRon capital
Statutory VNBmargins
Statutoryearnings/capital
strain
Marketconsistent VNB
ROA ROE Statutorycapital/EAR
GAAP ROE typically
promulgated in
investor disclosures
Rider charge /
hedge cost
G H I J K L

VA writers are able to meet pricing targets, but greater scrutiny on pricing targets is warranted
General observations Companies reported significant
differences between pricing targets and
minimum tolerable levels
Companies pricing on a GAAP/IRFS
basis tended to have higher target ROEs
than overall industry statutory IRR figures
Companies are more apt to accept lower
hedge cost minimum due to low interest
rate environment
GAAP/IFRS ROEs are often inflated
(discussed during next section)
18
Source: Towers Watson 2013 Pricing Survey
GAAP/IFRS Pricing Targets and Minimums
Statutory Pricing Targets and Minimums
G H I J K L
0.0%
5.0%
10.0%
15.0%
20.0%
15th Mean 85th
US GAAP/IFRS ROE - Target
US GAAP/IFRS ROE - minimum tolerable
0.00%
5.00%
10.00%
15.00%
20.00%
15th Mean 85th
Statutory IRR on Capital - target
Statutory IRR on Capital - minimum tolerable

SHORTCOMINGS WITH GAAP/IFRS ROE PROFITABILITY METRICS

Disconnected
from liability
valuation
Issues with GAAP VA general account balance sheet
GAAP variable annuity general
account balance sheet
20
Commentary • Inconsistent accounting treatment for
identical economic cash flows
• GMIB/GMDB vs. GMWB
• Rider vs. base contract
• Inconsistent assumptions across different
companies
• DAC mean reversion assumptions
• Different assumptions around
application of FAS 157
• Lack of transparency as to value and in
some cases the performance of the hedge
position
• Little transparency around “sources of
earnings”
• Inconsistent definition of where results
appear (Net Income vs OCI)
FAS 133 guarantees
0
200
400
600
800
1000
1200
Assets Liabilities
DAC
GAAP
value of
guarantee
fees
Net MV
hedge
assets
SOP 03-01
guarantees
Valuation
based on
non-market
assumption
is at odds
with an
economic
viewpoint
Assumptions
locked in at
issue; relies
on mean
reversion
G H I J K L

Background on VA “opaqueness” around variable annuity writers
21
The Insured Retirement Institute's study found a lack of disclosure
among annuity manufacturers around their investment hedging
strategies is depressing stock valuations
UBS Securities Managing Director Andrew Kligerman
– “Investors want to know more about the effectiveness and cost of hedging, the
sensitivity of VA products to equity markets and interest rates, and where excess
capital is going”
– “Clearly greater transparency is needed in the industry, which will improve investors’
perception as to the sectors’ strength and unlock capacity for growth”
Failing to meet investor expectations around transparency is largely due
to companies viewing their strategies as proprietary, thus providing full
transparency may place companies at competitive disadvantage
G H I J K L

Articulation of “Opaqueness” Discount
• U.S. life insurers continue to trade at material discounts to
reported GAAP book value and exhibit low price / book ratios
compared to rest of the financial services industry
22
Source: Factset, company reports, UBS (6/30/12)
G H I J K L

Major deficiencies in current VA disclosures
Deficiency Description Impact
1 Little transparency
into the value of
new business
• Provide little visibility into new business profitability
• Insurers do not communicate the underlying capital markets
assumptions behind these stated ROEs
• Full disclosures could help investors
understand that they have cheaper, and
certainly more transparent, vehicles to take
these types of capital markets positions
2 Performance of the
business over time
cannot be tracked
• In an attempt to foster greater understanding of their financial results,
many insurers have introduced modified earnings definitions that
leverage existing GAAP calculations
• Modified definitions are still rooted in GAAP concepts with all
attendant shortcomings.
• Adjusted performance measures have
often left investors even more confused
and skeptical of companies’ assertions of
satisfactory VA performance
3 Lack of credibility
of true tail risk
protection
• During the financial crisis, some insurers with large VA exposures
suffered substantial capital calls forcing them to raise capital when
valuations were at a trough.
• Current disclosures do not provide
investors adequate assessment of whether
a given business is well protected against
such ill-timed capital calls going forward.
4
Disconnect between
economic
valuations and
GAAP and Statutory
frameworks
• Price to GAAP Book multiples for valuation benchmarks have
limitations
– Inconsistent valuation of liabilities
– Asset valuations geared to capital markets (not all DAC assets
are created equal)
• The framework can leads to instances
where risk management decisions can
inappropriately influence reserve levels,
with the effect that reserves can increase
as a result of more hedging
G H I J K L

Elements of better VA disclosures
In order to address these issues, a framework for better VA
disclosure needs to accomplish four things:
24
Area of Improvement Description
1 Prove new business written is
profitable
• Portray new business profitability through objective metrics that can be compared across
companies and linked to overall capital efficiency goals
2 Demonstrate the effectiveness of
hedging
• Allow the assessment of how much slippage has incurred between the hedge portfolio and the
liability target, and how much unhedged positions have moved
3 Support valuation of the in force
business
• Provide pertinent information to investors to better assess the risk-adjusted economics of the in-
force to inform valuations
4 Investors’ dislike for VAs is
indiscriminate
• Establish that under harsh, yet conceivable, stress scenarios, the combination of hedging, re-
insurance and other balance sheet resources is sufficient to protect key capital ratios
These disclosures should improve transparency to the financial
performance of VA blocks and enable investors to make informed
judgment on proper valuation and ultimately reduce the
opaqueness discount.
G H I J K L

REACTIONS TO VA PRICING DIFFICULTIES

Pricing of target volatility funds requires care and impact on statutory requirements should be further analyzed
26
Volatility managed funds and other new product features are now
common feature to reduce benefit cost and/or reduce challenges
associated with hedging
Dimension Benefits of volatility managed funds Considerations of volatility managed funds
1 Cost of
guarantee
• Potential for moderate reduction in economic losses
• Downside protected from fund rebalancing mechanisms,
preserving account value and lowering claims
• Cost of guarantee lowered, but heavily dependent on
algorithm of volatility managed fund
2 Statutory • Minimal • Impact on statutory requirements is minimal compared to
impact on economics
3 Hedging • Delta sensitivity is lowered markedly with volatility
managed funds
• Material reduction in Vega exposure offers strong benefits
from risk management standpoint
G H I J K L

Case study parameters on volatility managed funds
Modeling of rebalancing strategies
(static versus historical volatility)
Static strategy – asset allocation between equity and bond is fixed
(75% equity 25% bond) at each time step
– equity return >> bond return, sell equity and buy
bond
– bond return >> equity return, purchase equity
and sell bond
“Exponentially Weight Moving Average” – allocation between equity and bond depends on
historical annualized rolling portfolio volatility
– weighting of more recent returns more heavily
(exponentially weighted)
– at each time step, historical annualized volatility
is compared to a target volatility (15%)
VIX
– Based on stochastic projection of VIX index
27
Model specifications
Interest rate Two-factor Hull-White
Volatility Heston
Projection period 40 years
Rebalancing frequency Monthly
*Correlation between equity and interest rates
Product specifications
Issue age 55
Starting AV $100,000
Rollup rate 3%
Rollup frequency Monthly
Ratchet Annually for 10 years
Withdrawal rate 5%
Contract fee 1.81%
MER fee 0.85%
G H I J K L

Impact of volatility managed strategies on Greek sensitivities
28
-$40
-$20
$0
$20
$40
$60
$80
$100
Reserve Delta Reserve Gamma Reserve Rho Reserve Vega
Vega changes most materially relative to a static strategy
Static EWMA VIX
Greek Potential impact of target volatility strategies
Delta • Reduction in dollar Delta • Less transactions in equity futures, reducing transaction costs and cost of hedging
Gamma • Reduction in dollar Gamma for VIX strategy • Mitigate hedge breakage during market volatility (Gamma or gap risk is typically not hedged)
Rho • Reduction in dollar Rho • Less transactions of interest rate swaps/Treasury futures in low interest rate environment
Vega • Significant reduction in Vega • Reduce need to enter into long dated puts or variance swaps
G H I J K L

Exchange offers have demonstrated success across VA markets to eliminate liabilities from balance sheet through offers
29
Assessment of exchange offer target
Size / Homo-geneity
Mitigating adverse selection
Variance in economic vs
perceived value
Overall assessment
for offer target Commentary
Old
er
des
ign
s
Guaranteed Minimum Death Benefit
• Subject to anti-selection if policyholders have non-uniform health status • Typically have low perceived value compared to economic value, in
particular for enhanced death benefits • Enhanced death benefits are excellent offer targets
Guaranteed Minimum Accumulation Benefit
• Relatively homogeneous, with low expected lapse rates • Low perceived value compared to intrinsic value • Benefits that are past surrender charge and are close to expiry are
excellent offer targets
Mo
de
rn d
es
ign
s
Guaranteed Minimum Withdrawal Benefit (non-lifetime)
• Relatively homogeneous, typically return of premium • Lower perceived value than lifetime withdrawal benefit
Guaranteed Minimum Income Benefit
• Not homogeneous, as older regimes require election of annuitization not present in modern designs
• Target older regimes of income benefits that require election of annuitization, as perceived value is likely lower compared to more recent regimes
Guaranteed Minimum Lifetime Withdrawal Benefit
• Variety of designs makes product heterogeneous • Highly lapse supported product makes mitigating adverse selection difficult • High economic values (rich features) and high perceived values (lifetime
income desired) make for poor offer targets
Significant characteristics across dimension Some characteristics across dimension Minimal characteristics across dimension
G H I J K L

Rejuvenated VA reinsurance market offers more flexibility with regard to VA pricing frameworks
30
Markets Description
1 Reinsurers
• Highly rated reinsurers are increasingly inquisitive about VA risks due to following reasons:
– Improve transparency around policyholder behavior frameworks
– Improved transparency around GAAP/IFRS profitability targets
– Emphasis on “sustainable products” with continued emphasis on volatility managed funds that afford policyholder
up-side
• Increased potential for diversification for reinsurers
• Most of the broader reinsurance market we have spoken with has expressed interest in variable annuity products
2 Banks
• Increased transparency being impetus for increased demand to take on risks in VA contracts
• Union Hamilton / Wells Fargo reinsurance deal for one of Lincoln’s largest living benefit rider started in 2013
• Banks have expressed similar inquisitions into taking on VA risks
The increased demand for VA reinsurance will certainly alter the VA
product development and / or pricing landscape
G H I J K L

APPENDIX

Surrender Charge
The standard cash flows involved in a variable annuity contract are depicted below
Variable Annuity – key cash flow
diagram
32
Variable Annuity – key cash flow descriptions
Cashflow Description
Initial
Commission
• Paid by insurer to adviser at policy issue
• Typically ~ 5% of deposit
Trailer
Commission
• Paid by insurer to adviser in Years 2+ while business is
inforce
• Typically 0.5% – 1%. May be a function of deposit or AV
Investment
Management
Fee
• Fee charged for the management of the funds
in policy
• Typically 150 – 200 bps of AV
• Investment manager shares IMF with insurer
Insurance
charge
• Sometimes called M&E
• Typically 10 – 20 bps of AV
Rider charge • Fee to support rider
• Ranges between 50 – 100 bps of GV
Admin charge • Fee for contract admin; usually $30
Surrender
charge
• Paid by policyholder to insurer in the event of lapse (to
compensate for commissions paid)
• Typically 7 – 8%; declining by 1% pa
Separate
Account
Policyholder
Investment manager
Advisor
General
Account
Deposit
Commission
(Initial +
Trailer)
IMF = Investment
Management Fee
IMF
Insurance charge
Administrative Charges
Rider charge
Expenses
(e.g.,
Marketing,
Maintenance)
Revenue
sharing

Dimension Description Solution Focal
Point
1 GLB rider charge • Adequacy of GLB rider charge should be
addressed on an on-going basis • Risk neutral valuation
2 Profitability of
contract
• Contract profitability should be analyzed
through stochastic scenarios with focus on
both mean and tail results
• Stochastic simulation, with focus across variety of
CTE(x%)
3 Reserve / Capital
requirements
• Impact of reserve and capital requirements
should be integrated into profit analysis of
base contract
• Utilize inner loop functionality, using real world
scenarios to determine capital adequacy
4 Impact of hedging • Hedging impact should be analyzed in profit
analysis
• Variety of approaches available, with most
sophisticated being inner-loop nested stochastic
scenarios to simulate payoff of hedge assets
5 VA reinsurance
market
• With increased demand for VA reinsurance
solutions, pricing frameworks should
understand landscape of reinsurers and
banks in market
• Reinsurance can help reduce tail risk or diversify
existing VA block of business
Elements of pricing framework will help companies maintain profitability in variety of economic scenarios
Robust VA pricing framework will help companies maintain profitability in
variety of economic scenarios
33 Significant impact to pricing Insignificant impact to pricing

Today, the most common type of guarantee is the Guaranteed Minimum Withdrawal Benefits (GMWB) and Income Benefit (GMIB), which are similar
Guarantee description Insurer provides policyholder with a guaranteed withdrawal amount that never declines and
continues for life
Insurers incur guarantee claims equal to all withdrawals once the account value is
exhausted
Withdrawals can be fixed in number (e.g., 20 withdrawals permitted for 5% withdrawal rate)
or allowed for the lifetime of the insured
ROP GMWB – Policyholder taking regular withdrawals
Age /Time
Withdrawals incur
guarantee claims Withdrawals reduce account
value
Strong market performance can
increase account value…
…but persistent withdrawals
tend to reduce it over time
Policyholder withdrawal
from account value
ROP benefit
base
Policyholder withdrawal
funded by insurer (i.e., claim) Account value

Consistency of VA guarantee valuation
Issue / context Currently, FAS 133 is used for valuation of most Guaranteed Minimum
Withdrawal Benefits (GMWB) and Guaranteed Minimum Accumulation Benefits (GMAB), while SOP 03-01 is used for all other GMxBs
– FAS 133 produces valuations more consistent with economics, larger in magnitude and more sensitive to market changes
– SOP 03-1 produces valuations that are starkly different than the economics, smaller in magnitude and less market-sensitive
Two VA contracts with highly similar risk and value characteristics could receive very different values in the stress test
Outline of alternatives This could create significant differences in stress test results for two insurers with
similar long-run risk and value profiles
35
Status quo Apply market consistent treatment for all VAs
Description • FAS 133 for valuation of most GMWBs and GMABs, SOP
03-1 for other GMxBs
• Fees are not capitalized
• FAS 133 for all VAs
• Fees are not capitalized
Pros (+) /
Cons (−)
+ Consistent with current GAAP accounting framework
– Inconsistent treatment of liabilities with similar risk profiles
– SOP 03-1 valuation is inconsistent with “economics”
+ Consistent accounting treatment of all VAs
+ Aligned with actual “economics”
– Requires additional work by supervised insurers
– Relies on unaudited financials
A B C D E F

Prove new business written is profitable
Provide the product’s ROE if full capital markets hedging were
utilized (in other words an ROE that is not geared to capital
market risks, or “fully hedged” ROE), in addition to the ROE
using their own individual hedging strategy, across a number of
market scenarios
36
Interest Rate Scenario Spread Scenario Equity Scenario ROE – hedged as
planned
ROE – fully
hedged
June 2012 rates frozen for 5
years then rising 50 bps per
year across term spectrum
Single A staying at 100 bps above
Treasury
0% p.a. …. ….
2% p.a. ….
4 % p.a. ….
June 2012 rates frozen until June
2014, then rising by 1% p.a. for
10 yrs, then frozen again
Single A staying at 100 bps above
Treasury
0% p.a. ….
2% p.a. ….
4 % p.a. ….
Single A widening to 150 bps above
Treasury by 2014 …. ….
Interest rate term structure
remains frozen at current 2012
levels
Single A staying at 100 bps above
Treasury
0% p.a.
2% p.a.
4 % p.a.
G H I J K L