Embed Size (px)
Citation preview
Day 1 Histograms, Scatterplots.notebook January 05, 2017
Complete Warm UP sheet
Work on Test Corrections
Complete EOC released problems
Day 1 Histograms, Scatterplots.notebook January 05, 2017
Day 1 Histograms, Scatterplots.notebook January 05, 2017
Day 1 Histograms, Scatterplots.notebook January 05, 2017
Day 1 Histograms, Scatterplots.notebook January 05, 2017
Day 1 Histograms, Scatterplots.notebook January 05, 2017
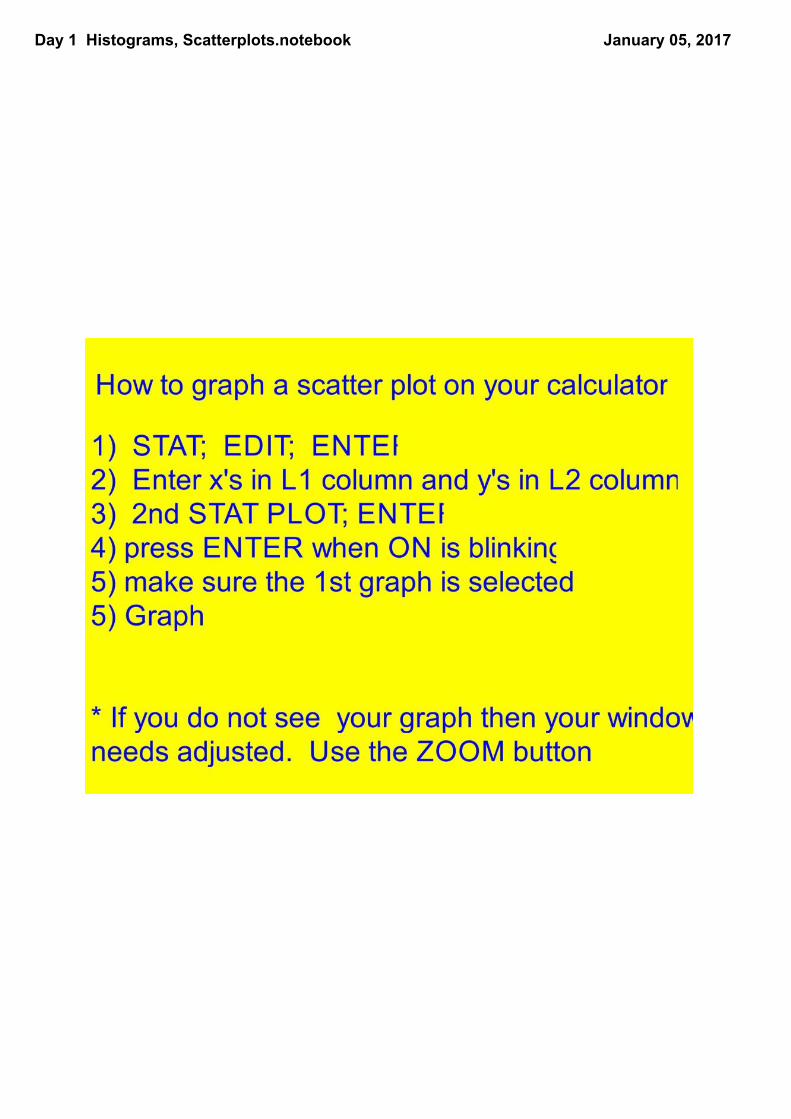
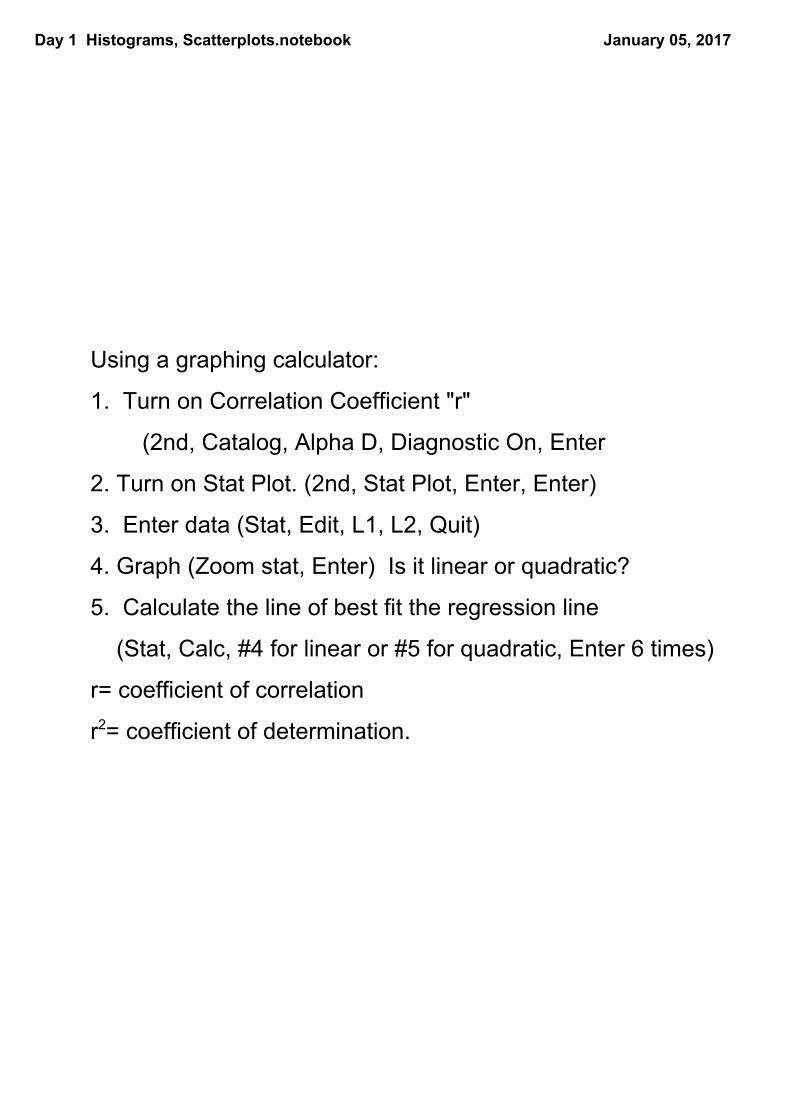
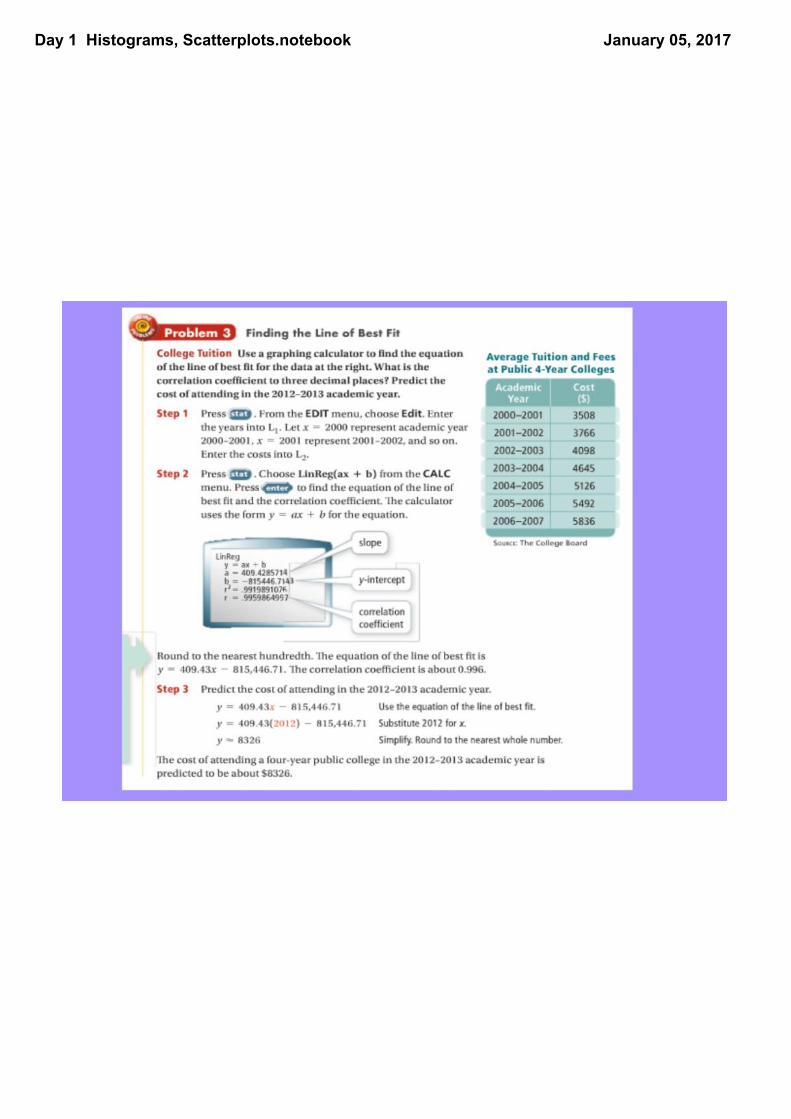
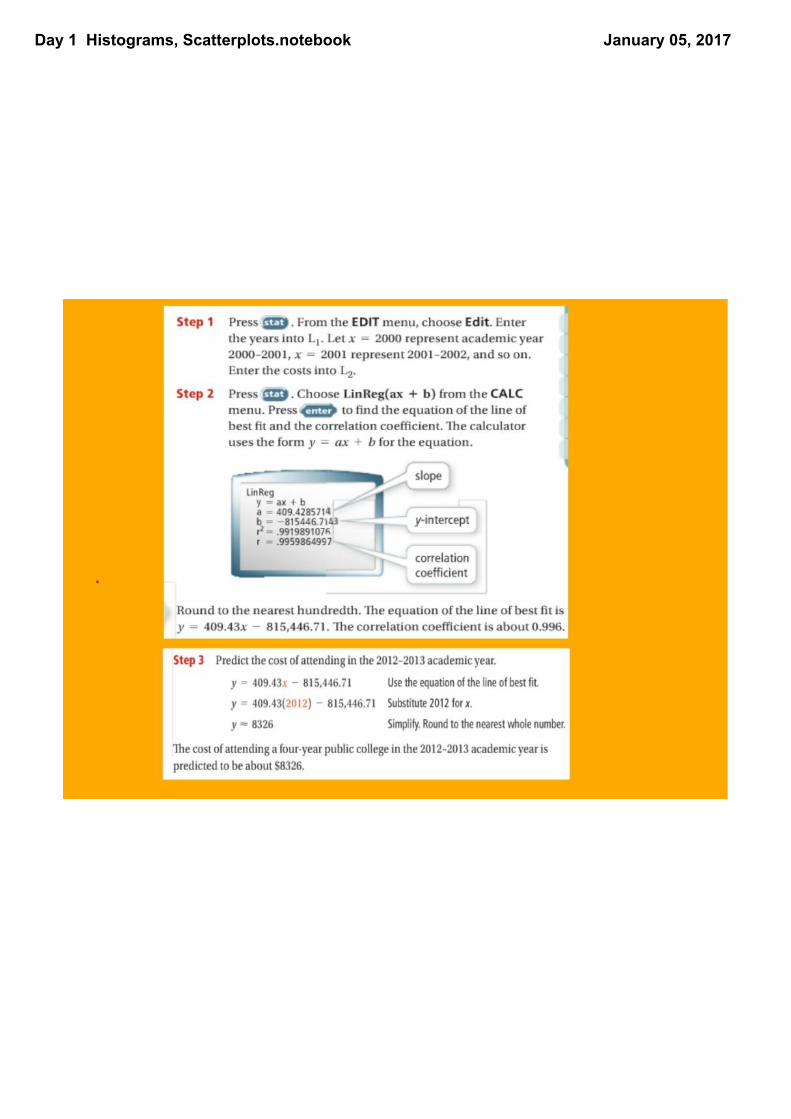
Using a graphing calculator:
1. Turn on Correlation Coefficient "r"
(2nd, Catalog, Alpha D, Diagnostic On, Enter
2. Turn on Stat Plot. (2nd, Stat Plot, Enter, Enter)
3. Enter data (Stat, Edit, L1, L2, Quit)
4. Graph (Zoom stat, Enter) Is it linear or quadratic?
5. Calculate the line of best fit the regression line
(Stat, Calc, #4 for linear or #5 for quadratic, Enter 6 times)
r= coefficient of correlation
r2= coefficient of determination.
Day 1 Histograms, Scatterplots.notebook January 05, 2017
Day 1 Histograms, Scatterplots.notebook January 05, 2017
https://www.youtube.com/watch?v=oCHk4xjnH7o
Day 1 Histograms, Scatterplots.notebook January 05, 2017
Day 1 Histograms, Scatterplots.notebook January 05, 2017
Day 1 Histograms, Scatterplots.notebook January 05, 2017
Day 1 Histograms, Scatterplots.notebook January 05, 2017
Day 1 Histograms, Scatterplots.notebook January 05, 2017
Day 1 Histograms, Scatterplots.notebook January 05, 2017
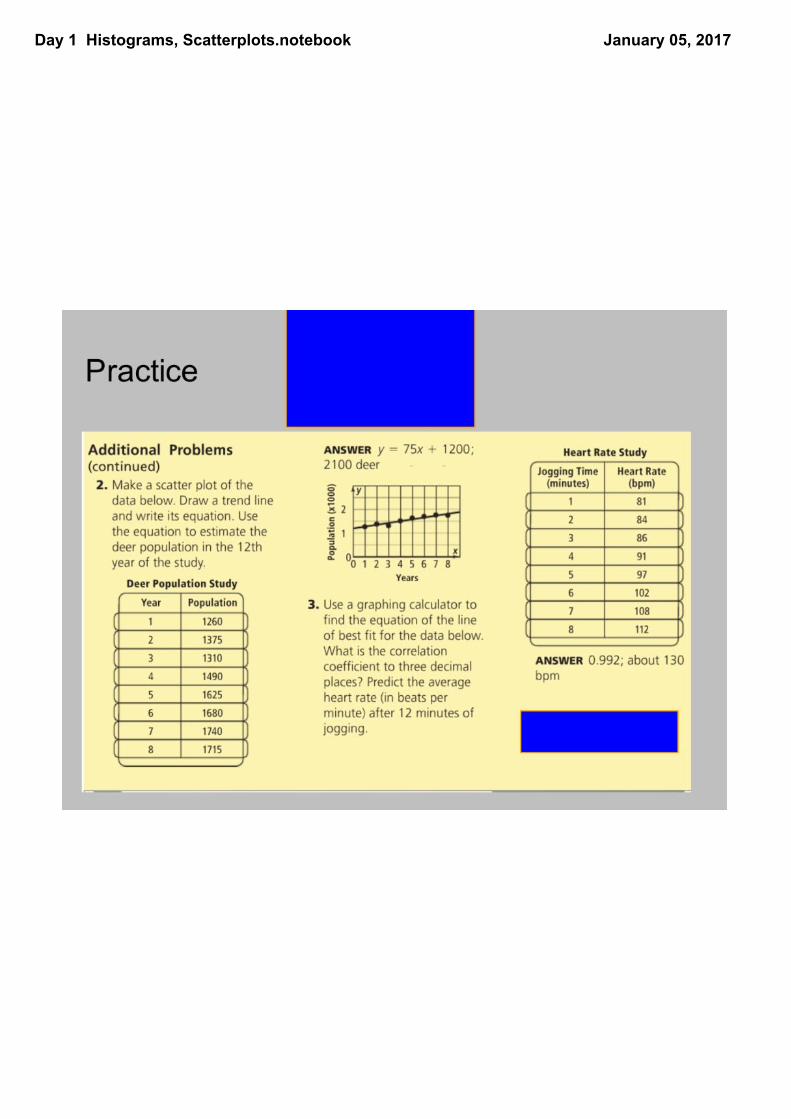
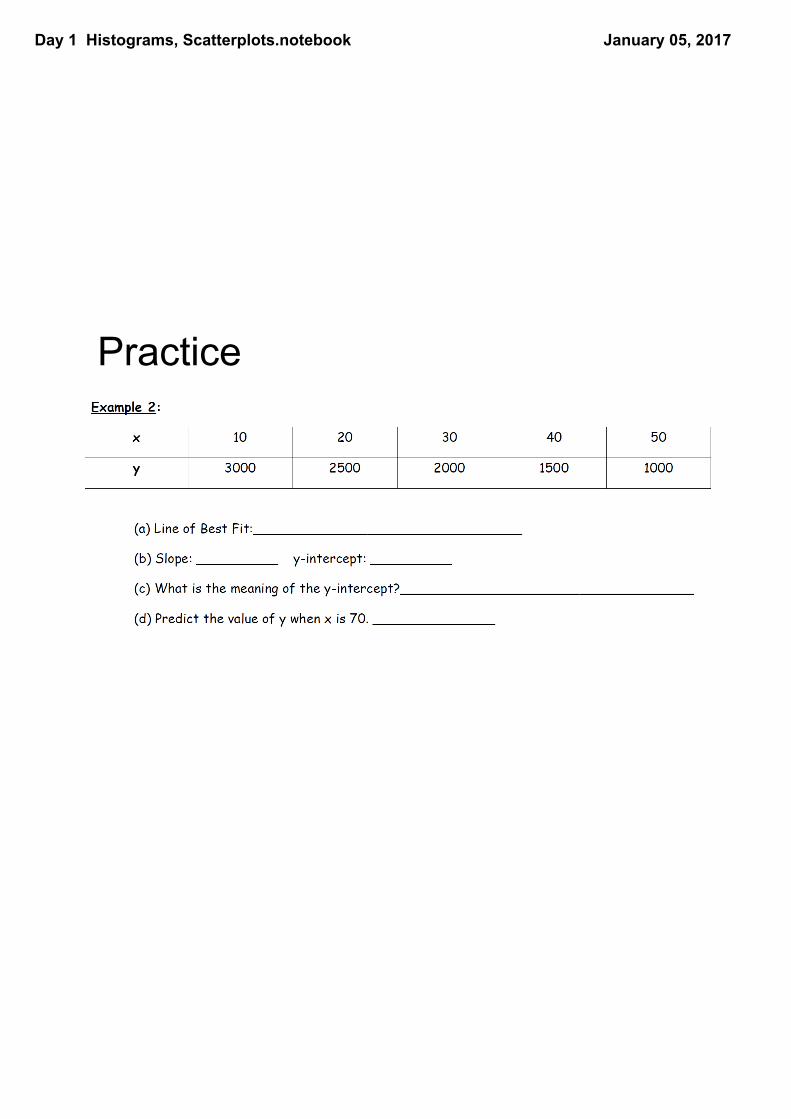
Practice
Day 1 Histograms, Scatterplots.notebook January 05, 2017
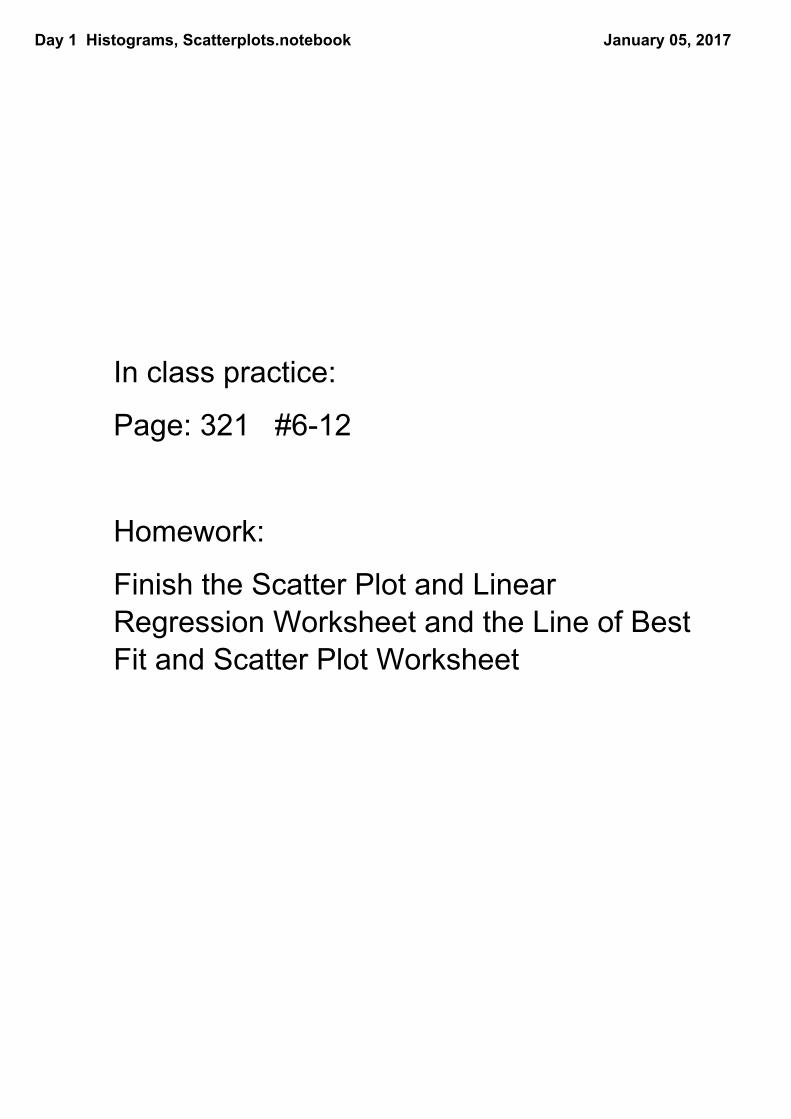
In class practice:
Page: 321 #612
Homework:
Finish the Scatter Plot and Linear Regression Worksheet and the Line of Best Fit and Scatter Plot Worksheet