Embed Size (px)
Citation preview
Stock Code:2838
Date of Publication: Jun 2018This Annual Report may be accessed on the MarketObservation Post System (http://newmops.tse.com.tw)and on the Bank’s Website (http://www.ubot.com.tw)
The English version of annual report is a brieftranslation and is not part of official documentof the shareholder’s meeting.The Chinese version shall prevail if there isany difference between these two. 2017
Annual Report2017
Annual Report2017
Annual Report
Shang-Wu WuAuthorized by Union Culture Foundation

I. Spokesman
Name: Mr. Herman Tu / Title: Senior Executive Vice President
Tel.: 02-27180001
E-mail: [email protected]
Second Spokesman
Name: Mr. Yanger Yang / Title: Department Manager
Tel.: 02-27180001
E-mail: [email protected]
II. Head Office/Domestic Branch, address, and telephone:
Please refer to page 168 ~171.
III. Stock Registration Office
Name: MasterLink Securities Corp.
Homepage: http://www.masterlink.com.tw
Address: B1, No.35, Ln. 11, Guangfu N. Rd., Taipei City
Tel: (02) 2768-6688
IV. Credit Ratings Institution
Name: Taiwan Ratings Corp.
Homepage: http://www.taiwanratings.com.tw
Address: 49F, No.7, Hsin-Yi Rd., Sec. 5, Taipei, Taiwan
Tel.: (02) 8722-5800
V. CPA for Financial Statement Auditing
Name: Mr. Vincent Cheng / Mr. Charles Yang
Company: Deloitte & Touche
Homepage: http://www.deloitte.com.tw
Address: 12F, No.156, Minsheng E. Rd., Sec. 3, Taipei, Taiwan
Tel.: (02) 2545-9988
VI. Offshore marketable securities exchange company and transaction information: None
VII. Homepage: http://www.ubot.com.tw

Table of Contents
Letter to Shareholders ......................................................................................................................................... 01 Bank Profile .............................................................................................................................................................. 06 Corporate Governance ........................................................................................................................................ 07 1. Organization Structure .............................................................................................................................. 08 2. Information on Directors, Supervisors and Executive Officers ........................................................... 10 3. Execution of Corporate Governance ........................................................................................................ 49 4. Information on CPA Professional Fees ..................................................................................................... 88 5. Information on change of CPA .................................................................................................................. 89 6. The Chairman, President and Executive Officers in charge of the Bank’s financial or
accounting affairs who have, during the past year, served a position in the CPA firm to which or its affiliated enterprises the independent auditor(s) belong to .................................... 89
7. Transfer of Equity and Changes in Equity Used as Collateral by Directors, Supervisors, Managers, and Others Required to Report Equity in accordance with Paragraph 3, Article 25 of the Banking Act. .. .............................................................................................................................. 89
8. Information on Top 10 Shareholders Being the Related Parties ............................................................ 94 9. Ownership of Investee Companies ......................................................................................................... 96
Fund Raising Status ................................................................................................................................................ 97
1. Capital and Share ...................................................................................................................................... 97 2. Issuance of Financial Debentures .......................................................................................................... 104 3. Issuance of Preferred Stock .................................................................................................................... 105 4. The status of Overseas Depository Receipts and Employee Stock Option ........................................ 107 5. Acquisitions or Disposition of Other Financial Institutions ................................................................. 107 6. Fund Utilization Plan and Execution Status ......................................................................................... 107
Operational Highlights ........................................................................................................................................ 109
1. Business Description .............................................................................................................................. 109 2. Employee Analysis ................................................................................................................................. 119 3. Corporate Responsibility and Ethical Conduct .................................................................................... 121 4. Number of Non-managerial Staff, Amt of employee welfare expense and difference from the
Previous Year ........................................................................................................................................ 122 5. Facilities of Information Technology .................................................................................................... 123 6. Labor Relations ....................................................................................................................................... 124 7. Major Contracts ....................................................................................................................................... 124 8. Securitization Commodities approved by the competent authority and relevant
information launched in accordance with Financial Asset Securitization Act or Real Estate Securitization Act in recent years ............................................................................129
Financial Highlights ............................................................................................................................................ 130
1. Condensed Balance Sheets, Income Statements and Auditors’ Opinions for the most recent five years ......................................................................................................................................................... 130
2. Financial Analysis and Capital Adequacy Ratio .................................................................................. 137 3. Supervisors’ Report for the 2017 Financial Statements ...................................................................... 145 4. Financial Statements for 2017 ................................................................................................................. 145 5. Any Financial Difficulties Experienced by the Bank and its Affiliated Enterprises in the
Past Year and Current Year up to the Printing Date of the Annual Report, if yes, please narrate the impact upon the Bank’s financial conditions ......................................................... 145
Analysis of the Financial Status and Operating Results & Risk Management ..................................... 147
1. Financial Status ........................................................................................................................................ 147 2. Results of Operation ............................................................................................................................... 148 3. Cash Flow ................................................................................................................................................. 149 4. The Impact of Major Capital Expenditures on the Bank’s Financial & Business Operations for

Table of Contents
the recent years ........................................................................................................................................ 149 5. Reinvestment Policy, the Main Reasons for Profit or Loss, Corrective Action Plan in last year, and
Investment Plan for the Next Year ......................................................................................................... 149 6. Risk Management ................................................................................................................................... 150 7. Contingency Plan ..................................................................................................................................... 163 8. Other Important Matters .......................................................................................................................... 163
Affiliate and Special Notes ................................................................................................................................ 164
1. Information on Affiliated Enterprises ................................................................................................... 164 2. Private placement of marketable securities and financial debentures in the past year and
current year up to the printing date of the annual report .......................................................... 167 3. Shares of the Bank held or disposed of by subsidiaries in the past year and current year
up to the printing date of the annual report .................................................................................. 167 4. Other Necessary Supplements ............................................................................................................... 167 5. Up to the printing date of the annual report, any event which has a material impact on
shareholders’ equity or securities prices pursuant to Article 36.2.2 of the Security and Exchange Law ........................................................................................................................................ 167
Bank Directory .................................................................................................................................................... 168
Appendix: Financial Statements for the Years Ended December 31, 2017 and 2016 and
Independent Auditors’ Report ..................................................................................................

Letter to Shareholders
1
1. Results of Operation for 2017
(1) Domestic and International Financial Environment
During year 2017, as global trading revived in the economic cycle, financial
environment remained loose and commodity prices went back to the stable state, and
the revival of advanced economies keep strengthening, people’s confidence in the
economics was boosted and thus helped them walk out of the shadow of deflation.
Emerging and developing economies were also in the trend of strong growth. .
(2) Changes in Bank Organization
In May, 2017, the Bank set up the “Information and Communication Security
Management Division” as the unit responsible for information safety under the IT
department. It is in charge of formulating and executing information safety plans and
the work of information safety protection.
(3) Business Plan, Results of Operations and Budget Execution Status
Thanks to the dedication of our employees, the Bank is pleased to report outstanding
performance across the various areas of business in 2017. With regard to profitability,
the Bank reported an after-tax net income of NT$ 2.745 billion for the year ended
December 31, 2017; earnings per share (EPS) was NT$ 1.05, return on assets (ROA)
was 0.51% and return on equity (ROE) was 6.55%. In terms of asset quality, the Bank
was able to maintain sound asset quality, reporting an NPL ratio of 0.12% and bad
debt coverage ratio of 887.26%.
For many years now, the Bank has developed its various business based on the
strategies of maintaining consistent growth and dedicating to cultivation of local
business. On January 18, 2018, Taiwan Ratings Corp. awarded our Bank its long- and
short-term issuer credit rating for “twA” and “twA-1” respectively, and the outlook
on the long-term rating is stable. According to the rating report of Taiwan Ratings
Corp., the Bank has prudent capital policy and appropriate risk control, which can
help the Bank’s credit rating remain stable in the following one to two years. Taiwan
Ratings Corp. expects that the Bank’s market position, asset quality, fund source and
liquidity structure, etc., should be able to remain similar to the current state.
.
(4) Revenue/Expenditure and Profitability
For the year ended December 31, 2017, the Bank reported a net interest income of
NT$ 6.685 billion, net non-interest income of NT$ 3.603 billion and net profit of NT$
10.288 billion; after deducting net bad debts expense totaling NT$ 0.357 billion and
Letter to Shareholders
2
operating expenses totaling NT$ 6.618 billion, the before-tax income amounted to
NT$3.313 billion; the after-tax income amounted to NT$ 2.745 billion.
2. Credit Rating
Rating Agency Date of
Rating
Rating Results Outlook
Taiwan Ratings
Corporation
Jan. 18, 2018
Long-Term:
twA
Short-Term:
twA-1
Stable
3. 2018 Business Plan
(1) Operating plan and important operating policy:
1. Deposit business: In response of the trend of E-payment business, the Bank will
strengthen VISA debit card and account function (e.g., business of “EasyCard A/C
LINK” and “Apple Pay Debit Card”), in order to provide depositors with overall
payment tools. We will also expand the functions of ATM (“ATM interbank
deposit” and “iPASS certificate saving” function) to provide customers with a
variety of service. Beside, we will continue holding marketing campaigns for
VISA debit card to increase customer loyalty and demand deposits, and arrange
for deposit campaigns for target customers to attract demand deposits and new
customers.
2. Corporate banking: The Bank will actively expand business loans to MIT
enterprises and visit existing customers’ operating offices in the industrial region
near the branches more often, in order to obtain more business from the
introduction to upstream and downstream firms by the existing customers. The
Bank will also give priority to undertake self-liquidating loans and factory loans
for production and manufacturing in Taiwan, while increasing the protection of
claims through the Credit Guarantee Fund and requesting collateral with good
quality. In addition, the Bank will undertake more premium stock investing loans,
develop customer source from foreign exchange and export/import business to
increase the niche in foreign exchange business and market share.
3. Consumer banking: Promote housing loans stably and choose owner occupants
who possess sound repayment capabilities; increase the business in second-hand
and new car loans, and adjust the percentages for different loan types to increase
the average lending rate; continue increasing the number of credit lending account
officers and business centres to focus on premium customers; keep promoting
credit loan products and design strategic products for overall marketing.
4. Credit card: Plan for cards targeted at young people to attract young new
customers; increase application rate, rate of usage and market share; continue the
derivative application and expansions of digital credit card products (e.g., channel

Letter to Shareholders
3
of Co-Brand Card companies, employee introduction and increasing online
application rate), in order to increase market share; continue maintaining and
strengthening the functions of premium cards to attract high-consumption
customers and increase card usage rate; improve new customers’ application rate
of digital bills to lower the paper bill cost; actively engage in “Union Day” in
virtual channels; cooperate with new credit card paying channels to increase card
usage rate, amount credited and effective card rate; expand small-amount loans,
control risk and increase revenue.
5. Wealth management, insurance agency and trust: Increase the sales of wealth
management products; further develop relations with customers and enhance
development of effective clients; combine big-data analysis and cooperate with
insurance companies in analysing target customer groups and factors affecting
sales based on different insurance product types, in order to increase selling
efficiency; in response of the interest rate raise of US dollars and the significant
interest rate gap between USD and NTD insurance policies, promote the sales of
USD policies to create more insurance fee income.
6. Digital finance business: continue integrating excellent mobile banking service,
establish the Bank’s digital virtual bank, combine cash-flow related services like
IC card, QR Code, LINE application, and convenient store channel, etc., plan for
cross-device and cross-platform digital finance application, and follow the
involvement of technology to devote relevant human labor to the research of new
financial services such as AI, block chain technology, and bio-identification;
increase the application of APPs for digital virtual bank (including digital deposit
account) and the number of applicant; provide a customer-service system that
meets safety control standards and are stable and expandable.
7. Securities: Further develop in the institutional customer group and the
management, and increase accounts opened and sales; promote business in digital
order and increase the percentage of digital trading.
(2) Channel development:
1. The Bank operates 90 domestic branches and has been granted approval by the
Financial Supervisory Commission to set up our Hong Kong branch, which is a
part of our plan to expand our business territory overseas in line with
globalization of the financial market.
2. The Bank has expanded our ATM service network to offer customers more
convenient services and through which we hope to enhance our corporate image
and reputation. As of December 31, 2017, the Bank has installed a total 916
ATMs to service our clients.
(3) The Bank’s 2018 business goals
1. Deposits expected to reach NT$ 496.8 billion by year end.
2. Loans expected to reach NT$ 352.7 billon (excluding credit cards) by year end.

Letter to Shareholders
4
3. Foreign exchange turnover is forecasted to reach US$ 6.234 billion.
4. Improvement in business performance targets: including a suppressed NPL ratio
or one that is lower than the industry average, improvement in capital level to
meet the requirement of 2019 in accordance with IFRS and Basel III, and the
maintenance of stable fund source and high-quality liquid assets in order to meet
the standards of Net Stable Funding Ratio (NSFR) and Liquidity Coverage Ratio
(LCR).
4. External Factors and Future Development Strategies
In 2018, the economic conditions domestically and abroad have revived gently, increasing
businesses’ demand of fund. The interest rate spread bumped to the bottom but reversed,
mainly due to the government’s effort in the reward project for industry lending and the
relieving atmosphere of international interest rate lead by US’s interest rate raise. In
addition, the adjustment in the lending structure of domestic banking industry helped
expanding customer groups of small and medium enterprises, the growth of interest rate
spread and revenue, and the control of customers’ real needs. These are all positive
influence factors to the operation of domestic banking industry. Overall, besides the reason
mentioned above, the Financial Supervisory Commission (FSC) continues following the
government’s New Southbound Policy to actively assisting domestic financial firms in
expanding oversea market in order to enhance the overall competitiveness of domestic
financial service industry. The fact that emerging countries in Southeast Asia have plenty
of room to develop financial market also attracts lots of domestic banks. The future market
is expected to have significant development and growth in business.
To meet with the challenges of different variations in the future, the Bank will continue to
adopt the strategy of growing in stability: to enhance market share and the scale of core
profit-making business by exerting branch network and marketing strategies to improve
business performance under the premise that risk is controllable; at the same time, stick to
the spirit of servicing locally and establishing brand value for Union Bank of Taiwan,
moving toward the goal of being an excellent bank and sustainable operation.
.
We are very grateful to you for your long-term patronage and strong support in the past. We
will endeavor to present a marvelous feat of performance under the Bank’s operating
mottoes of “Enthusiasm, Soundness, Efficiency and Innovation” through improving the
quality of service and strengthening customer-bank relationships. Your continued support
and encouragement in the future would be much appreciated.
Yours sincerely,

Letter to Shareholders
5
董事長
Chairman Shiang-Chang Lee
總經理
President Jeff Lin
BANK PROFILE
6
1. Date of Establishment and History
Union Bank of Taiwan was the third private-owned bank approved by the government to be established in the awakening of banking liberalization and globalization. The founders of the Bank shared a common interest of running a perpetual business and together they set up the preparatory office on Mar. 29, 1989 and business operation initiated on Jan. 21, 1992. The Bank was officially listed on the OTC on Sep. 19, 1995 and the Taiwan Stock Exchange Corporate on Jun. 29, 1998, and has now become a widely acclaimed and recognized listed company. The Bank set up the Ho Chi Minh City Representative Office in Vietnam and Hong Kong Representative Office in Hong Kong on February 25, 1998 and August 24, 1999, respectively. To expand business channels and the scale of operations, the Bank acquired Chung Shing Bank unconditionally on March 19, 2005.
To integrate the overall resources, strengthen management, and exert operating synergy, the Bank merged with Union Insurance Broker Co., Ltd. as resolved by the Board of Directors on August 26, 2015, and obtained the approval of the Financial Supervisory Commission dated March 21, 2016. The merger was completed on August 1, 2016, in which Union Bank of Taiwan served as the surviving bank, which continue to provide service for the insured customers of the Union Insurance Broker. .
2. Merger, Acquisition, Reinvestment in Affiliated Enterprises and Corporate Restructure During 2017 and Current Year Up to the Printing Date of the Annual Report : None.
3. Is the Bank a Member Firm of a Specific Financial Holding Company?
The Bank is a commercial bank limited by shares, but not a member of a financial holding company.
4. Significant Transfers or Changes in Shareholding of Directors, Supervisors and Parties Required to Declare Ownership of Shares Under Paragraph 3, Article 25 of the Banking Act. Refer to “Transfer of Equity and Changes in Equity Used as Collateral by Directors, Supervisors, Managers, and Others Required to Report Equity in accordance with Paragraph 3, Article 25 of the Banking Act” of the “Corporate Governance Report”.
5. Changes in Management Rights, Management Mode or Other Significant Business Changes During 2017 and Current Year Up to the Printing Date of the Annual Report: None.
6. Other matters of material significance that could affect shareholders' equity and how such matters will affect the Bank: In order to fulfill operating capital and strengthen financial condition, the Bank first issued NT$ 10 billion of preferred stock A and have successfully raised the funds. It was formally listed on Dec. 1, 2017.

Corporate Governance
7
S
hareholders’
Meeting
B
oard of
Directo
rs C
hairman
P
resident
Senior
Execu
tive Vice
Presiden
t
C
hief C
omp
liance
Officer of H
.Q.
1. Organization Structure (1) Organization Chart
S
upervisor
Residen
t S
upervisor
Chief A
uditor
Salary
and R
emun
eration
Com
mittee
Board
of Director
Conferen
ce Serv
ice D
ivision
Aud
it Dept.
International B
anking
Dep
t.
Informatio
n T
echnolo
gy Dept.
Hum
an Resou
rces Dep
t.
Secu
rities Fin
ance Dept.
Consum
er Ban
king
Dept.
Veh
icle Loan
Dept.
Consum
er Cred
it Dept.
Cred
it Card
& P
aymen
t Fin
ance D
ivision
Trust D
ept.
Business D
ept.
Dom
estic & O
verseas B
ranch
es
Wealth M
anagem
ent D
ept.
Business P
lanning &
A
dministration
Dept.
Prod
uct Developm
ent &
M
arketing D
ept.
Treasury D
ept.
Risk M
anagement D
ept.
Bills F
inance D
ept.
Legal A
ffair & C
ompliance D
ept.
Corp
orate Lo
ans Policy &
A
dministration
Dept.
General A
ffairs Dep
t.
Operation
s Center
Real E
state Man
agement D
ept.
Insuran
ce Ag
ency D
ept.

Corporate Governance
8
(2) Responsibilities of each department: Audit Department: Responsible for performing internal audit, planning internal controls systems and reviewing credit applications.
Business Planning & Administration Department: Responsible for the Bank’s organizational system, execution of budgets, risk management and deposit-taking and remittance businesses.
Product Development & Marketing Department: Responsible for the planning and promotion of e-Commerce businesses.
Treasury Department: Responsible for the Bank’s fund appropriation and assets and liabilities management. Real Estate Management Department: Responsible for the appraisal of real estate collaterals and management of collateral received for loans. Risk Management Department: Responsible for managing the Bank’s credit risks, market risks and operational risks. Bills Finance Department: Responsible for planning pursuing and managing the bills and bonds business. Legal Affairs & Compliance Department: Responsible for compliance affairs, processing of legal actions for the Bank, research of and advice on legal issues. Matters such as planning, supervision and compliance of anti-money laundering and countering the financing of terrorism. Corporate Loan Policy & Administration Department: Responsible for the promotion and management of corporate banking businesses. Wealth Management Department: Responsible for the promotion of wealth management businesses and administration of wealth management personnel. General Affairs Department: Response for the procurement of supplies, management of the bank’s properties and acting as the bank’s treasurer. Operations Center: Responsible for the establishment of files, disposition of transactional accounts and management of archives. Information Technology Department: Responsible for the design, execution and maintenance of the Bank’s computer system. Human Resources Department: Responsible for planning human resources.

Corporate Governance
9
Securities Finance Department: Responsible for entrusted trading, underwriting and purchase of marketable securities. Consumer Banking Department: Responsible for the promotion and management of consumer banking businesses. Vehicle Loan Department: Responsible for planning, promoting and managing the vehicle loan business. Consumer Credit Department: Responsible for the promotion and management of consumer credit businesses. Credit Card & Payment Finance Division: Responsible for the development of affairs related to credit cards and merchants, and processing of micro loans. Trust Department: Responsible for trust business, custodian banking and certification services. International Banking Department: Responsible for foreign exchange businesses and establishing and managing the overseas branches. Insurance Agency Department: Responsible for the promotion and management of insurance agency banking businesses. Business Department: Responsible for operating matters such as deposits, loans, exchange, agency, wealth management, safe deposit boxes and other businesses.

Corporate Governance
10
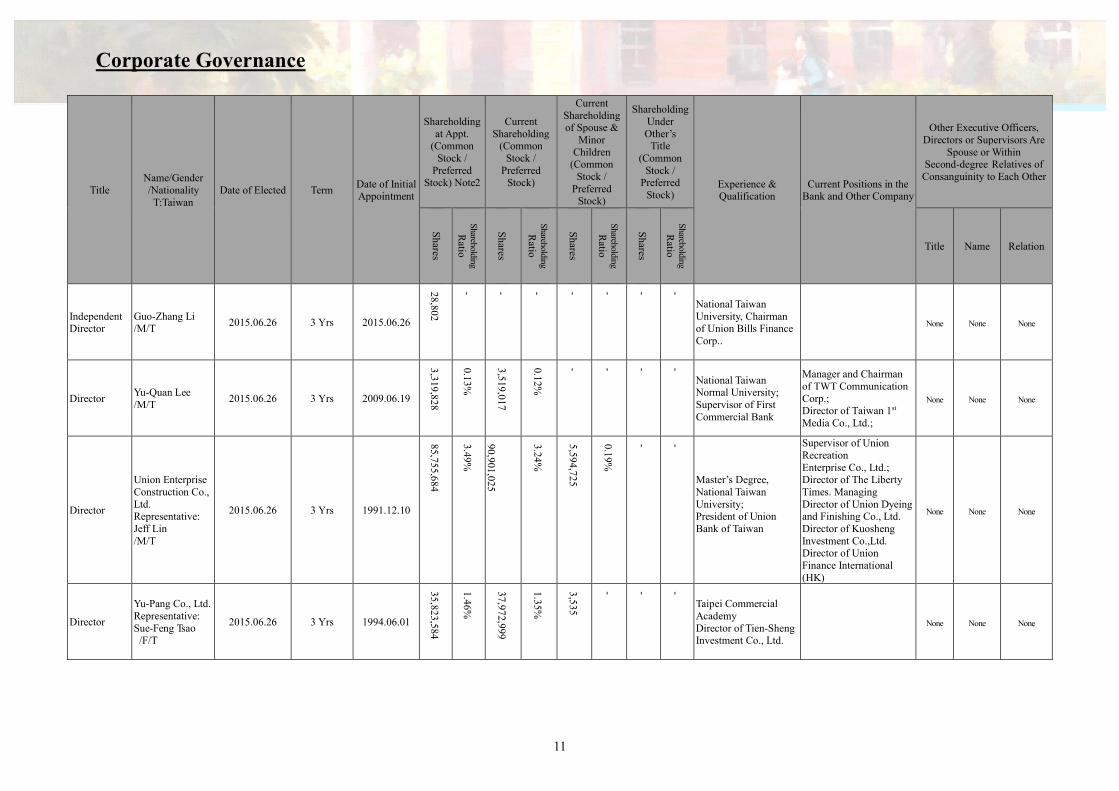
2. Information on Directors, Supervisors, and Executive Officers (1) Directors and Supervisors
A. General Information Recordation Date: March 31, 2018(Shares Holding Recordation Date: April 10, 2018)
Unit: Shares;%:
Title Name/Gender /Nationality T:Taiwan
Date of Elected Term Date of Initial Appointment
Shareholding at Appt.
(Common Stock /
Preferred Stock) Note2
Current Shareholding
(Common Stock /
Preferred Stock)
Current Shareholding of Spouse &
Minor Children
(Common Stock /
Preferred Stock)
Shareholding Under Other’s
Title (Common
Stock / Preferred
Stock) Experience & Qualification
Current Positions in the Bank and Other Company
Other Executive Officers, Directors or Supervisors Are
Spouse or Within Second-degree Relatives of
Consanguinity to Each Other
Shares
Shareholding
Ratio
Shares
Shareholding
Ratio
Shares
Shareholding
Ratio
Shares
Shareholding
Ratio
Title Name Relation
Chairman Shiang-Chang Lee /M/T
2015.06.26 3 Yrs 1991.12.10
1,273,528
0.05%
1,349
,939
0.04%
2,116
,949
0.07%
- -
National Taiwan University; President of UBOT
Union Finance International (HK) Director –
Taiwan Futures Exchange supervisor
None None None
Independent Managing Director
Kao-Jing Wang /M/T
2015.06.26 3 Yrs 2009.06.19
- - - - - - - -
Master’s Degree, University of North Dakota; SEVP, Bank of Taiwan
Independent Director of Mechema Chemical International Corp.
None None None
Managing Director
Chen-Chern Investment Co., Representative: Zhen-Xong Jiang /M/T
2015.06.26 3 Yrs 2012.06.22
117,9
52,4
91
4.81
%
125,0
29,640/4
,245
,959
4.45
%/0.1
5%
2,59
8,0
56
0.0
9%
- -
National Defense Medical School; Commissioner of International Rotary Club
. None None None
Independent Director
Zen-Fa Lu /M/T
2015.06.26 3 Yrs 2009.06.19
- - - - - - - - 4th Judicial Training Program, The Judges and Prosecutors Training Institute; Prosecutor General of Supreme Prosecutors Office
None None None
Corporate Governance
11
Title Name/Gender /Nationality T:Taiwan
Date of Elected Term Date of Initial Appointment
Shareholding at Appt.
(Common Stock /
Preferred Stock) Note2
Current Shareholding
(Common Stock /
Preferred Stock)
Current Shareholding of Spouse &
Minor Children
(Common Stock /
Preferred Stock)
Shareholding Under Other’s
Title (Common
Stock / Preferred
Stock) Experience & Qualification
Current Positions in the Bank and Other Company
Other Executive Officers, Directors or Supervisors Are
Spouse or Within Second-degree Relatives of
Consanguinity to Each Other
Shares
Shareholding
Ratio
Shares
Shareholding
Ratio
Shares
Shareholding
Ratio
Shares
Shareholding
Ratio
Title Name Relation
Independent Director
Guo-Zhang Li /M/T
2015.06.26 3 Yrs 2015.06.26
28,802
- - - - - - -
National Taiwan University, Chairman of Union Bills Finance Corp..
None None None
Director Yu-Quan Lee /M/T
2015.06.26 3 Yrs 2009.06.19
3,319
,828
0.13%
3,5
19,017
0.12%
- - - -
National Taiwan Normal University; Supervisor of First Commercial Bank
Manager and Chairman of TWT Communication Corp.; Director of Taiwan 1st Media Co., Ltd.;
None None None
Director
Union Enterprise Construction Co., Ltd. Representative: Jeff Lin /M/T
2015.06.26 3 Yrs 1991.12.10
85,75
5,68
4
3.49%
90,90
1,02
5
3.24%
5,594
,725
0.19%
- -
Master’s Degree, National Taiwan University; President of Union Bank of Taiwan
Supervisor of Union Recreation Enterprise Co., Ltd.; Director of The Liberty Times. Managing Director of Union Dyeing and Finishing Co., Ltd. Director of Kuosheng Investment Co.,Ltd. Director of Union Finance International (HK)
None None None
Director
Yu-Pang Co., Ltd. Representative: Sue-Feng Tsao /F/T
2015.06.26 3 Yrs 1994.06.01
35,8
23,5
84
1.4
6%
37,9
72,9
99
1.3
5%
3,5
35
- - -
Taipei Commercial Academy Director of Tien-Sheng Investment Co., Ltd.
None None None
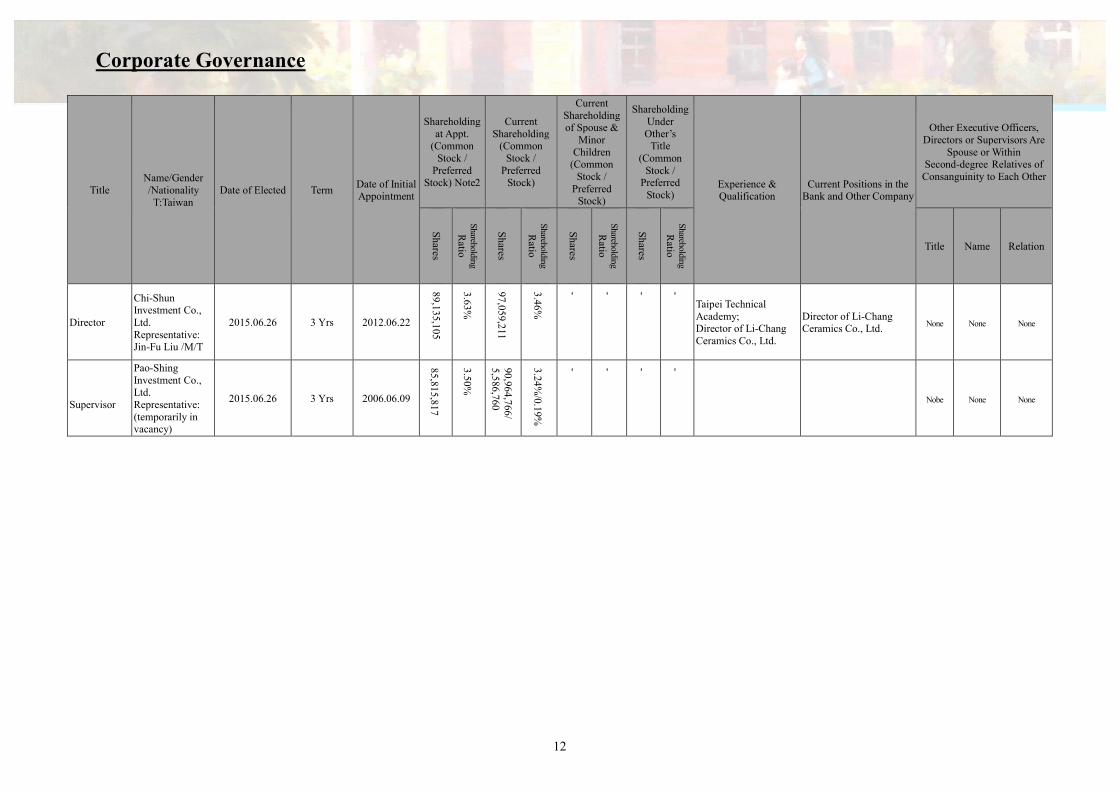
Corporate Governance
12
Title Name/Gender /Nationality T:Taiwan
Date of Elected Term Date of Initial Appointment
Shareholding at Appt.
(Common Stock /
Preferred Stock) Note2
Current Shareholding
(Common Stock /
Preferred Stock)
Current Shareholding of Spouse &
Minor Children
(Common Stock /
Preferred Stock)
Shareholding Under Other’s
Title (Common
Stock / Preferred
Stock) Experience & Qualification
Current Positions in the Bank and Other Company
Other Executive Officers, Directors or Supervisors Are
Spouse or Within Second-degree Relatives of
Consanguinity to Each Other
Shares
Shareholding
Ratio
Shares
Shareholding
Ratio
Shares
Shareholding
Ratio
Shares
Shareholding
Ratio
Title Name Relation
Director
Chi-Shun Investment Co., Ltd. Representative: Jin-Fu Liu /M/T
2015.06.26 3 Yrs 2012.06.22
89,135,105
3.63%
97,059,211
3.46%
- - - -
Taipei Technical Academy; Director of Li-Chang Ceramics Co., Ltd.
Director of Li-Chang Ceramics Co., Ltd.
None None None
Supervisor
Pao-Shing Investment Co., Ltd. Representative: (temporarily in vacancy)
2015.06.26 3 Yrs 2006.06.09
85,815,817
3.50%
90,964,766/
5,586,760
3.24%
/0.19%
- - - -
Nobe None None

Corporate Governance
13
Title Name/Gender /Nationality T:Taiwan
Date of Elected Term Date of Initial Appointment
Shareholding at Appt.
(Common Stock /
Preferred Stock) Note2
Current Shareholding
(Common Stock /
Preferred Stock)
Current Shareholding of Spouse &
Minor Children
(Common Stock /
Preferred Stock)
Shareholding Under Other’s
Title (Common
Stock / Preferred
Stock) Experience & Qualification
Current Positions in the Bank and Other Company
Other Executive Officers, Directors or Supervisors Are
Spouse or Within Second-degree Relatives of
Consanguinity to Each Other
Shares
Shareholding
Ratio
Shares
Shareholding
Ratio
Shares
Shareholding
Ratio
Shares
Shareholding
Ratio
Title Name Relation
Supervisor
Pai-Sheng Investment Co., Ltd. Representative: Si-Yong Lin /M/T
2015.06.26 3 Yrs 2015.06.26
12
5,4
54,092
5.11
%
132
,98
1,337
/ 8,1
67,281
4.74
%/
0.29%
1,78
9,6
96
0.06%
- -
National Taiwan Normal University Director of Hong-Bung Construction Enterprise Co., Ltd.
Director of Union Dyeing and Finishing Co., Ltd.; Director of Yeh-Shan Construction Co., Ltd.; Chairman of GreenIsland Hotel Co., Ltd.; Director of Jen-Yo Investment Co. Ltd.; Director of Sun-Che Investment Co., Ltd.; Supervisor of RSL Corporation.; Supervisor of Lung Shan Lin Realestate Management Corp.; Manager and Director of Hong-Bung Construction Enterprise Co., Ltd.; Director of Lung Shan Lin Construction Co., Ltd; Director of Kang-Hong investment Co., LtdSupervisor of Song-Mai investment;Chairman of Kuo-sheng investment Co., Ltd;Director of Pai-Sheng Investment Co., Ltd.; Director of Chu-Pao Investment; Supervisor of Lung Shan Lin Enterprise Co., Ltd.;Director of Union Bank of Taiwan; Director of Union Realestate Management Corp.;Director of Union Optronics Corp.
None None None
Corporate Governance
14
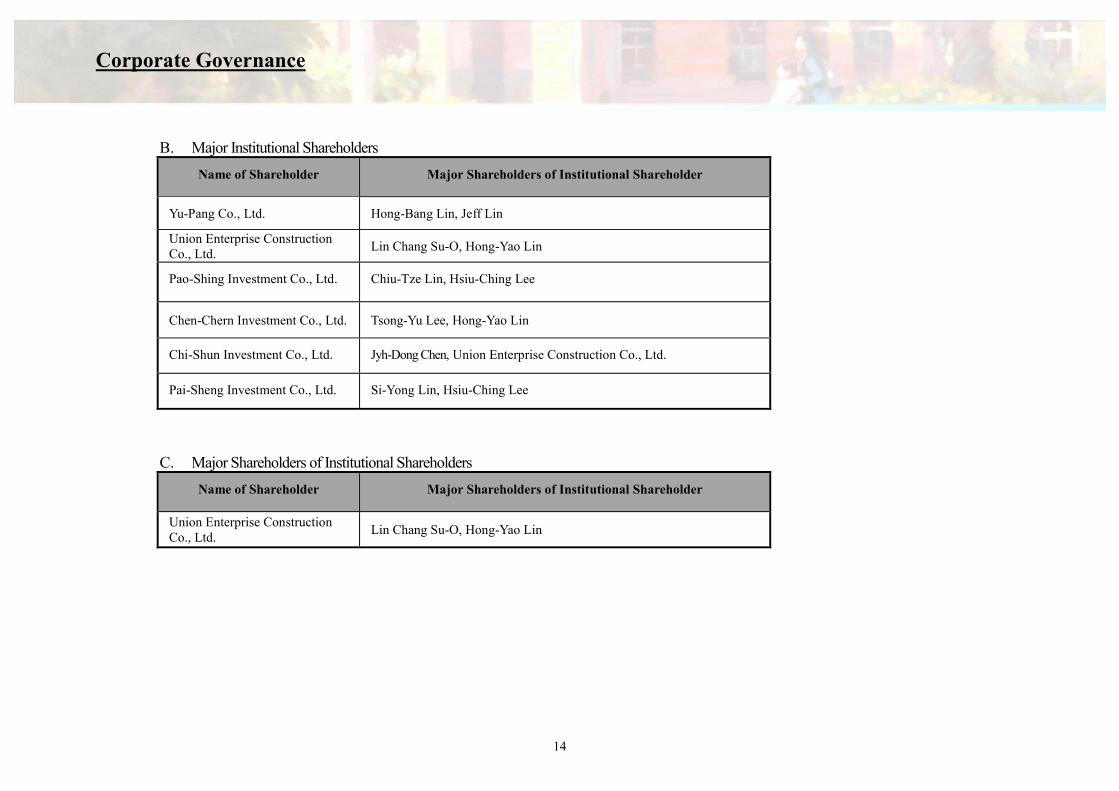
B. Major Institutional Shareholders
Name of Shareholder Major Shareholders of Institutional Shareholder
Yu-Pang Co., Ltd. Hong-Bang Lin, Jeff Lin
Union Enterprise Construction Co., Ltd.
Lin Chang Su-O, Hong-Yao Lin
Pao-Shing Investment Co., Ltd. Chiu-Tze Lin, Hsiu-Ching Lee
Chen-Chern Investment Co., Ltd. Tsong-Yu Lee, Hong-Yao Lin
Chi-Shun Investment Co., Ltd. Jyh-Dong Chen, Union Enterprise Construction Co., Ltd.
Pai-Sheng Investment Co., Ltd. Si-Yong Lin, Hsiu-Ching Lee
C. Major Shareholders of Institutional Shareholders
Name of Shareholder Major Shareholders of Institutional Shareholder
Union Enterprise Construction Co., Ltd.
Lin Chang Su-O, Hong-Yao Lin

Corporate Governance
15
D. Professional Knowledge and Independence Information of Directors and Supervisors
Qualification
Name
Over five years of experience in related fields and the following professional qualification
(Note 1)
Independent Status (Note 2)
Serving as an independent director of other public companies
(1) (2) (3) (1) (2) (3) (4) (5) (6) (7) (8) (9) (10)
Shiang-Chang Lee ˇ ˇ ˇ ˇ ˇ ˇ ˇ ˇ ˇ -
Kao-Jing Wang ˇ ˇ ˇ ˇ ˇ ˇ ˇ ˇ ˇ ˇ ˇ -
Zhen-Xong Jiang ˇ ˇ ˇ ˇ ˇ ˇ ˇ ˇ ˇ ˇ -
Zen-Fa Lu ˇ ˇ ˇ ˇ ˇ ˇ ˇ ˇ ˇ ˇ ˇ ˇ -
Guo-Zhang Li ˇ ˇ ˇ ˇ ˇ ˇ ˇ ˇ ˇ ˇ ˇ -
Jin-Fu Liu ˇ ˇ ˇ ˇ ˇ ˇ ˇ ˇ ˇ -
Yu-Quan Lee ˇ ˇ ˇ ˇ ˇ ˇ ˇ ˇ ˇ ˇ -
Jeff Lin ˇ ˇ ˇ ˇ ˇ ˇ -
Sue-Feng Tsao ˇ ˇ ˇ ˇ ˇ ˇ ˇ ˇ -
Si-Yong Lin ˇ ˇ ˇ ˇ ˇ ˇ ˇ ˇ -
Note 1: With over 5 years of work experience and the following professional qualification (1): Instructor, or higher up, of a public or private junior college, college or university, in Business, Law, Finance, Accounting or other departments as required by
corporate business. (2): Judge, prosecutor, solicitor, Certified Public Account or professionally qualified and technical person as required by the company. (3): Experience in Business, Law, Finance, Accounting or as required by corporate business. Note 2: Two years before the directors and supervisors are elected or during the period they are on the jobs, if they meet the following criteria, please make a “ˇ” mark in the
space under the criteria codes. (1): Not an employee of the Bank; nor an employee of its affiliated enterprises. (2): Not a director or supervisor of the Bank’s affiliated enterprises (Does not include the independent directors of the Bank‘s parent company or subsidiaries in
which the Bank holds more than 50% of the shares). (3): Not directly or indirectly own more than 1% of the Bank’s outstanding shares; nor is one of the top ten non-institutional shareholders of the Bank. (4): Not a spouse or within second-degree relation or third-degree immediate relation to any person specified in the preceding three criteria. (5): Not a director, supervisor, or employee of a legal entity which directly owns more than 5% of the Bank’s issued shares; nor a director, supervisor or employee of

Corporate Governance
16
the top five legal entities which are owners of the Bank’s issued shares. (6): Not a director, supervisor, or manager of a company which has a business relationship with the Bank; nor a shareholder who owns more than 5% of such a
company. (7): Not an owner, partner, director, supervisor, manager or spouse of any sole proprietor business, partnership, company or institution which has provided the Bank
and its affiliates with financial, business consulting, or legal services. Excluding members of the remuneration committee that exercise powers in accordance with Article 7 of the Regulations Governing the Appointment and Exercise of Powers by the Remuneration Committee of a Company Whose Stock is Listed on the Stock Exchange or Traded Over the Counter.
(8): Not a spouse or within second-degree relation to other directors. (9): Not a person under the circumstances specified in Article 30 of the R.O.C. Company Act. (10): Not a government agency, juristic person or its representative pursuant to Article 27 of the R.O.C. Company Act.
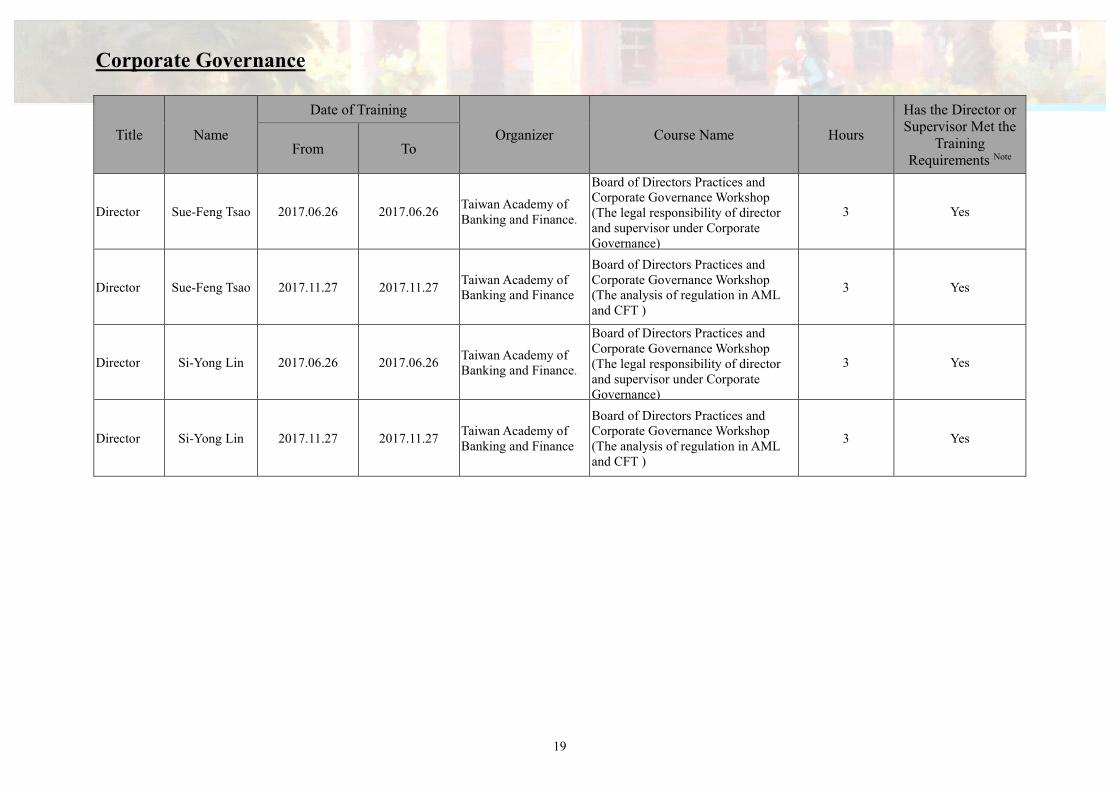
E. Director and Supervisors’ Training Records
Title Name
Date of Training
Organizer Course Name Hours
Has the Director or Supervisor Met the
Training Requirements Note
From To
Chairman Shiang-Chang
Lee 2017.06.26 2017.06.26
Taiwan Academy of Banking and Finance
Board of Directors Practices and Corporate Governance Workshop (The legal responsibility of director and supervisor under Corporate Governance)
3 Yes
Chairman Shiang-Chang
Lee 2017.11.27 2017.11.27
Taiwan Academy of Banking and Finance
Board of Directors Practices and Corporate Governance Workshop (The analysis of regulation in AML and CFT )
3 Yes
Independent Managing Director
Kao-Jing Wang 2017.06.26 2017.06.26 Taiwan Academy of Banking and Finance
Board of Directors Practices and Corporate Governance Workshop (The legal responsibility of director and supervisor under Corporate Governance)
3 Yes
Independent Managing Director
Kao-Jing Wang 2017.11.27 2017.11.27 Taiwan Academy of Banking and Finance
Board of Directors Practices and Corporate Governance Workshop (The analysis of regulation in AML and CFT )
3 Yes

Corporate Governance
17
Title Name
Date of Training
Organizer Course Name Hours
Has the Director or Supervisor Met the
Training Requirements Note
From To
Managing Director
Zhen-Xong Jiang
2017.06.26 2017.06.26 Taiwan Academy of Banking and Finance
Board of Directors Practices and Corporate Governance Workshop (The legal responsibility of director and supervisor under Corporate Governance)
3 Yes
Managing Director
Zhen-Xong Jiang
2017.11.27 2017.11.27 Taiwan Academy of Banking and Finance
Board of Directors Practices and Corporate Governance Workshop (The analysis of regulation in AML and CFT )
3 Yes
Independent Director
Zen-Fa Lu 2017.06.26 2017.06.26 Taiwan Academy of Banking and Finance.
Board of Directors Practices and Corporate Governance Workshop (The legal responsibility of director and supervisor under Corporate Governance)
3 Yes
Independent Director
Zen-Fa Lu 2017.11.27 2017.11.27 Taiwan Academy of Banking and Finance.
Board of Directors Practices and Corporate Governance Workshop (The analysis of regulation in AML and CFT )
3 Yes
Independent Director
Guo-Zhang Li 2017.06.26 2017.06.26 Taiwan Academy of Banking and Finance.
Board of Directors Practices and Corporate Governance Workshop (The legal responsibility of director and supervisor under Corporate Governance)
3 Yes

Corporate Governance
18
Title Name
Date of Training
Organizer Course Name Hours
Has the Director or Supervisor Met the
Training Requirements Note
From To
Independent Director
Guo-Zhang Li 2017.11.27 2017.11.27 Taiwan Academy of Banking and Finance.
Board of Directors Practices and Corporate Governance Workshop (The analysis of regulation in AML and CFT )
3 Yes
Director Jin-Fu Liu 2017.06.26 2017.06.26 Taiwan Academy of Banking and Finance.
Board of Directors Practices and Corporate Governance Workshop (The legal responsibility of director and supervisor under Corporate Governance)
3 Yes
Director Jin-Fu Liu 2017.11.27 2017.11.27 Taiwan Academy of Banking and Finance
Board of Directors Practices and Corporate Governance Workshop (The analysis of regulation in AML and CFT )
3 Yes
Director Yu-Quan Lee 2017.06.26 2017.06.26 Taiwan Academy of Banking and Finance.
Board of Directors Practices and Corporate Governance Workshop (The legal responsibility of director and supervisor under Corporate Governance)
3 Yes
Director Yu-Quan Lee 2017.11.27 2017.11.27 Taiwan Academy of Banking and Finance
Board of Directors Practices and Corporate Governance Workshop (The analysis of regulation in AML and CFT )
3 Yes
Director Jeff Lin 2017.06.26 2017.06.26 Taiwan Academy of Banking and Finance.
Board of Directors Practices and Corporate Governance Workshop (The legal responsibility of director and supervisor under Corporate Governance)
3 Yes
Director Jeff Lin 2017.11.27 2017.11.27 Taiwan Academy of Banking and Finance
Board of Directors Practices and Corporate Governance Workshop (The analysis of regulation in AML and CFT )
3 Yes
Corporate Governance
19
Title Name
Date of Training
Organizer Course Name Hours
Has the Director or Supervisor Met the
Training Requirements Note
From To
Director Sue-Feng Tsao 2017.06.26 2017.06.26 Taiwan Academy of Banking and Finance.
Board of Directors Practices and Corporate Governance Workshop (The legal responsibility of director and supervisor under Corporate Governance)
3 Yes
Director Sue-Feng Tsao 2017.11.27 2017.11.27 Taiwan Academy of Banking and Finance
Board of Directors Practices and Corporate Governance Workshop (The analysis of regulation in AML and CFT )
3 Yes
Director Si-Yong Lin 2017.06.26 2017.06.26 Taiwan Academy of Banking and Finance.
Board of Directors Practices and Corporate Governance Workshop (The legal responsibility of director and supervisor under Corporate Governance)
3 Yes
Director Si-Yong Lin 2017.11.27 2017.11.27 Taiwan Academy of Banking and Finance
Board of Directors Practices and Corporate Governance Workshop (The analysis of regulation in AML and CFT )
3 Yes

Corporate Governance
20
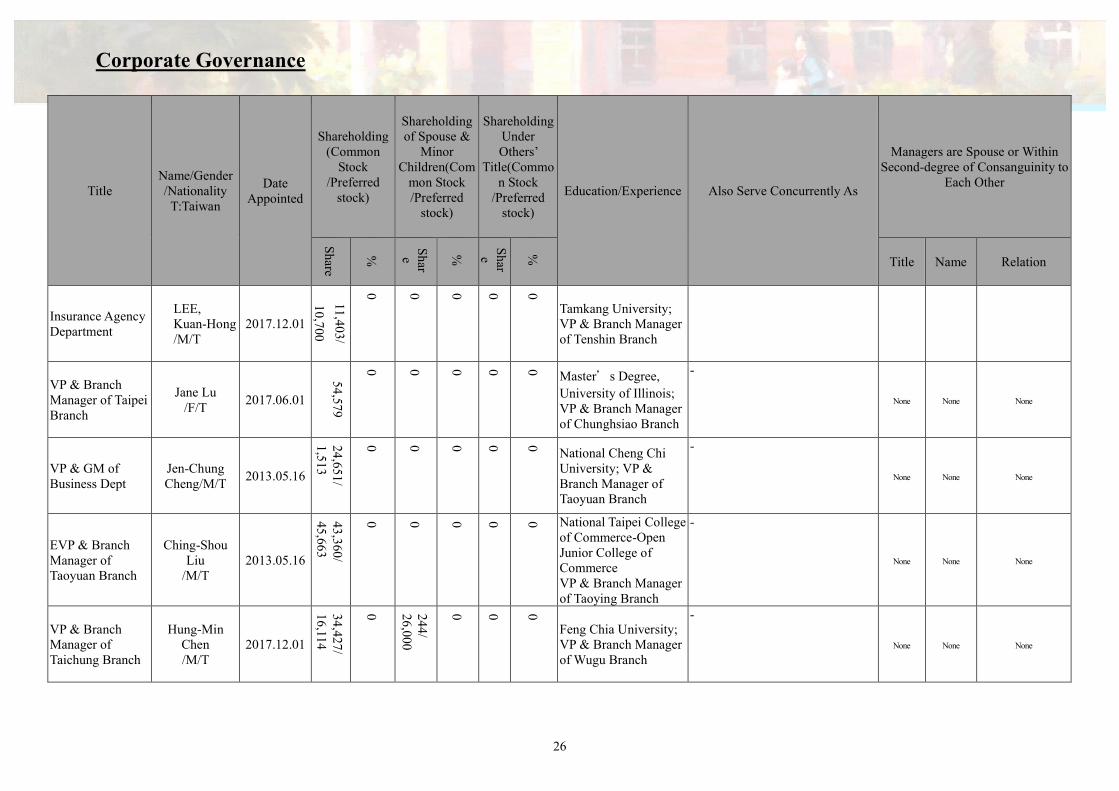
(2) President, SEVP, Chief Auditor, EVP and Managers of Departments/Branches Recordation Date: March 31, 2018(Shares Holding Recordation Date: April 10, 2018)
Unit: Shares;%
Title Name/Gender /Nationality
T:Taiwan
Date Appointed
Shareholding (Common
Stock /Preferred
stock)
Shareholding of Spouse &
Minor Children(Com
mon Stock /Preferred
stock)
Shareholding Under Others’
Title(Common Stock
/Preferred stock)
Education/Experience Also Serve Concurrently As
Managers are Spouse or Within Second-degree of Consanguinity to
Each Other
Sh
are
%
Sh
are
%
Sh
are
% Title Name Relation
President
LIN, HONG-LIAN
(Jeff Lin) /M/T
2006.08.02
5,594
,725 0
.19%
0
0
0
0
Master’s Degree, National Taiwan University; SEVP of UBOT
Supervisor of Union Recreation Enterprise Corp.; Director of The Liberty Times; Executive Director of Union Dyeing and Finishing Co., Ltd. Union Finance International (HK) Director
None None None
SEVP
CHAN, YING-PO
(Yin-Bor Chan) /M/T
2006.07.01
385
,753/
20,000
0.01%
/ 0%
0
0
0
0
Tamkang University; EVP of UBOT
Supervisor of Union Finance & Leasing
(International) Co., Ltd., , None None None
SEVP .
TU, HER-MAN
(Herman Tu) /M/T
2006.07.01
233
,506
0
0
0
0
0
Chinese Culture University; EVP of UBOT
Director of Union Securities Investment Trust Co., Ltd. Director of Union Finance & Leasing (International) Co., Ltd.
None None None
SEVP
LIU, CHENG-YU (Cheng-Yu Liu)/M/T
2010.07.01
42,749/
20,000
0
0
0
0
0
Takming College EVP of UBOT
Director of Union Information Technology Co., Ltd. Director of Union Finance International (HK)
None None None

Corporate Governance
21
Title Name/Gender /Nationality
T:Taiwan
Date Appointed
Shareholding (Common
Stock /Preferred
stock)
Shareholding of Spouse &
Minor Children(Com
mon Stock /Preferred
stock)
Shareholding Under Others’
Title(Common Stock
/Preferred stock)
Education/Experience Also Serve Concurrently As
Managers are Spouse or Within Second-degree of Consanguinity to
Each Other
Sh
are
%
Sh
are
%
Sh
are
% Title Name Relation
SEVP HSU,
WEI-WEN /M/T
2018.3.26
0
0
0
0
0
0 Master’s Degree, N
National Chengchi University, Director General of Bureau of Agricultural Finance,
- None None None
Chief Auditor
KANG, KUO-PAO (Kuo-Pao
Kang)/M/T
2010.11.01
34,874
/ 2,1
41
0
0
0
0
0 National Chiao Tung
University; VP & Branch Manager of E. Taipei Branch of UBOT
- None None None
Chief Compliance Officer and VP & GM of Legal Affair and Compliance Dept.
CHEN, CHING-WEN
/M/T 2017.06.01
22,425/
10,000
0
0
0
0
0 Soochow University
VP & Branch Manager of Nanking E.Branch of UBOT
-
None None None
EVP & GM of Consumer Banking Dept
HSIEH CHENG-JUH (Cheng-Juh Hsieh)/M/T
2017.07.01
312,139
/ 65,000
0.01
%/
0
0
0
0
0 Graduate School,
University of South Australia, EVP & GM of Vehicle Loan Department
Director of Union Finance & Leasing (Int’l) Corporation,
Director of Union Capital (Cayman) Corp, Director of New Asian Ventures Ltd.
None None None
SVP
CHIEN, HUNG-MING
(Peter Chien)/M/T
2006.06.26
100,330
/ 20,000
0
0
0
0
0 Panchiao Senior High
School; VP & Branch Manager of Hsinchung Branch of UBOT
-
None None None

Corporate Governance
22
Title Name/Gender /Nationality
T:Taiwan
Date Appointed
Shareholding (Common
Stock /Preferred
stock)
Shareholding of Spouse &
Minor Children(Com
mon Stock /Preferred
stock)
Shareholding Under Others’
Title(Common Stock
/Preferred stock)
Education/Experience Also Serve Concurrently As
Managers are Spouse or Within Second-degree of Consanguinity to
Each Other
Sh
are
%
Sh
are
%
Sh
are
% Title Name Relation
SVP & GM of Business Planning & Admin. Dept.
YANG, CHU-CHANG
(Yanger Yang)/M/T
2006.06.22
31
,42
5/
28
,93
0
0
0
0
0
0 Master’s Degree,
Tunghai University; VP and Deputy GM of Business Planning & Admin. Dept. of UBOT
Director of Lian-An Service Co. Ltd. & I Pass Corporation. Director of Euroc III Venture Capital. Corp.
None None None
VP & GM of Consumer Credit Dept.
TANG, PI-CHIU
(Joy Tang)/F/T 2004.03.22
66,361
0
0
0
0
0 Master’s Degree,
Memphis State University; VP & Deputy GM of Consumer Banking Dept.
-
None None None
VP & GM of Trust Dept.
TSAI, HANN-TSAU
(Hann-Tsau Tsai)/M/T
2006.06.22
253
,012/
10,000
0
2,005
0
0
0 Chung Yuan Christian
University; VP & GM of Business Planning & Admin. Dept of UBOT
-
None None None
VP & GM of Wealth Management Dept.
HSU, TING-YU
(Sophie Hsu)/F/T
2005.11.21
26,283
/ 10
,000
0
0
0
0
0 Master’s Degree, Canada Royal University; Executive VP of Business Development Dept. of ING
Director of Union Securities Investment Trust Co., Ltd.
None None None
VP & GM of Securities Finance Dept.
YANG, HUI-CHIN/F/T
2013.03.20
0/
3,000
0
0
0
0
0
Feng Jia University First Securities Fong Yuan Branch Manager
-
None None None

Corporate Governance
23
Title Name/Gender /Nationality
T:Taiwan
Date Appointed
Shareholding (Common
Stock /Preferred
stock)
Shareholding of Spouse &
Minor Children(Com
mon Stock /Preferred
stock)
Shareholding Under Others’
Title(Common Stock
/Preferred stock)
Education/Experience Also Serve Concurrently As
Managers are Spouse or Within Second-degree of Consanguinity to
Each Other
Sh
are
%
Sh
are
%
Sh
are
% Title Name Relation
VP & GM of Bills Finance Dept.
LEE, YAO-HSIEN (Yao-Hsien Lee)/M/T
2010.08.16
87
,80
9/
16
,00
0
0
0
0
0
0
Feng Jia University Manager of Union Bills Finance Corp.
-
None None None
VP & GM of Treasury Dept.
CHENG, WEN-CHIH
/M/T 2016.03.16
19,600
0
0
0
0
0
Feng Jia University; AVP & Division Head of Treasury Dept
-
None None None
VP & GM of Corporate Loans Policy & Admin. Dept.
LIU, CHUEH-LING
/F/T 2014.4.01
31,913
/ 10
,000
0
0
0
0
0 Master’s degree,
George Washington University Deputy GM of Corporate Loans Policy & Admin Dept.
VP & GM of Vehicle Loans Dept.
TU, SHUM-CHEN/
M/T 2017.07.01
10,175/
12,000
4,000
National Chung Hsing University,;AVP & Division of Vehicle Loans Dept.
VP & GM of Real Estate Management Dept.
LI, JUN-NAN (Michael Lee)/M/T
2004.03.05
621
/ 6,0
00
0
0
0
0
0 Master’s Degree,
National Cheng Chi University; VP & Branch Manager of Hueilong Branch
-
None None None

Corporate Governance
24
Title Name/Gender /Nationality
T:Taiwan
Date Appointed
Shareholding (Common
Stock /Preferred
stock)
Shareholding of Spouse &
Minor Children(Com
mon Stock /Preferred
stock)
Shareholding Under Others’
Title(Common Stock
/Preferred stock)
Education/Experience Also Serve Concurrently As
Managers are Spouse or Within Second-degree of Consanguinity to
Each Other
Sh
are
%
Sh
are
%
Sh
are
% Title Name Relation
VP & GM of Product Development &Marketing Dept.
KAO, YI-CHUN
(June Kao)/F/T 2015.08.01
6,2
75
/
20
,00
0
0
0
0
0
0 National Cheng Chi
University; AVP & Division Head of Wealth Management Dept.
None None None
VP & GM of Information Technology Dept.
YANG, FENG-JUNG
(Luke Yang)/M/T
2006.07.01
90,833
0
0
0
0
0 Master’s Degree,
National Taiwan University; Deputy GM of IT Dept. of UBOT
Director of Union Information Technology Co., Ltd.
None None None
VP & GM of Human Resources Dept.
LIN, HSIAO-CHEN
(Michael Lin)/M/T
1999.12.01
31,995
0
0
0
0
0 National Chung Hsing
University; VP & Deputy GM of Human Resources Dept.Of UBOT
-
None None None
VP & GM of General Affairs Dept.
CHANG, YU-CHANG (Russell YC Chang)/M/T
2003.10.01
137,041
0
0
0
0
0 Taiwan Institute of
Technology; VP & Deputy GM of General Affairs Dept.of UBOT
-
None None None
VP & GM of Operations Center
HSUEH, SHU-FENG (Shu-Feng Hsueh)/F/T
2005.09.06
23,598
/ 10
,000
0
2,149
0
0
0 National Cheng Chi
University; AVP of Hsintien Branch
-
None None None

Corporate Governance
25
Title Name/Gender /Nationality
T:Taiwan
Date Appointed
Shareholding (Common
Stock /Preferred
stock)
Shareholding of Spouse &
Minor Children(Com
mon Stock /Preferred
stock)
Shareholding Under Others’
Title(Common Stock
/Preferred stock)
Education/Experience Also Serve Concurrently As
Managers are Spouse or Within Second-degree of Consanguinity to
Each Other
Sh
are
%
Sh
are
%
Sh
are
% Title Name Relation
VP &GM of International Banking Department
TSENG, MENG -YUN
(Connie Tseng)/F/T
2010.09.01
20
,49
9/
2,0
00
0
0
0
0
0 Master’s degree of
National University, USA CA; VP of International Banking Dept. and OBU, Jih Sun Commercial Bank
Director of Union Finance International (HK)
None None None
VP & GM of Branch of OBU and Rep. of Hong Kong Rept. Office & Ho Chi Minh Rept. Office
LU, MEI-CHIH
(Lisa Lu)/F/T 2010.09.01
53,148
/ 8,0
00
0
0
0
0
0 MBA University of
Birmingham, UK; AVP of OBU and representative of Hong Kong Representative Office & Ho Chi Minh Representative Office (FRM)
-
None None None
VP & GM of Credit Card & Payment Finance Division
HSIUNG, LING-JUNG/F
/T 2016.06.15
0
0
0
0
0
0 Master’s degree of
New Jersey Institute of Technology; SVP of Citibank
Director of I Pass Corporation. Supervisor of Union Information Technology Co., Ltd None None None
VP & GM of Risk Management Department
CHANG, HUEI-WEN
/F/T 2016.08.24
15,440
/ 2,0
00
0
0/
2,000
0
0
0 Tamkang University;
AVP & Division Head of Risk Management Dept.
Corporate Governance
26
Title Name/Gender /Nationality
T:Taiwan
Date Appointed
Shareholding (Common
Stock /Preferred
stock)
Shareholding of Spouse &
Minor Children(Com
mon Stock /Preferred
stock)
Shareholding Under Others’
Title(Common Stock
/Preferred stock)
Education/Experience Also Serve Concurrently As
Managers are Spouse or Within Second-degree of Consanguinity to
Each Other
Sh
are
%
Sh
are
%
Sh
are
% Title Name Relation
Insurance Agency Department
LEE, Kuan-Hong /M/T
2017.12.01
11,4
03
/
10
,70
0
0
0
0
0
0
Tamkang University; VP & Branch Manager of Tenshin Branch
VP & Branch Manager of Taipei Branch
Jane Lu /F/T
2017.06.01
54,579
0
0
0
0
0 Master’s Degree,
University of Illinois; VP & Branch Manager of Chunghsiao Branch
-
None None None
VP & GM of Business Dept
Jen-Chung Cheng/M/T
2013.05.16
24,651
/ 1,5
13
0
0
0
0
0 National Cheng Chi
University; VP & Branch Manager of Taoyuan Branch
-
None None None
EVP & Branch Manager of Taoyuan Branch
Ching-Shou Liu
/M/T 2013.05.16
43,360
/ 45
,663
0
0
0
0
0 National Taipei College
of Commerce-Open Junior College of Commerce VP & Branch Manager of Taoying Branch
-
None None None
VP & Branch Manager of Taichung Branch
Hung-Min Chen /M/T
2017.12.01
34,427
/ 16
,114
0
244
/ 26
,000
0
0
0
Feng Chia University; VP & Branch Manager of Wugu Branch
-
None None None

Corporate Governance
27
Title Name/Gender /Nationality
T:Taiwan
Date Appointed
Shareholding (Common
Stock /Preferred
stock)
Shareholding of Spouse &
Minor Children(Com
mon Stock /Preferred
stock)
Shareholding Under Others’
Title(Common Stock
/Preferred stock)
Education/Experience Also Serve Concurrently As
Managers are Spouse or Within Second-degree of Consanguinity to
Each Other
Sh
are
%
Sh
are
%
Sh
are
% Title Name Relation
VP & Branch Manager of Nanking E. Road Branch
Jeffery Tsai /M/T
2017.06.01
43
,35
5/
29
,66
2
0
0
0
0
0 Master’s Degree, Fu
Jen Catholic University; VP & Branch Manager of Hsinchuang Branch
-
None None None
VP & Branch Manager of Chungli Branch
Chang-Yung Chen/M/T
2017.12.01
21,252
/ 1,3
05
0
0
0
0
0
Feng Chia University; VP & Branch Manager of Gaorong Branch
-
None None None
VP & Branch Manager of Sanchung Branch
Chia-Wei Lin/M/T
2015.11.16
13,792
/ 14
,000
0
0
0
0
0 Tung Hai University;
VP & Branch Manager of Breeze Mini Branch
-
None None None
VP & Branch Manager of East Taipei Branch
Yeong-Jin Hwang/M/T
2017.06.01
20,783
0
0
0
0
0 Master’s Degree,
University of Dallas. VP & Branch Manager of Luchu Branch
-
None None None
VP & Branch Manager of Kaohsiung Branch
Feng-Li Lin /F/T
2017.12.01
50,480
0
0
0
0
0
Feng Chia University; VP & Branch Manager of Lingya Branch
Director of I Pass Corporation
None None None
Corporate Governance
28
Title Name/Gender /Nationality
T:Taiwan
Date Appointed
Shareholding (Common
Stock /Preferred
stock)
Shareholding of Spouse &
Minor Children(Com
mon Stock /Preferred
stock)
Shareholding Under Others’
Title(Common Stock
/Preferred stock)
Education/Experience Also Serve Concurrently As
Managers are Spouse or Within Second-degree of Consanguinity to
Each Other
Sh
are
%
Sh
are
%
Sh
are
% Title Name Relation
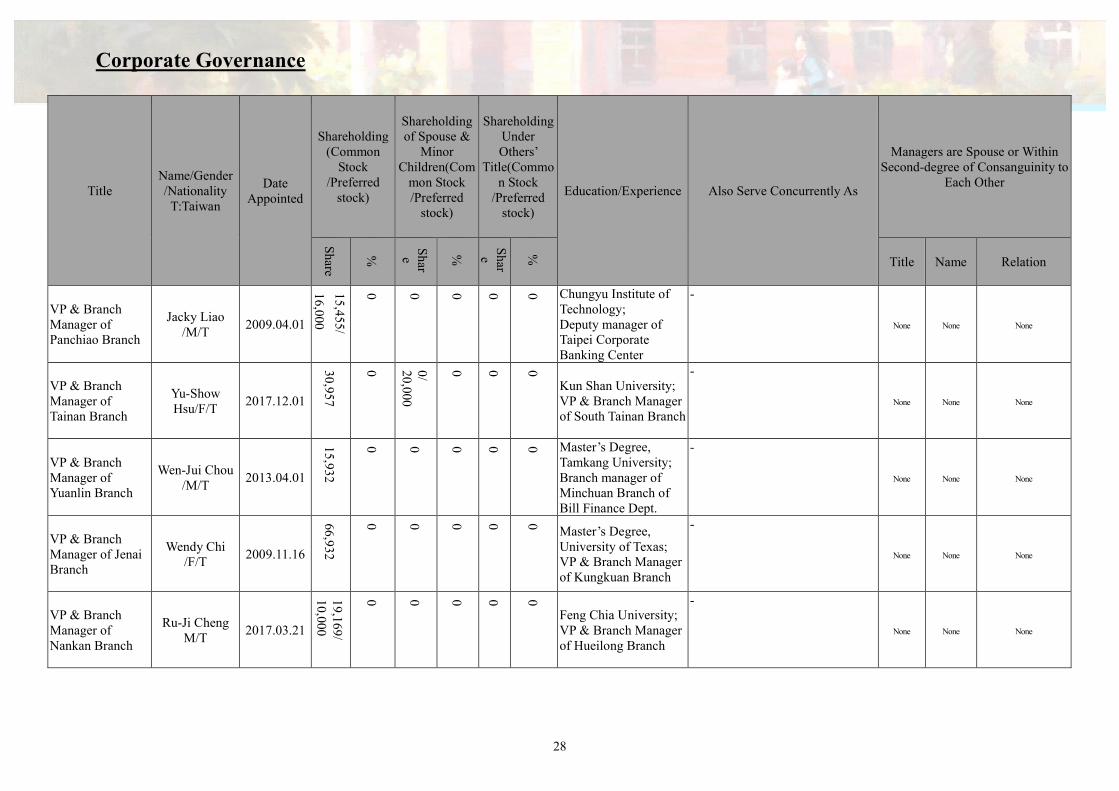
VP & Branch Manager of Panchiao Branch
Jacky Liao /M/T
2009.04.01
15
,45
5/
16
,00
0
0
0
0
0
0 Chungyu Institute of
Technology; Deputy manager of Taipei Corporate Banking Center
-
None None None
VP & Branch Manager of Tainan Branch
Yu-Show Hsu/F/T
2017.12.01
30,957
0
0/
20,000
0
0
0
Kun Shan University; VP & Branch Manager of South Tainan Branch
-
None None None
VP & Branch Manager of Yuanlin Branch
Wen-Jui Chou /M/T
2013.04.01
15,932
0
0
0
0
0 Master’s Degree,
Tamkang University; Branch manager of Minchuan Branch of Bill Finance Dept.
-
None None None
VP & Branch Manager of Jenai Branch
Wendy Chi /F/T
2009.11.16
66,932
0
0
0
0
0 Master’s Degree,
University of Texas; VP & Branch Manager of Kungkuan Branch
-
None None None
VP & Branch Manager of Nankan Branch
Ru-Ji Cheng M/T
2017.03.21
19
,169/
10,000
0
0
0
0
0
Feng Chia University; VP & Branch Manager of Hueilong Branch
-
None None None
Corporate Governance
29
Title Name/Gender /Nationality
T:Taiwan
Date Appointed
Shareholding (Common
Stock /Preferred
stock)
Shareholding of Spouse &
Minor Children(Com
mon Stock /Preferred
stock)
Shareholding Under Others’
Title(Common Stock
/Preferred stock)
Education/Experience Also Serve Concurrently As
Managers are Spouse or Within Second-degree of Consanguinity to
Each Other
Sh
are
%
Sh
are
%
Sh
are
% Title Name Relation
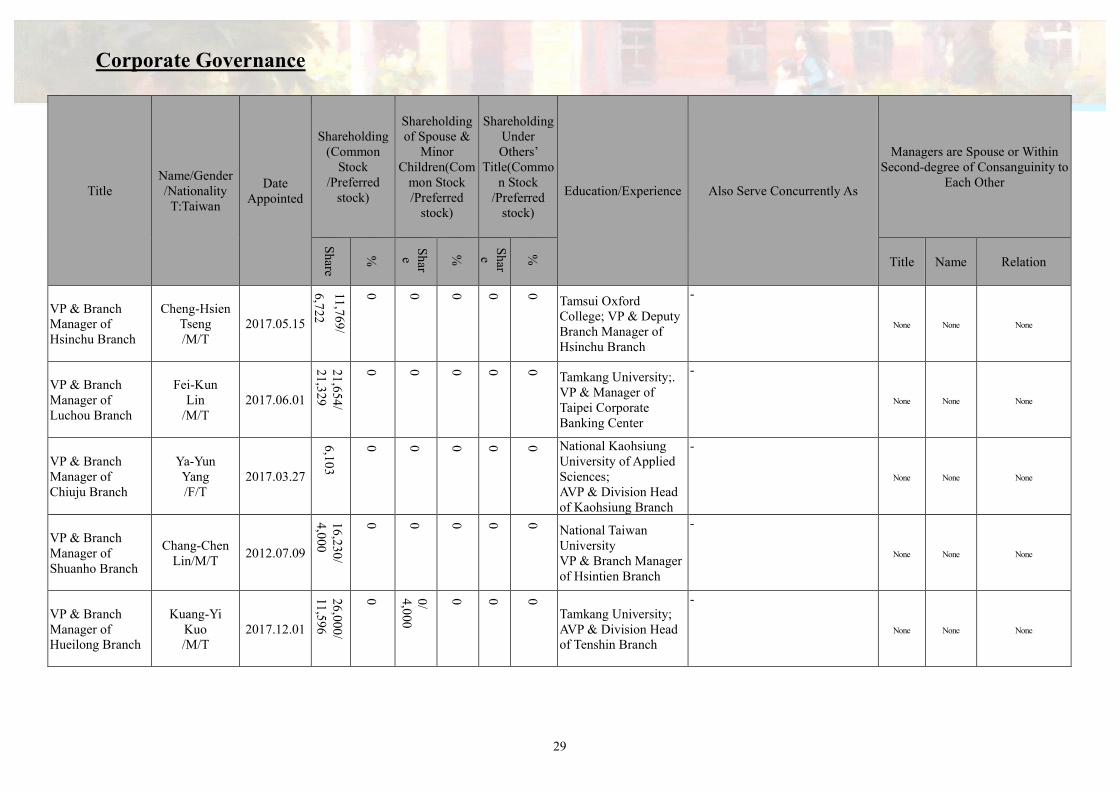
VP & Branch Manager of Hsinchu Branch
Cheng-Hsien Tseng /M/T
2017.05.15
11,7
69
/
6,7
22
0
0
0
0
0 Tamsui Oxford
College; VP & Deputy Branch Manager of Hsinchu Branch
-
None None None
VP & Branch Manager of Luchou Branch
Fei-Kun Lin
/M/T 2017.06.01
21,654
/ 21,329
0
0
0
0
0 Tamkang University;.
VP & Manager of Taipei Corporate Banking Center
-
None None None
VP & Branch Manager of Chiuju Branch
Ya-Yun Yang /F/T
2017.03.27
6,10
3
0
0
0
0
0 National Kaohsiung
University of Applied Sciences; AVP & Division Head of Kaohsiung Branch
-
None None None
VP & Branch Manager of Shuanho Branch
Chang-Chen Lin/M/T
2012.07.09
16,230
/ 4,0
00
0
0
0
0
0 National Taiwan
University VP & Branch Manager of Hsintien Branch
-
None None None
VP & Branch Manager of Hueilong Branch
Kuang-Yi Kuo /M/T
2017.12.01
26,000
/ 11,596
0
0/
4,000
0
0
0
Tamkang University; AVP & Division Head of Tenshin Branch
-
None None None

Corporate Governance
30
Title Name/Gender /Nationality
T:Taiwan
Date Appointed
Shareholding (Common
Stock /Preferred
stock)
Shareholding of Spouse &
Minor Children(Com
mon Stock /Preferred
stock)
Shareholding Under Others’
Title(Common Stock
/Preferred stock)
Education/Experience Also Serve Concurrently As
Managers are Spouse or Within Second-degree of Consanguinity to
Each Other
Sh
are
%
Sh
are
%
Sh
are
% Title Name Relation
VP & Branch Manager of Chiayi Branch
Liang- Kuei Kuo/M/T
2013.08.12
0
0
0
0
0
0 Master of National
Yunlin University of Science and Technology; Tainan Branch manager of J.P.Morgan Asset Management
-
None None None
VP & Branch Manager of Kungkuan Branch
Fang-Ni Wang/F/T
2014.4.1
18,6
43/ 5,0
00
0
0
0
0
0 Master’s Degree,
National Central University; AVP & Division Head of Corporate loans policy & Administration Dept.
-
None None None
VP & Branch Manager of Neili Branch
Shen-Yung Peng/M/T
2013.04.01
35,851
0
8,797
0
0
0
Ching Yun University; VP & Branch Manager of Tunhwa Branch
-
None None None
VP & Branch Manager of Chunghsiao Branch
Zhi-Zhong Zhang/M/T
2017.06.01
4,173
/ 10
0,000
0
0
0
0
0 National Chao Tung
University; VP & Branch Manager of East Taipei Branch
-
None None None

Corporate Governance
31
Title Name/Gender /Nationality
T:Taiwan
Date Appointed
Shareholding (Common
Stock /Preferred
stock)
Shareholding of Spouse &
Minor Children(Com
mon Stock /Preferred
stock)
Shareholding Under Others’
Title(Common Stock
/Preferred stock)
Education/Experience Also Serve Concurrently As
Managers are Spouse or Within Second-degree of Consanguinity to
Each Other
Sh
are
%
Sh
are
%
Sh
are
% Title Name Relation
VP & Branch Manager of Hsinchuang Branch
Wen-Shien Chu /M/T
2017.06.01
21
,51
0/
20
,00
0
0
0
0
0
0 Fu Jen Catholic
University;VP & Deputy Genaral Manager of the Law and Compliance Deprt.
-
None None None
VP & Branch Manager of Fengshan Branch
Miao-Hui Yeh /F/T
2017.12.01
97,612
0
0
0
0
0 Master’s Degree, New
York University; VP & Branch Manager of North Kaohsiung Branch
None None None
VP & Branch Manager of Taoying Branch
Jyh-Chiang, Huang /M/T
2013.05.16
72,402
0
16,422
/ 5,0
08
0
0
0 National Chiao Tung
University VP & Branch Manager of Dajhu Branch
None None None
VP & Branch Manager of Lungtan Branch
Lawrence Chen /M/T
2009.12.01
40,095
0
0
0
0
0 Master’s Degree,
National Central University; VP & Branch Manager of Neili Branch
-
None None None
VP & Branch Manager of Hsintien Branch
Shih-Shien Chene /M/T
2012.07.09
6,026
0
0
0
0
0 National Taiwan
University of Science and Technology; Sindian Branch Manager of Yuanta Bank
-
None None None
Corporate Governance
32
Title Name/Gender /Nationality
T:Taiwan
Date Appointed
Shareholding (Common
Stock /Preferred
stock)
Shareholding of Spouse &
Minor Children(Com
mon Stock /Preferred
stock)
Shareholding Under Others’
Title(Common Stock
/Preferred stock)
Education/Experience Also Serve Concurrently As
Managers are Spouse or Within Second-degree of Consanguinity to
Each Other
Sh
are
%
Sh
are
%
Sh
are
% Title Name Relation
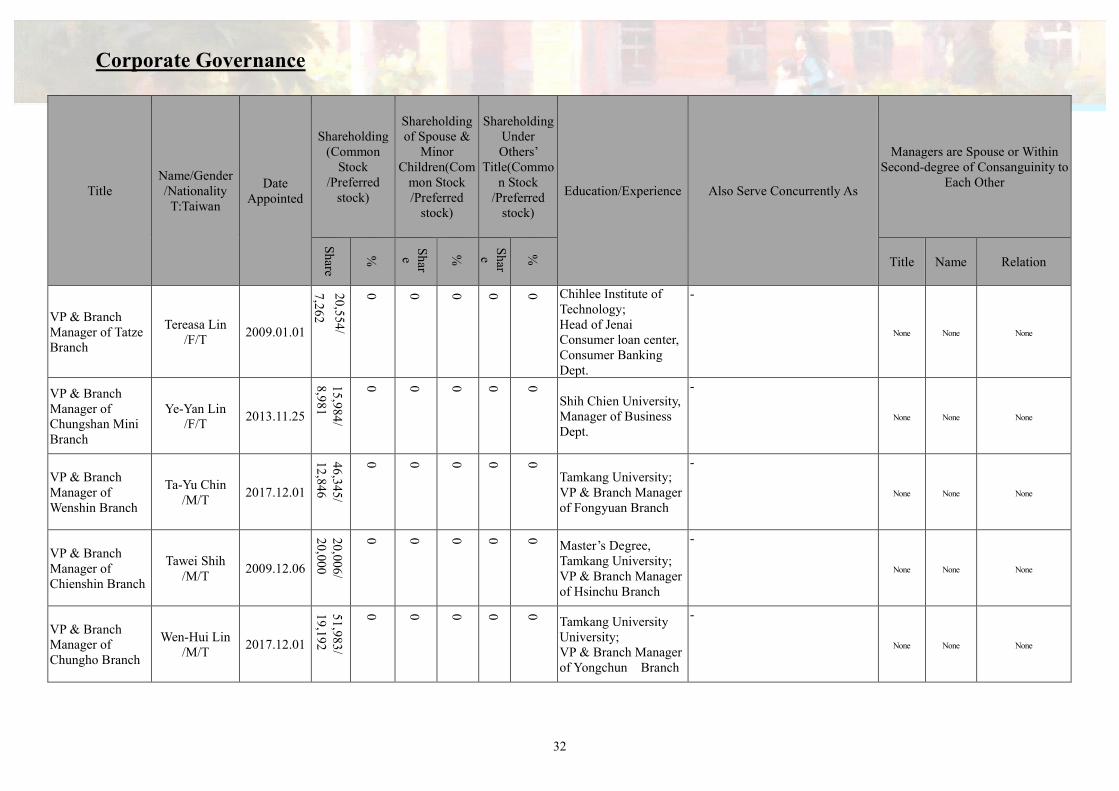
VP & Branch Manager of Tatze Branch
Tereasa Lin /F/T
2009.01.01
20
,55
4/
7,2
62
0
0
0
0
0 Chihlee Institute of
Technology; Head of Jenai Consumer loan center, Consumer Banking Dept.
-
None None None
VP & Branch Manager of Chungshan Mini Branch
Ye-Yan Lin /F/T
2013.11.25
15,984
/ 8,9
81
0
0
0
0
0
Shih Chien University, Manager of Business Dept.
-
None None None
VP & Branch Manager of Wenshin Branch
Ta-Yu Chin /M/T
2017.12.01
46,345
/ 12
,846
0
0
0
0
0
Tamkang University; VP & Branch Manager of Fongyuan Branch
-
None None None
VP & Branch Manager of Chienshin Branch
Tawei Shih /M/T
2009.12.06
20,006/
20,000
0
0
0
0
0 Master’s Degree,
Tamkang University; VP & Branch Manager of Hsinchu Branch
-
None None None
VP & Branch Manager of Chungho Branch
Wen-Hui Lin /M/T
2017.12.01
51,983
/ 19
,192
0
0
0
0
0 Tamkang University
University; VP & Branch Manager of Yongchun Branch
-
None None None

Corporate Governance
33
Title Name/Gender /Nationality
T:Taiwan
Date Appointed
Shareholding (Common
Stock /Preferred
stock)
Shareholding of Spouse &
Minor Children(Com
mon Stock /Preferred
stock)
Shareholding Under Others’
Title(Common Stock
/Preferred stock)
Education/Experience Also Serve Concurrently As
Managers are Spouse or Within Second-degree of Consanguinity to
Each Other
Sh
are
%
Sh
are
%
Sh
are
% Title Name Relation
VP & Branch Manager of Neihu Branch
CM Hwang /M/T
2011.11.01
34
7,3
10
/
4,0
00
0.0
1%
0
0
0
0 Chung Yuan Christian
University; VP & Branch Manager of Hoping Branch
-
None None None
VP & Branch Manager of Dayuan Branch
Chang-Yung Chen /M/T
2017.12.01
174,851
/ 10,738
0
0
0
0
0 National Taipei College
of Commerce- Open Junior College of Commerce; VP & Branch Manager of Chungli Branch
-
None None None
VP & Branch Manager of Yungho Branch
Chun-Hsien Chang /M/T
2017.12.01
502
/ 6,0
00
0
0
0
0
0 National Chung-Shin
University; Vice President & General Manager of Insurance Agency Dept.
-
None None None
VP & Branch Manager of Chungkung Mini Branch
Shu-Huey Huang /F/T
2017.06.01
51,899
0
0
0
0
0 Lunghwa University of
Science and Technology; Head of Hueilong Consumer loan center, Consumer Banking Dept.
-
None None None
VP & Branch Manager of Tonghwa Mini Branch
Liang-Wen Liu /M/T
2017.05.15
11
0
0
0
0
0 Yanping High School ;
Junior Manager of Tonghwa Mini Branch .
-
None None None

Corporate Governance
34
Title Name/Gender /Nationality
T:Taiwan
Date Appointed
Shareholding (Common
Stock /Preferred
stock)
Shareholding of Spouse &
Minor Children(Com
mon Stock /Preferred
stock)
Shareholding Under Others’
Title(Common Stock
/Preferred stock)
Education/Experience Also Serve Concurrently As
Managers are Spouse or Within Second-degree of Consanguinity to
Each Other
Sh
are
%
Sh
are
%
Sh
are
% Title Name Relation
VP & Branch Manager of Shihtung Branch
Hsiu-Yun Su /F/T
2017.12.01
19
,39
9/
17
,19
1
0
0
0
0
0 Master’s Degree,
Dallas Baptist University; VP & Branch Manager of Yungho Branch
-
None None None
VP & Branch Manager of Breeze Center Mini Branch
Sheng-Hsiu Chou /M/T
2015.11.16
9,786
/ 14
,000
0
0
0
0
0 National Taipei College
of Commerce; Head of Jenai Consumer loan center, Consumer Banking Dept
-
None None None
VP & Branch Manager of Changchun Branch
Ming-Tsan Hung /M/T
2016.08.29
12,334
/ 5,0
00
0
0
0
0
0 Chinese Culture
University; Junior Manager of Neihu Branch.
-
None None None
VP & Branch Manager of Sungchiang Branch
Chien-Lung Chen M/T
2013.11.25
107,273
/ 14
,588
0
0
0
0
0 Master’s Degree,
Aletheia University; VP & Branch Manager of Breeze Center Mini Branch
-
None None None
VP & Branch Manager of Taan Branch
Chien-Hui Li/M/T
2011.11.01
14,947
0
0
0
0
0 Soochow University;
Head of Jenai Loan Center, Consumer Banking Department
-
None None None

Corporate Governance
35
Title Name/Gender /Nationality
T:Taiwan
Date Appointed
Shareholding (Common
Stock /Preferred
stock)
Shareholding of Spouse &
Minor Children(Com
mon Stock /Preferred
stock)
Shareholding Under Others’
Title(Common Stock
/Preferred stock)
Education/Experience Also Serve Concurrently As
Managers are Spouse or Within Second-degree of Consanguinity to
Each Other
Sh
are
%
Sh
are
%
Sh
are
% Title Name Relation
VP & Branch Manager of Yungchi Branch
Candy Lin /F/T
2011.07.16
38
,61
8/
5,0
00
0
0
0
0
0 National Chung Hsing
University; Head of Chunghsiao Loan Center, Consumer Banking Department
-
None None None
VP & Branch Manager of Wenlin Branch
Ju-Ling Kuo /F/T
2008.11.01
71,402
0
0
0
0
0 Takming College;
VP & Deputy GM of Consumer Banking Dept.
-
None None None
VP & Branch Manager of Tungmen Branch
Cooper Kao /M/T
2015.11.16
44,139
/ 16
,710
0
416
0
0
0 Chinese Municipal
Vocational School; Head of Chungho Loan Center Consumer Banking Dept
-
None None None
VP & Branch Manager of Tunhwa Branch
Gary Tsai /M/T
2013.04.01
13,249/
1,243
0
0/
50,000
0
0
0 Lunghwa University of
Science &Technology; Head of Nanking E. Rd. Loan Center Consumer Banking Dept.
-
None None None
VP & Branch Manager of Hsihu Branch
Anita Hung /F/T
2016.03.21
16,565
0
513
0
0
0
Soochow University; AVP & Division Head of Business Dept.
-
None None None

Corporate Governance
36
Title Name/Gender /Nationality
T:Taiwan
Date Appointed
Shareholding (Common
Stock /Preferred
stock)
Shareholding of Spouse &
Minor Children(Com
mon Stock /Preferred
stock)
Shareholding Under Others’
Title(Common Stock
/Preferred stock)
Education/Experience Also Serve Concurrently As
Managers are Spouse or Within Second-degree of Consanguinity to
Each Other
Sh
are
%
Sh
are
%
Sh
are
% Title Name Relation
VP & Branch Manager of Beitou Mini Branch
Wen-Chi Chiang /M/T
2014.11.17
10
,89
6
0
6,9
58
/ 1
0,0
00
0
0
0 National Chiao-Tong
University; Head of Jenai Loan Center Consumer Banking Dept.
-
None None None
VP & Branch Manager of North Sanchung Branch
Shis-Wen Lu /M/T
2017.12.01
14,184
0
7,003
0
0
0 Takming Junior
College of Commerce; VP & Branch Manager of Fuguo Branch
-
None None None
VP & Branch Manager of Houpu Branch
Chuen-Chour Li
/F/T 2017.12.01
0/
20,000
0
0
0
0
0 National Chung Hsing
University; AVP & Division Head of East Taipei Branch
-
None None None
VP & Branch Manager of North Chungho Mini Branch
Vickie Chou /F/T
2016.03.21
25
0
0
0
0
0 Cheng Chi University;
Vice President & Deputy Branch Manage of Chungho Branch
-
None None None
VP & Branch Manager of Fuguo Branch
Su-Yean Lo /M/T
2017.12.01
14,662
0
0
0
0
0 National Changhua
Senior School of Commerce; VP & Branch Manager of Houpu Branch
-
None None None
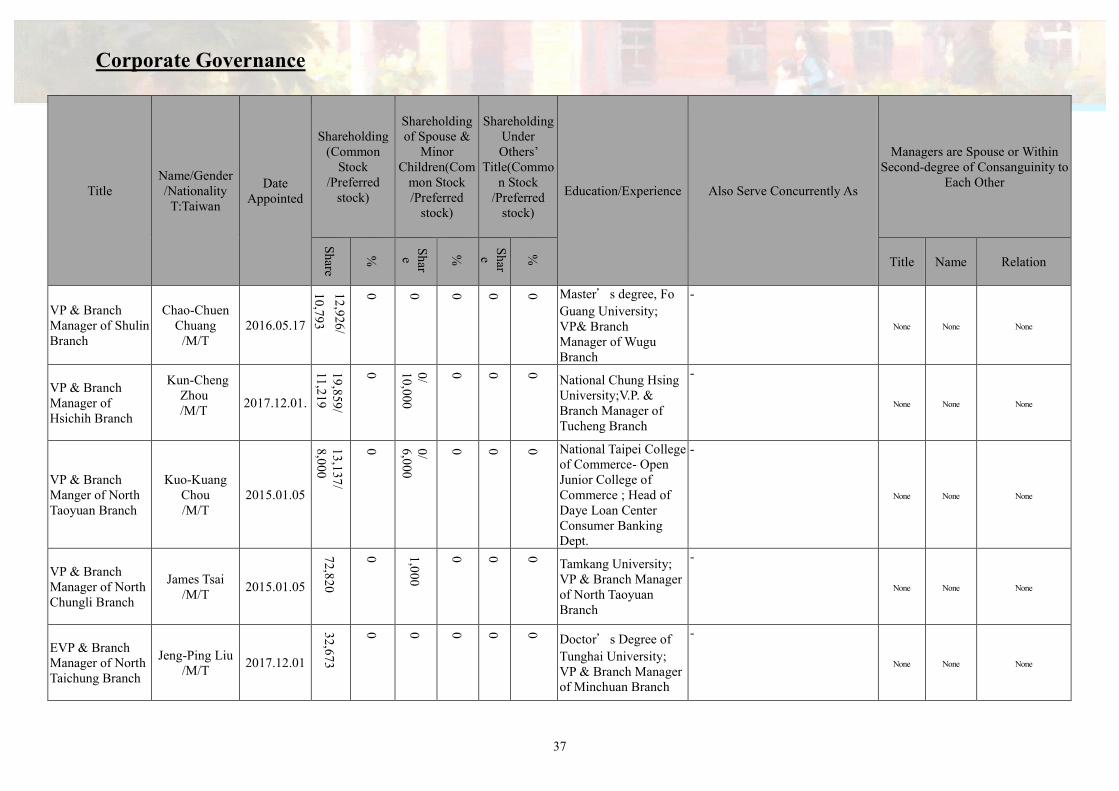
Corporate Governance
37
Title Name/Gender /Nationality
T:Taiwan
Date Appointed
Shareholding (Common
Stock /Preferred
stock)
Shareholding of Spouse &
Minor Children(Com
mon Stock /Preferred
stock)
Shareholding Under Others’
Title(Common Stock
/Preferred stock)
Education/Experience Also Serve Concurrently As
Managers are Spouse or Within Second-degree of Consanguinity to
Each Other
Sh
are
%
Sh
are
%
Sh
are
% Title Name Relation
VP & Branch Manager of Shulin Branch
Chao-Chuen Chuang
/M/T 2016.05.17
12
,92
6/
10
,79
3
0
0
0
0
0 Master’s degree, Fo
Guang University; VP& Branch Manager of Wugu Branch
-
None None None
VP & Branch Manager of Hsichih Branch
Kun-Cheng Zhou /M/T
2017.12.01.
19,859
/ 11,219
0
0/
10,000
0
0
0 National Chung Hsing
University;V.P. & Branch Manager of Tucheng Branch
-
None None None
VP & Branch Manger of North Taoyuan Branch
Kuo-Kuang Chou /M/T
2015.01.05
13,137
/ 8,0
00
0
0/
6,000
0
0
0 National Taipei College
of Commerce- Open Junior College of Commerce ; Head of Daye Loan Center Consumer Banking Dept.
-
None None None
VP & Branch Manager of North Chungli Branch
James Tsai /M/T
2015.01.05
72,8
20
0
1,00
0
0
0
0 Tamkang University;
VP & Branch Manager of North Taoyuan Branch
-
None None None
EVP & Branch Manager of North Taichung Branch
Jeng-Ping Liu /M/T
2017.12.01
32,673
0
0
0
0
0 Doctor’s Degree of
Tunghai University; VP & Branch Manager of Minchuan Branch
-
None None None

Corporate Governance
38
Title Name/Gender /Nationality
T:Taiwan
Date Appointed
Shareholding (Common
Stock /Preferred
stock)
Shareholding of Spouse &
Minor Children(Com
mon Stock /Preferred
stock)
Shareholding Under Others’
Title(Common Stock
/Preferred stock)
Education/Experience Also Serve Concurrently As
Managers are Spouse or Within Second-degree of Consanguinity to
Each Other
Sh
are
%
Sh
are
%
Sh
are
% Title Name Relation
VP & Branch Manager of Minchuan Branch
Hui-Fen Chao /F/T
2017.12.01
10
1,3
17
0
0
0
0
0 Graduate School of
National Yunlin University of Science and Technology ; VP & Branch Manager of North Taichung Branch
-
None None None
VP & Branch Manager of Hsitun Branch
Meng-Hsia Wu /F/T
2017.12.01
62,820
0
0
0
0
0 National Tsao-Tun
Commercial & Industrial Vocational Senior High School; VP & Branch Manager of Taichung Branch
-
None None None
VP & Branch Manager of Shingchung Branch
Chien-Tsung Wu
/M/T 2016.08.29
32,105
0
0
0
0
0 The Overseas Chinese
Institute of Technology; VP & Branch Manager of Beitun Branch
-
None None None
VP & Branch Manager of Beitun Branch
Chen-Jen Chang /M/T
2017.06.01
20,040
/ 3,0
00
0
0
0
0
0 Tonghai University; AVP & Deputy Manager of Minchuan Branch, Wealth Management Dept.
-
None None None
VP & Branch Manager of S. Yuanlin Branch
Wu-Yuan Chen /M/T
2005.03.19
51,543
/ 20
,000
0
0
0
0
0 Master’s Degree,
Dayeh University; Senior AVP of National Cash Card Dept.
-
None None None

Corporate Governance
39
Title Name/Gender /Nationality
T:Taiwan
Date Appointed
Shareholding (Common
Stock /Preferred
stock)
Shareholding of Spouse &
Minor Children(Com
mon Stock /Preferred
stock)
Shareholding Under Others’
Title(Common Stock
/Preferred stock)
Education/Experience Also Serve Concurrently As
Managers are Spouse or Within Second-degree of Consanguinity to
Each Other
Sh
are
%
Sh
are
%
Sh
are
% Title Name Relation
VP & Branch Manager of East Chiayi Branch
Shan-Chih Yen /M/T
2005.03.19
61
,31
9/
17
,76
6
0
3,5
42
/ 6
,21
7
0
0
0 Master’s Degree,
Chiayi University; Senior AVP of National Cash Card Dept.
Supervisor of Zhong-Guan Foods Enterprise Co., Ltd.
None None None
VP & Branch Manager of Fucheng Branch
Ping-Hui Lin /M/T
2017.12.01
22,796
/ 20,000
0
0
0
0
0
Aletheia University; VP & Branch Manager of Tainan Branch
-
None None None
VP & Branch Manager of Fongyuan Branch
Amy Chung /F/T
2017.12.01
27,678
/ 3,0
00
0
0
0
0
0 National Cheng Kung
University; VP & Branch Manager of Wenshin Branch
-
None None None
VP & Branch Manager of Fuchiang Branch
Roger Chang /M/T
2017.12.01
0
0
0
0
0
0 National Open
University; VP & Branch Manager of Kaiyuan Branch
-
None None None
VP & Branch Manager of Kaiyuan Branch
Alex Chiu /M/T
2017.12.01
074,200
/ 4,5
57
0
0/
5,000
0
0
0 Southern Taiwan
University of Science Technology.; VP & Branch Manager of Fuchiang Branch.
-
None None None

Corporate Governance
40
Title Name/Gender /Nationality
T:Taiwan
Date Appointed
Shareholding (Common
Stock /Preferred
stock)
Shareholding of Spouse &
Minor Children(Com
mon Stock /Preferred
stock)
Shareholding Under Others’
Title(Common Stock
/Preferred stock)
Education/Experience Also Serve Concurrently As
Managers are Spouse or Within Second-degree of Consanguinity to
Each Other
Sh
are
%
Sh
are
%
Sh
are
% Title Name Relation
VP & Branch Manager of South Tainan Branch
Huei-Jen Chiou /F/T
2017.12.01
22
,54
5/
3,3
84
0
0
0
0
0 National Kaohsiung
Institute of Technology ;AVP & Division Head Of Law & Compliance Dept in South section.
-
None None None
VP & Branch Manager of Lingya Branch
Hsien-Ming Yen /M/T
2017.12.01
1,429
0
0
0
0
0
Feng Chia University; VP & Branch Manager of Fucheng Branch
None None None
VP & Branch Manager of North Kaohsiung Branch
Wen-Chian Chang/M/T
2017.12.01
10,000
/ 61
4
0
10,000
/ 61
4
0
0
0
Soochow University; VP & Branch Manager of Kaohsiung Branch
-
None None None
VP & Branch Manager of Sanmin Branch
I-Wen Ho /M/T
2017.12.01
5,858
/ 16
,000
0
0
0
0
0 Master’s Degree,
National Chung Hsing University;VP & Branch Manager of Wuchia Branch
-
None None None
VP & Branch Manager of Wuchia Branch
Miranda Tsai /F/T
2017.12.01
20,130/
20,000
0
0
0
0
0 Tamkang University
University ; VP & Branch Manager of Sanmin Branch
-
None None None

Corporate Governance
41
Title Name/Gender /Nationality
T:Taiwan
Date Appointed
Shareholding (Common
Stock /Preferred
stock)
Shareholding of Spouse &
Minor Children(Com
mon Stock /Preferred
stock)
Shareholding Under Others’
Title(Common Stock
/Preferred stock)
Education/Experience Also Serve Concurrently As
Managers are Spouse or Within Second-degree of Consanguinity to
Each Other
Sh
are
%
Sh
are
%
Sh
are
% Title Name Relation
VP & Branch Manager of Pingtung Branch
Chi-Fang Chu /F/T
2014.03.19
11,0
26
/
8,0
00
0
0
0
0
0 Master’s Degree,
National Kaohsiung First University of Science and Technology; Manager of Pingtung Branch
-
None None None
VP & Branch Manager of Hoping Branch
Tsai-Ling Liao /F/T
2011.11.01
0
0
0
0
0
0 Taipei College of
Commerce; VP & Branch Manager of Taan Branch
None None None
VP & Branch Manager of Yongchun Branch
Shiu-Lan Hsieh /F/T
2017.12.01
36,000
/ 12
,211
0
0
0
0
0 National Taipei College
of Commerce- Open Junior College of Commerce; VP & Branch Manager of Linkou Branch
-
None None None
VP & Branch Manager of Tenshin Branch
Teh-Chin Tsai /M/T
2017.12.01
127,843
/ 21
,851
0
0
0
0 Kai Nan High School
of Commercial and Industry; VP & Branch Manager of North Sanchung Branch
-
None None None
VP & Branch Manager of Ankang Branch
Chan-Kwei Chen /M/T
2009.12.01
73,653
/ 8,5
23
0
0/
4,000
0
0
0
Feng Chia University; VP & Branch Manager of Shihtung Branch
-
None None None
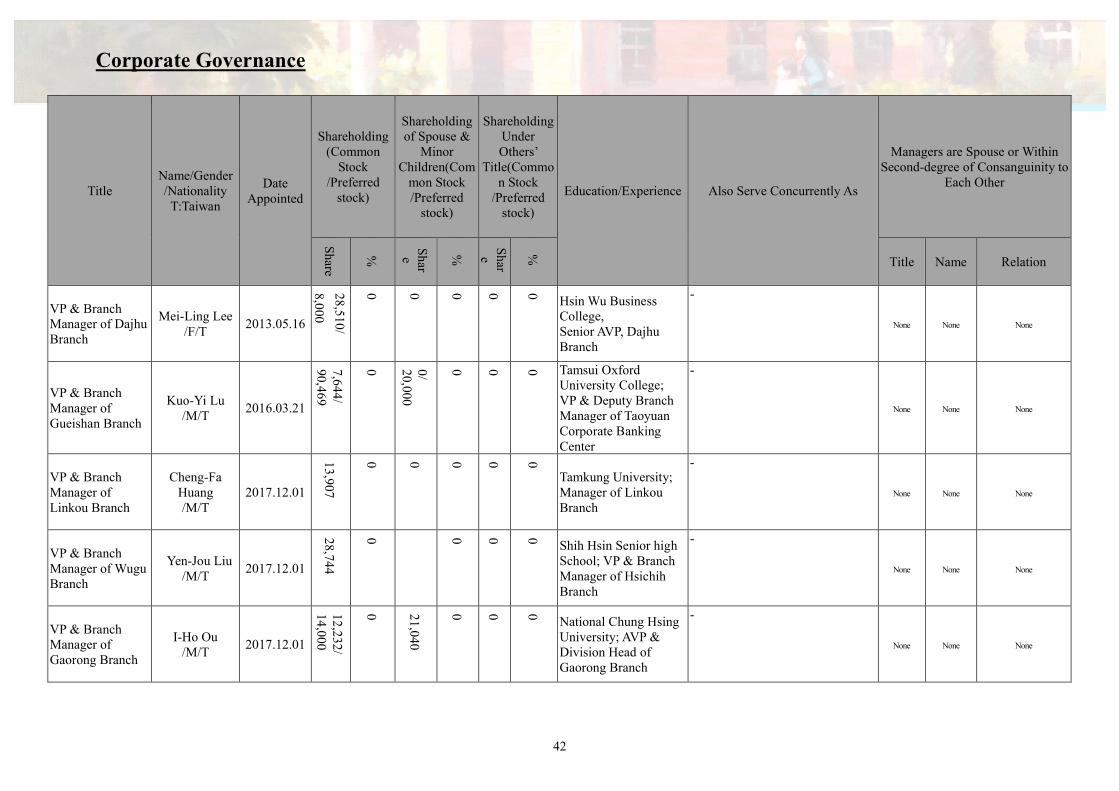
Corporate Governance
42
Title Name/Gender /Nationality
T:Taiwan
Date Appointed
Shareholding (Common
Stock /Preferred
stock)
Shareholding of Spouse &
Minor Children(Com
mon Stock /Preferred
stock)
Shareholding Under Others’
Title(Common Stock
/Preferred stock)
Education/Experience Also Serve Concurrently As
Managers are Spouse or Within Second-degree of Consanguinity to
Each Other
Sh
are
%
Sh
are
%
Sh
are
% Title Name Relation
VP & Branch Manager of Dajhu Branch
Mei-Ling Lee /F/T
2013.05.16
28
,51
0/
8,0
00
0
0
0
0
0 Hsin Wu Business
College, Senior AVP, Dajhu Branch
-
None None None
VP & Branch Manager of Gueishan Branch
Kuo-Yi Lu /M/T
2016.03.21
7,644
/ 90,469
0
0/
20,000
0
0
0 Tamsui Oxford
University College; VP & Deputy Branch Manager of Taoyuan Corporate Banking Center
-
None None None
VP & Branch Manager of Linkou Branch
Cheng-Fa Huang /M/T
2017.12.01
13,907
0
0
0
0
0
Tamkung University; Manager of Linkou Branch
-
None None None
VP & Branch Manager of Wugu Branch
Yen-Jou Liu /M/T
2017.12.01
28,744
0
0
0
0 Shih Hsin Senior high
School; VP & Branch Manager of Hsichih Branch
-
None None None
VP & Branch Manager of Gaorong Branch
I-Ho Ou /M/T
2017.12.01
12,232
/ 14
,000
0
21,040
0
0
0 National Chung Hsing
University; AVP & Division Head of Gaorong Branch
-
None None None

Corporate Governance
43
Title Name/Gender /Nationality
T:Taiwan
Date Appointed
Shareholding (Common
Stock /Preferred
stock)
Shareholding of Spouse &
Minor Children(Com
mon Stock /Preferred
stock)
Shareholding Under Others’
Title(Common Stock
/Preferred stock)
Education/Experience Also Serve Concurrently As
Managers are Spouse or Within Second-degree of Consanguinity to
Each Other
Sh
are
%
Sh
are
%
Sh
are
% Title Name Relation
VP & Branch Manager of Daye Branch
Chien-Chou Chen /M/T
2017.12.01
17
,42
1/
15
,06
0
0
0
0
0
0 Yuan Ze University;
AVP & Division Head of Real Estate Management Dept , Taoyuan Center
-
None None None
VP & Branch Manager of Luzhu Branch
Chu-Shih Wei /M/T
2017.12.01
16,756
/ 7,0
29
0
0
0
0
0
Feng Chia University ; VP & Branch Manager of Dayuan Branch
-
None None None
VP & Branch Manager of Tucheng Branch
Ching-Shyong Huang /M/T
2017.12.01
14,983
0
0/
6,000
0
0
0
Fu Jen Catholic University; AVP of Hueilong Branch
-
None None None
VP & Branch Manager of South Taoyuan Branch
Chang-Fu Tsai /M/T
2010.03.30
17,001
/ 1,0
44
0
0/
20,000
0
0
0 Feng Jia University;
AVP, SME Banking and Risk Management Dept., Standard Chartered Bank
-
None None None
VP & Branch Manager of JiSian Branch
Shih-Fu Liu /M/T
2015.08.01
25,564 0
4,256
/ 14,000
0
0
0 Master’s degree, Fu
Jen Catholic University VP & Deputy Branch Manager of JiSian Branch

Corporate Governance
44
Title Name/Gender /Nationality
T:Taiwan
Date Appointed
Shareholding (Common
Stock /Preferred
stock)
Shareholding of Spouse &
Minor Children(Com
mon Stock /Preferred
stock)
Shareholding Under Others’
Title(Common Stock
/Preferred stock)
Education/Experience Also Serve Concurrently As
Managers are Spouse or Within Second-degree of Consanguinity to
Each Other
Sh
are
%
Sh
are
%
Sh
are
% Title Name Relation
VP & Branch Manager of Sanxia Branch
Chia-Yu Chuo /F/T
2013.08.05
16
,24
8/
6,0
00
0
0
0
0
0 Master’s degree, Yuan
Ze University Head of Taoying Loan Center, Consumer Banking Department
None None
VP & Branch Manager of Donghu Branch
Chien-Chung Su
/M/T 2014.01.07
11,187/
14,867
0
0/
100,000
0
0
0 Soochow University,
VP & Deputy Branch Manager of Taipei Corporate Banking Center
None None
Note 1: The Nationality of President, SEVP, EVP and VP are Taiwan. Note 2: The shares of Preferred Stock shows while occurs.
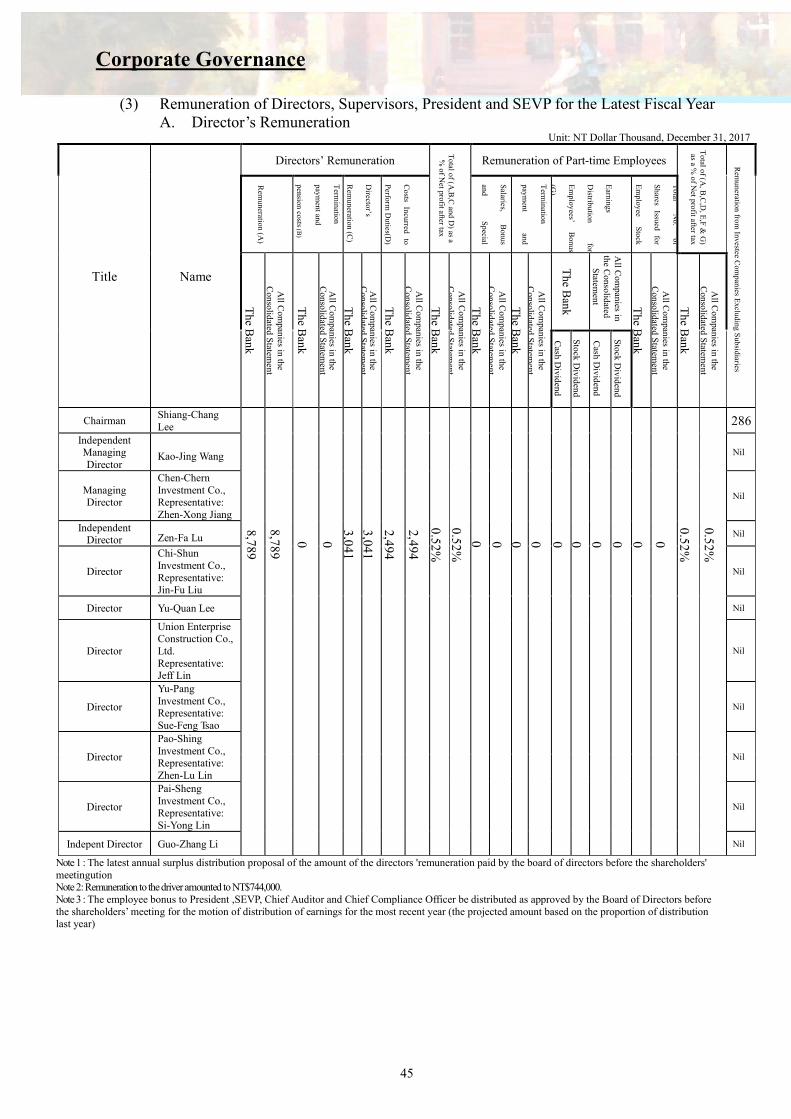
Corporate Governance
45
(3) Remuneration of Directors, Supervisors, President and SEVP for the Latest Fiscal Year A. Director’s Remuneration
Unit: NT Dollar Thousand, December 31, 2017
Title Name
Directors’ Remuneration
Total of (A
,B,C
and D) as a
%
of Net profit after tax
Remuneration of Part-time Employees
Total of (A
, B,C
,D, E
,F &
G)
as a %
of Net profit after tax
Rem
uneration from Investee C
ompanies E
xcluding Subsidiaries
Rem
uneration (A)
Term
ination
payment and
pension costs (B)
Director’s
Rem
uneration (C)
Costs
Incurred to
Perform
Duties(D
)
Salaries,
Bonus
and S
pecial
Term
ination
payment
and
Earnings
Distribution
for
Em
ployees’ B
onus
(G)
Total
No.
of
Shares
Issued for
Em
ployee S
tock
The B
ank
All C
ompanies in the
Consolidated S
tatement
The B
ank
All C
ompanies in the
Consolidated S
tatement
The B
ank
All C
ompanies in the
Consolidated S
tatement
The B
ank
All C
ompanies in the
Consolidated S
tatement
The B
ank
All C
ompanies in the
Consolidated S
tatement
The B
ank
All C
ompanies in the
Consolidated S
tatement
The B
ank
All C
ompanies in the
Consolidated S
tatement
The B
ank
A
ll Com
panies in the C
onsolidated S
tatement T
he Bank
All C
ompanies in the
Consolidated S
tatement
The B
ank
All C
ompanies in the
Consolidated S
tatement
C
ash Dividend
S
tock Dividend
C
ash Dividend
S
tock Dividend
Chairman Shiang-Chang Lee
8,789
8,789
0
0
3,041
3,041
2,494
2,494
0.52
%
0.52
%
0 0
0
0
0
0
0
0
0
0
0.52
%
0.52
%
286
Independent Managing Director
Kao-Jing Wang Nil
Managing Director
Chen-Chern Investment Co., Representative: Zhen-Xong Jiang
Nil
Independent Director Zen-Fa Lu Nil
Director
Chi-Shun Investment Co., Representative: Jin-Fu Liu
Nil
Director Yu-Quan Lee Nil
Director
Union Enterprise Construction Co., Ltd. Representative: Jeff Lin
Nil
Director
Yu-Pang Investment Co., Representative: Sue-Feng Tsao
Nil
Director
Pao-Shing Investment Co., Representative: Zhen-Lu Lin
Nil
Director
Pai-Sheng Investment Co., Representative: Si-Yong Lin
Nil
Indepent Director Guo-Zhang Li Nil
Note 1 : The latest annual surplus distribution proposal of the amount of the directors 'remuneration paid by the board of directors before the shareholders' meetingution Note 2: Remuneration to the driver amounted to NT$744,000. Note 3 : The employee bonus to President ,SEVP, Chief Auditor and Chief Compliance Officer be distributed as approved by the Board of Directors before the shareholders’ meeting for the motion of distribution of earnings for the most recent year (the projected amount based on the proportion of distribution last year)
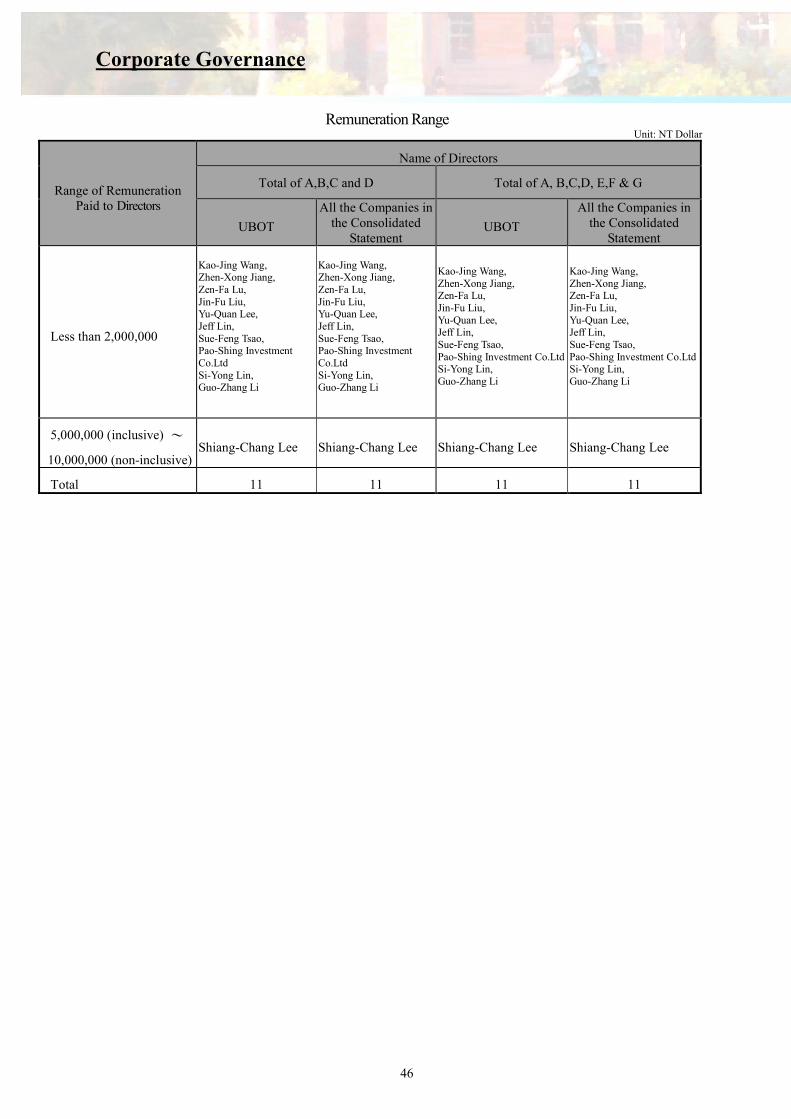
Corporate Governance
46
Remuneration Range Unit: NT Dollar
Range of Remuneration Paid to Directors
Name of Directors
Total of A,B,C and D Total of A, B,C,D, E,F & G
UBOT
All the Companies in the Consolidated
Statement UBOT
All the Companies in the Consolidated
Statement
Less than 2,000,000
Kao-Jing Wang, Zhen-Xong Jiang, Zen-Fa Lu, Jin-Fu Liu, Yu-Quan Lee, Jeff Lin, Sue-Feng Tsao, Pao-Shing Investment Co.Ltd Si-Yong Lin, Guo-Zhang Li
Kao-Jing Wang, Zhen-Xong Jiang, Zen-Fa Lu, Jin-Fu Liu, Yu-Quan Lee, Jeff Lin, Sue-Feng Tsao, Pao-Shing Investment Co.Ltd Si-Yong Lin, Guo-Zhang Li
Kao-Jing Wang, Zhen-Xong Jiang, Zen-Fa Lu, Jin-Fu Liu, Yu-Quan Lee, Jeff Lin, Sue-Feng Tsao, Pao-Shing Investment Co.Ltd Si-Yong Lin, Guo-Zhang Li
Kao-Jing Wang, Zhen-Xong Jiang, Zen-Fa Lu, Jin-Fu Liu, Yu-Quan Lee, Jeff Lin, Sue-Feng Tsao, Pao-Shing Investment Co.Ltd Si-Yong Lin, Guo-Zhang Li
5,000,000 (inclusive) ~
10,000,000 (non-inclusive) Shiang-Chang Lee Shiang-Chang Lee Shiang-Chang Lee Shiang-Chang Lee
Total 11 11 11 11

Corporate Governance
47
B. President, SEVP ,Chief Compliance Officer & Chief Auditor’s Remuneration and Range
Unit: NT Dollar Thousand, December 31, 2017
Title Name
Remuneration (A)
Termination payment and pension costs (B)
Bonus & Special
Allowance (C)
Employees’ Bonus from
Earnings (D)
Total of (A+B+C+D) as
a % of Net profit after tax
Rem
uneratio
n from Investee
C
omp
anies Ex
cluding S
ubsidiaries
The
Bank
All C
omp
anies in th
e F
inancial Statem
ent
The
Bank
All C
omp
anies in the
Financial S
tatemen
t
The
Bank
All C
omp
anies in the
Financial S
tatemen
t
The
Bank
All C
om
panies
in
the
Fin
ancial
Statem
ent
The
Bank
All C
omp
anies in the
Financial S
tatemen
t
Cash
D
ivid
end
Sto
ck
Div
idend
Cash
D
ivid
end
Sto
ck
Div
iden
d
President Jeff Lin
12,858 12,858 5,147 5,147 4,305 4,305 561 0 561 0 0.83 0.83 Nil
SEVP Yin-Bor Chan
SEVP Herman Tu
SEVP Cheng- Yu Liu
Chief Auditor
Kuo- Pao Kang
Chief Compliance Officer
Ching-Wen, Chen
Chief Compliance Officer
Kao- Yao-Tsung
Note1: The employee bonus to President, SEVP, Chief Auditor and Chief Compliance Officer be distributed as approved by the Board of Directors before the shareholders’ meeting for the motion of distribution of earnings for the most recent year (the projected amount based on the proportion of distribution last year)
Note2: Remuneration to the Company’s three drivers totalled NT$ 2,169,000. Unit: NT Dollar
Range of Remuneration Paid to President, SEVP, Chief Compliance Officer & Chief Auditor
Name of President, SEVP, Chief Compliance Officer & Chief Auditor
UBOT All the Companies in the
Financial Statement
Less than NT$ 2,000,000 Jeff Lin, Ching-Wen Chen Jeff Lin, , Ching-Wen Chen
NT$2,000,000 (inclusive) ~ NT$5,000,000 Herman Tu, Yin-Bor Chan,
Cheng-Yu Liu, Kuo-Pao Kang, Herman Tu, Yin-Bor Chan,
Cheng-Yu Liu, Kuo-Pao Kang,
NT$5,000,000 (inclusive) ~ NT$10,000,000 Yao-Tsung Kao Yao-Tsung Kao
Total 7 7

Corporate Governance
48
C. Bonus to Managers : Unit NT Dollar Thousand, Dec 31 2017
Title Name Stock Dividend Cash dividend Total Total as % of Net Profit after Tax
Please refer Page 1* to Page 38. 0 6,793 6,793 0.25
Note: The employee bonus to managers to be distributed as approved by the Board of Directors before the shareholders’ meeting for the motion of distribution of earnings for the most recent year (the projected amount based on the proportion of distribution last year).
(4) Analysis of Payments of Remuneration to Directors, Supervisors, President, Senior
Executive Vice President and Chief Auditor, as a percentage of net profit after tax in the latest two years, Remuneration Policy, Standard and Combination, Procedure for determining remuneration and their relationship to operating results and future risk A. The remuneration paid to Directors, Supervisors, President, Senior Executive Vice
President and Chief Auditor in 2016 is NT$31,835,000 and its ratio to net profit after tax is 1.20%.
B. The remuneration paid to Directors, Supervisors, President, Senior Executive Vice President and Chief Auditor in 2017 is NT$37,195,000 and its ratio to net profit after tax is 1.34%.
C. Remuneration paid to directors and supervisors primarily include meeting attendance fees and salaries. All remuneration is paid on a fixed basis. The President did not receive any form of remuneration. Remuneration to SEVPs and Chief Auditor was made in accordance with their respective experience, degree of business involvement and contribution, and compare with the salary and remuneration standard of the Industry peers. The salary and remuneration schedule will be submitted to the Board of Directors for resolution after it is examined by Salary and Remuneration Committee. The Board is authorized to determine remuneration which is granted to the management pursuant to the Bank’s Articles of Incorporations. In addition to monthly basic salaries and allowances, executives may also be eligible for the annual and the performance bonuses and the employee bonuses depending on the Bank’s annual results of operation and individual performance. As such, remuneration to SEVPs and Chief Auditor is closely related to the Bank’s operating performance. The occurrence of major risk events that may impair the Bank’s goodwill, or incidents of deficiency in internal management, or employee fraud would vastly affect the amount of bonuses to SEVPs and the Chief Auditor. The Risk Management Dept. should report directly to the Board of Directors regarding the status of the Bank’s risk control and risk exposure on a quarterly basis.
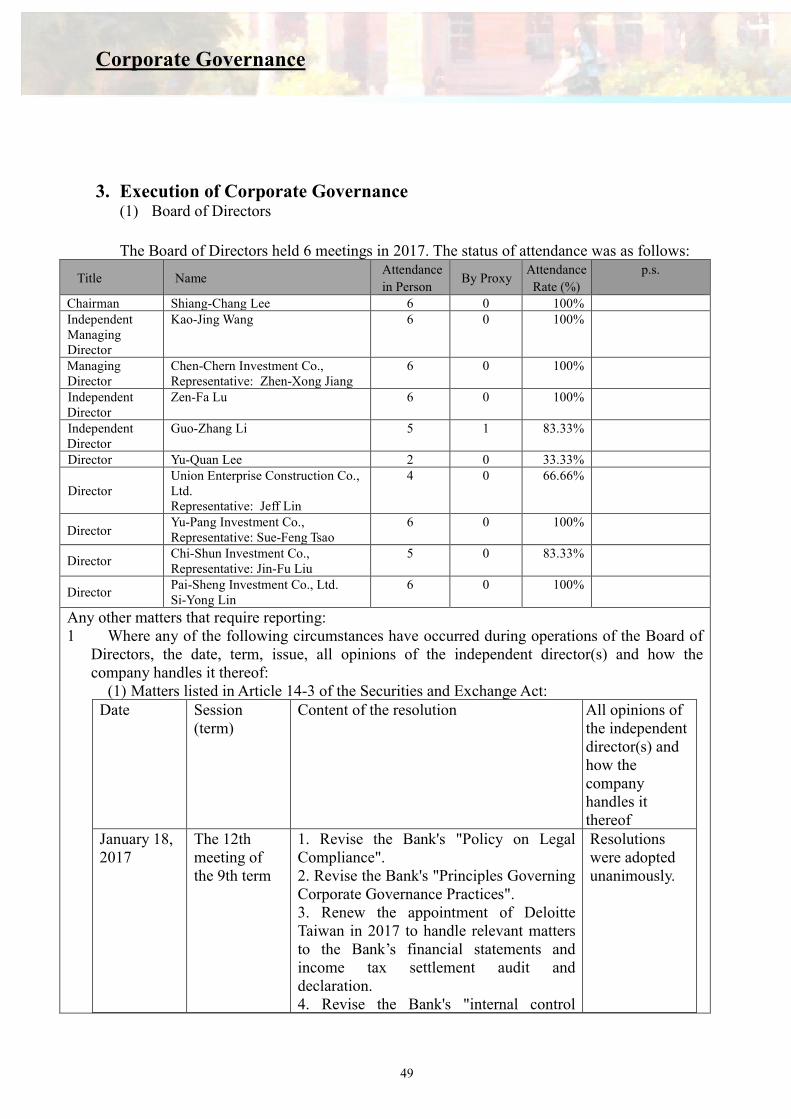
Corporate Governance
49
3. Execution of Corporate Governance (1) Board of Directors The Board of Directors held 6 meetings in 2017. The status of attendance was as follows:
Title Name Attendance
in Person By Proxy
Attendance
Rate (%)
p.s.
Chairman Shiang-Chang Lee 6 0 100% Independent Managing Director
Kao-Jing Wang 6 0 100%
Managing Director
Chen-Chern Investment Co., Representative: Zhen-Xong Jiang
6 0 100%
Independent Director
Zen-Fa Lu 6 0 100%
Independent Director
Guo-Zhang Li 5 1 83.33%
Director Yu-Quan Lee 2 0 33.33%
Director Union Enterprise Construction Co., Ltd. Representative: Jeff Lin
4 0 66.66%
Director Yu-Pang Investment Co., Representative: Sue-Feng Tsao
6 0 100%
Director Chi-Shun Investment Co., Representative: Jin-Fu Liu
5 0 83.33%
Director Pai-Sheng Investment Co., Ltd. Si-Yong Lin
6 0 100%
Any other matters that require reporting: 1 Where any of the following circumstances have occurred during operations of the Board of
Directors, the date, term, issue, all opinions of the independent director(s) and how the company handles it thereof:
(1) Matters listed in Article 14-3 of the Securities and Exchange Act: Date Session
(term) Content of the resolution All opinions of
the independent director(s) and how the company handles it thereof
January 18, 2017
The 12th meeting of the 9th term
1. Revise the Bank's "Policy on Legal Compliance". 2. Revise the Bank's "Principles Governing Corporate Governance Practices". 3. Renew the appointment of Deloitte Taiwan in 2017 to handle relevant matters to the Bank’s financial statements and income tax settlement audit and declaration. 4. Revise the Bank's "internal control
Resolutions were adopted unanimously.
Corporate Governance
50
system". 5. "2017 operating budget and operating policy by business for the bank".
March 22, 2017
The 13th meeting of the 9th term
1. Revise the "Position and Loss Limit on Industry Credit Lending". 2. Revise the Bank's "Regulations governing the Management of Enterprise Group Credit Risk". 3. Revise the Bank's "Regulations Governing the Division of Authorities and Responsibilities on Credit Extensions for the Bank’s Staff at All Levels” and authorization and operational rules for "TMU Derivatives Product Risk Limit". 4. Revise the "Standards for Foreign Currency Security Investment". 5. Revise the “Guidelines for the Bank's Concurrent Operation of Insurance Agent Business”. 6. Revise the "Guidelines for Structural Investment Portfolio". 7. Revise the "Guidelines for Exchange Rate Swap Business between NTD vs. Foreign Currency/Foreign Currency vs. Foreign Currency". 8. Revise the "Procedures for Obtaining or Decomposing Assets". 9. Revise the "Credit Limit on Real Estate Collateral Loans". 10. Revise the "Standards for Capital Adequacy Management". 11. Submit the Bank's self-inspections of internal control system, the overall assessment inspection report made by the Auditing Department, and the auditing results for the whole year of 2016. 12. The Bank's 2016 Business Report and Financial Reports audited by a CPA. 13. The Bank's 2016 earning distribution. 14. Distribution of remuneration for employees and directors in 2016. 15. Revise the Bank's "Articles of Association". 16. Plan for long-term fund raising.
Resolutions were adopted unanimously.
May 10, 2017
The 14th meeting of
1. Revise the “internal audit operation of the Bank's concurrent operation of bonds proprietary business of the
Resolutions were adopted unanimously.
Corporate Governance
51
the 9th term securities firms”. 2. Revise the “internal control system of
the Bank’s concurrent operation of securities firms”.
3. Revise the Bank's "Operational Procedures for Full Authorization of Investing Marketable Securities".
4. Revise the "Guidelines for recognition of non-performing loans, overdue receivables and bad debts in consumer credit business operation".
5. Revise the Bank’s “Organization Regulations”.
6. Revise the Bank’s “Articles of Association”.
7. Submit the Bank’s Consolidated Financial Report for the first quarter of 2017 audited by a CPA.
June 28, 2017
The 15th meeting of the 9th term
1. Revise the internal control system of the Bank’s concurrent operation of securities firms in the futures introducing broker business.
2. “Submission and Report of the
Bank’s ‘Information that Should be Declared in Compliance with the Principle of Supervision and Management’ for 2017”.
3. Preparation of the Bank’s shares issuance by cash of Registered Series A Preferred Stock.
The resolution was adopted unanimously.
August 23, 2017
The 16th meeting of the 9th term
1. Revise the internal control system of the Bank’s concurrent operation of securities firms.
2. Revise the Bank's "Pricing Policy on Consumer Credit Business".
3. Revise the Bank's "Performance Review Procedures of Vehicle Loan Business".
4. Revise the "Manual for OBU Business".
5. Revise the Bank's "Guidelines for Issuing Financial Bond".
6. Revise the Bank's "Banking Book Interest Rate Risk Management Policy".
7. Proposal of applying to the FSC in increasing domestic branches.
8. Revise the Bank's "Audit Committee
The left Item 1. ~2., 4. ~6. and 8.~15 : Resolutions were adopted unanimously. The left Item 3. Independent Managing Director Kao-Jing Wang: has no explicit opinions but suggests future revisions referred to the

Corporate Governance
52
Foundation Rules" and "Parliamentary Rules for Directors' Meetings".
9. Revise the Bank's "Rules for Ethical Conducts of Directors and Managers".
10. Revise the Bank's "Work Rules". 11. Revise the Bank's "Policy for Fair
Treatment of Customers” and the “Implementation Strategy for Fair Treatment of Customers".
12. Revise the Bank's "Execution Guidelines for Legal Compliance System".
13. Revise the Bank's "Money Laundering and Terrorist Financing Risk Assessment and Control Policy" and "Risk Assessment Report and Risk Control Project".
14. Revise the Bank's "Internal Auditing System".
15. Submit the Bank’s Business Report and Consolidated Financial Report for the first half of 2017 audited by a CPA.
industry practice. The Bank’s handling situation: Will take notice and revise it in the future. The left Item 7. Independent Managing Director Kao-Jing Wang: Shall we first move the branches with poorer performance? The Bank’s handling situation: Since the branch locations in the application this time do not include Taipei and New Taipei City, in order to establish a complete channel in Taiwan, besides proposing the application we will evaluate the moving of branches with poor performance or nearby locations.
November 8, 2017
The 17th meeting of the 9th term
1. Revise the Bank's "Operational Procedures for Full Authorization of Investing Marketable Securities".
The left Item 1. ~12., 14. And 15.:

Corporate Governance
53
2. Revise the procedures for Derivatives Trading by the Bank.
3. Revise the Bank's "Regulations Governing the Division of Authorities and Responsibilities on Credit Extensions for the Bank’s Staff at All Levels” and authorization and operational rules for "TMU Derivatives Product Risk Limit".
4. Revise the Bank’s “Restrictions on lending to employees and related parties under the Banking Act”.
5. Revise the Bank’s “Management Directions Concerning Credit Extensions by the Bank to a Same Juristic Person, Group Enterprise, or Industry Type”.
6. Revise the Bank’s “Investment Policy”. 7. Revise the Bank’s “Operational
Standards for Supervision and Control on Subsidiaries”.
8. Revise the Bank’s “Audit Committee Foundation Rules” and “Guideline Governing the Responsibilities of Independent Directors”.
9. The subsequent planning for the Bank’s cash issuance of Series A Preferred Stock.
10. Revise the Bank’s “Notices for Personal Information Protection”.
11. Revise the Bank’s “Internal Management Rules and Operational Procedures for using the competent authority’s financial examination reports”.
12. The Internal Audit Operation Audit Plan for 2018.
13. The Bank’s appointment of Deloitte Taiwan in auditing the project of anti-money laundering and countering the financing of terrorism in the first half of 2017 will be signed by the Chairman, President, Chief Auditor and Compliance Officer in the Statement of Internal Controls System.
14. Submit the Bank’s Consolidated Financial Report for the third quarter of 2017 audited by a CPA.
15. The improving measure report on the Bank’s former employee’s
Resolutions were adopted unanimously. The left Item 13. Independent Managing Director Kao-Jing Wang: Appendix I mainly declares that the Bank has adopted internal control and management in accordance with laws, and conducted evaluation on the system to ensure effectiveness of the design and execution. But the title of the Statement illustrates that the design and execution has not been effective. Is it appropriate? The Bank’s handling situation: Since we have evaluated what shall be improved by ourselves and the improving measures are presented in the fifth point, we directly

Corporate Governance
54
self-reporting on making fake loans and the summary table of amended credit business operation control procedures.
revised the item into: “Internal Control System Statement of Anti-money Laundering and Countering the Financing of Terrorism of Union Bank of Taiwan, Co.,
Ltd.”
(2) In addition to previous matters, other board of directors who have objected to or retain
opinions and have a recorded or written statement by an independent director: None.
2 Execution status of directors, avoidance on motions with conflict of interests. The names of directors, the content of the motion, the reasons of avoidance, and the voting participation status should be clearly stated:
Meeting Proposal Name of Director Reasons of Recusal Participated in Voting
12th meeting/9th Board Property Rental Zhen-Xong Jiang, Jeff Lin, Sue-Feng Tsao, Jin-Fu Liu and Si-Yong Lin
Stakeholder No. Stakeholders did not participate in discussion and voting in accordance with laws. The other directors had no opinions and resolutions were adopted unanimously.
13th meeting/9th Board Loan Jin-Fu Liu Stakeholder No. Jin-Fu Liu did not attend the meeting. The other directors had no opinions and resolutions were adopted unanimously.
14th meeting/9th Board Property Rental Jeff Lin, Zhen-Xong Jiang, Jin-Fu Liu, Sue-Feng Tsao
Stakeholder No. Stakeholders did not participate in
Corporate Governance
55
discussion and voting in accordance with laws. The other directors had no opinions and resolutions were adopted unanimously.
3. Measures taken to strengthen the functionality of the Board:
(1) The Bank, in accordance with the regulation in Article 14-2 of Securities and Exchange Act, sets three seats of independent directors and enacts “Guideline governing the responsibilities of independent directors in Union Bank of Taiwan Co., Ltd.” to adhere. It also formulates “Rules for the conduct of directors meetings in Union Bank of Taiwan Co., Ltd.” for following in the execution of meetings. Besides, in order to strengthen the Bank's corporate governance and the functions of the Board of Directors, the Audit Committee was established in June, 2015. The Audit Committee is composed of all independent directors, and related organization regulations are formulated for adhering.
(2) The Bank establishes a Salary and Remuneration Committee under the Board of Directors and sets “Regulation Governing the Organization of Salary and Remuneration Committee in Union Bank of Taiwan Co., Ltd.”. The major responsibilities of the Committee is to set and regularly review the pertaining policy, system, standard and structure, and conduct the performance evaluation and of directors, supervisors and management executives.
(2) Audit Committee The Audit Committee held 6 meetings in 2017. The status of attendance was as follows:
Title Name Attendance
in Person By Proxy
Attendance
Rate (%)
p.s.
Independent Director
Guo-Zhang Li 5 1 83.33%
Independent Director
Zen-Fa Lu 6 0 100%
Independent Managing Director
Kao-Jing Wang 6 0 100%
Other supplementary notes: 1. Where any of the following circumstances have occurred during operations of the audit
committee, the date, term, issue, resolution results of the audit committee and how the company handles opinions of the audit committee thereof:
(1) Matters listed in Article 14-5 of the Securities and Exchange Act: Date Session (term) Content of the resolution Resolution results
of the audit committee and how the company handles opinions of the audit committee thereof
January 18, 2017
The 9th meeting of the
1. Renew the appointment of Deloitte Taiwan in 2017 to
1. Resolutions were adopted

Corporate Governance
56
1st term
handle the relevant matters of the Bank’s financial statements and income tax settlement audit and declaration.
2. Submit the Bank’s self-inspections of its internal control systems.
3. Revise the Bank’s “Internal Auditing System”.
unanimously. 2. Submitted to the
Board for resolution
March 22, 2017
The 10th meeting of the 1st term
1. Revise the Bank’s “Procedure guidelines for concurrent operation of insurance agent business”.
2. Revise the Bank’s "Procedures for Obtaining or Decomposing Assets".
3. Submit the Bank’s self-inspections of its internal control system, the overall assessment inspection report, and the audit results of the audit business for the whole year of 2016.
4. Submit the Bank’s Business Report and Individual Financial Statements of 2016 audited by a CPA.
5. The Bank’s earnings distribution in 2016.
6. Plan for long-term fund raising.
1. Resolutions were adopted unanimously.
2. Submitted to the Board for resolution
May 10, 2017
The 11th meeting of the 1st term
1. Revise the internal control system of the Bank’s concurrent operation of bonds proprietary business of the securities firms.
2. Revise the internal control system of the Bank’s concurrent operation of securities firms.
1. The left items Director Kao-Jing Wang: since the rules are revised according to the letter by the regulatory authority, I suggest unifying the proposal illustration and the relevant reference data for auditing. Besides, Attachment II of the second

Corporate Governance
57
item was not specified. Please make the correction.
The Bank’s handling situation: we have directly corrected the error and will be more careful in the future.
2. Resolutions were adopted unanimously.
3. Submitted to the Board for recognition.
June 28, 2017
The 12th meeting of the 1st term
1. Revise the internal control system of the Bank’s concurrent operation of securities firms in the futures introducing broker business.
2. Prepare for the cash issuance of Registered Series A Preferred Stock in 2017..
1. Resolutions were adopted unanimously.
2. Submitted to the Board for resolution.
August 23, 2017
The 13th meeting of the 1st term
1. Revise the internal control system of the Bank’s concurrent operation of securities firms.
2. Revise the Bank’s “Audit Committee Foundation Rules” and "Parliamentary Rules for Directors' Meetings".
3. Revise the Bank’s “Internal Auditing System”.
4. Submit the Bank’s Business Report and financial statements of the first half of 2017 audited by a CPA.
1. Resolutions were adopted unanimously.
2. Submitted to the Board for recognition or resolution.
November 08, 2017
The 14th meeting of the 1st term
1. Revise the procedures for Derivatives Trading by the Bank.
2. Revise the Bank’s “Audit Committee Foundation Rules” and “Guideline Governing the Responsibilities of Independent Directors”.
3. The Internal Audit Operation Audit Plan for 2018.
1. The left Item 3. Director Kao-Jing Wang: Please illustrate in p.6 of the audit plan this time, the difference between the

Corporate Governance
58
4. The Bank’s appointment of Deloitte Taiwan in auditing the project of anti-money laundering and countering the financing of terrorism in the first half of 2017 will be signed by the Chairman, President, Chief Auditor and Compliance Officer in the Statement of Internal Controls System.
audit content of Society for Worldwide Interbank Financial Telecommunication (SWIFT) and that of the original version. The Bank’s reply: Originally the SWIFT only audited on the oversea department’s operation. As the central bank formulated operation notices for SWIFT last year, the Bank has made relevant compliance measures and audited on the oversea and IT departments.
2. Resolutions were adopted unanimously.
3. Submitted to the Board for resolution.
(2) In addition to the preceding items, any resolution that has not been approved with the
consent of the audit committee members but approved with the consent of two-thirds or more of all directors: None.
2. Execution status of directors, avoidance on motions with conflict of interests. The names of directors, the content of the motion, the reasons of avoidance, and the voting participation status should be clearly stated: None
3. Communication between independent directors and auditors: (1) Communication between independent internal directors and auditors:

Corporate Governance
59
The Chief Auditor is involved in all Board of Directors meetings and Audit Committee meetings, and reports regularly to the Audit Committee on the progress of ongoing audits. Before the end of the financial year, the internal audit department would submit in writing the next year’s audit plan for review by the Audit Committee. Furthermore, internal auditors engage independent directors in half-yearly meetings to present internal audit reports and to discuss any weaknesses found in the internal control system.
(2) Communication between independent directors and external auditors, The Bank's financial statement auditor briefs the Audit Committee every six months about the audit methods taken and any material findings or adjustments discovered during their work. They also discuss with independent directors on other relevant issues.
Date Points of communication Status of implementation
January 18, 2017
Audit the work report for the second half of 2016; report the status of implementation of the audit business on a regular basis
1. Allowed for future reference
2. Submit to the Board of Directors for future reference
March 22, 2017
Review internal control system deficiencies every half year; hold seminars by the auditors and independent directors
Follow up the status of the implementation of the opinions of the independent directors in the seminars, and submit the meeting minutes to the Board of Directors for report
August 23, 2017
Audit work report for the first half of 2016; report the status of implementation of the audit business on a regular basis
1. Allowed for future reference
2. Submit to the Board of Directors for future reference
August 23, 2017
Review internal control system deficiencies every half year; hold seminars by the auditors and independent directors
Follow up the status of the implementation of the opinions of the independent directors in the seminars, and submit the meeting minutes to the Board of Directors for report
November 08, 2017
2017 Audit Plan
1. Resolutions were adopted unanimously.
2. Submitted to the Board for resolution

Corporate Governance
60
(3) Items to be disclosed in Accordance with “Principles Governing Corporate Governance Practices of Banks”: Please Refer to the Bank’s Official Website: http://www.ubot.com.tw
Date Points of communication Status of implementation
March 22,
2017
The CPAs explained the results and adjustment items of the financial statements for the year of 2016, and engaged in two-way communication on the Bank’s finance and business.
The Bank invited the CPAs with the Bank’s internal audit supervisor and independent directors to explain and engage in two-way communication on the Bank’s finance and business at the 10th meeting of the 1st term of the audit committee, and completed the examination on the financial statements.
August 23,
2017
The CPAs explained the results and adjustment items of the financial statements for the first half of 2016, and engaged in two-way communication on the Bank’s finance and business.
The Bank invited the CPAs with the Bank’s internal audit supervisor and independent directors to explain and engage in two-way communication on the Bank’s finance and business at the 13th meeting of the 1st term of the audit committee, and completed the examination on the financial statements.
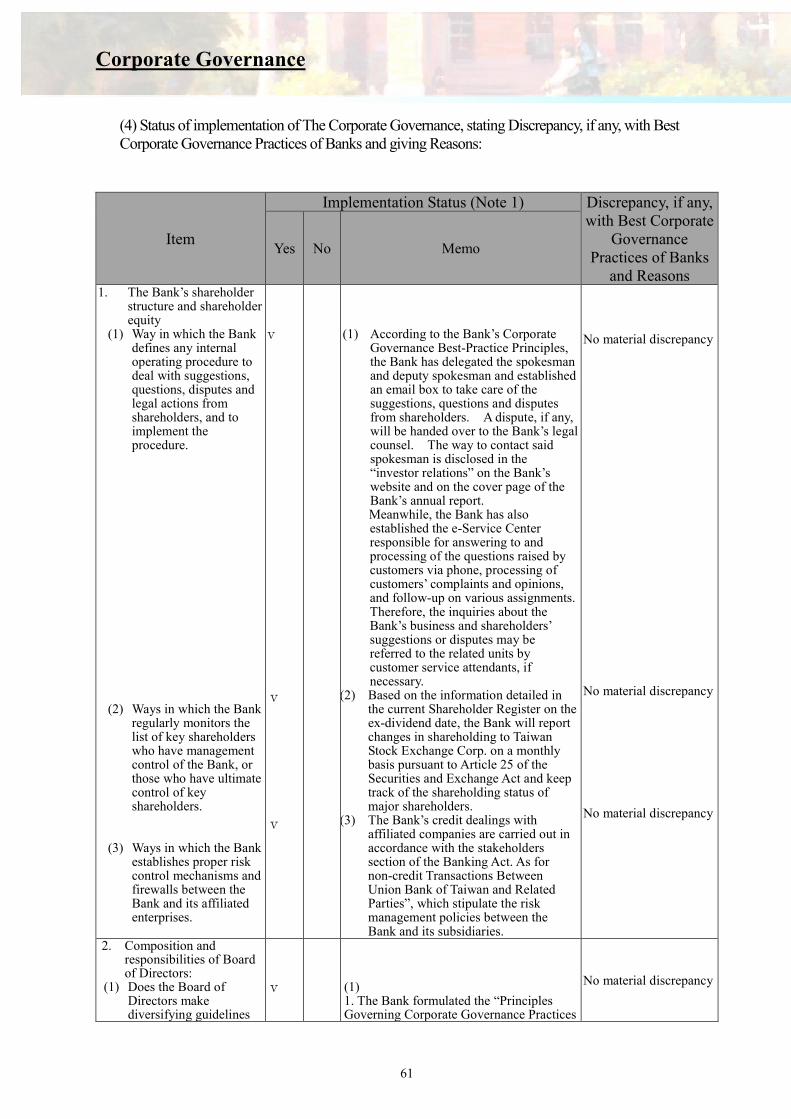
Corporate Governance
61
(4) Status of implementation of The Corporate Governance, stating Discrepancy, if any, with Best Corporate Governance Practices of Banks and giving Reasons:
Item
Implementation Status (Note 1) Discrepancy, if any, with Best Corporate
Governance Practices of Banks
and Reasons
Yes No Memo
1. The Bank’s shareholder structure and shareholder equity
(1) Way in which the Bank defines any internal operating procedure to deal with suggestions, questions, disputes and legal actions from shareholders, and to implement the procedure.
(2) Ways in which the Bank
regularly monitors the list of key shareholders who have management control of the Bank, or those who have ultimate control of key shareholders.
(3) Ways in which the Bank establishes proper risk control mechanisms and firewalls between the Bank and its affiliated enterprises.
v v v
(1) According to the Bank’s Corporate
Governance Best-Practice Principles, the Bank has delegated the spokesman and deputy spokesman and established an email box to take care of the suggestions, questions and disputes from shareholders. A dispute, if any, will be handed over to the Bank’s legal counsel. The way to contact said spokesman is disclosed in the “investor relations” on the Bank’s website and on the cover page of the Bank’s annual report. Meanwhile, the Bank has also established the e-Service Center responsible for answering to and processing of the questions raised by customers via phone, processing of customers’ complaints and opinions, and follow-up on various assignments. Therefore, the inquiries about the Bank’s business and shareholders’ suggestions or disputes may be referred to the related units by customer service attendants, if necessary.
(2) Based on the information detailed in the current Shareholder Register on the ex-dividend date, the Bank will report changes in shareholding to Taiwan Stock Exchange Corp. on a monthly basis pursuant to Article 25 of the Securities and Exchange Act and keep track of the shareholding status of major shareholders.
(3) The Bank’s credit dealings with affiliated companies are carried out in accordance with the stakeholders section of the Banking Act. As for non-credit Transactions Between Union Bank of Taiwan and Related Parties”, which stipulate the risk management policies between the Bank and its subsidiaries.
No material discrepancy No material discrepancy No material discrepancy
2. Composition and responsibilities of Board of Directors:
(1) Does the Board of Directors make diversifying guidelines
v
(1) 1. The Bank formulated the “Principles Governing Corporate Governance Practices
No material discrepancy
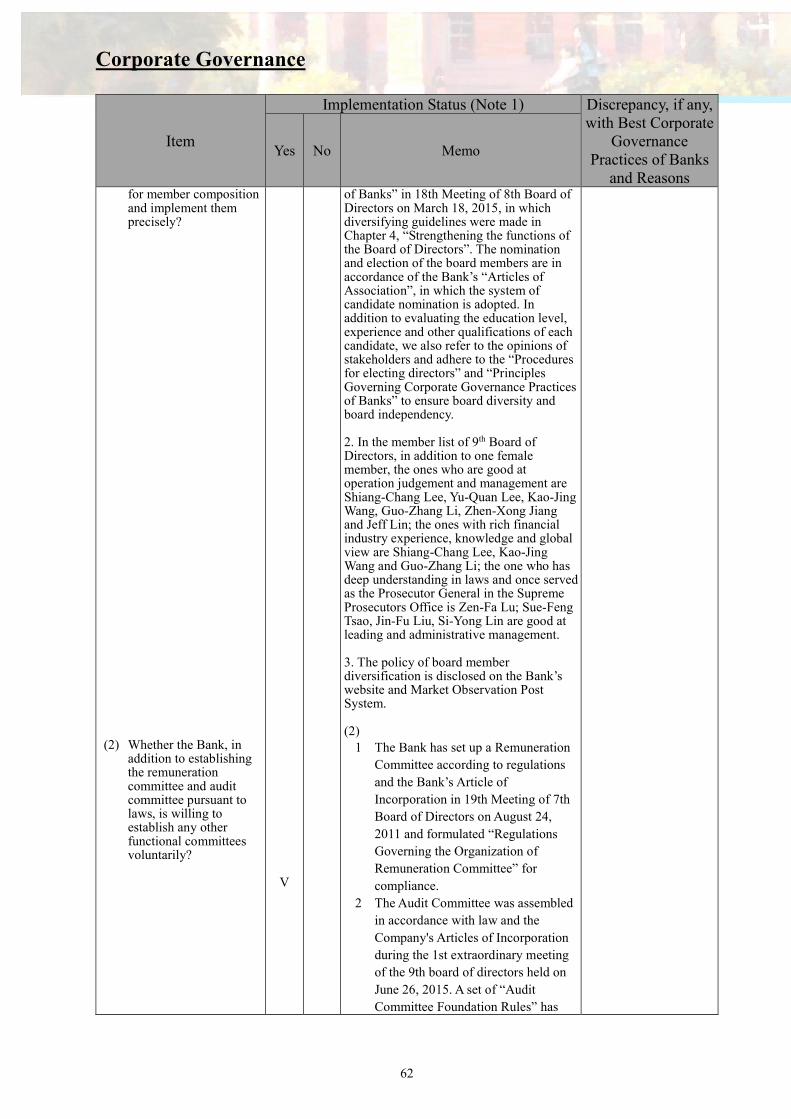
Corporate Governance
62
Item
Implementation Status (Note 1) Discrepancy, if any, with Best Corporate
Governance Practices of Banks
and Reasons
Yes No Memo
for member composition and implement them precisely?
(2) Whether the Bank, in addition to establishing the remuneration committee and audit committee pursuant to laws, is willing to establish any other functional committees voluntarily?
V
of Banks” in 18th Meeting of 8th Board of Directors on March 18, 2015, in which diversifying guidelines were made in Chapter 4, “Strengthening the functions of the Board of Directors”. The nomination and election of the board members are in accordance of the Bank’s “Articles of Association”, in which the system of candidate nomination is adopted. In addition to evaluating the education level, experience and other qualifications of each candidate, we also refer to the opinions of stakeholders and adhere to the “Procedures for electing directors” and “Principles Governing Corporate Governance Practices of Banks” to ensure board diversity and board independency. 2. In the member list of 9th Board of Directors, in addition to one female member, the ones who are good at operation judgement and management are Shiang-Chang Lee, Yu-Quan Lee, Kao-Jing Wang, Guo-Zhang Li, Zhen-Xong Jiang and Jeff Lin; the ones with rich financial industry experience, knowledge and global view are Shiang-Chang Lee, Kao-Jing Wang and Guo-Zhang Li; the one who has deep understanding in laws and once served as the Prosecutor General in the Supreme Prosecutors Office is Zen-Fa Lu; Sue-Feng Tsao, Jin-Fu Liu, Si-Yong Lin are good at leading and administrative management. 3. The policy of board member diversification is disclosed on the Bank’s website and Market Observation Post System. (2)
1 The Bank has set up a Remuneration
Committee according to regulations
and the Bank’s Article of
Incorporation in 19th Meeting of 7th
Board of Directors on August 24,
2011 and formulated “Regulations
Governing the Organization of
Remuneration Committee” for
compliance.
2 The Audit Committee was assembled
in accordance with law and the
Company's Articles of Incorporation
during the 1st extraordinary meeting
of the 9th board of directors held on
June 26, 2015. A set of “Audit
Committee Foundation Rules” has

Corporate Governance
63
Item
Implementation Status (Note 1) Discrepancy, if any, with Best Corporate
Governance Practices of Banks
and Reasons
Yes No Memo
(3) Regular evaluation of external auditors’ independence.
been implemented for guidance.
3 Additionally, in order to strengthen
management mechanism, the Bank
has set up committees such as “Asset
Liability Management Committee”,
“Operation Automation
Committee”, “Investment and Credit
Examination Committee”, “Overdue
Credit, Overdue Loan and
Non-Performing Loan Handling
Committee”, “Trust Property
Examination Committee” and
“Human Resource Arbitration
Committee”, and their resolutions are
all submitted to relevant level of
authorities for approval according to
Regulations governing separation of
duties.
(3) The Bank evaluates the independence
of the CPA each year in accordance
with the CPA Standard of Professional
Ethics and Corporate Governance
Best-Practice Principles for
TWSE/GTSM Listed Companies, and
submits the evaluation result to the
Board of Directors for review.
1. The CPA never holds the position of
director/supervisor or manager of the
Bank, or thea position likely to render
significant influence on the Bank.
2. The CPA does not have any direct or
significantly indirect financial interest
with the Bank.
3. The CPA never acts as the Bank’s
independent auditor for seven years.
4. The Statement of Independence has
been issued by the CPA. Upon evaluation,
the independent auditor retained by the
Bank is held meeting the independence
requirements under the corporate
governance. 3. If the bank is a
TWSE/TPEx listed company, has it set up a full- (or part-) time corporate governance unit or personnel to be in charge of corporate governance affairs
V 1. The Bank has set up the Board of Director Conference Service Division, which belongs to the Board of Directors and take charge of board meetings. 2. The Bank’s Business Planning & Administration Dept. is the responsible unit for business related to corporate governance. It is supervised by the senior
No material discrepancy.

Corporate Governance
64
Item
Implementation Status (Note 1) Discrepancy, if any, with Best Corporate
Governance Practices of Banks
and Reasons
Yes No Memo
(including but not limited to furnishing information required for business execution by directors and supervisors, handling matters relating to board meetings and shareholders meetings according to laws, handling corporate registration and amendment registration, producing minutes of board meetings and shareholders meetings, etc.)?
executive vice president in the department, which has at least three years of management experience related to legal affairs, financial or shareholders service in public companies. The corporate governance affairs mentioned above include providing directors with the data needed in executing business, assisting directors in legal compliance, preparing for board meetings in accordance with regulations. 3. The execution process in 2017: (1) Company amendment registration. (2) Preparing for board meetings in accordance with regulations. (3) Registering in advance the board meeting date, preparing meeting notices within the required time period, meeting handbook and memorandum. (4) Assisting the Bank in adhering to laws related to the Board of Directors and shareholders’ meetings. (5) Providing directors with the data needed in executing business. (6) Revising the Bank’s “Articles of Association”. (7) Revising regulations related to corporate governance such as “Rules for the conduct of directors meetings in Union Bank of Taiwan Co., Ltd.”, “Guideline governing the responsibilities of independent directors in Union Bank of Taiwan Co., Ltd.” and “Audit Committee Foundation Rules”.
4. Establishment of communication channels with stakeholders
V
1. The Bank has created a stakeholders section on its website. In addition, related parties should also contact with the Bank through mail, telephone, fax and internet etc. All communication channels are easily accessible and smooth.
No material discrepancy
5. Information Disclosure (2) Establishment of
corporate website to disclose information regarding the Bank's financials, business and corporate governance status.
(3) Other information disclosure channels (e.g. English website, designating particular
V
V
1. The Bank has regularly disclosed financial and corporate governance status in the Bank’s website (Web address: http://www.ubot.com.tw), and will disclose related information following the relevant regulations of the competent authority.
2. Information Disclosure Method
(1) A designated department is to take charge of the collection and disclosure of information on the
No material discrepancy.

Corporate Governance
65
Item
Implementation Status (Note 1) Discrepancy, if any, with Best Corporate
Governance Practices of Banks
and Reasons
Yes No Memo
person to handle information collection and disclosure, appointing spokesperson, webcasting investor conference)
Bank’s website. (2) The Bank has set spokesperson and
acting spokesperson position to be the sole outlet of the statement to the publics, and the Bank has also formulated “Procedures for Handling Significant Internal Information” for compliance.
(3) The annual report is prepared each year, disclosing the relevant information in accordance with the “Standards Governing Information to be published in the Annual Report of Banks”.
6. Other important information that helps to understand the Bank’s corporate governance status (such as rights of employees, care for employees, investor relations, rights of stakeholders, Directors’ and Supervisors’ training records, implementation of risk management policies and risk evaluation measures, implementation of customer protection policies, purchasing liability insurance for directors and supervisors, and donate to political parties, related parties and charitable foundations):
V (1) Rights of employees and care for employees: The Bank has put in place the “Rules of Employment” to clearly define the rights and obligations of the Bank and employees. The Bank also convenes regular labor relations meeting to enhance the bank-employee relationships and ensure rights of employees. In addition, the Bank undertakes evaluation of the various remuneration and welfare policies to maximize benefits for the employees. The Bank has also put in place the “Criteria for Prevention, Reporting and Punishment of Sexual Harassment Incidences” to ensure equal employment opportunities and human dignity.
(2) Investor relations: The Bank has set up an investor’s relationship window for a smooth communication channel.
(3) Any transaction between the Bank and our stakeholders are carried out treated in accordance with the “Operational Standards for Non-Credit Transactions Between Union Bank of Taiwan and Related Parties” and relevant regulations governing credit transactions.
(4) Directors and Supervisors’ training records: the Bank’s directors and supervisors have taken related trainings of practical operation and company governance. The record may be accessed on the Market Observation Post System (http://newmops.tse.com.tw) and is included in the annual report.
(5) Risk management policy and execution of the risk evaluation standards: The Bank has put in place a Risk Management Policy, established necessary risk management system and standard to effectively manage
No material discrepancy.
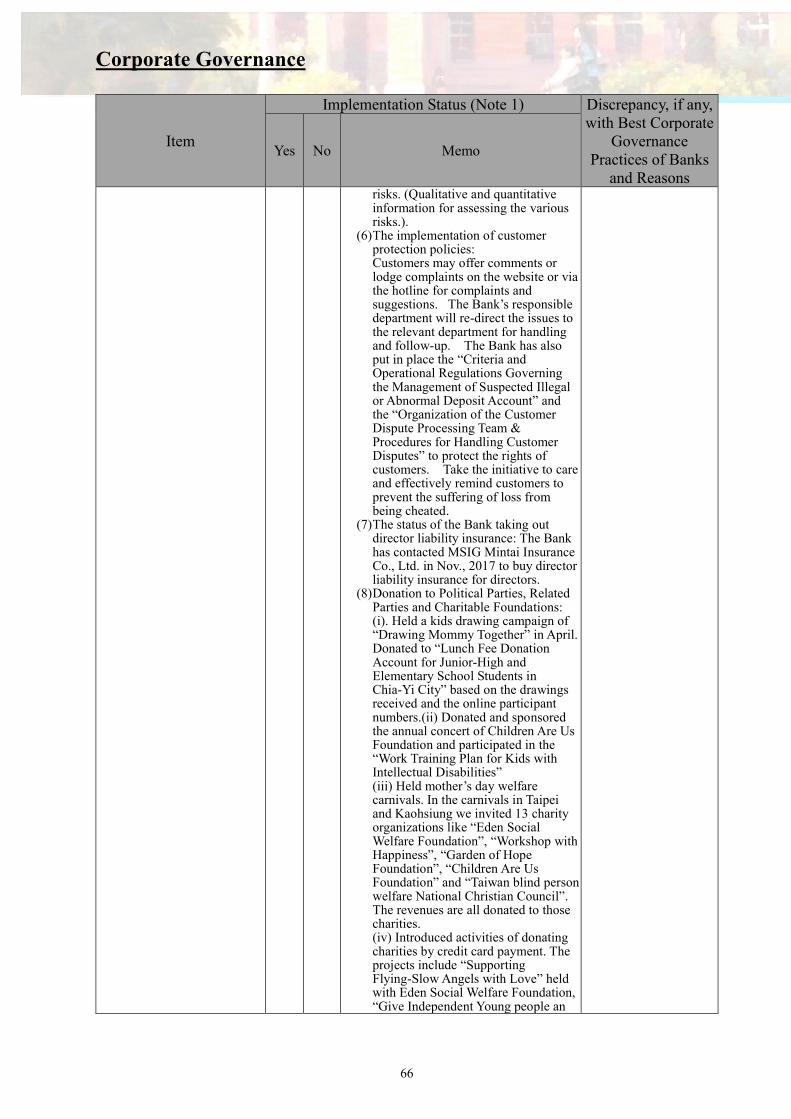
Corporate Governance
66
Item
Implementation Status (Note 1) Discrepancy, if any, with Best Corporate
Governance Practices of Banks
and Reasons
Yes No Memo
risks. (Qualitative and quantitative information for assessing the various risks.).
(6) The implementation of customer protection policies: Customers may offer comments or lodge complaints on the website or via the hotline for complaints and suggestions. The Bank’s responsible department will re-direct the issues to the relevant department for handling and follow-up. The Bank has also put in place the “Criteria and Operational Regulations Governing the Management of Suspected Illegal or Abnormal Deposit Account” and the “Organization of the Customer Dispute Processing Team & Procedures for Handling Customer Disputes” to protect the rights of customers. Take the initiative to care and effectively remind customers to prevent the suffering of loss from being cheated.
(7) The status of the Bank taking out director liability insurance: The Bank has contacted MSIG Mintai Insurance Co., Ltd. in Nov., 2017 to buy director liability insurance for directors.
(8) Donation to Political Parties, Related Parties and Charitable Foundations: (i). Held a kids drawing campaign of “Drawing Mommy Together” in April. Donated to “Lunch Fee Donation Account for Junior-High and Elementary School Students in Chia-Yi City” based on the drawings received and the online participant numbers.(ii) Donated and sponsored the annual concert of Children Are Us Foundation and participated in the “Work Training Plan for Kids with Intellectual Disabilities” (iii) Held mother’s day welfare carnivals. In the carnivals in Taipei and Kaohsiung we invited 13 charity organizations like “Eden Social Welfare Foundation”, “Workshop with Happiness”, “Garden of Hope Foundation”, “Children Are Us Foundation” and “Taiwan blind person welfare National Christian Council”. The revenues are all donated to those charities. (iv) Introduced activities of donating charities by credit card payment. The projects include “Supporting Flying-Slow Angels with Love” held with Eden Social Welfare Foundation, “Give Independent Young people an

Corporate Governance
67
Item
Implementation Status (Note 1) Discrepancy, if any, with Best Corporate
Governance Practices of Banks
and Reasons
Yes No Memo
Opportunity to Dream Together” held with Chinese Childrenhome & Shelter Association, “2017 Hope is Here” held with Hope Foundation for Cancer Care, “Care Program for Old Kids” held with Down Syndrome Foundation, “Donation to Poor People at Year End” held with Genesis Social Welfare Foundation, and “With the Eye on It: Love is in 17” held with Institute for the Blind of Taiwan.
7 Explain the status of the
improvement for the corporate governance evaluation results issued by the Corporate Governance Center of Taiwan Stock Exchange Corporation for the latest year, and propose priority enhancement items and measures for those not have been improved.
V The Bank intend to improve the items in the Corporate Governance in accordance to the evaluation result and benchmark of the Corporate Governance in 2017 as follow: (I) Disclose implementation of
resolutions in the shareholder’s meeting in the annual report.
(II) Disclose the points of communication among independent director, CPA and Chief Auditor on the bank’s website.
(III) Disclose the opinions of independent director and audit committee in the major , resolution at the BOD’s meeting in the annual report.
(IV) Buy director liability insurance for directors for the all the member of BOD of the Bank.
No material discrepancy.
Note 1: The status of operation must be specified in the Memo section, irrelevant with whether the answer is “Yes”
or “No"..
(5) The composition, responsibilities and operation status of the Salary and Remuneration Committee of the Bank:
A. Members of Salary and Remuneration Committee of the Bank

Corporate Governance
68
Note 1:With over 5 years of work experience and the following professional qualification (1): Instructor, or higher up, of a public or private junior college, college or university, in Business, Law,
Finance, Accounting or other departments as required by corporate business. (2): Judge, prosecutor, solicitor, Certified Public Account or professionally qualified and technical person as
required by the company. (3): Experience in Business, Law, Finance, Accounting or as required by corporate business.
Note 2:Two years before the directors and supervisors are elected or during the period they are on the jobs, if they meet the following criteria, please make a “ˇ” mark in the space under the criteria codes.
(1): Not an employee of the Bank; nor an employee of its affiliated enterprises. (2): Not a director or supervisor of the Bank or its affiliated enterprises. (Does not include the independent
directors of the Bank or its parent company or subsidiaries in which the Bank holds more than 50% of the shares).
(3): Not directly or indirectly own more than 1% of the Bank’s outstanding shares; nor is one of the top ten non-institutional shareholders of the Bank.
(4): Not a spouse or within second-degree relation or third-degree immediate relation to any person specified in the preceding three criteria.
(5): Not a director, supervisor, or employee of a legal entity which directly owns more than 5% of the Bank’s issued shares; nor a director, supervisor or employee of the top five legal entities which are owners of the Bank’s issued shares.
(6): Not a director, supervisor, or manager of a company which has a business relationship with the Bank; nor a shareholder who owns more than 5% of such a company.
(7): Not an owner, partner, director, supervisor, manager or spouse of any sole proprietor business, partnership, company or institution which has provided the Bank and its affiliates with financial, business consulting, or legal services.
(8): Not a person under the circumstances specified in Article 30 of the R.O.C. Company Act.
.
B. Operations of Salary and Remuneration Committee of the Bank
a. There are three people in the Salary and Remuneration Committee of the Bank. b. The term of commissioner: 2015.6.26 to 2018.6.25 Salary and Remuneration
Committee of the Bank held 2 meetings in 2017. The status of attendance was as follows:
Title Name Attendance in
Person By Proxy Attendance Rate (%)
p.s.
Convenor Zen-Fa Lu 2 0 100%
Commissioner Guo-Zhang Li 2 0 100%
Commissioner Tzung-Hang Lee 2 0 100%
Title
Qualification
Name
Over five years of experience in related fields and
the following professional qualification
(Note 1)
Independent Status (Note 2)
Serving as an
independent director of
other public companies
p.s. (Note 3)
(1) (2) (3) (1) (2) (3) (4) (5) (6) (7) (8)
Independent Director Zen-Fa Lu ˇ ˇ ˇ ˇ ˇ ˇ ˇ ˇ ˇ ˇ 0
Independent Director
Guo-Zhang Li ˇ ˇ ˇ ˇ ˇ ˇ ˇ ˇ ˇ 0
Other Tzung-Hang Lee
ˇ ˇ ˇ ˇ ˇ ˇ ˇ ˇ ˇ 0

Corporate Governance
69
Other Necessary Notes: 1 Board of director decline to adopt or require to modify recommendations of the remuneration committee:
None. 2 Resolutions of the remuneration committee to which a member or members of the committee has or have
expressed dissents or reservations which were recorded or made in writing: None.

Corporate Governance
70
( 6 ) Fulfillment of Corporate Social Responsibilities:
Item
Implementation Status (Note 1) Discrepancy, if any, with
Corporate Governance
Best-Practice Principles
for TWSE/GTSM Listed
Companies and Reasons
Yes No Memo (Note 2)
1. Exercising Corporate Governance:
(1) Formulation of the corporate social
responsibility policies or systems and
review of the status and results of
implementation.
(2) Whether the Bank has hold regular
social responsibility educational and
training activities?
(3) Whether the Bank has established a
dedicated unit (concurrently engaged in)
to promote corporate social
responsibility under supervision by the
V
V
V
(1) The Bank has enacted its
corporate social responsibility
best-practice principles and
submitted the motion for the
same to the shareholders’
meeting and then implemented
the same as the basis to be
bound by the Bank and its
subsidiaries. Further, the
“Corporate Social
Responsibility Committee”
established by the Bank would
review the status and
implementation effect of the
Bank's corporate social
responsibility policy.
(2) According to the Bank’s
corporate social responsibility
best-practice principles, the
Bank would hold regular
educational and training
activities each year, including
propagation of the Bank’s
corporate social responsibility
policy, system and related
management policy and
specific boosting program
approved upon resolution of the
Board of Directors,
arrangement of
directors/supervisors to attend
the corporate governance
programs organized by the
training organizations, and
arrangement of the Bank’s staff
to attend compliance
educational and training
programs.
(3) The Bank enacted the
“Regulations Governing
Establishment of Corporate
Social Responsibility
Committee” established the
Bank’s “Corporate Social
Responsibility Committee”
No material discrepancy

Corporate Governance
71
Item
Implementation Status (Note 1) Discrepancy, if any, with
Corporate Governance
Best-Practice Principles
for TWSE/GTSM Listed
Companies and Reasons
Yes No Memo (Note 2)
high-rank management authorized by the
board of directors who shall be
responsible for reporting the status
thereof to the board of directors?
(4) Whether the Bank has defined some
reasonable compensation policy,
integrated corporate social responsibility
with employees’ performance evaluation,
and established some clear and effective
reward/disciplinary system?
V
responsible for consolidating
the Bank’s corporate social
responsibility policy,
management policy and
specific boosting programs, and
reporting the status thereof to
the Board of Directors
regularly to fulfill its corporate
social responsibility.
(4) The Bank’s “Guidelines for
Payroll under Personnel
Management Regulations” have
defined the standards about
granting of salary, allowance,
compensation and bonus. In
addition to the fixed monthly
salary, the Bank would grant
employees the year-end bonus
and employee bonus based on
the entire operating results and
personal performance, and also
defined reasonable
compensation policy by
integrating the corporate social
responsibility policy.
Compensation policy: the Bank
enacts the “Criteria for
Handling Employee
Merit/Disciplinary Incidents”
separately.
2. Fostering a Sustainable Environment:
(1) The Bank’s endeavor to utilize all
resources more efficiently and use
renewable materials that have a low
impact on the environment to improve
sustainability of natural resources.
V
(1) In purchasing equipment, the
Bank gives priority to buying green
energy products with energy saving,
green building material,
environmental protection and water
saving certification logos. Besides
recycling, we have set up a database
of the various idle facility and
equipment, which is to be checked
prior to procurement of new office
equipment to ensure that existing
resources are used efficiently. Spare
equipment is used repeatedly to
increase the re-usage rate of office
No material discrepancy

Corporate Governance
72
Item
Implementation Status (Note 1) Discrepancy, if any, with
Corporate Governance
Best-Practice Principles
for TWSE/GTSM Listed
Companies and Reasons
Yes No Memo (Note 2)
(2) Establishment of proper environment
management systems based on the
characteristics of its industry.
(3) Monitoring of the impact of climate
change on the Bank’s operations and
execution of greenhouse gas inspection
and establishment of company strategies
for energy conservation and carbon
reduction and greenhouse gas reduction.
V
V
items.
(2) The Bank delegated the
personnel dedicated to
environmental management in
General Affairs Dept., who should
be responsible for establishing the
environmental management system.
For the time being, they would
conduct the environmental
inspection about concentration of
CO2 and lighting brightness once
per six months according to the
occupational safety & hygiene laws
and regulations to control the quality
of air indoor and maintain the
adequate brightness in the
operational environment. The Bank
is not an industrial firm, and thus is
not applicable to ISO14001 or
ISO50001.
(3) The Bank has completed the
greenhouse gases inventory for
2017, and disclosed it on the website
of the Company. The greenhouse
gas emission by the bank in 2017
was 5,385.2 tons/CO2e, which is
12.7% less than the previous year. .
3. Preserving Public Welfare
(1) Whether the Bank has established the related management policies and procedures in accordance with the relevant laws and international human right conventions?
(2) Whether the Bank has established any employee complaining mechanism and channel, and taken care of the complaint adequately?
(3) Whether the Bank has provided safe and
healthful work environments and training on safety and health for employees on a regular basis?
V
V
V
(1) The Bank complies with the
related labor laws and regulations
and also respects the standard labor
human right conventions recognized
internationally, protect employees’
legal interest and right and
non-discrimination employment
policy, establish adequate
management policies and procedure,
and execute the same precisely.
(2) The Bank has defined the
“employee complaining system” and
would take care of complaints
adequately.
(3) The Bank provides employees
with safe and healthy work
environment and performs labor
No material discrepancy

Corporate Governance
73
Item
Implementation Status (Note 1) Discrepancy, if any, with
Corporate Governance
Best-Practice Principles
for TWSE/GTSM Listed
Companies and Reasons
Yes No Memo (Note 2)
safety & health on-the-job education
and training periodically.
(4) Whether the Bank has constructed the periodical communication mechanism with employees and also informs them of operational change that might cause major impact to them in reasonable manner?
( 5)Whether the Bank has established some effective career development training plan for employees?
(6) Whether the Bank has established the related consumer protection policies and complaining procedures toward the R&D, procurement, production, operation and service procedures?
v
v
v
(4) The Bank has instituted several
mechanisms including the
web-based “Employees Corner” and
“Employee Comments and
Suggestions Form” to provide
employees with the opportunity to
offer comments and suggestions at
any time.
(5) In order to upgrade employees’
expertise, the Bank will organize
various training programs and
workshops and assign staff to attend
various external professional
training programs from time to time
each year. Further, the training of
the Bank clerks’ career capability is
also executed through the job
rotation system.
(6) For the protection of consumers’
interests, a “Consumer Dispute
Resolution Policy” was
formulated and passed during
the 2nd meeting of the 9th
board on August 26, 2015.
The Bank also maintains a
24-hour customer service
hotline for every day of the
year. Customers who find
themselves in dispute against
the Bank’s products or
services, and believe to have
suffered losses because of
which are entitled to file
complaints through proper
channels (e.g. telephone, mail,
web message, or personally at
branches). All complaints will
be handled in discretion
No material discrepancy

Corporate Governance
74
Item
Implementation Status (Note 1) Discrepancy, if any, with
Corporate Governance
Best-Practice Principles
for TWSE/GTSM Listed
Companies and Reasons
Yes No Memo (Note 2)
(7) Whether the Bank markets and labels products and services in accordance with the related laws and international practices?
v
according to the Bank’s
“Customer Complaint
Handling Procedures,” and
followed up by dedicated
personnel. The Bank will
resolve every customer dispute
in a fast and efficient manner,
and perform statistical
analyses on complaint cases to
identify rooms of improvement
and thereby prevent similar
occurrences. A “Consumer
Dispute Resolution Team” has
also been assembled to resolve
customers’ dispute in a
pro-active and efficient
manner.
(7) The Bank is used to marketing
and labeling products and services in
accordance with various laws and
regulations. If necessary, the Bank
will also ask the Legal Affairs &
Compliance Dept. for opinion.
(8) Whether the Bank has assessed the
supplier's record about environmental
protection and society before trading with
the supplier?
(9) Whether the contract between the Bank
and its main supplier includes the provision
stating that where the supplier is suspected
of violating its corporate social
responsibility policies or renders
remarkable effect to the environment and
society adversely, the Bank may terminate
or rescind the contract at any time?
v
v
(8) Before trading with any supplier,
the Bank would meet the relevant
requirements according to the
Bank’s procurement-related
regulations and corporate social
responsibility best-practice
principles.
(9) When the Bank is aware of any
supplier suspected of violating its
corporate social responsibility and
renders remarkable effect on the
environment or society (e.g., the
food safety issue) during any special
marketing activities, the Bank would
stop the activities immediately.
No material discrepancy

Corporate Governance
75
Item
Implementation Status (Note 1) Discrepancy, if any, with
Corporate Governance
Best-Practice Principles
for TWSE/GTSM Listed
Companies and Reasons
Yes No Memo (Note 2)
4. Enhancing Disclosure of Corporate Social
Responsibility(CSR) Information:
Whether the Bank has disclosed relevant and
reliable information relating to corporate
social responsibility on its website or Market
Observation Post System?
v The Bank has installed the CSR area
on its website to disclose its CSR
philosophy and policy.
Meanwhile, the Bank would disclose
the important information related to
the Bank’s CSR on MOPS. By
preparing the CSR report, the Bank
states its efforts and policies in
respect of economy, society and
environment. The report is posted on
the Bank’s website available for
access and downloading by the
public.
No material discrepancy
5. If the Bank has established its own corporate social responsibility best-practice principles based on the “Corporate
Social Responsibility Best Practice Principles for TWSE/GTSM Listed Companies”, please describe any
discrepancy between the policies and their implementation: The Bank has put in place its own “Corporate Social
Responsibility Best-Practice Principles” upon approval of 18th Meeting of 8th Board of Directors on March 18, 2015
and would implement the same upon resolution at a shareholders’ meeting. The Bank upholds the belief of “giving
back to society what we have benefited from it” and is dedicated to promoting the various charitable events on a
long-term basis as a way of fulfilling our corporate social responsibilities and also comply with the “Corporate
Social Responsibility Best Practice Principles for TWSE/GTSM Listed Companies”. Therefore, there is no material
discrepancy.
6. Other important information to facilitate better understanding of the Bank’s corporate social responsibility practices
(e.g., environmental protection, community involvement, social contribution, social work, social welfare, consumer
rights, human rights, safety and hygiene and the adopted policies and measures to fulfill corporate social
responsibilities and the status of performing such responsibilities).
7. If any of the Bank’s products or the CSR Report has been accredited to the standards of an external validation
agency, provide details: None. Note 1: The status of operation must be specified in the Memo section, irrelevant with whether the answer is “Yes” or “No". Note 2: Where the Bank has prepared the CSR report, the memo section may specify the way to access the CSR report and be
replaced by index pages.
(7) Fulfillment of ethical Management and Adopted measures:

Corporate Governance
76
Item
Implementation Status (Note 1) Discrepancy, if any, with Ethical Corporate
Management Best-Practice Principles for
TWSE/GTSM Listed Companies and Reasons
Yes No Memo
1. Formulate the Policy and Procedures for Ethical Management
(1) Whether the Bank has expressly stated the ethical policy and its fulfillment by the board of directors and the management in its Articles of Incorporation and public documents? (2) Whether the Bank has defined the policy against unethical conduct, and expressly stated the SOP, guidelines and reward and disciplinary & complaining systems for misconduct, and also implemented the policy precisely? (3) Whether the Bank takes any prevention measures against the operating activities involving high unethical conduct under Paragraph 2 of Article 7 of the "Ethical Corporate Management Best Practice Principles for TWSE/GTSM Listed Companies" or within other operating areas?
V
V
V
(1) The Bank has defined the
“Union Bank of Taiwan Ethical Corporate Management Best-Practice Principles” upon approval of the Board of Directors on March 18, 2015, and also expressly stated in these Principles that the Board of Directors and management shall commit to fulfill these Principles actively. In order to perform the commitment, the Bank asks the Audit Dept. to supervise fulfillment of the ethical corporate management policy and check whether there is any unethical conduct in the Bank, and evaluate the compliance about the related operational flows to produce report to the Board of Directors.
(2) To define the policy against unethical conduct, the Bank has expressly stated the Bank’s operating procedures, conduct guidelines, and reward and disciplinary & complaining system for misconduct in the Bank’s H.R. management regulations and work rules.
(3) Each of the Bank’s business lines is subject to strict internal control and risk control. In addition to following the requirements of competent authorities and competent entities in charge of the business lines, the Bank also establishes such units as compliance, audit and risk management. The prevention programs referred to in the preceding paragraph also define the relevant regulations prohibiting bribery to ensure the Company’s ethical management. Meanwhile, the Bank’s directors will adhere to the high self-discipline principle, and recuse themselves from any discussion
No material discrepancy

Corporate Governance
77
Item
Implementation Status (Note 1) Discrepancy, if any, with Ethical Corporate
Management Best-Practice Principles for
TWSE/GTSM Listed Companies and Reasons
Yes No Memo
or voting for any motions in which they have conflict of interest voluntarily, and are free from any unjust enrichment resulting in damage to the interest and right of the Bank’s customers and shareholders.
2. Implementation of Ethnical Management (1) Whether the Bank has evaluated the ethical record of trading counterparts and specifically set out the ethical management clause in business contract? (2) Whether the Bank has established a dedicated unit (concurrently engaged in) to promote ethical corporate management under supervision by the board of directors who shall be responsible for reporting the status thereof to the board of directors periodically? (3) Whether the Bank has defined the policy to prevent conflict of interest and to offer appropriate channels for providing a statement in regard to the situation, and implemented the same precisely? (4) Whether the Bank has implemented effective accounting policies and internal controls system established by the Bank to carry out ethical management and the status of audits conducted by internal auditors or external auditors?
V
V
V
V
V
(1) The Bank’s business activities shall avoid any trading with persons with unethical record, and the Bank planned to expressly state the clause about compliance with the Bank’s ethical management policy in contracts. Meanwhile, before conclusion of any contract, the Bank will have the contract reviewed by the legal affairs unit to ensure the right, obligation and validity of the contract. (2) The Bank appoints the Audit Dept. to supervise the promotion of the Bank’s ethical management policy and execution of the Bank’s prevention programs, and to report to the Board of Directors periodically. (3) The Bank’s policy and channel against conflict of interest are separately defined in the work rules, employees’ service rules, employee complaining system (counterpart: employees) and parliamentary rules for directors’ meetings (counterpart: directors), both of which are implemented precisely. (4) The Bank’s accounting policies were established in accordance with laws, the FSC-approved IFRS, international accounting standards, and interpretations thereof, and have been adjusted to accommodate existing and future business requirements. The Bank’s internal control system was developed based on “Implementation Rules of Internal Audit and Internal Control System of Financial Holding Companies and Banking Industries.” It exists to facilitate good business practices and to provide assurances in terms of business performance, financial reporting, and regulatory compliance. The audit team also
No material discrepancy
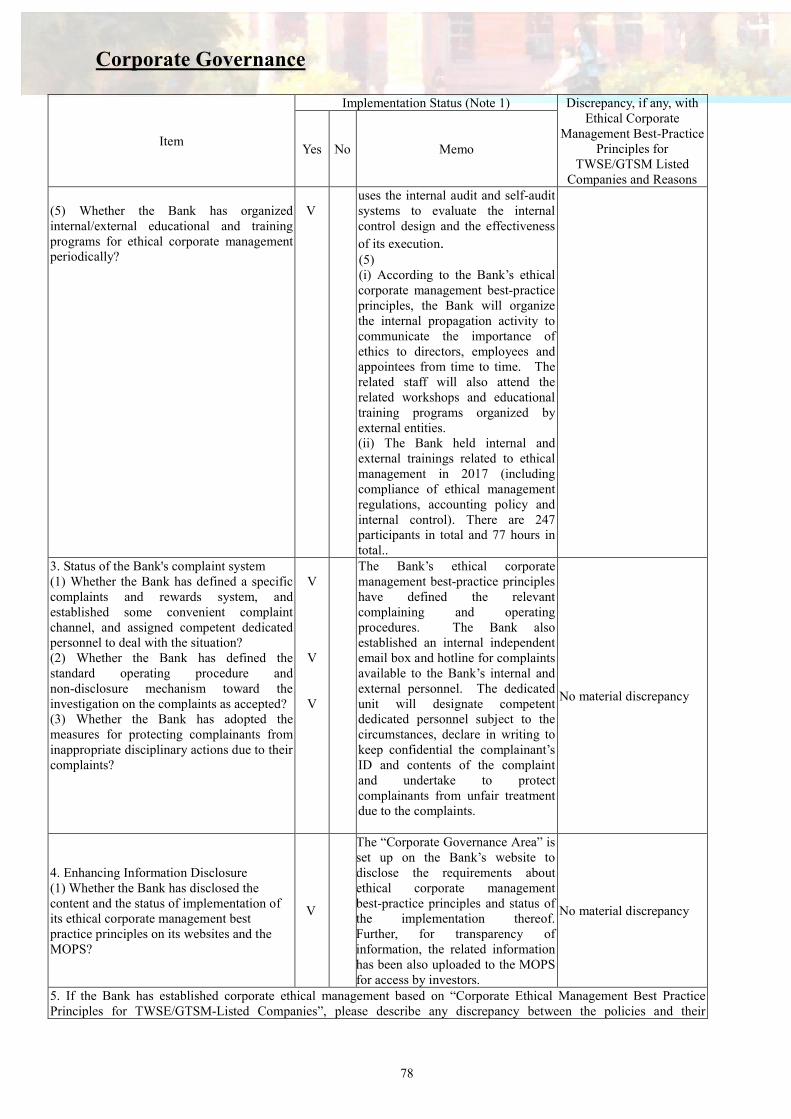
Corporate Governance
78
Item
Implementation Status (Note 1) Discrepancy, if any, with Ethical Corporate
Management Best-Practice Principles for
TWSE/GTSM Listed Companies and Reasons
Yes No Memo
(5) Whether the Bank has organized internal/external educational and training programs for ethical corporate management periodically?
V
uses the internal audit and self-audit systems to evaluate the internal control design and the effectiveness
of its execution. (5) (i) According to the Bank’s ethical corporate management best-practice principles, the Bank will organize the internal propagation activity to communicate the importance of ethics to directors, employees and appointees from time to time. The related staff will also attend the related workshops and educational training programs organized by external entities. (ii) The Bank held internal and external trainings related to ethical management in 2017 (including compliance of ethical management regulations, accounting policy and internal control). There are 247 participants in total and 77 hours in total..
3. Status of the Bank's complaint system (1) Whether the Bank has defined a specific complaints and rewards system, and established some convenient complaint channel, and assigned competent dedicated personnel to deal with the situation? (2) Whether the Bank has defined the standard operating procedure and non-disclosure mechanism toward the investigation on the complaints as accepted? (3) Whether the Bank has adopted the measures for protecting complainants from inappropriate disciplinary actions due to their complaints?
V
V
V
The Bank’s ethical corporate management best-practice principles have defined the relevant complaining and operating procedures. The Bank also established an internal independent email box and hotline for complaints available to the Bank’s internal and external personnel. The dedicated unit will designate competent dedicated personnel subject to the circumstances, declare in writing to keep confidential the complainant’s ID and contents of the complaint and undertake to protect complainants from unfair treatment due to the complaints.
No material discrepancy
4. Enhancing Information Disclosure (1) Whether the Bank has disclosed the content and the status of implementation of its ethical corporate management best practice principles on its websites and the MOPS?
V
The “Corporate Governance Area” is set up on the Bank’s website to disclose the requirements about ethical corporate management best-practice principles and status of the implementation thereof. Further, for transparency of information, the related information has been also uploaded to the MOPS for access by investors.
No material discrepancy
5. If the Bank has established corporate ethical management based on “Corporate Ethical Management Best Practice Principles for TWSE/GTSM-Listed Companies”, please describe any discrepancy between the policies and their
Corporate Governance
79
Item
Implementation Status (Note 1) Discrepancy, if any, with Ethical Corporate
Management Best-Practice Principles for
TWSE/GTSM Listed Companies and Reasons
Yes No Memo
implementation: The Bank has established the “Union Bank of Taiwan Corporate Ethical Management Best Practice Principles” and “Work Rules” setting out that employees are required to carry out their duties ethically and dutifully and comply with regulatory requirements, policies, and service standards prescribed by the Bank. The company shall be managed in accordance with regulatory requirements and internal procedures to maximise investor benefits. There is no discrepancy between the Bank's operation of ethical management and said “Corporate Ethical Management Best Practice Principles for TWSE/GTSE-Listed Companies”. 6. None.
Note 1: The status of operation must be specified in the Memo section, irrelevant with whether the answer is “Yes” or “No".
(8) Operating procedure for internal important information: In order to establish the Bank’s fair important internal information processing and disclosure mechanism to prevent information from being disclosed inadequately and to ensure the accuracy and consistency of the information released by the Bank to the public and enhance the control over prevention of insider trading, the Bank defined the “Operating Procedure for Processing of Important Internal Information”. Please refer to the corporate governance at MOPS (http://mops.twse.com.tw).
(9) Corporate governance principles and methods for searching the relevant regulations: Please refer to the corporate governance at MOPS (http://mops.twse.com.tw).
(10) Other material information sufficient to enhance understanding of the status of the Bank’s corporate governance practices:
Please refer to the Bank’s website (http://www.ubot.com.tw).
(11) Execution of the Internal Controls System A. Where an independent auditor is appointed to perform audit on the internal controls
system, the auditor’s report shall be disclosed: None. B. Statement of Internal Control:

Corporate Governance
80
Union Bank of Taiwan
Statement of Internal Controls System
March 14, 2018
To Financial Supervisory Commission:
On behalf of Union Bank of Taiwan, we hereby state that from January 1, 2017 to December 31,
2017, we have duly complied with the “Enforcement Regulations for Bank Internal Audit Control
System” in establishing its internal system, implementing risk management, designating an
independent and objective department to conduct audits, and regularly reporting to the Board of
Directors and the Supervisors. With respect to the securities business, evaluation of the effectiveness
of the design and implementation of its internal control systems described in the “Regulations
Governing the Establishment of Internal Control Systems of Service Enterprises in Securities and
Futures Markets”, promulgated by the Securities and Futures Bureau, Financial Supervisory
Commission. After prudent evaluation, the internal control and regulatory compliance of the units
for the year have been effectively implemented, except for matters set forth in the attached table.
This Statement will be included as the main content of the Bank’s annual report and prospectus, and
be published to the public. If there is any illegal activity such as fraud or concealment, liabilities
under Article 20, 32, 171, and 174 of the Securities and Exchange Law will be involved.
Chairman: Shiang-Chang Lee
President: Jeff Lin
Chief Auditor: Kuo-Pao Kang
Compliance Officer of the Bank
Ching-Wen Chen

Corporate Governance
81
Attachment: Internal Control Deficiencies and Improvement Plan (Record Date: December 31, 2017)
Matters that should be improved
Improvement measures Targeted completion date
I. When doing monetary trust business, the personnel asked the customer to sign the statement of paying debt with the trusted asset before lending, which violates Article 22-1 of Trust Enterprise Act.
The Bank has forbidden asking customers to sign the statement of paying debt with the trusted asset before the lending since August, 2016. Regarding the cases that have already been undertake, the bank has also forbidden the illegal act to protect customers’ right.
Has been completed by the improvement measures.
II. One of the Bank’s employee exploited his authority to withdraw the Bank’s cash in treasury, which violates the rules for operation.
Punishments have been resolved by Human Resource Arbitration Committee in accordance with the Bank’s Work Rules, and relevant operation principles in the multiple and detailed checking of cash in treasury for each operating unit have also been formulated in order to strengthen internal control and the management of cash in treasury.
Has been completed by the improvement measures.
III. The former employee of the Bank exploited his authority to produce fake stamps, signatures and deposit account. He subsequently applied for loans and withdrew the money with the name of customer.
We have conducted punishments in accordance with the Bank’s Work Rules after resolution by the Human Resource Arbitration Committee. To strengthen the operational requirements of credit lending, the management unit has announced and restated the amendments of operational control items for each operational unit. We have also proposed concrete improving measures in terms of transferring account, signature checking, meeting borrowers in person, contract deliver, and started up prevention mechanism for credit lending to prevent the occurrence of fake loans
Has been completed by the improvement measures
IV. The Bank’s current paper policy on anti-money laundering and blocking
The Bank have published the operational procedures of standardized control for each business item, formulated measures for risk evaluation
Part of the items that shall be improved have been processed

Corporate Governance
82
Matters that should be improved
Improvement measures Targeted completion date
financing terrorism and the system of internal control have not been completely revised. Part of the suspicious trading characteristics have not been included in the checking items of supervisory report, and overall and timely name checking and risk evaluation have not been executed.
and strengthening auditing, and will review paper policies on anti-money laundering and blocking financing terrorism. Besides, we will design supervisory modules for suspicious trading activities, supervise systematically and suggest purchasing blacklist database and negative news database to facilitate name checking and risk evaluation.
according to the improvement measures. The remaining items are expected to be improved sequentially in 2018 Q1.
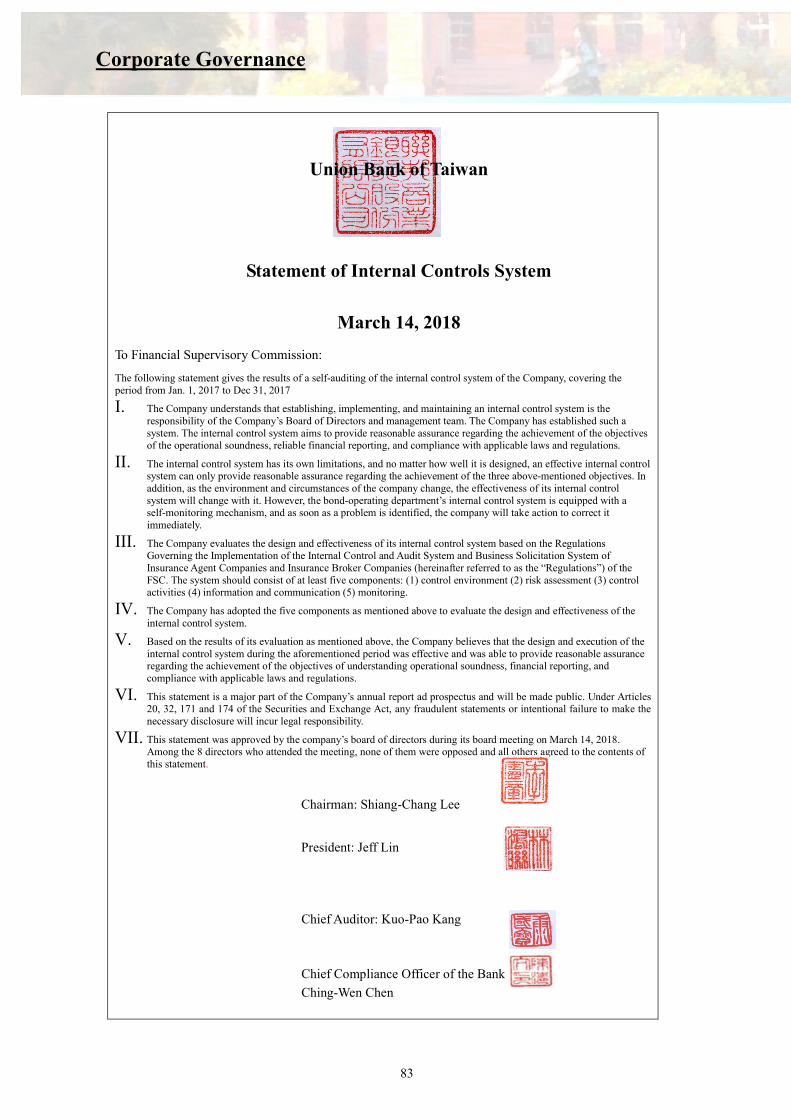
Corporate Governance
83
Union Bank of Taiwan
Statement of Internal Controls System
March 14, 2018
To Financial Supervisory Commission:
The following statement gives the results of a self-auditing of the internal control system of the Company, covering the period from Jan. 1, 2017 to Dec 31, 2017
I. The Company understands that establishing, implementing, and maintaining an internal control system is the responsibility of the Company’s Board of Directors and management team. The Company has established such a system. The internal control system aims to provide reasonable assurance regarding the achievement of the objectives of the operational soundness, reliable financial reporting, and compliance with applicable laws and regulations.
II. The internal control system has its own limitations, and no matter how well it is designed, an effective internal control system can only provide reasonable assurance regarding the achievement of the three above-mentioned objectives. In addition, as the environment and circumstances of the company change, the effectiveness of its internal control system will change with it. However, the bond-operating department’s internal control system is equipped with a self-monitoring mechanism, and as soon as a problem is identified, the company will take action to correct it immediately.
III. The Company evaluates the design and effectiveness of its internal control system based on the Regulations Governing the Implementation of the Internal Control and Audit System and Business Solicitation System of Insurance Agent Companies and Insurance Broker Companies (hereinafter referred to as the “Regulations”) of the FSC. The system should consist of at least five components: (1) control environment (2) risk assessment (3) control activities (4) information and communication (5) monitoring.
IV. The Company has adopted the five components as mentioned above to evaluate the design and effectiveness of the internal control system.
V. Based on the results of its evaluation as mentioned above, the Company believes that the design and execution of the internal control system during the aforementioned period was effective and was able to provide reasonable assurance regarding the achievement of the objectives of understanding operational soundness, financial reporting, and compliance with applicable laws and regulations.
VI. This statement is a major part of the Company’s annual report ad prospectus and will be made public. Under Articles 20, 32, 171 and 174 of the Securities and Exchange Act, any fraudulent statements or intentional failure to make the necessary disclosure will incur legal responsibility.
VII. This statement was approved by the company’s board of directors during its board meeting on March 14, 2018. Among the 8 directors who attended the meeting, none of them were opposed and all others agreed to the contents of this statement.
Chairman: Shiang-Chang Lee
President: Jeff Lin
Chief Auditor: Kuo-Pao Kang
Chief Compliance Officer of the Bank
Ching-Wen Chen

Corporate Governance
84
(12)Legal violations and the Bank’s response for the most recent two years:
Disclosed Matter
Major Deficiency
Status of Improvement
(1) Responsible person or employees of the Bank violated the law when conducting business and resulted in an indictment by a prosecutor.
None None
(2) A fine was levied on the Bank by the Financial Supervisory Commission for violations of laws and regulations.
1. The former employee of the Bank violated his authority and produced fake stamps, signatures and deposit account. He subsequently applied for loans and withdrew the money with the name of customer which violates Article 45-1 (1) of the Banking Act. He was fined with NT$ 6 million in accordance with Article 129-7 of the Banking Act.
1. We have conducted punishments in accordance with the Bank’s Work Rules after resolution by the Human Resource Arbitration Committee. To strengthen the operational requirements of credit lending, the management unit has announced and restated the amendments of operational control items for each operational unit. We have also proposed concrete improving measures in terms of transferring account, signature checking, meeting borrowers in person, contract deliver, and started up prevention mechanism for credit lending to prevent the occurrence of fake loans.
(3) Misconduct occurred and resulted in the Financial Supervisory Commission’s imposing strict corrective measures.
None None
(4) Punishment imposed by the Financial Supervisory Commission in accordance with Paragraph 1, Article 61-1 of the Banking Act of ROC
1. Invest in securities with a non-statutory investment grade exceeding the limits required by Article 74-1 of the Banking Act of the Republic of China(Taiwan).
2. Conduct the derivatives business:
1. In order to be able to respond immediately to changes in the assessment and exchange rates, the Bank has improved and revised the control mechanism as follows: (1) For those with only a BBB- rating, the
current frequency of monthly monitoring is changed from every month to every ten days of each month.
(2) Establish the early warning indicators for the exchange rate changes; that is, where the ratio of the Bank’s investments in securities with a non-statutory investment grade reaches 9.5%, the exchange rate changes will be monitored every day.
Through the above-mentioned control mechanism, the effective measures will be taken to comply with the statutory limits. 2. The Bank has improved and revised
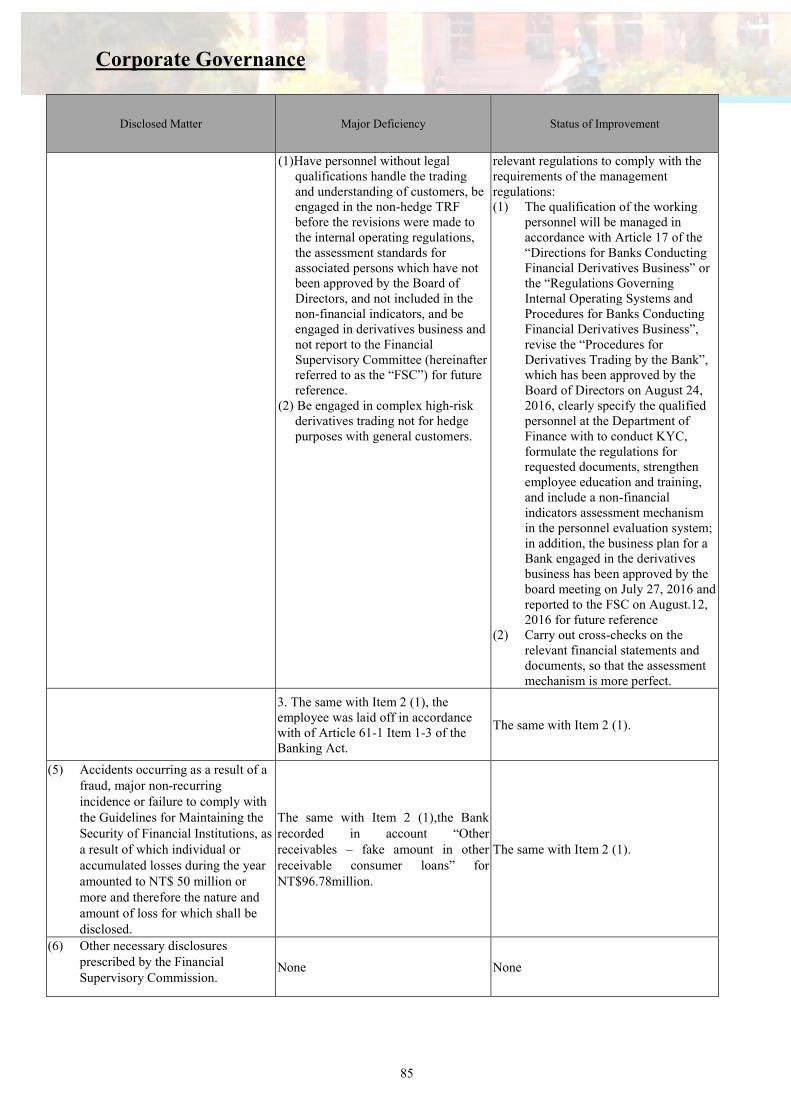
Corporate Governance
85
Disclosed Matter
Major Deficiency
Status of Improvement
(1)Have personnel without legal qualifications handle the trading and understanding of customers, be engaged in the non-hedge TRF before the revisions were made to the internal operating regulations, the assessment standards for associated persons which have not been approved by the Board of Directors, and not included in the non-financial indicators, and be engaged in derivatives business and not report to the Financial Supervisory Committee (hereinafter referred to as the “FSC”) for future reference.
(2) Be engaged in complex high-risk derivatives trading not for hedge purposes with general customers.
relevant regulations to comply with the requirements of the management regulations: (1) The qualification of the working
personnel will be managed in accordance with Article 17 of the “Directions for Banks Conducting Financial Derivatives Business” or the “Regulations Governing Internal Operating Systems and Procedures for Banks Conducting Financial Derivatives Business”, revise the “Procedures for Derivatives Trading by the Bank”, which has been approved by the Board of Directors on August 24, 2016, clearly specify the qualified personnel at the Department of Finance with to conduct KYC, formulate the regulations for requested documents, strengthen employee education and training, and include a non-financial indicators assessment mechanism in the personnel evaluation system; in addition, the business plan for a Bank engaged in the derivatives business has been approved by the board meeting on July 27, 2016 and reported to the FSC on August.12, 2016 for future reference
(2) Carry out cross-checks on the relevant financial statements and documents, so that the assessment mechanism is more perfect.
3. The same with Item 2 (1), the employee was laid off in accordance with of Article 61-1 Item 1-3 of the Banking Act.
The same with Item 2 (1).
(5) Accidents occurring as a result of a fraud, major non-recurring incidence or failure to comply with the Guidelines for Maintaining the Security of Financial Institutions, as a result of which individual or accumulated losses during the year amounted to NT$ 50 million or more and therefore the nature and amount of loss for which shall be disclosed.
The same with Item 2 (1),the Bank recorded in account “Other receivables – fake amount in other receivable consumer loans” for NT$96.78million.
The same with Item 2 (1).
(6) Other necessary disclosures prescribed by the Financial Supervisory Commission.
None None

Corporate Governance
86
(13) Material Resolutions of Shareholders Meetings or Board of Directors Meetings During the Current Fiscal Year up to the Date of Printing of the Annual Report
1. Material resolutions of a shareholders’ meeting during 2017 and the status of
implementation thereof (1) Ratification of the surplus earnings distribution or loss make-up proposal for 2016:
The resolution was adopted. Status of implementation: The resolution of the dividend distribution of NTD 0.45 per share in cash was adopted by the Bank’s shareholders' meeting. The distribution record date was determined to be July 29, 2017. Dividends were paid on August 23, 2017.
(2) Ratification of the 2016 Business Report and financial statements: The resolution was adopted.
(3) Revise part of Articles of the Bank’s “Articles of Association”: The resolution was adopted. Approved by the Ministry of Economic Affairs for registration on July 5, 2017 and disclosed on the website of the Bank.
(4) Revise part of the Bank’s “Procedures for Obtaining or Decomposing Assets”: The resolution was adopted.
(5) Plan for long-term fund raising: The resolution was adopted. The Bank completed the cash issuance of perpetual noncumulative preferred stock of NT$ 10 billion on October 24, 2017.
2. Material resolutions of a board of directors meeting during 2017 or during the current fiscal year up to the date of publication of the annual report. (1) On Jan. 18, 2017, the 12th meeting of the 9th Board of Directors resolved on the
amendments of “Policy on Legal Compliance”, “Principles Governing Corporate Governance Practices of Banks”, “relevant matters to renew the appointment of Deloitte Taiwan in 2017 to handle the relevant matters to the Bank’s financial statements and income tax settlement audit and declaration”, “Internal Auditing System”, and “2017 operating budget and operating policy by business for the whole bank”.
(2) On March 22, 2017, the 13th meeting of the 9th Board of Directors resolved on the amendments of “Position and Loss Limit on Industry Credit Lending”, “Regulations governing the Management of Enterprise Group Credit Risk”, “Regulations Governing the Division of Authorities and Responsibilities on Credit Extensions for the Bank’s Staff at All Levels” and authorization and operational rules for "TMU Derivatives Product Risk Limit", “Standards for Foreign Currency Security Investment”, “Procedure guidelines for concurrent operation of insurance agent business”, “Guidelines for Structural Investment Portfolio”, “Guidelines for Exchange Rate Swap Business between NTD vs. Foreign Currency/Foreign Currency vs. Foreign Currency”, “Procedures for Obtaining or Decomposing Assets”, “Credit Limit on Real Estate Collateral Loans”, “Standards for Capital Adequacy Management”, and the submissions of the Bank’s self-inspections of its internal control system, the overall assessment inspection report, and the audit results of the audit business for the whole year of 2016, “the Bank’s 2016 Business Report and Financial Reports preliminarily audited by a CPA”, “the Bank’s 2016 surplus earning distribution”, “compensation distribution of employees and directors for 2016”, and revisions to “Articles of Association” and “Plan for long-term fund raising”.

Corporate Governance
87
(3) On May 10, 2017, the 14th meeting of the 9th Board of Directors resolved on the amendments of “internal audit operation of the Bank's concurrent operation of bonds proprietary business of the securities firms”, the Bank’s “internal control system of the Bank’s concurrent operation of securities firms”, formulation of the Bank’s “Operational Procedures for Full Authorization of Investing Marketable Securities”, revisions to “Guidelines for recognition of non-performing loans, overdue receivables and bad debts in consumer credit business operation”, “Organization Regulations”, “Articles of Association”, and the submission of the Bank’s Consolidated Financial Reports for the first quarter of 2017 audited by a CPA. .
(4) On June 28, 2017, the 15th meeting of the 9th Board of Directors resolved on the revisions to the internal control system of the Bank’s concurrent operation of securities firms in the futures introducing broker business, “Submission and Report of the Bank’s ‘Information that Should be Declared in Compliance with the Principle of Supervision and Management’ for 2017”, and preparation of the Bank’s shares issuance by cash of Registered Series A Preferred Stock.
(5) On August 23, 2017, the 16th meeting of the 9th Board of Directors resolved on the revisions to “the internal control system of the Bank’s concurrent operation of securities firms”, “Pricing Policy on Consumer Credit Business”, “Guidelines for Issuing Financial Bond”, “Banking Book Interest Rate Risk Management Policy”, proposal of applying to the FSC in increasing domestic branches, revisions to “Audit Committee Foundation Rules” and “Parliamentary Rules for Directors' Meetings”, formulation of the Bank’s “Rules for Ethical Conducts of Directors and Managers”, revisions to the “Bank’s policy for fair treatment of customers” and “the implementation strategy for fair treatment of customers”, “Money Laundering and Terrorist Financing Risk Assessment and Control Policy” and “Risk Assessment Report and Risk Control Project”, “Internal Auditing System”, and submission of the Bank’s Business Report and financial reports for the first half of 2017 audited by a CPA. .
(6) On November 8, 2017, the 16th meeting of the 9th Board of Directors resolved on the revisions to “Operational Procedures for Full Authorization of Investing Marketable Securities”, “Procedures for Derivatives Trading by Union Bank of Taiwan Co., Ltd.”, “Regulations Governing the Division of Authorities and Responsibilities on Credit Extensions for the Bank’s Staff at All Levels” and authorization and operational rules for "TMU Derivatives Product Risk Limit", “Restrictions on lending to employees and related parties under the Banking Act”, formulation of “Management Directions Concerning Credit Extensions by the Bank to a Same Juristic Person, Group Enterprise, or Industry Type”, revisions to “Investment Policy”, “Operational Standards for Supervision and Control on Subsidiaries”, “Audit Committee Foundation Rules” and “Guideline Governing the Responsibilities of Independent Directors, proposal of the “subsequent planning for the Bank’s cash issuance of Series A Preferred Stock”, revisions to the Bank’s “Notices for Personal Information Protection”, “Internal Management Rules and Operational Procedures for using the competent authority’s financial examination reports”, “Internal Audit Operation Audit Plan for 2018”, “the Bank’s appointment of Deloitte Taiwan in auditing the project of anti-money laundering and countering the financing of terrorism in the first half of 2017 will be signed by the Chairman, President, Chief Auditor and Compliance Officer in the Statement of Internal Controls System”, and submission of the Bank’s Consolidated Financial Reports for 2017 Q3 audited by a CPA.
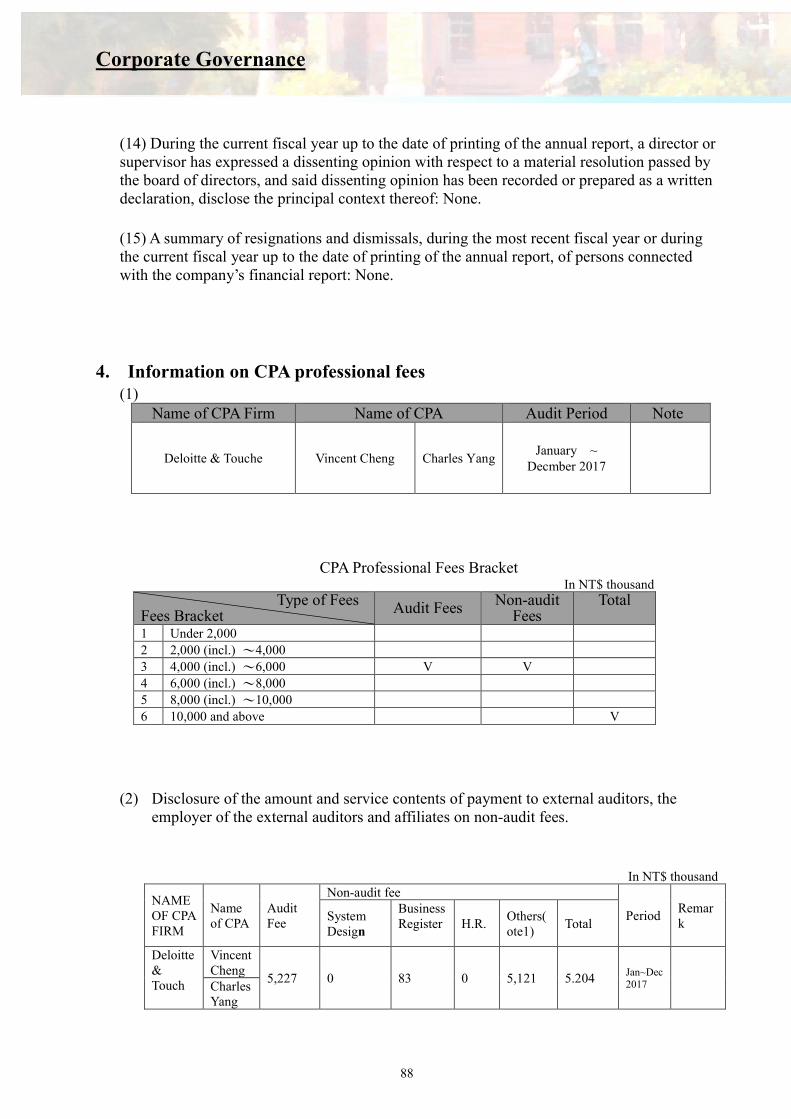
Corporate Governance
88
(14) During the current fiscal year up to the date of printing of the annual report, a director or supervisor has expressed a dissenting opinion with respect to a material resolution passed by the board of directors, and said dissenting opinion has been recorded or prepared as a written declaration, disclose the principal context thereof: None.
(15) A summary of resignations and dismissals, during the most recent fiscal year or during the current fiscal year up to the date of printing of the annual report, of persons connected with the company’s financial report: None.
4. Information on CPA professional fees
(1) Name of CPA Firm Name of CPA Audit Period Note
Deloitte & Touche Vincent Cheng Charles Yang January ~
Decmber 2017
CPA Professional Fees Bracket In NT$ thousand
Type of Fees Fees Bracket Audit Fees Non-audit
Fees Total
1 Under 2,000
2 2,000 (incl.) ~4,000
3 4,000 (incl.) ~6,000 V V
4 6,000 (incl.) ~8,000
5 8,000 (incl.) ~10,000
6 10,000 and above V
(2) Disclosure of the amount and service contents of payment to external auditors, the
employer of the external auditors and affiliates on non-audit fees.
In NT$ thousand
NAME OF CPA FIRM
Name of CPA
Audit Fee
Non-audit fee
Period Remark
System Design
Business Register
H.R. Others(ote1)
Total
Deloitte & Touch
Vincent Cheng
5,227 0 83 0 5,121 5.204 Jan~Dec 2017
Charles Yang
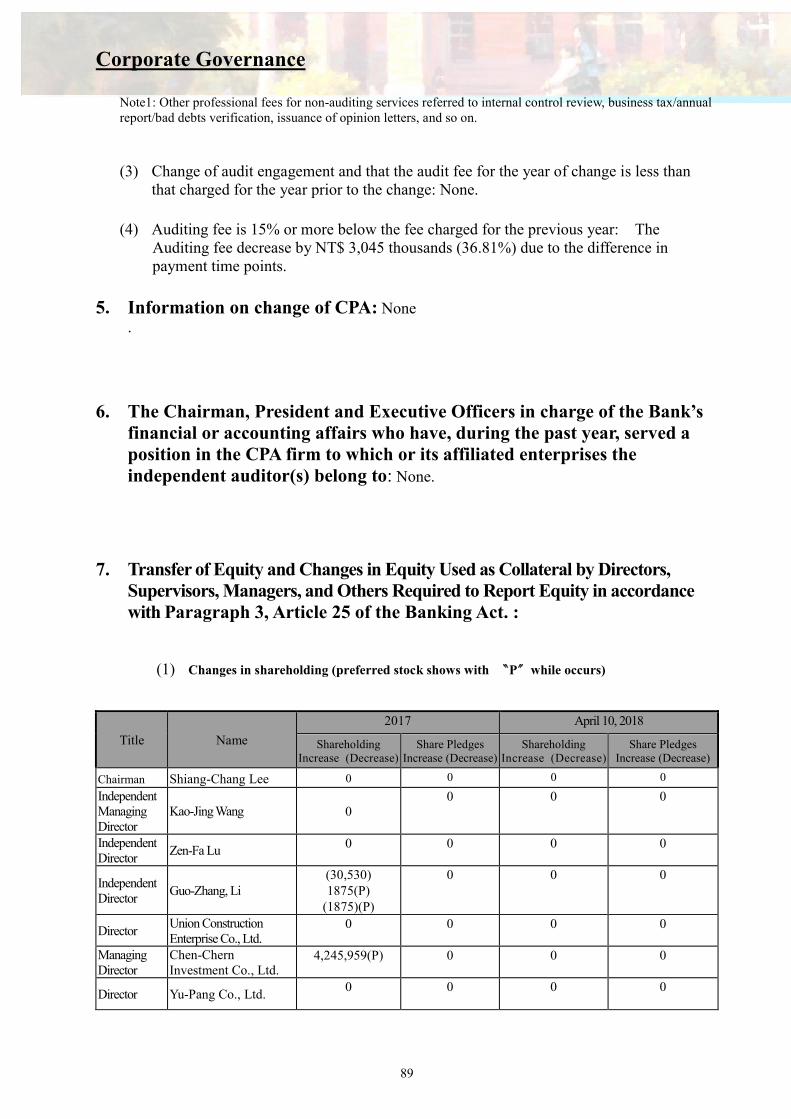
Corporate Governance
89
Note1: Other professional fees for non-auditing services referred to internal control review, business tax/annual report/bad debts verification, issuance of opinion letters, and so on.
(3) Change of audit engagement and that the audit fee for the year of change is less than
that charged for the year prior to the change: None. (4) Auditing fee is 15% or more below the fee charged for the previous year: The
Auditing fee decrease by NT$ 3,045 thousands (36.81%) due to the difference in payment time points.
5. Information on change of CPA: None
. 6. The Chairman, President and Executive Officers in charge of the Bank’s
financial or accounting affairs who have, during the past year, served a position in the CPA firm to which or its affiliated enterprises the independent auditor(s) belong to: None.
7. Transfer of Equity and Changes in Equity Used as Collateral by Directors, Supervisors, Managers, and Others Required to Report Equity in accordance with Paragraph 3, Article 25 of the Banking Act. :
(1) Changes in shareholding (preferred stock shows with 〝P〞while occurs)
Title Name
2017 April 10, 2018
Shareholding Increase (Decrease)
Share Pledges Increase (Decrease)
Shareholding Increase (Decrease)
Share Pledges Increase (Decrease)
Chairman Shiang-Chang Lee 0 0 0 0
Independent Managing Director
Kao-Jing Wang 0 0 0 0
Independent Director
Zen-Fa Lu 0 0 0 0
Independent Director
Guo-Zhang, Li (30,530) 1875(P)
(1875)(P)
0 0 0
Director Union Construction Enterprise Co., Ltd.
0 0 0 0
Managing Director
Chen-Chern Investment Co., Ltd.
4,245,959(P) 0 0 0
Director Yu-Pang Co., Ltd. 0 0 0 0
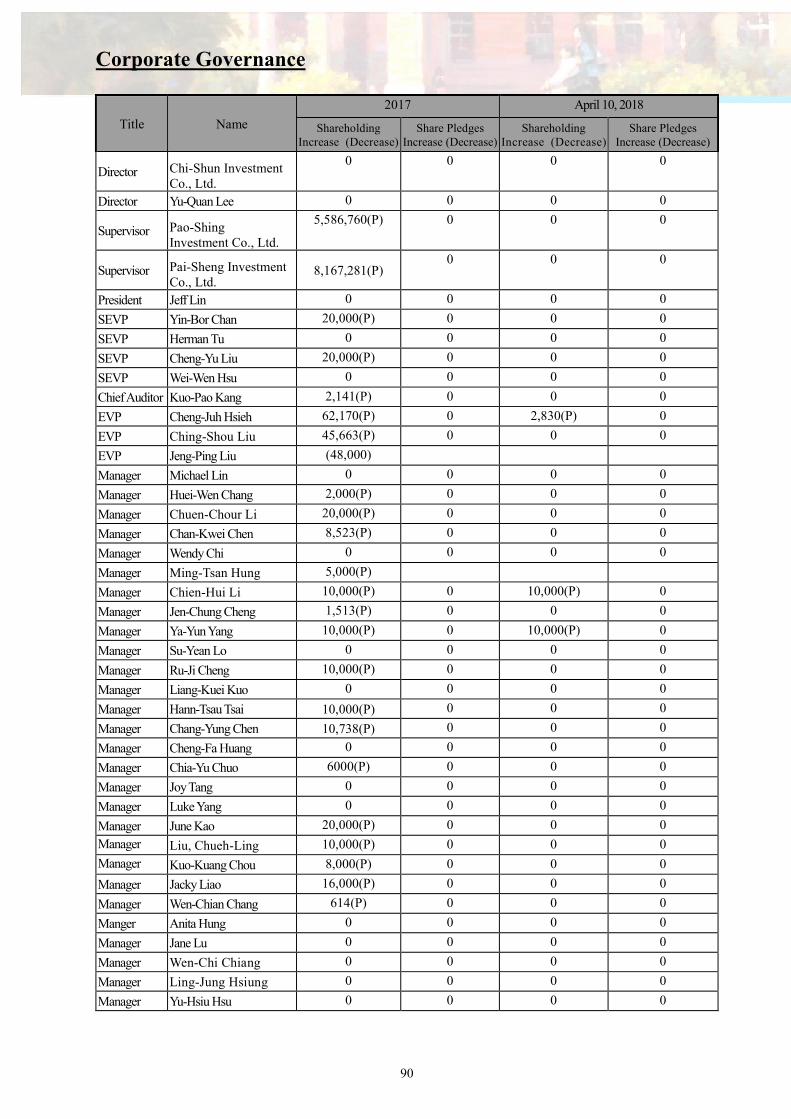
Corporate Governance
90
Title Name
2017 April 10, 2018
Shareholding Increase (Decrease)
Share Pledges Increase (Decrease)
Shareholding Increase (Decrease)
Share Pledges Increase (Decrease)
Director Chi-Shun Investment Co., Ltd.
0 0 0 0
Director Yu-Quan Lee 0 0 0 0
Supervisor Pao-Shing Investment Co., Ltd.
5,586,760(P) 0 0 0
Supervisor Pai-Sheng Investment Co., Ltd.
8,167,281(P) 0 0 0
President Jeff Lin 0 0 0 0
SEVP Yin-Bor Chan 20,000(P) 0 0 0
SEVP Herman Tu 0 0 0 0
SEVP Cheng-Yu Liu 20,000(P) 0 0 0
SEVP Wei-Wen Hsu 0 0 0 0
Chief Auditor Kuo-Pao Kang 2,141(P) 0 0 0
EVP Cheng-Juh Hsieh 62,170(P) 0 2,830(P) 0
EVP Ching-Shou Liu 45,663(P) 0 0 0
EVP Jeng-Ping Liu (48,000)
Manager Michael Lin 0 0 0 0
Manager Huei-Wen Chang 2,000(P) 0 0 0
Manager Chuen-Chour Li 20,000(P) 0 0 0
Manager Chan-Kwei Chen 8,523(P) 0 0 0
Manager Wendy Chi 0 0 0 0
Manager Ming-Tsan Hung 5,000(P)
Manager Chien-Hui Li 10,000(P) 0 10,000(P) 0
Manager Jen-Chung Cheng 1,513(P) 0 0 0
Manager Ya-Yun Yang 10,000(P) 0 10,000(P) 0
Manager Su-Yean Lo 0 0 0 0
Manager Ru-Ji Cheng 10,000(P) 0 0 0
Manager Liang-Kuei Kuo 0 0 0 0
Manager Hann-Tsau Tsai 10,000(P) 0 0 0
Manager Chang-Yung Chen 10,738(P) 0 0 0
Manager Cheng-Fa Huang 0 0 0 0
Manager Chia-Yu Chuo 6000(P) 0 0 0
Manager Joy Tang 0 0 0 0
Manager Luke Yang 0 0 0 0
Manager June Kao 20,000(P) 0 0 0
Manager Liu, Chueh-Ling 10,000(P) 0 0 0
Manager Kuo-Kuang Chou 8,000(P) 0 0 0
Manager Jacky Liao 16,000(P) 0 0 0
Manager Wen-Chian Chang 614(P) 0 0 0
Manger Anita Hung 0 0 0 0
Manager Jane Lu 0 0 0 0
Manager Wen-Chi Chiang 0 0 0 0
Manager Ling-Jung Hsiung 0 0 0 0
Manager Yu-Hsiu Hsu 0 0 0 0

Corporate Governance
91
Title Name
2017 April 10, 2018
Shareholding Increase (Decrease)
Share Pledges Increase (Decrease)
Shareholding Increase (Decrease)
Share Pledges Increase (Decrease)
Manager Peter Chien 20,000(P) 0 0 0
Manager Shih-Shien Chene 0 0 0 0
Manager Russell YC Chang 0 0 0 0
Manager Chang-Chen Lin 4,000(P) 0 0 0
Manager Gary Tsai (7,000)
1,243(P) 0 0 0
Manager Shum-Chen, Tu 12,000(P) 0 0 0
Manager Ching-Shyong Huang 0 0 0 0
Manager Chu-Shih Wei 7,029(P) 0 0 0
Manager Sophie Hsu 10,000(P) 0 0 0
Manager Michael Lee (21,000) 6,000(P)
0 0 0
Manager Chun-Hsien Chang 6,000(P) 0 0 0
Manager Chien-Lung Chen 20,588(P) 0 (6,000)(P) 0
Manager Tawei Shih 20,000(P) 0 0 0
Manager Shu-Feng Hsueh 10,000(P) 0 0 0
Manager Lawrence Chen 0 0 0 0
Manager Yeong-Jin Hwang 0 0 0 0
Manager Meng-Hsia Wu 0 0 0 0
Manager Chien-Chung Su 14,687(P) 0 0 0
Manager Hui-Chin Yang 16,000(P) 0 (13,000)(P) 0
Manager Ye-Yan Lin 8,981(P) 0 0 0
Manager Ching-Wen Chen 10,000(P) 0 0 0
Manager Chih-Chung Chang (18,000)
100,000(P) 80,000(P) 0 0
Manager Fang-Ni Wang 5,000(P) 0 0 0
Manager Lanny Liaw 0 0 0 0
Manager Yen-Jou Liu 0 0 0 0
Manager Shih-Fu Liu 0 0 0 0
Manager Vickie Chou 0 0 0 0
Manager Shen-Yung Peng 0 0 0 0
Manager I-Ho Ou 14,000(P) 0 0 0
Manager Sheng-Hsiu Chou 14,000(P) 0 0 0
Manager Teh-Chin Tsai 21,851(P) 0 0 0
Manager Kuo-Yi Lu 90,469(P) 0 0 0
Manager Hsiu-Yun Su 17,191(P) 0 0 0
Manager Shis-Wen Lu 0 0 0 0
Manager Kuan-Hong Lee 10,700(P) 0 0 0
Manager Hung-Min Chen 16,114(P) 0 0 0
Manager James Tsai 10,000 0 0 0
Manager Alex Ciu 4,557(P) 0 0 0
Manager Hui-Fen Chao 0 0 0 0
Manager Chia-Wei Lin 14,000(P) 0 0 0
Manager Huei-Jen Chiou 3,384(P) 0 0 0
Manager Chien-Chung Wu 0 0 0 0

Corporate Governance
92
Title Name
2017 April 10, 2018
Shareholding Increase (Decrease)
Share Pledges Increase (Decrease)
Shareholding Increase (Decrease)
Share Pledges Increase (Decrease)
Manager Wu-Yuan Chen 20,000(P) 0 0 0
Manager Shan-Chih Yen 17,766(P) 0 0 0
Manager Ta-Yu Chin 12,846(P) 0 0 0
Manager Chi-Fang Chu 8,000(P) 0 0 0
Manager Candy Lin 5,000(P) 0 0 0
Manager Roger Chang 0 0 0 0
Manager Hsien-Ming Yen (10,000) 0 (9,000) 0
Manager Feng-Li Lin 0 0 0 0
Manager Miao-Hui Yeh 0 0 0 0
Manager CM Huang 4,000(P) 0 0 0
Manager I-Wen Ho 16,000(P) 0 0 0
Manager Cheng-Hsien Tseng 6,722(P) 0 0 0
Manager Jeffery Tsai 29,622(P)
Manager Ju-Ling Kuo (79,000)
16,000(P) (1,000)(P)
0 (15,000)(P) 0
Manager Wen-Hui Lin 19,192(P) 0 0 0
Manager Miranda Tsai 20,000(P) 0 0 0
Manager Kuen-Cheng Chou 11,219(P) 0 0 0
Manager Jyh-Chiang Huang 0 0 0 0
Manager Wen-Jui Chou 2,000(P)
(2,000)(P) 0 0 0
Manager Ping-Hul Lin 20,000(P) 0 0 0
Manager Shiu-Lan Hsieh 12,211(P) 0 0 0
Manager Tereasa Lin 7,262(P) 0 0 0
Manager Amy Chung 3,000(P) 0 0 0
Manager Cooper Kao 16,710(P) 0 0 0
Manager Yao-Hsien Lee 16,000(P) 0 0 0
Manager Chao-Chuan Chuang 10,793(P) 0 0 0
Manager Jung-Hsiang Chung 1,305(P) 0 0 0
Manager Kuang-Yi Kuo 11,596(P) 0 0 0
Manager Chang-Fu Tsai 1,044(P) 0 0 0
Manager Connie Tseng 2,000(P) 0 0 0
Manager Lisa Lu 8,000(P) 0 0 0
Manager Liang-Wen Liu 0 0 0 0
Manager Mei-Ling Lee 8,000(P) 0 0 0
Manager Wen-Shien Chu 20,000(P) 0 0 0
Manager Fei-Kun Lin 21,329(P) 0 0 0
Manager Shu-Huey Huang 0 0 0 0
Manager Chien-Chou Chen 15,069(P) 0 0 0
Manager Chen-Jen Chang 3,000(P) 0 0 0
Manager Wen-Chih Cheng, 0 0 0 0
Manager Yanger Yang 28,930(P) 0 0 0
Major Shareholder
Tsong-Li Investment Co., Ltd.
0 0 0 0
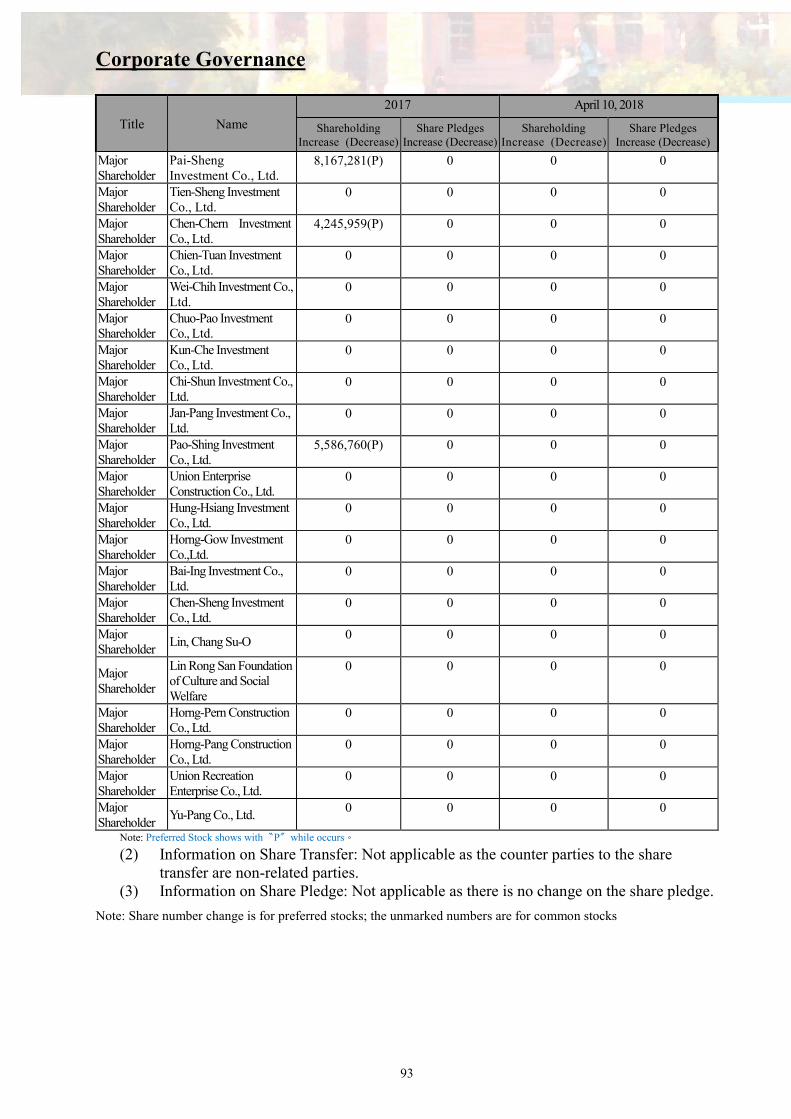
Corporate Governance
93
Title Name
2017 April 10, 2018
Shareholding Increase (Decrease)
Share Pledges Increase (Decrease)
Shareholding Increase (Decrease)
Share Pledges Increase (Decrease)
Major Shareholder
Pai-Sheng Investment Co., Ltd.
8,167,281(P) 0 0 0
Major Shareholder
Tien-Sheng Investment Co., Ltd.
0 0 0 0
Major Shareholder
Chen-Chern Investment Co., Ltd.
4,245,959(P) 0 0 0
Major Shareholder
Chien-Tuan Investment Co., Ltd.
0 0 0 0
Major Shareholder
Wei-Chih Investment Co., Ltd.
0 0 0 0
Major Shareholder
Chuo-Pao Investment Co., Ltd.
0 0 0 0
Major Shareholder
Kun-Che Investment Co., Ltd.
0 0 0 0
Major Shareholder
Chi-Shun Investment Co., Ltd.
0 0 0 0
Major Shareholder
Jan-Pang Investment Co., Ltd.
0 0 0 0
Major Shareholder
Pao-Shing Investment Co., Ltd.
5,586,760(P) 0 0 0
Major Shareholder
Union Enterprise Construction Co., Ltd.
0 0 0 0
Major Shareholder
Hung-Hsiang Investment Co., Ltd.
0 0 0 0
Major Shareholder
Horng-Gow Investment Co.,Ltd.
0 0 0 0
Major Shareholder
Bai-Ing Investment Co., Ltd.
0 0 0 0
Major Shareholder
Chen-Sheng Investment Co., Ltd.
0 0 0 0
Major Shareholder
Lin, Chang Su-O 0 0 0 0
Major Shareholder
Lin Rong San Foundation of Culture and Social Welfare
0 0 0 0
Major Shareholder
Horng-Pern Construction Co., Ltd.
0 0 0 0
Major Shareholder
Horng-Pang Construction Co., Ltd.
0 0 0 0
Major Shareholder
Union Recreation Enterprise Co., Ltd.
0 0 0 0
Major Shareholder
Yu-Pang Co., Ltd. 0 0 0 0
Note: Preferred Stock shows with〝P〞while occurs。
(2) Information on Share Transfer: Not applicable as the counter parties to the share transfer are non-related parties.
(3) Information on Share Pledge: Not applicable as there is no change on the share pledge.
Note: Share number change is for preferred stocks; the unmarked numbers are for common stocks
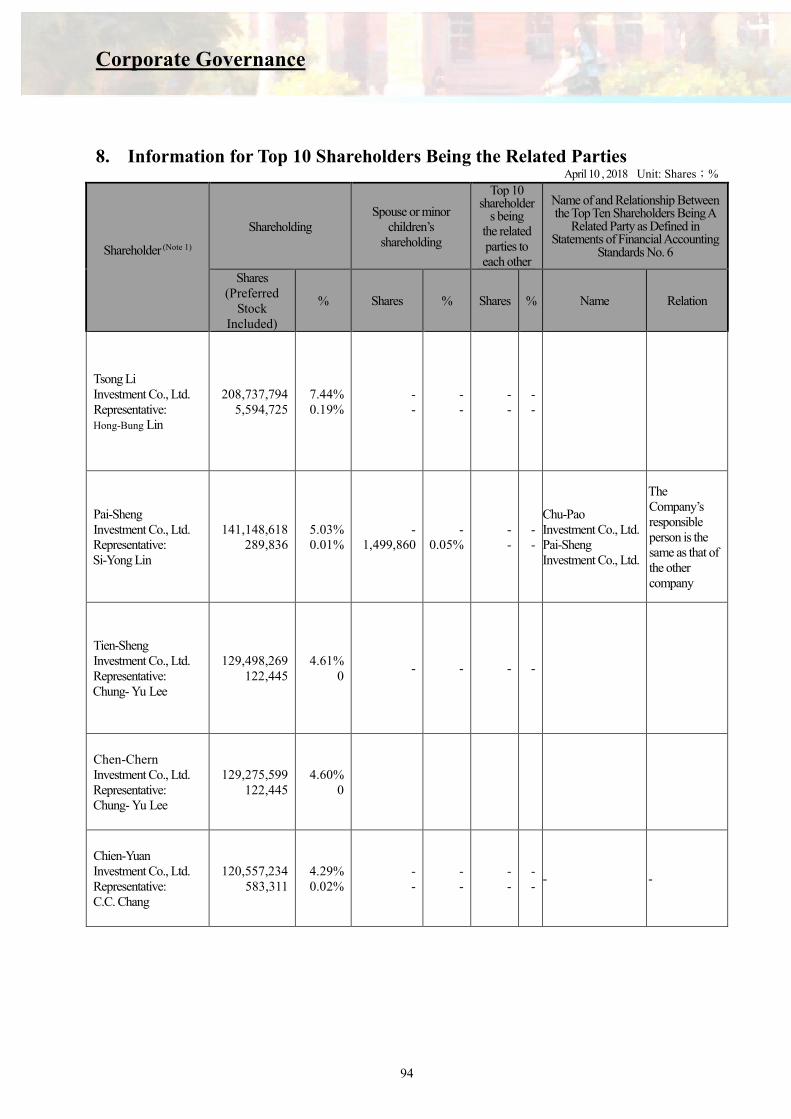
Corporate Governance
94
8. Information for Top 10 Shareholders Being the Related Parties
April 10 , 2018 Unit: Shares;%
Shareholder (Note 1)
Shareholding Spouse or minor
children’s shareholding
Top 10 shareholder
s being the related parties to each other
Name of and Relationship Between the Top Ten Shareholders Being A
Related Party as Defined in Statements of Financial Accounting
Standards No. 6
Shares (Preferred
Stock Included)
% Shares % Shares % Name Relation
Tsong Li Investment Co., Ltd. Representative: Hong-Bung Lin
208,737,794 5,594,725
7.44% 0.19%
- -
- -
- -
- -
Pai-Sheng Investment Co., Ltd. Representative: Si-Yong Lin
141,148,618 289,836
5.03% 0.01%
- 1,499,860
- 0.05%
- -
- -
Chu-Pao Investment Co., Ltd. Pai-Sheng Investment Co., Ltd.
The Company’s responsible person is the same as that of the other company
Tien-Sheng Investment Co., Ltd. Representative: Chung- Yu Lee
129,498,269 122,445
4.61% 0
- - - -
Chen-Chern Investment Co., Ltd. Representative: Chung- Yu Lee
129,275,599 122,445
4.60% 0
Chien-Yuan Investment Co., Ltd. Representative: C.C. Chang
120,557,234 583,311
4.29% 0.02%
- -
- -
- -
- -
- -

Corporate Governance
95
Shareholder (Note 1)
Shareholding Spouse or minor
children’s shareholding
Top 10 shareholder
s being the related parties to each other
Name of and Relationship Between the Top Ten Shareholders Being A
Related Party as Defined in Statements of Financial Accounting
Standards No. 6
Shares (Preferred
Stock Included)
% Shares % Shares % Name Relation
Wei-Chih Investment Co., Ltd. Representative: S.S. Yeh
115,417,866 0
4.11% 0
-
-
- -
- -
-
Chu-Pao Investment Co., Ltd. Representative: Si-Yong Lin
108,600,778 289,836
3.87% 0.01%
- 1,499,860
- 0.05%
- -
Chu-Pao Investment Co., Ltd. Pai-Sheng Investment Co., Ltd.
The Company’s responsible person is the same as that of the other company
Kun-Che Investment Co., Ltd. Representative: Y. C. Huang
104,496,932 8,201
3.72% 0%
- - - - - -
Chi-Shun Investment Co., Ltd. Representative: Jyh-Dong Chen
97,059,211 324,655
3.46% 0.01%
- - - - - -
Pao-Shing Investment Co., Ltd. Representative: Lin Chiou-Tzy Lin
96,551,526 563,735
3.44% 0.02%
- - - - - -
Note: Calculation of shares and holding rate includes the Preferred Stock。

Corporate Governance
96
9. Ownership of Investee Companies
December 31, 2017 Unit: Shares;%
Investee Companies Note
Invested by the Bank
(A)
Investments from Directors, Supervisors, Executive Officers and Directly or Indirectly Controlled Entities of
the Bank (B)
Total Investments (C=A+B)
Shares % Shares % Shares %
Union Finance Int’l (HK)Ltd. 30,000,000 99.999993% 2 0.000007% 30,000,002 100.00%
Union Information Technology Corp. 999,923 99.99% 0 0.00% 999,923 99.99%
Union Finance and Leasing Int’l Corp. 117,000,000 100.00% 0 0.00% 117,000,000 100.00%
Union Securities Investment Trust Corp. 10,500,000 35.00% 2,595,656 8.652% 13,095,656 43.65%
Union Real-Estate Management Corp. 2,000,000 40.00% 1,450,000 29.00% 3,450,000 69.00%
Taiwan Asset Management Corp. 7,500,000 0.57% 0 0.00% 7,500,000 0.57%
Li Yu Venture Corporation 606,804 4.76% 0 0.00% 606,804 4.76%
Taiwan Financial Asset Service Corp. 5,000,000 2.94% 0 0.00% 5,000,000 2.94%
Financial Information Service Co., Ltd. 12,497,985 2.39% 0 0.00% 12,497,985 2.39%
Fu Hua Venture Corporation 990,000 5.00% 0 0.00% 990,000 5.00%
Taiwan Depository & Clearing Corp. 899,441 0.25% 0 0.00% 899,441 0.25%
Taiwan Futures Exchange Co., Ltd. 6,421,799 2.04% 0 0.00% 6,421,799 2.04%
Taipei Forex Inc. 160,000 0.81% 0 0.00% 160,000 0.81%
Huan Hua Securities Finance Co. 2,102,512 0.53% 0 0.00% 2,102,512 0.53%
Lian An Service Corporation 125,000 5.00% 0 0.00% 125,000 5.00%
I-Pass Corporation 13,000,000 16.25% 0 0.00% 13,000,000 16.25%
Taipower Corporation 394,879 0.0012% 0 0.00% 394,879 0.0012%
Taiwan Mobile Payment Corporation 600,000 1% 0 0.00% 600,000 1%
Sunny Asset Management Co. 386,376 6.44% 0 0.00% 386,376 6.44%
Note : Investments made in accordance with Article 74 of the Banking Act.

Fund Raising Status
97
1. Capital and Shares (1) Sources of Capital
Date Issued Price
Authorized Capital Paid-in Capital Remark
Shares Amount ($) Shares Amount ($) Source of Capital Notes
Dec.1991
10 1 ,200 ,000 ,000 12 ,000 ,000 ,000 1 ,200 ,000 ,000 12 ,000 ,000 ,000
Th e pro moter s o f a co mp an y subscr ib ed shares fo r 9 ,600 ,000 ,000 Publ ic ly so l i c i t ing subsc r ip t ion to shares fo r 2 ,400 ,000 ,000
-
Ju l 1995
10 1 ,230 ,000 ,000 12 ,300 ,000 ,000 1 ,230 ,000 ,000 12 ,300 ,000 ,000 Capital Increase Via Return Earning
1
Ju l 1997
10 1 ,281 ,660 ,000 12 ,816 ,600 ,000 1 ,281 ,660 ,000 12 ,816 ,000 ,000 Capital Increase Via Return Earning
2
Ju l 1998
10 1 ,361 ,516 ,990 13 ,615 ,169 ,900 1 ,361 ,516 ,990 13 ,615 ,169 ,900 Capital Increase Via Return Earning
3
Ju l 1999
10 1 ,418 ,700 ,704 14 ,187 ,007 ,040 1 ,418 ,700 ,704 14 ,187 ,007 ,040 Capital Increase Via Return Earning
4
Ju l 2000
10 1 ,488 ,926 ,389 14 ,889 ,263 ,890 1 ,488 ,926 ,389 14 ,889 ,263 ,890 Capital Increase Via Return Earning
5
Mar 2005
10 2 ,488 ,926 ,389 24 ,889 ,263 ,890 1 ,788 ,926 ,389 17 ,889 ,263 ,890 Cash Capital Increase 6
Jun 2005
10 2 ,488 ,926 ,389 24 ,889 ,263 ,890 1 ,825 ,394 ,074 18 ,253 ,940 ,740 C.B. Con vers ion 7
Dec. 2006
10 2 ,488 ,926 ,389 24 ,889 ,263 ,890 1 ,827 ,797 ,807 18 ,277 ,978 ,070 C.B. Con vers ion 8
Mar 2007
10 2 ,488 ,926 ,389 24 ,889 ,263 ,890 1 ,828 ,066 ,183 18 ,280 ,661 ,830 C.B. Con vers ion 9
Sep 2007
10 3 ,000 ,000 ,000 30 ,000 ,000 ,000 2 ,228 ,066 ,183 22 ,280 ,661 ,830 Preferred Stocks of Private Placement
10
Sep 2007
10 3 ,000 ,000 ,000 30 ,000 ,000 ,000 2 ,318 ,824 ,429 23 ,188 ,244 ,290 C.B. Con vers ion 11
May 2010
10 3 ,000 ,000 ,000 30 ,000 ,000 ,000 1 ,753 ,661 ,989 17 ,536 ,619 ,890 Capi t a l r educt ion offset los s
12
Sep 2010
10 3 ,000 ,000 ,000 30 ,000 ,000 ,000 1 ,948 ,499 ,589 19 ,484 ,995 ,890 Capital Increase Via Amalgamation
13
Sep 2012
10 3 ,000 ,000 ,000 30 ,000 ,000 ,000 2 ,026 ,439 ,572 20 ,264 ,395 ,720 Capital Increase Via Return Earning
14
Au g 2013
10 3 ,000 ,000 ,000 30 ,000 ,000 ,000 2 ,216 ,525 ,121 22 ,165 ,251 ,210 Capital Increase Via Return Earning & Bonus Share
15
Au g 2014
10 3 ,000 ,000 ,000 30 ,000 ,000 ,000 2 ,450 ,930 ,628 24 ,509 ,306 ,280 Capital Increase Via Return Earning & Bonus Share
16
Sep 2015
10 3 ,000 ,000 ,000 30 ,000 ,000 ,000 2 ,605 ,152 ,427 26 ,051 ,524 ,270 Capital Increase Via Return Earning & Bonus Share
17
Oct 2017
50 4 ,500 ,000 ,000 45 ,000 ,000 ,000 2 ,805 ,152 ,427 28 ,051 ,524 ,270 Issuance of preferred stock by cash
18 ( revi sed in Ar t i c l es o f Associ a t ion)
Nots:1. According to Tai-Tsai-Zheng Tze (1) Letter No. 35096 issued by the Ministry of Finance on June 14, 1995.2. According to Tai-Tsai-Zheng Tze (1) Letter No. 44753 issued by the Ministry of Finance on June 6, 1997.3. According to Tai-Tsai-Zheng Tze (1) Letter No. 55074 issued by the Ministry of Finance on June 23, 1998. 4. According to Tai-Tsai-Zheng Tze (1) Letter No. 57967 issued by the Ministry of Finance on June 25, 1999.
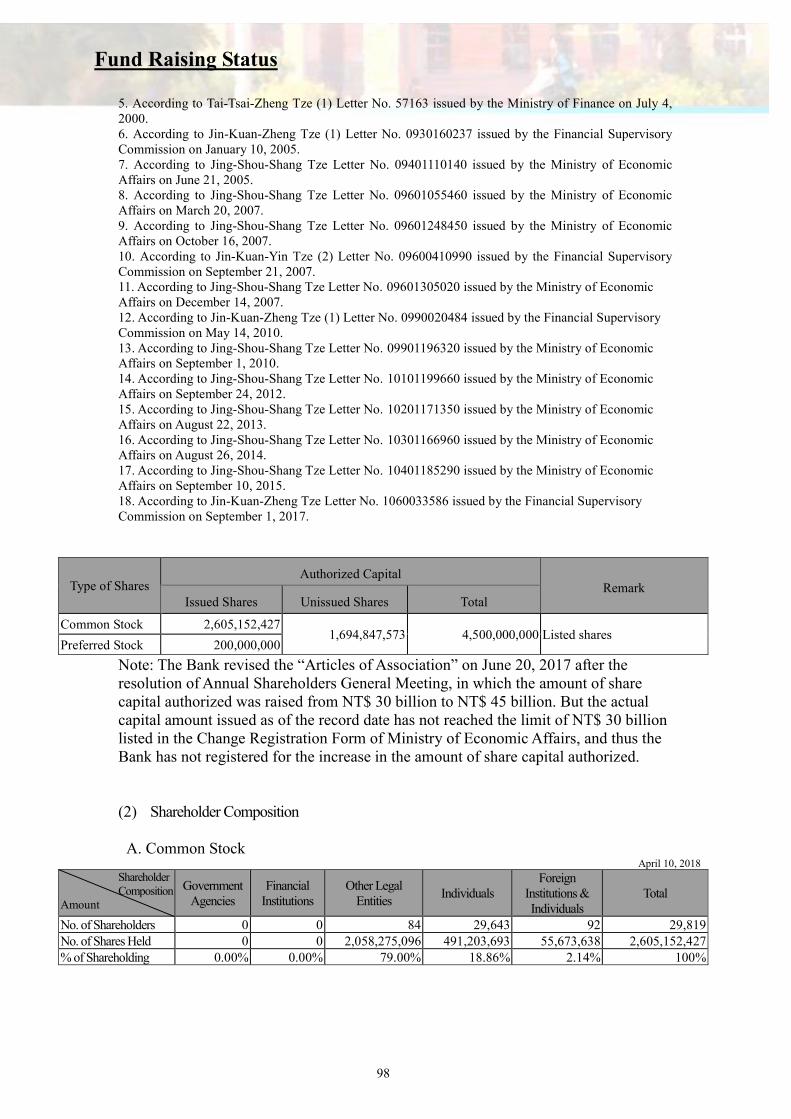
Fund Raising Status
98
5. According to Tai-Tsai-Zheng Tze (1) Letter No. 57163 issued by the Ministry of Finance on July 4, 2000. 6. According to Jin-Kuan-Zheng Tze (1) Letter No. 0930160237 issued by the Financial Supervisory Commission on January 10, 2005. 7. According to Jing-Shou-Shang Tze Letter No. 09401110140 issued by the Ministry of Economic Affairs on June 21, 2005. 8. According to Jing-Shou-Shang Tze Letter No. 09601055460 issued by the Ministry of Economic Affairs on March 20, 2007. 9. According to Jing-Shou-Shang Tze Letter No. 09601248450 issued by the Ministry of Economic Affairs on October 16, 2007. 10. According to Jin-Kuan-Yin Tze (2) Letter No. 09600410990 issued by the Financial Supervisory Commission on September 21, 2007. 11. According to Jing-Shou-Shang Tze Letter No. 09601305020 issued by the Ministry of Economic Affairs on December 14, 2007. 12. According to Jin-Kuan-Zheng Tze (1) Letter No. 0990020484 issued by the Financial Supervisory Commission on May 14, 2010. 13. According to Jing-Shou-Shang Tze Letter No. 09901196320 issued by the Ministry of Economic Affairs on September 1, 2010. 14. According to Jing-Shou-Shang Tze Letter No. 10101199660 issued by the Ministry of Economic Affairs on September 24, 2012. 15. According to Jing-Shou-Shang Tze Letter No. 10201171350 issued by the Ministry of Economic Affairs on August 22, 2013. 16. According to Jing-Shou-Shang Tze Letter No. 10301166960 issued by the Ministry of Economic Affairs on August 26, 2014. 17. According to Jing-Shou-Shang Tze Letter No. 10401185290 issued by the Ministry of Economic Affairs on September 10, 2015. 18. According to Jin-Kuan-Zheng Tze Letter No. 1060033586 issued by the Financial Supervisory Commission on September 1, 2017.
Type of Shares Authorized Capital
Remark Issued Shares Unissued Shares Total
Common Stock 2,605,152,427 1,694,847,573 4,500,000,000 Listed shares
Preferred Stock 200,000,000
Note: The Bank revised the “Articles of Association” on June 20, 2017 after the resolution of Annual Shareholders General Meeting, in which the amount of share capital authorized was raised from NT$ 30 billion to NT$ 45 billion. But the actual capital amount issued as of the record date has not reached the limit of NT$ 30 billion listed in the Change Registration Form of Ministry of Economic Affairs, and thus the Bank has not registered for the increase in the amount of share capital authorized. (2) Shareholder Composition A. Common Stock
April 10, 2018
Shareholder Composition
Amount
Government Agencies
Financial Institutions
Other Legal Entities
Individuals Foreign
Institutions & Individuals
Total
No. of Shareholders 0 0 84 29,643 92 29,819 No. of Shares Held 0 0 2,058,275,096 491,203,693 55,673,638 2,605,152,427 % of Shareholding 0.00% 0.00% 79.00% 18.86% 2.14% 100%

Fund Raising Status
99
B. Preferred Stock
April 10, 2018
Shareholder Composition
Amount
Government Agencies
Financial Institutions
Other Legal Entities
Individuals Foreign
Institutions & Individuals
Total
No. of Shareholders 0 4 102 12,586 3 12,695 No. of Shares Held 0 5,750,000 99,696,143 94,480,283 73,574 200,000,000 % of Shareholding 0.00% 2.87% 49.85% 47.24% 0.04% 100%
(3) Distribution of Shareholding
A. Common Stock
Par value per share NT$ 10; April 10, 2018
Class of Shareholding Number of Shareholders Shareholding (Shares) Shareholding (%)
1 ~ 999 12,224 3,031,795 0.12%
1,000 ~ 5,000 8,402 18,588,535 0.71%
5,001 ~ 10,000 2,928 20,924,664 0.80%
10,001 ~ 15,000 3,127 38,901,763 1.49%
15,001 ~ 20,000 587 10,476,957 0.40%
20,001 ~ 30,000 745 18,269,268 0.70%
30,001 ~ 50,000 556 21,712,573 0.84%
50,001 ~ 100,000 537 37,267,475 1.43%
100,001 ~ 200,000 334 45,624,263 1.75%
200,001 ~ 400,000 193 55,206,261 2.12%
400,001 ~ 600,000 66 33,094,590 1.27%
600,001 ~ 800,000 26 17,985,809 0.69%
800,001 ~ 1,000,000 15 13,454,102 0.52%
Over 1,000,001 79 2,270,614,372 87.16%
Total 29,819 2,605,152,427 100.00%
B. Preferred Stock Par value per share NT$ 50; April 10, 2018
Class of Shareholding Number of Shareholders Shareholding (Shares) Shareholding (%)
1 ~ 999 1,253 311,844 0.16%
1,000 ~ 5,000 9,239 12,070,347 6.04%
5,001 ~ 10,000 832 6,799,679 3.40%
10,001 ~ 15,000 191 2,415,197 1.21%
15,001 ~ 20,000 399 7,792,985 3.90%
20,001 ~ 30,000 127 3,338,209 1.67%
30,001 ~ 50,000 194 7,948,877 3.97%
50,001 ~ 100,000 226 17,917,460 8.96%
100,001 ~ 200,000 150 25,988,426 12.99%
200,001 ~ 400,000 33 10,886,156 5.44%
400,001 ~ 600,000 18 10,227,517 5.11%
600,001 ~ 800,000 4 2,853,000 1.43%
800,001 ~ 1,000,000 3 2,988,000 1.49%
Over 1,000,001 26 88,462,303 44.23%
Total 12,695 200,000,000 100.00%
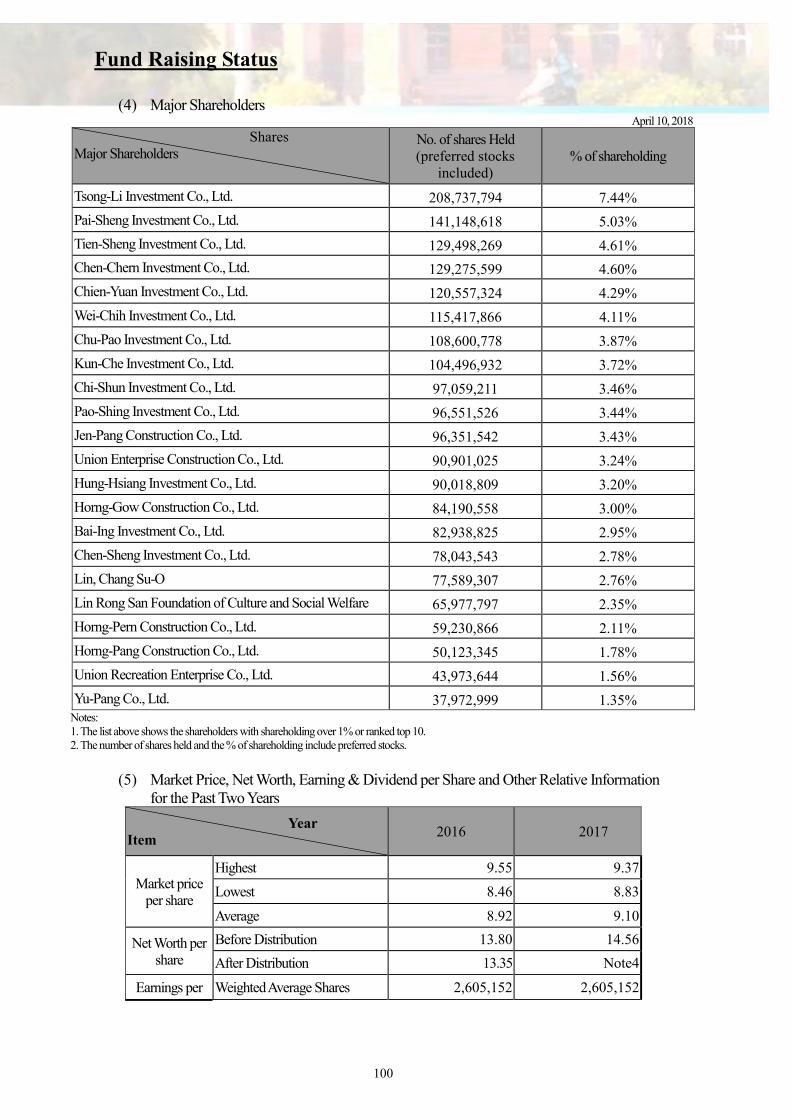
Fund Raising Status
100
(4) Major Shareholders April 10, 2018
Shares Major Shareholders
No. of shares Held (preferred stocks
included) % of shareholding
Tsong-Li Investment Co., Ltd. 208,737,794 7.44%
Pai-Sheng Investment Co., Ltd. 141,148,618 5.03%
Tien-Sheng Investment Co., Ltd. 129,498,269 4.61%
Chen-Chern Investment Co., Ltd. 129,275,599 4.60%
Chien-Yuan Investment Co., Ltd. 120,557,324 4.29%
Wei-Chih Investment Co., Ltd. 115,417,866 4.11%
Chu-Pao Investment Co., Ltd. 108,600,778 3.87%
Kun-Che Investment Co., Ltd. 104,496,932 3.72%
Chi-Shun Investment Co., Ltd. 97,059,211 3.46%
Pao-Shing Investment Co., Ltd. 96,551,526 3.44%
Jen-Pang Construction Co., Ltd. 96,351,542 3.43%
Union Enterprise Construction Co., Ltd. 90,901,025 3.24%
Hung-Hsiang Investment Co., Ltd. 90,018,809 3.20%
Horng-Gow Construction Co., Ltd. 84,190,558 3.00%
Bai-Ing Investment Co., Ltd. 82,938,825 2.95%
Chen-Sheng Investment Co., Ltd. 78,043,543 2.78%
Lin, Chang Su-O 77,589,307 2.76%
Lin Rong San Foundation of Culture and Social Welfare 65,977,797 2.35%
Horng-Pern Construction Co., Ltd. 59,230,866 2.11%
Horng-Pang Construction Co., Ltd. 50,123,345 1.78%
Union Recreation Enterprise Co., Ltd. 43,973,644 1.56%
Yu-Pang Co., Ltd. 37,972,999 1.35% Notes: 1. The list above shows the shareholders with shareholding over 1% or ranked top 10. 2. The number of shares held and the % of shareholding include preferred stocks.
(5) Market Price, Net Worth, Earning & Dividend per Share and Other Relative Information
for the Past Two Years
Year Item
2016 2017
Market price per share
Highest 9.55 9.37
Lowest 8.46 8.83
Average 8.92 9.10
Net Worth per share
Before Distribution 13.80 14.56
After Distribution 13.35 Note4
Earnings per Weighted Average Shares 2,605,152 2,605,152

Fund Raising Status
101
Year Item
2016 2017
share Earning Per Share(NT$) 1.01 1.05
Dividend per share
Cash Dividends 0.45 0.40 (Note 4)
Stock Dividends
Dividends from retained earning
0.3
Dividends from capital reserve
-
Accumulated Dividends - -
Return on investments
Price/Earning RatioNote1 8.83 8.67
Price/Dividend Ratio Note2 19.82 22.75
Cash dividends yield rate Note3 5.04% 4.40%
Notes: 1. P/E ratio= Average closing share price for the current fiscal year/ earnings per share. 2. P/D ratio= Average closing share price for the current fiscal year/ cash dividends per share. 3. Cash dividend yield to maturity= Cash dividends per share/ average closing share price for the current fiscal year. 4. The distribution of 2017 earnings will be confirmed when it is passed by a resolution at the 2018
Shareholders’ Meeting. 5. Net worth per share and earnings per share have been audited by independent auditors.
(6) Dividend Policy and Implementation A. Dividend policy set out in the Bank’s Articles of Incorporation:
If there are earnings, they shall first be used to make tax payments and offset against prior year losses and 30% of the remaining, if any, shall be set aside as a legal reserve. The Bank may, according to regulatory requirements and business needs, set aside or reverse a special reserve and distribute the remaining balance plus unappropriated earnings from the previous year in the form of preferred stock dividends. The types and percentage in cash and shares of the dividends and bonuses distributed are decided by the Board of Directors based on current financial condition, future profitability and the Bank’s capital budget planning. In principle, the Bank may distribute stock dividends if, after the distribution of the dividends, the ratio of the Bank’s core capital as a percentage of risk-based assets is less than the statutorily required ratio plus one percent point. However, the maximum cash profits which may be distributed shall not exceed fifteen percent (15%) of the Bank's paid-in capital unless and until the accumulated legal reserve equals the Bank's paid-in capital.
B. Proposal for dividend distribution for the current year:
The Board of Directors resolved in the meeting held on March 14, 2018 to approve the earnings distribution proposal for 2017 as follows: cash dividends on preferred stocks are NT$ 0.45369863 per share (based on the 69 days of shares outstanding in 2017 and the dividend rate of 4.8%); cash dividends on common shares are NT$ 0.40 per share and stock dividends on common shares are NT$ 0.30. The actual earnings per share distributed described above may be adjusted by the Board of

Fund Raising Status
102
Directors based on the number of outstanding shares as recorded in the common shareholders’ register on the record date.
(7) Impact on the bank’s Operations Results and Earning per Share resulting from the Proposal for Stock Dividend Distribution
Item Year Year2018
(Forecast) Beginning Paid-In Capital Common shares:
26,051,524,000 NT $ Preferred stocks: 2,000,000,000 NT$
Stock and Cash Dividend in this Year
Cash Dividend per share Preferred stocks: 0.45369863 NTdollars per share
Common shares: 0.40 NTdollars
per share Capitalization of Retained Earnings Stock Dividend per share
0.03 shares per share (common shares)
Capitalization of Capital Reserves Stock Dividend per share
None
Operation Result Changes
Operating Profit Not Applicable (Note) Ratio of Increase (Decrease) in Operating Profit
Compared to the same period last year Net Profit after Tax Ratio of Increase (Decrease) in After Tax Net Profit Compared to the same period last year Earnings per Share (NT$) Ratio of Increase (Decrease) in Earnings per share Compared to the same period last year Annual Average Return on Investment (Reciprocal of Annual Average Price/Earnings Ratio)
Pro forma Earnings per Share and P/E
Ratio
If Capitalization of Surplus is all changed to the Issuance of Cash Dividend
Pro forma earnings per share (NT$) Pro forma annual average return on investment
If Capitalization of Capital Reserve in not conducted.
Pro forma earnings per share (NT$) Pro forma annual average return on investment
If Capitalization of Capital Reserve is not conducted and Capitalization of Surplus is all changed to the Issuance of Cash Dividend
Pro forma earnings per share (NT$) Pro forma annual average return on investment
Note: The Bank has not published the financial forecasts for the 2018 fiscal year. According to Tai-Tsai-Zheng Tze (1) Letter No. 00371 issued by the Ministry of Finance on February 1, 2000, companies that have not published their financial forecasts are not required to disclose this information.
(8) Employees’ Bonus and Directors’ & Supervisors’ Remuneration A. The percentages or ranges with respect to employee bonuses and
director/supervisors’ remuneration, as set forth in the Bank’s Articles of Incorporation: a. Employees’ remuneration: Between 1% and 5% of net profit; where employees’ remuneration is paid in shares, the beneficiaries may include

Fund Raising Status
103
employees of subordinated companies that satisfy certain criteria. These criteria shall be determined by the board of directors.
b. Directors’ remuneration: No more than 0.1% of net profit. The board of directors is authorized to change the rules of employees’ and directors’ remuneration described above. In any case, however, profits must first be taken to offset against cumulative losses, if any, before the remainder can be distributed as employees’ and directors’ remuneration according to the above percentages.
B. If the estimated bonus to employees and remuneration to directors and
supervisors, differ from the actual amounts subsequently resolved by the stockholders meeting the differences are to be recorded the profit (loss) of the year as result of a change in accounting estimate.
C. The proposals to distribute remuneration approved by the Board of Directors are as follows: (1) Employees’ and directors’ remuneration distributed by cash or stocks: The Bank’s Board of Directors resolved on March 14, 2018 to distribute the employees’ remuneration and directors’ remuneration in 2017 totaling NT$ 62,163,553 and NT$ 3,040,609, respectively. The employees’ remuneration will be distributed in stocks and calculated based on the Bank’s common stock closing price of NT$ 9.27 on March, which are 6,705,884 shares in total with face value of NT$ 10 per share (the remaining remuneration of NT$ 8.32 that is not enough for one share will be distributed by cash); the remuneration for directors are all distributed by cash. The amounts mentioned above have no difference with that estimated in the year of expense recognition.
(2) The ratio of the employees’ stock remuneration to the after-tax income in the individual financial report for the current period and the total amount of employees’ remuneration: 2.21%.
D. Actual employees’, directors’, and supervisors’ remuneration in the previous year: Unit: NTD
Amount proposed and passed by the board
Amount actually paid Difference Remarks
Employees’ remuneration
60,601,611 60,601,611 -
Directors’ and supervisors’ remuneration
2,964,209 2,964,209
-
Total 63,565,820 63,565,820 -
Note: The above-mentioned amount will be paid entirely in cash.
(9) Share Repurchases by the bank: None
2. Issuance of Financial Debentures
Type of Financial
Debentures
1st Subordinated Financial
Debentures issued in 2011
1st Subordinated Financial
Debentures issued in 2012
1st Subordinated Financial
Debentures issued in 2013
1st Subordinated Financial
Debentures issued in 2015
1st Perpetual Non-Cumulated
Subordinated Financial
Debentures issued in 2016
1st Perpetual Non-Cumulated
Subordinated Financial
Debentures issued in 2017

Fund Raising Status
104
Type of Financial
Debentures
1st Subordinated Financial
Debentures issued in 2011
1st Subordinated Financial
Debentures issued in 2012
1st Subordinated Financial
Debentures issued in 2013
1st Subordinated Financial
Debentures issued in 2015
1st Perpetual Non-Cumulated
Subordinated Financial
Debentures issued in 2016
1st Perpetual Non-Cumulated
Subordinated Financial
Debentures issued in 2017
Date & No. Approved by Central Competent Authority
Jin-Kuan-Yin-Kuo-Zi-No.
10000158270 May 12, 2011
Jin-Kuan-Yin-Kuo-Zi-No.
10000387590 Nov. 8, 2011
Jin-Kuan-Yin-Kuo-Zi-No.
10200321780 Nov.20, 2013
Jin-Kuan-Yin-Kuo-Zi-No.
10400055530 Apr.1 , 2015
Jin-Kuan-Yin-Kuo
-Zi-No. 10500034480 Feb.24, 2016
Jin-Kuan-Yin-Kuo
-Zi-No. 10500034480 Feb.24, 2016
Issuing Date Jun. 15, 2011 Mar. 1, 2012 Dec 19, 2013 Apr 22, 2015 March 29,2016 March 23,2017
Face Value 1,000,000 1,000,000 1,000,000 1,000,000 1,000,000 1,000,000
Issuance/ Trade Place Domestic Domestic Domestic Domestic Domestic Domestic Currency NTD NTD NTD NTD NTD NTD
Issuance Price Issued at par Issued at par Issued at par Issued at par Issued at par Issued at par
Issuance Amount 2 billion 1.5 billion 3 billion 2.2 billion 2.5 billion 0.5 billion
Interest Rate 2.78%, fixed rate 2.32%, fixed rate 2.10%, fixed rate 2.08%, fixed rate 4.2%, fixed rate 4.2%, fixed rate
Term Maturity Date: Jun. 15, 2018
Maturity Date: Mar. 1, 2019
Maturity Date: Dec 19, 2020
Maturity Date: Apr 22, 2022
Perpetual Perpetual
Order of Redemption Subordinate Subordinate Subordinate Subordinate Subordinate Subordinate
Guarantor Nil Nil Nil Nil Nil Nil
Trustee Nil Nil Nil Nil Nil Nil
Underwriter Nil Nil Nil Nil Nil Nil
Auditor S.S. Lai S.S. Lai S.S. Lai S.S. Lai S.S. Lai S.S. Lai
CPA Deloitte & Touche (Terence Huang/ Jih-Yen Chang)
Deloitte & Touche (Terence Huang/ Jih-Yen Chang)
Deloitte & Touche (Terence Huang/ Jih-Yen Chang)
Deloitte & Touche (Terence Huang/ Vincent Cheng)
Deloitte & Touche (Vincent Cheng)
Deloitte & Touche (Vincent Cheng)
Certifying Financial
Institution “Book-Entry” “Book-Entry” “Book-Entry” “Book-Entry”
“Book-Entry”
“Book-Entry”
Method of Redemption
Repaid in full upon maturity
Repaid in full upon maturity
Repaid in full upon maturity
Repaid in full upon maturity
Refer to the terms of redemption or advance payment
for details.
Refer to the terms of redemption or advance payment
for details.
Unredeemed Balance 2 billion 1.5 billion 3 billion 2.2 billion 2.5 billion 0.5 billion
Paid-in Capital For the Previous Fiscal
Year 19.48 billion 19.48billion 20.26billion 24.51billion 26.05billion 26.05billion
After-tax Net Worth for the Previous
Fiscal Year 20.09 billion 21.97 billion 24.07 billion 32.38 billion 34.89 billion 35.95 billion
Performance Normal Normal Normal Normal Normal Normal
Redemption or Early Redemption
Nil Nil Nil Nil
Early redemption clause: After 5.1 years upon the
expiration of the issuance of the bonds, if
the ratio of capital to risk-based assets after calculation meets the
minimum requirements set by the Competent
Authority, the Bank may apply for redemption
Early redemption clause: After 5.1 years upon the
expiration of the issuance of the bonds, if
the ratio of capital to risk-based assets after calculation meets the
minimum requirements set by the Competent
Authority, the Bank may apply for redemption
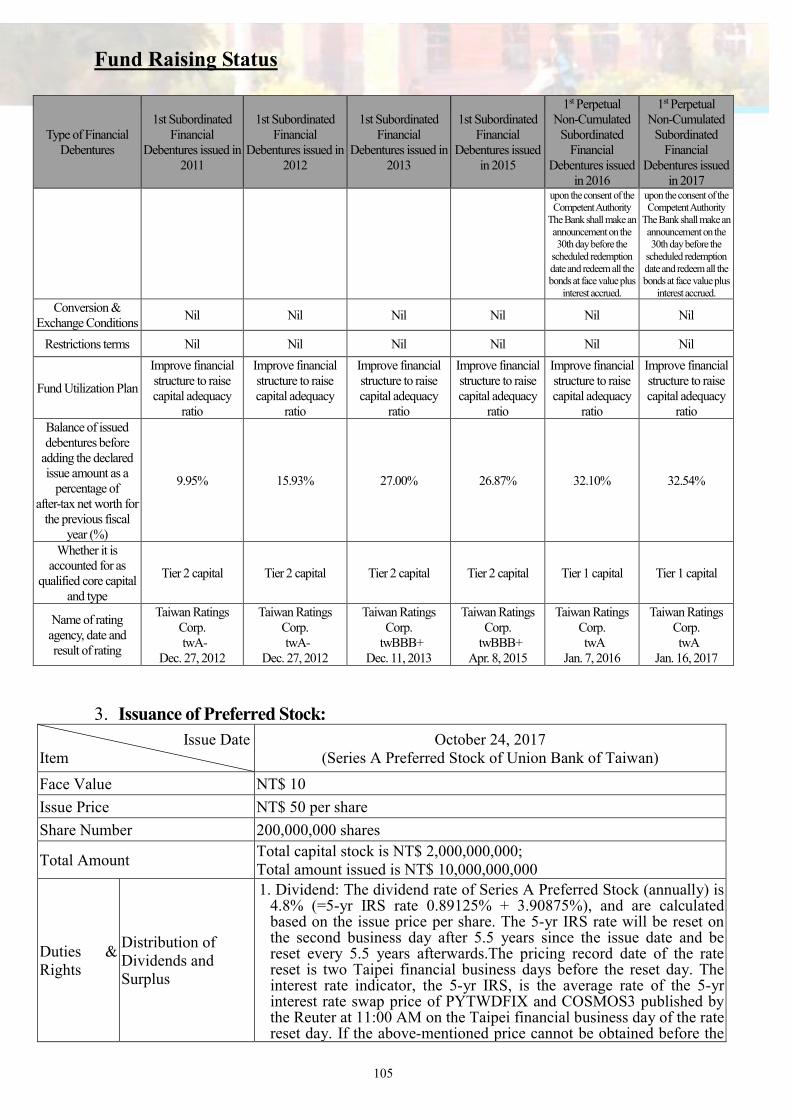
Fund Raising Status
105
Type of Financial
Debentures
1st Subordinated Financial
Debentures issued in 2011
1st Subordinated Financial
Debentures issued in 2012
1st Subordinated Financial
Debentures issued in 2013
1st Subordinated Financial
Debentures issued in 2015
1st Perpetual Non-Cumulated
Subordinated Financial
Debentures issued in 2016
1st Perpetual Non-Cumulated
Subordinated Financial
Debentures issued in 2017
upon the consent of the Competent Authority
The Bank shall make an announcement on the 30th day before the
scheduled redemption date and redeem all the bonds at face value plus
interest accrued.
upon the consent of the Competent Authority
The Bank shall make an announcement on the 30th day before the
scheduled redemption date and redeem all the bonds at face value plus
interest accrued.
Conversion & Exchange Conditions
Nil Nil Nil Nil Nil Nil
Restrictions terms Nil Nil Nil Nil Nil Nil
Fund Utilization Plan
Improve financial structure to raise capital adequacy
ratio
Improve financial structure to raise capital adequacy
ratio
Improve financial structure to raise capital adequacy
ratio
Improve financial structure to raise capital adequacy
ratio
Improve financial structure to raise capital adequacy
ratio
Improve financial structure to raise capital adequacy
ratio Balance of issued debentures before
adding the declared issue amount as a
percentage of after-tax net worth for
the previous fiscal year (%)
9.95% 15.93% 27.00% 26.87% 32.10% 32.54%
Whether it is accounted for as
qualified core capital and type
Tier 2 capital Tier 2 capital Tier 2 capital Tier 2 capital Tier 1 capital Tier 1 capital
Name of rating agency, date and result of rating
Taiwan Ratings Corp. twA-
Dec. 27, 2012
Taiwan Ratings Corp. twA-
Dec. 27, 2012
Taiwan Ratings Corp.
twBBB+ Dec. 11, 2013
Taiwan Ratings Corp.
twBBB+ Apr. 8, 2015
Taiwan Ratings Corp. twA
Jan. 7, 2016
Taiwan Ratings Corp. twA
Jan. 16, 2017
3. Issuance of Preferred Stock:
Issue Date Item
October 24, 2017 (Series A Preferred Stock of Union Bank of Taiwan)
Face Value NT$ 10
Issue Price NT$ 50 per share
Share Number 200,000,000 shares
Total Amount Total capital stock is NT$ 2,000,000,000; Total amount issued is NT$ 10,000,000,000
Duties & Rights
Distribution of Dividends and Surplus
1. Dividend: The dividend rate of Series A Preferred Stock (annually) is 4.8% (=5-yr IRS rate 0.89125% + 3.90875%), and are calculated based on the issue price per share. The 5-yr IRS rate will be reset on the second business day after 5.5 years since the issue date and be reset every 5.5 years afterwards.The pricing record date of the rate reset is two Taipei financial business days before the reset day. The interest rate indicator, the 5-yr IRS, is the average rate of the 5-yr interest rate swap price of PYTWDFIX and COSMOS3 published by the Reuter at 11:00 AM on the Taipei financial business day of the rate reset day. If the above-mentioned price cannot be obtained before the

Fund Raising Status
106
rate reset day, the rate will be decided by the Bank at the market price and based on the principle of good faith.
2. Dividend distribution: If there are earnings left in the Bank’s annual resolution, in addition to the required payment of income tax, the Bank shall first offset the losses in the previous years, recognize legal reserve and recognize or reverse special reserve, and then may distribute the regulated dividends to the preferred stocks based on the earnings balance with priority. The Bank reserves the discretion right on the dividend distribution of preferred stocks. However, if there are no earnings or not enough earnings for distribution in the Bank’s annual resolution, or if the dividend distribution of the preferred stock will cause the Bank’s capital adequacy ratio to be lower than the requirement of laws or the minimum limit regulated by the competent authority, or if there is other necessary consideration, the Bank may decide not to distribute the dividends of preferred stocks. The shareholders of the preferred stock shall not have other opinions. The dividends decided not to be distributed or are distributed inadequately will also not accumulated as the future payment in years with earnings. The dividends of Series A Preferred Stock are distributed by cash one time annually. The distributable dividends for the previous year and the record date of payment are decided by the Board of Directors after the ratification of financial reports by the Annual Shareholders General Meeting. The distributed amount in the issue year and call year is calculated based on the actual issue days in the year. The dividends distributed will be recorded in the dividend certificate.
3. Excess dividend distribution: The shareholders of Series A Preferred Stock shall not participate in the cash and capital distribution of earnings and capital surplus in common stock, except for the regulated dividend rate mentioned above.
Distribution of Residual Property
The order the shareholders of Series A Preferred Stock in distributing the Bank’s residual property is former than that of the shareholders of common stocks and is the same with the shareholders of the Bank’s other preferred stocks; except when the Bank is taken over by the competent authority, required to stop business for clearing and liquidation in accordance with “Regulations Governing the Capital Adequacy and Capital Category of Banks”, the distribution order of the shareholders of Series A Preferred Stock is the same with that of the common stock shareholders. However, their order is inferior to the holders of Tier 2 capital tools, depositors and the general debtholders, and the dividend amount shall not exceed the issue amount.
Execution of Voting Right
The shareholders of Series A Preferred Stock have no voting rights and election rights, but have voting rights on the preferred stock shareholders meetings or when there are circumstances in which their duties and rights are involved.
Others
There is no maturity date for the Banks’ Series A Preferred Stock. When the Bank issued new stocks by cash, the shareholders of Series A Preferred Stock have the same stock option right with common stock shareholders.
Outstanding Preferred Stock
Amount called or converted
NT$ 0
Balance not called or converted
NT$ 2,000,000,000
Terms of call and convert
1. The shareholders of Series A Preferred Stock shall not convert the preferred stocks into common stocks, and have no rights in asking the Banks to call back the Series A Preferred Stock they hold.
2. The Bank may call all or part of the preferred stocks at the original issue price anytime under approval of the competent authority on the

Fund Raising Status
107
second day after 5.5 years of the issuance. The preferred stocks not called still satisfy the duties and rights mentioned above. If the Bank’s shareholders meeting decides to distribute dividends in the year that Series A Preferred Stock is called, then the dividends that should be distributed until the call day are calculated based on the actual issue days in that year.
Market Price per Share
2017
Highest 50.80
Lowest 49.95
Average 50.22
As of March 31, 2018
Highest 51.00
Lowest 49.85
Average 50.21
Other rights attached
Amount converted or bought as of the date Annual Report is printed
The shareholders of Series A Preferred Stock shall not convert the preferred stocks into common stocks.
Guidelines for issuance and convert or buying
None
Effect of issue terms on the right of shareholders; circumstances that equity may be diluted and the effect on existing shareholders’ right
None
Impact of callable preferred stocks on capital to risk-weighted asset ratio
Not applicable
4. The status of Overseas Depository Receipts and Employee Stock Option: None
5. Acquisitions or Disposition of Other Financial Institutions (1) Where the bank has acquired another financial institution through merger or
acquisition in the most recent fiscal year, the annual report shall disclose the CPA’s opinion on the reasonableness of the share swap ratio: None.
(2) Mergers or acquisitions of other financial institutions in the past five years:None. (3) Where the Board of Directors has, during the most recent fiscal year or the
current fiscal year up to the date of printing of annual report, adopted a resolution approving issuance of new shares due to merger or acquisition of shares of another financial institution, the annual report shall disclose the state of implementation and the basic information of the institution merged or acquired: None.
6. Fund Utilization Plan and Execution Status 1. Fund Utilization Plan
A. Description of the plan: Please see the pages for details of previous public issues or private placement of securities and bank debentures.

Fund Raising Status
108
B. Uncompleted previous public issues or private placement of securities, or those completed in the most recent three years but have not yet fully yielded the planned benefits: None.
2. Execution Status Status of implementation: There are no circumstances that the execution progress or benefits do not meet the expected goal.

Operational Highlights
109
1. Business Description (1) Main Businesses
A. Primary Business Activities of the Respective Business Units a. To accept all types of deposits. b. To extend corporate loans, discount bills and notes, issue domestic letters of
credit and conduct accounts receivable factoring. c. To handle exports, imports, foreign remittances, foreign currency loans and
guarantees. d. To extend mortgage, auto loans, personal loans and other consumer credits, and
provide credit card services. e. Wealth management, trust, custodian business, safe-deposit box rental and
certification services for marketable securities. f. To extend the insurance agency business and property insurance business. g. To trade marketable securities and futures on behalf of customers. h. To provide peripheral financial services by acting as collecting and paying
agent for public facilities fees, taxes and remittances. i. To conduct other relevant businesses authorized by the competent authorities.
B. Operational Highlight a. Deposits: NTD and foreign currencies (including OBU), deposits from
peers, and deposits from Chunghwa Post)
Amount: NT$ Million
Type December 31, 2017 December 31, 2016 Comparison
Amount Ratio Amount Ratio Increase
(Decrease) Growth Rate%
Current Deposit 205,330 45.56% 192,749 44.48% 12,581 6.53%
Time Deposit 245,310 54.44% 240,632 55.52% 4,678 1.94%
Total 450,640 100% 433,381 100% 17,259 3.98%
b. Loans
Amount: NT$ Million
Type December 31, 2017 December 31, 2016 Comparison
Amount Ratio Amount Ratio Increase
(Decrease) Growth Rate%
Consumer Banking 168,810 52.47% 155,028 54.01% 13,782 8.89%
Corporate Banking 152,930 47.53% 132,008 45.99% 20,922 15.85%
Total 321,740 100% 287,036 100% 34,704 12.09%
c. Foreign Exchange
Amount: US$ Million
Type December 31, 2017 December 31, 2016 Comparison
Amount Ratio Amount Ratio Increase
(decrease) Growth Rate%
Exports 93 1.15% 106 1.3% (13) (12.26%)
Imports 373 4.63% 258 3.3% 115 44.57% Foreign Remittances
7,591 94.22% 7,528 95.4% 63 0.84%
Total 8,057 100% 7,892 100% 165 2.09%

Operational Highlights
110
d. Trust & Wealth Management Amount: NT$ Million
Type December 31, 2017 December 31, 2016 Comparison
Amount Amount Increase
(decrease) Growth Rate%
Trust
Non-discretionary Money Trust Invested in Securities 39,353 38,184 1,169 3.06%
Fund Custody Business 10,430 7,189 3,241 45.08%
General Trusts 18,502 14,602 3,900 26.71%
Ancillary Service Other Custody Business 5,113 4,194 919 21.91%
Total 73,398 64,169 9,229 14.38
e. Credit Card Business
Unit: NT$ Million;Card
Item
December 31, 2017
December 31, 2016
Comparison
Amount / Card Amount / Card Increase (Decrease) Growth Rate%
Card in New Issue 300,075 471,514 (171,439) (36.36%)
Cards in Circulation 2,036,860 2,015,520 21,340 1.06%
Valid cards 1,152,629 1,083,892 68,737 6.34%
Credit Amount 85,760 76,984 8,776 11.40%
Cash Advance Amount 805 1,299 (494) (38.03%)
Accounts Receivables 14,783 14,164 619 4.37%
Revolving Credit Balance 5,439 4,908 531 10.82%
Sales Amount 56,873 53,022 3,851 7.26%
f. Revenue and Percentage by Business
Item % of Total Revenue 2017 % of Total Revenue 2016 Changes (%)
Corporate Banking 13.75% 18.25% (4.50%)
Consumer Banking 34.28% 31.69% 2.59%
Trust &Wealth Management 9.21% 11.08% (1.87%)
Investment Banking 21.50% 20.49% 1.01%
Other 21.26% 18.49% 2.77%
Total 100.00% 100.00% -
(2) Business Plan for 2018
A. Deposit Business (1) In response of the trend of digital payment, the Bank plans to strengthen the functions of VISA debit card and account (e.g., EasyCard A/C LINK, and Apple Pay Debit Card) to provide depositors with multi-dimensional payment tools.

Operational Highlights
111
(2) Strengthen the functions of ATM (interbank deposit and iPASS certificate saving function, etc.) to provide customers with a variety of service; continue holding marketing campaigns for VISA debit card to increase customers’ loyalty and demand deposits. (3) Arrange for deposit campaigns for target customers to attract demand deposits and new customers.
B. Loan Business
a. Corporate Banking
- Anticipate trends of the local real estate market and adjust in line with
the authority’s policies, underwrite real estate loan with caution and
make every endeavor to develop SME loans to disperse risk.
- Under the circumstance and risk and income are attended to
simultaneously, give priority to make loans of self-liquidating nature
and loans to manufacturing plants based in Taiwan, and take advantage
of applying for credit guarantee fund and seeking for good quality
collateral to enhance the loan security
- Enhance post-lending; report abnormal customer behaviors and take
collection actions early for better control of overdue loans.
b. Consumer Banking
Steady expansion of the mortgage business for qualified owners of
self-use real property with repayment capacity, with focuses on better
subprime objects as collateral.
c. Bills Finance
Actively expand the sources of bills and strictly control credit risk of
underwriting customer; improve trading turnover rate and the
underwriting market share to create maximum profit.
Flexibly adjust value at risk according to market trends and at the same
time develop new RP clients that constitute a more stable source and
less costly funds. d. Consumer Credit - Adopt segment marketing and design loan packages for different
customer segments. - Apply intensive training on sales talents and managers with the goal of improving professional knowledge and sales skills.
- Enhance management over credit quality and overdue loans.
C. Foreign Exchange Business
a. Continue to expand the sources of foreign exchange businesses.
Expand imports, exports and foreign exchange businesses to increase
the Bank’s market share in the foreign exchange market.
b. Continue to expand international financial investment business to make
the most effective use of funds and improve revenue.
D. Trust and Wealth Management Business
a. Automate service operations; provide strong back-end support to
wealth management and satisfy customers’ demands for simplicity,
security, legitimacy, and efficiency.

Operational Highlights
112
b. Develop new trust business and strengthen the control functions of
trust operation system.
c. Collaborate across departments and industries to promote trust services
in terms of fee revenues and market share.
d. Facing the upcoming era of high age and low birth rate, the Bank will
follow the government’s policy in continuously promoting insurance
products of secured, pension and medical types to satisfy customers’
needs of insurance and wealth management in each stage of life.
e. Actively expand the custodian business and strengthen the control
functions of individual trust and custodian operating system.
f. Aggressively seek to take up the old and new fund custody business,
and strengthen the control functions of personal trust and custody
operation system.
g. Introduce the program of variable-amount subscription to a fund
through a regular saving plan to promote stable growth in customers’
asset portfolios.
h. Enhance the launching of marketing and promotional campaigns.
Provide differentiated services to different target groups. Introduce
diverse products (such as: foreign bonds, ETF, structured notes,
guaranteed issue life insurance and in-kind benefits/services policies,
and etc.) to increase the diversity of the asset portfolio of wealth
management clients and increase the size of assets managed by the
Bank.
i. Continue to recruit new wealth management staff and provide training
to bank employees to serve in the capacity as wealth management
advisors. The long-term goal is to expand the size of the wealth
management team to enhance the development of effective clients and
hence the Bank’s share of the wealth management market.
E. Credit Card
a. Channels: Encourage branch employees to promote credit cards to
increase the opportunities for cross selling; issue co-brand cards with
known brands and participating in their marketing campaigns, the Bank
will also take initiative in developing partnership with brands whose
existing co-brand relationships are about to expire, and therefore gain
quick access to new customer groups. In the meantime, the Bank will
simplify its application procedures and make services accessible over
the Internet and cell-phones, and provide customers with greater
incentives to apply for credit cards.
b. Products: Launch credit cards that feature functionalities of other
electronic cards, and thereby attract usage through convenience. Extend
exclusive privileges for top-tier cardholders as a means to attract
high-quality customers; follow the market of mobile payment in
arranging various payment promoting campaigns to attract the new
mobile generation.

Operational Highlights
113
c. Campaign: Continue the “2% cash reward on even-number days” to
cultivate the habit of using Union Bank credit cards for purchase and
upgrade the market shares of debit amount and wallet; as mobile
payment is becoming more and more applicable, the Bank will also
cooperate with real stores in holding credit card promoting campaigns
to increase the loading rate of mobile payment and keep track of
customers’ consumption behavior via online network; small-amount
payment can actively help the credit card market in expanding to more
consumption channels, such as MacDonald’s, KFC, Hi-Life and
FamilyMart, which can increase the overall credit card payment.
d. Credit loan: Arrange for various small loan projects to provide
customers with multiple choices; provide service of online loan
application and simplify the process; increase the percentage of
high-quality customers in the name list management to increase the
operating volume of small loans.
e. Credit card acquiring business
- Extend collection services in medium and large stores and chain stores,
and increase the percentage of cooperative restaurants; reinforce
promotional activities (discount and bonus redemption) for own-bank
cardholders, and promote installment plans to increase the amount of
payments by own-bank cards and income from service fees.
- Promote co-development of acquiring and bank-related services with
branches to increase the benefits of acquiring-related services and
thereby raise the income of the entire bank.
F. Ensure effective management of funds available to the Bank. Effectively
utilize funds in line with the various business development initiatives to
increase the Bank’s returns. We also maintain an appropriate level of liquid
funds to ensure that the Bank has a sound liquidity level. For TMU business,
besides continuing to service existing clients and offering them with
real-time financial market information and products, we also aims at
developing new clientele to increase the Bank’s business turnovers in
deposits, loans and foreign exchange business.
(3) Market Analysis
A. Areas of Business Operation As of the end of March 2018, the Bank has 90 domestic branches of which 47 branches in Greater Taipei area, 18 branches in Taoyuan and Hsin-Chu area, 10 branches in Taichung and Changhua area, 7 branches in Chiayi and Tainan area and 8 branches in Kaohsiung and Pingtung area. Additionally, there is an Offshore Banking Branch, and each one Representative Office in Vietnam and Hong Kong respectively.
B. Analysis of Supply/Demand and Growth in Future Market

Operational Highlights
114
The domestic banking industry is in the thriving state in 2018. The main
reason is that the global economy is booming and the FSC is continuously
amending regulations to enhance the competitiveness of domestic banking
industry in expanding business overseas. These all help the lending and
wealth management business domestically and abroad grow. Thus, even
though the devotion to information safety, risk control and financial
technology increases costs, the banking industry is still expected to benefit
from the growth of each business.
The lending structure of domestic banking industry is mainly based on
business loans, and focus much on large syndicate loans and the control
over the financing business opportunities brought by the infrastructure
strengthened by the government. Meanwhile, in addition to the existing
lending customers, the Bank will gradually pay attention to the financing
needs of other emerging industries, such as the cultural, green-energy,
sport-economics, and smart healthcare industry. These not only bring new
motivation to our lending business but also provide a chance for us to
cooperate with different industries via financing to seize the business
opportunities in those industries.
C. Competitive Niches and Advantages/Disadvantages Relating to
Development Prospects and Responsive Measures a、 Advantages i. The prediction of the improving global economic growth of 2018 is
beneficial to business’s demand and the market’s investment, which motivates the lending and wealth management business of domestic banking industry and increase profitability.
ii. With the assistance by the government, domestic banking industry is less restricted by the domestic regulations when expanding oversea to the New Southbound market, which will help them focus on the operating challenges in different countries.
iii. With policies promoted, regulations being loosened, and information safety improving, people’s acceptance increasing, and the collaboration between financial firms and the technology industry deepening, the product innovation ability and the market development of financial technology of domestic banking industry can improve. New business opportunities and new customers will also be brought to the banking firms.
iv. The stability of global economy, raised interest rate and shrunk balance sheet of the US FED will help the globe in terminating the low interest rate environment and gently moving upward. Besides, domestic interest rate is expected to remain stable, which will help the interest rate spread of domestic banking industry to go up.

Operational Highlights
115
b、 Disadvantages i. In 2018 the banking industry will continue to enhance the ability of
professionals in anti-money laundering and preventing financing terrorism, expand responsive departments, improve equipment and systems. These will all increase the Bank’s expenditure significantly.
ii. When domestic banking industry is actively expanding oversea market and financial technology market, the business mode is gradually changing. In the development of the New Southbound Policy, the discrepancy between each country’s tradition and culture is getting larger and larger, and the needs for financial technology innovation and development is becoming higher. Furthermore, the importance of information safety and risk control is continuously increasing, which deepens the needs of relevant talents in domestic banking industry. However, as the speed of new human resource injected is slower than that of the outflows of domestic talents to Mainland China and other oversea markets, the problem of human resource training and scarcity still exists.
iii. Mainland China is continuously adjusting its economic and industry structure. The risk of high-level corporate debts and house price growth is still going upward. The local business credit structure in China may be weakened and thus the quality of the assets held by domestic banking industry in China may be worsened.
c、 Responsive Measures i. As the FSC mandated regulations related to the banking industry’s
legal compliance, anti-money laundering and battling financing terrorism, the banking industry will be able to fasten its step in the legal compliance to meet the demand of international financial market. Although in the short run, employee training and organization change increase the costs significantly, in the long run, domestic banking industry will be more competitive in internationalization, which will help domestic banking industry in the long-term development of oversea expanding.
ii. In 2018 domestic banking industry will focus more on the combination of financial service, broadband network, information platform and marketing channel. With the gradually-improved risk control and information safety environment, the faster collaboration with different industries, and providing individual and business customers with more convenient financial service via mobile payment, the Bank can further dig into people’s daily life and the operation of business. In addition, the accumulation of financial big data is helpful in enhancing analysis results, which is expected to benefit business growth and profitability.
iii. The encouraging policy on the financing of emerging industries made by the government, the assistance in business’s collateral financing by the expanding Credit Guarantee Fund, and the construction of a sound operation environment for business are all motivations for the loan growth of the banking industry.

Operational Highlights
116
(4) Research of Financial Products and Status of Business Development: A. New financial instruments and the size of new business department(s)
introduced during the past two years and the profit/loss status a. Corporate Banking business continues to promote financial products
such as good-quality stock financing loans, account receivable purchase and subsequent advance payment loans, convenient loans to SMEs, easy discounted notes, corporate banking foreclosure real estate loans to offer corporate customers multiple loan choices.
b. Proactively promote issuance of bills with 1-year plus maturity to offer customers more diverse choices for short and medium-term capital planning and increase handling charges as well.
c. Actively promote loan services and provide customers with more short/medium/long-term funding options. A total of NT$10,362,318,000 were disbursed in 2017; outstanding loan balance totaled NT$ 14,247,318,000 in the end of 2017.
d. Wealth Management Business During 2017, the Bank has launched several stock funds and bond funds with stable returns in line with the global investment market sentiment and the bank actively assisted customers to adjust their asset allocation. As at December 31, 2017, the Bank had a total of 122,057 wealth management clients and total assets under management aggregated NT$262.4 billion, representing an increase of 10% from that of 2016.
e. Fortune Passbook business: The Bank launched the “Fortune Passbook” for children under fifteen years of age. It integrates our major financial management services including NT dollar deposit, foreign-currency deposit, securities and funds. The Bank worked with fine-quality child art & cultural merchants horizontally, including Sesame Street English, Cloud Gate Dance Theatre Foundation, Ju Percussion Music School, Hsin Yi Parent-Child Game Bookstore, Education, Parenting and Family Style, Language Canada Taipei, Paper Windmill Theatre, If Kids Theatre, Just Apple Theatre, and Song Song Song Children’s & Puppet Theatre. As of December 31, 2017, NT dollar deposits of the Fortune Passbook holders amounted to NT$7,237,960,000 representing a 6.24% growth rate comparing to NT$6,812,670,000 as at December 31, 2016.
f. VISA Debit Card Card use promotion was still the main strategy for 2017, including the “Double Rewards for New Card Use”, “Cash Reward (NT$200) for iPass Debit Card”, “1% Reward for UBOT Cards on Weekends”, “Free City Parking”, “Rebate for Gas Refill”, “PX Mart Bonus Points for iPass”, “Bonus Points for EasyCard”, and other card use promotion campaigns. The amounts spent using the Bank’s Visa debit cards (Easy Debit Card and iPass Debit Card totaled NT$1,369,400,000, which represented a 1.47% growth over 2016.
g. Promotion of Automated Service and Internet Banking

Operational Highlights
117
I. The Bank set up 26 ATMs and 2 self-service banks at the stations near the Taoyuan Airport MRT in June 2017; in 2017 the Bank set up 144 ATMs with audio function in convenient stores to provide customers with more convenient service.
II. The Bank introduced a mobile bank “Union Lohas APP” service through the e-Bank service featuring eight major services including “Special Offers News, Special Offers Venue, Account Services, Credit card service, Online applications, Financial information, Lifestyle information, and customer service. ”In 2016, we launched the “Lucky Roulette” activity, offered “mobile coupons” (discounts for shopping at over 5,000 stores of Family Mart, Hi-Life, and OK convenience store chains and Taiwan Pelican Express), and provided e-card and sticker downloads to make life more convenient by combining e-banking and everyday life.
III. The Bank launches the “Internet Banking Canteen” service for personal banking customers. This service allows customers to download discount food coupons and discount coupons for selected products at Yesgogogo Shopping website. With respect to Lohas APP, the Bank also launched preferential foreign exchange rate applicable to 8 special currency e-banking channels including “USD, Euro, AUD, NZD, RMB, JPY, HKD and ZAR”, in hope of upgrading downloading volume and exchange frequency of customers with substantial rebate Overall, the cumulative applicant number for the Bank’s e-banking services is 288,676 in 2017, which grew by 13% in 2017 comparing to 2016. The accumulated downloading number for Lohas APP is 415,669 in 2017, which grew by 41% comparing to 2016.
h. The business department set by the Bank in the recent two years: Following the law amendments by the competent authority, the Bank
established the Insurance Agency Dept. on Aug. 01, 2016 and introduced a variety of insurance products to satisfy the insurance needs of customers in each of their stage of life.
Business scale in recent two years Unit: NTD Billion
2016 2017 Insurance Fee Income 4.4 13.9
B. R&D Expenditure and achievement for the Last Two Years and a brief description of its Future Plan a. R&D Expenditure and Results
Unit: NT$ Thousand

Operational Highlights
118
Year Item
2017 2016
R&D Expenditure 31,785 9,737
I. Since the opening of Apple Pay in March 2017, the Bank further introduced mobile payment projects like Samsung Pay, Andriod Pay and Hami wallet NFC, and arranged for a variety of promoting campaigns for mobile payment. These motivated customers in loading mobile credit cards and payment amounts, which helped us attract new young customers to apply for the Bank’s credit cards.
II. In 2017 we continued to strengthen the Bank’s service of digital banking. In addition to the using experience of each platform, we also focused on the convenience of mobile service in adding various online services, including applying for personal loan, housing loan, vehicle loan, and the trust account opening. We also provided cardless withdrawal service for the Bank’s mobile banking. We provided customers with the experience of more convenient financial service through a variety of channels, which enhanced the Bank’s overall service benefits of digital finance.
III. In 2017 we continued integrating and improving the Bank’s digital banking service and started to establish the Bank’s digital virtual bank. We combined the applications of ATM cards, mobile devices, and social media to strengthen identification mechanism and prepared for the cross-device and cross-platform digital financial service, constructing the Bank’s blueprint of digital cash flow service step by step.
b. Future R&D plan I. Build online Loan Management System to streamline the credit
granting process and enhance operation efficiency. II. In view of the popularization of smartphones and mobile devices
and the thriving of various mobile economic activities, the Bank will further develop QR codes that combine digital certificates, wearing gadgets and EMVCo, which makes customers accept and use the products more easily and helps the Bank keep ahead on the mobile payment market.
III. In view of the maturity of mobile devices and the network environment, the Bank will continue to focus on mobile applications in our e-banking service R&D. We will strengthen the existing platform of digital banking service, which will be designed based on customers’ need and put more focus on the platform that the user experiences with. In applying the technology of mobile device connecting we can provide services of trading verification and message notification. Under the prerequisite of considering both trading efficiency and information safety, we will be able to provide customers with more instant, safer and more convenient digital banking service.
IV. The Bank will continue to investigate and pay attention to new technologies related to financial markets and the relevant applications; follow the evolvement of technologies and cultivate

Operational Highlights
119
promising talents in the fields of AI, blockchain, and bio-identification, etc. Facing the trend of changing service type, the Bank will continue doing research on digital service and its application, and be closer to the needs of the young customers in the next generation. We aim to strengthen the basis for future development of each business by attracting the Bank’s young customers with new digital financial service.
V. We will enhance the Bank’s wealth management system and improve the efficiency of consultants and the control over trading. We will also utilize multi-dimensional analysis and asset allocation to effectively identify wealth management customers, and increase the functions of internal management and control, analysis and identification. Besides, we will also follow the government’s policy in introducing information and mechanism of anti-money laundering and financing terrorism, in order to maintain financial order and trading safety.
(5) Long-term and Short-term Business Development Plan
A. Short-term Business Development Plan: Please refer to “Chapter (2) 2016 Business Plan”.
B. Long-term Business Development Plan: Please refer to page 2 “4. External Factors and Future Development Strategies of I. Letter to Shareholders”
2. Employee Analysis (1) Employee Data for the Last Two Years and Current Year Up to the Printing Date
of the Annual Report:
Year End of 2016 End of 2017 Mar31, 2018
Number of Employees
Permanent 3,621 3,691 3,716 Temporary 0 0 0
Other 0 0 0 Total 3,621 3,691 3,716
Average age 37.21 37.41 37.68 Average year of service 8.92 9.09 9.23
Education
Doctorate 0.03 0.03 0.03 Master 6.96 7.13 7.24 University (College) 85.67 85.99 85.68 Senior High School 7.29 6.85 7.05 Junior High School & Under 0.06 0 0
Type of professional certification held by employees End of 2016 End of 2017 Mar31, 2018 Basic Proficiency Test for International Banking Personnel 330 335 332 Proficiency Test on Foreign Exchange Trading 9 10 10 Proficiency Test for Trust Operations Personnel 2,219 2,281 2,260 Subject Test - Laws and Regulations on Trust Businesses 31 33 35 Qualification exam for “General knowledge of Financial Markets and professional code of Ethics” 2,596 2,722 2,720
Financial Risk Manager (FRM) 3 3 3 Class B Accounts Clerk 9 10 10 Class C Accounts Clerk 104 105 106 Basic Proficiency Test for Bank Lending Personnel 392 396 398 Advanced Proficiency Test for Bank Lending Personnel 31 32 32 Proficiency Test for Bank Collateral Appraisal Personnel 10 10 10 Proficiency Test for Financial Planning Personnel 364 363 361 Structured Product Sales Personnel Qualification Test 245 451 249

Operational Highlights v
120
Year End of 2016 End of 2017 Mar31, 2018
Qualification exam for securities investment trust and consulting regulations (including professional ethics rules) 11 20 19
For taking “Investment trust & consulting regulations(including self-disciplinary rules)” only 695 699 693
Life insurance salesperson 2,611 2,728 2,722 Investment-oriented insurance salesperson 1,261 1,245 1,232 Fundamental Test of Investment-oriented insurance salesperson and financial market 228 232 232
Property Insurance Salesperson Registration Certificate 1,060 1,130 1,124
Qualification Test for Life Insurance Salesperson Selling Non-Investment Type of Insurance Product in Foreign Currency
981 1,018 1,015
Futures specialist 333 336 334 Bill finance specialist 78 80 79 Fin Tech Knowledge Test 14 27 27 Labor safety and health specialists (Class B certificate for labor safety and hygiene) 4 5 5
Class A Manager of Labor Safety & Health Affairs 49 51 52 Class B Manager of Labor Safety & Health Affairs 84 88 89 Class C Manager of Labor Safety & Health Affairs 39 39 40 Fire Fighting Administrator 136 139 140 First Aid Specialist 179 174 173 Bond Specialist 23 24 24 Basic Proficiency Test on Internal Controls 1,780 1,851 1,857 Securities specialist 334 364 353 Senior securities specialist 256 257 254 Securities investment trust and consulting professionals 190 195 195 Securities investment Analyst 5 5 5 Specialist of “Margin and Stock Loans by Securities Firms” 45 47 48 Assistant real estate Brokers 6 8 8 Note: Not include the 2 employees of offshore units.
(2) Advanced Education and Training of Employees In response to the fast changing financial environment and for the purpose of enhancing the professional competency of our employees, the Bank organizes the various business seminars and symposiums each year as well as sends employees to attend the various external training programs. The bank also requests, where possible, the relevant staff at all levels to acquire the required certification. The bank aims to upgrade the capabilities in product innovation and improve the operational procedures.
Item Internal program External program Total
Number of employees trained 20,394 2,958 23,352
Total training expense ( in NT$ thousand) 11,125 7,500 18,625
(3) Rules of Employee Behavior and Ethics
The Bank has put in place the “Employment Standards” and “Employee Service Rules” to govern employees’ behaviors and dedication for works. The Bank motivates its employees to take the corporate mission above all personal pursuits and perform their duties in accordance with corporate rules to facilitate the development of the various businesses.
(4) Protection for Work Environment and Employee Safety

Operational Highlights
121
A. Access Security: The Bank has installed a premise access surveillance system to monitor people entering or leaving the office premise. The system is linked to the police stations at all times and is subject to regular trial checks. Security guards stationed on site to ensure personnel and premise security.
B. Office Premises and Equipment: The Bank performs regular or random maintenance check on the various equipment in accordance with the relevant regulations on public safety and fire tests of office premises.
C. Security Maintenance: The security maintenance regulations enforced by the competent authority and Bankers’ Association prescribe that each retail office shall conduct anti-robbery rehearsals each year.
D. Safety and health: We have established the “Safety and Health Work Rules” and “Occupational Safety and Health Management Plan”. In addition, we implement various environmental examinations and organize occupational safety and health education/training activities and first aid training courses in accordance with the Occupational Safety and Health Act and relevant regulations to ensure workplace safety for employees.
3. Corporate Responsibility and Ethical Conduct
(1) Cultural Intelligence Education: We have long devoted ourselves to the promotion of cultural intelligence education, as witnessed by the “Let Me Draw My Mommy” children’s art contests over the past 17 years. Apart from cultivating art literacy in children and the filial piety culture, we donate NT$5 for each entry in 2017 to finance nutritional lunches for students in remote villages, hoping to inspire the philanthropic value in children. The annual “Little Banker—Financial Management Camp” entered its 9th session. Aiming to combine with social contributions, apart from equipping children with the concept for financial and financial management knowledge, we introduced courses on basketball and animal conservation in collaboration with the Male Basketball Team of Dong-Shan High School in Taichung and Transportation Bureau of Kaohsiung City Government. In order to promote the beauty of Taiwan’s cultural relics, we launched the “Stories in Taiwan: A UBOT Tour to Historical Relics in Taiwan” in collaboration with SET Taiwan Channel to visit cultural relics across Taiwan and explore the history and culture of Taiwan past and present. To promote the concept of ecology protection, the Bank not only participated in adopting Taiwan’s protected animal, “Chinese leopard cat” and “ring-necked pheasant” , but also sponsored the Transportation Bureau of Kaohsiung City Government in holding “2017 Global Festival of Ecology and Transportation in Kaohsiung”. We also invited the Bank’s wealth management VIP customers to participate in the visit experience of “Delta Green Building Exhibition” and enjoy the life of energy saving and low carbon together.
(2) Sponsoring Arts and Cultural Activities:
To promote and implement the development of local arts activities, we have been funding the “Kaohsiung Philharmonic Cultural and Arts Foundation” for 7 consecutive years since 2011 to organize theme concerts and the Kaohsiung Spring Arts Festival. In addition, we have established the “UBOT Arts and Cultural Gallery” in the KMRT Formosa Boulevard Station for citizens to
Operational Highlights
122
appreciate artworks. The Bank also participated in “Taiwan Lantern Festival in Yunlin”, “Kaohsiung Lantern Festival” and the sponsor of “Taipei New Year's Eve Countdown Party”. We wish to support local art and cultural activities through sponsoring and preparing for exhibition of installation art.
(3) Social Engagement 1. Care for community development: We continued adopting “Minyao Park
#2” in Songshan District, Taipei City and the flower beds in front Luzhou Elementary School, and participated in the Community Development Experiment Program of Pingtung County Government” to maintain public natural environment and facilitate positive symbiosis between business and community.
2. Care for local citizens: In May we purchased 35,930 carnations from flower farms in Tianwei, Changhua County, on the eve of Mother’s Day and presented them to customers and local citizens. To care for young students without adequate economic and education resources, the Bank engaged in the sponsor of “Male Basketball Team of Dong-Shan High School of Taichung City” and “Puzangalan Children's Choir” respectively to assist the children in digging out their talent.
3. Care for local industries: Every year when we order a large quantity of Lunar New Year gifts, such as ceramic Chinese zodiac piggy banks, calendars, red envelops, and Spring Festival couplets, local manufacturers (made in Taiwan, MIT) are our priority contractors.
(4) Charity
1. Donation for charities: In addition to the campaigns for UBOT cardholders to make donations for the Eden Social Welfare Foundation, Chinese Children's Home & Shelter Association, on the Mother's Day Charitable Fair in May, we invited 13 charities including the Eden Social Welfare Foundation, Workshop with Happiness, Garden of Hope Foundation, Children Are Us Foundation and Taiwan blind person welfare National Christian Council to join the charity sale and donated all income from the sale to respective charities.
2. Sponsorship: Continue sponsoring the tickets and meal boxes of the Children Are Us Theatre and Music Group and the “Children Are Us Work Training Program”. We also sponsored the “Kaohsiung Metro Romance Micro-Movie Competition”, “Kaohsiung MRT 3-to-3 Basketball Tournament”, “Kaohsiung MRT Summer Love Cosplay Event” and “Kaohsiung MRT Charity Marathon” (the registration fee and the monetary balance were all donated to the Genesis Social Welfare Foundation ) held by the Kaohsiung MRT company, and sponsored the charity campaign of “Tao-chi X’mas Afternoon Tea” held by the Taoyuan MRT Company.
4. Number of non-managerial staff, amount of employee welfare expenses, and differences from the previous year
Unit: NT$ thousands; %

Operational Highlights
123
Category 2016 2017 Difference
Head count 3,163 3,204 41 1.30%
Average welfare expense
706 703 -3 -0.40%
5. Facilities of Information Technology (1) Maintenance and Allocation of Hardware & Software for major IT systems:
A. Production Computer Room: One IBM z/BC12 operation server and one IBMz/890 backup- server, two IBM 8870 diskettes driver, IBM 3590 Tape driver, Fujitsu 3490 Tape driver, IBM TS7760 virtual Tape driver, fourteen IBM RS/6000, one IBM i520 and 100 PC servers.
B. Backup Computer Room: One IBM z/800 remote backup server, two IBM Shark-800 diskeet drive, IBM 2074 back-end controller, one set of 3590 tape drive, IBM TS7760 virtual Tape driver, two IBM RS/6000, one IBM AS/400-720 and twelve PC servers.
C. Network: The operating system control room uses two CISCO 7206 routers, two CISCO 7507 routers, two CISCO 4507 routers. The backup control rooms uses three ASR1001 routers, three CISCO ASR1001 routers, and two CISCO 3750 routers via the DWDM connecting with the operating system and backup control rooms. Branches use CISCO 2811/2911 routers and connected to the operation system’s computer room via the CHT exclusive line (transaction), with connection to the backup control room routers via Asia Pacific Telecom FTTB 2M (non-transaction) as alternate, if necessary.
D. The Bank has signed maintenance contracts with the vendors for above hardwares and softwares.
(2) Future development or procurement plans: A. Development of software for system operation trail audits. B. Development of the control system for country risks. C. Development of the registration system for loaning of book-entry
government bonds. D. Upgrading of the report inquiry system. E. Upgrading of recording equipment system of call center. F. Hardware and software upgrading of database storage. G. Constructing Defend APT(Advanced Persistent Threat) system over the
internet. H. Web Application Firewall Device I. Computer system information security evaluation and testing J. Construction of the mail audit and archival system K. ATM white list construction L. SIEM Inter-network Information Safety Prediction & Analysis System
(3) Emergency Backup and Security Protection Measures A. Construct on-site backup device at Neihu computer room with Minsheng
computer room serving as the remote backup support. B. Off-site media backup and storage of sensitive documents, separately at
Neihu and Minsheng computer rooms.

Operational Highlights
124
C. Installation of access control system, surveillance cameras, line control, fire safety equipment and environmental security systems to protect the IT equipment.
D. Using intrusion detector, setting internal/external firewalls and anti-spam system, scanning virus, Trojan horse or spy programs, updating virus-code and system patch to ensure internet and data transmission security.
E. Enact the “Plan for Union Bank of Taiwan IT Security Contingency” and conduct annual rehearsals of on-site and remote backup and fire safety in accordance with the “Plan for Union Bank of Taiwan IT Disaster Contingency”.
6. Labor Relations
(1) Execution status of employee welfare and retirement policy, labor agreements and protection of employee welfare: A. Establish the Employee Welfare Committee. Deduct 0.5% of employees’
monthly salaries and appropriate 0.1% of operating revenue and use the fund to administer employee welfare affairs such as Mother’s Day Fair and special allowances for marriage, funeral, birth (including spouse) and major accident.
B. In accordance with the Social Insurance Policy, the Bank administers Labor Insurance, National Health Insurance and Group Insurance (including term life insurance, group accident insurance, worker’s accident insurance, occupational injury insurance, cancer insurance and hospital and medical insurance for employees and their dependents).
C. Offer deposits, loans and unsecured consumer loan for staff at special rates.
D. The Employee Welfare Committee disburses bonus to employees on major festivals of the Lunar year.
E. Employee Retirement Policy has been set that any employee reaching retirement age or eligible for retirement pursuant to the Bank’s retirement policy is entitled to receive the retirement payout under the old pension system (Labor Standards Act). On the other hand, the Bank makes monthly contributions to individual retirement accounts for employees who apply for new pension system.
F. The Bank has set up rules for governing labor-management committee to maintain sound and harmonious labor-management relationship.
(2) Loss incurred as a result of labor disputes in the past year and current year up to the
printing date of annual report, the amount of estimated potential loss and the bank’s responses. Where it is impossible to make a reasonable estimate, provide the reason: An employee in the North Taoyuan Branch applied for disputes mediation due to the reason of misunderstanding with the supervisor regarding the layoff, and finally reached the reconciliation with NT$ 150,000.
7. Major Contracts Mar 31,2018
Nature of Contract Concerned Parties Contract Period Content Restriction on
Contract Insurance Contract Central Deposit
Insurance Signed on Apr. 27, 1994
Performance bond agreement for the
None
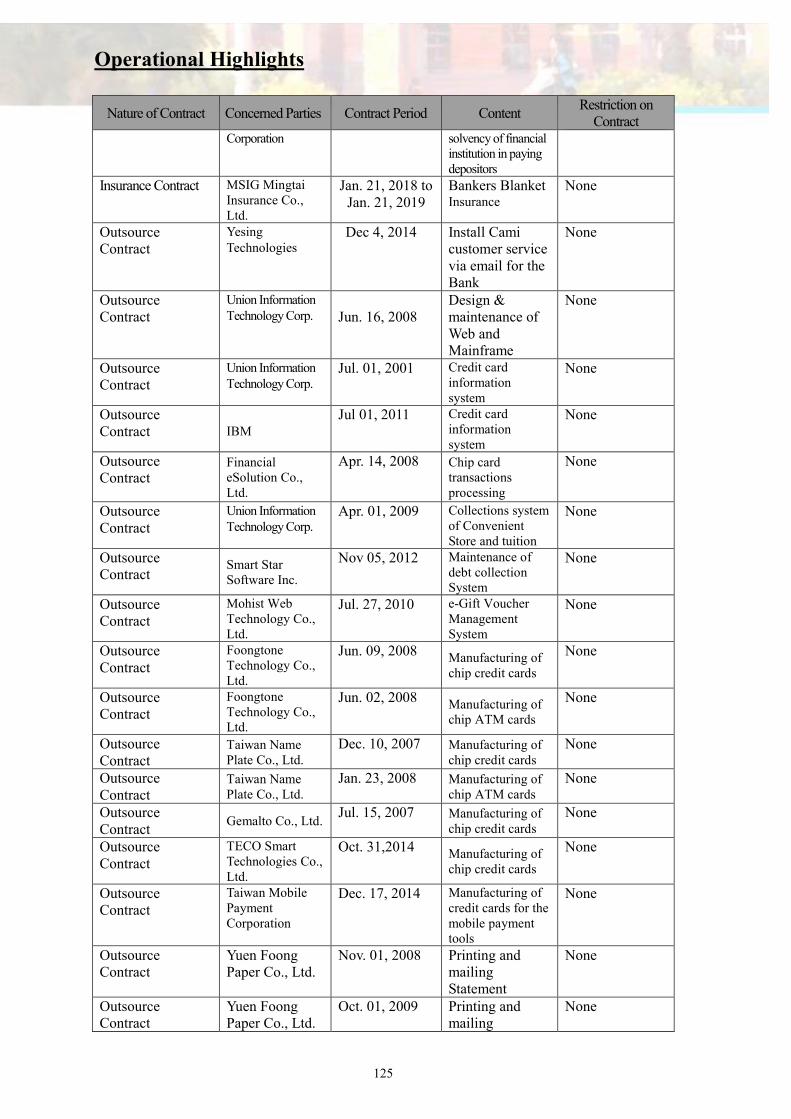
Operational Highlights
125
Nature of Contract Concerned Parties Contract Period Content Restriction on
Contract Corporation solvency of financial
institution in paying depositors
Insurance Contract MSIG Mingtai Insurance Co., Ltd.
Jan. 21, 2018 to Jan. 21, 2019
Bankers Blanket Insurance
None
Outsource Contract
Yesing Technologies
Dec 4, 2014 Install Cami customer service via email for the Bank
None
Outsource Contract
Union Information Technology Corp.
Jun. 16, 2008
Design & maintenance of Web and Mainframe
None
Outsource Contract
Union Information Technology Corp.
Jul. 01, 2001 Credit card information system
None
Outsource Contract IBM
Jul 01, 2011 Credit card information system
None
Outsource Contract
Financial eSolution Co., Ltd.
Apr. 14, 2008 Chip card transactions processing
None
Outsource Contract
Union Information Technology Corp.
Apr. 01, 2009 Collections system of Convenient Store and tuition
None
Outsource Contract
Smart Star Software Inc.
Nov 05, 2012 Maintenance of debt collection System
None
Outsource Contract
Mohist Web Technology Co., Ltd.
Jul. 27, 2010 e-Gift Voucher Management System
None
Outsource Contract
Foongtone Technology Co., Ltd.
Jun. 09, 2008 Manufacturing of chip credit cards
None
Outsource Contract
Foongtone Technology Co., Ltd.
Jun. 02, 2008 Manufacturing of chip ATM cards
None
Outsource Contract
Taiwan Name Plate Co., Ltd.
Dec. 10, 2007 Manufacturing of chip credit cards
None
Outsource Contract
Taiwan Name Plate Co., Ltd.
Jan. 23, 2008 Manufacturing of chip ATM cards
None
Outsource Contract
Gemalto Co., Ltd. Jul. 15, 2007 Manufacturing of
chip credit cards None
Outsource Contract
TECO Smart Technologies Co., Ltd.
Oct. 31,2014 Manufacturing of chip credit cards
None
Outsource Contract
Taiwan Mobile Payment Corporation
Dec. 17, 2014 Manufacturing of credit cards for the mobile payment tools
None
Outsource Contract
Yuen Foong Paper Co., Ltd.
Nov. 01, 2008 Printing and mailing Statement
None
Outsource Contract
Yuen Foong Paper Co., Ltd.
Oct. 01, 2009 Printing and mailing
None

Operational Highlights
126
Nature of Contract Concerned Parties Contract Period Content Restriction on
Contract integrated Statement
Outsource Contract
Yuen Foong Paper Co., Ltd.
Jan. 01, 2008 Printing of withholding tax statements
None
Outsource Contract
Ma Chiu Consulting Management Co. Ltd.
Mar. 1, 2010 Household registration transport apply
None
Outsource Contract
Ma Chiu Consulting Management Co. Ltd.
Apr. 24, 2010 Household registration and financial/tax information search
None
Outsource Contract
SinLinYang Business Consulting Co., Ltd.
Apr. 24, 2010 Household registration and financial/tax information search
None
Outsource Contract
EVERY8D Co., LTD.
Aug. 1, 2012 Messaging system and message delivery service
None
Outsource Contract
SYSTEX Corporation
June 01, 2016 Mail Printing and Posting of Credit Card
Outsource Contract Mitake Inc.
July 01, 2017 Messaging system and message delivery service
None
Outsource Contract IBM
Jul. 01, 2011 Credit card statement printing
None
Outsource Contract
Chunghwa Post Co., Ltd. Taipei Post
Aug. 01, 2012 Printing, the credit card notification letter and aerogram
None
Outsource Contract
Chunghwa Post Co., Ltd. Taipei Post
Aug. 01, 2012 Enveloping the credit card notification letter and aerogram
None
Outsource Contract
Chunghwa Post Co., Ltd. Taipei Post
Aug. 01, 2012 Delivery Service
None
Outsource Contract Hou Jeh Co., Ltd.
Dec. 31, 2008 Enveloping of printed mail and delivery
None
Outsource Contract
Philip Morris International Taiwan
Nov. 20, 2012 Packaging the redemptions
None
Outsource Contract
Philip Morris International Taiwan
Nov. 20, 2012 Delivery the redemptions
None
Outsource Contract
SYSTEX Corporation
Sep. 01, 2012 Delivery of credit card statements
None
Outsource Contract
SYSTEX Corporation
Jan. 01, 2016 Delivery of credit card e-statements
None
Outsource Contract
Leebao Security Co., Ltd
Aug. 01, 2008 Cash transportation
None
Outsource Contract
Taiwan Security Co., Ltd.
Jan. 01, 2010 Cash transportation
None
Outsource Jihsun Security Dec. 01, 2012 Cash None

Operational Highlights
127
Nature of Contract Concerned Parties Contract Period Content Restriction on
Contract Contract Co., Ltd. transportation Outsource Contract
An Fong Enterprise Co., Ltd.
Oct. 01, 2008 ATM banknote replenishment and troubleshooting operation
None
Outsource Contract
Lian-An Service Co., Ltd.
Jan. 01, 2010 ATM banknote replenishment and troubleshooting operation
None
Outsource Contract
Transnational Group
Jan. 01, 2013 Check clearing house delivery operation
None
Outsource Contract
Lee & Lin Real Estate Consultant
Dec 1, 2014 Conveyancing services
None
Outsource Contract
Yeah Ju-Cui Conveyancing Office
Nov. 25, 2014
Conveyancing services
None
Outsource Contract
Hsin Yaun Conveyancing Office
Nov. 14, 2014
Conveyancing services
None
Outsource Contract
Ja Chou Conveyancing Office
Nov. 17, 2014 Conveyancing services
None
Outsource Contract
Lin Hsiu-Fan Conveyancing Office
Dec 1, 2014 Conveyancing services
None
Outsource Contract
Chou Jin-Kuo Conveyancing Office
Dec 1, 2014 Conveyancing services
None
Outsource Contract
Shih Chang-Chih Conveyancing Office
Nov. 25, 2014 Conveyancing services
None
Outsource Contract
Lin Yin-Hui Conveyancing Office
Dec 1, 2014 Conveyancing services
None
Outsource Contract
Huang Jin-Yuan Conveyancing Office
Dec 1, 2014 Conveyancing services
None
Outsource Contract
Pu-Hsin Conveyancing Office
Dec 1, 2014 Conveyancing services
None
Outsource Contract
Fong Tai Management Consulting Co., Ltd.
Aug. 28, 2007 Lost car search service
None
Outsource Contract
Tai Ding Industrial Co., Ltd.
Aug. 28, 2007 Lost car search service
None
Outsource Contract
Hong Jeh Management Consulting Co., Ltd.
Dec.01, 2009 Lost car search service
None
Outsource Contract
SinJang Enterprise Co., Ltd.
Jul. 01, 2006 Lost car resell
None
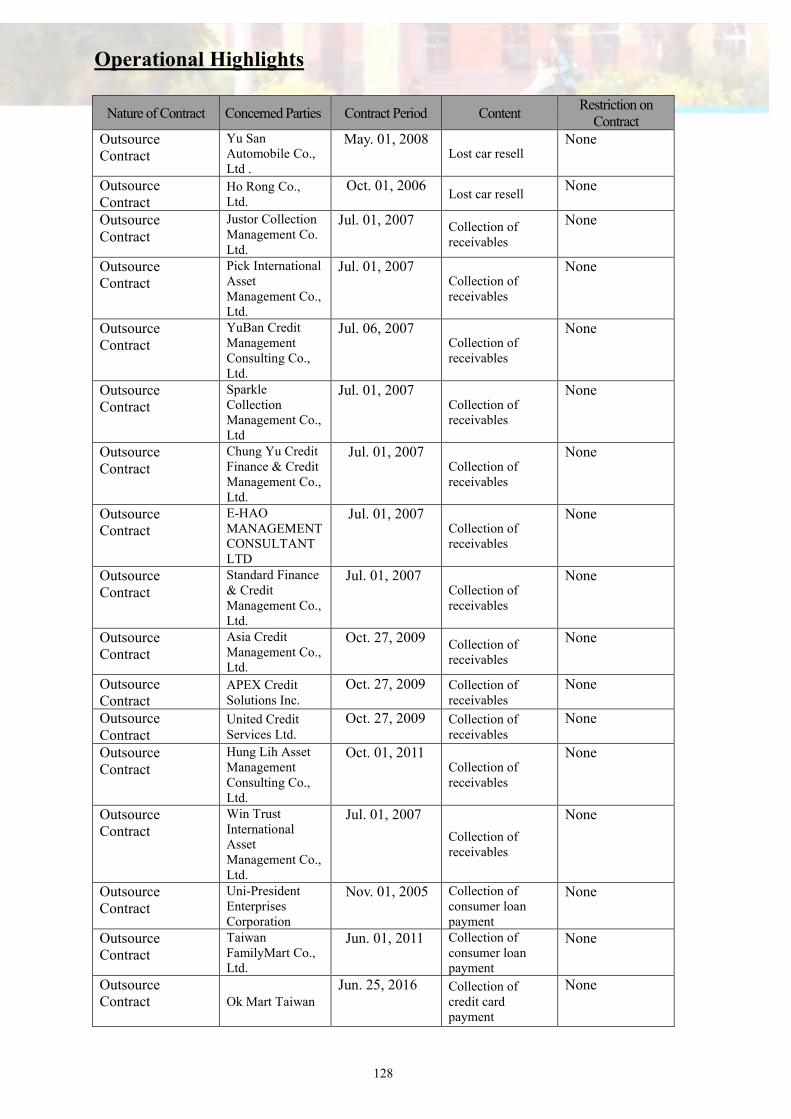
Operational Highlights
128
Nature of Contract Concerned Parties Contract Period Content Restriction on
Contract Outsource Contract
Yu San Automobile Co., Ltd .
May. 01, 2008 Lost car resell
None
Outsource Contract
Ho Rong Co., Ltd.
Oct. 01, 2006 Lost car resell
None
Outsource Contract
Justor Collection Management Co. Ltd.
Jul. 01, 2007 Collection of receivables
None
Outsource Contract
Pick International Asset Management Co., Ltd.
Jul. 01, 2007 Collection of receivables
None
Outsource Contract
YuBan Credit Management Consulting Co., Ltd.
Jul. 06, 2007 Collection of receivables
None
Outsource Contract
Sparkle Collection Management Co., Ltd
Jul. 01, 2007 Collection of receivables
None
Outsource Contract
Chung Yu Credit Finance & Credit Management Co., Ltd.
Jul. 01, 2007 Collection of receivables
None
Outsource Contract
E-HAO MANAGEMENT CONSULTANT LTD
Jul. 01, 2007 Collection of receivables
None
Outsource Contract
Standard Finance & Credit Management Co., Ltd.
Jul. 01, 2007 Collection of receivables
None
Outsource Contract
Asia Credit Management Co., Ltd.
Oct. 27, 2009 Collection of receivables
None
Outsource Contract
APEX Credit Solutions Inc.
Oct. 27, 2009 Collection of receivables
None
Outsource Contract
United Credit Services Ltd.
Oct. 27, 2009 Collection of receivables
None
Outsource Contract
Hung Lih Asset Management Consulting Co., Ltd.
Oct. 01, 2011 Collection of receivables
None
Outsource Contract
Win Trust International Asset Management Co., Ltd.
Jul. 01, 2007
Collection of receivables
None
Outsource Contract
Uni-President Enterprises Corporation
Nov. 01, 2005 Collection of consumer loan payment
None
Outsource Contract
Taiwan FamilyMart Co., Ltd.
Jun. 01, 2011 Collection of consumer loan payment
None
Outsource Contract
Ok Mart Taiwan Jun. 25, 2016 Collection of
credit card payment
None
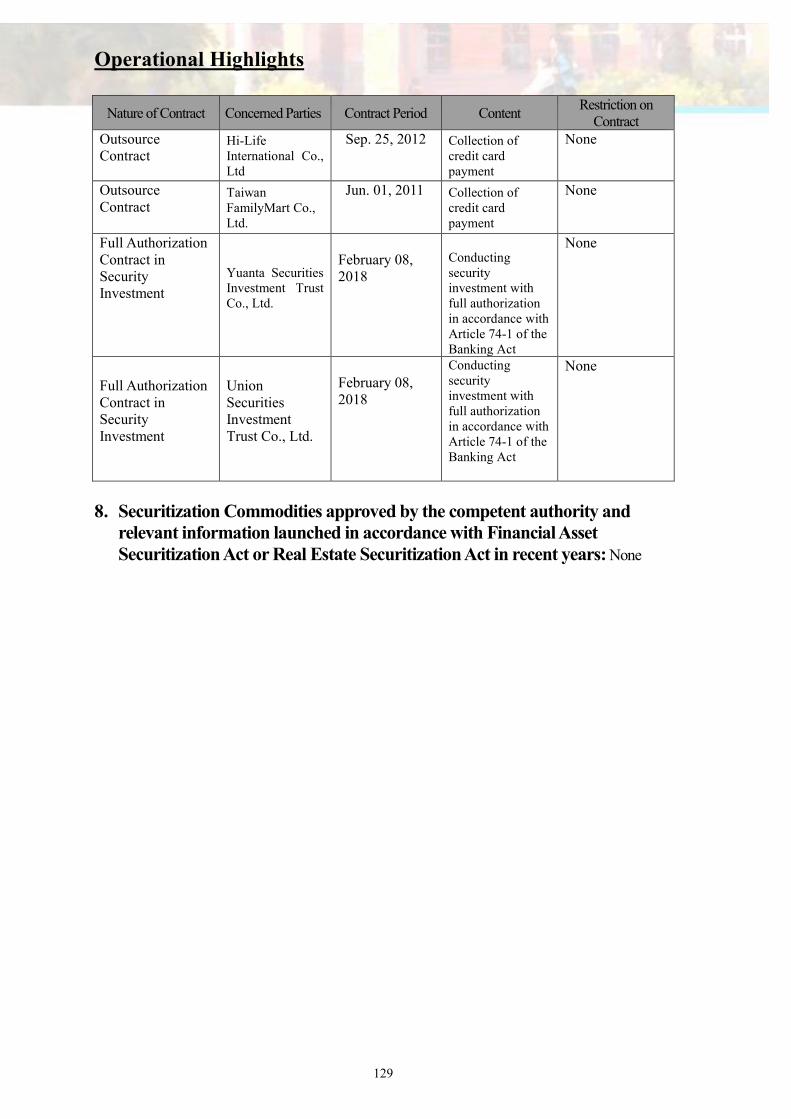
Operational Highlights
129
Nature of Contract Concerned Parties Contract Period Content Restriction on
Contract Outsource Contract
Hi-Life International Co., Ltd
Sep. 25, 2012 Collection of credit card payment
None
Outsource Contract
Taiwan FamilyMart Co., Ltd.
Jun. 01, 2011 Collection of credit card payment
None
Full Authorization Contract in Security Investment
Yuanta Securities Investment Trust Co., Ltd.
February 08, 2018
Conducting security investment with full authorization in accordance with Article 74-1 of the Banking Act
None
Full Authorization Contract in Security Investment
Union Securities Investment Trust Co., Ltd.
February 08, 2018
Conducting security investment with full authorization in accordance with Article 74-1 of the Banking Act
None
8. Securitization Commodities approved by the competent authority and relevant information launched in accordance with Financial Asset Securitization Act or Real Estate Securitization Act in recent years: None

Financial Highlights
130
1. Condensed Balance Sheets, Income Statement and Auditors’ Opinions for the most recent
five years.
(1)Condensed Consolidated Balance Sheets - IFRS In NT$ thousand
Year
Item
Financial Data for the Past Five Years(Note 1)
2013 2014 2015 2016 2017
Cash and equivalent, due from the
Central Bank and other banks 79,101,215 76,850,501 71,659,720 65,385,579 31,317,157
Financial assets at fair value through
profit or loss 10,115,316 18,614,020 9,058,815 9,538,090 12,136,325
Available-for-sale financial assets 8,711,283 13,974,008 23,319,718 39,978,425 35,489,633
Hedging derivative financial
instruments - - - - -
Securities purchased under resell agreements 20,237,019 26,371,487 22,072,191 27,855,242 28,234,334
Receivable-Net 13,917,483 14,781,594 15,217,776 17,888,230 17,751,420
Current Tax asset 160,672 332,275 332,660 186,231 52,134
Available-for-sale asset-Net - - - - -
Discounts & Loans-Net 227,974,804 255,787,180 278,801,052 282,416,950 316,728,989
Held-to-maturity financial asset 440,233 534,200 4,207,436 7,192,115 51,285,957
Equity Investment(Equity Method)- Net 54,294 54,183 53,794 53,447 53,121
Restricted assets - - - - -
Other financial asset – Net 57,559,287 56,835,380 61,133,831 57,403,743 48,267,839
Property and equipment- Net 7,644,442 7,732,876 7,723,438 8,156,305 8,081,729
Investment property-Net 2,777,603 3,691,781 3,703,410 5,415,376 5,284,434
Intangible asset –Net 2,049,795 2,050,999 2,144,240 2,167,730 2,169,444
Deferred tax asset-Net 2,992,503 2,407,704 1,886,538 1,447,039 1,172,974
Other asset 6,419,023 6,463,385 7,184,578 7,622,068 7,590,797
Total asset 440,154,972 486,481,573 508,489,197 532,706,570 565,616,287
Due to the central bank and other banks 5,315,113 6,748,799 3,781,976 8,389,312 9,249,185
Call loans to the central banks and other
banks - - - - -
Financial liability at fair value through
profit or loss 16,006 211,084 54,271 39,253 183,384
Hedging derivative financial instruments - - - - -
Securities sold under repurchase agreements 24,582,657 31,791,276 26,986,936 28,874,137 30,273,976
Payable 4,267,543 5,567,108 4,061,998 6,981,464 7,108,824
Current Income Tax liability 18,954 9,849 49,618 97,549 77,173

Financial Highlights
131
Year
Item
Financial Data for the Past Five Years(Note 1)
2013 2014 2015 2016 2017
Liabilities directly associated with assets
held f or sale - - - - -
Deposit and remittance 364,084,582 395,852,404 421,018,106 431,618,915 449,049,470
Bank debentures 7,400,000 7,400,000 10,204,397 12,335,884 13,109,598
Liability component of preferred stocks - - - - -
Other financial liability 2,180,986 2,517,176 2,679,438 4,235,138 4,291,441
Provision 769,416 959,941 1,044,534 189,572 182,262
Deferred tax liability 574,580 707,731 881,731 834,410 937,196
Other liability 2,264,761 2,409,132 2,575,775 2,892,210 2,967,213
T o t a l l i a b i l i t y Before dilution 411,474,598 454,174,500 478,338,780 496,488,114 517,429,722
After dilution 411,483,560 454,811,742 474,380,841 497,660,433 Note 2
BIS total Equity 28,423,332 32,038,122 34,890,164 35,949,316 47,918,675
Capital stock Before dilution 22,165,251 24,509,306 26,051,524 26,051,524 28,051,524
After dilution 24,448,272 25,979,865 26,051,524 26,051,524 Note 2
Capital surplus 34,288 33,006 32,413 32,413 8,032,413
Retained earnings Before dilution 5,391,915 6,126,910 7,087,950 8,673,248 10,254,481
After dilution 3,099,932 4,019,109 6,045,889 7,500,929 Note 2
Others equity 831,878 1,368,900 1,718,277 1,192,131 1,580,257
Treasury Stock - - - - -
Non control Interest 257,042 268,951 260,253 269,140 267,890
Total equity Before dilution 28,680,374 32,307,073 35,150,417 36,218,456 48,186,565
After dilution 28,671,412 31,669,831 34,108,356 35,046,137 Note 2
Note 1: All financial data has been audited by independent auditors, with the exception of the first quarterly financial data for 2017. Note 2: The 2018 annual general shareholders’ meeting has yet to be held. As such, the amount after appropriation for 2017 was not provided.

Financial Highlights
132
(2)Condensed Individual Balance Sheet-IFRS In NT$ thousand
Year
Item
Financial Data for the Past Five Year(Note 1)
2013 2014 2015(Reedit) 2016 2017
Cash and equivalent, due from the
Central Bank and other banks 78,568,012 76,737,109 71,152,509 64,389,151 29,937,036
Financial assets at fair value
through profit or loss 9,863,257 18,373,136 8,815,810 9,291,613 11,852,723
Available-for-sale financial assets 8,500,192 13,699,485 22,911,977 39,548,602 35,183,406
Hedging derivative financial
instruments - - - - -
Securities purchased under resell
agreements 20,230,519 26,350,581 22,052,189 27,845,242 28,215,334
Receivable-Net 13,742,618 14,678,252 15,141,449 17,768,361 17,627,438
Current Tax asset 160,660 326,786 316,861 183,591 46,909
Available-for-sale asset-Net - - - - -
Discounts & Loans-Net 230,142,592 257,632,121 280,781,558 284,040,723 318,624,348
Held-to-maturity financial asset 428,017 521,266 4,191,245 7,192,115 51,285,957
Equity Investment(Equity Method)-
Net 2,567,706 2,616,318 2,758,367 2,910,889 2,981,366
Restricted assets - - - - -
Other financial asset – Net 57,830,216 56,639,357 60,969,196 56,620,906 48,100,741
Property and equipment- Net 7,630,976 7,722,206 7,713,726 8,136,374 8,061,615
Investment property-Net - - - - -
Intangible asset -Net 2,044,866 2,046,198 2,140,281 2,164,516 2,162,835
Deferred tax asset-Net 2,826,055 2,245,936 1,750,150 1,307,570 1,019,583
Other asset 1,925,098 1,962,732 2,193,401 2,230,774 2,102,313
Total asset 436,460,784 481,551,483 502,888,719 523,630,427 557,201,604
Due to the central bank and other
banks 4,924,611 6,164,744 3,163,991 7,017,629 8,961,290
Call loan to the central bank and
other banks - - - - -
Financial liability at fair value
through profit or loss 16,006 211,084 54,271 38,430 183,611
Hedging derivative financial
instrument - - - - -

Financial Highlights
133
Year
Item
Financial Data for the Past Five Year(Note 1)
2013 2014 2015(Reedit) 2016 2017
Securities sold under repurchase
agreements 24,582,657 31,791,276 26,986,936 28,874,137 30,273,976
Payable 4,168,148 5,456,071 4,037,153 6,889,250 7,005,686
Current Income Tax liability - - 32,955 64,784 70,008
Liabilities directly associated with assets held for
sale - - - - -
Deposit and remittance 365,120,161 396,410,432 421,746,026 432,062,824 449,412,119
Bank debentures 7,400,000 7,400,000 9,600,000 11,200,000 11,700,000
Liability component of preferred
stocks - - - - -
Other financial liability 201,858 18,928 20,408 19,566 21,720
Provision 752,628 942,785 1,026,155 176,554 171,759
Deferred tax liability 556,558 699,730 869,197 815,251 911,524
Other liability 314,825 418,311 461,463 522,686 571,236
Total liability Before dilution 408,037,452 449,513,361 467,998,555 487,681,111 509,282,929
After dilution 408,046,414 450,150,603 469,040,616 488,853,430 Note 2
Capital stock
Before dilution 22,165,251 24,509,306 26,051,524 26,051,524 26,051,524
After dilution 24,448,272 25,979,865 26,051,524 26,051,524 Note 2
Capital surplus 34,288 33,006 32,413 32,413 8,032,413
Retained earning Before dilution 5,391,915 6,126,910 7,087,950 8,673,248 10,254,481
After dilution 3,099,932 4,019,109 6,045,889 7,500,929 Note 2
Other equity 831,878 1,368,900 1,718,277 1,192,131 1,580,257
Treasury stock - - - - -
Total equity Before dilution 28,423,332 32,038,122 34,890,164 35,949,316 47,918,675
After dilution 28,414,370 31,400,880 33,848,103 34,776,997 Note 2
. Note 1: All financial data has been audited by independent auditors, with the exception of the first quarterly financial data for 2017. Besides, the Bank merged its subsidiary, Union Insurance Broker Co., Ltd. in August 2016. The nature of this merger belongs to organizational restructuring within the group, with the consolidated accounts recorded at the carrying value of assets and liabilities, and it should be considered as a merger from the beginning. Therefore, the financial information compared to the previous period (2015) should be reedited. Note 2: The 2018 annual general shareholders’ meeting has yet to be held. As such, the amount after appropriation for 2017 was not provided.
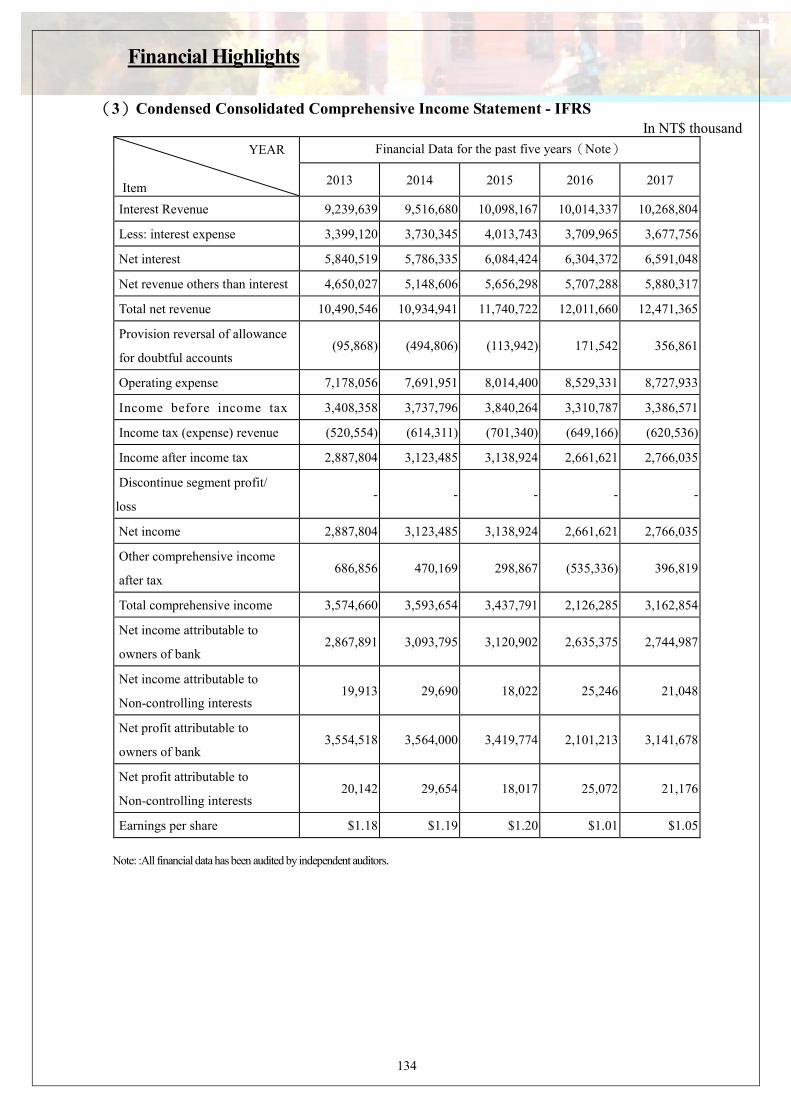
Financial Highlights
134
(3)Condensed Consolidated Comprehensive Income Statement - IFRS In NT$ thousand
YEAR
Item
Financial Data for the past five years(Note)
2013 2014 2015 2016 2017
Interest Revenue 9,239,639 9,516,680 10,098,167 10,014,337 10,268,804
Less: interest expense 3,399,120 3,730,345 4,013,743 3,709,965 3,677,756
Net interest 5,840,519 5,786,335 6,084,424 6,304,372 6,591,048
Net revenue others than interest 4,650,027 5,148,606 5,656,298 5,707,288 5,880,317
Total net revenue 10,490,546 10,934,941 11,740,722 12,011,660 12,471,365
Provision reversal of allowance
for doubtful accounts (95,868) (494,806) (113,942) 171,542 356,861
Operating expense 7,178,056 7,691,951 8,014,400 8,529,331 8,727,933
Income before income tax 3,408,358 3,737,796 3,840,264 3,310,787 3,386,571
Income tax (expense) revenue (520,554) (614,311) (701,340) (649,166) (620,536)
Income after income tax 2,887,804 3,123,485 3,138,924 2,661,621 2,766,035
Discontinue segment profit/
loss - - - - -
Net income 2,887,804 3,123,485 3,138,924 2,661,621 2,766,035
Other comprehensive income
after tax 686,856 470,169 298,867 (535,336) 396,819
Total comprehensive income 3,574,660 3,593,654 3,437,791 2,126,285 3,162,854
Net income attributable to
owners of bank 2,867,891 3,093,795 3,120,902 2,635,375 2,744,987
Net income attributable to
Non-controlling interests 19,913 29,690 18,022 25,246 21,048
Net profit attributable to
owners of bank 3,554,518 3,564,000 3,419,774 2,101,213 3,141,678
Net profit attributable to
Non-controlling interests 20,142 29,654 18,017 25,072 21,176
Earnings per share $1.18 $1.19 $1.20 $1.01 $1.05
Note: :All financial data has been audited by independent auditors.

Financial Highlights
135
(4)Condensed Individual Comprehensive Income Statement - IFRS
In NT$ thousand
Year
Item
Financial Data for The Past Five years(Note)
2013 2014 2015(Reedit) 2016 2017
Interest Revenue 9,271,343 9,548,551 10,129,151 10,051,894 10,298,904
less: Interest Expense 3,350,022 3,681,523 3,958,924 3,653,016 3,613,710
Net Interest 5,921,321 5,867,028 6,170,227 6,398,878 6,685,194
Net revenues others than interest 2,557,835 2,982,487 3,635,663 3,508,315 3,602,533
Total net revenue 8,479,156 8,849,515 9,805,890 9,907,193 10,287,727
Provision reversal of allowance
for doubtful accounts (95,890) (494,806) (113,942) 171,542 356,861
Operating expenses 5,236,264 5,668,767 6,156,689 6,509,173 6,617,616
Income before income tax 3,338,782 3,675,554 3,763,143 3,226,478 3,313,250
Income tax revenue(expense) (470,891) (581,759) (642,241) (590,103) (568,263)
Income after income tax 2,867,891 3,093,795 3,120,902 2,636,375 2,744,987
Discontinue segment profit - - - - -
Net income 2,867,891 3,093,795 3,120,902 2,636,375 2,744,987
Other comprehensive income
after tax 686,627 470,205 298,872 (535,162) 396,691
Total comprehensive income 3,554,518 3,564,000 3,419,774 2,101,213 3,141,678
Earnings per share $1.18 $1.19 $1.20 $1.01 $1.05
Note: Financial information for each reporting period has all been audited by the certified public accountant. Besides, the Bank merged its subsidiary, Union Insurance Broker Co., Ltd. in August 2016. The nature of this merger belongs to organizational restructuring within the group, with the consolidated accounts recorded at the carrying value of assets and liabilities, and it should be considered as a merger from the beginning. Therefore, the financial information compared to the previous period (2015) should be reedited.

Financial Highlights
136
(5) Name of CPAs and the Auditors’ Opinion
Year CPA Firm Independent Auditors Audit Opinion
2012 Deloitte & Touche Terence Huang /Vincent Cheng Unqualified opinion
2013 Deloitte & Touche Terence Huang /Vincent Cheng Unqualified opinion
2014 Deloitte & Touche Terence Huang /Vincent Cheng Unqualified opinion
2015 Deloitte & Touche Terence Huang /Vincent Cheng Unqualified opinion
2016 Deloitte & Touche Charels Yang /Vincent Cheng Unqualified opinion
2017 Deloitte & Touche Charels Yang /Vincent Cheng Unqualified opinion
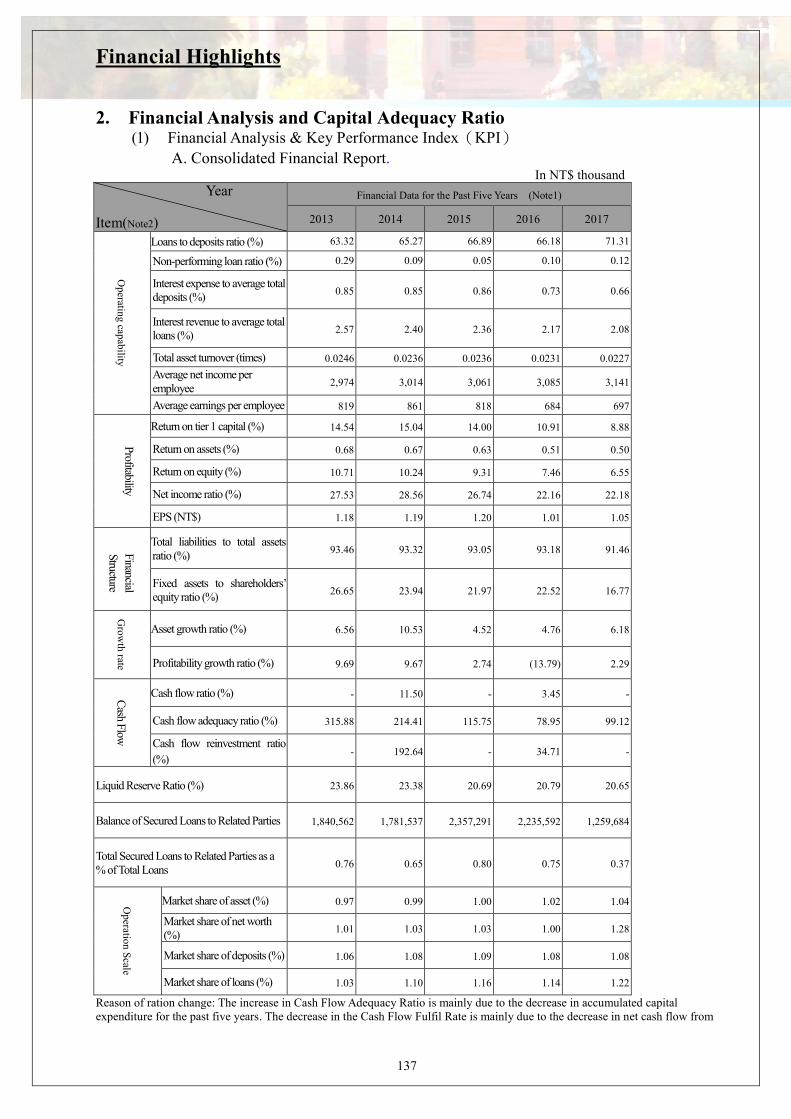
Financial Highlights
137
2. Financial Analysis and Capital Adequacy Ratio (1) Financial Analysis & Key Performance Index(KPI) A. Consolidated Financial Report.
In NT$ thousand Year Item(Note2)
Financial Data for the Past Five Years (Note1)
2013 2014 2015 2016 2017
Op
erating
capab
ility
Loans to deposits ratio (%) 63.32 65.27 66.89 66.18 71.31
Non-performing loan ratio (%) 0.29 0.09 0.05 0.10 0.12
Interest expense to average total deposits (%)
0.85 0.85 0.86 0.73 0.66
Interest revenue to average total loans (%)
2.57 2.40 2.36 2.17 2.08
Total asset turnover (times) 0.0246 0.0236 0.0236 0.0231 0.0227
Average net income per employee
2,974 3,014 3,061 3,085 3,141
Average earnings per employee 819 861 818 684 697
Profitability
Return on tier 1 capital (%) 14.54 15.04 14.00 10.91 8.88
Return on assets (%) 0.68 0.67 0.63 0.51 0.50
Return on equity (%) 10.71 10.24 9.31 7.46 6.55
Net income ratio (%) 27.53 28.56 26.74 22.16 22.18
EPS (NT$) 1.18 1.19 1.20 1.01 1.05
Financial
Structure
Total liabilities to total assets ratio (%)
93.46 93.32 93.05 93.18 91.46
Fixed assets to shareholders’ equity ratio (%)
26.65 23.94 21.97 22.52 16.77
Grow
th rate
Asset growth ratio (%) 6.56 10.53 4.52 4.76 6.18
Profitability growth ratio (%) 9.69 9.67 2.74 (13.79) 2.29 C
ash Flow
Cash flow ratio (%) - 11.50 - 3.45 -
Cash flow adequacy ratio (%) 315.88 214.41 115.75 78.95 99.12
Cash flow reinvestment ratio
(%) - 192.64 - 34.71 -
Liquid Reserve Ratio (%) 23.86 23.38 20.69 20.79 20.65
Balance of Secured Loans to Related Parties 1,840,562 1,781,537 2,357,291 2,235,592 1,259,684
Total Secured Loans to Related Parties as a % of Total Loans
0.76 0.65 0.80 0.75 0.37
Operation S
cale
Market share of asset (%) 0.97 0.99 1.00 1.02 1.04
Market share of net worth (%)
1.01 1.03 1.03 1.00 1.28
Market share of deposits (%) 1.06 1.08 1.09 1.08 1.08
Market share of loans (%) 1.03 1.10 1.16 1.14 1.22
Reason of ration change: The increase in Cash Flow Adequacy Ratio is mainly due to the decrease in accumulated capital expenditure for the past five years. The decrease in the Cash Flow Fulfil Rate is mainly due to the decrease in net cash flow from

Financial Highlights
138
operating activities for 2017. Note 1: All financial data has been audited or reviewed by independent auditors.
Note 2: Financial ratios are computed as follows:
I. Operating Capability i. Loans to deposits ratio= Total loans/ total deposits (excluding redeposits of Chunghwa Post Co.) ii. Non-performing loan ratio= Total NPL/ total loans iii. Interest expense to average total deposits= Deposits related interest expense/ average total deposits iv. Interest revenue to average total loans= Loans related interest revenue/ average total loans v. Total asset turnover= Net operating revenue/ average total assets vi. Average net income per employee (Note 6) = Net operating revenue/ total number of employees. vii. Average earnings per employee= Net income after tax/ total number of employees.
II. Profitability
i. Return on tier 1 capital= Net income before tax/ average total tier 1 capital.
ii. Return on assets= Net income after tax/ average total assets.
iii. Return on equity= Net income after tax/ average shareholders’ equity.
iv. Net Income ratio= Net income after tax/ net income.
v. Earnings per share= (Net Income after tax - preferred stock dividend)/weighted average outstanding shares (Note 4)
III. Financial structure
i. Total liabilities to total assets ratio=Total liabilities (Note 3) / total assets.
ii. Fixed assets and equipment to net worth ratio=Fixed assets and equipment, net/shareholders’ equity, net.
IV. Growth rate
i. Asset growth ratio= (Total assets as at the end of this year - total assets as at the end of last year)/total assets as at the end of last year.
ii. Profitability growth ratio=(Net income before tax for the current year- net income before tax for the past year)/net income before tax for the past year.
V. Cash flow (Note 7)
i. Cash flow ratio=Net cash from operating activities/(call loans to banks+ CD payable+change in fair value of financial liabilities
through the income statement+repurchase securities payable+Liabilities-current portion due within one year).
ii. Cash flow adequacy ratio=Net cash from operating activities for the past five years/(capital expenditure+cash dividends) incurred for
the past 5 years.
iii. Cash flow reinvestment ratio=Net cash from operating activities/net cash from investing activities.
VI. Liquid reserve ratio=Liquid assets statutorily required/reserve for liabilities.
VII. Operation scale
i. Market share of assets=Total assets/total assets of all authorized deposit-taking and loan-underwriting financial institutions*. (Note 5)
ii. Market share of net worth=Net worth/total net worth of all authorized deposit-taking and loan-underwriting financial institutions*.
iii. Market share of deposits=Total deposits/total deposits of all authorized deposit-taking and loan-underwriting financial institutions*.
iv. Market share of loans=Total loans/total loans of all authorized deposit- taking and loan-underwriting financial institutions*.
Note 3: Total liabilities refer to the amount of liabilities after deducting performance guarantee reserve and contingency
reserve.
Note 4: I. Measurement should be based on the weighted average number of common shares, not the number of issued shares
at year end.
II. In any case where there is a cash capital increase or treasury stock transaction, the period of time in circulation
shall be considered in calculating the weighted average number of shares.
III. In the case of capital increase out of earnings or capital surplus, the calculation of earnings per share for the past
fiscal year and the fiscal half-year shall be retrospectively adjusted based on the capital increase ratio, without the
need to consider the issuance period for the capital increase.
IV. If the preferred shares are non-convertible cumulative preferred shares, the dividend of the current year (whether
issued or not) shall be subtracted from the net profit after tax, or added to the net loss after tax.
V. In the case of non-cumulative preferred shares, if there is net profit after tax, dividend on preferred shares shall be subtracted from the net profit after tax; no adjustment is required to be made if the result of operation is a net loss.

Financial Highlights
139
Note 5: All authorized deposit-taking and loan-underwriting financial institutions include all domestic bank, the local branches of foreign banks, credit cooperative associations, farmers’ & fishermen’s associations and trust & investment corps.
Note 6: Revenue refers to the sum of interest income and non-interest income.
Note 7: The following notes apply when conducting cash flow analysis:
I. Net cash flow from operating activities means net cash in-flows from operating activities listed in the statement of
cash flows.
II. Capital expenditures means the amounts of cash out-flows for annual capital investment.
III. Cash dividend includes cash dividends from both common shares and preferred shares.

Financial Highlights 䌁
140
(B) Financial Analysis – Financial Report In NT$ thousand
Year Item(Note2)
Financial Data for the Past Five Years (Note1)
2013 2014 2015 2016 2017
Op
erating
capab
ility
Loans to deposits ratio (%) 63.73 65.65 67.24 66.49 71.68
Non-performing loan ratio (%) 0.29 0.09 0.05 0.10 0.12
Interest expense to average total deposits (%)
0.85 0.85 0.86 0.73 0.66
Interest revenue to average total loans (%)
2.56 2.40 2.36 2.17 2.08
Total asset turnover (times) 0.0201 0.0193 0.0199 0.0193 0.0190
Average net income per employee
2,610 2,693 2,745 2,729 2,780
Average earnings per employee 883 942 874 726 742
Profitability
Return on tier 1 capital (%) 14.17 14.72 13.70 10.64 8.71
Return on assets (%) 0.68 0.67 0.63 0.51 0.51
Return on equity (%) 10.74 10.23 9.33 7.44 6.55
Net income ratio (%) 33.82 34.96 31.83 26.61 26.68
EPS (NT$) 1.18 1.19 1.20 1.01 1.05
Financial
Structure
Total liabilities to total assets ratio (%)
93.47 93.31 93.02 93.11 91.38
Fixed assets to shareholders’ equity ratio (%)
26.85 24.10 22.11 22.63 16.82
Grow
th rate
Asset growth ratio (%) 6.63 10.33 4.43 4.12 6.41
Profitability growth ratio (%) 9.45 10.09 2.38 (14.26) 2.69
Cash F
low
Cash flow ratio (%) - 8.27 - - -
Cash flow adequacy ratio (%) 1493.53 892.03 364.19 92.41 81.05
Cash flow reinvestment ratio
(%) - 1,159.37 - - -
Liquid Reserve Ratio (%) 23.86 23.38 20.69 20.79 20.65
Balance of Secured Loans to Related Parties 4,008,350 3,626,478 4,337,797 3,859,365 3,155,043
Total Secured Loans to Related Parties as a % of Total Loans
1.65 1.32 1.47 1.59 0.94
Operation S
cale
Market share of asset (%) 0.97 0.98 0.99 1.00 1.02
Market share of net worth (%)
1.00 1.02 1.02 1.00 1.27
Market share of deposits (%) 1.06 1.08 1.09 1.08 1.08
Market share of loans (%) 1.04 1.11 1.17 1.14 1.22
Note 1: All financial data for the most recent two years was audited by CPA. Note 2: Financial ratios are computed as follows:

Financial Highlights
141
I . Operating Capability Loans to deposits ratio= Total loans/ total deposits (excluding redeposits of Chunghwa Post Co.) Non-performing loan ratio= Total NPL/ total loans. Interest expense to average total deposits= Total interest expense/ average total deposits. Interest revenue to average total loans= Total interest revenue/ average total loans. Total asset turnover= Net operating revenue/ total assets. Average net income per employee (Note 6) = Net operating revenue/ total number of employees. Average earnings per employee= Net income after tax/ total number of employees.
II . Profitability Return on tier 1 capital= Net income before tax/ average total tier 1 capital. Return on assets= Net income after tax/ average total assets. Return on equity= Net income after tax/ average shareholders’ equity. Net Income ratio= Net income after tax/ net income. Earnings per share= (Net Income after tax - preferred stock dividend)/weighted average outstanding shares (Note 4)
III. Financial structure Total liabilities to total assets ratio=Total liabilities/total assets. Fixed assets to net worth ratio=Fixed assets, net/shareholders’ equity, net.
IV. Growth rate Asset growth ratio= (Total assets as at the end of this year - total assets as at the end of last year)/total assets as at the end of last year. Profitability growth ratio=(Net income before tax for the current year- net income before tax for the past year)/net income before tax for the past year.
V. Cash flow (Note 7) Cash flow ratio=Net cash from operating activities/(call loans to banks+ CD payable+change in fair value of financial
liabilities through the income statement+repurchase securities payable+Liabilities-current portion due within one year).
Cash flow adequacy ratio=Net cash from operating activities for the past five years/(capital expenditure+cash dividends)
incurred for the past 5 years. Cash flow reinvestment ratio=Net cash from operating activities/net cash from investing activities.
VI.. Liquid reserve ratio=Liquid assets statutorily required/reserve for liabilities. VII.. Operation scale
Market share of assets=Total assets/total assets of all authorized deposit-taking and loan-underwriting financial institutions*.(Note 5) Market share of net worth=Net worth/total net worth of all authorized deposit-taking and loan-underwriting financial institutions*. Market share of deposits=Total deposits/total deposits of all authorized deposit-taking and loan-underwriting financial institutions*. Market share of loans=Total loans/total loans of all authorized deposit- taking and loan-underwriting financial institutions*.
Note 3: Total liabilities refer to the amount of liabilities after deducting performance guarantee reserve and contingency reserve.
Note 4: I. Measurement should be based on the weighted average number of common shares, not the number of
issued shares at year end.
II. In any case where there is a cash capital increase or treasury stock transaction, the period of time in
circulation shall be considered in calculating the weighted average number of shares.
III. In the case of capital increase out of earnings or capital surplus, the calculation of earnings per share
for the past fiscal year and the fiscal half-year shall be retrospectively adjusted based on the capital
increase ratio, without the need to consider the issuance period for the capital increase.
IV. If the preferred shares are non-convertible cumulative preferred shares, the dividend of the current
year (whether issued or not) shall be subtracted from the net profit after tax, or added to the net loss after

Financial Highlights
142
tax.
V. In the case of non-cumulative preferred shares, if there is net profit after tax, dividend on preferred shares shall be subtracted from the net profit after tax; no adjustment is required to be made if the result of operation is a net loss.
Note 5: All authorized deposit-taking and loan-underwriting financial institutions include all domestic bank, the local
branches of foreign banks, credit cooperative associations, farmers’ & fishermen’s associations and trust & investment corps.
Note 6: Revenue refers to the sum of interest income and non-interest income.
Note 7: The following notes apply when conducting cash flow analysis:
I. Net cash flow from operating activities means net cash in-flows from operating activities listed in the
statement of cash flows.
II. Capital expenditures means the amounts of cash out-flows for annual capital investment.
III. Cash dividend includes cash dividends from both common shares and preferred shares.

Financial Highlights
143
(2) Capital Adequacy (Unconsolidated)
In NT$ thousand Year(Note1)
Item
Capital Adequacy Ratio for the Past Five Years (Note2) Capital
Adequacy
Ratio as of
the current
year
2013 2014 2015 2016 2017
Regulato
ry C
apital
Common Stock Equity 23,562,741 26,380,471 28,573,380 30,419,225 31,867,478
As of the date of publication of the annual report, the recent information(2017) certified or audited by the CPA has been presented in the left column and does not need to be disclosed again.
Other Tier1 Capital of Non- Common Stock Equity
0 0 0 1,664,565 12,146,864
Tier2 Capital 6,624,701 6,462,888 7,817,292 6,851,336 5,726,391
Regulatory Capital 30,187,442 32,843,359 36,390,672 38,935,126 49,740,733
Risk W
eighted A
ssets
Credit risk
Standardized Approach 190,929,908 214,767,222 232,370,458 248,197,971 262,292,42
7
Internal Ratings-Based Approach - - - - -
Credit Valuation Adjustment (CVA)
18,320 8,416 14,776 8,583 25,735
Asset Securitization 1,219,545 1,262,627 1,227,133 919,153 11,794,762
Operation
risk
Basic Indicator Approach 15,405,625 15,555,738 16,711,475 17,384,500 17,986,588
Standardized Approach/ Alternative Standardized Approach
- - - - -
Advanced Measurement Approach - - - - -
Market
Risk
Standardized Approach 9,234,588 17,206,850 25,658,013 22,483,575 24,757,659
Internal Model Approach - - - - -
Total Risk-weighted Assets 216,807,986 248,800,853 275,981,855 288,993,781 316,857,17
1
Capital Adequacy Ratio 13.92% 13.20% 13.19% 13.47% 15.70%
Ratio of tier 1 capital to risk-weighted assets 10.87% 10.60% 10.35% 11.10% 13.89%
Ratio of common stock equity to risk-weighted assets 10.87% 10.60% 10.35% 10.53% 10.06%
Leverage Ratio - - 5.28% 5.68% 7.30%
Note1: The financial data in all periods was audited by CPA... Note2: Core capital, weighted risk-based assets and total exposures in this Table were calculated in accordance with the “Regulations
Governing the Capital Adequacy and Capital Category of Banks” and “Explanation and Table of Computation of Banks’ Core Capital and Risk-Weighted Assets”.
Note3: The ratios are computed as follows:
i. Regulatory Capital = Common Stock Equity+Other Tier1 Capital of Non- Common Stock Equity+Tier2 Capital
ii. Total risk-weighted assets= Credit risk weighted assets+(operational risk + market risk) capital appropriation* 12.5.
iii. Capital adequacy ratio= Regulatory capital/Total risk-weighted assets.
iv. Ratio of tier 1 capital to risk-weighted assets = (Common Stock Equity+Other Tier1 Capital of Non- Common Stock Equity) /Total risk-weighted
assets.
v. Ratio of Common Stock Equity l to risk-weighted assets = Common Stock Equity /Total risk-weighted assets.
vi. Gearing ratio=Tier 1 Capital- Net/ Total Risk Exposure.
Note 4: As of the date of publication of the annual report, if the information is certified or audited by the accountant, it should be disclosed. Note 5: The disclosure of leverage ratio since 2015.

Financial Highlights
144
(Consolidated)
In NT$ thousand Year(Note1)
Item
Capital Adequacy Ratio for the Past Five Years (Note2)
2013 2014 2015 2016 2017
Regulato
ry C
apital
Common Stock Equity 23,436,734 26,284,281 28,573,960 29,751,735 31,226,900
Other Tier1 Capital of Non- Common Stock Equity
0 0 0 2,378,925 12,878,925
Tier2 Capital 9,229,142 9,094,428 10,537,483 9,629,432 8,534,948
Regulatory Capital 32,665,876 35,378,709 39,111,443 41,760,092 52,640,773
Risk W
eighted Assets
Credit risk
Standardized Approach 199,593,002 222,034,638 240,005,077 258,435,318 271,952,498
Internal Ratings-Based Approach - - - - -
Credit Valuation Adjustment (CVA)
18,320 8,416 14,776 8,583 25,735
Asset Securitization 1,252,907 1,262,627 1,227,133 919,153 11,794,762
Operation
risk
Basic Indicator Approach 17,706,850 17,986,163 19,034,288 19,969,925 20,976,363
Standardized Approach/ Alternative Standardized Approach
- - - - -
Advanced Measurement Approach - - - -
Market
Risk
Standardized Approach 10,280,113 18,233,988 26,975,300 23,893,763 25,883,018
Internal Model Approach - - - - -
Total Risk-weighted Assets 228,851,192 259,525,832 287,256,574 303,226,742 330,632,376
Capital Adequacy Ratio 14.27% 13.63% 13.62% 13.77% 15.92%
Ratio of tier 1 capital to risk-weighted assets 10.24% 10.13% 9.95% 10.60% 13.34%
Ratio of common stock equity to risk-weighted assets 10.24% 10.13% 9.95% 9.81% 9.44%
Leverage Ratio - - 5.21% 5.57% 7.21%
Note1: The financial data in all periods was audited by the CPA . Note2: Core capital, weighted risk-based assets and total exposures in this Table were calculated in accordance with the “Regulations
Governing the Capital Adequacy and Capital Category of Banks” and “Explanation and Table of Computation of Banks’ Core Capital and Risk-Weighted Assets”.
Note3: The ratios are computed as follows:
i. Regulatory Capital = Common Stock Equity+Other Tier1 Capital of Non- Common Stock Equity+Tier2 Capital
ii. Total risk-weighted assets= Credit risk weighted assets+(operational risk + market risk) capital appropriation* 12.5.
iii. Capital adequacy ratio= Regulatory capital/Total risk-weighted assets.
iv. Ratio of tier 1 capital to risk-weighted assets = (Common Stock Equity+Other Tier1 Capital of Non- Common Stock Equity) /Total
risk-weighted assets.
v. Ratio of Common Stock Equity l to risk-weighted assets = Common Stock Equity /Total risk-weighted assets.
vi. Gearing ratio=Tier 1 Capital- Net/ Total Risk Exposure
Note 4: As of the date of publication of the annual report, if the information is certified or audited by the accountant, it should be disclosed. Note 5: The disclosure of leverage ratio since 2015.
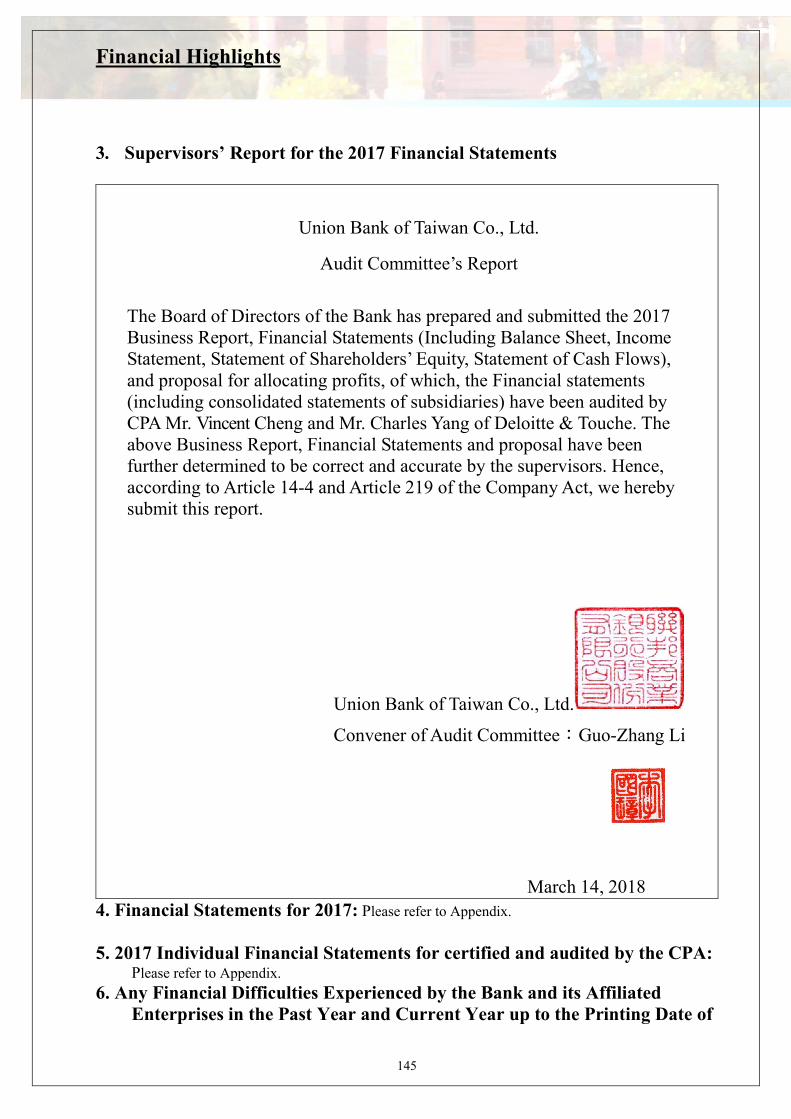
Financial Highlights
145
3. Supervisors’ Report for the 2017 Financial Statements
Union Bank of Taiwan Co., Ltd.
Audit Committee’s Report
The Board of Directors of the Bank has prepared and submitted the 2017 Business Report, Financial Statements (Including Balance Sheet, Income Statement, Statement of Shareholders’ Equity, Statement of Cash Flows), and proposal for allocating profits, of which, the Financial statements (including consolidated statements of subsidiaries) have been audited by CPA Mr. Vincent Cheng and Mr. Charles Yang of Deloitte & Touche. The above Business Report, Financial Statements and proposal have been further determined to be correct and accurate by the supervisors. Hence, according to Article 14-4 and Article 219 of the Company Act, we hereby submit this report.
Union Bank of Taiwan Co., Ltd.
Convener of Audit Committee:Guo-Zhang Li
March 14, 2018
4. Financial Statements for 2017: Please refer to Appendix. 5. 2017 Individual Financial Statements for certified and audited by the CPA:
Please refer to Appendix. 6. Any Financial Difficulties Experienced by the Bank and its Affiliated
Enterprises in the Past Year and Current Year up to the Printing Date of

Financial Highlights
146
the Annual Report, if yes, please narrate the impact upon the Bank’s financial conditions: None.

Analysis of the Financial Status and Operating Results & Risk Management
147
1. Financial Status In NT$ thousand
Year Item
Dec. 31, 2017 Dec. 31, 2016 Difference
Amount % Cash & cash equivalent, Due from Central Bank and other banks (note 1)
31,317,157 65,385,579 (34,068,422) (52.10)
Financial assets at fair value through profit or loss
12,136,325 9,538,090 2,598,235 27.24
Securities purchased under re-sale agreements
28,234,334 27,855,242 379,092 1.36
Account receivable – net 17,751,420 17,888,230 (136,810) (0.76)
Current income tax asset (note 2)
52,134 186,231 (134,097) (72.01)
Discount & loans – net 316,728,989 282,416,950 34,312,039 12.15 Financial assets available for sale – net
35,489,633 39,978,425 (4,488,792) (11.23)
Held-to-maturity investment financial asset (note 3)
51,285,957 7,192,115 44,093,842 613.09
Stock investments accounted for under the Equity Method
53,121 53,447 (326) (0.61)
Other Financial Assets - net 48,267,839 57,403,743 (9,135,904) (15.92) Property & equipment – net 8,081,729 8,156,305 (74,576) (0.91) Investment property-net 5,284,434 5,415,376 (130,942) (2.42) Intangibles 2,169,444 2,167,730 1,714 0.08 Due to Central Bank & other banks
1,172,974 1,447,039 (274,065) (18.94)
Other assets 7,590,797 7,622,068 (31,271) (0.41) Total assets
565,616,287 532,706,570 32,909,717 6.18
Due to Central Bank & other banks
9,249,185 8,389,312 859,873 10.25
Financial liability at fair value through profit or loss (note 4)
183,384 39,523 143,861 363.99
Securities sold under re-purchase agreement 30,273,976 28,874,137 1,399,839 4.85
Accounts Payable 7,108,824 6,981,464 127,360 1.82 Current income tax liabilities 77,173 97,549 (20,376) (20.89) Deposit & remittance 449,049,470 431,618,915 17,430,555 4.04 Bank debentures 13,109,598 12,335,884 773,714 6.27 Other financial liability 4,291,441 4,235,138 56,303 1.33 Provision 182,262 189,572 (7,310) (3.86) Deferred income tax liabilities
937,196 834,410 102,786 12.32
Other liabilities 2,967,213 2,892,210 75,003 2.59 Total liabilities 517,429,722 496,488,114 20,941,608 4.22 Capital stock 28,051,524 26,051,524 2,000,000 7.68 Capital surplus (note 5) 8,032,413 32,413 8,000,000 24,681.45
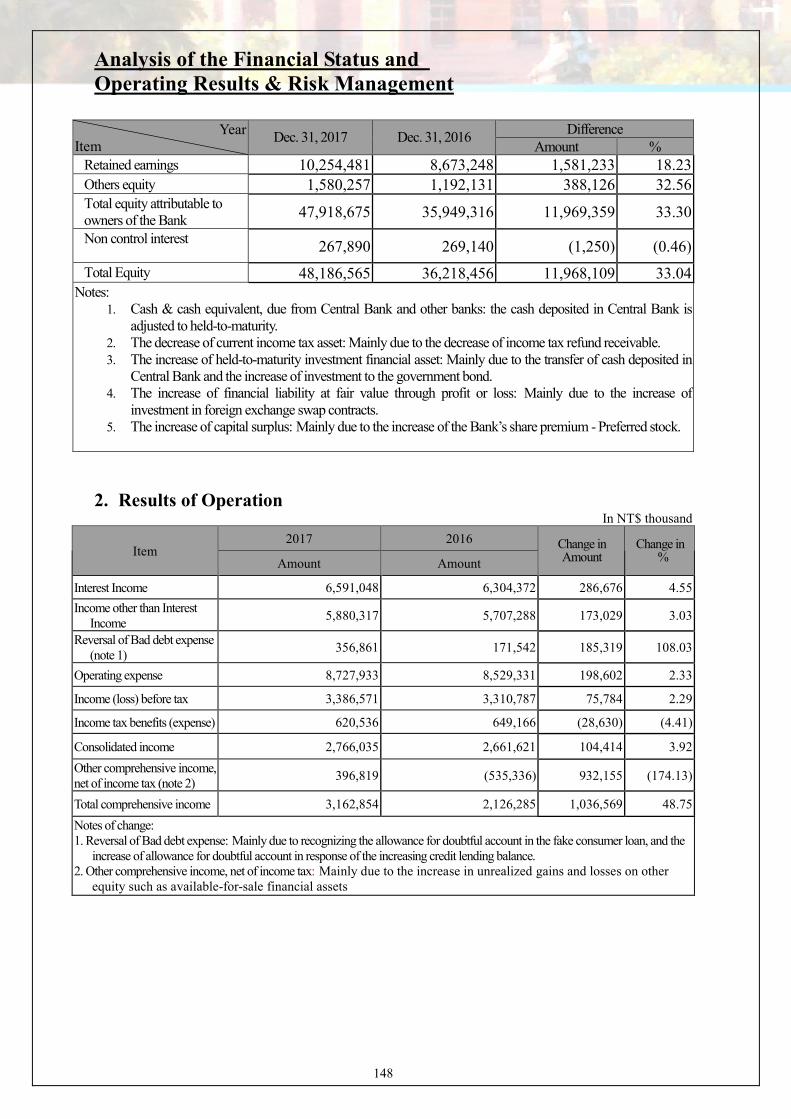
Analysis of the Financial Status and Operating Results & Risk Management
148
Year Item
Dec. 31, 2017 Dec. 31, 2016 Difference
Amount % Retained earnings 10,254,481 8,673,248 1,581,233 18.23 Others equity 1,580,257 1,192,131 388,126 32.56 Total equity attributable to owners of the Bank
47,918,675 35,949,316 11,969,359 33.30
Non control interest 267,890 269,140 (1,250) (0.46)
Total Equity 48,186,565 36,218,456 11,968,109 33.04 Notes:
1. Cash & cash equivalent, due from Central Bank and other banks: the cash deposited in Central Bank is adjusted to held-to-maturity.
2. The decrease of current income tax asset: Mainly due to the decrease of income tax refund receivable. 3. The increase of held-to-maturity investment financial asset: Mainly due to the transfer of cash deposited in
Central Bank and the increase of investment to the government bond. 4. The increase of financial liability at fair value through profit or loss: Mainly due to the increase of
investment in foreign exchange swap contracts. 5. The increase of capital surplus: Mainly due to the increase of the Bank’s share premium - Preferred stock.
2. Results of Operation In NT$ thousand
Item 2017 2016 Change in
Amount Change in
% Amount Amount
Interest Income 6,591,048 6,304,372 286,676 4.55
Income other than Interest Income
5,880,317 5,707,288 173,029 3.03
Reversal of Bad debt expense (note 1)
356,861 171,542 185,319 108.03
Operating expense 8,727,933 8,529,331 198,602 2.33
Income (loss) before tax 3,386,571 3,310,787 75,784 2.29
Income tax benefits (expense) 620,536 649,166 (28,630) (4.41)
Consolidated income 2,766,035 2,661,621 104,414 3.92
Other comprehensive income, net of income tax (note 2)
396,819 (535,336) 932,155 (174.13)
Total comprehensive income 3,162,854 2,126,285 1,036,569 48.75
Notes of change: 1. Reversal of Bad debt expense: Mainly due to recognizing the allowance for doubtful account in the fake consumer loan, and the
increase of allowance for doubtful account in response of the increasing credit lending balance. 2. Other comprehensive income, net of income tax: Mainly due to the increase in unrealized gains and losses on other
equity such as available-for-sale financial assets

Analysis of the Financial Status and Operating Results & Risk Management
149
3. Cash Flow (1) Cash Flow Analysis for the Past Two Years In NT$ thousand
Year I tem
2017 2016 Change in %
Cash flow ratio (%) - 3.45% (3.45%)
Cash flow adequacy ratio (%) 99.12% 78.95% 20.16%
Cash flow satisfaction ratio (%) - 34.71% (34.71%)
Analysis of changes in proportion: The decrease in cash flow adequacy ratio was mainly due to the decrease in net cash flows from operating activities accumulated for the past five years The increase of cash flow satisfaction ratio was mainly due to the decrease in net cash flows from operating activities accumulated for 2017.
.
(2) Liquidity Analysis for the Next Year
In NT$ thousand Opening balance
of cash
①
Expected cash inflows (outflows) from
operating activities
②
Total expected cash inflows (outflows)
③
Expected cash surplus (deficit)
①+②+③
Corrective measures for cash Deficiency
Investment Plan
Financing Plan
40,695,617 1,890,126 (3,112,622) 39,473,121 - -
1. Cash flow analysis: (1) Operating activities: The increase was due to the growth of operating activities. (2) Investing and financing activities: The increase in the issue of Bank debentures and commercial paper. (3) Measures to finance cash deficiency and liquidity analysis: None.
4. The Impact of Major Capital Expenditure on the Bank’s Financial Operations for the recent years: None
5. Reinvestment Policy, the Main Reasons for Profit or Loss, Corrective Action Plan in last year, and Investment Plan for the Next Year: (1) Reinvestment Policy
The Bank’s basic principles of reinvestment are to be in line with the government policy, to carry out business diversification and to optimize capital utilization. In addition, the bank will coalesce its related financial business channels to provide customers with multiple services and to create an operating synergy for the group.
(2) The Main Reasons for Profit or Loss, and Corrective Action Plan in 2017 The Bank’s Investment profit recognized in 2017 totaling NT$ 0.193 billion and the main items recognized are the operating profit and cash dividend income of the reinvestment business.
(3) Improvement Plan The Bank evaluates the performance and risks of our investee companies on a regular basis during the year. We adopt a proactive management approach in that we examine the financial and business status of investee companies from time to time and make adjustments accordingly to ensure performance.
(4) Investment Plan for the Next Year Will depend on the overall economic environment and the Bank’s operating strategy.

Analysis of the Financial Status and Operating Results & Risk Management
150
6. Risk Management (1) Qualitative and Quantitative Information About the Various Risks:
A. Credit Risk Management System and Capital Requirement: a. Credit Risk Management System-2017
Item
Contents
1. Credit risk management strategies and procedures
1. Credit risk management strategy: The Bank has enacted UBOT credit risk management principle as the basis to plan, promote, manage and execute the credit risk.
2. Credit risk management objective: The Bank has established credit risk management mechanism to lower credit risk, and to achieve the objective of operating and management, and to attain a balance between risk control and business development.
3. Credit risk management policy: The Bank has aimed at maintaining an adequate capital base within an acceptable level of credit risk to complete the objective of credit risk strategy and maximize revenue in after-risk-adjusted.
4. Credit risk management procedure: The Bank has employed procedures such as risk recognition, risk measuring, risk offsetting, risk control and risk reporting etc. to establish risk management system.
2. Credit risk
management organization and framework
1. Board of Directors: The highest decision-making unit of the Bank’s credit risk management policy. Responsible for reviewing the Bank’s credit risk management policy.
2. Assets and Liabilities Management Committee: Responsible for reviewing the implementation of the Bank’s credit risk management.
3. Risk Management Dept.: Responsible for examining the risk management mechanisms established by the respective business administration departments, performing the risk control and submitting the risk control report to the Board of Directors regularly.
4. Business Planning and Administration Dept.: Responsible for formulating the business management rules and control mechanisms and properly supervising the performance of risk control of respective business unit.
5. Respective business units: Shall comply with the rules and regulations set forth by the Business Planning and Administration Departments while conducting their day-to-day operations.
3. Scope and characteristics of credit risk reporting and measurement system
Scope of Risk Reporting 1. All business administration departments report to the Assets and Liabilities
Management Committee on a periodic basis regarding the status of business promotion and execution as well as information on the allocation of risk-based assets.
2. The Risk Management Dept. monitors the control of the Bank’s credit limits on a periodic basis and reports to the Assets and Liabilities Committee with respect to concentration of credit risks and achievement of the BIS targets set for various business sectors. The Risk Management Dept. also reports to the Board of Directors on the various business volumes achieved, status of
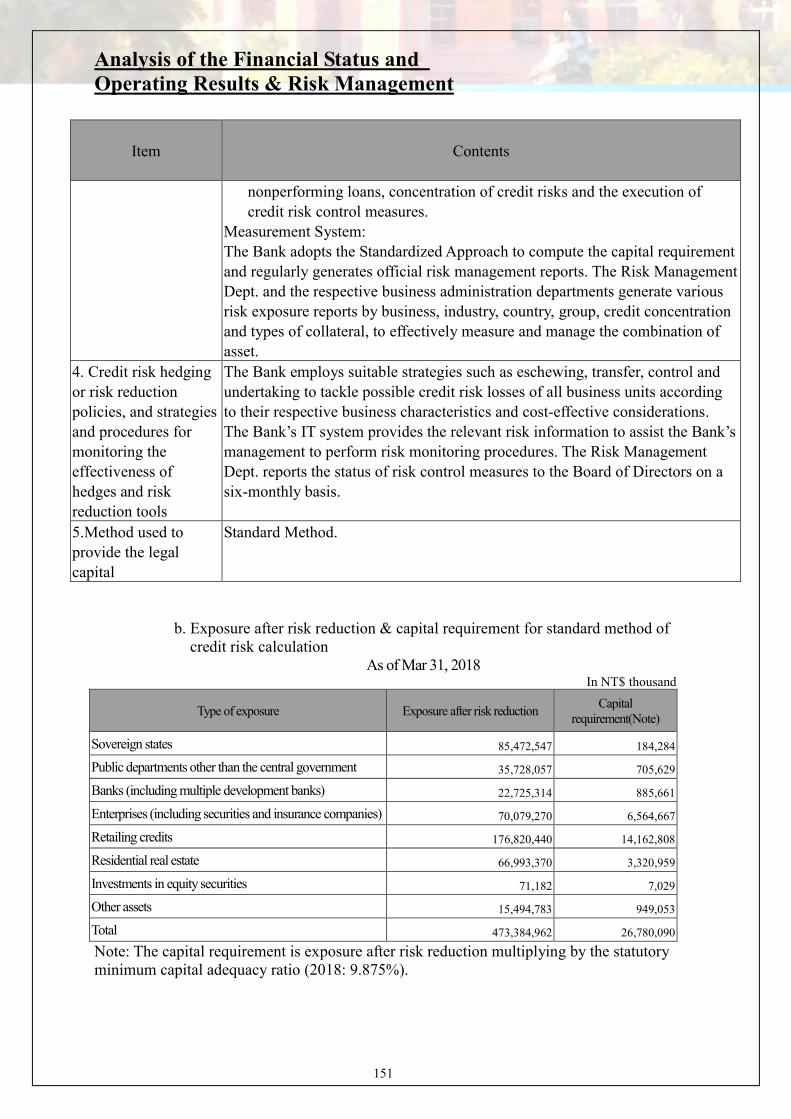
Analysis of the Financial Status and Operating Results & Risk Management
151
Item
Contents
nonperforming loans, concentration of credit risks and the execution of credit risk control measures.
Measurement System: The Bank adopts the Standardized Approach to compute the capital requirement and regularly generates official risk management reports. The Risk Management Dept. and the respective business administration departments generate various risk exposure reports by business, industry, country, group, credit concentration and types of collateral, to effectively measure and manage the combination of asset.
4. Credit risk hedging or risk reduction policies, and strategies and procedures for monitoring the effectiveness of hedges and risk reduction tools
The Bank employs suitable strategies such as eschewing, transfer, control and undertaking to tackle possible credit risk losses of all business units according to their respective business characteristics and cost-effective considerations. The Bank’s IT system provides the relevant risk information to assist the Bank’s management to perform risk monitoring procedures. The Risk Management Dept. reports the status of risk control measures to the Board of Directors on a six-monthly basis.
5.Method used to provide the legal capital
Standard Method.
b. Exposure after risk reduction & capital requirement for standard method of
credit risk calculation As of Mar 31, 2018
In NT$ thousand
Type of exposure Exposure after risk reduction Capital
requirement(Note)
Sovereign states 85,472,547 184,284
Public departments other than the central government 35,728,057 705,629
Banks (including multiple development banks) 22,725,314 885,661
Enterprises (including securities and insurance companies) 70,079,270 6,564,667
Retailing credits 176,820,440 14,162,808
Residential real estate 66,993,370 3,320,959
Investments in equity securities 71,182 7,029
Other assets 15,494,783 949,053
Total 473,384,962 26,780,090
Note: The capital requirement is exposure after risk reduction multiplying by the statutory minimum capital adequacy ratio (2018: 9.875%).

Analysis of the Financial Status and Operating Results & Risk Management
152
B. Risk Management System, Risk Exposure and Capital Requirement of Asset Securitization: a. Risk Management System of Asset Securitization in 2017
Item Contents
1. Management strategy and procedure of securitization
(1) Securitization Strategy: The current asset securitization investment positions held by the Bank belong to the banking books. In principle the bank does not act in the capacity of the originating bank of securitization products, but rather plays as the investor to earn stable income. The investment target products are mainly of the investment grade with higher security.
(2) Securitization procedure: Before making investment, the bank evaluates the characteristics, credit rating, returns and risks of the products to understand the security, liquidity and profitability. Investment proposals should be submitted to the Board of Managing Directors for approval, and regularly review the exposure status on the investment targets.
2. Securitization management organization and framework
The Bank does not act as the originating bank of any securitized products. The risks of positions invested are evaluated and reviewed by the investing unit and the Bank’s risk management department periodically.
3. Scope and characteristics of securitization risk report and measuring system
In addition to observing the global economy and market interest rate change in connection with the investment on securitization products, regular evaluation and monitoring on risk and income are performed periodically and the results are submitted to Asset and Liability Management committee and the Board of Director.
4. Securitization hedging or risk reduction policies, and effective strategies and procedures for controlling risk hedging and risk reduction tools
The relevant units shall review and control the securitized products periodically.
5. Approach to require the authorized capital
Standard Method
6. Disclosure of Marco qualitative:
a. Objectives of securitization activities and the risk of re-securitization.
b. Other risk of asset securitization.
c. The role and the degree of involvement in

Analysis of the Financial Status and Operating Results & Risk Management
153
Item Contents
securitization process.
d. The description of monitoring tool in credit and market fluctuation related to securitization exposure.
e. Management policy of offsetting credit risk in securitization and re securitization.
Not applicable since the Bank does not act as the originating bank of securitized product.
7. The description of accounting policy of bank’s securitization..
8.Explian the exposure of securitization and ECAI in the banking book
9. Explain major change in the quantities information after reporting period
b. Status of Asset Securitization as of December 31, 2017
Type Total issue amount Outstanding balance Amount repurchased
None
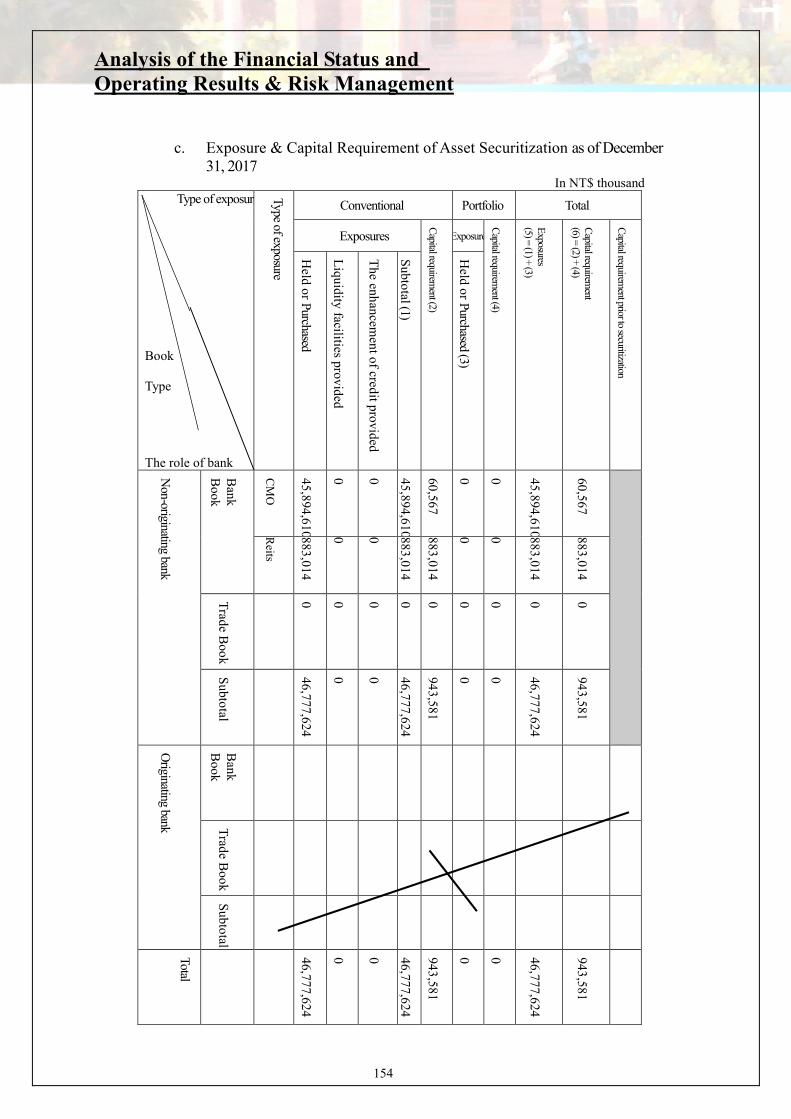
Analysis of the Financial Status and Operating Results & Risk Management
154
c. Exposure & Capital Requirement of Asset Securitization as of December
31, 2017 In NT$ thousand
Type of exposure
Book Type The role of bank
Type of exposure
Conventional Portfolio Total
Exposures
Capital requirem
ent (2)
Exposures
Capital requirem
ent (4)
Exposures
(5) = (1) + (3)
Capital requirem
ent (6) =
(2) + (4)
Capital requirem
ent prior to securitization
Held o
r Purchased
Liqu
idity facilities provided
The enh
ancemen
t of credit provided
Subto
tal (1)
Held o
r Purchased (3)
Non-originating bank
Bank
B
ook
CM
O
45,894,610
0
0
45,894,610
60,567
0
0
45,894,610
60,567
Reits
883,014
0
0
883,014
883,014
0
0
883,014
883,014
Trad
e Boo
k
0
0
0
0
0
0
0
0
0
Su
bto
tal
46,7
77,62
4
0
0
46,7
77,62
4
943
,581
0
0
46,7
77,62
4
943
,581
Originating bank
Bank
B
ook
Trad
e Boo
k
Su
btotal
Total
46,777,6
24
0
0
46,777,6
24
943,58
1
0
0
46,777,6
24
943,58
1

Analysis of the Financial Status and Operating Results & Risk Management
155
d. Information of Securitized commodities investment as of December 31, 2017 I. Summary of Investment in Securitized commodities
USD:NTD=1:29.848 In NT$ thousand
Item Account Initial Cost Cumulative
Valuation Gain or Loss
Cumulative Impairment
Carrying Amount
CMO
Held-to-maturity financial assets
25,668 4,356 1
25,668
CMO
Non-active market debt instruments
45,992,999 848,727 2,495 45,734,754
Note1: The above numbers do not include the amount of Interest Receivable. Note2: Accumulated valuation gains or losses and accumulated impairment losses were calculated and provided by an internationally renowned professional risk management agency (MARKIT model).
II. i. Information on Securitized commodities investment where the
initial cost of a single investment is in excess of NT$300 million (excluding those held by the Originator for the purpose of credit enhancement):
USD:NTD=1:29.848 In NT$ thousand
Name of Securities
Account (Note)
Currency Issuer &
Place
Purchase Date Coupon
Rate Credit Rating
Method of Interest Payment
& Principal Repayment
Initial Cost
Cumulative
Valuation Gain or
Loss
Cumulative
Impairment
Carrying Amount
Attachment Point
Details of Asset
Pool Maturity Date
Ginnie Mae
CMO
Non-active market debt instruments
USD Ginnie Mae
20091130- 20171130 2.5%~
5.5% Moody’s
Aaa
Fitch AAA
S&P AA+
Monthly 34,619,358 0 194,348 34,425,010
N/A N/A
20180502- 20281025
Freddie Mac CMO
Non-active market debt instruments
USD Freddie
Mac
20121030 3.0%- Monthly 300,139 0 1,681 298,458
20230320
Fannie Mae
CMO
Non-active market debt instruments
USD Fannie Mae
20121030
3.0% Monthly 931,284 0 5,217 926,067
20220914
ii. Securitized commodities held by the bank as the originator for the purpose of credit enhancement In NT$ thousand
Name of Securities
Currency
Purchase Date
Maturity Date
Coupon Rate
Credit Rating
Method of Interest
Payment & Principal
Repayment
Initial Cost
Cumulative Valuation Gain or
Loss
Cumulative Impairment
Carrying Amount
Attachment Point
Details of
Asset Pool
None
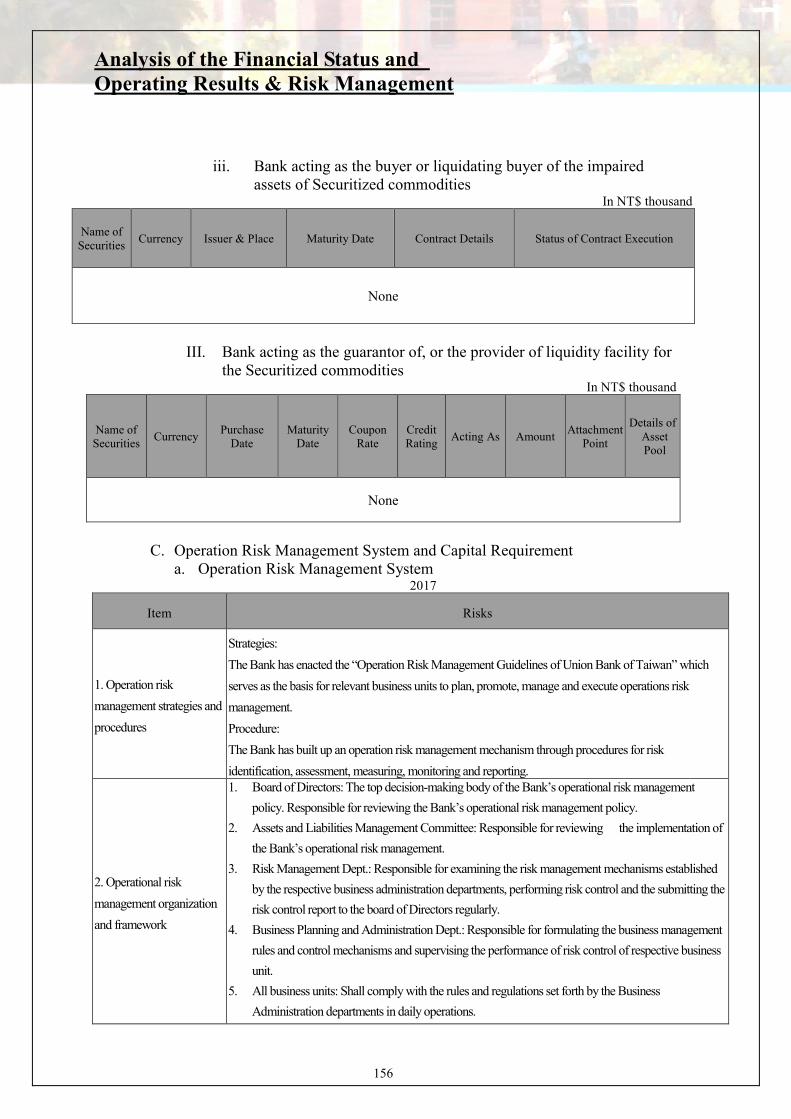
Analysis of the Financial Status and Operating Results & Risk Management
156
iii. Bank acting as the buyer or liquidating buyer of the impaired assets of Securitized commodities
In NT$ thousand
Name of Securities
Currency Issuer & Place Maturity Date Contract Details Status of Contract Execution
None
III. Bank acting as the guarantor of, or the provider of liquidity facility for
the Securitized commodities In NT$ thousand
Name of Securities
Currency
Purchase Date
Maturity Date
Coupon Rate
Credit Rating
Acting As Amount Attachment
Point
Details of Asset Pool
None
C. Operation Risk Management System and Capital Requirement
a. Operation Risk Management System 2017
Item Risks
1. Operation risk
management strategies and
procedures
Strategies:
The Bank has enacted the “Operation Risk Management Guidelines of Union Bank of Taiwan” which
serves as the basis for relevant business units to plan, promote, manage and execute operations risk
management.
Procedure:
The Bank has built up an operation risk management mechanism through procedures for risk
identification, assessment, measuring, monitoring and reporting.
2. Operational risk
management organization
and framework
1. Board of Directors: The top decision-making body of the Bank’s operational risk management
policy. Responsible for reviewing the Bank’s operational risk management policy.
2. Assets and Liabilities Management Committee: Responsible for reviewing the implementation of
the Bank’s operational risk management.
3. Risk Management Dept.: Responsible for examining the risk management mechanisms established
by the respective business administration departments, performing risk control and the submitting the
risk control report to the board of Directors regularly.
4. Business Planning and Administration Dept.: Responsible for formulating the business management
rules and control mechanisms and supervising the performance of risk control of respective business
unit.
5. All business units: Shall comply with the rules and regulations set forth by the Business
Administration departments in daily operations.

Analysis of the Financial Status and Operating Results & Risk Management
157
Item Risks
3. Scope and characteristics
of the operational risk
reporting and measurement
system
1 The Bank adapts the “Guidelines for Collection of Operational Risk Information” and establishes the
“Operational Risk Reporting System” for all departments to report any operational risk incident to the
Risk Management Dept.
2 The Bank has put in place the “Operational Risk Indicators”. Upon setting the control
frequency and risk warning standards, the relevant departments are responsible for
providing the risk indicator values based on the risk control frequency to the Risk
Management Dept. Improvement measures are taken to address any risks that exceeded
the set standards.
3 The Bank has adopted the “Guidelines for Operational Risk Control Self-Assessment”
and established the “Operational Risk Control Self-Assessment” database to carry out
the operational risk control self-assessment throughout the Bank periodically.
4 The Risk Management Dept. reports the status control of “Operational risk events”,
“Operational risk indicators” and “Operational risk control self-assessment” to the
Assets and Liabilities Management Committee and Board of Directors on a regular
basis.
4. Operational risk hedging
or risk reduction policies,
and strategies and
procedures for monitoring
the effectiveness of
hedges and risk reduction
tools
1. The Bank evaluates the frequency and level of influence with respect to operation risk confronted and
adopts a series of risk reduction measures such as insurance, outsourcing operation, procedure
improvement, personnel training enhancement, urgent response actions set up and risk hedging.
2. The Bank takes every possible operation risk into consideration and build up acceptable action
measures while enacting operation manual for core products. In addition, External and internal
auditing are the enhancements of operation risk prevention.
3. Risk Management Dept. informs Assets and Liabilities Management Committee about
operation risk incidents collected quarterly and reports the Board of Director the operation risk control
status of all business biannually.
5. Method used to provide
the legal capital
Basic Indicator Approach.
b. Operation Risk Capital Requirement as of Dec.31, 2017
In NT$ thousand
Year Gross profit Capital requirement
2015 9,542,818
2016 9,547,482
2017 9,688,238
Total 28,778,538 1,438,927

Analysis of the Financial Status and Operating Results & Risk Management
158
D. Market Risk Management System and Capital Requirement a. Market Risk Management System-2017
Item Contents
1. Market risk management
strategies and procedures
1. The Bank has enacted “UNION BANK market risk management principle” approved
by the Board of Directors, as the basis for market risk management.
2. The management procedure of market risk management contains the following five
processes:
(1) Risk Identification: For items on/off the Balance Sheet, the bank identify the market risk factors of various products and investment business to evaluate the risk and define management procedure and control mechanism.
(2) Risk Measurement: To cope with market risk quantification, there is at least one assessment tool for each investment or transaction. The assessment tools include mark-to-market, nominal principal, sensitivity analysis, value at risk and pressure test.
(3) Risk Monitoring: Clearly define risk limits on relevant operation regulations for all business and monitor by frequency. Risk Management Dept. is in charge of the summarization and presentation of market risks for the Bank.
(4) Risk Reporting: Risk Reporting is divided into routine reporting, overrun reporting and exceptional reporting. Routine reports are distributed to proper authorized level in accordance with the List of Separation of Duties; overrun reports should explain overrun status and suggest responsive measures; Exception reports are submitted by business unit before an event due to temporary business needs.
(5) Risk reduction: Risk reduction procedures such as risk hedging, investment portfolio adjustment, position allocation, stop-loss and close new transactions.
2. Market risk management
organization and framework
1. Board of Directors: The top decision-making body of the Bank’s market risk management policy responsible for examining and approving the Bank’s market risk policy and the total risk limit targets for all businesses, and setting and modifying the Bank’s market risk management organization structure.
2. Asset and Liability Management Committee: Examine the management reports and information submitted by risk management department and the business units.
3. Risk Management Dept.: It is a dedicated independent risk management unit executing three pillars related operation of BASEL Π market risk, planning and building market risk measuring tools, and monitoring according to the risk limits for different products.
4. Business Units: responsible for the execution of daily market risk management for the business they handle, and reporting the market risk and investment status related information to proper authorization level.
3. Scope and characteristics of
the market risk reporting and
measurement system
1. Market Risk evaluated trading book position for various financial products and use fair market value or evaluation model as basis to regularly evaluate the profit/loss condition of the position held.
2. All business units and Risk Management Department should make relevant management reports regularly and submit to proper authorization level.
3. Market risk management system combine with front-desk trading position and middle desk evaluation to generate sufficient information for assisting all management levels to execute each individual risk monitoring task, and can support the capital calculation method selected by a bank to generate relevant internal and
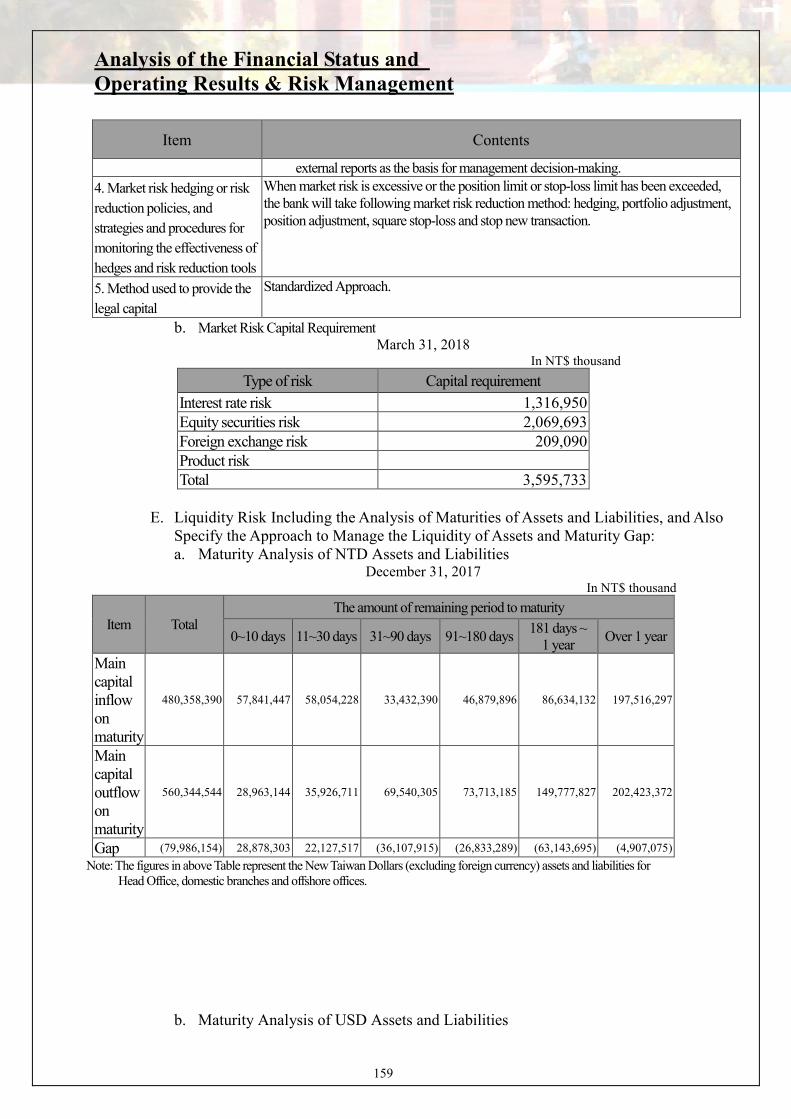
Analysis of the Financial Status and Operating Results & Risk Management
159
Item Contents
external reports as the basis for management decision-making.
4. Market risk hedging or risk
reduction policies, and
strategies and procedures for
monitoring the effectiveness of
hedges and risk reduction tools
When market risk is excessive or the position limit or stop-loss limit has been exceeded, the bank will take following market risk reduction method: hedging, portfolio adjustment, position adjustment, square stop-loss and stop new transaction.
5. Method used to provide the
legal capital
Standardized Approach.
b. Market Risk Capital Requirement March 31, 2018
In NT$ thousand
Type of risk Capital requirement
Interest rate risk 1,316,950 Equity securities risk 2,069,693 Foreign exchange risk 209,090 Product risk Total 3,595,733
E. Liquidity Risk Including the Analysis of Maturities of Assets and Liabilities, and Also
Specify the Approach to Manage the Liquidity of Assets and Maturity Gap: a. Maturity Analysis of NTD Assets and Liabilities
December 31, 2017 In NT$ thousand
Item Total The amount of remaining period to maturity
0~10 days 11~30 days 31~90 days 91~180 days 181 days ~
1 year Over 1 year
Main capital inflow on maturity
480,358,390 57,841,447 58,054,228 33,432,390 46,879,896 86,634,132 197,516,297
Main capital outflow on maturity
560,344,544 28,963,144 35,926,711 69,540,305 73,713,185 149,777,827 202,423,372
Gap (79,986,154) 28,878,303 22,127,517 (36,107,915) (26,833,289) (63,143,695) (4,907,075)
Note: The figures in above Table represent the New Taiwan Dollars (excluding foreign currency) assets and liabilities for Head Office, domestic branches and offshore offices.
b. Maturity Analysis of USD Assets and Liabilities

Analysis of the Financial Status and Operating Results & Risk Management
160
December 31, 2017 In US$ thousand
Item Total The amount of remaining period to maturity
1~30 days 31~90 days 91~180 days 181 days ~1 year Over 1 year
Main capital inflow on maturity
3,323,479 483,526 466,456 168,450 512,438 1,692,609
Main capital outflow on maturity
2,929,180 1,135,576 510,754 343,293 532,066 407,491
Gap 394,299 (652,050) (44,298) (174,843) (19,628) 1,285,118
Note: The figures in above Table represent the foreign currency (in USD equivalent) assets and liabilities for the Head Office, domestic branches and offshore offices.
c. Approach to Manage Assets and Liabilities i. The Bank’s assets and liabilities management mechanism applies the asset
and liability interest rate sensitivity and gap analysis for control purpose. Presently, the Bank has set up the Assets and Liabilities Management Committee to provide guidance and policy instruction and, to manage interest rate fluctuations and gaps. In addition to fully monitoring on interest rate, senior executive meetings are called from time to time as needed to exercise overall adjustment and review the Bank’s asset and liabilities structure, and present result to the Committee for approval.
ii. For the interest rate risk of NTD and foreign currencies, the Bank employ
well-established trading and funding MIS to manage daily changes of deposit and loan amounts, as well as the cost and balance of deposits in various types and terms. In addition, it will produce the analysis of floating and fixed interest rate deposits and loans, the analysis of interest rate sensitivity and the analysis of interest rate spread. The Bank will utilize above mentioned information and analyses to set up strategies for interest rate adjustment.
iii. For foreign exchange risk, the Bank has designed independent and related
procedures for transaction settlement, and has also applied the position control, individual trader position control and stop-loss control etc.
iv. For liquidity risk, the Bank strictly monitor cash on hands and the movement
of deposits and loans every day. Meanwhile, the Bank has also launched the mechanism to forecast, measure,calculate and early warning for future needs and changes of funding so as to realize current assets to meet the needs.
(2) Domestic and Global Changes in Government Policies and Legal Environment,
and the Effect on the Financial and Operational Status of the Bank, and Response Actions thereof:
A. The FSC has relaxed its restrictions and given banks more room to invest.
The Bank’s investment limit is now determined based on “net worth,” which should allow greater freedom.
B. New amendments to the Personal Information Protection Act “Special Personal Data” require that “special personal data” be collected, processed or

Analysis of the Financial Status and Operating Results & Risk Management
161
used with the written consent of the data subject, the “written consent” for the existing “general personal data” to be collected, processed or used is amended to only “consent” and no longer limited in writing, and a supplementary notification is given after indirect collection. The Bank has revised the Notices for Personal Information Protection and the personal information files security maintenance plan accordingly. The evaluation shows that there should be no need to increase the cost of manpower and material resources and expenses.
C. For the Principle of Fair Treatment of Customers for the Financial Service Industry newly promulgated by the Financial Supervisory Commission, the contents of which include nine principles: the principle of fair and honest in contract engagement, the principle of duty of care and loyalty, the principle of truthfulness in marketing and advertising, the principle of product or service suitability, the principle of notification and disclosure, the principle of selling complex high risk products, the principle of balanced remuneration structures, the principle of customer complaint handling, and the principle of professionalism of sales people. The Bank has formulated the policy for fair treatment of customers and the implementation strategy for fair treatment of customers to enhance employee awareness of the Bank on financial consumer protection and compliance with the relevant laws and regulations regarding financial consumer protection. The evaluation shows that the future compensation for risks and expenses of financial consumers should be able to be reduced.
D. Regarding the “Money Laundering Control Act” amended and published by the president of R.O.C., the Financial Supervisory Commission has additionally mandated the “Regulations Governing Anti-Money Laundering of Financial Institutions”, and revised relevant sub-laws such as “Directions Governing Internal Control System of Anti-Money Laundering and Countering Terrorism Financing of Banking Business, Electronic Payment Institutions and Electronic Stored Value Card Issuers”. The Bankers Association, Trust Association, Bills Finance Association and Taiwan Securities Association will continually revise their compliance modules. The Bank has formulated “Notices for Anti- Money Laundering and Terrorist Financing”, supervised each department in executing the internal control system of anti- money laundering and terrorist financing, and evaluated the additional human resource needed, educational training, and the cost and expense of the IT system.
E. In order to enhance financial holding companies’ focus on legal compliance of the banking industry and anti- money laundering and terrorist financing, the FSC has put more restrictions on the qualification, professional training and role function of legal compliance personnel and supervisors. At the same time, the reporting mechanism of financial holding companies and banks has been strengthened, and the “Implementation Rules of Internal Audit and Internal Control System of Financial Holding Companies and Banking Industries” have also been amended. The Bank has revised its legal compliance implementation rules and the guidelines for self-evaluation of legal compliance system. Although the stricter qualification and on-the-job training of legal compliance supervisors and personnel will increase costs and expenses, it shall be able to effectively lower the Bank’s legal compliance risk.
Analysis of the Financial Status and Operating Results & Risk Management
162
(3) The Effect of Technological and Industrial Changes on the Bank’s Financial
Position and its Response Actions thereof: Third party payment, Internet banking, cloud service, mobile payment, blockchain application, biological identification and big data are bringing rapid and irreversible changes to customers’ behaviors and spending patterns, and are revolutionizing the ways banking services are delivered. Arrival of the digital banking era means that many conventional banking services will be automated and replaced by machines, and banks will no longer rely on branches to carry out services as much as they used to. In response to digital banking, the Bank will be introducing new services, training programs, and solutions to help employees through the transition.
(4) The effect of change in the Bank’s corporate image on the Bank and its response
actions: To continue to rejuvenate our brand and expand new customers, the Bank plans on brand image advertising, while making cross-use of television, printing, out-of-home media, and emerging media such as network community and mobile devices for promotion to enhance brand visibility. It also creates a new look for the brand through the spokesperson, the mascot Mykonos, sponsoring cross-industry alliances and participating in public welfare activities, and so on to create a new look brand and improve the brand image and visibility of the Bank. In addition to adopting a spokesperson system, the Bank also has a set of “Union Bank of Taiwan Crisis Management Guidelines” and “Inside Material Information Procedures” in place to ensure proper communication with the media, and avoid public relation crises that would hurt the corporate image. Should a corporate image crisis arise, the issue will be escalated to the accountable department according to SOP. Meanwhile, the public will be addressed through the spokesperson in an appropriate manner to prevent damage from spreading, and thereby protect the Bank’s reputation and brand image.
(5) Expected Result and Possible Risks of Mergers and Acquisitions and Response Actions
thereof: None (6) Expected Result for Establishing More Business Locations, Possible Risk and Response
Actions Thereof: The establishment of business unit will not only increase transaction volume of deposits/loans/wealth management but also improve profits as well as provide comprehensive services to our customers. Effectively nevertheless, there is possibility that the economy of scale may not be achieved due to poor branch location or the business activities may be below our expectation. The Bank will then access the needs for relocation.
(7) Risk in the Over Concentration of Business and Response Action thereof: When business is concentrated, it could easily make business income source over-concentrated in one single industry or single customer group. It is vulnerable to industry cycle and could heighten the risks borne by the Bank. The Bank’s current credit and investment related business are all based on and executed within the internal quota policy. The Bank has set regulations such as
Analysis of the Financial Status and Operating Results & Risk Management
163
“Credit/Market Risk Management Guideline”, “Regulations governing the Management of Enterprise Group Credit Risk”, “Foreign Currency Security Investment Processing Guideline”, “Foreign Currency Credit and Country Risk Management Approach”, and “Investment Policy” to strenghten the management of risk quota for all business. The Bank’s Risk Management Department also monitors credit quota, controls status and reports the credit concentration regularly to Asset and Liability Management Committee and the Board of Directors.
(8) The Effect of Change in the Management of the Bank, Possible Risk and Response Action Thereof: The Bank was founded with the mission for sustainable operation. We maintain the management concepts of “Enthusiasm”, “Stability”, “Efficiency” and “Innovation” to provide financial products and services that meet the needs of customers and to service the general public. The Bank employs professional managerial officers to manage the businesses and as such, the Bank’s business management will not change or be impacted significantly as a result of changes in management power. The Bank shall provide the relevant internal management information and enhance the transparency of information disclosure in the event of a change in management power in order to secure investor and consumer confidence.
(9) The effect that large transfer in shares of director or supervisor, or shareholders
holding more than ten percent of shares of the company, Possible Risk and Response Action: There has been no significant change in share ownership of the Bank’s shareholders, directors and supervisors. The Bank employs professional managerial officers to manage the Bank’s business. Therefore, the Bank’s operational management wil not be impacted as a result of a significant change in share ownership. The Bank shall ensure infromation transparency in the event of a significant tranfer or change in share ownership and files a declaration and makes public announcement with respect to the changes in accordance with the relevant banking regulations to secure investor and consumer confidence.
(10) Legal Actions and Non-contentious Matters: None. (11) Other Major Risks and Response Actions thereof: None.
7. Contingency Plan The Bank has enacted the “Essential Points for Urgent Response Action to Disasters” and has set up a crisis management taskforce, urgent contact and report mechanism to execute the disaster rescue measures effectively. The various business units shall perform the disaster education training and drill in accordance with the Bank’s “Instructions to Safety Protection” and “Safety Protection Drill Implementation Plan”, and shall also check and maintain the safety facilities more than twice a year.
8. Other Important Matters: None

Affiliated and Special Notes
164
100%
49%%
1. Information on Affiliated Enterprises
(1) Organization Chart
Shareholding(%)
Amount in NT$ thousand
Name of Enterprise Date of
Establishment
Address Paid-in Capital
Main Business or Production Activities
Union Finance International (HK) Ltd 1996.04.23
Unit 18, 35/F, West Tower, Shun Tak Centre, 200 Connaught Road, Central, Hong Kong
TWD 106,589 Import and export financing
Union Information Technology Co., Ltd.
1998.08.10 10F, No. 109, Sec. 3, Minsheng E. Road, Taipei, Taiwan
TWD 10,000
IT and software services
Union Finance & Leasing (Int’l) Co., Ltd. 1996.11.11
9F, 137, Sec. 2, Nanking E. Road, Taipei, Taiwan
TWD 1,170,000 Installment purchases, leasing, auto loan and car rental business
Union Securities Investment Trust Co., Ltd.
1998.12.22 6F, 137, Sec. 2, Nanking E. Road, Taipei, Taiwan
TWD 300,000 Securities investment trust
Union Capital (Cayman) Corp.
1997.07.23 P.O.Box 1034,George Town, Grand Cayman, Cayman Islands, British West Indies.
USD50 Installment purchase and lease investment businesses
New Asian Ventures Ltd.
1997.10.27 P.O.Box 957,Offshore Incorporations Centre,Road Town,Tortola , British Virgin Islands.
- Installment purchase and lease investment businesses
Union Capital (Singapore)Holding Pte. Ltd.
2014.9.12
50 RAFFLES PLACE #25-03 SINGAPORE LAND TOWER SINGAPORE (048623)
- Lease investment businesses。
Uni
on B
ank
of T
aiw
an C
o., L
td.
Union Finance
Int’l (HK) Ltd
Union Information
Technology Co.,Ltd
Union Finance
&Leasing (Int’l)
Union Securities
Investment Trust Co.,Ltd
99.99%
99.99%
100%
35%
100%
100%
Union Capital
(Cayman) Corp.
New Asian
Venture Ltd 31%
100%
Kabuskiki Kaisha
UCJ1
Tokutei Mokuteki
Kaisha SSG15
Union Capital (Singapore) Holding Pte.
Ltd.
51%
Kabuskiki Kaisha
UCJ1
UFLC Capital
(Singapore) Holding
Pte. Ltd.
Tokutei Mokuteki
Kaisha SSG16
Tokutei Mokuteki
Kaisha SSG12
Tokutei Mokuteki
Kaisha SSG17
Tokutei Mokuteki
Kaisha SSG16
51%
51%
49%
69%
49%

Affiliated and Special Notes
165
UFLC Capital (Singapore)Holding Pte. Ltd.
2016.3.11
50 RAFFLES PLACE #25-03 SINGAPORE LAND TOWER SINGAPORE (048623)
- Lease investment businesses。
Kabuskiki Kaisha UCJ1 2014.9.12 1 Chome 11, Kanda Jinbocho,
Chiyoda ,Tokyo, Japan JPY1,043,800 Lease investment businesses。
Tokutei Mokuteki Kaisha SSG15
2014.9.19 1 Chome 11, Kanda Jinbocho,
Chiyoda ,Tokyo , Japan JPY1,430,200 Lease investment businesses。
Tokutei Mokuteki Kaisha SSG12
2016.2.25 1 Chome 11, Kanda Jinbocho,
Chiyoda ,Tokyo , Japan JPY1,930,200 Lease investment businesses。
Tokutei Mokuteki Kaisha SSG16
2016.3.31 1 Chome 11, Kanda Jinbocho,
Chiyoda ,Tokyo , Japan JPY2,530,200 Lease investment businesses。
(2) Information on Directors, Supervisors and President of Affiliated Enterprises
December 31, 2017
Name of Enterprise
Title Name of Representative
Shareholding
Shares %
Union Finance
International (HK) Ltd
Director Union Bank of Taiwan (Representative: Jeff Lin) 30,000,000 99.999993%
Director Shiang-Chang Lee 2 0.000007%
Director Union Bank of Taiwan (Representative: Cheng-Yu Liu) - 0.00%
Director Union Bank of Taiwan (Representative: Connie Tseng) - 0.00%
Director & President Union Bank of Taiwan (Representative: Amanda Lin) - 0.00%
Union Information
Technology Co.,
Ltd.
Chairman Union Bank of Taiwan (Representative: Angela Shen)
999,923 99.99%Director Union Bank of Taiwan (Representative: Cheng-Yu Liu)
Director Union Bank of Taiwan (Representative: Luke Yang)
Supervisor
Ling-Rong, Xiong 0 0%
President Angela Shen 0 0.00%
Union Finance &
Leasing
(International) Co.,
Ltd.
Chairman Union Bank of Taiwan (Representative: Wei-Shin Shen)
117,000,000100.00%Director Union Bank of Taiwan (Representative: Herman Tu)
Director Union Bank of Taiwan (Representative: Cheng-Juh Hsieh)
Supervisor Union Bank of Taiwan (Representative: Yin-Bor Chan)
President Wei-Shin Shen 0 0.00%
Union Securities
Investment Trust
Co., Ltd.
Chairman Union Bank of Taiwan (Representative: Ming-Hsing Ho)
10,500,000 35%Director Union Bank of Taiwan (Representative: Herman Tu)
Director Union Bank of Taiwan (Representative: Ting-Wan Hsu)
Supervisor Kun-Che Investment Co., Ltd. (Representative: Wen-Ming Lee)) 5,399,667
17.99%
President Lin-Yu Fan 00.00%
Union Capital
(Cayman) Corp
Director Union Finance & Leasing (International) Co., Ltd. (Representative: Wei-Shin Shen)
50,000 100%
Director Union Finance & Leasing (International) Co., Ltd.
(Representative: Cheng-Juh Hsieh)
New Asian Ventures
Ltd.
Director Union Finance & Leasing (International) Co., Ltd.
(Representative: Wei-Shin Shen) 1 100%
Director Union Finance & Leasing (International) Co., Ltd. (Representative: Cheng-Juh Hsieh)
Union Capital (Singapore) Holding Pte. Ltd.
Director Union Capital (Cayman) Corp (Representative: Wei-Shin Shen)
1 100.00%
Director Union Capital (Cayman) Corp (Representative: Ru-Jwu Tsai)
0 0
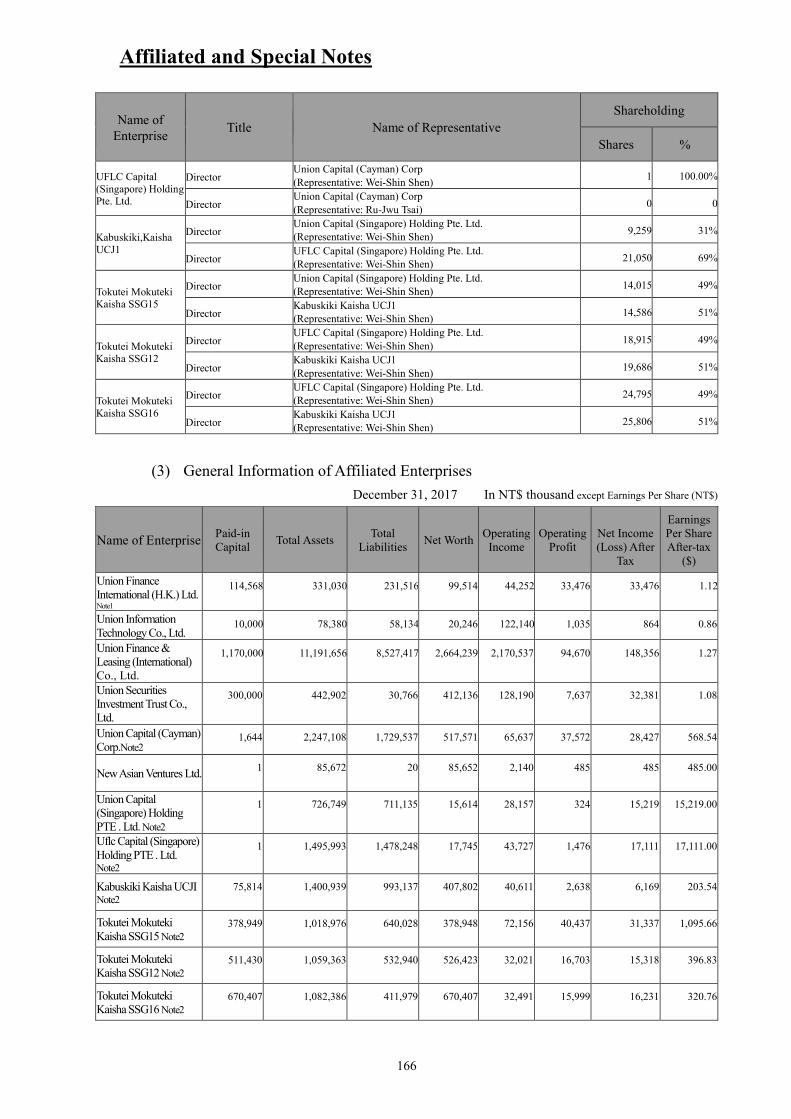
Affiliated and Special Notes
166
Name of Enterprise
Title Name of Representative
Shareholding
Shares %
UFLC Capital (Singapore) Holding Pte. Ltd.
Director Union Capital (Cayman) Corp
(Representative: Wei-Shin Shen) 1 100.00%
Director Union Capital (Cayman) Corp
(Representative: Ru-Jwu Tsai) 0 0
Kabuskiki,Kaisha UCJ1
Director Union Capital (Singapore) Holding Pte. Ltd. (Representative: Wei-Shin Shen)
9,259 31%
Director UFLC Capital (Singapore) Holding Pte. Ltd. (Representative: Wei-Shin Shen)
21,050 69%
Tokutei Mokuteki Kaisha SSG15
Director Union Capital (Singapore) Holding Pte. Ltd. (Representative: Wei-Shin Shen)
14,015 49%
Director Kabuskiki Kaisha UCJ1 (Representative: Wei-Shin Shen)
14,586 51%
Tokutei Mokuteki Kaisha SSG12
Director UFLC Capital (Singapore) Holding Pte. Ltd.
(Representative: Wei-Shin Shen) 18,915 49%
Director Kabuskiki Kaisha UCJ1
(Representative: Wei-Shin Shen) 19,686 51%
Tokutei Mokuteki Kaisha SSG16
Director UFLC Capital (Singapore) Holding Pte. Ltd. (Representative: Wei-Shin Shen)
24,795 49%
Director Kabuskiki Kaisha UCJ1 (Representative: Wei-Shin Shen)
25,806 51%
(3) General Information of Affiliated Enterprises
December 31, 2017 In NT$ thousand except Earnings Per Share (NT$)
Name of Enterprise Paid-in Capital
Total Assets Total
Liabilities Net Worth
Operating Income
Operating Profit
Net Income (Loss) After
Tax
Earnings Per Share After-tax
($)
Union Finance International (H.K.) Ltd. Note1
114,568 331,030 231,516 99,514 44,252 33,476 33,476 1.12
Union Information Technology Co., Ltd.
10,000 78,380 58,134 20,246 122,140 1,035 864 0.86
Union Finance & Leasing (International) Co., Ltd.
1,170,000 11,191,656 8,527,417 2,664,239 2,170,537 94,670 148,356 1.27
Union Securities Investment Trust Co., Ltd.
300,000 442,902 30,766 412,136 128,190 7,637 32,381 1.08
Union Capital (Cayman) Corp.Note2
1,644 2,247,108 1,729,537 517,571 65,637 37,572 28,427 568.54
New Asian Ventures Ltd. 1 85,672 20 85,652 2,140 485 485 485.00
Union Capital (Singapore) Holding PTE . Ltd. Note2
1 726,749 711,135 15,614 28,157 324 15,219 15,219.00
Uflc Capital (Singapore) Holding PTE . Ltd. Note2
1 1,495,993 1,478,248 17,745 43,727 1,476 17,111 17,111.00
Kabuskiki Kaisha UCJI Note2
75,814 1,400,939 993,137 407,802 40,611 2,638 6,169 203.54
Tokutei Mokuteki Kaisha SSG15 Note2
378,949 1,018,976 640,028 378,948 72,156 40,437 31,337 1,095.66
Tokutei Mokuteki Kaisha SSG12 Note2
511,430 1,059,363 532,940 526,423 32,021 16,703 15,318 396.83
Tokutei Mokuteki Kaisha SSG16 Note2
670,407 1,082,386 411,979 670,407 32,491 15,999 16,231 320.76

Affiliated and Special Notes
167
Note1: HKD/TWD: 3.818931 for Asset and Liability items; HKD/TWD: 3.890378 for P/L items
Note 2 : JPY/TWD: 0.264962 for Asset and Liability items JPY/TWD: 0.270703 for P/L Items
(4) Consolidated Financial Reports of affiliated enterprises: please refer to
Appendix.
(5) Report on relationships between the business activities conducted by affiliated
enterprises: please refer to Appendix.
2. Private placement of marketable securities and financial
debentures in the past year and current year up to the printing date
of the annual report: None.
3. Shares of the Bank held or disposed of by subsidiaries in the past
year and current year up to the printing date of the annual report:
None.
4. Other necessary supplements: None.
5. In the past year and current year up to the printing date of the
annual report, any event which has a material impact on
shareholders’ equity or securities prices pursuant to Article 36.2.2
of the Security and Exchange Law: None.

Bank Directory
168
Bank Directory
Branch Name Address Telephone
Head Office 3F, No.109, Sec. 3, Minsheng E. Rd., Songshan District, Taipei City 105, Taiwan (R.O.C.) (02)2718-0001
International Banking Dept 2F, No.109, Sec. 3, Minsheng E. Rd., Songshan District, Taipei City 105, Taiwan (R.O.C.) (02)2718-0001
Trust Department 3F, No.137, Sec. 2, Nanjing E. Rd., Chungshan District, Taipei City 104, Taiwan (R.O.C.) (02)2507-4066
Credit & Payment Dept. 5F, No.399, Rueiguang Rd., Neihu District, Taipei City 114, Taipei City 105, Taiwan (R.O.C.) (02)2719-2233
Offshore Banking Branch 2F, No.109, Sec. 3, Minsheng E. Rd., Songshan District, Taipei City 105, Taiwan (R.O.C.) (02)2718-0001
Taipei Branch No.105, Sec. 1, Chengde Rd., Datong District, Taipei City 103, Taiwan (R.O.C.) (02)2556-8500
Business Department 1F, No.109, Sec. 3, Minsheng E. Rd., Songshan District, Taipei City 105, Taiwan (R.O.C.) (02)2718-0001
Changchun Branch No.328, Changchun Rd., Jhongshan District, Taipei City 104, Taiwan (R.O.C.) (02)2545-5588
Nanking East Road Branch No.137, Sec. 2, Nanjing E. Rd., Jhongshan District, Taipei City 104, Taiwan (R.O.C.) (02)2515-1333
East Taipei Branch No.217, Sec. 5, Nanjing E. Rd., Songshan District, Taipei City 105, Taiwan (R.O.C.) (02)2753-0900
Chunghsiao Branch 2F., No.5, Lane 223, Sec. 4, Jhongsiao E. Rd., Da-an District, Taipei City 106, Taiwan (R.O.C.) (02)2773-3456
Jenai Branch No.179, Yanji St., Da’an District, Taipei City 106, Taiwan (R.O.C.) (02)2781-3366
Tungmen Branch No.101, Sec. 2, Sinyi Rd., Jhongjheng District, Taipei City 100, Taiwan (R.O.C.) (02)2358-2345
Hoping Branch No.68-2, Sec. 3, Heping E. Rd., Da-an District, Taipei City 106, Taiwan (R.O.C.) (02)2735-2828
Chungshan Mini Branch No.83, Sec. 2, Jhongshan N. Rd., Jhongshan District, Taipei City 104, Taiwan (R.O.C.) (02)2571-7890
Kungkuan Branch No.272, Sec. 3, Roosevelt Rd., Jhongjheng District, Taipei City 100, Taiwan (R.O.C.) (02)2369-2678
Sungchiang Branch No.228, Songjiang Rd., Jhongshan District, Taipei City 104, Taiwan (R.O.C.) (02)2561-6601
Breeze Center Mini Branch 2F., No.39, Sec. 1, Fusing S. Rd., Songshan District, Taipei City 105, Taiwan (R.O.C.) (02)8772-2858
Tunhwa Branch No.209-1, Sec. 1, Dunhua S. Rd., Da-an District, Taipei City 106, Taiwan (R.O.C.) (02)8773-3588
Taan Branch No.165, Sec. 4, Hsin-I. Rd., Da-an District, Taipei City 106, Taiwan (R.O.C.) (02)2704-9588
Tonghwa Mini Branch No.74, Tonghua St., Da-an District, Taipei City 106, Taiwan (R.O.C.) (02)2739-5888
Yongchun Branch No.453, Sec. 5, Jhongsiao E. Rd., Sinyi District, Taipei City 110, Taiwan (R.O.C.) (02)2748-0188
Yungchi Branch No.306, Yongji Rd., Sinyi District, Taipei City 110, Taiwan (R.O.C.) (02)2748-0329
Neihu branch No.399, Rueiguang Rd., Neihu District, Taipei City 114, Taiwan (R.O.C.) (02)2658-6121

Bank Directory
169
Branch Name Address Telephone
Donghu Branch No.150-3, Sec. 6, Minquan E. Rd., Neihu District, Taipei City 114, Taiwan (R.O.C.) (02)-2796-7779
Hsihu Branch No.88, Sec. 1, Neihu Rd., Neihu District, Taipei City 114, Taiwan (R.O.C.) (02)8797-1537
Tachih Branch No.649, Mingshuei Rd., Jhongshan District, Taipei City 104, Taiwan (R.O.C.) (02)2532-3836
Shihtung Branch No.9, Lane 91, Shihdong Rd., Shihlin District, Taipei City 111, Taiwan (R.O.C.) (02)2875-6161
Wenlin Branch No.758, Wunlin Rd., Shihlin District, Taipei City 111, Taiwan (R.O.C.) (02)2835-1818
Beitou Mini Branch No.68, Sec. 1, Jhongyang N. Rd., Beitou District, Taipei City 112, Taiwan (R.O.C.) (02)2896-6333
Panchiao Branch No.226, Mincyuan Rd., Banciao District, New Taipei City 220, Taiwan (R.O.C.) (02)2965-6600
Houpu Branch No.77, Chongcing Rd., Banciao District, New Taipei City 220, Taiwan (R.O.C.) (02)2964-2777
Sanchung Branch No.10, Sec. 3, Chongsin Rd., Sanchong District, New Taipei City 241, Taiwan (R.O.C.) (02)2977-7666
North Sanchung Branch No.245, Jhengyi N. Rd., Sanchong District, New Taipei City 241, Taiwan (R.O.C.) (02)2982-6226
Tenshin Branch No.16, Sec. 3, Jhongsiao Rd., Sanchong District, New Taipei City 241, Taiwan (R.O.C.) (02)8982-1155
JiSian Branch No.329, Wuhua St., Sanchong Dist., New Taipei City 241, Taiwan (R.O.C.) (02)2855-9996
Sanxia Branch No.261, Xuecheng Rd., Sanxia Dist., New Taipei City 237, Taiwan (R.O.C.) (02)2673-0808
Luchou Branch No.80, Jhongjheng Rd., Lujhou District, New Taipei City 247, Taiwan (R.O.C.) (02)2848-5577
Chungho Branch No.150, Jian 1st Rd., Jhonghe District, New Taipei City 235, Taiwan (R.O.C.) (02)8226-5168
North Chungho Mini Branch No.146, Sec. 3, Jhongshan Rd., Jhonghe District, New Taipei City 235, Taiwan (R.O.C.) (02)2221-9698
Shuanho Branch No.222, Jhongjheng Rd., Yonghe District, New Taipei City 234, Taiwan (R.O.C.) (02)2945-9898
Yungho Branch No.137, Sec. 2, Yonghe Rd., Yonghe District, New Taipei City 234, Taiwan (R.O.C.) (02)8660-0808
Hsintien Branch No.102, Mincyuan Rd., Sindian District, New Taipei City 231, Taiwan (R.O.C.) (02)2219-9989
Ankang Branch No.161, Sec. 2, Ankang Rd., Sindian District, New Taipei City 231, Taiwan (R.O.C.) (02)2211-9088
Hsinchung Branch No.601, Sihyuan Rd., Sinjhuang District, New Taipei City 242, Taiwan (R.O.C.) (02)8522-7799
Fuguo Branch No.108, Fuguo Rd., Sinjhuang District, New Taipei City 242, Taiwan (R.O.C.) (02)2205-2299
Chungkung Mini Branch No.308, Jhonggang Rd., Sinjhuang District, New Taipei City 242, Taiwan (R.O.C.) (02)2276-9678
Wugu Branch No.6-1, Sec.3, Chengtai Rd., Wugu District, New Taipei City 248, Taiwan (R.O.C.) (02)2291-5888
Linkou Branch No.468, Jhongsiao Rd., Linkou District, New Taipei City 244, Taiwan (R.O.C.) (02)2600-6969
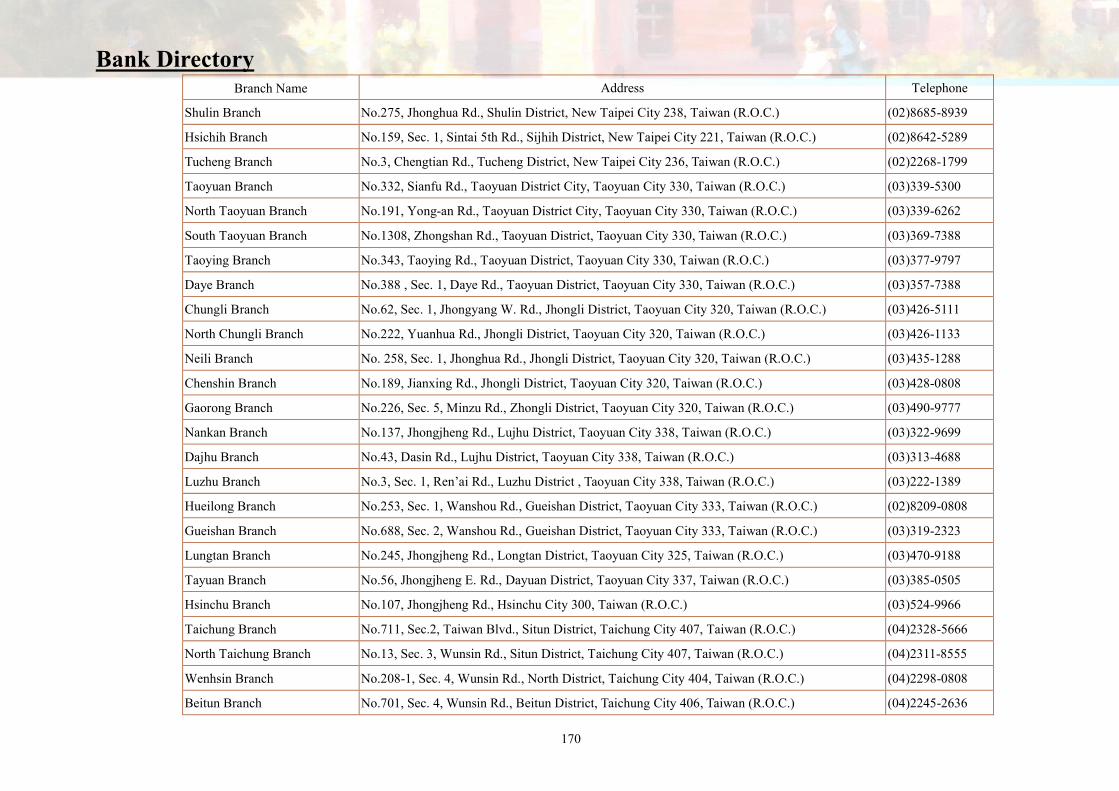
Bank Directory
170
Branch Name Address Telephone
Shulin Branch No.275, Jhonghua Rd., Shulin District, New Taipei City 238, Taiwan (R.O.C.) (02)8685-8939
Hsichih Branch No.159, Sec. 1, Sintai 5th Rd., Sijhih District, New Taipei City 221, Taiwan (R.O.C.) (02)8642-5289
Tucheng Branch No.3, Chengtian Rd., Tucheng District, New Taipei City 236, Taiwan (R.O.C.) (02)2268-1799
Taoyuan Branch No.332, Sianfu Rd., Taoyuan District City, Taoyuan City 330, Taiwan (R.O.C.) (03)339-5300
North Taoyuan Branch No.191, Yong-an Rd., Taoyuan District City, Taoyuan City 330, Taiwan (R.O.C.) (03)339-6262
South Taoyuan Branch No.1308, Zhongshan Rd., Taoyuan District, Taoyuan City 330, Taiwan (R.O.C.) (03)369-7388
Taoying Branch No.343, Taoying Rd., Taoyuan District, Taoyuan City 330, Taiwan (R.O.C.) (03)377-9797
Daye Branch No.388 , Sec. 1, Daye Rd., Taoyuan District, Taoyuan City 330, Taiwan (R.O.C.) (03)357-7388
Chungli Branch No.62, Sec. 1, Jhongyang W. Rd., Jhongli District, Taoyuan City 320, Taiwan (R.O.C.) (03)426-5111
North Chungli Branch No.222, Yuanhua Rd., Jhongli District, Taoyuan City 320, Taiwan (R.O.C.) (03)426-1133
Neili Branch No. 258, Sec. 1, Jhonghua Rd., Jhongli District, Taoyuan City 320, Taiwan (R.O.C.) (03)435-1288
Chenshin Branch No.189, Jianxing Rd., Jhongli District, Taoyuan City 320, Taiwan (R.O.C.) (03)428-0808
Gaorong Branch No.226, Sec. 5, Minzu Rd., Zhongli District, Taoyuan City 320, Taiwan (R.O.C.) (03)490-9777
Nankan Branch No.137, Jhongjheng Rd., Lujhu District, Taoyuan City 338, Taiwan (R.O.C.) (03)322-9699
Dajhu Branch No.43, Dasin Rd., Lujhu District, Taoyuan City 338, Taiwan (R.O.C.) (03)313-4688
Luzhu Branch No.3, Sec. 1, Ren’ai Rd., Luzhu District , Taoyuan City 338, Taiwan (R.O.C.) (03)222-1389
Hueilong Branch No.253, Sec. 1, Wanshou Rd., Gueishan District, Taoyuan City 333, Taiwan (R.O.C.) (02)8209-0808
Gueishan Branch No.688, Sec. 2, Wanshou Rd., Gueishan District, Taoyuan City 333, Taiwan (R.O.C.) (03)319-2323
Lungtan Branch No.245, Jhongjheng Rd., Longtan District, Taoyuan City 325, Taiwan (R.O.C.) (03)470-9188
Tayuan Branch No.56, Jhongjheng E. Rd., Dayuan District, Taoyuan City 337, Taiwan (R.O.C.) (03)385-0505
Hsinchu Branch No.107, Jhongjheng Rd., Hsinchu City 300, Taiwan (R.O.C.) (03)524-9966
Taichung Branch No.711, Sec.2, Taiwan Blvd., Situn District, Taichung City 407, Taiwan (R.O.C.) (04)2328-5666
North Taichung Branch No.13, Sec. 3, Wunsin Rd., Situn District, Taichung City 407, Taiwan (R.O.C.) (04)2311-8555
Wenhsin Branch No.208-1, Sec. 4, Wunsin Rd., North District, Taichung City 404, Taiwan (R.O.C.) (04)2298-0808
Beitun Branch No.701, Sec. 4, Wunsin Rd., Beitun District, Taichung City 406, Taiwan (R.O.C.) (04)2245-2636
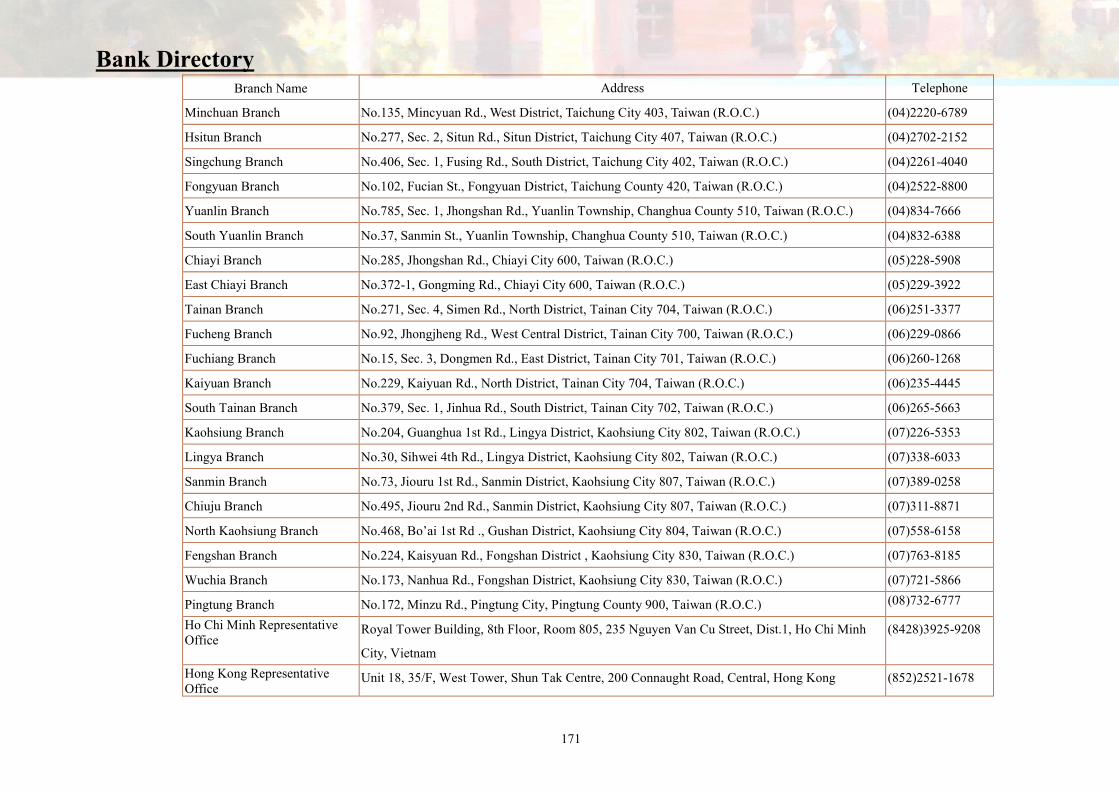
Bank Directory
171
Branch Name Address Telephone
Minchuan Branch No.135, Mincyuan Rd., West District, Taichung City 403, Taiwan (R.O.C.) (04)2220-6789
Hsitun Branch No.277, Sec. 2, Situn Rd., Situn District, Taichung City 407, Taiwan (R.O.C.) (04)2702-2152
Singchung Branch No.406, Sec. 1, Fusing Rd., South District, Taichung City 402, Taiwan (R.O.C.) (04)2261-4040
Fongyuan Branch No.102, Fucian St., Fongyuan District, Taichung County 420, Taiwan (R.O.C.) (04)2522-8800
Yuanlin Branch No.785, Sec. 1, Jhongshan Rd., Yuanlin Township, Changhua County 510, Taiwan (R.O.C.) (04)834-7666
South Yuanlin Branch No.37, Sanmin St., Yuanlin Township, Changhua County 510, Taiwan (R.O.C.) (04)832-6388
Chiayi Branch No.285, Jhongshan Rd., Chiayi City 600, Taiwan (R.O.C.) (05)228-5908
East Chiayi Branch No.372-1, Gongming Rd., Chiayi City 600, Taiwan (R.O.C.) (05)229-3922
Tainan Branch No.271, Sec. 4, Simen Rd., North District, Tainan City 704, Taiwan (R.O.C.) (06)251-3377
Fucheng Branch No.92, Jhongjheng Rd., West Central District, Tainan City 700, Taiwan (R.O.C.) (06)229-0866
Fuchiang Branch No.15, Sec. 3, Dongmen Rd., East District, Tainan City 701, Taiwan (R.O.C.) (06)260-1268
Kaiyuan Branch No.229, Kaiyuan Rd., North District, Tainan City 704, Taiwan (R.O.C.) (06)235-4445
South Tainan Branch No.379, Sec. 1, Jinhua Rd., South District, Tainan City 702, Taiwan (R.O.C.) (06)265-5663
Kaohsiung Branch No.204, Guanghua 1st Rd., Lingya District, Kaohsiung City 802, Taiwan (R.O.C.) (07)226-5353
Lingya Branch No.30, Sihwei 4th Rd., Lingya District, Kaohsiung City 802, Taiwan (R.O.C.) (07)338-6033
Sanmin Branch No.73, Jiouru 1st Rd., Sanmin District, Kaohsiung City 807, Taiwan (R.O.C.) (07)389-0258
Chiuju Branch No.495, Jiouru 2nd Rd., Sanmin District, Kaohsiung City 807, Taiwan (R.O.C.) (07)311-8871
North Kaohsiung Branch No.468, Bo’ai 1st Rd ., Gushan District, Kaohsiung City 804, Taiwan (R.O.C.) (07)558-6158
Fengshan Branch No.224, Kaisyuan Rd., Fongshan District , Kaohsiung City 830, Taiwan (R.O.C.) (07)763-8185
Wuchia Branch No.173, Nanhua Rd., Fongshan District, Kaohsiung City 830, Taiwan (R.O.C.) (07)721-5866
Pingtung Branch No.172, Minzu Rd., Pingtung City, Pingtung County 900, Taiwan (R.O.C.) (08)732-6777
Ho Chi Minh Representative Office
Royal Tower Building, 8th Floor, Room 805, 235 Nguyen Van Cu Street, Dist.1, Ho Chi Minh
City, Vietnam
(8428)3925-9208
Hong Kong Representative Office
Unit 18, 35/F, West Tower, Shun Tak Centre, 200 Connaught Road, Central, Hong Kong (852)2521-1678

APPENDIX

Union Bank of Taiwan Financial Statements for the Years Ended December 31, 2017 and 2016 and Independent Auditors’ Report

- 1 -
INDEPENDENT AUDITORS’ REPORT The Board of Directors and Stockholders Union Bank of Taiwan Opinion We have audited the accompanying financial statements of Union Bank of Taiwan (the Bank), which comprise the balance sheets as of December 31, 2017 and 2016, and the statements of comprehensive income, changes in equity and cash flows for the years then ended, and the notes to the financial statements, including a summary of significant accounting policies. In our opinion, the accompanying financial statements present fairly, in all material respects, the financial position of the Bank as of December 31, 2017 and 2016, and its financial performance and its cash flows for the years then ended in accordance with the Regulations Governing the Preparation of Financial Reports by Public Banks and Regulations Governing the Preparation of Financial Reports by Securities Firms. Basis for Opinion We conducted our audits in accordance with the Regulations Governing Auditing and Attestation of Financial Statements of Financial Institutions by Certified Public Accountants and auditing standards generally accepted in the Republic of China. Our responsibilities under those standards are further described in the Auditors’ Responsibilities for the Audit of the Financial Statements section of our report. We are independent of the Bank in accordance with The Norm of Professional Ethics for Certified Public Accountant of the Republic of China, and we have fulfilled our other ethical responsibilities in accordance with these requirements. We believe that the audit evidence we have obtained is sufficient and appropriate to provide a basis for our opinion. Key Audit Matters Key audit matters are those matters that, in our professional judgment, were of most significance in our audit of the financial statements for the year ended December 31, 2017. These matters were addressed in the context of our audit of the financial statements as a whole, and in forming our opinion thereon, and we do not provide a separate opinion on these matters. The key audit matters of the Bank’s financial statements for the year ended December 31, 2017 are described as follows: Accuracy of Interest Revenue from Discounts and Loans For the year ended December 31, 2017, the amount of interest revenue from discounts and loans was $6,342,642 thousand which, represented approximately 62% of total net revenue, and was considered material to the financial statements as a whole. Refer to Note 30 to the financial statements. Therefore, we considered the accuracy of the recognition of interest revenue as a key audit matter for the year ended December 31, 2017.

- 2 -
The main audit procedures we performed in response to certain aspects of the key audit matter described above were as follows: 1. Understanding of the design of the Bank’s computerized information system and General IT
Controls, and testing of the operating effectiveness of the controls over the relevant application system and the information generated.
2. Understanding of the design of the application system for recognition of commercial loans and
discounts and interest revenue. Testing of operating effectiveness of relevant automated controls in the application system.
3. Determination and verification of the classification of material loans. Verification if there is
any difference in the balance of loans generated by information system and carrying amount per book.
4. Testing and assessment of the accuracy of interest revenue generated by information system.
Verification if there is any difference in the interest revenue generated by information system and carrying amount per books.
Possible Impairment of Discounts and Loans As of December 31, 2017, the net amount of discounts and loans of the Bank was $318,624,348 thousand which, represented approximately 57% of total assets, and was considered material to the financial statements as a whole. Refer to Note 11 to the financial statements. The Bank’s management performs loan impairment assessment involving critical judgements on accounting estimates and assumptions; therefore, we determined allowance for possible losses on discounts and loans as a key audit matter for the year ended December 31, 2017. The Bank’s management performs loan impairment assessment through reviewing of portfolios of loans periodically, and makes a judgement on whether to recognize impairment loss per observable evidence indicating the probable occurrence of impairment events. The amount of impairment loss is the difference between the asset’s carrying amount and the present value of the estimated future cash flows with consideration of collaterals and guarantees, discounted at the financial asset’s original effective interest rate. In addition, the allowance provision must comply with relevant regulations issued by the authorities. For the accounting policies and relevant information on loan impairment assessment, refer to Notes 4, 5 and 12 to the financial statements. The main audit procedures we performed in response to certain aspects of the key audit matter described above were as follows: 1. Understanding and testing of the internal controls in respect of the Bank’s loan impairment
assessment process. 2. Impairment assessment of sample individual loans by:
Verifying the accuracy of the balance of loans. Verifying the payment of principal and interest, and the classification of credit assets
according to relevant regulations issued by the authorities. Assessing the assumptions used to estimate future cash flows and the reasonableness of the
value of collateral.

- 3 -
3. Impairment assessment of loans on collective basis by:
Verifying the classification of collectively assessed loans. Understanding the assumptions on critical factors of collectively assessed loans, including
the possibility of impairment and the recoverability of loan balances, used in the impairment assessment model, and verifying whether the estimates reasonably reflected the actual outcome for each loan portfolio.
Recalculating to confirm the amount of recognized impairment.
4. Verifying the classification of credit assets in order to assess whether the provision of
allowances for possible losses complied with relevant regulations issued by the authorities. Emphasis of Matter As stated in Notes 1 and 15 to the financial statements, on August 1, 2016, the Bank merged with Union Insurance Broker Company, a 100% owned subsidiary of the Bank. The merger was treated as a reorganization. Thus, the Bank restated its financial statements retrospectively. Our opinion is not modified in respect of this matter. Responsibilities of Management and Those Charged with Governance for the Financial
Statements Management is responsible for the preparation and fair presentation of the financial statements in accordance with the Regulations Governing the Preparation of Financial Reports by Public Banks and Regulations Governing the Preparation of Financial Reports by Securities Firms, and for such internal control as management determines is necessary to enable the preparation of financial statements that are free from material misstatement, whether due to fraud or error. In preparing the financial statements, management is responsible for assessing the Bank’s ability to continue as a going concern, disclosing, as applicable, matters related to going concern and using the going concern basis of accounting unless management either intends to liquidate the Bank or to cease operations, or has no realistic alternative but to do so. Those charged with governance, including the audit committee, are responsible for overseeing the Bank’s financial reporting process. Auditor’s Responsibilities for the Audit of the Financial Statements Our objectives are to obtain reasonable assurance about whether the financial statements as a whole are free from material misstatement, whether due to fraud or error, and to issue an auditors’ report that includes our opinion. Reasonable assurance is a high level of assurance, but is not a guarantee that an audit conducted in accordance with the auditing standards generally accepted in the Republic of China will always detect a material misstatement when it exists. Misstatements can arise from fraud or error and are considered material if, individually or in the aggregate, they could reasonably be expected to influence the economic decisions of users taken on the basis of these financial statements.

- 4 -
As part of an audit in accordance with the auditing standards generally accepted in the Republic of China, we exercise professional judgment and maintain professional skepticism throughout the audit. We also: 1. Identify and assess the risks of material misstatement of the financial statements, whether due
to fraud or error, design and perform audit procedures responsive to those risks, and obtain audit evidence that is sufficient and appropriate to provide a basis for our opinion. The risk of not detecting a material misstatement resulting from fraud is higher than for one resulting from error, as fraud may involve collusion, forgery, intentional omissions, misrepresentations, or the override of internal control.
2. Obtain an understanding of internal control relevant to the audit in order to design audit
procedures that are appropriate in the circumstances, but not for the purpose of expressing an opinion on the effectiveness of the Bank’s internal control.
3. Evaluate the appropriateness of accounting policies used and the reasonableness of accounting
estimates and related disclosures made by management. 4. Conclude on the appropriateness of management’s use of the going concern basis of
accounting and, based on the audit evidence obtained, whether a material uncertainty exists related to events or conditions that may cast significant doubt on the Bank’s ability to continue as a going concern. If we conclude that a material uncertainty exists, we are required to draw attention in our auditors’ report to the related disclosures in the financial statements or, if such disclosures are inadequate, to modify our opinion. Our conclusions are based on the audit evidence obtained up to the date of our auditors’ report. However, future events or conditions may cause the Bank to cease to continue as a going concern.
5. Evaluate the overall presentation, structure and content of the financial statements, including
the disclosures, and whether the financial statements represent the underlying transactions and events in a manner that achieves fair presentation.
6. Obtain sufficient and appropriate audit evidence regarding the financial information of entities
or business activities within the Bank to express an opinion on the financial statements. We are responsible for the direction, supervision, and performance of the audit. We remain solely responsible for our audit opinion.
We communicate with those charged with governance regarding, among other matters, the planned scope and timing of the audit and significant audit findings, including any significant deficiencies in internal control that we identify during our audit. We also provide those charged with governance with a statement that we have complied with relevant ethical requirements regarding independence, and to communicate with them all relationships and other matters that may reasonably be thought to bear on our independence, and where applicable, related safeguards. From the matters communicated with those charged with governance, we determine those matters that were of most significance in the audit of the financial statements for the year ended December 31, 2017 and are therefore the key audit matters. We describe these matters in our auditors’ report unless law or regulation precludes public disclosure about the matter or when, in extremely rare circumstances, we determine that a matter should not be communicated in our report because the adverse consequences of doing so would reasonably be expected to outweigh the public interest benefits of such communication.
- 5 -
The engagement partners on the audit resulting in this independent auditors’ report are Shiuh-Ran Cheng and Chen-Hsiu Yang. Deloitte & Touche Taipei, Taiwan Republic of China March 29, 2018
Notice to Readers The accompanying financial statements are intended only to present the financial position, financial performance and cash flows in accordance with accounting principles and practices generally accepted in the Republic of China and not those of any other jurisdictions. The standards, procedures and practices to audit such financial statements are those generally accepted and applied in the Republic of China. For the convenience of readers, the independent auditors’ report and the accompanying financial statements have been translated into English from the original Chinese version prepared and used in the Republic of China. If there is any conflict between the English version and the original Chinese version or any difference in the interpretation of the two versions, the Chinese-language independent auditors’ report and financial statements shall prevail.
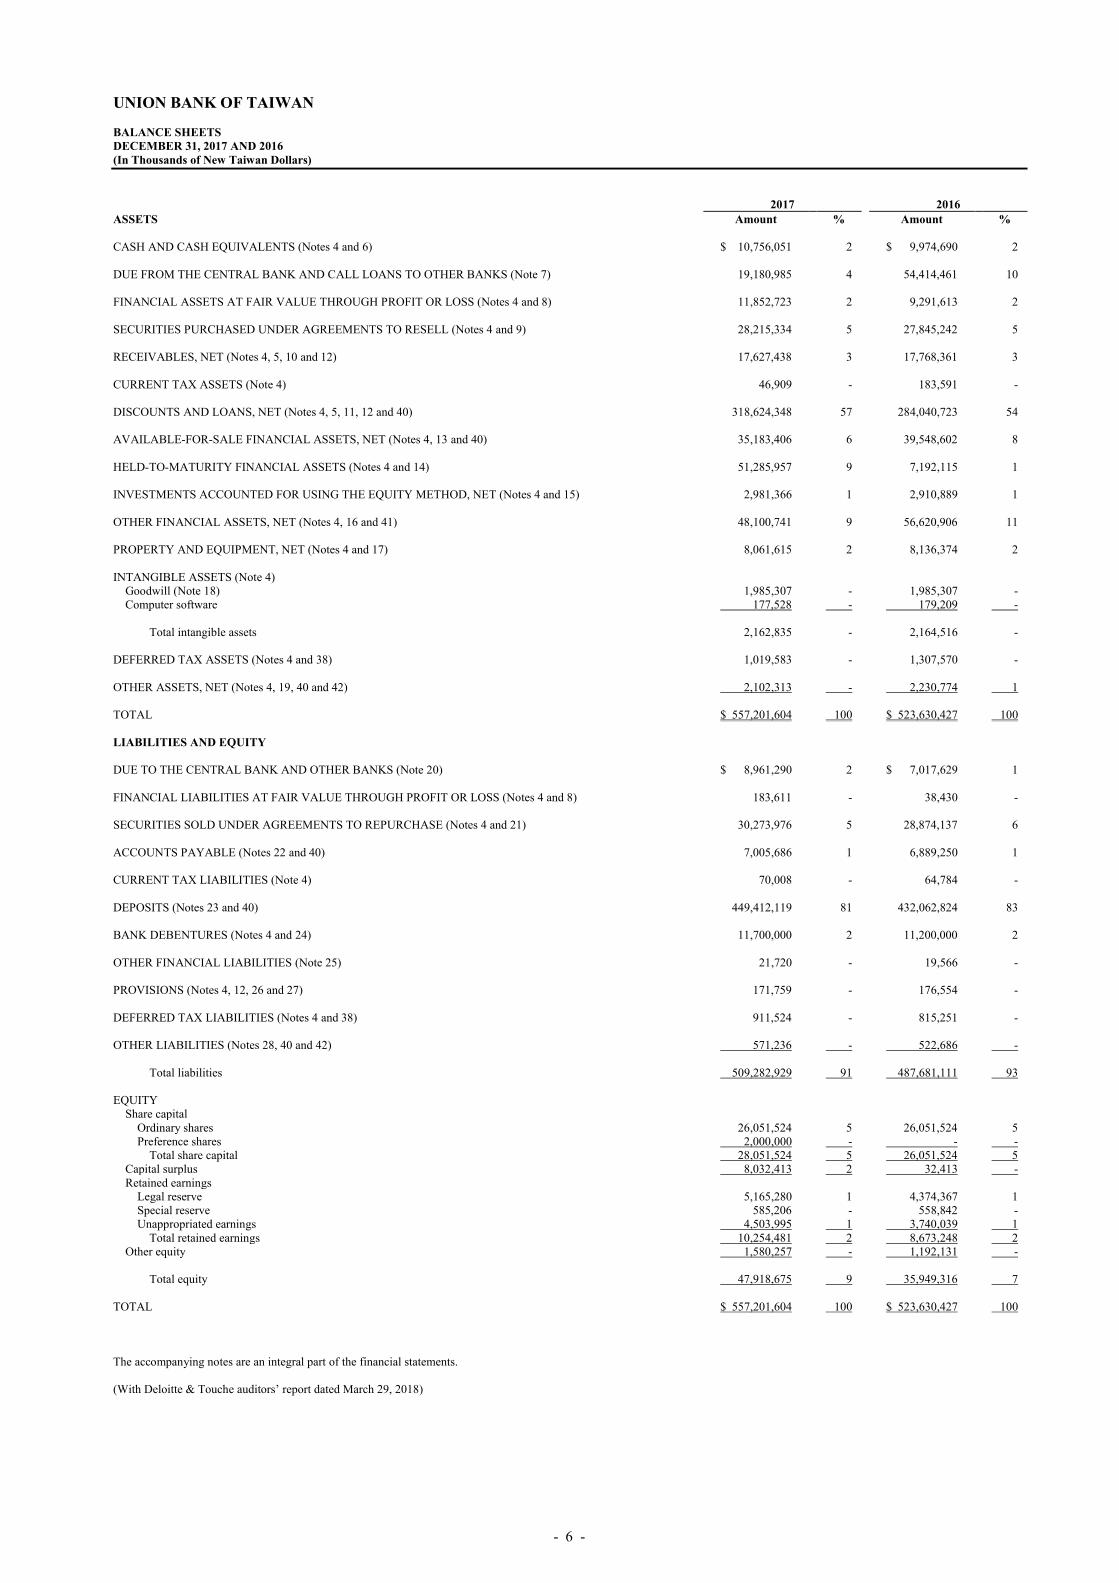
- 6 -
UNION BANK OF TAIWAN BALANCE SHEETS DECEMBER 31, 2017 AND 2016 (In Thousands of New Taiwan Dollars)
2017 2016 ASSETS Amount % Amount % CASH AND CASH EQUIVALENTS (Notes 4 and 6) $ 10,756,051 2 $ 9,974,690 2 DUE FROM THE CENTRAL BANK AND CALL LOANS TO OTHER BANKS (Note 7) 19,180,985 4 54,414,461 10 FINANCIAL ASSETS AT FAIR VALUE THROUGH PROFIT OR LOSS (Notes 4 and 8) 11,852,723 2 9,291,613 2 SECURITIES PURCHASED UNDER AGREEMENTS TO RESELL (Notes 4 and 9) 28,215,334 5 27,845,242 5 RECEIVABLES, NET (Notes 4, 5, 10 and 12) 17,627,438 3 17,768,361 3 CURRENT TAX ASSETS (Note 4) 46,909 - 183,591 - DISCOUNTS AND LOANS, NET (Notes 4, 5, 11, 12 and 40) 318,624,348 57 284,040,723 54 AVAILABLE-FOR-SALE FINANCIAL ASSETS, NET (Notes 4, 13 and 40) 35,183,406 6 39,548,602 8 HELD-TO-MATURITY FINANCIAL ASSETS (Notes 4 and 14) 51,285,957 9 7,192,115 1 INVESTMENTS ACCOUNTED FOR USING THE EQUITY METHOD, NET (Notes 4 and 15) 2,981,366 1 2,910,889 1 OTHER FINANCIAL ASSETS, NET (Notes 4, 16 and 41) 48,100,741 9 56,620,906 11 PROPERTY AND EQUIPMENT, NET (Notes 4 and 17) 8,061,615 2 8,136,374 2 INTANGIBLE ASSETS (Note 4)
Goodwill (Note 18) 1,985,307 - 1,985,307 - Computer software 177,528 - 179,209 -
Total intangible assets 2,162,835 - 2,164,516 -
DEFERRED TAX ASSETS (Notes 4 and 38) 1,019,583 - 1,307,570 - OTHER ASSETS, NET (Notes 4, 19, 40 and 42) 2,102,313 - 2,230,774 1 TOTAL $ 557,201,604 100 $ 523,630,427 100 LIABILITIES AND EQUITY DUE TO THE CENTRAL BANK AND OTHER BANKS (Note 20) $ 8,961,290 2 $ 7,017,629 1 FINANCIAL LIABILITIES AT FAIR VALUE THROUGH PROFIT OR LOSS (Notes 4 and 8) 183,611 - 38,430 - SECURITIES SOLD UNDER AGREEMENTS TO REPURCHASE (Notes 4 and 21) 30,273,976 5 28,874,137 6 ACCOUNTS PAYABLE (Notes 22 and 40) 7,005,686 1 6,889,250 1 CURRENT TAX LIABILITIES (Note 4) 70,008 - 64,784 - DEPOSITS (Notes 23 and 40) 449,412,119 81 432,062,824 83 BANK DEBENTURES (Notes 4 and 24) 11,700,000 2 11,200,000 2 OTHER FINANCIAL LIABILITIES (Note 25) 21,720 - 19,566 - PROVISIONS (Notes 4, 12, 26 and 27) 171,759 - 176,554 - DEFERRED TAX LIABILITIES (Notes 4 and 38) 911,524 - 815,251 - OTHER LIABILITIES (Notes 28, 40 and 42) 571,236 - 522,686 -
Total liabilities 509,282,929 91 487,681,111 93 EQUITY
Share capital Ordinary shares 26,051,524 5 26,051,524 5 Preference shares 2,000,000 - - -
Total share capital 28,051,524 5 26,051,524 5 Capital surplus 8,032,413 2 32,413 - Retained earnings
Legal reserve 5,165,280 1 4,374,367 1 Special reserve 585,206 - 558,842 - Unappropriated earnings 4,503,995 1 3,740,039 1
Total retained earnings 10,254,481 2 8,673,248 2 Other equity 1,580,257 - 1,192,131 -
Total equity 47,918,675 9 35,949,316 7
TOTAL $ 557,201,604 100 $ 523,630,427 100 The accompanying notes are an integral part of the financial statements. (With Deloitte & Touche auditors’ report dated March 29, 2018)
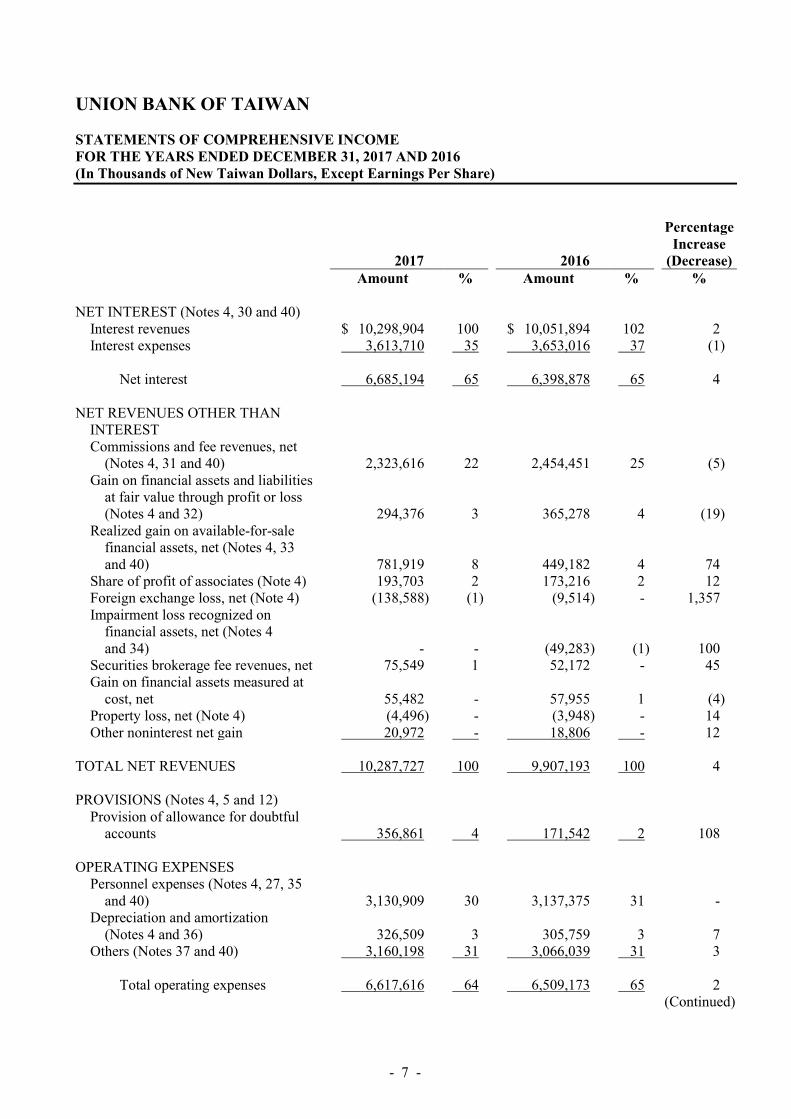
- 7 -
UNION BANK OF TAIWAN STATEMENTS OF COMPREHENSIVE INCOME FOR THE YEARS ENDED DECEMBER 31, 2017 AND 2016 (In Thousands of New Taiwan Dollars, Except Earnings Per Share)
Percentage
Increase 2017 2016 (Decrease) Amount % Amount % % NET INTEREST (Notes 4, 30 and 40)
Interest revenues $ 10,298,904 100 $ 10,051,894 102 2 Interest expenses 3,613,710 35 3,653,016 37 (1)
Net interest 6,685,194 65 6,398,878 65 4
NET REVENUES OTHER THAN
INTEREST Commissions and fee revenues, net
(Notes 4, 31 and 40) 2,323,616 22 2,454,451 25 (5) Gain on financial assets and liabilities
at fair value through profit or loss (Notes 4 and 32) 294,376 3 365,278 4 (19)
Realized gain on available-for-sale financial assets, net (Notes 4, 33 and 40) 781,919 8 449,182 4 74
Share of profit of associates (Note 4) 193,703 2 173,216 2 12 Foreign exchange loss, net (Note 4) (138,588) (1) (9,514) - 1,357 Impairment loss recognized on
financial assets, net (Notes 4 and 34) - - (49,283) (1) 100
Securities brokerage fee revenues, net 75,549 1 52,172 - 45 Gain on financial assets measured at
cost, net 55,482 - 57,955 1 (4) Property loss, net (Note 4) (4,496) - (3,948) - 14 Other noninterest net gain 20,972 - 18,806 - 12
TOTAL NET REVENUES 10,287,727 100 9,907,193 100 4 PROVISIONS (Notes 4, 5 and 12)
Provision of allowance for doubtful accounts 356,861 4 171,542 2 108
OPERATING EXPENSES
Personnel expenses (Notes 4, 27, 35 and 40) 3,130,909 30 3,137,375 31 -
Depreciation and amortization (Notes 4 and 36) 326,509 3 305,759 3 7
Others (Notes 37 and 40) 3,160,198 31 3,066,039 31 3
Total operating expenses 6,617,616 64 6,509,173 65 2 (Continued)

- 8 -
UNION BANK OF TAIWAN STATEMENTS OF COMPREHENSIVE INCOME FOR THE YEARS ENDED DECEMBER 31, 2017 AND 2016 (In Thousands of New Taiwan Dollars, Except Earnings Per Share)
Percentage
Increase 2017 2016 (Decrease) Amount % Amount % % INCOME BEFORE INCOME TAX $ 3,313,250 32 $ 3,226,478 33 3 INCOME TAX EXPENSE (Notes 4
and 38) 568,263 5 590,103 6 (4) NET INCOME 2,744,987 27 2,636,375 27 4 OTHER COMPREHENSIVE INCOME
Items that will not be reclassified subsequently to profit or loss: Remeasurement of defined benefit
plans (Note 27) 9,802 - (16,223) - 160 Share of the other comprehensive
income of subsidiaries and associates 429 - 4,449 - (90)
Income tax relating to items that will not be reclassified subsequently to profit or loss (Note 38) (1,666) - 2,758 - (160) 8,565 - (9,016) - 195
Items that may be reclassified subsequently to profit or loss: Exchange differences on translating
foreign operations (814,626) (8) (539,546) (6) 51 Unrealized gain on
available-for-sale financial assets 1,228,170 12 (60,740) (1) 2,122 Share of other comprehensive
income (loss) of subsidiaries and associates (76,598) (1) 5,526 - (1,486)
Income tax relating to items that may be reclassified subsequently to profit or loss (Note 38) 51,180 1 68,614 1 (25) 388,126 4 (526,146) (6) 174
Other comprehensive income
(loss) for the year, net of income tax 396,691 4 (535,162) (6) 174
TOTAL COMPREHENSIVE INCOME $ 3,141,678 31 $ 2,101,213 21 50
(Continued)
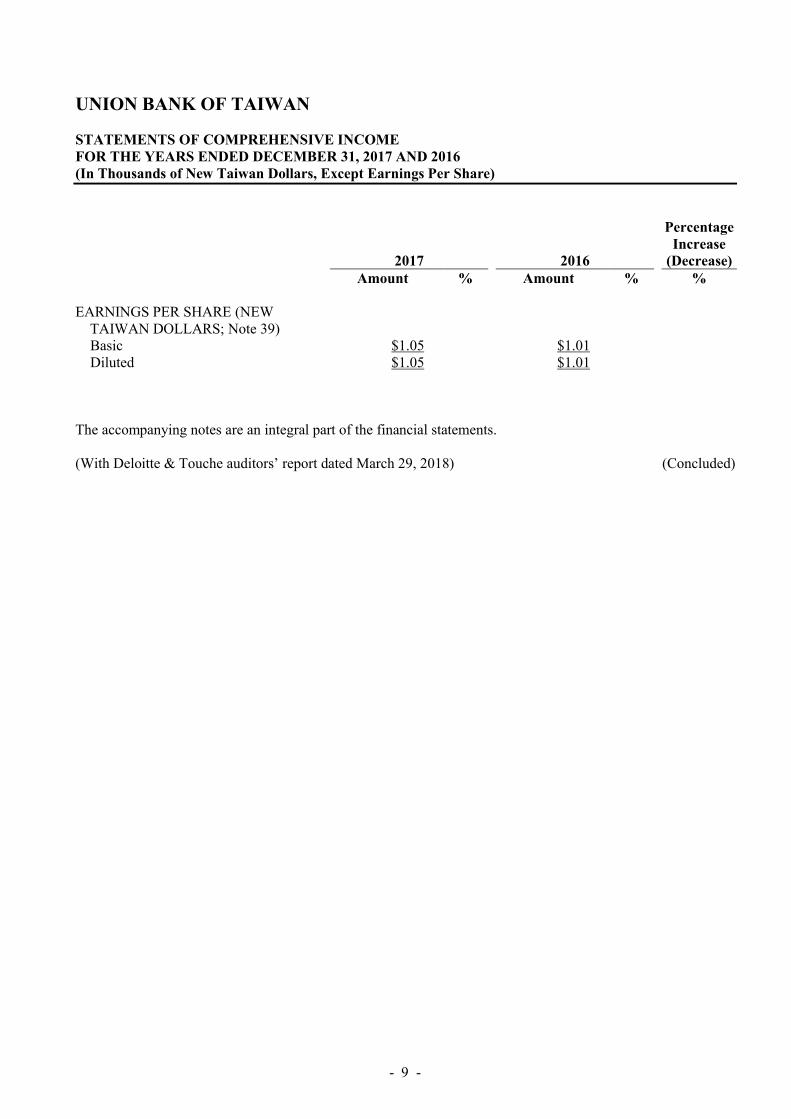
- 9 -
UNION BANK OF TAIWAN STATEMENTS OF COMPREHENSIVE INCOME FOR THE YEARS ENDED DECEMBER 31, 2017 AND 2016 (In Thousands of New Taiwan Dollars, Except Earnings Per Share)
Percentage
Increase 2017 2016 (Decrease) Amount % Amount % % EARNINGS PER SHARE (NEW
TAIWAN DOLLARS; Note 39) Basic $1.05 $1.01 Diluted $1.05 $1.01
The accompanying notes are an integral part of the financial statements. (With Deloitte & Touche auditors’ report dated March 29, 2018) (Concluded)

- 10 -
UNION BANK OF TAIWAN STATEMENTS OF CHANGES IN EQUITY FOR THE YEARS ENDED DECEMBER 31, 2017 AND 2016 (In Thousands of New Taiwan Dollars)
Other Equity (Notes 4 and 29) Unrealized Exchange Gain (Loss) Differences on on Share Capital (Note 29) Capital Retained Earnings (Notes 4 and 29) Available-for- Translating Ordinary Preference Surplus Special Unappropriated sale Financial Foreign Shares Shares (Note 29) Legal Reserve Reserve Earnings Total Assets Operations Total Total Equity BALANCE AT JANUARY 1, 2016 $ 26,051,524 $ - $ 32,413 $ 3,450,907 $ 558,842 $ 3,078,201 $ 7,087,950 $ 1,302,228 $ 416,049 $ 1,718,277 $ 34,890,164 Appropriation of the 2015 earnings
Legal reserve - - - 923,460 - (923,460) - - - - - Cash dividends on common shares - - - - - (1,042,061) (1,042,061) - - - (1,042,061)
Net income for the year ended December 31, 2016 - - - - - 2,636,375 2,636,375 - - - 2,636,375 Other comprehensive income for the year ended
December 31, 2016 - - - - - (9,016) (9,016) (29,920) (496,226) (526,146) (535,162) BALANCE AT DECEMBER 31, 2016 26,051,524 - 32,413 4,374,367 558,842 3,740,039 8,673,248 1,272,308 (80,177) 1,192,131 35,949,316 Appropriation of the 2016 earnings
Legal reserve - - - 790,913 - (790,913) - - - - - Special reserve - - - - 26,364 (26,364) - - - - - Cash dividends on common shares - - - - - (1,172,319) (1,172,319) - - - (1,172,319)
Net income for the year ended December 31, 2017 - - - - - 2,744,987 2,744,987 - - - 2,744,987 Other comprehensive income for the year ended
December 31, 2017 - - - - - 8,565 8,565 1,073,393 (685,267) 388,126 396,691 Issuance of preference shares - 2,000,000 8,000,000 - - - - - - - 10,000,000 BALANCE AT DECEMBER 31, 2017 $ 26,051,524 $ 2,000,000 $ 8,032,413 $ 5,165,280 $ 585,206 $ 4,503,995 $ 10,254,481 $ 2,345,701 $ (765,444) $ 1,580,257 $ 47,918,675 The accompanying notes are an integral part of the financial statements. (With Deloitte & Touche auditors’ report dated March 29, 2018)
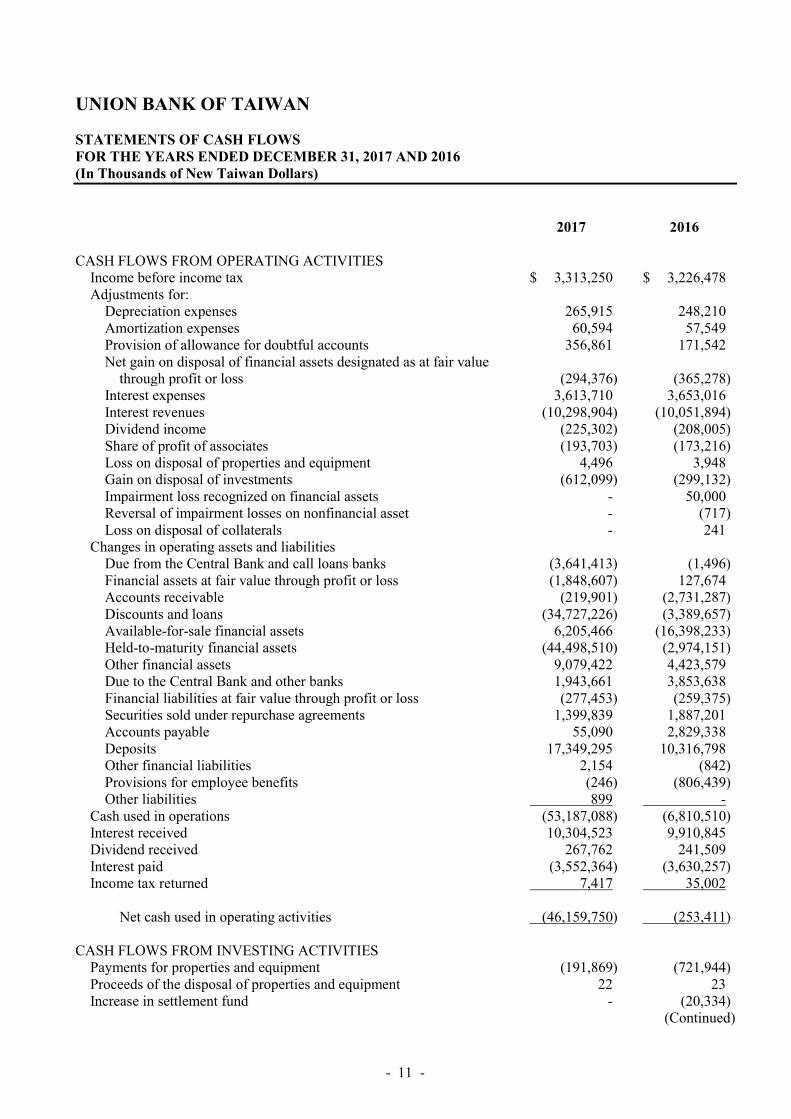
- 11 -
UNION BANK OF TAIWAN STATEMENTS OF CASH FLOWS FOR THE YEARS ENDED DECEMBER 31, 2017 AND 2016 (In Thousands of New Taiwan Dollars)
2017 2016 CASH FLOWS FROM OPERATING ACTIVITIES
Income before income tax $ 3,313,250 $ 3,226,478 Adjustments for:
Depreciation expenses 265,915 248,210 Amortization expenses 60,594 57,549 Provision of allowance for doubtful accounts 356,861 171,542 Net gain on disposal of financial assets designated as at fair value
through profit or loss (294,376) (365,278) Interest expenses 3,613,710 3,653,016 Interest revenues (10,298,904) (10,051,894) Dividend income (225,302) (208,005) Share of profit of associates (193,703) (173,216) Loss on disposal of properties and equipment 4,496 3,948 Gain on disposal of investments (612,099) (299,132) Impairment loss recognized on financial assets - 50,000 Reversal of impairment losses on nonfinancial asset - (717) Loss on disposal of collaterals - 241
Changes in operating assets and liabilities Due from the Central Bank and call loans banks (3,641,413) (1,496) Financial assets at fair value through profit or loss (1,848,607) 127,674 Accounts receivable (219,901) (2,731,287) Discounts and loans (34,727,226) (3,389,657) Available-for-sale financial assets 6,205,466 (16,398,233) Held-to-maturity financial assets (44,498,510) (2,974,151) Other financial assets 9,079,422 4,423,579 Due to the Central Bank and other banks 1,943,661 3,853,638 Financial liabilities at fair value through profit or loss (277,453) (259,375) Securities sold under repurchase agreements 1,399,839 1,887,201 Accounts payable 55,090 2,829,338 Deposits 17,349,295 10,316,798 Other financial liabilities 2,154 (842) Provisions for employee benefits (246) (806,439) Other liabilities 899 -
Cash used in operations (53,187,088) (6,810,510) Interest received 10,304,523 9,910,845 Dividend received 267,762 241,509 Interest paid (3,552,364) (3,630,257) Income tax returned 7,417 35,002
Net cash used in operating activities (46,159,750) (253,411)
CASH FLOWS FROM INVESTING ACTIVITIES
Payments for properties and equipment (191,869) (721,944) Proceeds of the disposal of properties and equipment 22 23 Increase in settlement fund - (20,334)
(Continued)
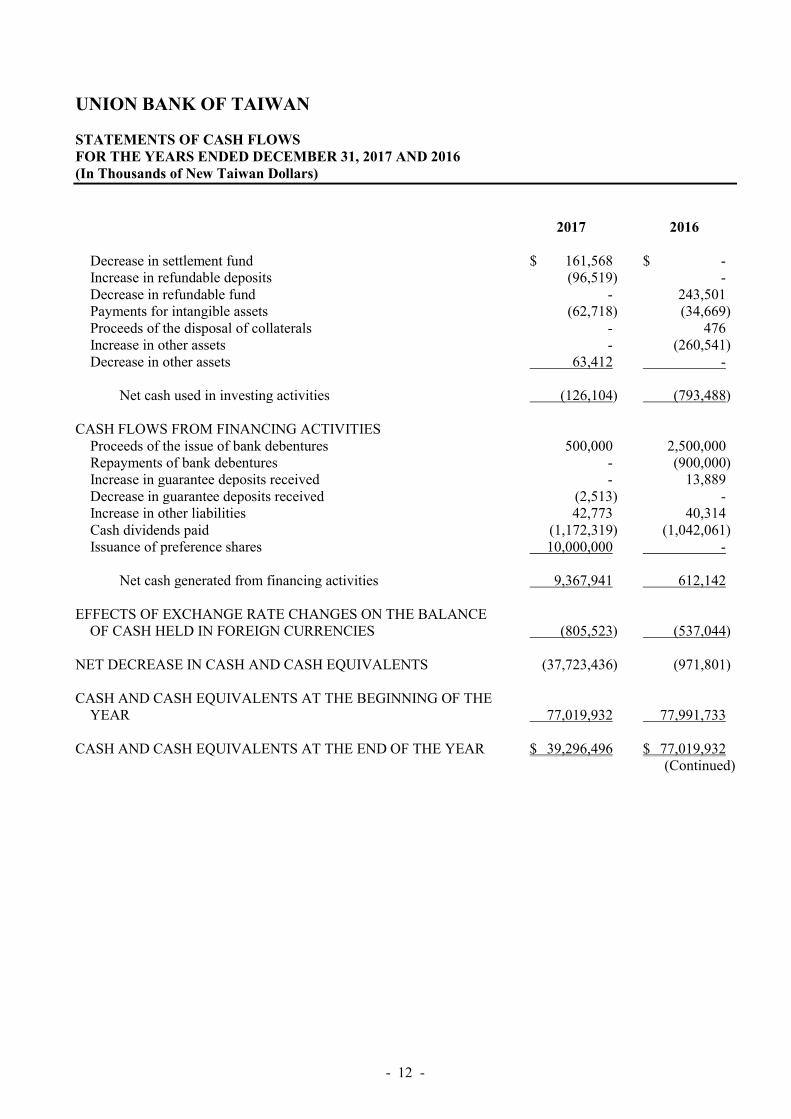
- 12 -
UNION BANK OF TAIWAN STATEMENTS OF CASH FLOWS FOR THE YEARS ENDED DECEMBER 31, 2017 AND 2016 (In Thousands of New Taiwan Dollars)
2017 2016
Decrease in settlement fund $ 161,568 $ - Increase in refundable deposits (96,519) - Decrease in refundable fund - 243,501 Payments for intangible assets (62,718) (34,669) Proceeds of the disposal of collaterals - 476 Increase in other assets - (260,541) Decrease in other assets 63,412 -
Net cash used in investing activities (126,104) (793,488)
CASH FLOWS FROM FINANCING ACTIVITIES
Proceeds of the issue of bank debentures 500,000 2,500,000 Repayments of bank debentures - (900,000) Increase in guarantee deposits received - 13,889 Decrease in guarantee deposits received (2,513) - Increase in other liabilities 42,773 40,314 Cash dividends paid (1,172,319) (1,042,061) Issuance of preference shares 10,000,000 -
Net cash generated from financing activities 9,367,941 612,142
EFFECTS OF EXCHANGE RATE CHANGES ON THE BALANCE
OF CASH HELD IN FOREIGN CURRENCIES (805,523) (537,044) NET DECREASE IN CASH AND CASH EQUIVALENTS (37,723,436) (971,801) CASH AND CASH EQUIVALENTS AT THE BEGINNING OF THE
YEAR 77,019,932 77,991,733 CASH AND CASH EQUIVALENTS AT THE END OF THE YEAR $ 39,296,496 $ 77,019,932
(Continued)

- 13 -
UNION BANK OF TAIWAN STATEMENTS OF CASH FLOWS FOR THE YEARS ENDED DECEMBER 31, 2017 AND 2016 (In Thousands of New Taiwan Dollars)
Reconciliation of the amounts in the statements of cash flows with the equivalent items reported in the balance sheets as of December 31, 2017 and 2016: December 31 2017 2016 Cash and cash equivalents in balance sheets $ 10,756,051 $ 9,974,690 Due from the Central Bank and call loans to banks that meet the
definition of cash and cash equivalents in IAS 7 “Cash Flow Statements”
325,111 39,200,000 Securities purchased under agreements to resell that meet the definition
of cash and cash equivalents in IAS 7
28,215,334 27,845,242 Cash and cash equivalents in statements of cash flows $ 39,296,496 $ 77,019,932 The accompanying notes are an integral part of the financial statements. (With Deloitte & Touche auditors’ report dated March 29, 2018) (Concluded)

- 14 -
UNION BANK OF TAIWAN NOTES TO FINANCIAL STATEMENTS FOR THE YEARS ENDED DECEMBER 31, 2017 AND 2016 (In Thousands of New Taiwan Dollars, Unless Stated Otherwise)
1. GENERAL INFORMATION
The Union Bank of Taiwan (the Bank) obtained approval from the Ministry of Finance (MOF) to be established on August 1, 1991 and was incorporated on December 31, 1991. It started operations on January 21, 1992. The Bank engages in activities allowed under the Banking Law, which cover deposits, loans, discounts, remittances, acceptances, issuance of guarantees and letters of credit, short-term bills transactions, investments, foreign exchange transactions, savings, trust, etc. On the Bank’s merger with Chung Shing Bank on March 19, 2005, the Bank took over all of the assets, liabilities and operating units of Chung Shing Bank. The Bank merged with the Union Bills Finance Corporation (UBF) on August 16, 2010, with the Bank as the survivor entity. On August 26, 2015, the board of directors of the Bank resolved to merge UIB in order to integrate the resources, strengthen management and business synergy. The merger is approved by FSC (Rule No. 10502022990). The effective date of this merger is August 1, 2016. As of December 31, 2016, the Bank’s operating units included Banking, Trust, Wealth Management, Security Finance, Bills Finance, International Banking Department of the Head Office, Union Insurance Brokerage agency, an Offshore Banking Unit (OBU), two overseas representative offices in Hong Kong and Vietnam, and 90 domestic branches (including Business Department). The operations of the Bank’s Trust Department are (1) trust business planning, managing and operating; and (2) custody of nondiscretionary trust funds in domestic and overseas securities and mutual funds. These foregoing operations are regulated under the Banking Law and Trust Law. The Bank’s shares are traded on the Taiwan Stock Exchange. The Bank’s financial statements are presented in New Taiwan dollars.
2. APPROVAL OF FINANCIAL STATEMENTS
The financial statements were approved by the board of directors and authorized for issue on March 14, 2018.
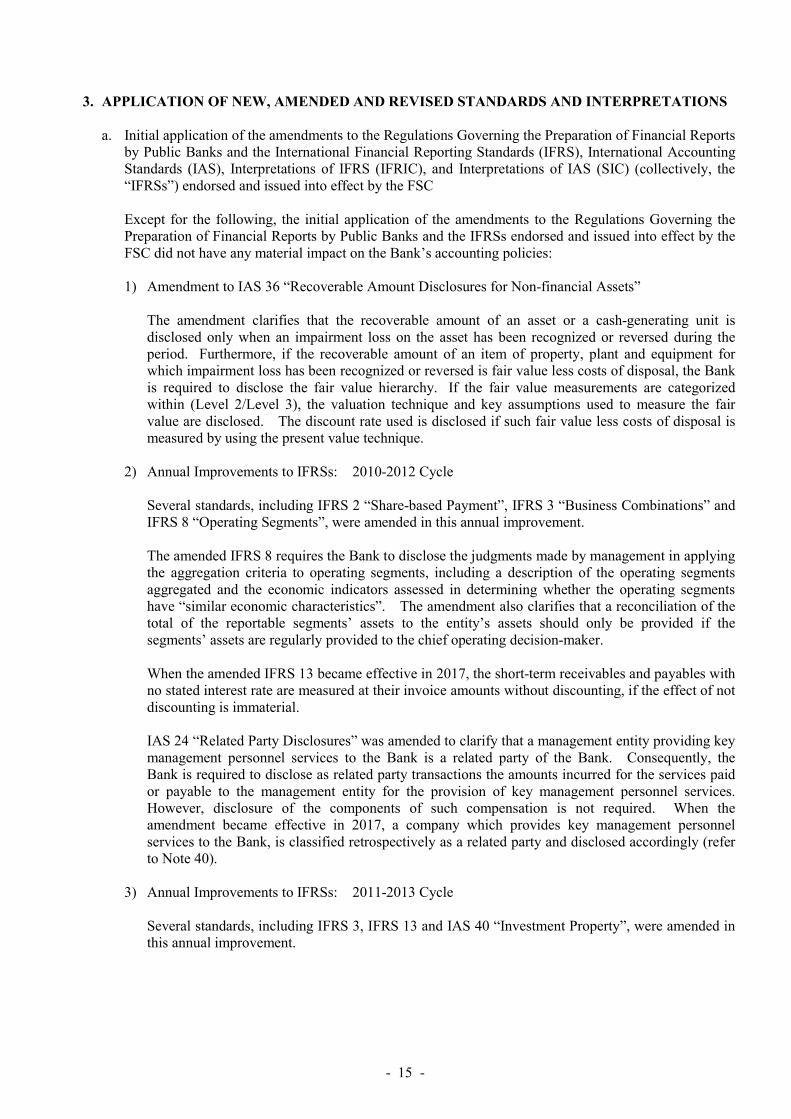
- 15 -
3. APPLICATION OF NEW, AMENDED AND REVISED STANDARDS AND INTERPRETATIONS a. Initial application of the amendments to the Regulations Governing the Preparation of Financial Reports
by Public Banks and the International Financial Reporting Standards (IFRS), International Accounting Standards (IAS), Interpretations of IFRS (IFRIC), and Interpretations of IAS (SIC) (collectively, the “IFRSs”) endorsed and issued into effect by the FSC Except for the following, the initial application of the amendments to the Regulations Governing the Preparation of Financial Reports by Public Banks and the IFRSs endorsed and issued into effect by the FSC did not have any material impact on the Bank’s accounting policies: 1) Amendment to IAS 36 “Recoverable Amount Disclosures for Non-financial Assets”
The amendment clarifies that the recoverable amount of an asset or a cash-generating unit is disclosed only when an impairment loss on the asset has been recognized or reversed during the period. Furthermore, if the recoverable amount of an item of property, plant and equipment for which impairment loss has been recognized or reversed is fair value less costs of disposal, the Bank is required to disclose the fair value hierarchy. If the fair value measurements are categorized within (Level 2/Level 3), the valuation technique and key assumptions used to measure the fair value are disclosed. The discount rate used is disclosed if such fair value less costs of disposal is measured by using the present value technique.
2) Annual Improvements to IFRSs: 2010-2012 Cycle Several standards, including IFRS 2 “Share-based Payment”, IFRS 3 “Business Combinations” and IFRS 8 “Operating Segments”, were amended in this annual improvement. The amended IFRS 8 requires the Bank to disclose the judgments made by management in applying the aggregation criteria to operating segments, including a description of the operating segments aggregated and the economic indicators assessed in determining whether the operating segments have “similar economic characteristics”. The amendment also clarifies that a reconciliation of the total of the reportable segments’ assets to the entity’s assets should only be provided if the segments’ assets are regularly provided to the chief operating decision-maker. When the amended IFRS 13 became effective in 2017, the short-term receivables and payables with no stated interest rate are measured at their invoice amounts without discounting, if the effect of not discounting is immaterial. IAS 24 “Related Party Disclosures” was amended to clarify that a management entity providing key management personnel services to the Bank is a related party of the Bank. Consequently, the Bank is required to disclose as related party transactions the amounts incurred for the services paid or payable to the management entity for the provision of key management personnel services. However, disclosure of the components of such compensation is not required. When the amendment became effective in 2017, a company which provides key management personnel services to the Bank, is classified retrospectively as a related party and disclosed accordingly (refer to Note 40).
3) Annual Improvements to IFRSs: 2011-2013 Cycle Several standards, including IFRS 3, IFRS 13 and IAS 40 “Investment Property”, were amended in this annual improvement.

- 16 -
IFRS 3 was amended to clarify that IFRS 3 does not apply to the accounting for the formation of all types of joint arrangements in the financial statements of the joint arrangement itself. The amendment is applied prospectively starting from January 1, 2017. The scope in IFRS 13 of the portfolio exception for measuring the fair value of a Bank of financial assets and financial liabilities on a net basis was amended to clarify that it includes all contracts that are within the scope of, and accounted for in accordance with, IAS 39 or IFRS 9, even those contracts which do not meet the definitions of financial assets or financial liabilities within IAS 32. IAS 40 was amended to clarify that IAS 40 and IFRS 3 are not mutually exclusive and the application of both standards may be required to determine whether the investment property acquired is an acquisition of an asset or a business combination. The amendment is applied prospectively to acquisitions of investment property on or after January 1, 2017.
4) Amendments to IAS 16 and IAS 38 “Clarification of Acceptable Methods of Depreciation and Amortization” The entity should use appropriate depreciation and amortization method to reflect the pattern in which the future economic benefits of the property, plant and equipment and intangible asset are expected to be consumed by the entity. The amended IAS 16 “Property, Plant and Equipment” stipulates that a depreciation method that is based on revenue that is generated by an activity that includes the use of an asset is not appropriate. The amended standard does not provide any exception from this requirement. The amended IAS 38 “Intangible Assets” clarifies there is a rebuttable presumption that an amortization method that is based on revenue that is generated by an activity that includes the use of an intangible asset is not appropriate. This presumption can be overcome only in the following limited circumstances when: a) The intangible asset is expressed as a measure of revenue (for example, when there is a contract
that specifies the entity’s use of the intangible asset will expire upon the achievement of a revenue threshold); or
b) It can be demonstrated that revenue and the consumption of the economic benefits of the
intangible asset are highly correlated.
5) Annual Improvements to IFRSs: 2012-2014 Cycle Several standards, including IFRS 5 “Non-current assets held for sale and discontinued operations”, IFRS 7, IAS 19 and IAS 34 were amended in this annual improvement. IFRS 5 was amended to clarify that reclassification between non-current assets (or disposal Bank) “held for sale” and non-current assets “held for distribution to owners” does not constitute a change to a plan of sale or distribution. Therefore, the previous accounting treatment is not reversed. The amendment also explains that assets that no longer meet the criteria for “held for distribution to owners” and do not meet the criteria for “held for sale” should be treated in the same way as assets that cease to be classified as held for sale. The amendment is applied prospectively to transactions that occur on or after January 1, 2017.
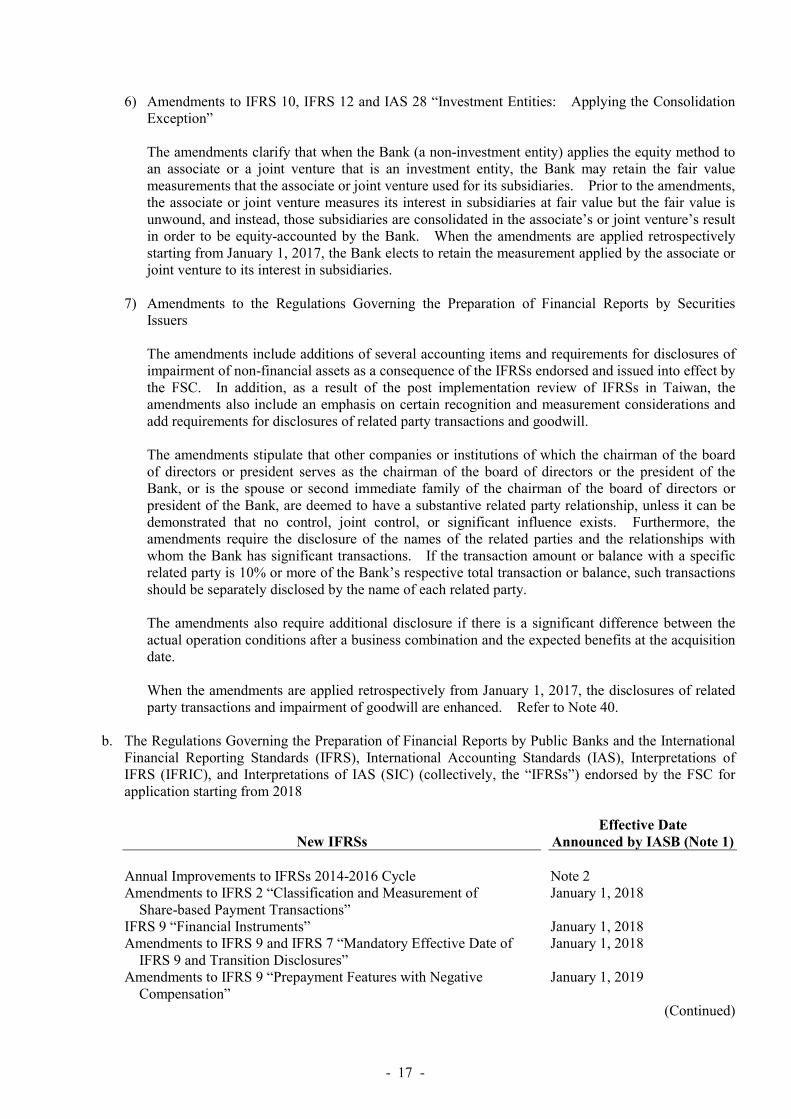
- 17 -
6) Amendments to IFRS 10, IFRS 12 and IAS 28 “Investment Entities: Applying the Consolidation Exception” The amendments clarify that when the Bank (a non-investment entity) applies the equity method to an associate or a joint venture that is an investment entity, the Bank may retain the fair value measurements that the associate or joint venture used for its subsidiaries. Prior to the amendments, the associate or joint venture measures its interest in subsidiaries at fair value but the fair value is unwound, and instead, those subsidiaries are consolidated in the associate’s or joint venture’s result in order to be equity-accounted by the Bank. When the amendments are applied retrospectively starting from January 1, 2017, the Bank elects to retain the measurement applied by the associate or joint venture to its interest in subsidiaries.
7) Amendments to the Regulations Governing the Preparation of Financial Reports by Securities Issuers The amendments include additions of several accounting items and requirements for disclosures of impairment of non-financial assets as a consequence of the IFRSs endorsed and issued into effect by the FSC. In addition, as a result of the post implementation review of IFRSs in Taiwan, the amendments also include an emphasis on certain recognition and measurement considerations and add requirements for disclosures of related party transactions and goodwill. The amendments stipulate that other companies or institutions of which the chairman of the board of directors or president serves as the chairman of the board of directors or the president of the Bank, or is the spouse or second immediate family of the chairman of the board of directors or president of the Bank, are deemed to have a substantive related party relationship, unless it can be demonstrated that no control, joint control, or significant influence exists. Furthermore, the amendments require the disclosure of the names of the related parties and the relationships with whom the Bank has significant transactions. If the transaction amount or balance with a specific related party is 10% or more of the Bank’s respective total transaction or balance, such transactions should be separately disclosed by the name of each related party. The amendments also require additional disclosure if there is a significant difference between the actual operation conditions after a business combination and the expected benefits at the acquisition date. When the amendments are applied retrospectively from January 1, 2017, the disclosures of related party transactions and impairment of goodwill are enhanced. Refer to Note 40.
b. The Regulations Governing the Preparation of Financial Reports by Public Banks and the International
Financial Reporting Standards (IFRS), International Accounting Standards (IAS), Interpretations of IFRS (IFRIC), and Interpretations of IAS (SIC) (collectively, the “IFRSs”) endorsed by the FSC for application starting from 2018
New IFRSs Effective Date
Announced by IASB (Note 1) Annual Improvements to IFRSs 2014-2016 Cycle Note 2 Amendments to IFRS 2 “Classification and Measurement of
Share-based Payment Transactions” January 1, 2018
IFRS 9 “Financial Instruments” January 1, 2018 Amendments to IFRS 9 and IFRS 7 “Mandatory Effective Date of
IFRS 9 and Transition Disclosures” January 1, 2018
Amendments to IFRS 9 “Prepayment Features with Negative Compensation”
January 1, 2019
(Continued)

- 18 -
New IFRSs Effective Date
Announced by IASB (Note 1) Amendments to IFRS 10 and IAS 28 “Sale or Contribution of Assets
between an Investor and Its Associate or Joint Venture” To be determined by IASB
IFRS 15 “Revenue from Contracts with Customers” January 1, 2018 Amendments to IFRS 15 “Clarifications to IFRS 15 Revenue from
Contracts with Customers” January 1, 2018
IFRS 16 “Leases” January 1, 2019 Amendment to IAS 7 “Disclosure Initiative” January 1, 2017 Amendments to IAS 12 “Recognition of Deferred Tax Assets for
Unrealized Losses” January 1, 2017
Amendments to IAS 40 “Transfers of Investment Property” January 1, 2018 IFRIC 22 “Foreign Currency Transactions and Advance
Consideration” January 1, 2018
(Concluded) Note 1: Unless stated otherwise, the above New IFRSs are effective for annual periods beginning on
or after their respective effective dates. Note 2: The amendment to IFRS 12 is retrospectively applied for annual periods beginning on or after
January 1, 2017; the amendments to IAS 28 are retrospectively applied for annual periods beginning on or after January 1, 2018.
1) Annual Improvements to IFRSs 2014-2016 Cycle
Several standards, including IFRS 12 “Disclosure of Interests in Other Entities” and IAS 28 “Investments in Associates and Joint Ventures,” were amended in this annual improvement. The amendment to IFRS 12 clarifies that when an entity’s interest in a subsidiary, a joint venture or an associate is classified as held for sale or is included in a disposal group that is classified as held for sale, the entity is not required to disclose summarized financial information of that subsidiary, joint venture or associate in accordance with IFRS 12. However, all other requirements in IFRS 12 apply to interests in entities classified as held for sale in accordance with IFRS 5. The Group will apply the aforementioned amendment retrospectively.
2) IFRS 9 “Financial Instruments” and related amendments Classification, measurement and impairment of financial assets With regard to financial assets, all recognized financial assets that are within the scope of IAS 39 “Financial Instruments: Recognition and Measurement” are subsequently measured at amortized cost or fair value. Under IFRS 9, the requirement for the classification of financial assets is stated below. For the Bank’s debt instruments that have contractual cash flows that are solely payments of principal and interest on the principal amount outstanding, their classification and measurement are as follows: a) For debt instruments, if they are held within a business model whose objective is to collect
contractual cash flows, the financial assets are measured at amortized cost and are assessed for impairment continuously with any impairment loss recognized in profit or loss. Interest revenue is recognized in profit or loss by using the effective interest method;

- 19 -
b) For debt instruments, if they are held within a business model whose objective is achieved by
both collecting contractual cash flows and selling financial assets, the financial assets are measured at fair value through other comprehensive income (FVTOCI) and are assessed for impairment. Interest revenue is recognized in profit or loss by using the effective interest method, and other gains or losses shall be recognized in other comprehensive income, except for impairment gains or losses and foreign exchange gains and losses. When the debt instruments are derecognized or reclassified, the cumulative gain or loss previously recognized in other comprehensive income is reclassified from equity to profit or loss.
Except for the above, all other financial assets are measured at fair value through profit or loss. However, the Bank may make an irrevocable election to present subsequent changes in the fair value of an equity investment (that is not held for trading) in other comprehensive income, with only dividend income generally recognized in profit or loss. No subsequent impairment assessment is required, and the cumulative gain or loss previously recognized in other comprehensive income cannot be reclassified from equity to profit or loss. The Bank analyzed the facts and circumstances of its financial assets that exist at December 31, 2017 and performed the assessment of the impact of IFRS 9 on the classification and measurement of financial assets. Under IFRS 9: a) Listed shares, emerging market shares, and unlisted shares classified as available-for-sale will
be classified as at fair value through profit or loss. Listed shares, emerging market shares, and unlisted shares classified as available-for-sale will be designated as at fair value through other comprehensive income and the fair value gains or losses accumulated in other equity will be transferred directly to retained earnings instead of being reclassified to profit or loss on disposal. Besides this, unlisted shares measured at cost will be measured at fair value instead;
b) Mutual funds classified as available-for-sale will be classified as at fair value through profit or
loss because the contractual cash flows are not solely payments of principal and interest on the principal outstanding and they are not equity instruments; and
c) Debt investments classified as held-to-maturity financial assets/debt investments with no active
market and measured at amortized cost will be classified as measured at amortized cost under IFRS 9 because, on initial recognition, the contractual cash flows that are solely payments of principal and interest on the principal outstanding and these investments are held within a business model whose objective is to collect contractual cash flows/will be classified as at fair value through other comprehensive income under IFRS 9, because, on initial recognition, the contractual cash flows that are solely payments of principal and interest on the principal outstanding and these investments are held within a business model whose objective is achieved both by collecting contractual cash flows and selling financial assets/will be classified as at fair value through profit or loss, because, on initial recognition, the contractual cash flows are solely payments of principal and interest on the principal outstanding but the objective of the Bank’s business model is not to collect contractual cash flows and neither is it achieved both by collecting contractual cash flows and selling financial assets/will be classified as at fair value through profit or loss, because, on initial recognition, the contractual cash flows are not solely payments of principal and interest on the principal outstanding.
IFRS 9 requires impairment loss on financial assets to be recognized by using the “Expected Credit Losses Model”. A loss allowance is required for financial assets measured at amortized cost, investments in debt instruments measured at FVTOCI, lease receivables, contract assets arising from IFRS 15 “Revenue from Contracts with Customers”, certain written loan commitments and financial guarantee contracts. A loss allowance for 12-month expected credit losses is required for a financial asset if its credit risk has not increased significantly since initial recognition. A loss allowance for full-lifetime expected credit losses is required for a financial asset if its credit risk has increased significantly since initial recognition and is not low. However, a loss allowance for

- 20 -
full-lifetime expected credit losses is required for trade receivables that do not constitute a financing transaction. The Bank has performed a preliminary assessment in which it will apply the simplified approach to recognize full-lifetime expected credit losses for trade receivables, contract assets. In relation to debt instrument investments and financial guarantee contracts, the Bank will assess whether there has been a significant increase in credit risk to determine whether to recognize 12-month or full-lifetime expected credit losses. In general, the Bank anticipates that the application of the expected credit losses model of IFRS 9 will result in an earlier recognition of credit losses for financial assets. The bank elects not to restate prior reporting periods when applying the requirements for the classification, measurement and impairment of financial assets under IFRS 9 with the cumulative effect of the initial application recognized at the date of initial application and will provide the disclosures related to the classification and the adjustment information upon initial application of IFRS 9. The anticipated impact on assets, liabilities and equity of retrospective application of the requirements for the classification, measurement and impairment of financial assets as of January 1, 2018 is set out below:
Carrying Amount as of December 31,
2017
Adjustments Arising from
Initial Application
Adjusted Carrying
Amount as of January 1, 2018
Impact on assets, liabilities and equity Financial assets at fair value through
profit or loss $ 11,852,723 $ 990,357 $ 12,843,080 Financial assets at fair value through other
comprehensive income - 35,526,034 35,526,034 Receivable, net 17,627,438 (16,737) 17,610,701 Available-for-sale financial assets, net 35,183,406 (35,183,406) - Held-to-maturity financial assets 51,285,957 (51,285,957) - Investments accounted for using the
equity method, net 2,981,366 (634) 2,980,732 Financial assets measured at amortized
cost - current - 96,662,116 96,662,116 Debt investments with no active market 45,734,754 (45,734,754) - Financial assets measured at cost 507,614 (507,614) - Total effect on assets $ 449,405 Provisions 171,759 $ 27,308 199,067 Deferred tax liability 911,524 1,262 912,786 Total effect on liabilities $ 28,570 Retained earnings 10,254,481 $ (68,668) 10,185,813 Other equity 1,580,257 489,503 2,069,760 Total effect on equity $ 420,835

- 21 -
3) IFRS 15 “Revenue from Contracts with Customers” and related amendment IFRS 15 establishes principles for recognizing revenue that apply to all contracts with customers, and will supersede IAS 18 “Revenue”, IAS 11 “Construction Contracts” and a number of revenue-related interpretations. When applying IFRS 15, an entity shall recognize revenue by applying the following steps: Identify the contract with the customer; Identify the performance obligations in the contract; Determine the transaction price; Allocate the transaction price to the performance obligations in the contract; and Recognize revenue when the entity satisfies a performance obligation. In identifying performance obligations, IFRS 15 and related amendment require that a good or service is distinct if it is capable of being distinct (for example, the Bank regularly sells it separately) and the promise to transfer it is distinct within the context of the contract (i.e. the nature of the promise in the contract is to transfer each of those goods or services individually rather than to transfer combined items). Under IFRS 15, the Bank will allocate the transaction price to each performance obligation identified in the contract on a relative stand-alone selling price basis. Under current standard, the Bank applies residual value method to allocate the amount of revenue to be recognized. Incremental costs of obtaining a contract will be recognized as an asset to the extent the Bank expects to recover those costs. Such asset will be amortized on a basis that is consistent with the transfer to the customer of the goods or services to which the asset relates. This will lead to the later recognition of charges for certain customer-obtaining costs. The Bank chooses to apply IFRS 15 only to contracts that have not yet been completed on January 1, 2018, and the relevant cumulative effect will be adjusted to retained earnings on that date.
4) Amendment to IAS 12 “Recognition of Deferred Tax Assets for Unrealized Losses” The amendment clarifies that the difference between the carrying amount of the debt instrument measured at fair value and its tax base gives rise to a temporary difference, even though there are unrealized losses on that asset, irrespective of whether the Bank expects to recover the carrying amount of the debt instrument by sale or by holding it and collecting contractual cash flows. In addition, in determining whether to recognize a deferred tax asset, the Bank should assess a deductible temporary difference in combination with all of its other deductible temporary differences, unless the tax law restricts the utilization of losses as deduction against income of a specific type, in which case, a deductible temporary difference is assessed in combination only with other deductible temporary differences of the appropriate type. The amendment also stipulates that, when determining whether to recognize a deferred tax asset, the estimate of probable future taxable profit may include some of the Bank’s assets for more than their carrying amount if there is sufficient evidence that it is probable that the Bank will achieve the higher amount, and that the estimate for future taxable profit should exclude tax deductions resulting from the reversal of deductible temporary differences. In assessing a deferred tax asset, the Bank currently assumes it will recover the asset at its carrying amount when estimating probable future taxable profit; the amendments will be applied retrospectively in 2018.

- 22 -
5) Amendments to IAS 40 “Transfers of Investment Property” The amendments clarify that the Bank should transfer to, or from, investment property when, and only when, the property meets, or ceases to meet, the definition of investment property and there is evidence of the change in use. In isolation, a change in management’s intentions for the use of a property does not provide evidence of a change in use. The amendments also clarify that the evidence of the change in use is not limited to those illustrated in IAS 40.
6) IFRIC 22 “Foreign Currency Transactions and Advance Consideration” IAS 21 stipulated that a foreign currency transaction shall be recorded on initial recognition in the functional currency by applying to the foreign currency amount the spot exchange rate between the functional currency and the foreign currency at the date of the transaction. IFRIC 22 further explains that the date of the transaction is the date on which an entity recognizes a non-monetary asset or non-monetary liability from payment or receipt of advance consideration. If there are multiple payments or receipts in advance, the entity shall determine the date of the transaction for each payment or receipt of advance consideration. The Bank will apply IFRIC 22 prospectively to all assets, expenses and income recognized on or after January 1, 2018 within the scope of the interpretation.
d. New IFRSs in issue but not yet endorsed and issued into effect by the FSC
New IFRSs Effective Date
Announced by IASB (Note 1) Annual Improvements to IFRSs 2015-2017 Cycle January 1, 2019 Amendments to IFRS 9 “Prepayment Features with Negative
Compensation” January 1, 2019
Amendments to IFRS 10 and IAS 28 “Sale or Contribution of Assets between an Investor and Its Associate or Joint Venture”
To be determined by IASB
IFRS 16 “Leases” January 1, 2019 (Note 3) IFRS 17 “Insurance Contracts” January 1, 2021 Amendments to IAS 19 “Plan Amendment, Curtailment or
Settlement” January 1, 2019 (Note 4)
Amendments to IAS 28 “Long-term Interests in Associates and Joint Ventures”
January 1, 2019
IFRIC 23 “Uncertainty Over Income Tax Treatments” January 1, 2019 Note 1: Unless stated otherwise, the above New IFRSs are effective for annual periods beginning on
or after their respective effective dates. Note 2: The FSC permits the election for early adoption of the amendments starting from 2018. Note 3: On December 19, 2017, the FSC announced that IFRS 16 will take effect starting from
January 1, 2019. Note 4: The Bank shall apply these amendments to plan amendments, curtailments or settlements
occurring on or after January 1, 2019.

- 23 -
1) Amendments to IFRS 10 and IAS 28 “Sale or Contribution of Assets between an Investor and its Associate or Joint Venture” The amendments stipulate that, when the Bank sells or contributes assets that constitute a business (as defined in IFRS 3) to an associate or joint venture, the gain or loss resulting from the transaction is recognized in full. Also, when the bank loses control of a subsidiary that contains a business but retains significant influence or joint control, the gain or loss resulting from the transaction is recognized in full. Conversely, when the Bank sells or contributes assets that do not constitute a business to an associate or joint venture, the gain or loss resulting from the transaction is recognized only to the extent of the unrelated investors’ interest in the associate or joint venture, i.e. the Bank’s share of the gain or loss is eliminated. Also, when the Bank loses control of a subsidiary that does not contain a business but retains significant influence or joint control over an associate or a joint venture, the gain or loss resulting from the transaction is recognized only to the extent of the unrelated investors’ interest in the associate or joint venture, i.e. the Bank’s share of the gain or loss is eliminated.
2) IFRS 16 “Leases” IFRS 16 sets out the accounting standards for leases that will supersede IAS 17 and a number of related interpretations. Under IFRS 16, if the Bank is a lessee, it shall recognize right-of-use assets and lease liabilities for all leases on the consolidated balance sheets except for low-value and short-term leases. The Bank may elect to apply the accounting method similar to the accounting for operating leases under IAS 17 to low-value and short-term leases. On the statements of comprehensive income, the Bank should present the depreciation expense charged on right-of-use assets separately from the interest expense accrued on lease liabilities; interest is computed by using the effective interest method. On the statements of cash flows, cash payments for the principal portion of lease liabilities are classified within financing activities; cash payments for the interest portion are classified within operating activities. The application of IFRS 16 is not expected to have a material impact on the accounting of the Bank as lessor. When IFRS 16 becomes effective, the Bank may elect to apply this standard either retrospectively to each prior reporting period presented or retrospectively with the cumulative effect of the initial application of this standard recognized at the date of initial application.
3) IFRIC 23 “Uncertainty Over Income Tax Treatments” IFRIC 23 clarifies that when there is uncertainty over income tax treatments, the Bank should assume that the taxation authority will have full knowledge of all related information when making related examinations. If the Bank concludes that it is probable that the taxation authority will accept an uncertain tax treatment, the Bank should determine the taxable profit, tax bases, unused tax losses, unused tax credits or tax rates consistently with the tax treatments used or planned to be used in its income tax filings. If it is not probable that the taxation authority will accept an uncertain tax treatment, the Bank should make estimates using either the most likely amount or the expected value of the tax treatment, depending on which method the Bank expects to better predict the resolution of the uncertainty. The Bank has to reassess its judgments and estimates if facts and circumstances change. On initial application, the Bank shall apply IFRIC 23 either retrospectively to each prior reporting period presented, if this is possible without the use of hindsight, or retrospectively with the cumulative effect of the initial application of IFRIC 23 recognized at the date of initial application.
- 24 -
4) Amendments to IFRS 9 “Prepayment Features with Negative Compensation”
IFRS 9 stipulated that if a contractual term of a financial asset permits the issuer (i.e. the debtor) to prepay a debt instrument or permits the holder (i.e. the creditor) to put a debt instrument back to the issuer before maturity and the prepayment amount substantially represents unpaid amounts of principal and interest on the principal amount outstanding, which may include reasonable compensation for early termination, the financial asset has contractual cash flows that are solely payments of principal and interest on the principal amount outstanding. The amendments further explained that reasonable compensation may be paid or received by either of the parties, i.e. a party may receive reasonable compensation when it chooses to terminate the contract early. When the amendments become effective, the Bank shall apply the amendments retrospectively. However, the Bank may elect to recognize the cumulative effect of the initial application of the amendments in the opening carrying amount at the date of initial application, or to restate prior periods if, and only if, it is possible without the use of hindsight.
5) Annual Improvements to IFRSs 2015-2017 Cycle Several standards, including IFRS 3, IFRS 11, IAS 12 and IAS 23 “Borrowing Costs”, were amended in this annual improvement. IAS 23 was amended to clarify that, if any specific borrowing remains outstanding after the related asset is ready for its intended use or sale, that borrowing becomes part of the funds that an entity borrows generally when calculating the capitalization rate on general borrowings. The amendment shall be applied prospectively.
6) Amendments to IAS 19 “Plan Amendment, Curtailment or Settlement”
The amendments stipulate that, if a plan amendment, curtailment or settlement occurs, the current service cost and the net interest for the remainder of the annual reporting period are determined using the actuarial assumptions used for the remeasurement of the net defined benefit liabilities (assets). In addition, the amendments clarify the effect of a plan amendment, curtailment or settlement on the requirements regarding the asset ceiling. The amendment shall be applied prospectively.
Except for the above impact, as of the date the consolidated financial statements were authorized for issue, the Bank is continuously assessing the possible impact that the application of other standards and interpretations will have on the Bank’s financial position and financial performance, and will disclose the relevant impact when the assessment is completed.
4. SUMMARY OF SIGNIFICANT ACCOUNTING POLICIES
Statement of Compliance The financial statements have been prepared in accordance with the Regulations Governing the Preparation of Financial Reports by Public Banks and Regulations Governing the Preparation of Financial Reports by Securities Firms. Basis of Preparation The financial statements have been prepared on the historical cost basis except for financial instruments that are measured at revalued amounts or fair values. Historical cost is generally based on the fair value of the consideration given in exchange for assets.

- 25 -
When preparing its financial statements, the Bank used the equity method to account for its investment in subsidiaries and associates. In order for the amounts of the net profit for the year, other comprehensive income for the year and total equity in the parent company only financial statements to be the same with the amounts attributable to the owner of the Bank in its consolidated financial statements, adjustments arising from the differences in accounting treatment between parent company only basis and consolidated basis were made to investments accounted for using equity method, share of profit or loss of subsidiaries and associates, share of other comprehensive income of subsidiaries, associates and related equity items, as appropriate, in the financial statements. Foreign Currencies In preparing the financial statements of each group entity, transactions in currencies other than the Bank’s functional currency (foreign currencies) are recognized at the rates of exchange prevailing at the dates of the transactions. At the end of each reporting period, monetary items denominated in foreign currencies are retranslated at the rates prevailing at that date. Exchange differences on monetary items arising from settlement or translation are recognized in profit or loss in the period in which they arise except for: Exchange differences on monetary items receivable from or payable to a foreign operation for which settlement is neither planned nor likely to occur (therefore forming part of the net investment in the foreign operation), which are recognized initially in other comprehensive income and reclassified from equity to profit or loss on disposal of the net investments. Non-monetary items measured at fair value that are denominated in foreign currencies are retranslated at the rates prevailing at the date when the fair value was determined. Exchange differences arising from the retranslation of non-monetary items are included in profit or loss for the period except for exchange differences arising from the retranslation of non-monetary items in respect of which gains and losses are recognized directly in other comprehensive income, in which cases, the exchange differences are also recognized in other comprehensive income. Non-monetary items that are measured at historical cost in a foreign currency are translated using the exchange rate at the date of the transaction. For the purposes of presenting financial statements, the assets and liabilities of the Bank’s foreign operations (including subsidiaries, associates, joint ventures and branches in other countries that use currencies which are different from the currency of the Bank) are translated into the presentation currency, the New Taiwan dollars, as follows: Assets and liabilities are translated at the exchange rates prevailing at the end of the reporting period; and income and expense items are translated at the average exchange rates for the period. The resulting currency translation differences are recognized in other comprehensive income. Investments Accounted for Using the Equity Method The Bank uses the equity method to account for its investments in subsidiaries and associates. a. Investments in subsidiaries
A subsidiary is an entity (including a structured entity) that is controlled by the Bank. Under the equity method, an investment in a subsidiary is initially recognized at cost and adjusted thereafter to recognize the Bank’s share of the profit or loss and other comprehensive income of the subsidiary. The Bank also recognizes the changes in the Bank’s share of equity of subsidiaries attributable to the Bank.

- 26 -
Changes in the Bank’s ownership interest in a subsidiary that do not result in the Bank losing control of the subsidiary are equity transactions. The Bank recognizes directly in equity any difference between the carrying amount of the investment and the fair value of the consideration paid or received. When the Bank’s share of losses of a subsidiary exceeds its interest in that subsidiary (which includes any carrying amount of the investment accounted for using the equity method and long-term interests that, in substance, form part of the Bank’s net investment in the subsidiary), the Bank continues recognizing its share of further losses. Any excess of the cost of acquisition over the Bank’s share of the net fair value of the identifiable assets and liabilities of a subsidiary at the date of acquisition is recognized as goodwill, which is included within the carrying amount of the investment and is not amortized. Any excess of the Bank’s share of the net fair value of the identifiable assets and liabilities over the cost of acquisition is recognized immediately in profit or loss. The Bank assesses its investment for any impairment by comparing the carrying amount with the estimated recoverable amount as assessed based on the entire financial statements of the invested company. Impairment loss is recognized when the carrying amount exceeds the recoverable amount. If the recoverable amount of the investment subsequently increases, the Bank recognizes the reversal of the impairment loss; the adjusted post-reversal carrying amount should not exceed the carrying amount that would have been recognized had no impairment loss been recognized in prior years. An impairment loss recognized on goodwill cannot be reversed in a subsequent period. When the Bank loses control of a subsidiary, it recognizes the investment retained in the former subsidiary at its fair value at the date when control is lost. The difference between the fair value of the retained investment plus any consideration received and the carrying amount of the previous investment at the date when control is lost is recognized as a gain or loss in profit or loss. Besides, the Bank accounts for all amounts previously recognized in other comprehensive income in relation to that subsidiary on the same basis as would be required if the Bank had directly disposed of the related assets or liabilities. Profits or losses resulting from downstream transactions are eliminated in full only in the parent Bank’s financial statements. Profits and losses resulting from upstream transactions and transactions between subsidiaries are recognized only in the parent Bank’s financial statements only to the extent of interests in the subsidiaries that are not related to the Bank.
b. Investment in associates
An associate is an entity over which the Bank has significant influence and that is neither a subsidiary nor an interest in a joint venture. The Bank uses the equity method to account for its investments in associates. Under the equity method, investments in an associate are initially recognized at cost and adjusted thereafter to recognize the Bank’s share of the profit or loss and other comprehensive income of the associate. The Bank also recognizes the changes in the Bank’s share of the equity of associates attributable to the Group. Any excess of the cost of acquisition over the Bank’s share of the net fair value of the identifiable assets and liabilities of an associate or a joint venture at the date of acquisition is recognized as goodwill, which is included within the carrying amount of the investment and is not amortized. Any excess of the Bank’s share of the net fair value of the identifiable assets and liabilities over the cost of acquisition, after reassessment, is recognized immediately in profit or loss.

- 27 -
When the Bank subscribes for additional new shares of an associate at a percentage different from its existing ownership percentage, the resulting carrying amount of the investment differs from the amount of the Bank’s proportionate interest in the associate. The Bank records such a difference as an adjustment to investments with the corresponding amount charged or credited to capital surplus - changes in capital surplus from investments in associates accounted for using the equity method. If the Bank’s ownership interest is reduced due to its additional subscription of the new shares of the associate, the proportionate amount of the gains or losses previously recognized in other comprehensive income in relation to that associate is reclassified to profit or loss on the same basis as would be required if the investee had directly disposed of the related assets or liabilities. When the adjustment should be debited to capital surplus, but the capital surplus recognized from investments accounted for using the equity method is insufficient, the shortage is debited to retained earnings. When the Bank’s share of losses of an associate equals or exceeds its interest in that associate (which includes any carrying amount of the investment accounted for using the equity method and long-term interests that, in substance, form part of the Bank’s net investment in the associate), the Bank discontinues recognizing its share of further losses. Additional losses and liabilities are recognized only to the extent that the Bank has incurred legal obligations, or constructive obligations, or made payments on behalf of that associate. The entire carrying amount of an investment (including goodwill) is tested for impairment as a single asset by comparing its recoverable amount with its carrying amount. Any impairment loss recognized is deducted from the carrying amount of the investment. Any reversal of that impairment loss is recognized to the extent that the recoverable amount of the investment subsequently increases. The Bank discontinues the use of the equity method from the date on which its investment ceases to be an associate. Any retained investment is measured at fair value at that date, and the fair value is regarded as the investment’s fair value on initial recognition as a financial asset. The difference between the previous carrying amount of the associate attributable to the retained interest and its fair value is included in the determination of the gain or loss on disposal of the associate. The Bank accounts for all amounts previously recognized in other comprehensive income in relation to that associate on the same basis as would be required if that associate had directly disposed of the related assets or liabilities. If an investment in an associate becomes an investment in a joint venture or an investment in a joint venture becomes an investment in an associate, the Bank continues to apply the equity method and does not remeasure the retained interest. When the Bank entity transacts with its associate, profits and losses resulting from the transactions with the associate are recognized in the Bank’ consolidated financial statements only to the extent that interests in the associate are not related to the Bank.
Financial Instruments Financial assets and financial liabilities are recognized when a Bank entity becomes a party to the contractual provisions of the instruments. Financial assets and financial liabilities are initially measured at fair value. Transaction costs that are directly attributable to an acquisition or issuance of financial assets and financial liabilities (other than financial assets and financial liabilities at fair value through profit or loss) are added to or deducted from the fair value of the financial assets or financial liabilities, as appropriate, on initial recognition. Transaction costs directly attributable to the acquisition of financial assets or financial liabilities at fair value through profit or loss are recognized immediately in profit or loss. Financial assets All regular way purchases or sales of financial assets are recognized and derecognized on a trade date basis.
- 28 -
a. Measurement category Financial assets are classified into the following categories: Financial assets at fair value through profit or loss, held-to-maturity investments, available-for-sale financial assets, and loans and receivables. 1) Financial assets at fair value through profit or loss
Financial assets are classified as at fair value through profit or loss when such financial assets are either held for trading or designated as at fair value through profit or loss. A financial asset may be designated as at fair value through profit or loss upon initial recognition if: a) Such designation eliminates or significantly reduces a measurement or recognition
inconsistency that would otherwise arise; or b) The financial asset forms part of the Bank of financial assets or financial liabilities or both,
which is managed and has performance evaluated on a fair value basis in accordance with the Bank’s documented risk management or investment strategy, and information about the grouping is provided internally on that basis; or
c) The contract contains one or more embedded derivatives so that the entire hybrid (combined)
contract can be designated as at fair value through profit or loss. Financial assets at fair value through profit or loss are stated at fair value, with any gains or losses arising on remeasurement recognized in profit or loss. The net gain or loss recognized in profit or loss incorporates any dividend or interest earned on the financial asset. Fair value is determined in the manner described in Note 44. Investments in equity instruments under financial assets at fair value through profit or loss that do not have a quoted market price in an active market and whose fair value cannot be reliably measured and derivatives that are linked to and must be settled by the delivery of such unquoted equity instruments are subsequently measured at cost less any identified impairment loss at the end of each reporting period and presented in a separate line item as financial assets measured at cost. If, in a subsequent period, the fair value of the financial assets can be reliably measured, the financial assets are remeasured at fair value. The difference between the carrying amount and the fair value is recognized in profit or loss.
2) Held-to-maturity investments
Corporate bonds, government bonds and asset backed securities which the Bank has the positive intent and ability to hold to maturity held-to-maturity investments. Subsequent to initial recognition, held-to-maturity investments are measured at amortized cost using the effective interest method less any impairment.
3) Available-for-sale financial assets Available-for-sale financial assets are non-derivatives that are either designated as available-for-sale or are not classified as loans and receivables, held-to-maturity investments or financial assets at fair value through profit or loss. The Bank holds government bonds, corporate bonds, listed stocks, mutual funds, negotiable certificates of deposit and commercial paper in an active market that are classified as trading and available-for-sale financial assets and are stated at fair value at each balance sheet date. Fair value is determined in the manner described in Note 44.

- 29 -
Available-for-sale financial assets are measured at fair value. Changes in the carrying amounts of available-for-sale monetary financial assets (relating to changes in foreign currency exchange rates, interest income calculated using the effective interest method and dividends on available-for-sale equity investments) are recognized in profit or loss. Other changes in the carrying amount of available-for-sale financial assets are recognized in other comprehensive income and will be reclassified to profit or loss when such investments are disposed of or are determined to be impaired. Dividends on available-for-sale equity instruments are recognized in profit or loss when the Bank’s right to receive the dividends is established. Available-for-sale equity investments that do not have a quoted market price in an active market and whose fair value cannot be reliably measured and derivatives that are linked to and must be settled by delivery of such unquoted equity investments are measured at cost less any identified impairment loss at the end of each reporting period and presented in a separate line item as financial assets measured at cost. If, in a subsequent period, the fair value of the financial assets can be reliably measured, the financial assets are remeasured at fair value. The difference between the carrying amount and the fair value is recognized in other comprehensive income on financial assets. Any impairment losses are recognized in profit and loss.
4) Loans and receivables Loans and receivables (including trade loans, receivables, cash and cash equivalent, debt investments with no active market, and nonperforming loans) are measured using the effective interest method at amortized cost less any impairment, except for short-term receivables when the effect of discounting is immaterial. Cash equivalents include time deposits with original maturities within 3 months from the date of acquisition, which are highly liquid, readily convertible to a known amount of cash and are subject to an insignificant risk of changes in value. These cash equivalents are held for the purpose of meeting short-term cash commitments.
b. Impairment of financial assets Financial assets, other than those at fair value through profit or loss, are assessed for indicators of impairment at the end of each reporting period. Financial assets are considered to be impaired when there is objective evidence, as a result of one or more events that occurred after the initial recognition of the financial assets, that the estimated future cash flows of the investment have been affected. Certain categories of financial assets, such as loans, receivables, nonperforming loans and debt investments with no active market, are assessed for impairment collectively even if they are assessed as not impaired individually. Objective evidence of impairment of a portfolio of discounts and loans, receivables and nonperforming loans could include the significant financial difficulty of the debtor, economic or legal reasons relating to the debtor’s financial difficulties, a counterparty’s compromise on or breach of a contract, and an asset becoming more than three months overdue. For financial assets carried at amortized cost, the amount of the impairment loss recognized is the difference between the asset’s carrying amount and the present value of estimated future cash flows, discounted at the financial asset’s original effective interest rate. For financial assets carried at amortized cost, if, in a subsequent period, the amount of the impairment loss decreases and the decrease can be related objectively to an event occurring after the impairment was recognized, the previously recognized impairment loss is reversed through profit or loss to the extent that the carrying amount of the investment at the date of impairment is reversed does not exceed what the amortized cost would have been had the impairment not been recognized.

- 30 -
For any available-for-sale equity investments, a significant or prolonged decline in the fair value of the security below its cost is considered to be objective evidence of impairment. For all other financial assets, objective evidence of impairment could include significant financial difficulty of the issuer or counterparty, breach of contract, such as a default or delinquency in interest or principal payments, it becoming probable that the borrower will enter bankruptcy or financial re-organization, or the disappearance of an active market for those financial asset because of financial difficulties. When an available-for-sale financial asset is considered to be impaired, cumulative gains or losses previously recognized in other comprehensive income are reclassified to profit or loss in the period. In respect of available-for-sale equity securities, impairment loss previously recognized in profit or loss is not reversed through profit or loss. Any increase in fair value subsequent to an impairment loss is recognized in other comprehensive income. In respect of available-for-sale debt securities, impairment loss is subsequently reversed through profit or loss if an increase in the fair value of the investment can be objectively related to an event occurring after the recognition of the impairment loss. For financial assets that are measured at cost, the amount of the impairment loss is measured as the difference between such an asset’s carrying amount and the present value of the estimated future cash flows discounted at the current market rate of return for a similar financial asset. Such impairment loss will not be reversed in subsequent periods. The carrying amount of the financial asset is reduced by the impairment loss directly for all financial assets with the exception of trade receivables and other receivables where the carrying amount is reduced through the use of an allowance account. When a trade receivable and other receivables are considered uncollectable, it is written off against the allowance account. Subsequent recoveries of amounts previously written off are credited against the allowance account. Changes in the carrying amount of the allowance account are recognized in profit or loss except for uncollectable trade receivables and other receivables that are written off against the allowance account.
c. Derecognition of financial assets The Bank derecognizes a financial asset only when the contractual rights to the cash flows from the asset expire or when it transfers the financial asset and substantially all the risks and rewards of ownership of the asset to another party. On derecognition of a financial asset in its entirety, the difference between the asset’s carrying amount and the sum of the consideration received and receivable and the cumulative gain or loss that had been recognized in other comprehensive income is recognized in profit or loss.
Equity instruments Debt and equity instruments issued by the Bank entity are classified as either financial liabilities or as equity in accordance with the substance of the contractual arrangements and the definitions of a financial liability and an equity instrument. An equity instrument is any contract that evidences a residual interest in the assets of an entity after deducting all of its liabilities. Equity instruments issued by the Bank entity are recognized at the proceeds received, net of direct issue costs. The repurchase of the Bank’s own equity instruments is recognized in and deducted directly from equity. No gain or loss is recognized in profit or loss on the purchase, sale, issuance or cancellation of the Bank’s own equity instruments.

- 31 -
Financial liabilities a. Subsequent measurement
Except the following situations, all financial liabilities are carried at amortized cost using the effective interest method: 1) Financial liabilities at fair value through profit or loss
Financial liabilities are classified as at fair value through profit or loss when the financial liability are either held for trading or it is designated as at fair value through profit or loss. A financial liability may be designated as at fair value through profit or loss upon initial recognition when doing so results in more relevant information and if: a) Such designation eliminates or significantly reduces a measurement or recognition
inconsistency that would otherwise arise; or b) The financial liability forms part of a Bank of financial assets or financial liabilities or both,
which is managed and has performance evaluated on a fair value basis, in accordance with the Bank’s documented risk management or investment strategy, and information about the grouping is provided internally on that basis; or
c) A contract contains one or more embedded derivatives so that the entire hybrid (combined)
contract can be designated as at fair value through profit or loss. For a financial liability designated as at fair value through profit or loss, the amount of changes in fair value attributable to changes in the credit risk of the liability is presented in other comprehensive income and it will not be subsequently reclassified to profit or loss. The remaining amount of changes in the fair value of that liability which incorporates any interest or dividend paid on the financial liability is presented in profit or loss. The gain or loss accumulated in other comprehensive income will be transferred to retained earnings when the financial liabilities are derecognized. If this accounting treatment related to credit risk would create or enlarge an accounting mismatch, all changes in fair value of the liability are presented in profit or loss. Fair value is determined in the manner described in Note 44.
2) Financial guarantee contracts
Financial guarantee contracts issued by the Bank are initially measured at their fair values and, if not designated as at fair value through profit or loss, are subsequently measured at the higher of the best estimate of the obligation under the contract or the amount initially recognized less cumulative amortization recognized.
b. Derecognition of financial liabilities
The Bank derecognizes financial liabilities when, and only when, the Bank’s obligations are discharged, cancelled or they expire. The difference between the carrying amount of a financial liability derecognized and the consideration paid, including any non-cash assets transferred or liabilities assumed, is recognized in profit or loss.

- 32 -
Derivative financial instruments Derivatives are initially recognized at fair value at the date the derivative contracts are entered into and are subsequently remeasured to their fair value at the end of each reporting period. The resulting gain or loss is recognized in profit or loss immediately unless the derivative is designated and effective as a hedging instrument, in which event the timing of the recognition in profit or loss depends on the nature of the hedging relationship. When the fair value of derivative financial instruments is positive, the derivative is recognized as a financial asset; when the fair value of derivative financial instruments is negative, the derivative is recognized as a financial liability. Derivatives embedded in non-derivative host contracts are treated as separate derivatives when they meet the definition of a derivative; their risks and characteristics are not closely related to those of the host contracts and the contracts are not measured at fair value through profit or loss. Nonperforming Loans Under the “Regulations Governing the Procedures for Banking Institutions to Evaluate Assets and Deal with Nonperforming/Nonaccrual Loans” issued by the authorities, loans and other credits (including the accrued interests) that remain unpaid on their maturity are transferred immediately to nonperforming loans if the transfer is approved by the board of directors. Nonperforming loans transferred from loans are recognized as discounts and loans, and those transferred from other credits are recognized as other financial assets. Allowance for Doubtful Accounts and Reserve for Losses on Guarantees In determining the allowance for credit losses and the reserve for losses on guarantees, the Bank assesses the balances of discounts and loans, receivables, nonperforming loans, and other financial assets as well as guarantees and acceptances for their collectability and their specific risks or general risks as of the balance sheet date. Under the regulations issued by the Ministry of Finance (MOF), the Bank evaluates credit balances on the basis of their estimated collectability. The MOF regulations also require the grouping of loans into these five classes: Normal, special mention, substandard, with doubtful collectability and uncollectable; the minimum allowances for doubtful accounts and for losses on guarantees for these loans should be 1%, 2%, 10%, 50% and 100%, respectively, of outstanding credits. Later, the MOF issued a guideline stating that, within three years from January 1, 2011, the normal loans should have a minimum allowance of 1%, with the allowances for the four non-normal loans remaining the same. The Bank believes it can meet this new allowance requirement within three years from January 1, 2011. Rule No. 10300329440 issued by FSC, stipulated the minimum the allowance for mortgage and improvement loans should be 1.5% by the end of 2016. Credits deemed uncollectable may be written off if the write-off is approved by the board of directors. Recoveries of amounts previously written off are credited to the allowance account. Repurchase and Resell Transactions Securities purchased under agreement to resell and securities sold under agreements to repurchase are generally treated as collateralized financing transactions. Interest earned on reverse repurchase agreements or interest incurred on repurchase agreements is recognized as interest income or interest expense over the life of each agreement.

- 33 -
Property and Equipment Property and equipment are stated at cost less accumulated depreciation and accumulated impairment loss. Freehold land is not depreciated. Depreciation of property and equipment is recognized using the straight-line method. Each significant part is depreciated separately. If a lease term is shorter than the assets’ useful lives, such assets are depreciated over the lease term. The estimated useful lives, residual values and depreciation methods are reviewed at the end of each reporting period, with the effects of any changes in the estimates accounted for on a prospective basis. For a contract where an owner of land provides land for construction of buildings by a property developer in exchange for a certain percentage of the buildings, any exchange gain or loss is recognized when the exchange transaction occurs, if the buildings acquired are classified as property, plant and equipment and the exchange transaction has commercial substance. On derecognition of an item of property and equipment, the difference between the sales proceeds and the carrying amount of the asset is recognized in profit or loss. Goodwill Goodwill arising from the acquisition of a business is carried at cost as established at the date of acquisition of the business less accumulated impairment loss. For the purposes of impairment testing, goodwill is allocated to each of the Bank’s cash-generating units or Bank of cash-generating units (referred to as “cash-generating units”) that is expected to benefit from the synergies of the combination. A cash-generating unit to which goodwill has been allocated is tested for impairment annually or more frequently when there is an indication that the unit may be impaired, by comparing its carrying amount, including the attributed goodwill, with its recoverable amount. However, if the goodwill allocated to a cash-generating unit was acquired in a business combination during the current annual period, that unit shall be tested for impairment before the end of the current annual period. If the recoverable amount of the cash-generating unit is less than its carrying amount, the impairment loss is allocated first to reduce the carrying amount of any goodwill allocated to the unit and then pro rata to the other assets of the unit based on the carrying amount of each asset in the unit. Any impairment loss is recognized directly in profit or loss. Any impairment loss recognized on goodwill is not reversed in subsequent periods. If goodwill has been allocated to a cash-generating unit and the entity disposes of an operation within that unit, the goodwill associated with the operation which is disposed of is included in the carrying amount of the operation when determining the gain or loss on disposal and is measured on the basis of the relative values of the operation disposed of and the portion of the cash-generating unit retained. Intangible Assets Separate acquisition Intangible assets with finite useful lives that are acquired separately are initially measured at cost and subsequently measured at cost less accumulated amortization and accumulated impairment losses. Amortization is recognized on a straight-line basis. The estimated useful lives, residual values, and amortization methods are reviewed at the end of each reporting period, with the effect of any changes in the estimates accounted for on a prospective basis.

- 34 -
Derecognition On derecognition of an intangible asset, the difference between the net disposal proceeds and the carrying amount of the asset is recognized in profit or loss. Foreclosed Collaterals Collaterals assumed (included in other assets) are recorded at cost, which includes the assumed prices and any necessary repairs to make the collaterals saleable, and evaluated at the lower of cost or net realizable value as of the balance sheet date. Impairment of Tangible and Intangible Assets (Excluded Goodwill) At the end of each reporting period, the Bank reviews the carrying amounts of its tangible and intangible assets, excluding goodwill, to determine whether there is any indication that those assets have suffered any impairment loss. If any such indication exists, the recoverable amount of the asset is estimated in order to determine the extent of the impairment loss. When it is not possible to estimate the recoverable amount of an individual asset, the Bank estimates the recoverable amount of the cash-generating unit to which the asset belongs. Corporate assets are allocated to cash-generating units on a reasonable and consistent basis of allocation. The recoverable amount is the higher of fair value less costs to sell and value in use. If the recoverable amount of an asset or cash-generating unit is estimated to be less than its carrying amount, the carrying amount of the asset or cash-generating unit is reduced to its recoverable amount, with the resulting impairment loss recognized in profit or loss. When an impairment loss is subsequently reversed, the carrying amount of the corresponding asset or cash-generating unit is increased to the revised estimate of its recoverable amount, but only to the extent of the carrying amount that would have been determined had no impairment loss been recognized for the asset or cash-generating unit in prior years. A reversal of an impairment loss is recognized in profit or loss. Leasing Leases are classified as finance leases whenever the terms of the lease transfer substantially all the risks and rewards of ownership to the lessee. All other leases are classified as operating leases. a. The Bank as lessor
Rental income from operating leases is recognized on a straight-line basis over the term of the relevant lease. Initial direct costs incurred in negotiating and arranging an operating lease are added to the carrying amount of the leased asset and amortized on a straight-line basis over the lease term. Lease incentives included in an operating lease are recognized as an asset. The aggregate cost of incentives is recognized as a reduction of rental income on a straight-line basis. Lease incentives are recognized as income in the period in which they are incurred.
b. Bank as lessee Lease payments under an operating lease are expensed on a straight-line basis over the lease period. Under operating lease, contingent rentals are recognized as expenses at current period. Lease incentives received under operating leases are recognized as a liability. The aggregate benefit of incentives is recognized as a reduction of rental expense on a straight-line basis.

- 35 -
Provisions Provisions, including those arising from contractual obligation specified in service concession arrangement to maintain or restore infrastructure before it is handed over to the grantor, are measured at the best estimate of the discounted cash flows of the consideration required to settle the present obligation at the end of the reporting period, taking into account the risks and uncertainties surrounding the obligation. When some or all of the economic benefits required to settle a provision are expected to be recovered from a third party, a receivable is recognized as an asset if it is virtually certain that reimbursement will be received and the amount of the receivable can be measured reliably. Employee Benefits a. Short-term employee benefits
Liabilities recognized in respect of short-term employee benefits are measured at the undiscounted amount of the benefits expected to be paid in exchange for the related service.
b. Retirement benefits Payments to defined contribution retirement benefit plans are recognized as an expense when employees have rendered service entitling them to the contributions. Defined benefit costs (including service cost, net interest and remeasurement) under the defined benefit retirement benefit plans are determined using the projected unit credit method. Service cost (including current service cost and past service cost) and net interest on the net defined benefit liability (asset) are recognized as employee benefits expense in the period they occur. Remeasurement, comprising actuarial gains and losses, the effect of the changes to the asset ceiling and the return on plan assets (excluding interest), is recognized in other comprehensive income in the period in which they occur. Remeasurement recognized in other comprehensive income is reflected immediately in retained earnings and will not be reclassified to profit or loss. Net defined benefit liability (asset) represents the actual deficit (surplus) in the Bank’s defined benefit plan. Any surplus resulting from this calculation is limited to the present value of any refunds from the plans or reductions in future contributions to the plans.
c. Other long-term employee benefits Other long-term employee benefits are accounted for in the same way as the accounting required for a defined benefit plan except that remeasurement is recognized in profit or loss.
d. Termination benefits A liability for a termination benefit is recognized at the earlier of when the Bank can no longer withdraw the offer of the termination benefit and when the Bank recognizes any related restructuring costs.
Income Tax Income tax expense represents the sum of the tax currently payable and deferred tax. a. Current tax
According to the Income Tax Law, an additional tax at 10% of unappropriated earnings is provided for as income tax in the year the stockholders approve to retain the earnings.

- 36 -
Adjustments of prior years’ tax liabilities are added to or deducted from the current year’s tax provision.
b. Deferred tax Deferred tax is recognized on temporary differences between the carrying amounts of assets and liabilities in the financial statements and the corresponding tax bases used in the computation of taxable profit. Deferred tax liabilities are generally recognized for all taxable temporary differences. Deferred tax assets are generally recognized for all deductible temporary difference and unused loss carryforwards to the extent that it is probable that taxable profits will be available against which those deductible temporary differences can be utilized. Such deferred tax assets and liabilities are not recognized if the temporary difference arises from goodwill or from the initial recognition (other than in a business combination) of other assets and liabilities in a transaction that affects neither the taxable profit nor the accounting profit. Deferred tax liabilities are recognized for taxable temporary differences associated with investments in subsidiaries and associates, and interests in joint ventures, except where the Bank can control the reversal of the temporary difference and it is probable that the temporary difference will not reverse in the foreseeable future. Deferred tax assets arising from deductible temporary differences associated with such investments and interests are recognized only to the extent that it is probable that there will be sufficient taxable profits against which to use the benefits of the temporary differences and these differences are expected to reverse in the foreseeable future. The carrying amount of deferred tax assets is reviewed at the end of each reporting period and reduced to the extent that it is no longer probable that sufficient taxable profits will be available to allow all or part of the asset to be recovered. A previously unrecognized deferred tax asset is also reviewed at the end of each reporting period and recognized to the extent that it has become probable that future taxable profit will allow the deferred tax asset to be recovered. Deferred tax assets and liabilities are measured at the amounts expected to be paid to (recovered from) taxation authorities, using the rates or laws that have been enacted or substantively enacted by the balance sheet date. The measurement of deferred tax liabilities and assets should reflect the tax consequences of how the Bank expects, at the end of the reporting period, to recover or settle the carrying amount of its assets and liabilities.
c. Current and deferred taxes for the period For transactions recognized in profit or loss, current and deferred taxes are also recognized in profit or loss; for transactions recognized outside profit or loss, i.e., in other comprehensive income or directly in equity, the current and deferred taxes are also recognized in other comprehensive income or directly in equity. Where current tax or deferred tax arises from the initial accounting for a business combination, the tax effect is included in the accounting for the business combination.
Interest Revenue and Service Fees Interest revenue on loans is recorded by the accrual method. No interest revenue is recognized in the accompanying financial statements on loans and other credits extended by the Bank that are classified as nonperforming loans. The interest revenue on these loans/credits is recognized upon collection. Under a Ministry of Finance regulation, the interest revenue on credits covered by agreements that extend their repayment periods is recorded as deferred revenue and recognized as revenue upon collection Revenue from brokerage is recognized when the earnings process has been completed.

- 37 -
5. CRITICAL ACCOUNTING JUDGMENTS AND KEY SOURCES OF ESTIMATION UNCERTAINTY In the application of the Bank’s accounting policies, management is required to make judgments, estimates and assumptions about the carrying amounts of assets and liabilities that are not readily apparent from other sources. The estimates and associated assumptions are based on historical experience and other factors that are considered to be relevant. Actual results may differ from these estimates. The estimates and underlying assumptions are reviewed on an ongoing basis. Revisions to accounting estimates are recognized in the period in which the estimate is revised if the revision affects only that period or in the period of the revision and future periods if the revision affects both current and future periods. a. Estimated impairment of loans and receivables
When there is objective evidence of impairment loss, the Bank takes into consideration the estimation of future cash flows. Impairment loss is measured as the difference between the asset’s carrying amount and the present value of estimated future cash flows (excluding future credit losses that have not been incurred) discounted at the financial asset’s original effective interest rate. If the actual future cash flows are less than expected, a material impairment loss may arise.
b. Recognition and measurement of defined benefit plans
Net defined benefit liabilities (assets) and the resulting defined benefit costs under defined benefit pension plans are calculated using the projected unit credit method. Actuarial assumptions comprise the discount rate, rate of employee turnover, and future salary increase, etc. Changes in economic circumstances and market conditions will affect these assumptions and may have a material impact on the amount of the expense and the liability.
6. CASH AND CASH EQUIVALENTS December 31 2017 2016 Cash on hand $ 5,775,427 $ 5,817,939 Checks for clearing 4,042,078 3,563,014 Due from banks 938,546 593,737 $ 10,756,051 $ 9,974,690
7. DUE FROM THE CENTRAL BANK AND OTHER BANKS
December 31 2017 2016 Deposit reserve - checking account $ 7,342,004 $ 3,985,664 Required deposit reserve 11,439,250 11,164,239 Deposit reserve - foreign-currency deposits 74,620 64,558 Call loans to banks 325,111 - Deposit account in Central Bank - 39,200,000 $ 19,180,985 $ 54,414,461

- 38 -
Under a directive issued by the Central Bank of the ROC, the Bank determines monthly the New Taiwan dollar (NTD)-denominated deposit reserves at prescribed rates based on the average balances of customers’ NTD-denominated deposits, which are subject to withdrawal restrictions. In addition, the foreign-currency deposit reserves are determined at rates prescribed for balances of foreign-currency deposits. These reserves may be withdrawn anytime and are noninterest earning.
8. FINANCIAL INSTRUMENTS AT FAIR VALUE THROUGH PROFIT OR LOSS December 31 2017 2016 Financial assets held for trading Commercial paper $ 10,389,618 $ 8,300,747 Government bonds - 151,223 Domestic quoted stocks 42,757 68,371 Mutual funds 883,014 5,662 11,315,389 8,526,003 Derivative instrument
Forward exchange contracts 311,723 418,515 Currency swap contracts 177,358 15,982 Option contracts 48,253 8,145
537,334 442,642 11,852,723 8,968,645 Financial assets designated as at fair value through profit or loss Principal guaranteed notes - 322,968 $ 11,852,723 $ 9,291,613 Financial liabilities held for trading Derivative instrument
Forward exchange contracts $ 14,246 $ 23,924 Option contracts 48,259 8,135 Currency swap contracts 121,106 6,371 $ 183,611 $ 38,430
The Bank engaged in derivative transactions mainly to accommodate customers’ needs and manage its exposure positions. The financial risk management objective of the Bank was to minimize risks due to changes in fair value or cash flows. The contract amounts (notional amounts) of the derivative transactions for accommodating customers’ needs and managing its exposure positions as of December 31, 2017 and 2016 were as follows: December 31 2017 2016 Currency swap contracts $ 6,348,016 $ 3,090,128 Forward exchange contracts 32,026,895 11,612,082 Option contracts
Buy 2,465,312 1,684,467 Sell 2,465,312 1,684,467
- 39 -
As of December 31, 2017 and 2016, financial instruments at fair value through profit and loss in the amount of $8,552,033 thousand and $7,054,785 thousand were under agreement to repurchase agreements.
9. SECURITIES PURCHASED UNDER AGREEMENTS TO RESELL December 31 2017 2016 Commercial paper $ 12,094,964 $ 14,867,255 Government bonds 300,229 940,707 Corporate bonds 15,820,141 12,037,280 $ 28,215,334 $ 27,845,242 Date of the resell agreement 2018.01-2018.02 2017.01-2017.02 Amount of the resell $ 28,226,473 $ 27,852,409 The securities purchased under resell agreements had not been sold under repurchase agreements.
10. RECEIVABLES, NET December 31 2017 2016 Notes and accounts receivable $ 14,725,496 $ 14,391,672 Interest receivable 835,648 832,976 Interbank clearing fund receivable 800,470 800,493 Accounts receivable factoring without recourse 396,449 799,844 Redemption of convertible bond receivable - 513,962 Investment receivable 398,156 438,998 Acceptances receivable 186,974 135,531 Collections receivable 123,276 68,197 Others 349,268 154,934 17,815,737 18,136,607 Less: Allowance for doubtful accounts 188,299 368,246 $ 17,627,438 $ 17,768,361 Please refer to Note 45 for the impairment loss analysis of receivables. The Bank has accrued an allowance for doubtful accounts on receivables. Please refer to Note 12 for the movements of allowance for doubtful accounts.

- 40 -
11. DISCOUNTS AND LOANS, NET December 31 2017 2016 Discounts and overdraft $ 212,176 $ 43,283 Accounts receivable - financing 14,290 29,690 Loans
Short-term - unsecured 61,312,117 48,432,945 - secured 60,714,827 54,147,371 Medium-term - unsecured 18,561,250 15,783,090 - secured 49,686,071 45,771,509 Long-term - unsecured 5,682,256 4,792,014 - secured 125,557,881 118,036,010
Import and export negotiations 37,962 22,985 Overdue loans 247,336 179,120 322,026,166 287,238,017 Less: Allowance for doubtful accounts 3,401,818 3,197,294 $ 318,624,348 $ 284,040,723 As of December 31, 2017 and 2016, the balances of nonaccrual loans were $247,336 thousand and $179,120 thousand, respectively. The unrecognized interest revenues on nonperforming loans were $6,751 thousand in 2017 and $5,241 thousand in 2016. In 2017 and 2016, the Bank wrote off certain credits after completing the required legal procedures. Please refer to Note 45 for impairment loss analysis of discounts and loans. The Bank had set up an allowance for doubtful accounts on discounts and loans. Please refer to Note 12 for the movements in the allowance for doubtful accounts.
12. ALLOWANCE FOR DOUBTFUL ACCOUNTS The movements in the allowance for doubtful accounts and reserve for losses on guarantees liabilities for the years ended December 31, 2017 and 2016 are summarized as follows: Year Ended December 31, 2017
Receivables Discounts and
Loans
Reserve for Losses on
Guarantees Total Balance at January 1, 2017 $ 368,246 $ 3,197,294 $ 134,621 $ 3,700,161 Provision of allowance for doubtful
accounts 208,906 133,955 14,000 356,861 Write-offs (665,750) (296,290) - (962,040) Recovery of written-off credits 299,327 363,071 - 662,398 Reclassification - 9,500 (9,500) - Effects of exchange rate changes (22,430) (5,712) (146) (28,288) Balance at December 31, 2017 $ 188,299 $ 3,401,818 $ 138,975 $ 3,729,092
- 41 -
Year Ended December 31, 2016
Receivables Discounts and
Loans
Reserve for Losses on
Guarantees Total Balance at January 1, 2016 $ 113,358 $ 2,796,860 $ 194,006 $ 3,104,224 Provision (reversal) of allowance
for doubtful accounts 100,436 130,467 (59,361) 171,542 Write-offs (173,535) (74,220) - (247,755) Recovery of written-off credits 327,987 345,452 - 673,439 Effects of exchange rate changes - (1,265) (24) (1,289) Balance at December 31, 2016 $ 368,246 $ 3,197,294 $ 134,621 $ 3,700,161
13. AVAILABLE-FOR-SALE FINANCIAL ASSETS
December 31 2017 2016 Overseas corporate bonds $ 10,105,102 $ 12,979,154 Overseas financial bonds 6,302,487 8,473,037 Domestic corporate bonds 4,150,714 4,424,558 Overseas government bonds 5,966,611 5,377,258 Domestic quoted stocks 3,583,369 3,179,665 Mutual funds 917,253 1,791,542 Overseas quoted stocks 3,206,175 2,375,111 Domestic government bonds 951,695 948,277 $ 35,183,406 $ 39,548,602 The available-for-sale financial assets amounting to $10,837,361 thousand and $14,636,448 thousand as of December 31, 2017 and 2016, respectively, had been sold under repurchase agreements.
14. HELD-TO-MATURITY FINANCIAL ASSETS December 31 2017 2016 Convertible deposits $ 42,300,000 $ - Domestic government bonds 8,660,289 6,864,356 Domestic corporate bonds 300,000 300,000 Asset-based securities 25,668 27,759 $ 51,285,957 $ 7,192,115 The held-to-maturity investments had not been sold under repurchase agreements.

- 42 -
15. INVESTMENTS ACCOUNTED FOR USING THE EQUITY METHOD, NET December 31 2017 2016 Investments in subsidiaries $ 2,928,245 $ 2,857,442 Investments in associates 53,121 53,447 $ 2,981,366 $ 2,910,889 a. Investments in subsidiaries
December 31 2017 2016 Union Finance and Leasing International Corporation (UFLIC) $ 2,664,239 $ 2,604,833 Union Securities Investment Trust Corporation (USITC) 144,248 144,920 Union Finance International (H.K.) Limited 99,514 72,936 Union Information Technology Corporation (UIT) 20,244 34,753 $ 2,928,245 $ 2,857,442 At the end of the reporting period, the proportion of ownership and voting rights in subsidiaries held by the Bank were as follows:
December 31 2017 2016 Union Finance and Leasing International Corporation (UFLIC) 100.00% 100.00% Union Securities Investment Trust Corporation (USITC) 35.00% 35.00% Union Finance International (H.K.) Limited 99.99% 99.99% Union Information Technology Corporation (UIT) 99.99% 99.99% The Bank have the ability to control over finance, operating and personnel policy of USITC and therefore USITC be included in financial statements. The Bank merged with Union Insurance Broker Company (UIB) on August 1, 2016 under the approval of the FSC. The merger should be treated as a reorganization. In addition, the Bank should recognize all the assets and liabilities of UIB at carrying amount and retrospectively restate the Bank’s prior year’s financial statements in the comparative financial statements. The Bank acquired UIB’s assets and liabilities amounting to $49,592 thousand on August 1, 2016.
b. Investment in as associates
December 31 2017 2016 None individually material Union Real-Estate Management Corporation $ 53,121 $ 53,447

- 43 -
The summarized financial information in respect of the Bank’s associates was set below: For the Year Ended December 31 2017 2016 Net loss $ (326) $ (347) The Bank’s share of the associate’s profit and other comprehensive income for 2017 and 2016 was based on the associate’s audited financial statements for the same reporting periods as those of the Bank.
16. OTHER FINANCIAL ASSETS, NET
December 31 2017 2016 Debt instruments with no active markets, net $ 45,734,754 $ 51,433,548 Pledged assets (Note 41) 594,026 4,207,784 Due from banks - certificate of deposit 937,964 464,500 Financial assets carried at cost, net 507,614 507,614 Call loans to securities 298,480 - Non-overdue loans 25,105 3,765 Others 2,798 3,695 $ 48,100,741 $ 56,620,906 a. Debt instruments with no active markets
As of December 31, 2017 and 2016, debt instruments with no active markets and amounting to $15,415,779 thousand and $10,163,828 thousand, respectively, were under repurchase agreements.
b. Financial assets carried at cost, net December 31 2017 2016 Unquoted stocks
I Pass Corporation $ 123,320 $ 123,320 Financial Information Service Company 118,782 118,782 Taiwan Asset Management Corporation 75,000 75,000 Taiwan Future Exchange Corporation 71,250 71,250 Taiwan Financial Asset Service Corporation 50,000 50,000 Other 69,262 69,262
$ 507,614 $ 507,614 Financial assets carried at cost were unlisted common stocks with no quoted market prices in an active market and with fair values that could not be reliably measured. Thus, these assets were measured at cost less accumulated impairment.
c. Due from banks - certificate of deposit The amount of due from banks - time deposits with maturities longer than three months or certificate of deposits that cannot be cancelled or used.

- 44 -
17. PROPERTY AND EQUIPMENT, NET
Land Buildings
Machinery and Computer Equipment
Transportation Equipment
Lease Improvements
Prepayments for Equipment Total
Cost Balance at January 1, 2016 $ 3,421,707 $ 5,087,227 $ 1,404,868 $ 274,070 $ 193,648 $ 44,395 $ 10,425,915 Additions 423,916 30,931 124,197 12,349 46,389 84,162 721,944 Disposals - - (176,847 ) (1,728 ) (672 ) - (179,247 ) Reclassification - 20,900 6,951 1,394 8,404 (84,764 ) (47,115 ) Balance at December 31,
2016 3,845,623 5,139,058 1,359,169 286,085 247,769 43,793 10,921,497 Accumulated depreciation Balance at January 1, 2016 - 1,288,319 1,119,885 240,864 63,121 - 2,712,189 Depreciation - 120,473 77,594 9,700 40,443 - 248,210 Disposals - - (172,920 ) (1,684 ) (672 ) - (175,276 ) Balance at December 31,
2016 - 1,408,792 1,024,559 248,880 102,892 - 2,785,123 Balance at December 31,
2016, net $ 3,845,623 $ 3,730,266 $ 334,610 $ 37,205 $ 144,877 $ 43,793 $ 8,136,374 Cost Balance at January 1, 2017 $ 3,845,623 $ 5,139,058 $ 1,359,169 $ 286,085 $ 247,769 $ 43,793 $ 10,921,497 Additions - 10,869 79,654 11,994 42,302 47,050 191,869 Disposals - (66 ) (128,799 ) (5,737 ) (856 ) - (135,458 ) Reclassification - 4,847 6,475 4,821 24,855 (37,193 ) 3,805 Balance at December 31,
2017 3,845,623 5,154,708 1,316,499 297,163 314,070 53,650 10,981,713 Accumulated depreciation Balance at January 1, 2017 - 1,408,792 1,024,559 248,880 102,892 - 2,785,123 Depreciation - 123,754 92,699 10,404 39,058 - 265,915 Disposals - (18 ) (124,960 ) (5,273 ) (689 ) - (130,940 ) Balance at December 31,
2017 - 1,532,528 992,298 254,011 141,261 - 2,920,098 Balance at December 31,
2017, net $ 3,845,623 $ 3,622,180 $ 324,201 $ 43,152 $ 172,809 $ 53,650 $ 8,061,615
The above items of property and equipment are depreciated on a straight-line basis over the useful lives of the assets, estimated as follows: Buildings
Main buildings 50-55 years Equipment installed in buildings 5 years
Machinery and computer equipment 3-5 years Transportation equipment 3-5 years Lease improvements 5 years In August 2016, the Bank acquired a piece of land in Tucheng Dist. from New Taipei City through the public auction in order to construct business operation office for $423,916 thousand. The Bank completed the payment and obtained the ownership of the land in October 2016. On November 9, 2016, the board of directors of the Bank and UFLIC, the property developer, resolved respectively to enter into a cooperation contract with each other to cooperatively construct a building. Upon completion of the building, the ownership thereof will be attributed to the Bank and UFLIC. Per contract, the Bank will provide its land (estimated cost amounting to $439,626 thousand) in Tucheng District, New Taipei City for constructing the building, and UFLIC will render funds and donate a piece of land originally reserved for the public facilities to the government in exchange for transfer development rights (TDR) to increase the building area. The funds and the TDR in the aggregate amount to $447,614 thousand. The building area increased due to the exercise of the TDR belongs to UFLIC.

- 45 -
18. GOODWILL The Bank acquired Chung Shing Bank (Chung Shing) on March 19, 2005 and recognized goodwill amounting to $3,309,000 thousand. The goodwill amortization period was five years, and the amortization expense in 2005 was $551,500 thousand. However, the amortization of goodwill became no longer required from January 1, 2006. The Bank merged with Union Bills Finance Corporation on August 16, 2010, with the Bank as the survivor entity, and recognized goodwill amounting to $130,498 thousand. For the impairment test on Chung Shing, the Bank treated individual business units as cash-generating units (CGUs). Goodwill resulting from the merger was allocated to the relevant CGUs. The recoverable amount was determined by the value in use of each CGU and was calculated at the present values of the cash flow forecast for the next five years based on the going-concern assumption. Future cash flows were estimated on the basis of Chung Shing’s present operations and will be adjusted depending on the business outlook and economic trends. As of December 31, 2017 and 2016, the balances of accumulated impairment both were $902,691 thousand.
19. OTHER ASSETS, NET December 31 2017 2016 Refundable deposits $ 1,702,663 $ 1,767,712 Prepaid expenses 399,484 462,906 Others 166 156 $ 2,102,313 $ 2,230,774
20. DUE TO THE CENTRAL BANK AND OTHER BANKS December 31 2017 2016 Due to Chunghwa Post Co., Ltd. $ 1,233,370 $ 1,339,430 Call loans from banks 7,500,000 5,565,207 Due to the Central Bank and other banks 87,635 51,577 Overdraft 140,285 61,415 $ 8,961,290 $ 7,017,629
21. SECURITIES SOLD UNDER AGREEMENTS TO REPURCHASE December 31 2017 2016 Commercial paper $ 8,557,700 $ 6,908,529 Asset-based securities 12,042,309 8,166,461 Corporate bonds 6,110,732 7,514,752
(Continued)
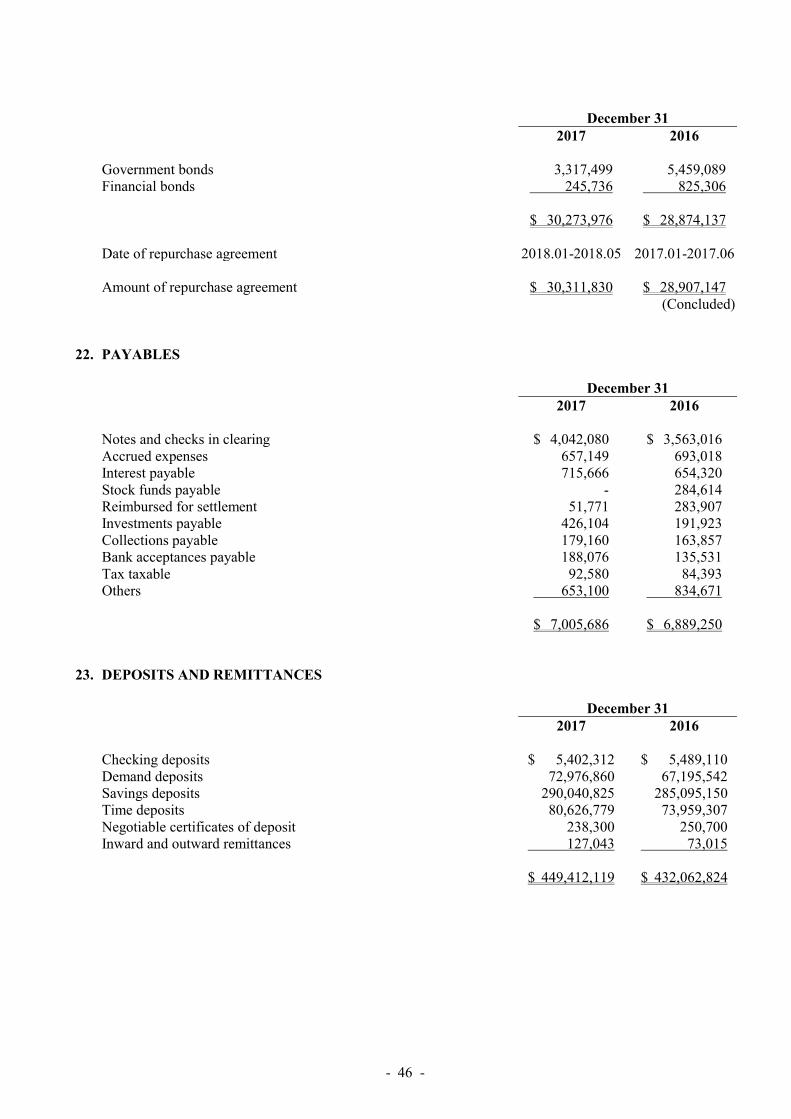
- 46 -
December 31 2017 2016 Government bonds 3,317,499 5,459,089 Financial bonds 245,736 825,306 $ 30,273,976 $ 28,874,137 Date of repurchase agreement 2018.01-2018.05 2017.01-2017.06 Amount of repurchase agreement $ 30,311,830 $ 28,907,147
(Concluded)
22. PAYABLES December 31 2017 2016 Notes and checks in clearing $ 4,042,080 $ 3,563,016 Accrued expenses 657,149 693,018 Interest payable 715,666 654,320 Stock funds payable - 284,614 Reimbursed for settlement 51,771 283,907 Investments payable 426,104 191,923 Collections payable 179,160 163,857 Bank acceptances payable 188,076 135,531 Tax taxable 92,580 84,393 Others 653,100 834,671 $ 7,005,686 $ 6,889,250
23. DEPOSITS AND REMITTANCES
December 31 2017 2016 Checking deposits $ 5,402,312 $ 5,489,110 Demand deposits 72,976,860 67,195,542 Savings deposits 290,040,825 285,095,150 Time deposits 80,626,779 73,959,307 Negotiable certificates of deposit 238,300 250,700 Inward and outward remittances 127,043 73,015 $ 449,412,119 $ 432,062,824

- 47 -
24. BANK DEBENTURES December 31 2017 2016 First issue of subordinated bank debentures in 2009; fixed rate at
2.95%; maturity: June 2016 $ $ - First issue of subordinated bank debentures in 2011; fixed rate at
2.78%; maturity: June 2018 2,000,000 2,000,000 First issue of subordinated bank debentures in 2012; fixed rate at
2.32%; maturity: March 2019 1,500,000 1,500,000 First issue of subordinated bank debentures in 2013; fixed rate at
2.10%; maturity: December 2020 3,000,000 3,000,000 First issue of subordinated bank debentures in 2015; fixed rate at
2.08%; maturity: April 2022 2,200,000 2,200,000 First issue of subordinated bank debentures in 2016; no maturity date
and non-cumulative; redeemable at face value plus interest accrued under the approval of the authorities when the issue term is over 5.1 years; fixed rate at 4.20% 2,500,000 2,500,000
First issue of subordinated bank debentures in 2017; no maturity date and non-cumulative; redeemable at face value plus interest accrued under the approval of the authorities when the issue term is over 5.1 years; fixed rate at 4.20% 500,000 -
$ 11,700,000 $ 11,200,000
25. OTHER FINANCIAL LIABILITIES
December 31 2017 2016 Principals of structured products $ 20,358 $ 14,953 Funds obtained from the government - intended for specific types of
loans 1,362 4,613 $ 21,720 $ 19,566
26. PROVISIONS December 31 2017 2016 Provisions for employee benefits $ 5,606 $ 15,654 Reserve for losses on guarantees (Note 12) 138,975 134,621 Others 27,178 26,279 $ 171,759 $ 176,554

- 48 -
27. RETIREMENT BENEFIT PLANS
a. Defined contribution plans
The Bank adopted a pension plan under the Labor Pension Act (LPA), a state-managed defined contribution plan. Under LPA, the Bank makes monthly contributions to employees’ individual pension accounts at 6% of monthly salaries and wages.
b. Defined benefit plans The Bank adopted the defined benefit plan under the Labor Standards Law, pension benefits are calculated on the basis of the length of service and average monthly salaries of the six months before retirement. The Bank contributes amounts equal to 2% of total monthly salaries and wages to a pension fund administered by the pension fund monitoring committee. Pension contributions are deposited in the Bank of Taiwan and in the Bank’s Business Department in the committee’s name. The fund is deposited in the Bank of Taiwan under management of Bureau of Labor Funds, Ministry of Labor. The Bank has no right to influence the investment policy and strategy. Before the end of each year, the Bank assesses the balance in the pension fund. If the amount of the balance in the pension fund is inadequate to pay retirement benefits for employees who conform to retirement requirements in the next year, the Bank is required to fund the difference in one appropriation that should be made before the end of March of the next year. The amounts included in the balance sheets in respect of the Bank’s defined benefit plans were as follows:
December 31 2017 2016 Present value of defined benefit obligation $ (1,536,301) $ (1,544,965) Fair value of plan assets 1,530,695 1,529,311 Deficit (surplus) (5,606) (15,654) Net defined benefit liability $ (5,606) $ (15,654) Movements in net defined benefit liability were as follows:
Present Value of the Defined
Benefit Obligation
Fair Value of the Plan Assets Total
Balance at January 1, 2016 $ (1,514,365) $ 708,495 $ (805,870) Service cost
Current service cost (17,840) - (17,840) Net interest expense (income) (22,715) 10,850 (11,865)
Recognized in profit or loss (40,555) 10,850 (29,705) (Continued)

- 49 -
Present Value of the Defined
Benefit Obligation
Fair Value of the Plan Assets Total
Remeasurement
Return on plan assets (excluding amounts included in net interest) $ - $ (3,673) $ (3,673)
Actuarial loss - changes in financial assumptions (21,652) - (21,652)
Actuarial gain - experience adjustments 9,102 - 9,102 Recognized in other comprehensive income (12,550) (3,673) (16,223) Contributions from the employer - 836,144 836,144 Benefits paid 22,505 (22,505) - Balance at December 31, 2016 $ (1,544,965) $ 1,529,311 $ (15,654) Balance at January 1, 2017 $ (1,544,965) $ 1,529,311 $ (15,654) Service cost
Current service cost (16,436) - (16,436) Net interest expense (income) (21,243) 21,028 (215)
Recognized in profit or loss (37,679) 21,028 (16,651) Remeasurement
Return on plan assets (excluding amounts included in net interest) - 9,799 9,799
Actuarial loss - changes in financial assumptions (26,491) - (26,491)
Actuarial gain - experience adjustments 26,494 - 26,494 Recognized in other comprehensive income 3 9,799 9,802 Contributions from the employer - 16,897 16,897 Benefits paid 46,340 (46,340) - Balance at December 31, 2017 $ (1,536,301) $ 1,530,695 $ (5,606)
(Concluded) Through the defined benefit plans under the Labor Standards Law, the Bank is exposed to the following risks: 1) Investment risk: The plan assets are invested in domestic/and foreign/equity and debt securities,
bank deposits, etc. The investment is conducted at the discretion of the Bureau of Labor Funds, Ministry of Labor or under the mandated management. However, in accordance with relevant regulations, the return generated by plan assets should not be below the interest rate for a 2-year time deposit with local banks.
2) Interest risk: A decrease in the interest rate will increase the present value of the defined benefit
obligation; however, this will be partially offset by an increase in the return on the plan’s debt investments.
3) Salary risk: The present value of the defined benefit obligation is calculated by reference to the
future salaries of plan participants. As such, an increase in the salary of the plan participants will increase the present value of the defined benefit obligation.
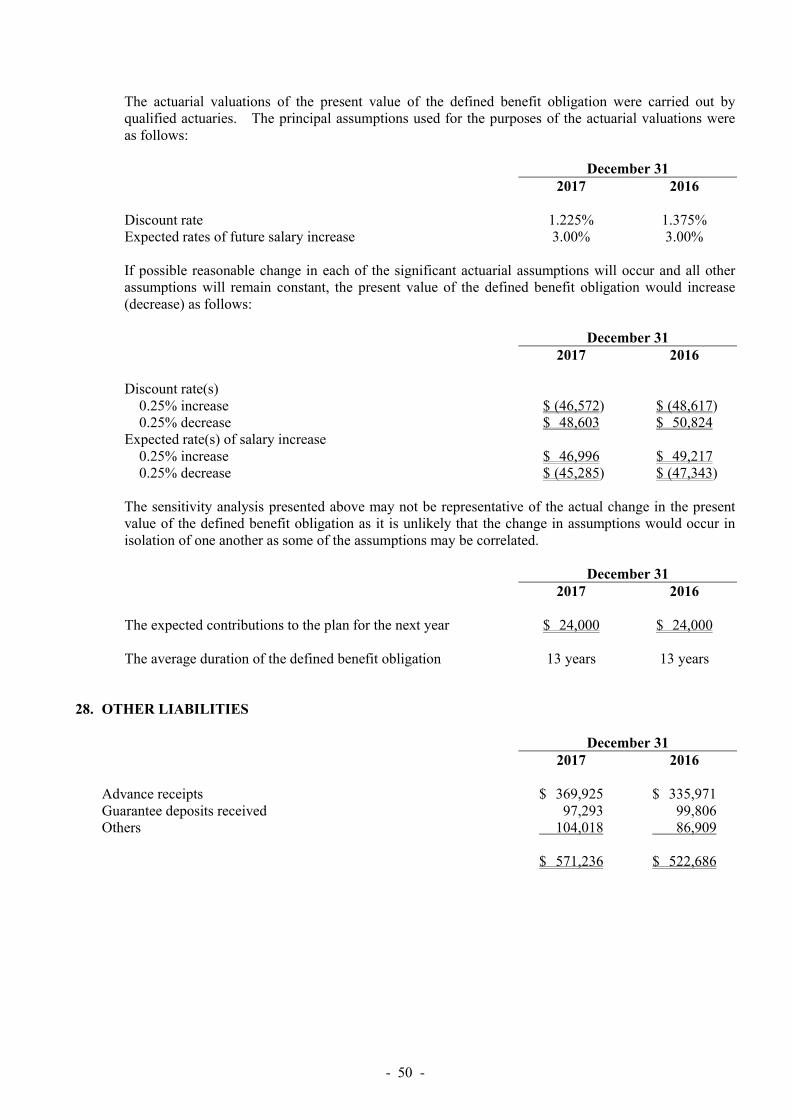
- 50 -
The actuarial valuations of the present value of the defined benefit obligation were carried out by qualified actuaries. The principal assumptions used for the purposes of the actuarial valuations were as follows:
December 31 2017 2016 Discount rate 1.225% 1.375% Expected rates of future salary increase 3.00% 3.00% If possible reasonable change in each of the significant actuarial assumptions will occur and all other assumptions will remain constant, the present value of the defined benefit obligation would increase (decrease) as follows:
December 31 2017 2016 Discount rate(s)
0.25% increase $ (46,572) $ (48,617) 0.25% decrease $ 48,603 $ 50,824
Expected rate(s) of salary increase 0.25% increase $ 46,996 $ 49,217 0.25% decrease $ (45,285) $ (47,343)
The sensitivity analysis presented above may not be representative of the actual change in the present value of the defined benefit obligation as it is unlikely that the change in assumptions would occur in isolation of one another as some of the assumptions may be correlated.
December 31 2017 2016 The expected contributions to the plan for the next year $ 24,000 $ 24,000 The average duration of the defined benefit obligation 13 years 13 years
28. OTHER LIABILITIES December 31 2017 2016 Advance receipts $ 369,925 $ 335,971 Guarantee deposits received 97,293 99,806 Others 104,018 86,909 $ 571,236 $ 522,686

- 51 -
29. EQUITY a. Capital stock
Common stock
December 31 2017 2016 Number of shares authorized (in thousands) 4,500,000 3,000,000 Amount of shares authorized $ 45,000,000 $ 30,000,000 Number of shares issued and fully paid (in thousands) 2,605,152 2,605,152 Amount of shares issued $ 26,051,524 $ 26,051,524 Fully paid common shares, which have a par value of NT$10, carry one vote per share and carry a right to dividends. Preferred stock Due to the capital needs of the Bank for future long-term business development and operational scale expansion, the Bank’s shareholders approved and authorized the board of directors to issue ordinary shares or special shares for domestic cash capital increase (one or both, as appropriate) in accordance with the provisions of the Articles of Incorporation or the relevant laws and regulations, in order to raise the long-term funds. The total funds to be raised through issuing new shares as authorized this time shall not be more than NT$10 billion (inclusive) as the principle. The number of shares for issue shall not be more than 800,000,000 shares (inclusive) as the principle. On June 28, 2017, the Banks’s board of directors resolved to issue preferred stock - A totaling 200,000 thousand shares, with a par value of NT$10, at NT$50 per share in the total amount of NT$10,000,000 thousand on December 28, 2017. The issuance of shares has been approved by the FSC under Order No. 1060033586 issued on September 1, 2017. On October 24, 2017, the capital from issue of preferred stock - A amounted to NT$10,000,000 thousand. The preferred stock - A was listed on Taiwan Stock Exchange on December 1, 2017. The rights and other important conditions of issuance of the preferred stock - A are as follows:
1) Tenor: Perpetual. 2) Dividend Yield: An annual dividend yield is set at 4.8% (5-year IRS 0.89125%+3.90875%) per
annum of the issue price at the pricing day. The 5-year IRS will be reset on the next business day after each 5.5 anniversary day after issuance thereafter. The pricing date for reset is the second business day of financial industry in Taipei immediately preceding each reset date. The 5-year IRS rate is the arithmetic mean of 5-year IRS rates appearing on Reuters pages “PYTWDFIX” and “COSMOS3” at 11:00 a.m. (Taipei time) on the relevant pricing date for reset. If such rate cannot be obtained, the Bank will determine the rate based on reasonable market price with good faith.
3) Dividend Payment: Whereas the Company makes profit in a fiscal year, the profit shall be first
utilized for paying taxes, offset losses of previous years, and from the remaining profit set aside amount as legal reserve, and set aside or reverse special reserve in accordance with the laws and regulations, and distribute dividends to the preferred shareholders. The Bank has the sole discretion on the distribution of dividends of preferred stocks - A, which includes but not limited to the Bank’s discretion to resolve not to distribute dividends to the preferred shareholders if there is no surplus, or if earnings in the fiscal year are insufficient to fully pay off dividends to the shareholders of the preferred stocks, or if the distribution of dividends of preferred stocks may cause Total Capital Adequacy Ratio to be less than the authority’s minimum requirement, or if the Bank has other essential considerations. If the Bank resolves not to distribute dividends to the
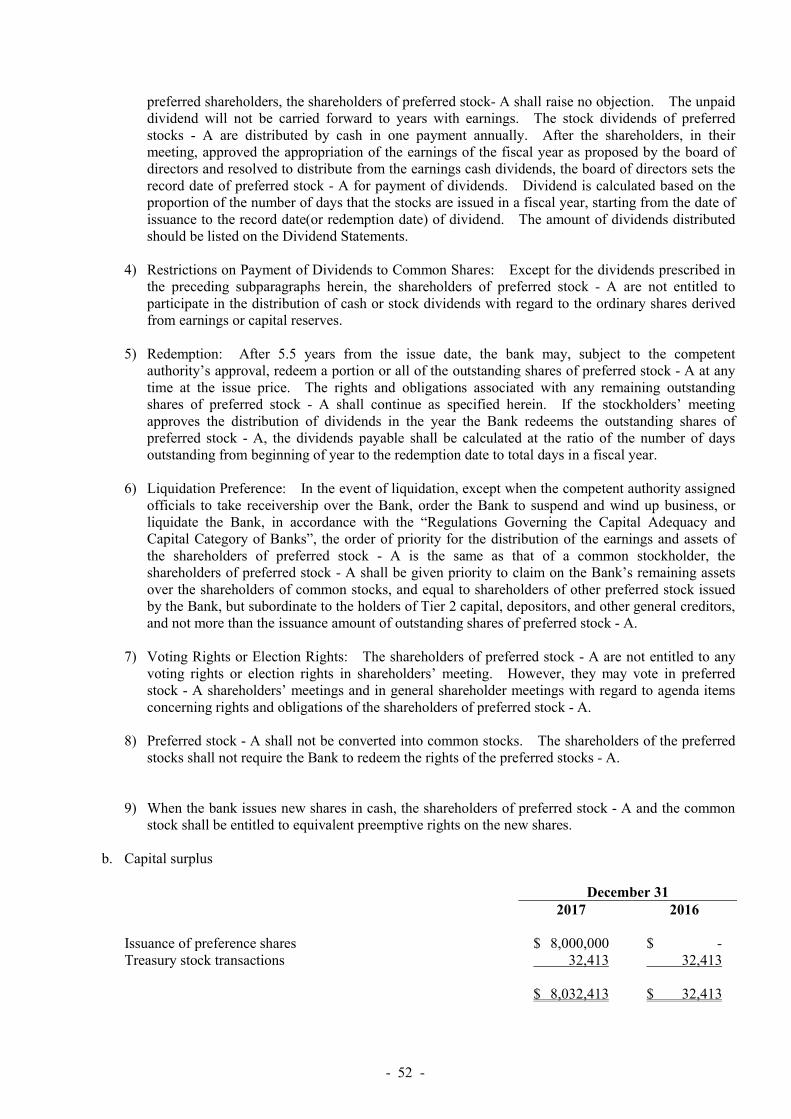
- 52 -
preferred shareholders, the shareholders of preferred stock- A shall raise no objection. The unpaid dividend will not be carried forward to years with earnings. The stock dividends of preferred stocks - A are distributed by cash in one payment annually. After the shareholders, in their meeting, approved the appropriation of the earnings of the fiscal year as proposed by the board of directors and resolved to distribute from the earnings cash dividends, the board of directors sets the record date of preferred stock - A for payment of dividends. Dividend is calculated based on the proportion of the number of days that the stocks are issued in a fiscal year, starting from the date of issuance to the record date(or redemption date) of dividend. The amount of dividends distributed should be listed on the Dividend Statements.
4) Restrictions on Payment of Dividends to Common Shares: Except for the dividends prescribed in
the preceding subparagraphs herein, the shareholders of preferred stock - A are not entitled to participate in the distribution of cash or stock dividends with regard to the ordinary shares derived from earnings or capital reserves.
5) Redemption: After 5.5 years from the issue date, the bank may, subject to the competent
authority’s approval, redeem a portion or all of the outstanding shares of preferred stock - A at any time at the issue price. The rights and obligations associated with any remaining outstanding shares of preferred stock - A shall continue as specified herein. If the stockholders’ meeting approves the distribution of dividends in the year the Bank redeems the outstanding shares of preferred stock - A, the dividends payable shall be calculated at the ratio of the number of days outstanding from beginning of year to the redemption date to total days in a fiscal year.
6) Liquidation Preference: In the event of liquidation, except when the competent authority assigned
officials to take receivership over the Bank, order the Bank to suspend and wind up business, or liquidate the Bank, in accordance with the “Regulations Governing the Capital Adequacy and Capital Category of Banks”, the order of priority for the distribution of the earnings and assets of the shareholders of preferred stock - A is the same as that of a common stockholder, the shareholders of preferred stock - A shall be given priority to claim on the Bank’s remaining assets over the shareholders of common stocks, and equal to shareholders of other preferred stock issued by the Bank, but subordinate to the holders of Tier 2 capital, depositors, and other general creditors, and not more than the issuance amount of outstanding shares of preferred stock - A.
7) Voting Rights or Election Rights: The shareholders of preferred stock - A are not entitled to any
voting rights or election rights in shareholders’ meeting. However, they may vote in preferred stock - A shareholders’ meetings and in general shareholder meetings with regard to agenda items concerning rights and obligations of the shareholders of preferred stock - A.
8) Preferred stock - A shall not be converted into common stocks. The shareholders of the preferred
stocks shall not require the Bank to redeem the rights of the preferred stocks - A. 9) When the bank issues new shares in cash, the shareholders of preferred stock - A and the common
stock shall be entitled to equivalent preemptive rights on the new shares.
b. Capital surplus
December 31 2017 2016 Issuance of preference shares $ 8,000,000 $ - Treasury stock transactions 32,413 32,413 $ 8,032,413 $ 32,413

- 53 -
The capital surplus from shares issued in excess of par (additional paid-in capital from issuance of common shares, preference shares and treasury stock transactions) and donations may be used to offset a deficit; in addition, when the Bank has no deficit, this capital surplus may be distributed in cash or mar be capitalized within a certain percentage of the Bank’s paid-in capital once a year. The capital surplus from long-term investments, employee stock options and conversion options may not be used for any purpose.
c. Legal reserve Legal reserve should be appropriated until it equals the Bank’s paid-in-capital. Legal reserve may be used to offset deficit. If the Bank has no deficit and the legal reserve has exceeded 25% of its paid-in capital, the excess may be transferred to capital or distributed in cash. In addition, based on the Banking Act, if the legal reserve is less than the Bank’s paid-in capital, the amount that may be distributed in cash should not exceed 15% of the Bank’s paid-in-capital.
d. Special reserve
Items referred to under Rule No. 1010012865, Rule No. 1030006415 issued by the FSC and the directive titled “Questions and Answers for Special Reserves Appropriated Following Adoption of IFRSs” should be appropriated to or reversed from a special reserve by the Bank. If a special reserve appropriated on the first-time adoption of IFRSs relates to investment properties other than land, the special reserve may be reversed continuously over the period of use. The special reserve relating to land may be reversed on the disposal or reclassification of the related assets. The above special reserve may be used to offset a deficit; if the reserve has reached at least 50% of the paid-in capital, half of this special reserve may be capitalized. According to Order No. 10510001510 issued by the FSC, a special reserve should be appropriated between 0.5% and 1% of net income after tax when banks appropriate earnings of 2016 through 2018. Since 2017, the Bank is allowed to reverse the special reserve at the amount of the costs of employee transfer and arrangement in connection with the development of financial technology. According to Order No. 1010012865 and No. 10510001510 issued by FSC that should appropriate special reserves. December 31 2017 2016 Balance at January 1, 2017 $ 558,842 $ 558,842 Special reserves appropriated 26,364 - Balance at December 31, 2017 $ 585,206 $ 558,842
e. Retained earnings and dividend policy
In accordance with the amendments to the Company Act in May 2015, the recipients of dividends and bonuses are limited to stockholders and do not include employees. The stockholders held their regular meeting on June 8, 2016 and, in that meeting, had resolved amendments to the Bank’s Articles of Incorporation (the Articles), particularly the amendment to the policy on dividend distribution and the addition of the policy on distribution of employees’ compensation. For the policies on distribution of employees’ compensation and remuneration of directors and supervisors before and after amendment, please refer to Employee benefits expense in Note 35.

- 54 -
The Bank’s Articles of Incorporation provide that annual net income less any prior years’ deficit should be appropriated in the following order: 1) 30% as legal reserve; 2) Special reserve, as deemed proper; 3) Remainder plus prior year’s unappropriated earnings: Dividends; These appropriations should be approved by the stockholders in, and given effect to in the financial statements of, the year following the year of earnings generation. The board of directors decides the appropriation and distribution of cash and stock dividends, taking into account the Bank’s overall financial and economic condition, future profitability and capital expenditure requirements. In principle, when the Bank of International Settlement ratio is lower than the ratio approved by the authorities plus 1%, primarily stock dividends will be declared. If the legal reserve has not reached the Bank’s paid-in capital, cash dividends are limited to 15% of the Bank’s paid-in capital. The plan on employees’ bonus and remuneration to directors and supervisors is proposed by the board of directors. Except for non-ROC resident stockholders, all stockholders receiving the dividends are allowed a tax credit equal to their proportionate share of the income tax paid by the Bank. The appropriations from the earnings of 2016 and 2015 were approved in stockholders’ meetings on June 20, 2017 and June 8, 2016, respectively. The appropriations and dividends per share were as follows: Appropriation of Earnings Dividends Per Share (NT$) 2016 2015 2016 2015 Legal reserve $ 790,913 $ 923,460 Special reserve 26,364 - Cash dividends on ordinary shares 1,172,319 1,042,061 $ 0.45 $ 0.40 The appropriations from the 2017 earnings were proposed by the board of directors on March 14, 2018. The appropriations, including the dividends per share, were as follows:
Appropriation
of Earnings Dividends Per Share (NT$)
Legal reserve $ 823,496 Special reserve 27,450 Cash dividends on ordinary shares 1,042,061 $0.40 Stock dividends on ordinary shares 781,546 0.30 Cash dividends on preference shares 90,740 0.45369863 (Note) Note: 69 days of outstanding in 2017 and 4.8% dividend yield. About the appropriation of earnings of 2017 will be approved in stockholders’ meetings in June 2018.

- 55 -
f. Other equity items 1) Exchange differences on translating foreign operations
For the Year Ended December 31 2017 2016 Balance at January 1 $ (80,177) $ 416,049 Exchange differences arising on translating the foreign
operations (814,626) (539,546) Income tax on related from translating the net assets of
foreign operations 192,461 58,664 Share of exchange difference of subsidiaries accounted for
using the equity method (63,102) (15,344) Balance at December 31 $ (765,444) $ (80,177)
2) Unrealized gain (loss) on available-for-sale financial assets
For the Year Ended December 31 2017 2016 Balance at January 1 $ 1,272,308 $ 1,302,228 Unrealized gain from the revaluation of available-for-sale
financial assets 1,840,269 238,392 Income tax on unrealized gain from the revaluation of
available-for-sale financial assets (141,281) 9,950 Cumulative gain reclassified to profit or loss on sale of
available-for-sale financial assets (612,099) (299,132) Share of exchange difference of subsidiaries accounted for
using the equity method (13,496) 20,870 Balance at December 31 $ 2,345,701 $ 1,272,308
30. NET INTEREST For the Year Ended December 31 2017 2016 Interest revenue Discounts and loans $ 6,342,642 $ 6,189,110 Debt instruments with no active market 1,722,890 1,715,733 Credit card 726,838 706,213 Due from the Central Bank and call loans to other banks 329,176 392,886 Available-for-sale financial assets 953,877 845,680 Securities purchased under resell agreements 115,813 119,833 Held-to-maturity financial assets 84,481 63,214 Others 23,187 19,225 10,298,904 10,051,894
(Continued)

- 56 -
For the Year Ended December 31 2017 2016 Interest expense Deposits $ 2,922,401 $ 3,113,462 Securities sold under repurchase agreements 331,824 214,377 Bank debentures 322,024 291,833 Due to Chunghwa Post Co., Ltd. 12,115 14,366 Others 25,346 18,978 3,613,710 3,653,016 $ 6,685,194 $ 6,398,878
(Concluded) 31. COMMISSION AND FEE REVENUES, NET
For the Year Ended December 31 2017 2016 Commission and fee revenues
Insurance commission $ 820,626 $ 1,220,848 Credit cards and cash cards 1,084,776 1,029,415 Trust business 382,052 255,903 Loan business 235,023 207,199 Interbank service fee 162,258 143,489 Underwriting business 65,963 105,940 Guarantee business 85,012 82,908 Others 236,348 217,014
3,072,058 3,262,716 Commission and fee expense
Credit card 590,427 663,369 Verification of credit 33,462 30,588 Interbank service fee 22,653 17,687 Acquiring liquidation deal 14,259 14,340 Agency fee 13,934 13,748 Others 73,707 68,533
748,442 808,265 $ 2,323,616 $ 2,454,451
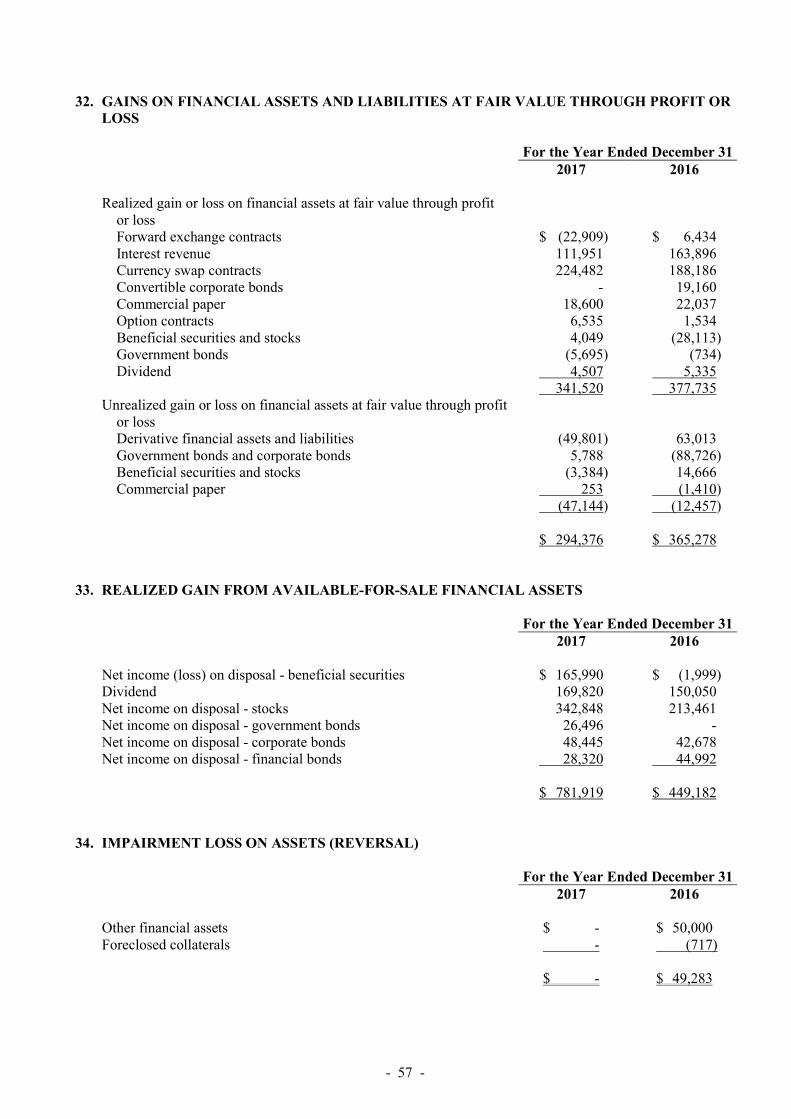
- 57 -
32. GAINS ON FINANCIAL ASSETS AND LIABILITIES AT FAIR VALUE THROUGH PROFIT OR LOSS For the Year Ended December 31 2017 2016 Realized gain or loss on financial assets at fair value through profit
or loss Forward exchange contracts $ (22,909) $ 6,434 Interest revenue 111,951 163,896 Currency swap contracts 224,482 188,186 Convertible corporate bonds - 19,160 Commercial paper 18,600 22,037 Option contracts 6,535 1,534 Beneficial securities and stocks 4,049 (28,113) Government bonds (5,695) (734) Dividend 4,507 5,335
341,520 377,735 Unrealized gain or loss on financial assets at fair value through profit
or loss Derivative financial assets and liabilities (49,801) 63,013 Government bonds and corporate bonds 5,788 (88,726) Beneficial securities and stocks (3,384) 14,666 Commercial paper 253 (1,410) (47,144) (12,457) $ 294,376 $ 365,278
33. REALIZED GAIN FROM AVAILABLE-FOR-SALE FINANCIAL ASSETS
For the Year Ended December 31 2017 2016 Net income (loss) on disposal - beneficial securities $ 165,990 $ (1,999) Dividend 169,820 150,050 Net income on disposal - stocks 342,848 213,461 Net income on disposal - government bonds 26,496 - Net income on disposal - corporate bonds 48,445 42,678 Net income on disposal - financial bonds 28,320 44,992 $ 781,919 $ 449,182
34. IMPAIRMENT LOSS ON ASSETS (REVERSAL)
For the Year Ended December 31 2017 2016 Other financial assets $ - $ 50,000 Foreclosed collaterals - (717) $ - $ 49,283

- 58 -
35. EMPLOYEE BENEFIT EXPENSES For the Year Ended December 31 2017 2016 Salaries and wages $ 1,994,645 $ 1,959,049 Bonus 679,296 734,364 Pension
Defined contribution plans 117,785 116,886 Defined benefit plans 16,651 29,705
Labor insurance and national health insurance 250,389 243,088 Others 72,143 54,283 $ 3,130,909 $ 3,137,375 In compliance with the Company Act as amended in May 2015 and the amended Articles of Incorporation of the Bank approved by the stockholders in their meeting on June 8, 2016, the Bank accrued employees’ compensation and remuneration of directors at the rates of between 1% to 5% and no higher than 0.1%, respectively, of net profit before income tax, employees’ compensation, and remuneration of directors. The employees’ compensation and remuneration of directors for the years ended December 31, 2017 and 2016 which have been approved by the Bank’s board of directors on March 14, 2018 and March 22, 2017, respectively, were as follows: Accrual Rate For the Year Ended December 31 2017 2016 Employees’ compensation 1.84% 1.84% Remuneration of directors 0.09% 0.09% Amount For the Year Ended December 31 2017 2016 Cash Share Cash Share Employees’ compensation $ 62,164 $ - $ 60,602 $ - Remuneration of directors and
supervisors 3,041 - 2,964 - If there is a change in the amounts after the annual financial statements were authorized for issue, the differences are recorded as a change in the accounting estimate. There was no difference between the actual amounts of employees’ compensation and remuneration of directors and paid and the amounts recognized in the financial statements in 2017 and 2016. Information on the employees’ compensation and remuneration of directors resolved by the Bank’s board of directors in 2018 and 2017 is available at the Market Observation Post System website of the Taiwan Stock Exchange.
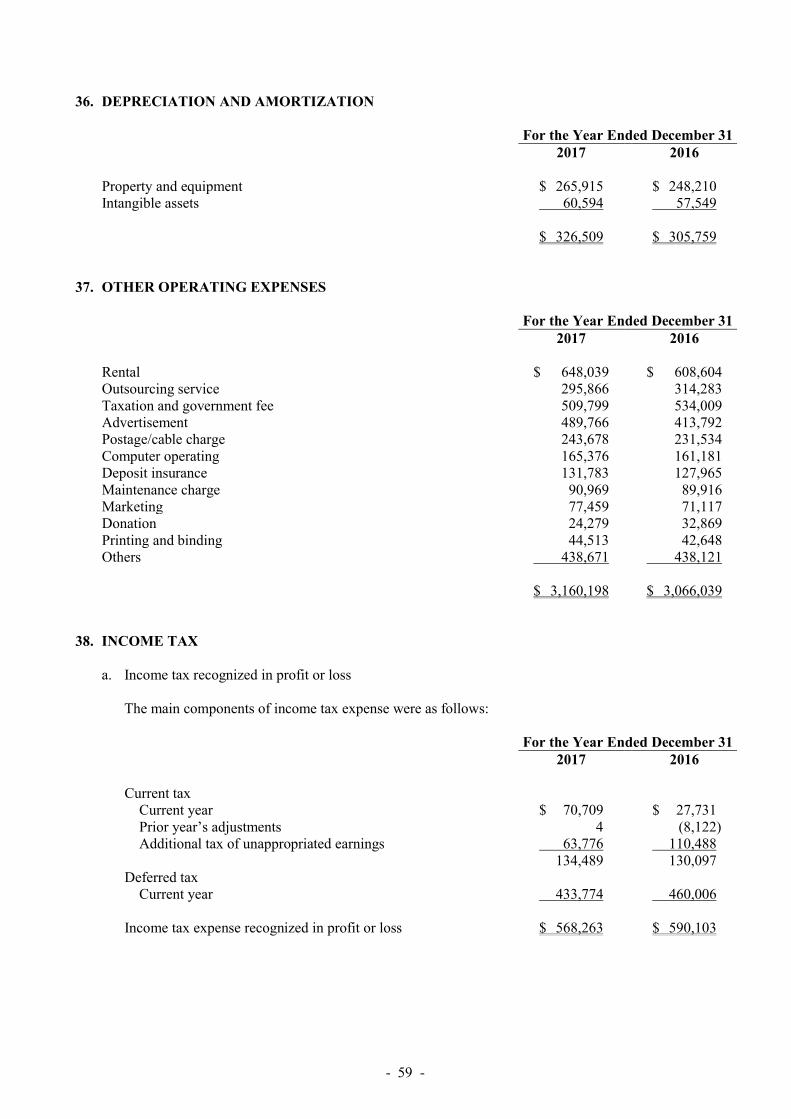
- 59 -
36. DEPRECIATION AND AMORTIZATION For the Year Ended December 31 2017 2016 Property and equipment $ 265,915 $ 248,210 Intangible assets 60,594 57,549 $ 326,509 $ 305,759
37. OTHER OPERATING EXPENSES
For the Year Ended December 31 2017 2016 Rental $ 648,039 $ 608,604 Outsourcing service 295,866 314,283 Taxation and government fee 509,799 534,009 Advertisement 489,766 413,792 Postage/cable charge 243,678 231,534 Computer operating 165,376 161,181 Deposit insurance 131,783 127,965 Maintenance charge 90,969 89,916 Marketing 77,459 71,117 Donation 24,279 32,869 Printing and binding 44,513 42,648 Others 438,671 438,121 $ 3,160,198 $ 3,066,039
38. INCOME TAX
a. Income tax recognized in profit or loss
The main components of income tax expense were as follows: For the Year Ended December 31 2017 2016 Current tax
Current year $ 70,709 $ 27,731 Prior year’s adjustments 4 (8,122) Additional tax of unappropriated earnings 63,776 110,488
134,489 130,097 Deferred tax
Current year 433,774 460,006 Income tax expense recognized in profit or loss $ 568,263 $ 590,103

- 60 -
A reconciliation of accounting profit and current income tax expenses for the years ended December 31, 2017 and 2016 is as follows: For the Year Ended December 31 2017 2016 Income before tax $ 3,313,250 $ 3,226,478 Income tax expense at the 17% statutory rate $ 563,252 $ 548,501 Nondeductible expenses in determining taxable income 1,021 201 Additional income tax under the Alternative Minimum Tax Act 70,709 21,432 Unrecognized deductible temporary differences 53,657 42,934 Additional tax of unappropriated earnings 63,776 110,488 Tax-exempt income (184,156) (125,331) Adjustments for prior year’s tax 4 (8,122) Income tax expense recognized in profit or loss $ 568,263 $ 590,103 The applicable tax rate used by the Bank was 17%. In February 2018, it was announced by the President that the Income Tax Act in the ROC was amended and, starting from 2018, the corporate income tax rate will be adjusted from 17% to 20%. In addition, the rate of the corporate surtax applicable to 2018 unappropriated earnings will be reduced from 10% to 5%. Deferred tax assets and deferred tax liabilities recognized as at December 31, 2017 are expected to be adjusted and would increase by $179,926 thousand and $160,857 thousand, respectively, in 2018. As the manner of the 2018 appropriation of the 2017 earnings is uncertain, the income tax consequences on the 2017 unappropriated earnings cannot be reliably determined.
b. Income tax recognized in other comprehensive income For the Year Ended December 31 2017 2016 Deferred tax Recognized in other comprehensive income:
Unrealized gains on available-for-sale financial assets $ 141,281 $ (9,950) Exchange differences on the translation of financial statements
of foreign operations (192,461) (58,664) Actuarial gains and losses on defined benefit plans 1,666 (2,758)
Total income tax expenses recognized in other comprehensive
income $ (49,514) $ (71,372)
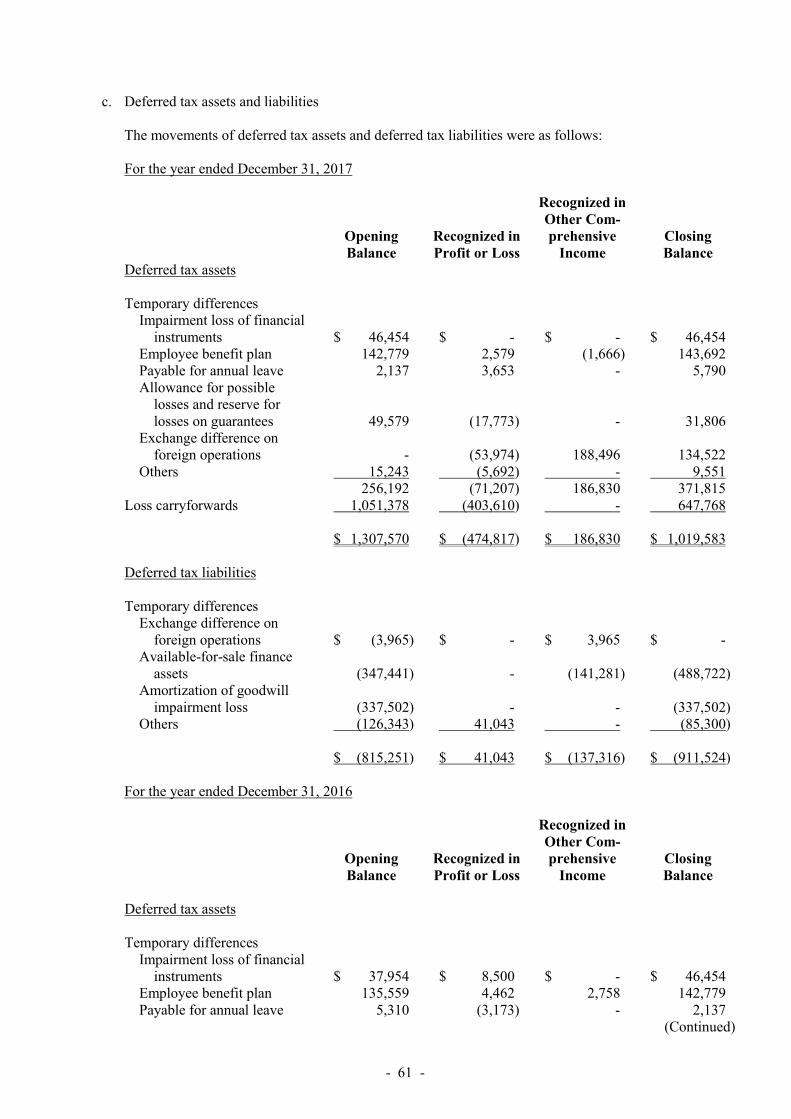
- 61 -
c. Deferred tax assets and liabilities The movements of deferred tax assets and deferred tax liabilities were as follows: For the year ended December 31, 2017
Opening Balance
Recognized in Profit or Loss
Recognized in Other Com- prehensive
Income Closing Balance
Deferred tax assets Temporary differences
Impairment loss of financial instruments $ 46,454 $ - $ - $ 46,454
Employee benefit plan 142,779 2,579 (1,666) 143,692 Payable for annual leave 2,137 3,653 - 5,790 Allowance for possible
losses and reserve for losses on guarantees 49,579 (17,773) - 31,806
Exchange difference on foreign operations - (53,974) 188,496 134,522
Others 15,243 (5,692) - 9,551 256,192 (71,207) 186,830 371,815
Loss carryforwards 1,051,378 (403,610) - 647,768 $ 1,307,570 $ (474,817) $ 186,830 $ 1,019,583 Deferred tax liabilities Temporary differences
Exchange difference on foreign operations $ (3,965) $ - $ 3,965 $ -
Available-for-sale finance assets (347,441) - (141,281) (488,722)
Amortization of goodwill impairment loss (337,502) - - (337,502)
Others (126,343) 41,043 - (85,300)
$ (815,251) $ 41,043 $ (137,316) $ (911,524) For the year ended December 31, 2016
Opening Balance
Recognized in Profit or Loss
Recognized in Other Com- prehensive
Income Closing Balance
Deferred tax assets Temporary differences
Impairment loss of financial instruments $ 37,954 $ 8,500 $ - $ 46,454
Employee benefit plan 135,559 4,462 2,758 142,779 Payable for annual leave 5,310 (3,173) - 2,137
(Continued)

- 62 -
Opening Balance
Recognized in Profit or Loss
Recognized in Other Com- prehensive
Income Closing Balance
Allowance for possible losses and reserve for losses on guarantees $ 13,175 $ 36,404 $ - $ 49,579
Others 15,385 (142) - 15,243 207,383 46,051 2,758 256,192
Loss carryforwards 1,542,767 (491,389) - 1,051,378 $ 1,750,150 $ (445,338) $ 2,758 $ 1,307,570 Deferred tax liabilities Temporary differences
Exchange difference on foreign operations $ (62,629) $ - $ 58,664 $ (3,965)
Available-for-sale finance assets (357,391) - 9,950 (347,441)
Amortization of goodwill impairment loss (337,502) - - (337,502)
Others (111,675) (14,668) - (126,343)
$ (869,197) $ (14,668) $ 68,614 $ (815,251) (Concluded)
d. Information about loss carryforwards
The Bank’s loss carryforwards as of December 31, 2017 were as followed: Unused Amount Expiry Year
$ 115,278 2018 3,654,948 2019 40,176 2020 $ 3,810,402
e. Information on the Bank’s integrated income tax
December 31 2017 2016 Imputation credits accounts Note $ 114,475 The Bank has no unappropriated earnings generated on before January 1, 1998. For the Year Ended December 31 2017 2016 The creditable ratios for the distribution of the earnings Note 6.29% Note: Since the amended Income Tax Act announced in February 2018 abolished the imputation tax
system, related information for 2017 is not applicable.

- 63 -
Under the Income Tax Law, for the distribution of earnings generated from January 1, 1998, the imputation credits allocable to ROC resident stockholders of the Bank are calculated on the basis of the creditable ratio as of the date of dividend distribution. The actual imputation credits allocable to stockholders of the Bank are based on the balance of the imputation credit accounts as of the date of dividend distribution.
f. The Bank’s income tax returns through 2015 were examined and cleared by the tax authorities. The Bank disagreed with the tax authorities’ assessment of the ending balance of imputation credits account (ICA) for 2012 and applied for a re-examination. The tax authorities replied in March 2017 that the balance shall be re-examined. The Bank expects that there will be no major difference between the applied amount and the approved amount.
39. EARNINGS PER SHARE
The numerators and denominators used in computing earnings per share (EPS) are summarized as follows: Denominator Earnings Numerator (Amounts) (Shares in Per Share (NT$) Pretax After Tax Thousands) Pretax After Tax 2017 Basic EPS
Income for the year attributable to common stockholders $ 3,313,250 $ 2,744,987 2,605,152 $ 1.27 $ 1.05
Bonus to employees - - 8,135 Diluted EPS $ 3,313,250 $ 2,744,987 2,613,287 $ 1.27 $ 1.05 2016 Basic EPS
Income for the year attributable to common stockholders $ 3,226,478 $ 2,636,375 2,605,152 $ 1.24 $ 1.01
Bonus to employees - - 8,328 Diluted EPS $ 3,226,478 $ 2,636,375 2,613,480 $ 1.23 $ 1.01 If the Bank offered to settle compensation or bonuses paid to employees in cash or shares, the Bank assumed the entire amount of the compensation or bonus will be settled in shares and the resulting potential shares were included in the weighted average number of shares outstanding used in the computation of diluted earnings per share, as the effect is dilutive. Such dilutive effect of the potential shares is included in the computation of diluted earnings per share until the number of shares to be distributed to employees is resolved in the following year.

- 64 -
40. RELATED-PARTY TRANSACTIONS
In addition to those disclosed in other footnotes, significant transactions between the Bank and related parties are summarized as follows: a. Related parties and their relationships with the Bank
Related Party Relationship with the Bank Union Finance and Leasing International Corporation
(UFLIC) Subsidiary
Union Information Technology Corporation (UIT) Subsidiary Union Finance International (H.K.) Limited Subsidiary Union Securities Investment Trust Corporation (USITC) Subsidiary Union Capital (Cayman) Corp. (UCCC) Subsidiary of UFLIC New Asian Ventures Ltd. (New Asian) Subsidiary of UFLIC Union Capital (Singapore) Holding Pte. Ltd. (UCSH) Subsidiary of Cayman Uflc Capital (Singapore) Holding Pte. Ltd. (UFLC) Subsidiary of Cayman Kabushiki Kaisha UCJ1 (KK) Subsidiary of UCSH and UFLC Tokutei Mokuteki Kaisha SSG15 (TMK SSG15) Subsidiary of UCSH and KK Tokutei Mokuteki Kaisha SSG12 (TMK SSG12) Subsidiary of UFLC and KK Tokutei Mokuteki Kaisha SSG16 (TMK SSG16) Subsidiary of UFLC and KK Union Real-Estate Management Corporation Associates Hung-Kou Construction Inc., Ltd. (Hung-Kou) Related party in substance The Liberty Times Co., Ltd. (Liberty Times) Related party in substance Long Shan Lin Corporation Related party in substance Yong-Xuan Co., Ltd. (Yong-Xuan) Related party in substance Union Enterprise Construction Co., Ltd. (UECC) Related party in substance Yu-Pang Co., Ltd. (Yu-Pang) Related party in substance Union Recreation Enterprise Corporation Related party in substance Union Optronics Co., Ltd. (Union Optronics) Related party in substance Securities Investment Trust Funds Issued by Union Securities Investment Trust Others Directors, managers and their relatives and
affiliates b. Significant transactions with related parties:
1) Loans December 31, 2017
Highest
Balance in the Loan Classification
Differences in Terms of
Transaction
Account
Volume or Year Ended
December 31, Ending Normal Nonper- forming
with Those for Unrelated
Type Name 2017 Balance Loans Loans Collaterals Parties Consumer loans 13 $ 16,719 $ 13,679 $ 13,679 $ - Land, buildings and cars None Self-used housing
mortgage loans 18 162,034 117,965 117,965 - Real estate None
Others UFLIC 1,934,751 1,895,359 1,895,359 - Land and buildings None Others 9 1,108,800 62,850 62,850 - Land, plant, buildings,
quoted stock and time deposits
None
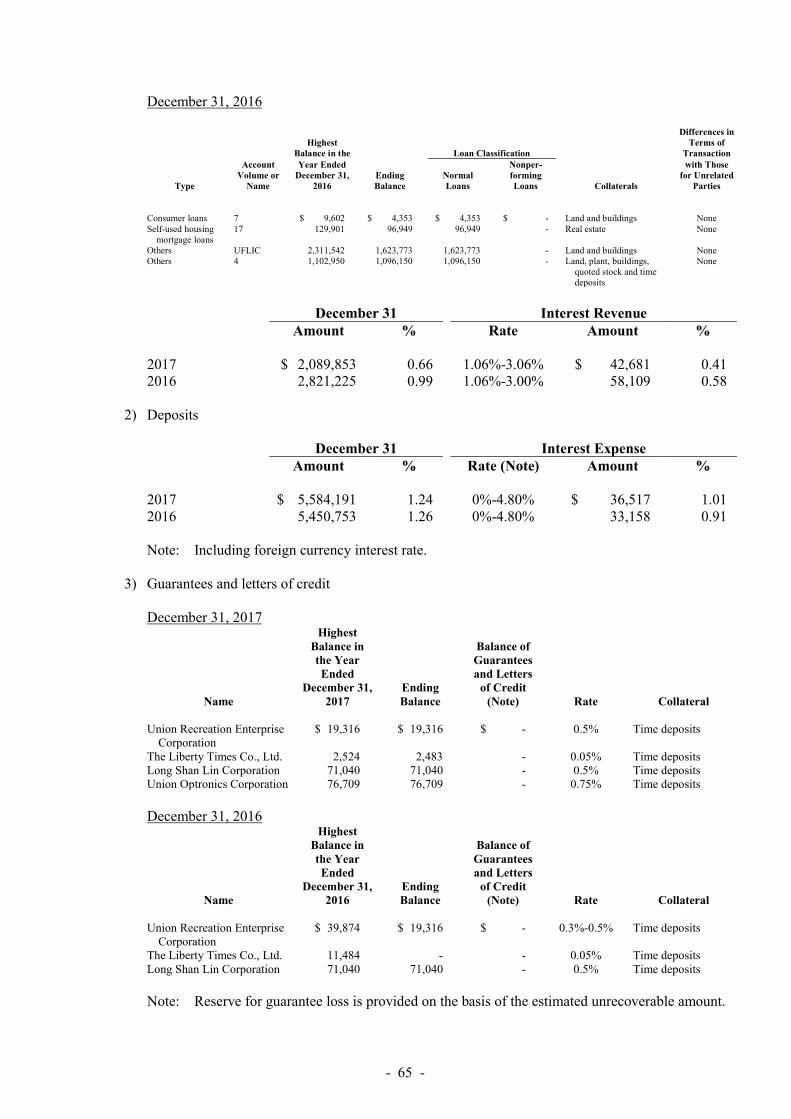
- 65 -
December 31, 2016
Highest
Balance in the Loan Classification
Differences in Terms of
Transaction
Account
Volume or Year Ended
December 31, Ending Normal Nonper- forming
with Those for Unrelated
Type Name 2016 Balance Loans Loans Collaterals Parties Consumer loans 7 $ 9,602 $ 4,353 $ 4,353 $ - Land and buildings None Self-used housing
mortgage loans 17 129,901 96,949 96,949 - Real estate None
Others UFLIC 2,311,542 1,623,773 1,623,773 - Land and buildings None Others 4 1,102,950 1,096,150 1,096,150 - Land, plant, buildings,
quoted stock and time deposits
None
December 31 Interest Revenue
Amount % Rate Amount % 2017 $ 2,089,853 0.66 1.06%-3.06% $ 42,681 0.41 2016 2,821,225 0.99 1.06%-3.00% 58,109 0.58
2) Deposits
December 31 Interest Expense Amount % Rate (Note) Amount % 2017 $ 5,584,191 1.24 0%-4.80% $ 36,517 1.01 2016 5,450,753 1.26 0%-4.80% 33,158 0.91
Note: Including foreign currency interest rate.
3) Guarantees and letters of credit
December 31, 2017
Name
Highest Balance in the Year Ended
December 31, 2017
Ending Balance
Balance of Guarantees and Letters
of Credit (Note) Rate Collateral
Union Recreation Enterprise
Corporation $ 19,316 $ 19,316 $ - 0.5% Time deposits
The Liberty Times Co., Ltd. 2,524 2,483 - 0.05% Time deposits Long Shan Lin Corporation 71,040 71,040 - 0.5% Time deposits Union Optronics Corporation 76,709 76,709 - 0.75% Time deposits
December 31, 2016
Name
Highest Balance in the Year Ended
December 31, 2016
Ending Balance
Balance of Guarantees and Letters
of Credit (Note) Rate Collateral
Union Recreation Enterprise
Corporation $ 39,874 $ 19,316 $ - 0.3%-0.5% Time deposits
The Liberty Times Co., Ltd. 11,484 - - 0.05% Time deposits Long Shan Lin Corporation 71,040 71,040 - 0.5% Time deposits
Note: Reserve for guarantee loss is provided on the basis of the estimated unrecoverable amount.

- 66 -
4) Leases a) The Bank as lessee
Under operating lease agreements with terms of one year to five years, the Bank rents from related parties’ office spaces for use by the Head Office, Trust, International Banking Department, Wealth Management, Information Technology Department, Consumer Banking Department, Credit Card Department, the Northern Collateral Appraisal Center, and five branches. Rentals are payable quarterly, with some contracts allowing placement with the lessors of lease deposits in lieu of rental payments. Rental expenses and lease deposits were as follows:
Lease Deposit (Part of
Other Assets) Rental Expense (Part of
Other Operating Expense) Amount % Amount %
2017 Yu-Pang $ 454,888 26.72 $ 15,980 2.47 Hung-Kuo 218,768 12.85 101,476 15.66 Yong-Xuan 14,292 0.84 58,974 9.10 UECC 4,384 0.26 9,410 1.45 UFLIC 1,158 0.07 3,462 0.53 2016 Yu-Pang 454,888 25.73 15,251 2.51 Hung-Kuo 218,768 12.38 101,476 16.69 Yong-Xuan 13,979 0.79 58,207 9.58 UECC 4,384 0.25 9,410 1.55 UFLIC 1,158 0.07 3,470 0.57 The Bank rented cars for business use from UFLIC; the rental expenses were $10,467 thousand in 2017 and $10,582 thousand in 2016. Rentals payable as of December 31, 2017 and 2016 were $49 thousand and $48 thousand, respectively.
b) The Bank as lessor The Bank’s South Taoyuan Branch, Kaohsiung Branch, Minchuan Branch, Chiayi Branch and Fucheng Branch leased part of their office premises to UFLIC under operating lease agreements starting from December 2014 to August 2019, from January 2016 to December 2020, from November 2011 to September 2017, from July 2014 to October 2016 (no extension), from June 2013 to June 2018, from May 2017 to April 2022, and from November 2017 to October 2022, respectively. The leasing revenues received were $1,432 thousand and $1,171 thousand in 2017 and 2016, respectively. The lease deposits received (included in other liabilities) were $423 thousand and $269 thousand in 2017 and 2016, respectively.
5) Available-for-sale financial assets As of December 31, 2017 and 2016, the Bank had purchased 0 thousand units and 85,608 thousand units, respectively, of beneficial certificates issued by USITC, which amounted to $0 thousand and $1,018,028 thousand and gain on disposal of investment were $93,546 thousand and $4,343 thousand in 2017 and 2016, respectively.
6) UIT sold computers and related materials and software and provided network services to the Bank.
The purchase and service fees were $107,958 thousand in 2017 and $105,137 thousand in 2016.

- 67 -
7) Derivative financial instruments
December 31, 2017
Notional Unrealized Balance Sheets Related Party Contract Period Amount Gain (Loss) Account Balance
UCCC Currency
swap contracts
2017.01.25- 2018.01.22
JPY1,480,000/ US$13,174
$ (658) Financial liabilities at fair value through profit or loss
$ (658)
December 31, 2016
Notional Unrealized Balance Sheets Related Party Contract Period Amount Gain (Loss) Account Balance
UCCC Currency
swap contracts
2016.12.27- 2017.01.25
JPY1,480,000/ US$12,626
$ (9) Financial liabilities at fair value through profit or loss
$ (9)
2017 2016 Gain (loss) on financial instruments at fair value through
profit or loss UFLIC $ - $ (3,917) UCCC (4,869) (4,503)
$ (4,869) $ (8,420)
Under the Banking Law, except for consumer and government loans, credits extended by the Bank to any related party should be fully secured, and the credit terms for related parties should be similar to those for unrelated parties. For transactions between the Bank and related parties, the terms are similar to those transacted with third parties, except for the preferential interest rates offered to Bank employees for savings and loans within prescribed amounts.
c. Compensation of directors, supervisors and management personnel:
For the Year Ended December 31 2017 2016 Short-term employment benefits
Salaries $ 31,503 $ 32,177 Transportation expenses 1,218 1,140
32,721 33,317 Post-employment benefits 6,055 2,167 $ 38,776 $ 35,484 Compensation of directors and management personnel is determined by the remuneration committee on the basis of individual performance and market trends.

- 68 -
41. PLEDGED ASSETS As of December 31, 2017 and 2016, government bonds and bank debentures, which amounted to $286,705 thousand and $154,405 thousand (all amounts included in other financial assets), respectively, had been provided to the courts and the Bank of Taiwan as guarantee deposits on provisional seizures against the debtors’ properties, as reserve for credit card receivables, as guarantee deposits on bills finance operations, brokering life insurance, property and casualty insurance, and as trust reserve. In addition, as of December 31, 2017 and 2016, negotiable certificates of deposit, which amounted to $0 thousand and $3,800,000 thousand, respectively (all amounts included in other financial assets), had been provided to the Central Bank as collateral for day-term overdraft. As of December 31, 2017 and 2016, the Bank pledged a time deposit of $300,000 thousand and $300,000 thousand (part of other financial assets) to Mega International Commercial Bank to be part of the latter’s online bank-to-bank payment system.
42. CONTINGENCIES AND COMMITMENTS
a. As of December 31, 2017 and 2016, the Bank’s commitments consisted of the following:
December 31 2017 2016 Irrevocable standby loan commitment $ 85,654,457 $ 109,697,387 Unused credit card commitment 257,495,390 238,271,865 Unused letters of credit 1,241,648 860,155 Other guarantees 13,804,083 10,270,804 Collections for customers 28,800,426 30,941,654 Travelers’ checks consigned-in 116,832 115,788 Guarantee notes payable 570,700 4,265,400 Trust assets 68,285,472 59,974,657 Marketable securities under custody 5,180,415 4,262,547
b. The Bank as lessee
The Bank rents several office premises for its branches under operating leases with terms ranging between 2 and 20 years. All operating lease contracts over 5 years contain clauses for market rental reviews for every five years. The Bank does not have a bargain purchase option to acquire the leased premises at the expiration of the lease period. As of December 31, 2017 and 2016, refundable deposits paid under operating leases were $799,182 thousand and $797,483 thousand, respectively (included in other assets - refundable deposits). The Bank’s future minimum lease payments for noncancellable operating lease commitments were as follows: December 31 2017 2016 Within 1 year $ 411,532 $ 423,831 Over 1 year up to 5 years 808,818 1,086,397 Over 5 years 345,302 380,035 $ 1,565,652 $ 1,890,263
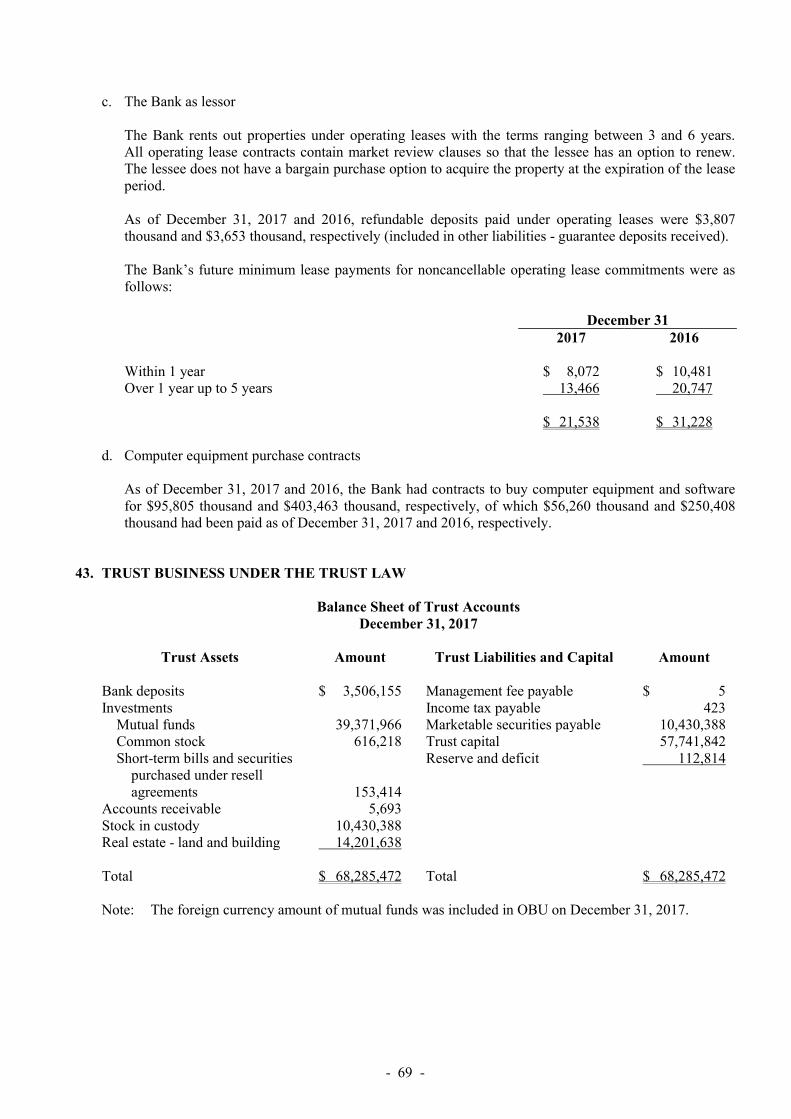
- 69 -
c. The Bank as lessor The Bank rents out properties under operating leases with the terms ranging between 3 and 6 years. All operating lease contracts contain market review clauses so that the lessee has an option to renew. The lessee does not have a bargain purchase option to acquire the property at the expiration of the lease period. As of December 31, 2017 and 2016, refundable deposits paid under operating leases were $3,807 thousand and $3,653 thousand, respectively (included in other liabilities - guarantee deposits received). The Bank’s future minimum lease payments for noncancellable operating lease commitments were as follows: December 31 2017 2016 Within 1 year $ 8,072 $ 10,481 Over 1 year up to 5 years 13,466 20,747 $ 21,538 $ 31,228
d. Computer equipment purchase contracts As of December 31, 2017 and 2016, the Bank had contracts to buy computer equipment and software for $95,805 thousand and $403,463 thousand, respectively, of which $56,260 thousand and $250,408 thousand had been paid as of December 31, 2017 and 2016, respectively.
43. TRUST BUSINESS UNDER THE TRUST LAW
Balance Sheet of Trust Accounts December 31, 2017
Trust Assets Amount Trust Liabilities and Capital Amount
Bank deposits $ 3,506,155 Management fee payable $ 5 Investments Income tax payable 423
Mutual funds 39,371,966 Marketable securities payable 10,430,388 Common stock 616,218 Trust capital 57,741,842 Short-term bills and securities Reserve and deficit 112,814 purchased under resell
agreements 153,414 Accounts receivable 5,693 Stock in custody 10,430,388 Real estate - land and building 14,201,638 Total $ 68,285,472 Total $ 68,285,472 Note: The foreign currency amount of mutual funds was included in OBU on December 31, 2017.

- 70 -
Balance Sheet of Trust Accounts December 31, 2016
Trust Assets Amount Trust Liabilities and Capital Amount
Bank deposits $ 3,045,051 Management fee payable $ - Investments Income tax payable 25
Mutual funds 38,199,360 Marketable securities payable 7,189,491 Common stock 269,587 Trust capital 52,866,325 Short-term bills and securities Reserve and deficit (81,184) purchased under resell
agreements 132,635 Accounts receivable 1,825 Stock in custody 7,189,491 Real estate - land and building 11,136,708 Total $ 59,974,657 Total $ 59,974,657 Note: The foreign currency amount of mutual funds was included in OBU on December 31, 2016.
Income Statement of Trust Accounts Year Ended December 31, 2017
Amount Trust income
Interest revenue - demand accounts $ 521 Interest revenue - time deposits 10,051 Interest revenue - short-term bills and securities purchased under resell agreements 211 Cash dividends - common stock 17,336 Service fee allowances - common stock 2 Income from beneficial certificates 532 Realized capital gain - fund 448 Unrealized capital gain - common stock 160,012 Unrealized capital gain - fund 1,243
Total trust income 190,356 Trust expense
Management expense 8,509 Supervisor fee 80 Taxation 64,060 Agency fees 2,669 Realized capital loss - fund 177 Unrealized capital loss - common stock 2,367 Unrealized capital loss - fund 833 Others 120
Total trust expense 78,815 Loss before tax 111,541 Income tax expense (2,255) Net income $ 109,286 Note: The above trust income statements were not included in the Bank’s income statements.
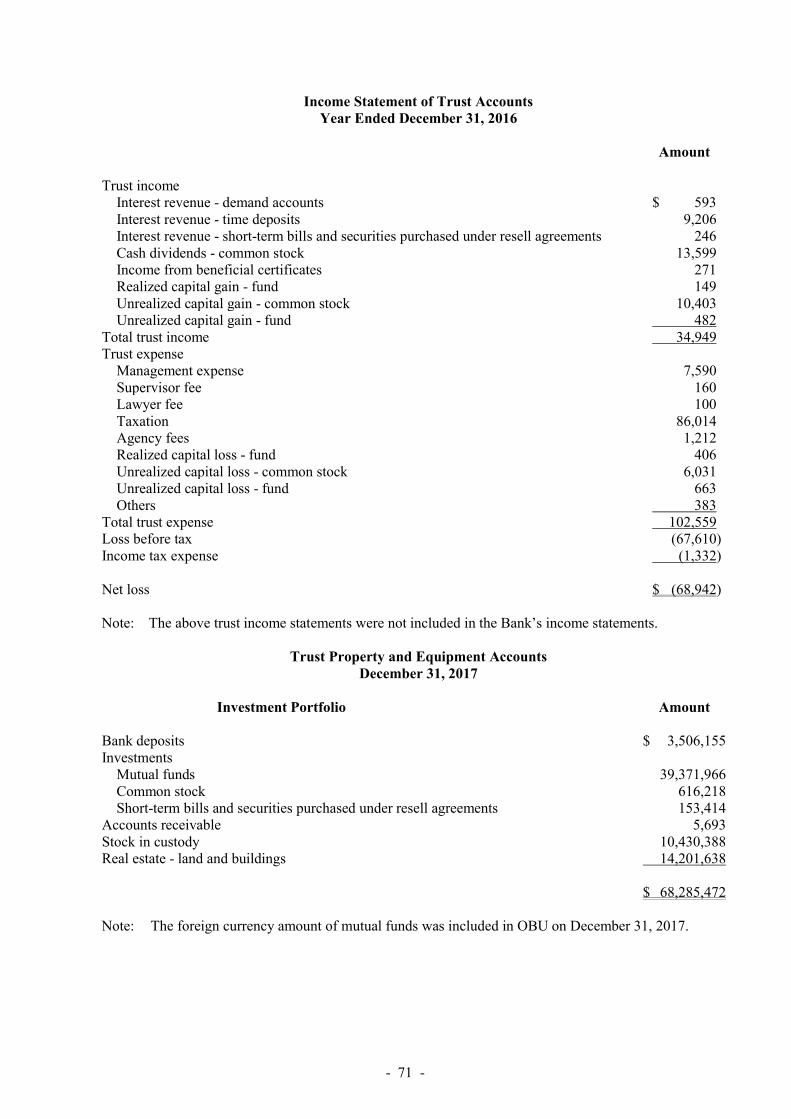
- 71 -
Income Statement of Trust Accounts Year Ended December 31, 2016
Amount Trust income
Interest revenue - demand accounts $ 593 Interest revenue - time deposits 9,206 Interest revenue - short-term bills and securities purchased under resell agreements 246 Cash dividends - common stock 13,599 Income from beneficial certificates 271 Realized capital gain - fund 149 Unrealized capital gain - common stock 10,403 Unrealized capital gain - fund 482
Total trust income 34,949 Trust expense
Management expense 7,590 Supervisor fee 160 Lawyer fee 100 Taxation 86,014 Agency fees 1,212 Realized capital loss - fund 406 Unrealized capital loss - common stock 6,031 Unrealized capital loss - fund 663 Others 383
Total trust expense 102,559 Loss before tax (67,610) Income tax expense (1,332) Net loss $ (68,942) Note: The above trust income statements were not included in the Bank’s income statements.
Trust Property and Equipment Accounts December 31, 2017
Investment Portfolio Amount Bank deposits $ 3,506,155 Investments
Mutual funds 39,371,966 Common stock 616,218 Short-term bills and securities purchased under resell agreements 153,414
Accounts receivable 5,693 Stock in custody 10,430,388 Real estate - land and buildings 14,201,638 $ 68,285,472 Note: The foreign currency amount of mutual funds was included in OBU on December 31, 2017.

- 72 -
Trust Property and Equipment Accounts December 31, 2016
Investment Portfolio Amount Bank deposits $ 3,045,051 Investments
Mutual funds 38,199,360 Common stock 269,587 Short-term bills and securities purchased under resell agreements 132,635
Accounts receivable 1,825 Stock in custody 7,189,491 Real estate - land and buildings 11,136,708 $ 59,974,657 Note: The foreign currency amount of mutual funds was included in OBU on December 31, 2016.
44. FINANCIAL INSTRUMENTS
a. Three-level fair value hierarchy The definitions of each level of the fair value hierarchy are shown below: 1) Level 1
Level 1 financial instruments are traded in an active market in which there are quoted prices for identical assets and liabilities. An active market has the following characteristics: a) All financial instruments in the market are homogeneous. b) There are willing buyers and sellers in the market all the time. c) The public can access the price information easily. The products in this level, such as listed stocks and beneficial securities, usually have high liquidity or are traded in futures market or exchanges.
2) Level 2
The products in this level have fair values that can be inferred from either directly or indirectly observable inputs other than quoted prices in an active market. Examples of these inputs are: a) Quoted prices from the similar products in an active market. This means the fair value can be
derived from the current trading prices of similar products, and whether they are similar products should be judged on the characteristics and trading rules. The fair price valuation in this circumstance may be adjusted due to time differences, trading rule’s differences, interested parties’ prices, and the correlation of price between itself and the similar goods;
b) Quoted prices for identical or similar financial instruments in inactive markets; c) For the marking-to-model method, the inputs to this model should be observable (such as
interest rates, yield curves and volatilities). The observable inputs mean that they can be obtained from the market and can reflect the expectation of market participants;

- 73 -
d) Inputs that are derived from observable market data through correlation or other means. The fair values of products categorized in this level are usually calculated using a valuation model generally accepted by the market. Examples are forward contracts, cross-currency swap, simple interest bearing bonds, convertible bonds and commercial paper.
3) Level 3
The fair values of the products in this level are typically based on management assumptions or expectations other than the direct market data. For example, historical volatility used in valuing options is an unobservable input because it cannot represent the entire market participants’ expectation on future volatility. The products in this level are complex derivate financial instruments or products with prices that are provided by brokers. Examples are complex foreign exchange options.
b. The fair value hierarchies of the Bank’s financial instruments as of December 31, 2017 and 2016 were as follows:
(In Thousands of New Taiwan Dollars)
December 31, 2017 Total Level 1 Level 2 Level 3 Measured at fair value on a recurring basis Nonderivative financial instruments Assets
Financial assets at fair value through profit or loss (FVTPL) Held-for-trading financial assets
Stock $ 42,757 $ 42,757 $ - $ - Beneficial certificates 883,014 883,014 - - Commercial paper 10,389,618 - 10,389,618 -
Available-for-sale financial assets Stock 6,789,544 6,789,544 - - Debt instruments 27,476,609 - 27,476,609 - Beneficial certificates 917,253 917,253 - -
Derivative financial instruments Assets
Financial assets at FVTPL 537,334 - 489,081 48,253 Liabilities
Financial liabilities at FVTPL 183,611 - 135,352 48,259

- 74 -
December 31, 2016 Total Level 1 Level 2 Level 3 Measured at fair value on a recurring basis Nonderivative financial instruments Assets
Financial assets at fair value through profit or loss (FVTPL) Held-for-trading financial assets
Stock $ 68,371 $ 68,371 $ - $ - Debt instruments 151,223 - 151,223 - Beneficial certificates 5,662 5,662 - - Commercial paper 8,300,747 - 8,300,747 -
Financial assets designated as at FVTPL on initial recognition Principal guaranteed notes 322,968 - 322,968 -
Available-for-sale financial assets Stock 5,554,776 5,554,776 - - Debt instruments 32,202,284 - 32,202,284 - Beneficial certificates 1,791,542 1,791,542 - -
Derivative financial instruments Assets
Financial assets at FVTPL 442,642 - 434,497 8,145 Liabilities
Financial liabilities at FVTPL 38,430 - 30,295 8,135
c. The financial instruments measured at fair value
Fair value is the price that would be received to sell an asset or paid to transfer a liability in an orderly transaction between willing market participants with full understanding of the sale or transfer transaction. The fair values of financial instruments at fair value, available-for-sale financial assets and hedging derivative financial instruments with quoted price in an active market are based on their market prices; financial instruments with no quoted prices in an active market are estimated by valuation methods. 1) Marking to market
This method should be used first to determine fair value. Following are the principles to follow in marking to market: a) Ensure the consistency and integrity of market data. b) The source of market data should be transparent and easy to access and can be referred to by
independent resources. c) Listed securities with tradable prices should be valued at closing prices. d) Evaluating unlisted securities that lack tradable closing prices should use quoted prices from
independent brokers.
2) Marking to model The use of marking to model is suggested if marking to market is infeasible. This valuation methodology is based upon model inputs that are used to derive the value of the trading positions. The Bank uses the same estimations and assumptions as those used by market participants to determine the fair value.

- 75 -
The Bank uses the forward rates provided by Reuters to estimate the fair values of forward contracts, foreign exchange swap contracts, interest rate swap and cross-currency swap contacts and the discounted cash flow method to calculate the fair values of each contract. For foreign exchange option transactions, the Bank uses the option pricing models which are generally used by other market participants (e.g., the Black-Scholes model) to calculate the fair value of the contracts. For debt instruments with no active market, the Bank estimates fair values based on prices quoted by counterparties and adjusted in accordance with the results of the evaluation of a debtor’s credit.
3) Transfer between Level 1 and Level 2
There was no material transfer between Level 1 and Level 2 for 2017 and 2016.
4) Reconciliation of Level 3 items of financial instruments
a) Reconciliation of Level 3 items of financial assets For the year ended December 31, 2017
(In Thousands of New Taiwan Dollars)
Items Beginning Balance
Valuation Gains (Losses) Amount of Increase Amount of Decrease Ending Balance
In Net Income
In Other Comprehen- sive Income
Purchase or Change in Fair Value
Transfer to Level 3
Sale or Change in Fair Value
Transfer from Level 3
Financial assets at fair value through profit or loss Derivative
financial assets $ 8,145 $ 26,551 $ - $ 45,673 $ - $ (32,116 ) $ - $ 48,253
For the year ended December 31, 2016
(In Thousands of New Taiwan Dollars)
Items Beginning Balance
Valuation Gains (Losses) Amount of Increase Amount of Decrease Ending Balance
In Net Income
In Other Comprehen- sive Income
Purchase or Change in Fair Value
Transfer to Level 3
Sale or Change in Fair Value
Transfer from Level 3
Financial assets at fair value through profit or loss Derivative
financial assets $ 24,194 $ (13,284 ) $ - $ 28,978 $ - $ (31,743 ) $ - $ 8,145
b) Reconciliation of Level 3 items of financial liabilities
For the year ended December 31, 2017
(In Thousands of New Taiwan Dollars)
Items Beginning Balance
Valuation Gains (Losses) Amount of Increase Amount of Decrease Ending Balance
In Net Income
In Other Comprehen- sive Income
Purchase or Change in Fair Value
Transfer to Level 3
Sale or Change in Fair Value
Transfer from Level 3
Financial liabilities at fair value through profit or loss Derivative
financial liabilities $ 8,135 $ 25,151 $ - $ 51,515 $ - $ (36,542 ) $ - $ 48,259
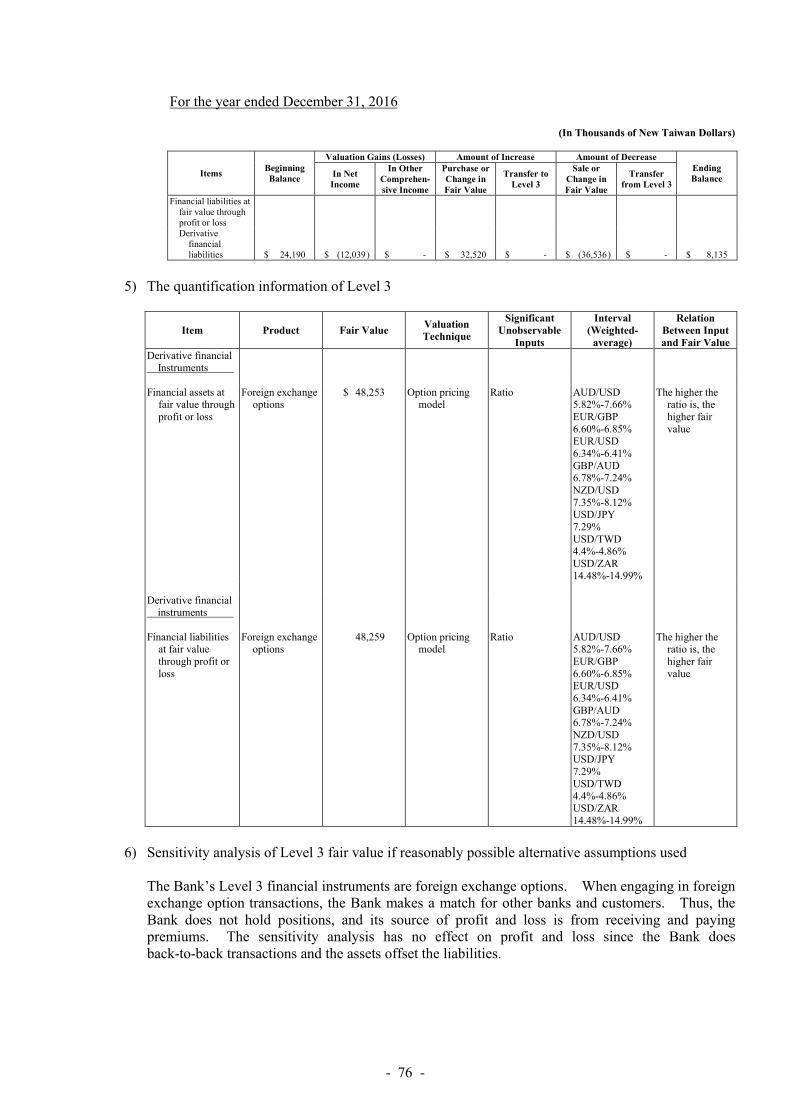
- 76 -
For the year ended December 31, 2016
(In Thousands of New Taiwan Dollars)
Items Beginning Balance
Valuation Gains (Losses) Amount of Increase Amount of Decrease Ending Balance
In Net Income
In Other Comprehen- sive Income
Purchase or Change in Fair Value
Transfer to Level 3
Sale or Change in Fair Value
Transfer from Level 3
Financial liabilities at fair value through profit or loss Derivative
financial liabilities $ 24,190 $ (12,039 ) $ - $ 32,520 $ - $ (36,536 ) $ - $ 8,135
5) The quantification information of Level 3
Item Product Fair Value Valuation Technique
Significant Unobservable
Inputs
Interval (Weighted-
average)
Relation Between Input and Fair Value
Derivative financial Instruments
Financial assets at
fair value through profit or loss
Foreign exchange options
$ 48,253 Option pricing model
Ratio AUD/USD 5.82%-7.66% EUR/GBP 6.60%-6.85% EUR/USD 6.34%-6.41% GBP/AUD 6.78%-7.24% NZD/USD 7.35%-8.12% USD/JPY 7.29% USD/TWD 4.4%-4.86% USD/ZAR 14.48%-14.99%
The higher the ratio is, the higher fair value
Derivative financial instruments
Financial liabilities
at fair value through profit or loss
Foreign exchange options
48,259 Option pricing model
Ratio AUD/USD 5.82%-7.66% EUR/GBP 6.60%-6.85% EUR/USD 6.34%-6.41% GBP/AUD 6.78%-7.24% NZD/USD 7.35%-8.12% USD/JPY 7.29% USD/TWD 4.4%-4.86% USD/ZAR 14.48%-14.99%
The higher the ratio is, the higher fair value
6) Sensitivity analysis of Level 3 fair value if reasonably possible alternative assumptions used
The Bank’s Level 3 financial instruments are foreign exchange options. When engaging in foreign exchange option transactions, the Bank makes a match for other banks and customers. Thus, the Bank does not hold positions, and its source of profit and loss is from receiving and paying premiums. The sensitivity analysis has no effect on profit and loss since the Bank does back-to-back transactions and the assets offset the liabilities.

- 77 -
d. Fair value of financial instruments that are not measured at fair value
Except for the financial instruments shown in the following table, the management believes that the financial assets and financial liabilities recognized in the financial statements either have carrying amounts that approximate their fair values or have fair values that cannot be reasonably measured. 1)
December 31 2017 2016
Carrying Amount
Estimated Fair Value
Carrying Amount
Estimated Fair Value
Financial assets Held-to-maturity financial
assets $ 51,285,957 $ 51,388,334 $ 7,192,115 $ 7,088,803 Debt instruments with no
active market 45,734,754 46,737,536 51,433,548 53,015,036 Financial liabilities Bank debentures 11,700,000 11,887,884 11,200,000 11,445,952
2) Fair value hierarchy
Items December 31, 2017
Total Level 1 Level 2 Level 3 Financial assets Held-to-maturity financial
assets $ 51,388,334 $ - $ 51,388,334 $ - Debt instruments with no
active market 46,737,536 - 46,737,536 - Financial liabilities Bank debentures 11,887,884 - 11,887,884 -
Items December 31, 2016
Total Level 1 Level 2 Level 3 Financial assets Held-to-maturity financial
assets $ 7,088,803 $ - $ 7,088,803 $ - Debt instruments with no
active market 53,015,036 - 53,015,036 - Financial liabilities Bank debentures 11,445,952 - 11,445,952 -

- 78 -
45. FINANCIAL RISK MANAGEMENT
a. Overview To deal with any expected or unexpected business risk, the Bank has established a comprehensive risk management system to allocate resources effectively and efficiently, strengthen business competitiveness, mitigate operational risk to a tolerable or acceptable level, and maintain the capital adequacy ratio to meet the minimum requirements of the authorities and the Basel Accord framework.
b. Risk management framework The Board of Directors, which occupies the highest level in the Bank’s risk management framework, reviews risk management policies, the overall risk management framework and organization structure for carrying out responsibilities and exercising accountability. The Asset/Liability Management Committee inspects management reports or information provided by business units and the Risk Management Division. The Risk Management Division is an independent unit that is in charge of reviewing the risk management system designed by business units and the compliance with risk management requirements; this division also submits risk management reports to the authorities and develops a series of risk management tools to assess the risks identified. Business units establish risk control procedures, manage and monitor the implementation of those controls in operation units. Operation units perform daily risk management work and internal controls to ensure the accuracy and completeness of the risk management information generated.
c. Credit risk 1) Credit risk definitions and sources
Credit risk refers to the risk of losses caused by borrowers, debtors, or counterparties’ failure to fulfill their contractual obligations due to deteriorating financial position or other factors. It arises principally from transactions involving discounts, loans, credit cards, due from or call loans to banks, debt investments and derivatives etc., and also from off-balance sheet products such as guarantees, acceptance, letters of credit and commitments.
2) Strategy/objectives/policies and processes
a) Credit risk management strategy: The Bank has established “Credit Risk Management Standards of Union Bank of Taiwan” as the basis of planning, implementing, and managing credit risk management system.
b) Credit risk management objective: The objectives are to establish and implement an effective
credit risk management mechanism to mitigate credit risk, archive operational and management goals, and balance business development and risk control.
c) Credit risk management policy: The policies are meant to ensure that credit risk falls within an
acceptable range and that adequate capital is maintained to meet credit risk management objectives and create maximum risk-adjusted returns.
d) Credit risk management process: The Bank carries out credit risk identification, credit risk
measurement, credit risk mitigation, credit risk monitoring and control and credit risk reporting process as part of its credit risk management mechanism.
3) Credit risk management framework
a) The Board of Directors: The Board of Directors, the top risk supervisor of the Bank, reviews
risk management policies, operational risk limits and the design and change of credit risk management framework.

- 79 -
b) Asset/Liability Management Committee: This committee inspects management reports or
information provided by business units and the Risk Management Division. c) Risk Management Division: The Risk Management Division is an independent unit that is in
charge of the work related to three pillars of Basel and reviews the risk management system designed by business units and the compliance with risk management requirements; the division also submits risk management reports to the authorities and develops risk management tools to assess the risk identified.
d) Business units: Business units are responsible for establishing risk management regulations
and risk control procedures and managing and monitoring the implementation of those controls in operation units.
e) Operation units: Under the risk management regulations and procedures set by business units,
operation units perform daily risk management work and internal controls and prepares reports on these tasks.
4) Credit risk measurement, control and reporting
a) The range of credit risk reporting:
i. Each business unit will regularly report the promotion of the business and the allocation of risk assets to the Assets/Liability Management Committee (ALMC).
ii. The Bank’s risk management department regularly monitors the credit limit control
situations and reports to the ALMC the credit concentration and the status of each business’ achieving BIS (Bank for International Settlements) goals. The department also presents the volume of business NPL situation, credit concentration and the execution of credit risk control to the Board.
b) Measurement system:
The Bank’s credit risk management adopts the use of the standardized approach to calculate capital charge and regularly submits related reports to the government. The risk management division and business units implement the Bank’s management system and monitors the credit exposure of the business, industry, and countries as well as the concentration of credit and collateral to effectively measure and manage investment portfolio.
5) Mitigation of risks or hedging of credit risk
The Bank is exposed to loss on each credit risk faced by its business. Thus, depending on the nature of the business and the cost considerations, the Bank will take appropriate measures to control risk. The Bank’s information systems provide information that can be used in managing risk control procedures, and the risk management division reports to the board every six months the business risk management status.

- 80 -
6) Maximum exposure to credit risk The maximum credit exposures of assets in the balance sheet are almost equivalent to their carrying values. These off-balance sheet maximum credit exposures (excluding collaterals and other credit enhancement instruments) are shown as follows:
Off-Balance Sheet Items The Maximum Credit Exposure December 31,
2017 December 31,
2016 Irrevocable standby loan commitment $ 2,199,776 $ 9,482,533 Unused letters of credit 1,241,648 860,155 Other guarantees 13,804,083 10,270,804 Unused credit card commitments 257,495,390 238,271,865
December 31, 2017 Collateral Netting
Arrangements Other Credit Enhancement Total
In-balance sheet items Discount and loans $ 250,557,922 $ - $ - $ 250,557,922
December 31, 2016 Collateral Netting
Arrangements Other Credit Enhancement Total
In-balance sheet items Discount and loans $ 228,403,708 $ - $ - $ 228,403,708
7) Concentrations of credit risk exposure
Concentrations of credit risk arise when a number of counterparties or exposure have comparable economic characteristics, or such counterparties are engaged in similar activities, or operate in the same geographical areas or industry sectors, so that their collective ability to meet contractual obligations is uniformly affected by changes in economic or other conditions. There can be credit risk concentrations in a bank’s assets, liabilities, or off-balance sheet items through the execution or processing of transactions (either product or service), or through a combination of exposures across these broad categories. These exposures can cover credits, loans and deposits, call loans to banks, investments, receivables and derivatives. To minimize its credit risk, the Bank maintains a diversified portfolio; limits its exposure to any one geographic region, country or individual creditor; and closely monitors its exposures. The Bank’s most significant concentrations of credit risk are summarized as follows: a) By industry
December 31, 2017 December 31, 2016 Amount % Amount %
Private enterprises $ 84,654,639 25.19 $ 71,596,120 24.05 Public enterprises 5,000,000 1.49 5,000,000 1.68 Government organizations 42,032,219 12.51 33,036,805 11.10 Nonprofit organizations 694,719 0.21 917,924 0.31 Private organizations 202,610,903 60.30 186,430,171 62.64 Foreign enterprises 1,024,743 0.30 663,332 0.22 Total 336,017,223 100.00 297,644,352 100.00

- 81 -
b) By geographical area The Bank’s operations are mainly in Taiwan.
c) By collaterals
December 31, 2017 December 31, 2016 Amount % Amount %
Unsecured $ 80,394,252 23.92 $ 63,101,890 21.20 Secured
Financial instruments 8,134,418 2.42 7,229,286 2.43 Stocks 9,397,235 2.80 9,284,626 3.12 Properties 213,097,461 63.42 194,540,140 65.36 Movables 16,925,126 5.04 15,813,134 5.31 Guarantees 6,288,007 1.87 5,520,845 1.86 Others 1,780,724 0.53 2,154,431 0.72
Total 336,017,223 100.00 297,644,352 100.00

- 82 -
8) Credit quality and impairment assessment
Some financial assets - cash and cash equivalents, due from the Central Bank and call loans to other banks, financial assets at fair value through profit or loss, repos and debt securities, refundable deposits, guaranty bonds and clearing and settlement fund - are regarded as having very low credit risk because of the good credit ratings of counterparties. Other financial assets not regarded as having low credit risk are summarized as follows: a) Discounts, loans and receivables
December 31, 2017
Neither Past Due Nor Impaired Past Due But Not Impaired
(B)
Impaired Amount (C)
Total (A)+(B)+(C)
Loss Recognized (D)
Net Total (A)+(B)+(C)-(D) Excellent Good Acceptable No Ratings Subtotal (A)
With Objective Evidence of Impairment
With No Objective
Evidence of Impairment
Receivables Credit card business $ 8,756,311 $ 4,596,438 $ 37,114 $ - $ 13,389,863 $ 190,760 $ 1,205,206 $ 14,785,829 $ 63,838 $ 27,863 $ 14,694,128 Acceptances receivable 123,578 63,396 - - 186,974 - - 186,974 - 1,000 185,974 Accounts receivable
factoring without recourse - 396,449 - - 396,449 - - 396,449 - 3,964 392,485
Others 2,187,816 116,026 26,294 3,980 2,334,116 3,081 109,288 2,446,485 90,711 923 2,354,851 Overdue guarantee loans - - - - - - 25,105 25,105 - - 25,105 Discounts and loans
Consumer finance 82,148,042 59,308,582 23,229,244 3,282,059 167,967,927 563,963 205,953 168,737,843 71,261 1,708,041 166,958,541 Corporate banking 110,245,661 39,278,948 2,045,235 186,763 151,756,607 157,307 1,374,409 153,288,323 162,389 1,460,127 151,665,807
December 31, 2016
Neither Past Due Nor Impaired Past Due But Not Impaired
(B)
Impaired Amount (C)
Total (A)+(B)+(C)
Loss Recognized (D)
Net Total (A)+(B)+(C)-(D) Excellent Good Acceptable No Ratings Subtotal (A)
With Objective Evidence of Impairment
With No Objective
Evidence of Impairment
Receivables Credit card business $ 8,705,928 $ 3,932,822 $ 40,380 $ - $ 12,679,130 $ 200,846 $ 1,287,067 $ 14,167,043 $ 62,126 $ 34,319 $ 14,070,598 Acceptances receivable 97,552 37,979 - - 135,531 - - 135,531 - 476 135,055 Accounts receivable
factoring without recourse - 799,844 - - 799,844 - - 799,844 - 3,504 796,340
Others 2,374,863 104,684 23,120 3,819 2,506,486 1,815 525,888 3,034,189 267,780 41 2,766,368 Overdue guarantee loans - - - - - - 3,765 3,765 - - 3,765 Discounts and loans
Consumer finance 88,535,794 42,291,881 20,657,009 2,930,474 154,415,158 331,607 134,205 154,880,970 63,497 1,656,388 153,161,085 Corporate banking 76,411,238 53,177,163 806,354 219,925 130,614,680 17,379 1,724,988 132,357,047 227,124 1,250,285 130,879,638

- 83 -
b) Credit quality analysis of securities
December 31, 2017
Neither Past Due Nor Impaired Amount (Note) Past Due But Not
Impaired (B)
Impaired Amount
(C)
Total (A)+(B)+(C)
Loss Recognized (D) Net Total
(A)+(B)+(C)-(D) Investment
Grade Non-investment
Grade No Ratings Subtotal (A)
With Objective Evidence of Impairment
With Objective Evidence of Impairment
Available-for-sale financial assets Investments in bonds $ 25,733,292 $ 1,743,317 $ - $ 27,476,609 $ - $ - $ 27,476,609 $ - $ - $ 27,476,609 Investments in stocks 6,534,669 254,875 - 6,789,544 - - 6,789,544 - - 6,789,544 Others - - 917,253 917,253 - - 917,253 - - 917,253
Held-to-maturity financial assets Investments in bonds 8,985,957 - - 8,985,957 - - 8,985,957 - - 8,985,957 Others 42,300,000 - - 42,300,000 - - 42,300,000 - - 42,300,000
Other financial assets Investments in bonds 45,734,754 - - 45,734,754 - 258,245 45,992,999 - 258,245 45,734,754 Investments in stocks - - 507,614 507,614 - - 507,614 - - 507,614
December 31, 2016
Neither Past Due Nor Impaired Amount (Note) Past Due But Not
Impaired (B)
Impaired Amount
(C)
Total (A)+(B)+(C)
Loss Recognized (D) Net Total
(A)+(B)+(C)-(D) Investment
Grade Non-investment
Grade No Ratings Subtotal (A)
With Objective Evidence of Impairment
With Objective Evidence of Impairment
Available-for-sale financial assets Investments in bonds $ 30,660,942 $ 1,541,342 $ - $ 32,202,284 $ - $ - $ 32,202,284 $ - $ - $ 32,202,284 Investments in stocks 5,311,930 242,846 - 5,554,776 - - 5,554,776 - - 5,554,776 Others 500,007 - 1,291,535 1,791,542 - - 1,791,542 - - 1,791,542
Held-to-maturity financial assets Investments in bonds 7,192,115 - - 7,192,115 - - 7,192,115 - - 7,192,115
Other financial assets Investments in bonds 51,433,548 - - 51,433,548 - 279,278 51,712,826 - 279,278 51,433,548 Investments in stocks - - 507,614 507,614 - - 507,614 - - 507,614
Note: The definitions are as follows:
1. Investment grade: Credit rating is BBB - or higher or 1-5 TCRI corporate rating of TEJ if it is a publicly traded company. 2. Non-investment grade: Credit rating is BB + or higher or 6-9 TCRI corporate rating of TEJ if it is a publicly traded company. 3. No ratings: No external ratings.

- 84 -
9) Aging analysis of overdue but not yet impaired financial assets Delays in processing payments by borrowers and other administrative reasons could result in financial assets becoming overdue but unimpaired. Based on the Bank’s internal risk management policies, financial assets that are 90 days overdue are not considered impaired unless evidences show otherwise. The aging analysis of overdue but unimpaired financial assets was as follows:
December 31, 2017 Overdue Less
Than One Month
Overdue One to Three Months
Overdue Over Three to Six
Months Total
Accounts receivable Credit cards $ 148,259 $ 42,501 $ - $ 190,760 Others 1,529 1,552 - 3,081
Discounts and loans Consumer finance 368,306 195,657 - 563,963 Corporate banking 96,066 61,241 - 157,307
December 31, 2016 Overdue Less
Than One Month
Overdue One to Three Months
Overdue Over Three to Six
Months Total
Accounts receivable Credit cards $ 157,031 $ 43,815 $ - $ 200,846 Others 1,118 697 - 1,815
Discounts and loans Consumer finance 247,672 83,935 - 331,607 Corporate banking 11,270 6,109 - 17,379
10) Analysis of impairment for financial assets
The Bank’s assessment of loans and receivables for impairment indicated no impairment loss on due from other banks, due from the Central Bank and call loans to other banks. The assessment of the other loans and receivables was as follows: Discounts and loans
Type of Impairment
December 31, 2017 December 31, 2016
Discounts and Loans
Allowance for Doubtful Accounts
Discounts and Loans
Allowance for Doubtful Accounts
With objective evidence of impairment
Assessment of individual impairment
$ 1,271,517 $ 129,051 $ 1,666,013 $ 201,768
Assessment of collective impairment
406,929 104,599 310,587 88,853
With no objective evidence of impairment
Assessment of collective impairment
320,347,720 3,168,168 285,261,417 2,906,673
Note: The loans are those originated by the Bank, and are not net of the allowance for doubtful
accounts and adjustments for discount (premium).
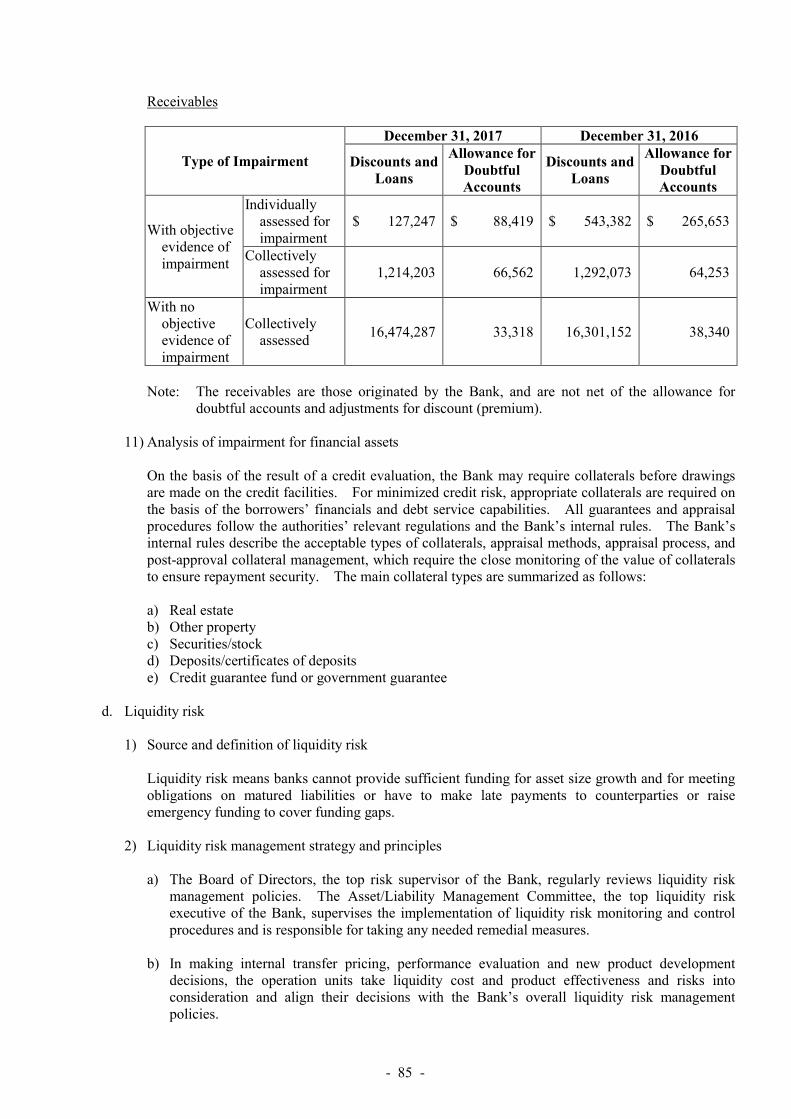
- 85 -
Receivables
Type of Impairment
December 31, 2017 December 31, 2016
Discounts and Loans
Allowance for Doubtful Accounts
Discounts and Loans
Allowance for Doubtful Accounts
With objective evidence of impairment
Individually assessed for impairment
$ 127,247 $ 88,419 $ 543,382 $ 265,653
Collectively assessed for impairment
1,214,203 66,562 1,292,073 64,253
With no objective evidence of impairment
Collectively assessed
16,474,287 33,318 16,301,152 38,340
Note: The receivables are those originated by the Bank, and are not net of the allowance for
doubtful accounts and adjustments for discount (premium).
11) Analysis of impairment for financial assets On the basis of the result of a credit evaluation, the Bank may require collaterals before drawings are made on the credit facilities. For minimized credit risk, appropriate collaterals are required on the basis of the borrowers’ financials and debt service capabilities. All guarantees and appraisal procedures follow the authorities’ relevant regulations and the Bank’s internal rules. The Bank’s internal rules describe the acceptable types of collaterals, appraisal methods, appraisal process, and post-approval collateral management, which require the close monitoring of the value of collaterals to ensure repayment security. The main collateral types are summarized as follows: a) Real estate b) Other property c) Securities/stock d) Deposits/certificates of deposits e) Credit guarantee fund or government guarantee
d. Liquidity risk
1) Source and definition of liquidity risk
Liquidity risk means banks cannot provide sufficient funding for asset size growth and for meeting obligations on matured liabilities or have to make late payments to counterparties or raise emergency funding to cover funding gaps.
2) Liquidity risk management strategy and principles
a) The Board of Directors, the top risk supervisor of the Bank, regularly reviews liquidity risk management policies. The Asset/Liability Management Committee, the top liquidity risk executive of the Bank, supervises the implementation of liquidity risk monitoring and control procedures and is responsible for taking any needed remedial measures.
b) In making internal transfer pricing, performance evaluation and new product development
decisions, the operation units take liquidity cost and product effectiveness and risks into consideration and align their decisions with the Bank’s overall liquidity risk management policies.
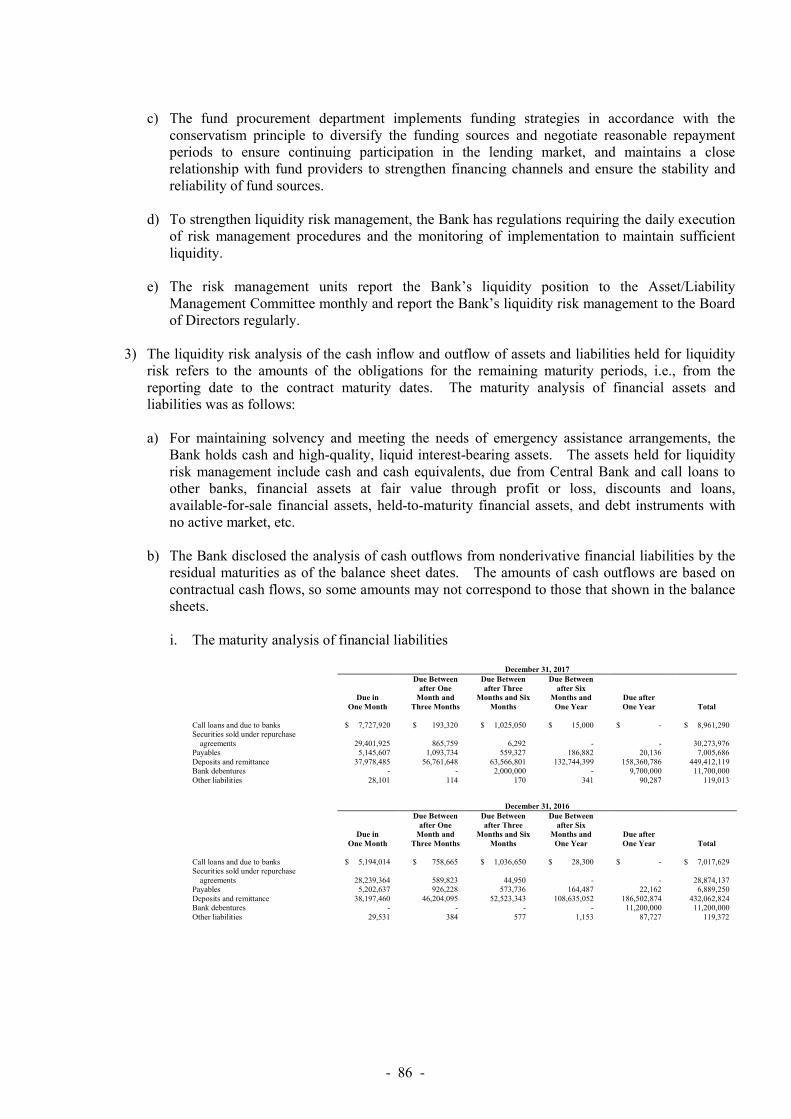
- 86 -
c) The fund procurement department implements funding strategies in accordance with the
conservatism principle to diversify the funding sources and negotiate reasonable repayment periods to ensure continuing participation in the lending market, and maintains a close relationship with fund providers to strengthen financing channels and ensure the stability and reliability of fund sources.
d) To strengthen liquidity risk management, the Bank has regulations requiring the daily execution
of risk management procedures and the monitoring of implementation to maintain sufficient liquidity.
e) The risk management units report the Bank’s liquidity position to the Asset/Liability
Management Committee monthly and report the Bank’s liquidity risk management to the Board of Directors regularly.
3) The liquidity risk analysis of the cash inflow and outflow of assets and liabilities held for liquidity
risk refers to the amounts of the obligations for the remaining maturity periods, i.e., from the reporting date to the contract maturity dates. The maturity analysis of financial assets and liabilities was as follows:
a) For maintaining solvency and meeting the needs of emergency assistance arrangements, the
Bank holds cash and high-quality, liquid interest-bearing assets. The assets held for liquidity risk management include cash and cash equivalents, due from Central Bank and call loans to other banks, financial assets at fair value through profit or loss, discounts and loans, available-for-sale financial assets, held-to-maturity financial assets, and debt instruments with no active market, etc.
b) The Bank disclosed the analysis of cash outflows from nonderivative financial liabilities by the
residual maturities as of the balance sheet dates. The amounts of cash outflows are based on contractual cash flows, so some amounts may not correspond to those that shown in the balance sheets. i. The maturity analysis of financial liabilities
December 31, 2017
Due in
One Month
Due Between after One
Month and Three Months
Due Between after Three
Months and Six Months
Due Between after Six
Months and One Year
Due after One Year Total
Call loans and due to banks $ 7,727,920 $ 193,320 $ 1,025,050 $ 15,000 $ - $ 8,961,290 Securities sold under repurchase
agreements 29,401,925 865,759 6,292 - - 30,273,976 Payables 5,145,607 1,093,734 559,327 186,882 20,136 7,005,686 Deposits and remittance 37,978,485 56,761,648 63,566,801 132,744,399 158,360,786 449,412,119 Bank debentures - - 2,000,000 - 9,700,000 11,700,000 Other liabilities 28,101 114 170 341 90,287 119,013
December 31, 2016
Due in
One Month
Due Between after One
Month and Three Months
Due Between after Three
Months and Six Months
Due Between after Six
Months and One Year
Due after One Year Total
Call loans and due to banks $ 5,194,014 $ 758,665 $ 1,036,650 $ 28,300 $ - $ 7,017,629 Securities sold under repurchase
agreements 28,239,364 589,823 44,950 - - 28,874,137 Payables 5,202,637 926,228 573,736 164,487 22,162 6,889,250 Deposits and remittance 38,197,460 46,204,095 52,523,343 108,635,052 186,502,874 432,062,824 Bank debentures - - - - 11,200,000 11,200,000 Other liabilities 29,531 384 577 1,153 87,727 119,372
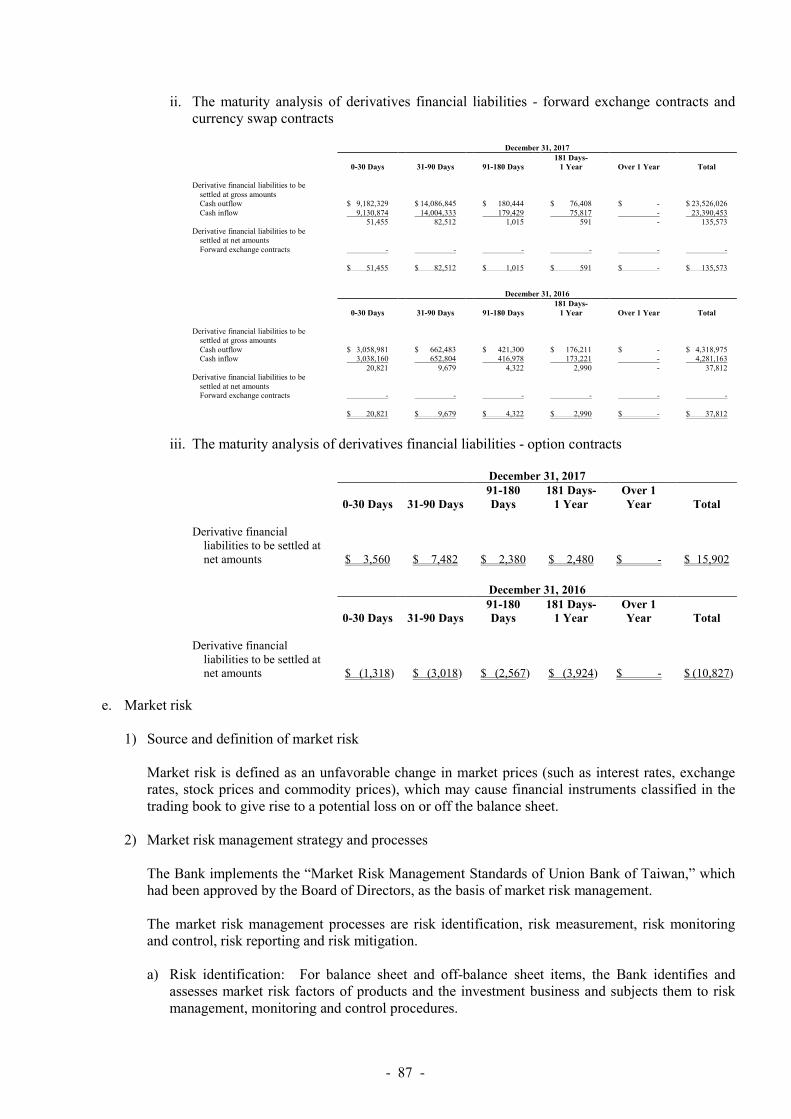
- 87 -
ii. The maturity analysis of derivatives financial liabilities - forward exchange contracts and currency swap contracts
December 31, 2017
0-30 Days 31-90 Days 91-180 Days 181 Days-
1 Year Over 1 Year Total Derivative financial liabilities to be
settled at gross amounts Cash outflow $ 9,182,329 $ 14,086,845 $ 180,444 $ 76,408 $ - $ 23,526,026 Cash inflow 9,130,874 14,004,333 179,429 75,817 - 23,390,453 51,455 82,512 1,015 591 - 135,573
Derivative financial liabilities to be settled at net amounts Forward exchange contracts - - - - - - $ 51,455 $ 82,512 $ 1,015 $ 591 $ - $ 135,573
December 31, 2016
0-30 Days 31-90 Days 91-180 Days 181 Days-
1 Year Over 1 Year Total Derivative financial liabilities to be
settled at gross amounts Cash outflow $ 3,058,981 $ 662,483 $ 421,300 $ 176,211 $ - $ 4,318,975 Cash inflow 3,038,160 652,804 416,978 173,221 - 4,281,163 20,821 9,679 4,322 2,990 - 37,812
Derivative financial liabilities to be settled at net amounts Forward exchange contracts - - - - - - $ 20,821 $ 9,679 $ 4,322 $ 2,990 $ - $ 37,812
iii. The maturity analysis of derivatives financial liabilities - option contracts
December 31, 2017
0-30 Days 31-90 Days 91-180 Days
181 Days- 1 Year
Over 1 Year Total
Derivative financial
liabilities to be settled at net amounts $ 3,560 $ 7,482 $ 2,380 $ 2,480 $ - $ 15,902
December 31, 2016
0-30 Days 31-90 Days 91-180 Days
181 Days- 1 Year
Over 1 Year Total
Derivative financial
liabilities to be settled at net amounts $ (1,318) $ (3,018) $ (2,567) $ (3,924) $ - $ (10,827)
e. Market risk
1) Source and definition of market risk Market risk is defined as an unfavorable change in market prices (such as interest rates, exchange rates, stock prices and commodity prices), which may cause financial instruments classified in the trading book to give rise to a potential loss on or off the balance sheet.
2) Market risk management strategy and processes The Bank implements the “Market Risk Management Standards of Union Bank of Taiwan,” which had been approved by the Board of Directors, as the basis of market risk management. The market risk management processes are risk identification, risk measurement, risk monitoring and control, risk reporting and risk mitigation. a) Risk identification: For balance sheet and off-balance sheet items, the Bank identifies and
assesses market risk factors of products and the investment business and subjects them to risk management, monitoring and control procedures.

- 88 -
b) Risk measurement: In principle, each investment or transaction has at least one risk measurement tool - such as sensitivity analysis, value at risk and stress testing, which can be applied to variables, such as fair market value and notional amounts, to quantify market risk.
c) Risk monitoring and control: Each operation unit observes the risk limit regulation stated in its
operating manual and regularly monitors risk control. The department of risk management is responsible for summarizing and reporting the Bank’s overall market risk monitoring.
d) Risk reporting: The risk management reports are classified as regular report, over-limit report
and exception report. Regular reports are the management statements sent to the appropriate level in accordance with certain requirements. Over-limit reports are about situations in which risk limits are exceeded. Exception reports contain operation units’ recommendations on how to meet temporary business needs.
e) Risk mitigation: An operation unit may take certain action to reduce risk, such as hedging,
investment combination adjustment, position adjustment, setting a break-even point, halting new transactions, etc.
3) Market risk management framework
a) The Board of Directors: The Board of Directors, the Bank’s top market risk supervisor,
reviews risk management policies, operational risk limits and the design and change of the credit risk management framework.
b) Asset/Liability Management Committee: The Asset/Liability Management Committee
inspects management reports or information provided by business units and the Risk Management Division.
c) Risk Management Division: The Risk Management Division is an independent unit in charge
of the work related to three pillars of Basel and of the development of market risk management tools to assess and control the risk identified through setting risk limits.
d) Operation units: Operation units perform daily market risk management work and report the
market risk of investment positions and related information to the authorities.
4) Market risk measurement, control and reporting a) The market risk of the trading book financial instruments is measured in accordance with the
fair market value or evaluation model and the profit and loss situation is evaluated regularly. b) The business units and the risk management division prepares management reports periodically
and report to the appropriate level. c) The market risk management system combines the evaluation of the front and middle offices to
generate information that will assist management in risk monitoring. Moreover, the system supports the capital accrual method being used by the Bank through generating internal and external reports for management’s decision, making.
5) Market risk measurement of trading book
The Bank assesses the market risk exposure of the trading book in conformity with an assessment model using publicly quoted market prices or other measurement methods, including interest rate sensitivity analysis (DV01 value) and stress tests. The interest rate sensitivity analysis (DV01 value) refers to changes in market interest by 1 basis point (0.01%); the abnormal stress test system deals with market volatility and involves the regular estimation of possible losses (stress loss) and of the impact of stress test scenarios on major asset portfolios and the Bank’s profit and loss.

- 89 -
6) Banking book market risk
a) Interest rate risk
The loans and deposits and other interest rate-related items in the Bank’s balance sheet, including interest rate sensitive assets and interest rate sensitive liabilities, are measured from the viewpoint of earnings because there is a risk of decrease in earnings due to adverse changes in interest rates for loans and deposits. The earnings viewpoint mainly emphasizes the impact of interest rates on earnings, especially short-term earnings. For 2017 and 2016, assuming all market risk indicators, except interest rates, remained constant, an interest rate increase or decrease by 100bps would result in an increase or decrease in profit before tax by $393,900 thousand and $(98,890) thousand, respectively.
b) Exchange rate risk The exchange rate risk of the banking book refers to the business operation of the International Banking Department of the Bank’s Head Office and the operating funds in foreign currencies required by the ROC or local regulations; if there are adverse exchange rate changes, the income statement or cumulative translation adjustments in equity would be negatively affected. The International Banking Department (IBD) of the Bank’s Head Office is a going concern, and its operating funds are foreign currencies for business needs. However, the exchange rate risk on these funds is not significant because the percentage of the operating funds to the Bank’s total assets is small, as shown by the immaterial ratio of the IBD’s cumulative translation adjustment to the Banks’ net worth.
7) Foreign currency rate risk information The information on significant foreign financial assets and liabilities is as follows:
Unit: Each Foreign Currency (Thousands)/NT$(Thousands)
December 31, 2017
Foreign
Currencies Exchange
Rate New Taiwan
Dollars Financial assets USD $ 2,600,794 32.279 $ 83,951,022 JPY 4,425,352 0.2757 1,220,070 GBP 2,149 39.6192 85,123 AUD 117,932 23.3087 2,748,838 HKD 125,055 4.1622 520,509 CAD 15,701 23.9281 375,698 CNY 468,192 4.6219 2,163,913 SGD 2,547 22.3075 56,808 ZAR 740,320 2.6379 1,952,854 CHF 1,229 31.5533 38,774 THB 507 0.9011 456 NZD 23,878 7.1955 171,814 EUR 26,141 33.9091 886,431
(Continued)

- 90 -
December 31, 2017
Foreign
Currencies Exchange
Rate New Taiwan
Dollars Financial liabilities USD $ 2,367,763 29.848 $ 70,672,999 JPY 6,990,969 0.2650 1,852,341 GBP 5,479 40.2053 220,266 AUD 131,390 23.2635 3,056,585 HKD 190,889 3.8189 728,991 CAD 15,163 23.7795 360,568 CNY 719,522 4.5790 3,294,719 SGD 1,445 22.3246 32,255 ZAR 853,645 2.4191 2,065,015 CHF 1,650 30.5507 50,402 THB 89 0.9153 81 NZD 26,955 21.2010 571,476 EUR 46,206 35.6773 1,648,507
(Concluded)
December 31, 2016
Foreign
Currencies Exchange
Rate New Taiwan
Dollars Financial assets
USD $ 2,809,313 29.848 $ 83,852,383 JPY 4,740,622 0.2650 1,256,085 GBP 1,409 40.2053 56,652 AUD 128,377 23.2635 2,986,498 HKD 190,976 3.8189 729,325 CAD 15,168 23.7795 360,685 CNY 706,005 4.5790 3,232,822 SGD 1,507 22.3246 33,654 ZAR 853,238 2.4191 2,064,030 CHF 1,687 30.5507 51,529 THB 331 0.9153 303 NZD 26,935 21.2010 571,041 EUR 32,026 35.6773 1,142,605 Financial liabilities USD 2,179,910 32.279 70,365,313 JPY 7,577,941 0.2757 2,089,238 GBP 7,184 39.6192 284,610 AUD 117,806 23.3087 2,745,893 HKD 125,660 4.1622 523,027 CAD 15,758 23.9281 377,068 CNY 471,818 4.6219 2,180,670 SGD 2,611 22.3075 58,234 ZAR 739,785 2.6379 1,951,442 CHF 1,234 31.5533 38,941 NZD 23,918 7.1955 172,103 EUR 37,181 33.9091 1,206,766

- 91 -
f. Transfers of financial assets.
Most of the transferred financial assets of the Bank that are not derecognized in their entirety are securities sold under repurchase agreements. According to these transactions, the right on cash flow of the transferred financial assets would be transferred to other entities and the associated liabilities of the Bank’s obligation to repurchase the transferred financial assets at a fixed price in the future would be recognized. As the Bank is restricted to use, sell or pledge the transferred financial assets throughout the term of transaction, and is still exposed to interest rate risks and credit risks on these instruments, the transferred financial assets are not derecognized in their entirety. The details of financial assets that are not derecognized in their entirety and the associated financial liabilities are as following:
December 31, 2017
Category of Financial Assets
Carrying Amount of
Transferred Financial
Asset
Carrying Amount of Associated Financial Liability
Fair Value of Transferred
Financial Asset
Fair Value of Associated Financial Liability
Fair Value of Net Position
Financial instruments at fair value through profit or loss Securities sold under
repurchase agreements $ 8,552,033 $ 8,557,700 $ 8,552,033 $ 8,557,700 $ (5,667) Available-for-sale financial
assets Securities sold under
repurchase agreements 10,837,361 9,673,967 10,837,361 9,673,967 1,163,394 Debt instruments with no
active market Securities sold under
repurchase agreements 15,415,779 12,042,309 15,716,202 12,042,309 3,673,893
December 31, 2016
Category of Financial Assets
Carrying Amount of
Transferred Financial
Asset
Carrying Amount of Associated Financial Liability
Fair Value of Transferred
Financial Asset
Fair Value of Associated Financial Liability
Fair Value of Net Position
Financial instruments at fair value through profit or loss Securities sold under
repurchase agreements $ 7,054,785 $ 7,073,524 $ 7,054,785 $ 7,073,524 $ (18,739) Available-for-sale financial
assets Securities sold under
repurchase agreements 14,636,448 13,634,152 14,636,448 13,634,152 1,002,296 Debt instruments with no
active market Securities sold under
repurchase agreements 10,163,828 8,166,461 10,438,839 8,166,461 2,272,378
g. Offsetting financial assets and financial liabilities.
The Bank is eligible to present certain derivative assets and derivative liabilities on a net basis on the balance sheet since the offsetting criteria are met. Cash collateral has also been paid by part of counterparties for the net amount of the derivative assets and derivative liabilities. The cash collateral does not meet the offsetting criteria, but it can be set off against the net amount of the derivative assets and derivative liabilities in the case of default and insolvency or bankruptcy, in accordance with an associated collateral arrangement.

- 92 -
The tables below present the quantitative information on financial assets and financial liabilities that have been offset in the balance sheet or that are covered by enforceable master netting arrangements or similar agreements.
December 31, 2017
Financial Assets
Gross Amount of Recognized
Financial Asset (a)
Gross Amount of Recognized
Financial Assets Offset in the
Balance Sheet (b)
Net Amount of Financial Assets Presented in the Balance Sheet
(c)=(a)-(b)
Related Amount Not Offset in the Balance Sheet (d)
Net Amount (e)=(c)-(d) Financial
Instrument Cash Collateral
Pledged
Derivatives $ 537,334 $ - $ 537,334 $ 158,636 $ - $ 378,698
December 31, 2017
Financial Liabilities
Gross Amount of Recognized Financial
Liabilities (a)
Gross Amount of Recognized Financial
Liabilities Offset in the Balance
Sheet (b)
Net Amount of Financial Liabilities
Presented in the Balance Sheet
(c)=(a)-(b)
Related Amount Not Offset in the Balance Sheet (d)
Net Amount (e)=(c)-(d) Financial
instrument Cash Collateral
Pledged
Derivatives $ 183,611 $ - $ 183,611 $ 49,868 $ - $ 133,743
December 31, 2016
Financial Assets
Gross Amount of Recognized
Financial Asset (a)
Gross Amount of Recognized
Financial Assets Offset in the
Balance Sheet (b)
Net Amount of Financial Assets Presented in the Balance Sheet
(c)=(a)-(b)
Related Amount Not Offset in the Balance Sheet (d)
Net Amount (e)=(c)-(d) Financial
Instrument Cash Collateral
Pledged
Derivatives $ 442,642 $ - $ 442,642 $ 6,187 $ - $ 436,455
December 31, 2016
Financial Liabilities
Gross Amount of Recognized Financial
Liabilities (a)
Gross Amount of Recognized Financial
Liabilities Offset in the Balance
Sheet (b)
Net Amount of Financial Liabilities
Presented in the Balance Sheet
(c)=(a)-(b)
Related Amount Not Offset in the Balance Sheet (d)
Net Amount (e)=(c)-(d) Financial
instrument Cash Collateral
Pledged
Derivatives $ 38,430 $ - $ 38,430 $ 1,639 $ - $ 36,791
46. CAPITAL MANAGEMENT
a. Strategies to maintain capital adequacy
Under the regulations set by the authorities, the Bank complies with the requirements set each year for the minimum consolidated capital adequacy ratios, including the common equity Tier I capital ratio; the Bank’s leverage ratio is also in accordance with the requirements of the relevant authorities. These ratios are applied in accordance with the regulations announced by the authorities.
b. Capital assessment program The capital ratios and leverage ratios are applied, analyzed, monitored and reported regularly, and are assigned to each business unit as the target capital adequacy ratios. The business units’ compliance with the ratio requirements is tracked regularly, and remedial action is taken if the capital and leverage ratio requirements are not met.
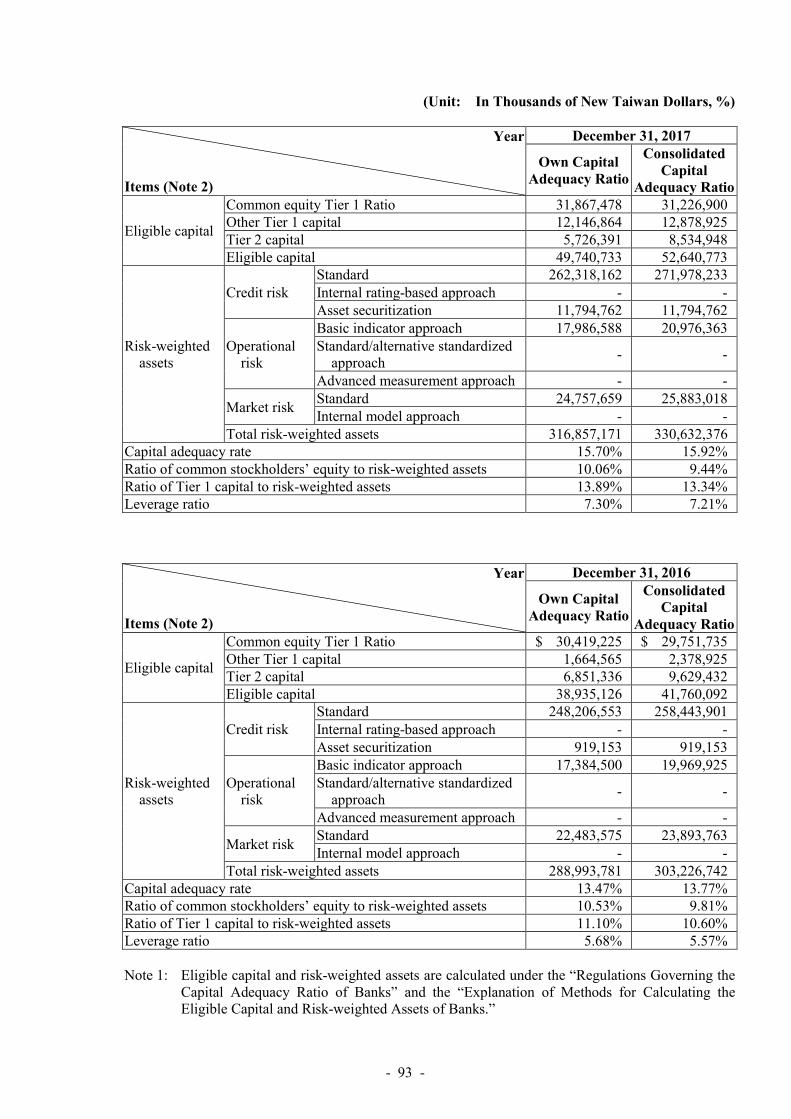
- 93 -
(Unit: In Thousands of New Taiwan Dollars, %)
Year
Items (Note 2)
December 31, 2017
Own Capital Adequacy Ratio
Consolidated Capital
Adequacy Ratio
Eligible capital
Common equity Tier 1 Ratio 31,867,478 31,226,900 Other Tier 1 capital 12,146,864 12,878,925 Tier 2 capital 5,726,391 8,534,948 Eligible capital 49,740,733 52,640,773
Risk-weighted assets
Credit risk Standard 262,318,162 271,978,233 Internal rating-based approach - - Asset securitization 11,794,762 11,794,762
Operational risk
Basic indicator approach 17,986,588 20,976,363 Standard/alternative standardized
approach - -
Advanced measurement approach - -
Market risk Standard 24,757,659 25,883,018 Internal model approach - -
Total risk-weighted assets 316,857,171 330,632,376 Capital adequacy rate 15.70% 15.92% Ratio of common stockholders’ equity to risk-weighted assets 10.06% 9.44% Ratio of Tier 1 capital to risk-weighted assets 13.89% 13.34% Leverage ratio 7.30% 7.21%
Year
Items (Note 2)
December 31, 2016
Own Capital Adequacy Ratio
Consolidated Capital
Adequacy Ratio
Eligible capital
Common equity Tier 1 Ratio $ 30,419,225 $ 29,751,735 Other Tier 1 capital 1,664,565 2,378,925 Tier 2 capital 6,851,336 9,629,432 Eligible capital 38,935,126 41,760,092
Risk-weighted assets
Credit risk Standard 248,206,553 258,443,901 Internal rating-based approach - - Asset securitization 919,153 919,153
Operational risk
Basic indicator approach 17,384,500 19,969,925 Standard/alternative standardized
approach - -
Advanced measurement approach - -
Market risk Standard 22,483,575 23,893,763 Internal model approach - -
Total risk-weighted assets 288,993,781 303,226,742 Capital adequacy rate 13.47% 13.77% Ratio of common stockholders’ equity to risk-weighted assets 10.53% 9.81% Ratio of Tier 1 capital to risk-weighted assets 11.10% 10.60% Leverage ratio 5.68% 5.57% Note 1: Eligible capital and risk-weighted assets are calculated under the “Regulations Governing the
Capital Adequacy Ratio of Banks” and the “Explanation of Methods for Calculating the Eligible Capital and Risk-weighted Assets of Banks.”
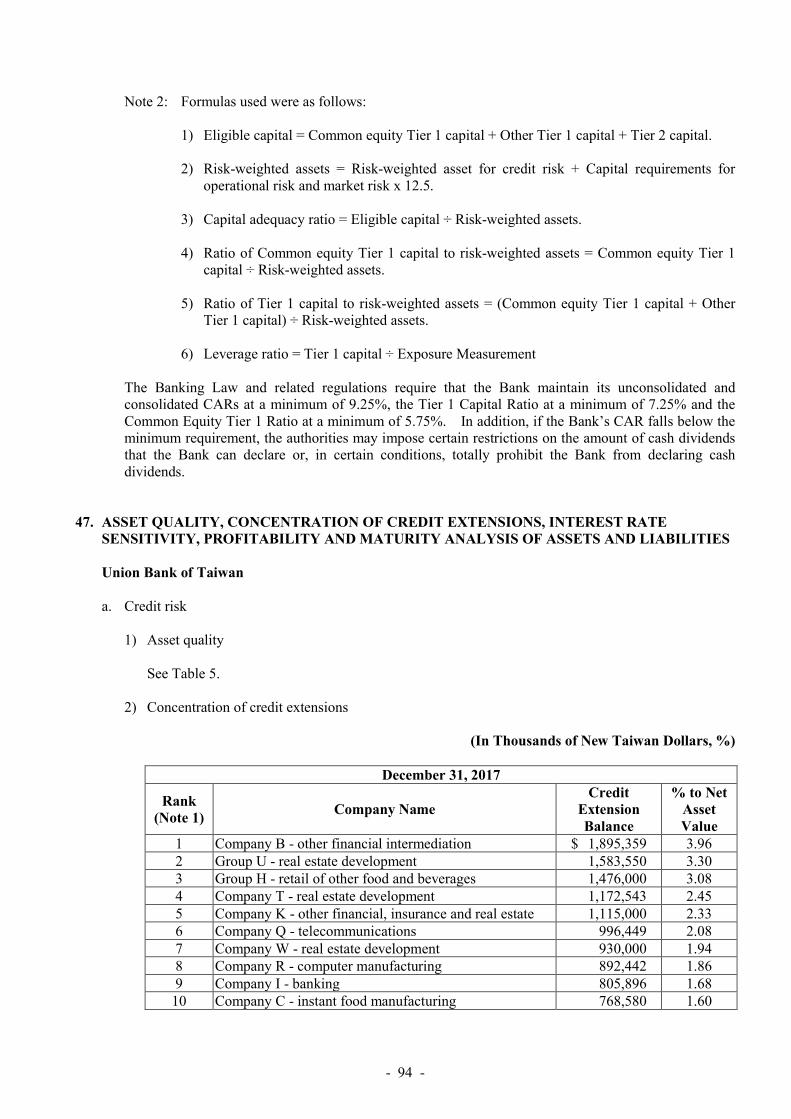
- 94 -
Note 2: Formulas used were as follows:
1) Eligible capital = Common equity Tier 1 capital + Other Tier 1 capital + Tier 2 capital. 2) Risk-weighted assets = Risk-weighted asset for credit risk + Capital requirements for
operational risk and market risk x 12.5. 3) Capital adequacy ratio = Eligible capital ÷ Risk-weighted assets. 4) Ratio of Common equity Tier 1 capital to risk-weighted assets = Common equity Tier 1
capital ÷ Risk-weighted assets. 5) Ratio of Tier 1 capital to risk-weighted assets = (Common equity Tier 1 capital + Other
Tier 1 capital) ÷ Risk-weighted assets. 6) Leverage ratio = Tier 1 capital ÷ Exposure Measurement
The Banking Law and related regulations require that the Bank maintain its unconsolidated and consolidated CARs at a minimum of 9.25%, the Tier 1 Capital Ratio at a minimum of 7.25% and the Common Equity Tier 1 Ratio at a minimum of 5.75%. In addition, if the Bank’s CAR falls below the minimum requirement, the authorities may impose certain restrictions on the amount of cash dividends that the Bank can declare or, in certain conditions, totally prohibit the Bank from declaring cash dividends.
47. ASSET QUALITY, CONCENTRATION OF CREDIT EXTENSIONS, INTEREST RATE
SENSITIVITY, PROFITABILITY AND MATURITY ANALYSIS OF ASSETS AND LIABILITIES Union Bank of Taiwan a. Credit risk
1) Asset quality
See Table 5. 2) Concentration of credit extensions
(In Thousands of New Taiwan Dollars, %)
December 31, 2017
Rank (Note 1)
Company Name Credit
Extension Balance
% to Net Asset Value
1 Company B - other financial intermediation $ 1,895,359 3.96 2 Group U - real estate development 1,583,550 3.30 3 Group H - retail of other food and beverages 1,476,000 3.08 4 Company T - real estate development 1,172,543 2.45 5 Company K - other financial, insurance and real estate 1,115,000 2.33 6 Company Q - telecommunications 996,449 2.08 7 Company W - real estate development 930,000 1.94 8 Company R - computer manufacturing 892,442 1.86 9 Company I - banking 805,896 1.68 10 Company C - instant food manufacturing 768,580 1.60

- 95 -
December 31, 2016
Rank (Note 1)
Company Name Credit
Extension Balance
% to Net Asset Value
1 Group U - real estate development $ 1,728,080 4.81 2 Company B - other financial intermediation 1,623,773 4.52 3 Company V - other telecommunications market 1,499,844 4.17 4 Group D - real estate development 1,495,115 4.16 5 Group H - retail of other food and beverages 1,248,800 3.47 6 Company T - real estate development 891,380 2.48 7 Company O - financial intermediation 865,000 2.41 8 Company T - real estate development 708,000 1.97 9 Group F - manufacture of chemical material 630,185 1.75 10 Company P - renting and leasing of other transport
equipment 618,000 1.72
b. Market risk
Interest Rate Sensitivity
December 31, 2017
(In Thousands of New Taiwan Dollars, %)
Items 1 to 90 Days 91 to 180 Days 181 Days to One Year
Over One Year Total
Interest rate-sensitive assets $ 376,966,538 $ 9,601,587 $ 11,136,138 $ 38,825,399 $ 436,529,662 Interest rate-sensitive liabilities 197,693,904 153,613,569 58,382,557 19,977,717 429,667,747 Interest rate-sensitive gap 179,272,634 (144,011,982) (47,246,419) 18,847,682 6,861,915 Net worth 47,621,711 Ratio of interest rate-sensitive assets to liabilities 101.60% Ratio of interest rate sensitivity gap to net worth 14.41%
December 31, 2016
(In Thousands of New Taiwan Dollars, %)
Items 1 to 90 Days 91 to 180 Days 181 Days to One Year
Over One Year Total
Interest rate-sensitive assets $ 303,648,998 $ 13,621,567 $ 16,719,210 $ 65,246,623 $ 399,236,398 Interest rate-sensitive liabilities 163,766,946 148,972,674 66,453,129 20,884,794 400,077,543 Interest rate-sensitive gap 139,882,052 (135,351,107) (49,733,919) 44,361,829 (841,145) Net worth 36,171,130 Ratio of interest rate-sensitive assets to liabilities 99.79% Ratio of interest rate sensitivity gap to net worth (2.33%)
Note 1: The above amounts included only New Taiwan dollar amounts held by the Bank’s Head
Office and branches (i.e., excluding foreign currency). Note 2: Interest rate-sensitive assets and liabilities mean the revenues or costs of interest-earning
assets and interest-bearing liabilities are affected by interest rate changes. Note 3: Interest rate sensitivity gap = Interest rate-sensitive assets - Interest rate-sensitive liabilities. Note 4: Ratio of interest rate-sensitive assets to liabilities = Interest rate-sensitive assets ÷ Interest
rate-sensitive liabilities (in New Taiwan dollars).

- 96 -
Interest Rate Sensitivity December 31, 2017
(In Thousands of U.S. Dollars, %)
Items 1 to 90 Days 91 to 180 Days 181 Days to One Year
Over One Year Total
Interest rate-sensitive assets $ 727,760 $ 144,129 $ 512,407 $ 1,667,860 $ 3,052,156 Interest rate-sensitive liabilities 1,226,308 300,065 475,541 352,259 2,354,173 Interest rate-sensitive gap (498,548) (155,936) 36,866 1,315,601 697,983 Net worth 49,704 Ratio of interest rate-sensitive assets to liabilities 129.65% Ratio of interest rate sensitivity gap to net worth 1,404.28%
December 31, 2016
(In Thousands of U.S. Dollars, %)
Items 1 to 90 Days 91 to 180 Days 181 Days to One Year
Over One Year Total
Interest rate-sensitive assets $ 89,734 $ 53,035 $ 118,086 $ 2,290,955 $ 2,551,810 Interest rate-sensitive liabilities 978,992 248,275 376,550 337,223 1,941,040 Interest rate-sensitive gap (889,258) (195,240) (258,464) 1,953,732 610,770 Net worth 33,054 Ratio of interest rate-sensitive assets to liabilities 131.47% Ratio of interest rate sensitivity gap to net worth 1,847.79%
Note 1: The above amounts included only U.S. dollar amounts held by the Bank’s Head Office,
domestic branches, OBU and overseas branches and excluded contingent assets and contingent liabilities.
Note 2: Interest rate-sensitive assets and liabilities mean the revenues or costs of interest-earning
assets and interest-bearing liabilities are affected by interest rate changes. Note 3: Interest rate sensitivity gap = Interest rate-sensitive assets - Interest rate-sensitive liabilities. Note 4: Ratio of interest rate-sensitive assets to liabilities = Interest rate-sensitive assets ÷ Interest
rate-sensitive liabilities (in U.S. dollars)
c. Liquidity risk
1) Profitability
(%)
Items
For the Year Ended
December 31, 2017
For the Year Ended
December 31, 2017
Return on total assets Before income tax 0.61 0.63 After income tax 0.51 0.51
Return on equity Before income tax 7.90 9.11 After income tax 6.55 7.44
Net income ratio 26.68 26.61 Note 1: Return on total assets = Income before (after) income tax ÷ Average total assets Note 2: Return on equity = Income before (after) income tax ÷ Average equity Note 3: Net income ratio = Income after income tax ÷ Total net revenues
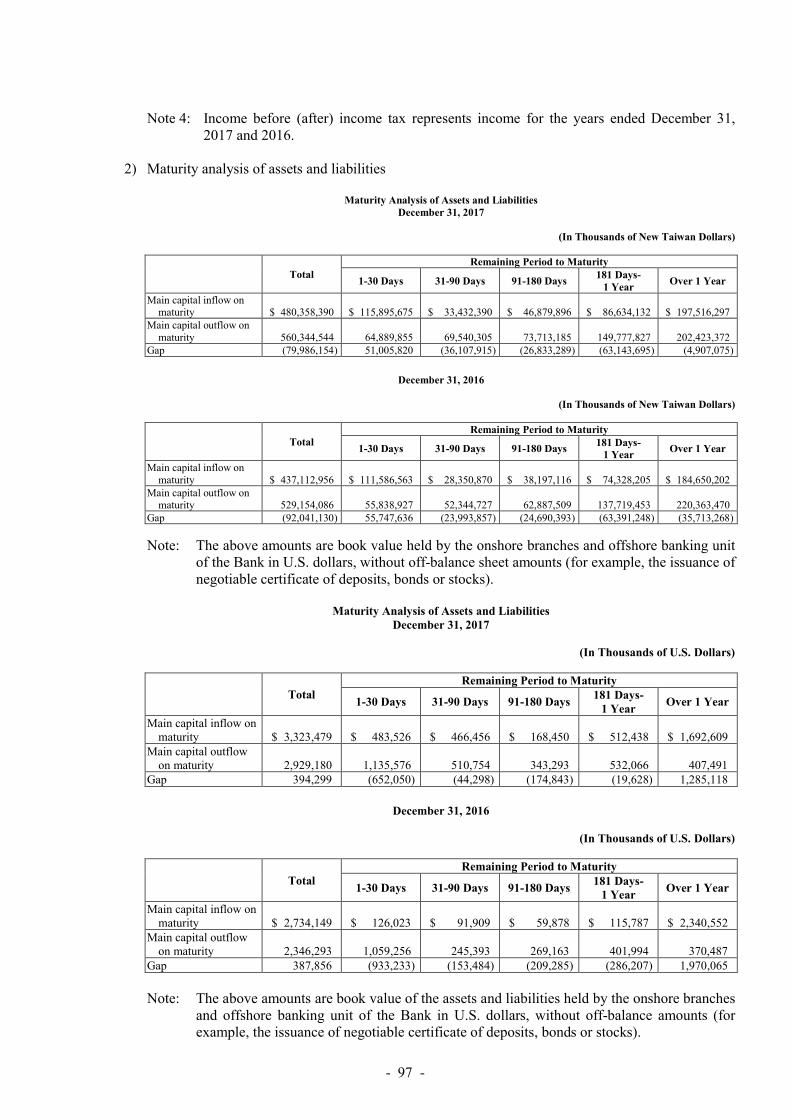
- 97 -
Note 4: Income before (after) income tax represents income for the years ended December 31,
2017 and 2016. 2) Maturity analysis of assets and liabilities
Maturity Analysis of Assets and Liabilities
December 31, 2017
(In Thousands of New Taiwan Dollars)
Total Remaining Period to Maturity
1-30 Days 31-90 Days 91-180 Days 181 Days-
1 Year Over 1 Year
Main capital inflow on maturity $ 480,358,390 $ 115,895,675 $ 33,432,390 $ 46,879,896 $ 86,634,132 $ 197,516,297
Main capital outflow on maturity 560,344,544 64,889,855 69,540,305 73,713,185 149,777,827 202,423,372
Gap (79,986,154 ) 51,005,820 (36,107,915 ) (26,833,289 ) (63,143,695 ) (4,907,075 )
December 31, 2016
(In Thousands of New Taiwan Dollars)
Total Remaining Period to Maturity
1-30 Days 31-90 Days 91-180 Days 181 Days-
1 Year Over 1 Year
Main capital inflow on maturity $ 437,112,956 $ 111,586,563 $ 28,350,870 $ 38,197,116 $ 74,328,205 $ 184,650,202
Main capital outflow on maturity 529,154,086 55,838,927 52,344,727 62,887,509 137,719,453 220,363,470
Gap (92,041,130 ) 55,747,636 (23,993,857 ) (24,690,393 ) (63,391,248 ) (35,713,268 )
Note: The above amounts are book value held by the onshore branches and offshore banking unit of the Bank in U.S. dollars, without off-balance sheet amounts (for example, the issuance of negotiable certificate of deposits, bonds or stocks).
Maturity Analysis of Assets and Liabilities
December 31, 2017
(In Thousands of U.S. Dollars)
Total Remaining Period to Maturity
1-30 Days 31-90 Days 91-180 Days 181 Days-
1 Year Over 1 Year
Main capital inflow on maturity $ 3,323,479 $ 483,526 $ 466,456 $ 168,450 $ 512,438 $ 1,692,609
Main capital outflow on maturity 2,929,180 1,135,576 510,754 343,293 532,066 407,491
Gap 394,299 (652,050) (44,298) (174,843) (19,628) 1,285,118
December 31, 2016
(In Thousands of U.S. Dollars)
Total Remaining Period to Maturity
1-30 Days 31-90 Days 91-180 Days 181 Days-
1 Year Over 1 Year
Main capital inflow on maturity $ 2,734,149 $ 126,023 $ 91,909 $ 59,878 $ 115,787 $ 2,340,552
Main capital outflow on maturity 2,346,293 1,059,256 245,393 269,163 401,994 370,487
Gap 387,856 (933,233) (153,484) (209,285) (286,207) 1,970,065
Note: The above amounts are book value of the assets and liabilities held by the onshore branches
and offshore banking unit of the Bank in U.S. dollars, without off-balance amounts (for example, the issuance of negotiable certificate of deposits, bonds or stocks).

- 98 -
48. ADDITIONAL DISCLOSURES
Following are the additional disclosures required by the Securities and Futures Bureau for the Bank and its investees: a. Related information of significant transactions and investees and (b) proportionate share in investees:
1) Financing provided to other parties: The Bank - not applicable; investee - Table 1 (attached) 2) Endorsement/guarantee provided: The Bank - not applicable; investee: None 3) Marketable securities held: The Bank - not applicable; investee - Table 2 (attached) 4) Marketable securities acquired and disposed of at costs or prices of at least $300 million or 10% of
the paid-in capital: None 5) Acquisition of individual real estate at costs of at least $300 million or 10% of the paid-in capital:
Table 3 (attached) 6) Disposal of individual real estate at costs of at least $300 million or 10% of the paid-in capital:
None 7) Allowance of service fees to related parties amounting to at least $5 million: None 8) Receivables from related parties amounting to at least $300 million or 10% of the paid-in capital:
Table 4 (attached) 9) Sale of nonperforming loans: None 10) Asset securitization under the “Regulations for Financial Asset Securitization”: None 11) Other significant transactions which may affect the decisions of users of financial reports: Table 5
(attached) 12) Names, locations and other information of investees on which the Bank exercises significant
influence: Table 6 (attached) 13) Derivative transactions: Note 8
b. Investment in Mainland China: None 49. INFORMATION SEGMENTS
The Bank has disclosed the segment information in the consolidated financial statements. Thus, no segment information is presented herein.

- 99 -
TABLE 1
UNION BANK OF TAIWAN FINANCING PROVIDED TO OTHERS FOR THE YEAR ENDED DECEMBER 31, 2017 (In Thousands of New Taiwan Dollars, Unless Stated Otherwise)
No. Lender Borrower Financial
Statement Account Highest Balance for the Period
Ending Balance Actual
Borrowing Amount
Interest Rate (%)
Nature of Financing Business
Transaction Amount
Reason for Short-term Financing
Allowance for Impairment
Loss
Collateral Financing Limit for Each
Borrower
Aggregate Financing Limit Item Value
1 Union Financial and Leasing
International Corporation Union Capital (Cayman) Corp. Affiliates of receivable $ 2,119,696
( JPY 8,000,000 ) $ 2,119,696 ( JPY 8,000,000 )
$ 1,716,636 ( JPY 5,639,163 ) ( US$ 7,453 )
1.50 Business transaction $ 2,119,696 ( JPY 8,000,000 )
- $ - - $ - $ 2,664,239 $ 2,664,239
2 Union Capital (Cayman) Corp. Union Capital (Singapore)
Holding Pte. Ltd. Affiliates of receivable 980,359
( JPY 3,700,000 ) 980,359 ( JPY 3,700,000 )
709,363 ( JPY 2,677,225 )
1.50 Business transaction 980,359 ( JPY 3,700,000 )
- - - - 2,664,239 2,664,239
Uflc Capital (Singapore) Holding Pte. Ltd.
Affiliates of receivable 1,722,253 ( JPY 6,500,000 )
1,722,253 ( JPY 6,500,000 )
1,464,978 ( JPY 5,523,808 ) ( US$ 46 )
1.50 Business transaction 1,722,253 ( JPY 6,500,000 )
- - - - 2,664,239 2,664,239
3 Union Capital (Singapore)
Holding Pte. Ltd. Kabushiki Kaisha UCJ1 (Japan) Affiliates of receivable 503,428
( JPY 1,900,000 ) 503,428 ( JPY 1,900,000 )
388,398 ( JPY 1,465,865 )
2.75 Business transaction 503,428 ( JPY 1,900,000 )
- - - - 2,664,239 2,664,239
4 Uflc Capital (Singapore) Holding
PTE. Ltd. Kabushiki Kaisha UCJ1 (Japan) Affiliates of receivable 874,375
( JPY 3,300,000 ) 874,375 ( JPY 3,300,000 )
596,907 ( JPY 2,252,804 )
2.75 Business transaction 874,375 ( JPY 3,300,000 )
- - - - 2,664,239 2,664,239

- 100 -
TABLE 2
UNION BANK OF TAIWAN ENDORSEMENTS/GUARANTEES PROVIDED FOR THE YEAR ENDED DECEMBER 31, 2017 (In Thousands of New Taiwan Dollars, Unless Stated Otherwise)
No. Endorser/Guarantor
Endorsee/Guarantee
Limits on Endorsement/
Guarantee Given on Behalf of Each Party
Maximum Amount
Endorsed/ Guaranteed During the
Period
Outstanding Endorsement/
Guarantee at the End of the
Period
Actual Borrowing
Amount
Amount Endorsed/
Guaranteed by Collateral
Ratio of Accumulated Endorsement/ Guarantee to Net Equity in
Latest Financial Statements
(%)
Aggregate Endorsement/
Guarantee Limit
Endorsement/ Guarantee Given
by Parent on Behalf of
Subsidiaries
Endorsement/ Guarantee Given by Subsidiaries
on Behalf of Parent
Endorsement/ Guarantee Given
on Behalf of Companies in
Mainland China
Note Name Relationship
1 Union Financial and Leasing
International Corporation Union Capital (Cayman) Corp. Union Financial and Leasing
International Corporation and subsidiaries
$ 2,664,239 $ 746,200 (US$ 25,000)
$ 746,200 (US$ 25,000)
$ - $ - 28.01 $ 2,664,239 Yes No No

- 101 -
TABLE 3
UNION BANK OF TAIWAN MARKETABLE SECURITIES HELD DECEMBER 31, 2017 (In Thousands of New Taiwan Dollars and Foreign Currency, Unless Stated Otherwise)
Holding Company Type and Issuer/
Name of Marketable Security
Issuer’s Relationship with Holding
Company
Financial Statement Account
December 31, 2017
Note Shares/Piece/
Units (In Thousands)
Carrying Value
Percentage of
Ownership (%)
Market Value or Net Asset
Value
Union Finance and Leasing International Stock Corporation Masterlink Securities Corporation. - Available-for-sale financial assets 931 $ 8,101 0.06 $ 8,101 Note 4 China Chemical Corporation - Available-for-sale financial assets 356 6,646 0.12 6,646 Note 4 Hey-Song Corporation - Available-for-sale financial assets 4,551 143,129 1.13 143,129 Note 4 Union Capital (Cayman) Corp. Subsidiary Equity investment - equity method 50 517,572 100.00 517,572 Note 1 New Asian Ventures Ltd. Subsidiary Equity investment - equity method - 85,652 100.00 85,652 Note 1 ERA Communications Co., Ltd. - Unquoted equity instruments 425 1,415 0.33 1,415 Note 1 Beneficial certificates Union Advantage Global FI Portfolio Fund - Available-for-sale financial assets 6,614 100,088 100,088 Note 4 Union Golden Balance Fund - Available-for-sale financial assets 854 19,603 19,603 Note 4 Union Information Technology Corporation Stock ELTA Technology Co., Ltd. - Unquoted equity instruments 2,646 23,411 14.70 29,319 Note 3 Union Securities Investment Trust Stock Corporation (USITC) Fundrish Securities Co., Ltd. - Unquoted equity instruments 566 7,235 0.94 6,534 Note 2 Beneficial certificates Union Advantage Global FI Portfolio Fund - Financial assets at fair value through profit or loss 1,068 17,478 17,478 Note 4 Union Emerging Asia Bond A - Financial assets at fair value through profit or loss 486 5,539 5,539 Note 4 Union Money Market - Financial assets at fair value through profit or loss 1,230 16,154 16,154 Note 4 Union Golden Balance Fund - Financial assets at fair value through profit or loss 575 13,215 13,215 Note 4 Union Emerg Res-rich Countries HYBd A - Financial assets at fair value through profit or loss 800 8,894 8,894 Note 4 Union China - Financial assets at fair value through profit or loss 1,006 24,919 24,919 Note 4 Union Technology Fund - Financial assets at fair value through profit or loss 1,460 18,266 18,266 Note 4 Union APEC Balanced A - Financial assets at fair value through profit or loss 1,001 12,326 12,326 Note 4 Union Global ETF Fund - Financial assets at fair value through profit or loss 513 5,403 5,403 Note 4 Union Asian High Yield Bond A Financial assets at fair value through profit or loss 1,451 15,194 15,194 Note 4 Union Finance International (HK) Limited Bond HBOS Capital Funding LP - Available-for-sale financial assets 900 units US$ 917 US$ 917 Note 4
(Continued)

- 102 -
Holding Company Type and Issuer/
Name of Marketable Security
Issuer’s Relationship with Holding
Company
Financial Statement Account
December 31, 2017
Note Shares/Piece/
Units (In Thousands)
Carrying Value
Percentage of
Ownership (%)
Market Value or Net Asset
Value
Stock Apple Computer Inc. - Financial assets at fair value through profit or loss 17 US$ 2,945 US$ 2,945 Note 4 Merck & Co., Inc. - Financial assets at fair value through profit or loss 12 US$ 658 US$ 658 Note 4 EBAY Inc. - Financial assets at fair value through profit or loss 14 US$ 516 US$ 516 Note 4 Obsidian - Financial assets at fair value through profit or loss 119 US$ 148 US$ 148 Note 4 Qualcomm - Financial assets at fair value through profit or loss 5 US$ 320 US$ 320 Note 4 AT&T - Financial assets at fair value through profit or loss 10 US$ 389 US$ 389 Note 4 WMI Holdings - Financial assets at fair value through profit or loss 18 US$ 15 US$ 15 Note 4 New Asian Ventures Ltd. Stock Grace T.H.W. Holding Limited - Unquoted equity instruments 1,667 $ 64,320 0.81 US$ 2,714 Note 2 Union Capital (Cayman) Corp. Union Capital (Singapore) Holding Pte. Ltd. Subsidiary Equity investment - equity method - JPY 58,927 100.00 JPY 58,927 Note 5 Uflc Capital (Singapore) Holding Pte. Ltd. Subsidiary Equity investment - equity method - JPY 66,975 100.00 JPY 66,975 Note 5 Union Capital (Singapore) Holding Pte. Ltd. Kabushiki Kaisha UCJ1 Subsidiary Equity investment - equity method 9 JPY 470,173 30.55 JPY 470,173 Note 5 Tokutei Mokuteki Kaisha SSG15 Subsidiary Equity investment - equity method Note 7 JPY 700,750 49.00 JPY 700,750 Note 5 Kabushiki Kaisha UCJ1 Tokutei Mokuteki Kaisha SSG15 Subsidiary Equity investment - equity method Preferred stock
15 JPY 729,300 51.00 JPY 729,300 Note 5
Tokutei Mokuteki Kaisha SSG12 Subsidiary Equity investment - equity method Note 9 JPY 1,013,159 51.00 JPY 1,013,159 Note 5 Tokutei Mokuteki Kaisha SSG16 Subsidiary Equity investment - equity method Preferred stock
26 JPY 1,290,300 51.00 JPY 1,290,300 Note 5
Uflc Capital (Singapore) Holding Pte. Ltd. Kabushiki Kaisha UCJ1 Subsidiary Equity investment - equity method 21 JPY 1,068,923 69.45 JPY 1,068,923 Note 5 Tokutei Mokuteki Kaisha SSG12 Subsidiary Equity investment - equity method Note 8 JPY 973,477 49.00 JPY 973,477 Note 5 Tokutei Mokuteki Kaisha SSG16 Subsidiary Equity investment - equity method Note 6 JPY 1,239,750 49.00 JPY 1,239,750 Note 5 The Bank’s investees had investments in companies with shares having no quoted market prices. The net asset values of these companies were based on the following: Note 1: Union Finance and Leasing International Corporation:
a. ERA Communications Co., Ltd. - the audited statements of stockholders’ equity as of December 31, 2016. b. New Asian Ventures Ltd. and Union Capital (Cayman) Corp. - the audited statements of stockholders’ equity as of December 31, 2017.
Note 2: Union Securities Investment Trust Corporation (USITC):
Fundrish Securities Co., Ltd. - the audited statements of stockholders’ equity as of December 31, 2017. New Asian Ventures Ltd.: Grace T.H.W. Holding Limited - unaudited statements of stockholders’ equity as of December 31, 2017.
Note 3: Union Information Technology Corporation: ELTA Technology Co., Ltd. - unaudited statements of stockholders’ equity as of December 31, 2017.
(Continued)

- 103 -
Note 4: The market values of the listed and OTC stocks included in financial assets at fair value through profit or loss and available-for-sale financial assets were based on the daily closing prices as of balance sheet date. The market values of
beneficial certificates were based on net asset values as of the balance sheet date. Note 5: Union Capital (Singapore) Holding Pte. Ltd., Uflc Capital (Singapore) Holding Pte. Ltd. and Tokutei Mokuteki Kaisha SSG15, SSG12 and SSG16 - the audited statements of stockholders’ equity as of September 30, 2017.
Kabushiki Kaisha UCJ1 - unaudited statements of stockholders’ equity as of September 30, 2017.
Note 6: Common stock 1 shares and preferred stock 25 thousand shares. Note 7: Common stock 1 shares and preferred stock 14 thousand shares. Note 8: Common stock 1 shares and preferred stock 19 thousand shares. Note 9: Preferred stock 20 thousand shares.
(Concluded)

- 104 -
TABLE 4
UNION BANK OF TAIWAN RECEIVABLES FROM RELATED PARTIES AMOUNTING TO AT LEAST NT$300 MILLION OR 10% OF THE PAID-IN CAPITAL DECEMBER 31, 2017 (In Thousands of New Taiwan Dollars, Unless Stated Otherwise)
Company Name Related Party Relationship Ending Balance
Turnover Rate
Overdue Amounts Received in Subsequent
Period
Allowance for Impairment Loss Amount Actions Taken
Union Finance and Leasing International
Corporation Union Capital (Cayman) Corp. Subsidiary $ 1,716,636
(JPY 5,639,163) (US$ 7,453)
- $ - - $ - $ -
Union Capital (Cayman) Corp. Union Capital (Singapore) Holding
Pte. Ltd. Subsidiary 709,363
(JPY 2,677,225) - - - - -
Uflc Capital (Singapore) Holding Pte. Ltd.
Subsidiary 1,464,978 (JPY 5,523,808) (US$ 46)
- - - - -
Union Capital (Singapore) Holding Pte. Ltd. Kabushiki Kaisha UCJ1 (Japan) Subsidiary 388,398
(JPY 1,465,865) - - - - -
Uflc Capital (Singapore) Holding Pte. Ltd. Kabushiki Kaisha UCJ1 (Japan) Subsidiary 596,907
(JPY 2,252,804) - - - - -
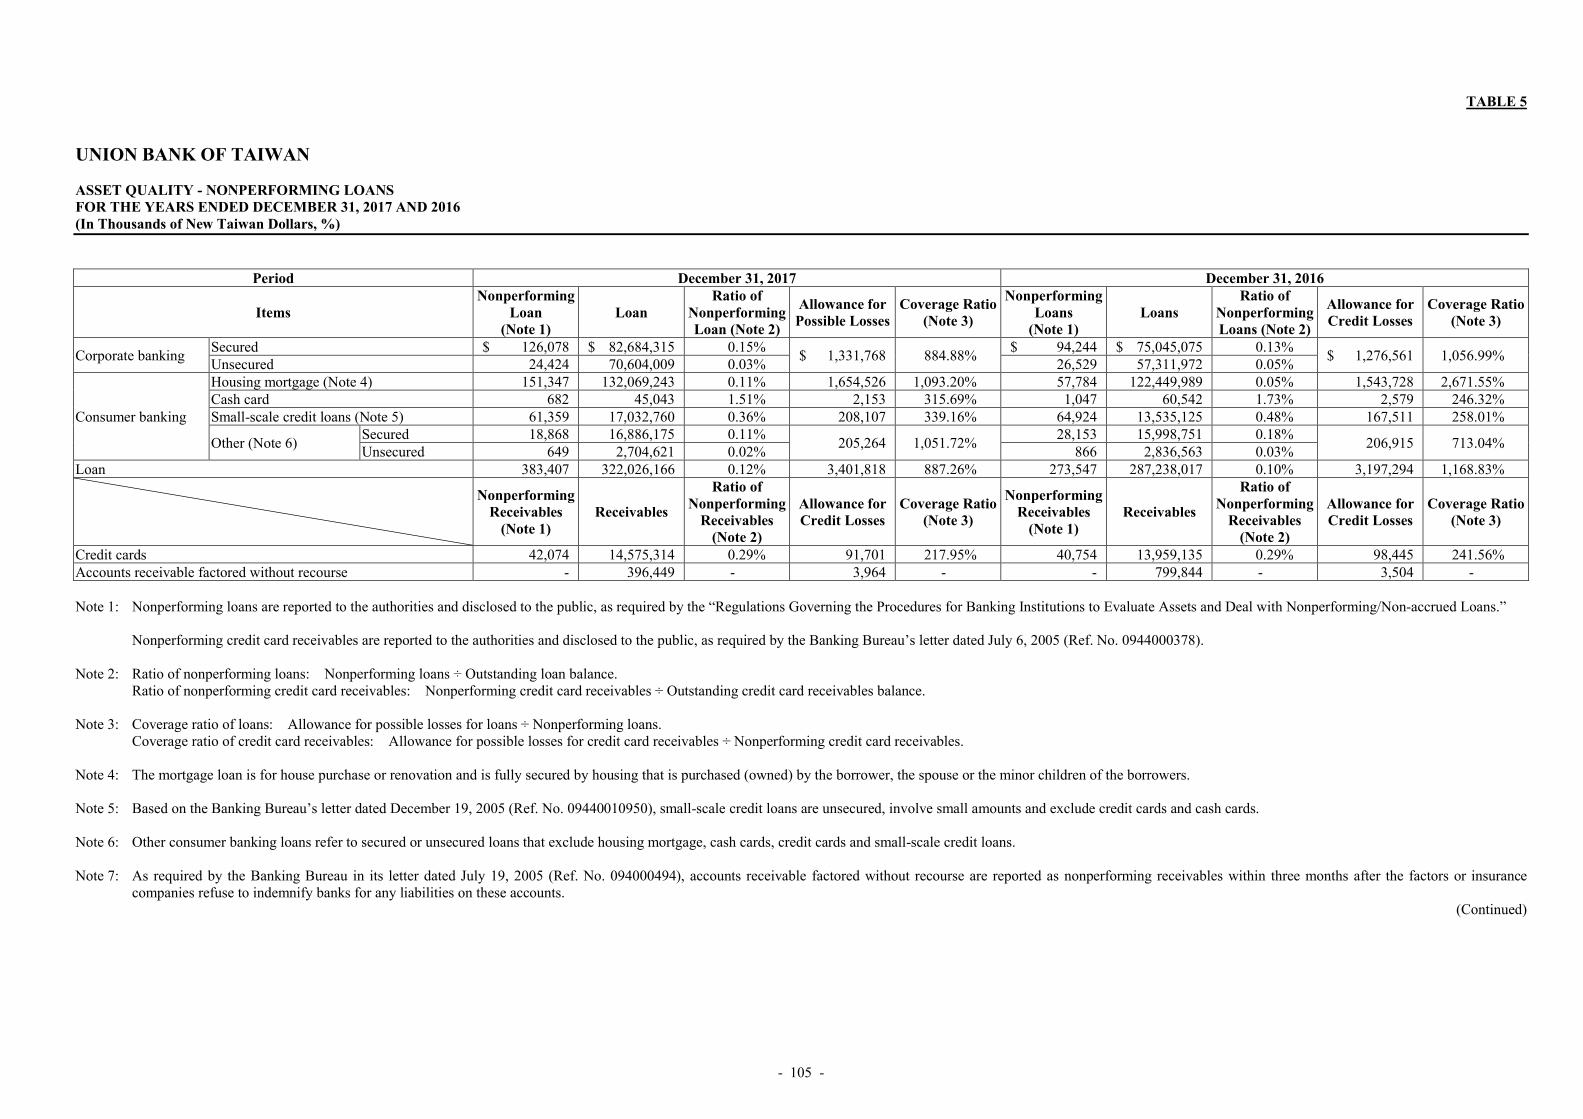
- 105 -
TABLE 5
UNION BANK OF TAIWAN ASSET QUALITY - NONPERFORMING LOANS FOR THE YEARS ENDED DECEMBER 31, 2017 AND 2016 (In Thousands of New Taiwan Dollars, %)
Period December 31, 2017 December 31, 2016
Items Nonperforming
Loan (Note 1)
Loan Ratio of
Nonperforming Loan (Note 2)
Allowance for Possible Losses
Coverage Ratio (Note 3)
Nonperforming Loans
(Note 1) Loans
Ratio of Nonperforming Loans (Note 2)
Allowance for Credit Losses
Coverage Ratio (Note 3)
Corporate banking Secured $ 126,078 $ 82,684,315 0.15%
$ 1,331,768 884.88% $ 94,244 $ 75,045,075 0.13%
$ 1,276,561 1,056.99% Unsecured 24,424 70,604,009 0.03% 26,529 57,311,972 0.05%
Consumer banking
Housing mortgage (Note 4) 151,347 132,069,243 0.11% 1,654,526 1,093.20% 57,784 122,449,989 0.05% 1,543,728 2,671.55% Cash card 682 45,043 1.51% 2,153 315.69% 1,047 60,542 1.73% 2,579 246.32% Small-scale credit loans (Note 5) 61,359 17,032,760 0.36% 208,107 339.16% 64,924 13,535,125 0.48% 167,511 258.01%
Other (Note 6) Secured 18,868 16,886,175 0.11%
205,264 1,051.72% 28,153 15,998,751 0.18%
206,915 713.04% Unsecured 649 2,704,621 0.02% 866 2,836,563 0.03%
Loan 383,407 322,026,166 0.12% 3,401,818 887.26% 273,547 287,238,017 0.10% 3,197,294 1,168.83%
Nonperforming Receivables
(Note 1) Receivables
Ratio of Nonperforming
Receivables (Note 2)
Allowance for Credit Losses
Coverage Ratio (Note 3)
Nonperforming Receivables
(Note 1) Receivables
Ratio of Nonperforming
Receivables (Note 2)
Allowance for Credit Losses
Coverage Ratio (Note 3)
Credit cards 42,074 14,575,314 0.29% 91,701 217.95% 40,754 13,959,135 0.29% 98,445 241.56% Accounts receivable factored without recourse - 396,449 - 3,964 - - 799,844 - 3,504 - Note 1: Nonperforming loans are reported to the authorities and disclosed to the public, as required by the “Regulations Governing the Procedures for Banking Institutions to Evaluate Assets and Deal with Nonperforming/Non-accrued Loans.”
Nonperforming credit card receivables are reported to the authorities and disclosed to the public, as required by the Banking Bureau’s letter dated July 6, 2005 (Ref. No. 0944000378). Note 2: Ratio of nonperforming loans: Nonperforming loans ÷ Outstanding loan balance.
Ratio of nonperforming credit card receivables: Nonperforming credit card receivables ÷ Outstanding credit card receivables balance. Note 3: Coverage ratio of loans: Allowance for possible losses for loans ÷ Nonperforming loans.
Coverage ratio of credit card receivables: Allowance for possible losses for credit card receivables ÷ Nonperforming credit card receivables. Note 4: The mortgage loan is for house purchase or renovation and is fully secured by housing that is purchased (owned) by the borrower, the spouse or the minor children of the borrowers. Note 5: Based on the Banking Bureau’s letter dated December 19, 2005 (Ref. No. 09440010950), small-scale credit loans are unsecured, involve small amounts and exclude credit cards and cash cards. Note 6: Other consumer banking loans refer to secured or unsecured loans that exclude housing mortgage, cash cards, credit cards and small-scale credit loans. Note 7: As required by the Banking Bureau in its letter dated July 19, 2005 (Ref. No. 094000494), accounts receivable factored without recourse are reported as nonperforming receivables within three months after the factors or insurance
companies refuse to indemnify banks for any liabilities on these accounts. (Continued)

- 106 -
Not reported as nonperforming loans or nonperforming receivables
Items
Types
December 31, 2017 December 31, 2016 Not Reported as Nonperforming
Loan
Not Reported as Nonperforming
Receivable
Not Reported as Nonperforming
Loan
Not Reported as Nonperforming
Receivable Amounts of executed contracts on
negotiated debts not reported as nonperforming loans and receivables (Note 1) $ 42,254 $ 178,460 $ 56,493 $ 234,830
Amounts of discharged and executed contracts on clearance of consumer debts not reported as nonperforming loans and receivables (Note 2) 77,446 768,034 67,968 798,500
Total 119,700 946,494 124,461 1,033,330 Note 1: Amounts of executed contracts on negotiated debts that are not reported as nonperforming loans or receivables are reported in accordance with the Banking Bureau’s letter dated April 25, 2006 (Ref. No. 09510001270). Note 2: Amounts of discharged and executed contracts on clearance of consumer debts that are not reported as nonperforming loans or receivables are reported in accordance with the Banking Bureau’s letter dated September 15, 2008 (Ref.
No. 09700318940).
(Concluded)

- 107 -
TABLE 6
UNION BANK OF TAIWAN INFORMATION ON AND PROPORTIONATE SHARE IN INVESTEES DECEMBER 31, 2017 (In Thousands of New Taiwan Dollars)
Investee Company Location Main Business and Product
Percentage of
Ownership (%)
Carrying Value Investment Gain (Loss)
Proportionate Share of the Bank and Its Subsidiaries in Investees
Note Shares
(Thousands) Pro Forma
Shares (Note 2)
Total
Shares (Thousands)
Percentage of
Ownership (%)
Financial-related Union Finance and Leasing International
Corporation Taipei Installment, leasing and accounts receivable factoring 100.00 $ 2,664,239 $ 148,356 117,000 - 117,000 100.00 Note 3
Union Finance International (HK) Limited Hong Kong Import and export accommodation 99.99 99,514 33,476 30,000 - 30,000 99.99 Note 3 Union Securities Investment Trust Corporation Taipei Securities investment trust 35.00 144,248 11,333 10,500 - 10,500 35.00 Note 3 Union Information Technology Corporation Taipei Software and hardware product retail and distribution,
system programming development, system development outsourcing, website design, e-commerce, etc.
99.99 20,244 864 1,000 - 1,000 99.99 Note 3
Ipass Corporation Kaohsiung IC card 16.25 123,320 - 13,000 - 13,000 16.25 Taiwan Gin Lian Asset Management
Corporation Taipei Purchase, sale and management of nonperforming loans
from financial institutions 0.57 75,000 - 7,500 - 7,500 0.57
Taiwan Financial Asset Service Corporation Taipei Property auction 2.94 50,000 - 5,000 - 5,000 2.94 Huan Hua Securities Finance Co. Taipei Securities finance 0.53 20,055 - 2,103 - 2,103 0.53 Sunny Asset Management Co. Taipei Purchase, sell and manage nonperforming loans from
financial institution 6.44 3,864 - 386 - 386 6.44
Taipei Forex Inc. Taipei Foreign exchange brokering 0.81 2,113 - 160 - 160 0.81 Financial Information Service Co., Ltd. Taipei Information service 2.39 118,782 - 12,498 - 12,498 2.39 Taiwan Depository & Clearing Corporation Taipei Financial service 0.25 13,916 - 899 - 899 0.25 Taiwan Futures Exchange Co., Ltd. Taipei Futures clearing 2.04 71,250 - 6,422 - 6,422 2.04 Taiwan Mobile Payment Corporation Taipei International trade, data processing service 1.00 6,000 - 600 - 600 1.00 Nonfinancial-related Union Real-Estate Management Corporation Taipei Construction plan review and consulting 40.00 53,121 (326) 2,000 - 2,000 40.00 Note 3 Fu Hua Venture Corporation Taipei Investments 5.00 9,852 - 990 - 990 5.00 Li Yu Venture Corporation Taipei Investment 4.76 5,837 - 607 - 607 4.76 Lian An Service Corporation Taipei Security service 5.00 1,501 - 125 - 125 5.00 Taiwan Power Corporation Taipei Electricity-related business 0.0012 6,124 - 395 - 395 0.0012 Note 1: The investees’ information shown above is based on audited financial reports as of December 31, 2017. Note 2: Pro forma shares are considered if equity securities - convertible bonds, warrants, etc. - or derivative contracts such as stock options, are converted to shares.

Union Bank of Taiwan and Subsidiaries Consolidated Financial Statements for the Years Ended December 31, 2017 and 2016 and Independent Auditors’ Report

- 1 -
DECLARATION OF CONSOLIDATION OF FINANCIAL STATEMENTS OF AFFILIATES The Bank and its subsidiaries required to be included in the consolidated financial statements of affiliates
in accordance with the “Criteria Governing Preparation of Affiliation Reports, Consolidated Business
Reports and Consolidated Financial Statements of Affiliated Enterprises” for the year ended December 31,
2017 are all the same as the companies required to be included in the consolidated financial statements of
parent and subsidiary companies as provided in International Financial Reporting Standard 10. Relevant
information that should be disclosed in the consolidated financial statements of affiliates has all been
disclosed in the consolidated financial statements of parent and subsidiary companies. Hence, we have
not prepared a separate set of consolidated financial statements of affiliates.
Very truly yours, UNION BANK OF TAIWAN By: March 29, 2018

- 2 -
INDEPENDENT AUDITORS’ REPORT The Board of Directors and Stockholders Union Bank of Taiwan Opinion We have audited the accompanying consolidated financial statements of Union Bank of Taiwan (the Bank) and its subsidiaries (collectively, the Company), which comprise the consolidated balance sheets as of December 31, 2017 and 2016, and the consolidated statements of comprehensive income, changes in equity and cash flows for the years then ended, and the notes to the consolidated financial statements, including a summary of significant accounting policies. In our opinion, the accompanying consolidated financial statements present fairly, in all material respects, the consolidated financial position of the Company as of December 31, 2017 and 2016, and its consolidated financial performance and its consolidated cash flows for the years then ended in accordance with the Regulations Governing the Preparation of Financial Reports by Public Banks, Regulations Governing the Preparation of Financial Reports by Securities Firms, and International Financial Reporting Standards (IFRS), International Accounting Standards (IAS), IFRIC Interpretations (IFRIC), and SIC Interpretations (SIC) endorsed and issued into effect by the Financial Supervisory Commission of the Republic of China. Basis for Opinion We conducted our audits in accordance with the Regulations Governing Auditing and Attestation of Financial Statements of Financial Institutions by Certified Public Accountants and auditing standards generally accepted in the Republic of China. Our responsibilities under those standards are further described in the Auditors’ Responsibilities for the Audit of the Consolidated Financial Statements section of our report. We are independent of the Company in accordance with The Norm of Professional Ethics for Certified Public Accountant of the Republic of China, and we have fulfilled our other ethical responsibilities in accordance with these requirements. We believe that the audit evidence we have obtained is sufficient and appropriate to provide a basis for our opinion. Key Audit Matters Key audit matters are those matters that, in our professional judgment, were of most significance in our audit of the consolidated financial statements for the year ended December 31, 2017. These matters were addressed in the context of our audit of the consolidated financial statements as a whole, and in forming our opinion thereon, and we do not provide a separate opinion on these matters.

- 3 -
The key audit matters of the Company’s consolidated financial statements for the year ended December 31, 2017 are described as follows: Accuracy of Interest Revenue from of Discounts and Loans For the year ended December 31, 2017, the amount of interest revenue from discounts and loans was $6,307,257 thousand which, represented approximately 51% of total net revenue, and was considered material to the financial statements as a whole. Refer to Note 33 to the consolidated financial statements. Therefore, we considered the accuracy of the recognition of interest revenue as a key audit matter for the year ended December 31, 2017. The main audit procedures we performed in response to certain aspects of the key audit matter described above were as follows: 1. Understanding of the design of the Company’s computerized information system and General
IT Controls, and testing of the operating effectiveness of the controls over the relevant application system and the information generated.
2. Understanding of the design of the application system for recognition of commercial loans and
discounts and interest revenue. Testing of operating effectiveness of relevant automated controls in the application system.
3. Determination and verification of the classification of material loans. Verification if there is
any difference in the balance of loans generated by information system and carrying amount per books.
4. Testing and assessment of the accuracy of interest revenue generated by information system.
Verification if there is any difference in the interest revenue generated by information system and carrying amount on per books.
Possible Impairment of Discounts and Loans As of December 31, 2017, the net amount of discounts and loans of the Company was $316,728,989 thousand which, represented approximately 56% of total consolidated assets, and was considered material to the financial statements as a whole. Refer to Note 11 to the consolidated financial statements. The Company’s management performs loan impairment assessment involving critical judgements on accounting estimates and assumptions; therefore, we determined allowance for possible losses on discounts and loans a key audit matter for the year ended December 31, 2017. The Company’s management performs loan impairment assessment through reviewing of portfolios of loans periodically, and makes a judgement on whether to recognize impairment loss per observable evidence indicating the probable occurrence of impairment events. The amount of impairment loss is the difference between the asset’s carrying amount and the present value of the estimated future cash flows, with consideration of collaterals and guarantees, discounted at the financial asset’s original effective interest rate. In addition, the allowance provision must comply with relevant regulations issued by the authorities. For the accounting policies and relevant information on loan impairment assessment, refer to Notes 4, 5 and 12 to the financial statements.

- 4 -
The main audit procedures we performed in response to certain aspects of the key audit matter described above were as follows: 1. Understanding and testing of the relevant internal controls in respect of the Bank’s loan
impairment assessment process. 2. Impairment assessment of sample individual loans by:
Verifying the accuracy of the balance of loans. Verifying the payment of principal and interest, and the classification of credit assets
according to relevant regulations issued by the authorities. Assessing the assumptions used to estimate future cash flows and the reasonableness of the
value of collateral. 3. Impairment assessment of loans on collective basis by:
Verifying the classification of collectively assessed loans. Understanding the assumptions on critical factors of collectively assessed loans, including
the possibility of the impairment and the recoverability of loan balances, used in the impairment assessment model, and verifying whether the estimates reasonably reflected the actual outcome for each loan portfolio.
Recalculating to confirm the amount of recognized impairment.
4. Verifying the classification of credit assets in order to assess whether the provision of
allowance for possible losses complied with relevant regulations issued by the authorities. Other Matter We have also audited the separate financial statements of Union Bank of Taiwan as of and for the years ended December 31, 2017 and 2016 on which we have issued an unmodified opinion. Responsibilities of Management and Those Charged with Governance for the Consolidated
Financial Statements Management is responsible for the preparation and fair presentation of the consolidated financial statements in accordance with the Regulations Governing the Preparation of Financial Reports by Public Banks, Regulations Governing the Preparation of Financial Reports by Securities Firms, and IFRS, IAS, IFRIC, and SIC endorsed and issued into effect by the Financial Supervisory Commission of the Republic of China, and for such internal control as management determines is necessary to enable the preparation of consolidated financial statements that are free from material misstatement, whether due to fraud or error. In preparing the consolidated financial statements, management is responsible for assessing the Company’s ability to continue as a going concern, disclosing, as applicable, matters related to going concern and using the going concern basis of accounting unless management either intends to liquidate the Company or to cease operations, or has no realistic alternative but to do so. Those charged with governance, including the audit committee, are responsible for overseeing the Company’s financial reporting process.

- 5 -
Auditors’ Responsibilities for the Audit of the Consolidated Financial Statements Our objectives are to obtain reasonable assurance about whether the consolidated financial statements as a whole are free from material misstatement, whether due to fraud or error, and to issue an auditors’ report that includes our opinion. Reasonable assurance is a high level of assurance, but is not a guarantee that an audit conducted in accordance with the auditing standards generally accepted in the Republic of China will always detect a material misstatement when it exists. Misstatements can arise from fraud or error and are considered material if, individually or in the aggregate, they could reasonably be expected to influence the economic decisions of users taken on the basis of these consolidated financial statements. As part of an audit in accordance with the auditing standards generally accepted in the Republic of China, we exercise professional judgment and maintain professional skepticism throughout the audit. We also: 1. Identify and assess the risks of material misstatement of the consolidated financial statements,
whether due to fraud or error, design and perform audit procedures responsive to those risks, and obtain audit evidence that is sufficient and appropriate to provide a basis for our opinion. The risk of not detecting a material misstatement resulting from fraud is higher than for one resulting from error, as fraud may involve collusion, forgery, intentional omissions, misrepresentations, or the override of internal control.
2. Obtain an understanding of internal control relevant to the audit in order to design audit
procedures that are appropriate in the circumstances, but not for the purpose of expressing an opinion on the effectiveness of the Company’s internal control.
3. Evaluate the appropriateness of accounting policies used and the reasonableness of accounting
estimates and related disclosures made by management. 4. Conclude on the appropriateness of management’s use of the going concern basis of
accounting and, based on the audit evidence obtained, whether a material uncertainty exists related to events or conditions that may cast significant doubt on the Company’s ability to continue as a going concern. If we conclude that a material uncertainty exists, we are required to draw attention in our auditors’ report to the related disclosures in the consolidated financial statements or, if such disclosures are inadequate, to modify our opinion. Our conclusions are based on the audit evidence obtained up to the date of our auditors’ report. However, future events or conditions may cause the Company to cease to continue as a going concern.
5. Evaluate the overall presentation, structure and content of the consolidated financial statements,
including the disclosures, and whether the consolidated financial statements represent the underlying transactions and events in a manner that achieves fair presentation.
6. Obtain sufficient and appropriate audit evidence regarding the financial information of entities
or business activities within the Company to express an opinion on the consolidated financial statements. We are responsible for the direction, supervision, and performance of the group audit. We remain solely responsible for our audit opinion.
We communicate with those charged with governance regarding, among other matters, the planned scope and timing of the audit and significant audit findings, including any significant deficiencies in internal control that we identify during our audit.

- 6 -
We also provide those charged with governance with a statement that we have complied with relevant ethical requirements regarding independence, and to communicate with them all relationships and other matters that may reasonably be thought to bear on our independence, and where applicable, related safeguards. From the matters communicated with those charged with governance, we determine those matters that were of most significance in the audit of the consolidated financial statements for the year ended December 31, 2017 and are therefore the key audit matters. We describe these matters in our auditors’ report unless law or regulation precludes public disclosure about the matter or when, in extremely rare circumstances, we determine that a matter should not be communicated in our report because the adverse consequences of doing so would reasonably be expected to outweigh the public interest benefits of such communication. The engagement partners on the audit resulting in this independent auditors’ report are Shiuh-Ran Cheng and Chen-Hsiu Yang. Deloitte & Touche Taipei, Taiwan Republic of China March 29, 2018
Notice to Readers The accompanying consolidated financial statements are intended only to present the consolidated financial position, financial performance and cash flows in accordance with accounting principles and practices generally accepted in the Republic of China and not those of any other jurisdictions. The standards, procedures and practices to audit such consolidated financial statements are those generally applied in the Republic of China. For the convenience of readers, the independent auditors’ report and the accompanying consolidated financial statements have been translated into English from the original Chinese version prepared and used in the Republic of China. If there is any conflict between the English version and the original Chinese version or any difference in the interpretation of the two versions, the Chinese-language independent auditors’ report and consolidated financial statements shall prevail.

- 7 -
UNION BANK OF TAIWAN AND SUBSIDIARIES CONSOLIDATED BALANCE SHEETS DECEMBER 31, 2017 AND 2016 (In Thousands of New Taiwan Dollars)
2017 2016 ASSETS Amount % Amount % CASH AND CASH EQUIVALENTS (Notes 4 and 6) $ 12,136,172 2 $ 10,971,118 2 DUE FROM THE CENTRAL BANK AND CALL LOANS TO BANKS (Note 7) 19,180,985 4 54,414,461 10 FINANCIAL ASSETS AT FAIR VALUE THROUGH PROFIT OR LOSS (Notes 4 and 8) 12,136,325 2 9,538,090 2 SECURITIES PURCHASED UNDER AGREEMENTS TO RESELL (Notes 4 and 9) 28,234,334 5 27,855,242 5 RECEIVABLES, NET (Notes 4, 5, 10 and 12) 17,751,420 3 17,888,230 3 CURRENT TAX ASSETS (Note 4) 52,134 - 186,231 - DISCOUNTS AND LOANS, NET (Notes 4, 5, 11, 12 and 43) 316,728,989 56 282,416,950 53 AVAILABLE-FOR-SALE FINANCIAL ASSETS, NET (Notes 4, 13 and 43) 35,489,633 6 39,978,425 8 HELD-TO-MATURITY FINANCIAL ASSETS (Notes 4 and 14) 51,285,957 9 7,192,115 1 INVESTMENTS ACCOUNTED FOR USING THE EQUITY METHOD, NET (Notes 4 and 16) 53,121 - 53,447 - OTHER FINANCIAL ASSETS, NET (Notes 4, 17 and 44) 48,267,839 9 57,403,743 11 PROPERTY AND EQUIPMENT, NET (Notes 4 and 18) 8,081,729 2 8,156,305 2 INVESTMENT PROPERTIES, NET (Notes 4, 19 and 27) 5,284,434 1 5,415,376 1 INTANGIBLE ASSETS (Notes 4 and 20)
Goodwill 1,985,307 - 1,985,307 - Computer software 184,137 - 182,423 -
Total intangible assets 2,169,444 - 2,167,730 -
DEFERRED TAX ASSETS (Notes 4 and 41) 1,172,974 - 1,447,039 - OTHER ASSETS, NET (Notes 4, 21, 30, 43 and 45) 7,590,797 1 7,622,068 2 TOTAL $ 565,616,287 100 $ 532,706,570 100 LIABILITIES AND EQUITY DUE TO THE CENTRAL BANK AND CALL LOANS TO OTHER BANKS (Note 22) $ 9,249,185 2 $ 8,389,312 2 FINANCIAL LIABILITIES AT FAIR VALUE THROUGH PROFIT OR LOSS (Notes 4 and 8) 183,384 - 39,523 - SECURITIES SOLD UNDER AGREEMENTS TO REPURCHASE (Notes 4 and 23) 30,273,976 5 28,874,137 5 ACCOUNTS PAYABLE (Note 24) 7,108,824 1 6,981,464 1 CURRENT TAX LIABILITIES (Note 4) 77,173 - 97,549 - DEPOSITS AND REMITTANCES (Notes 25 and 43) 449,049,470 79 431,618,915 81 BANK DEBENTURES (Note 26) 11,700,000 2 11,200,000 2 BOND PAYABLE (Note 27) 1,409,598 - 1,135,884 - OTHER FINANCIAL LIABILITIES (Note 28) 4,291,441 1 4,235,138 1 PROVISIONS (Notes 4, 29 and 30) 182,262 - 189,572 - DEFERRED TAX LIABILITIES (Notes 4 and 41) 937,196 - 834,410 - OTHER LIABILITIES (Notes 31 and 45) 2,967,213 1 2,892,210 1
Total liabilities 517,429,722 91 496,488,114 93 EQUITY ATTRIBUTABLE TO OWNERS OF THE BANK
Share capital Ordinary shares 26,051,524 5 26,051,524 5 Preference shares 2,000,000 - - -
Total share capital 28,051,524 5 26,051,524 5 Capital surplus 8,032,413 2 32,413 - Retained earnings
Legal reserve 5,165,280 1 4,374,367 1 Special reserve 585,206 - 558,842 - Unappropriated earnings 4,503,995 1 3,740,039 1
Total retained earnings 10,254,481 2 8,673,248 2 Other equity 1,580,257 - 1,192,131 -
Total equity attributable to owners of the Bank 47,918,675 9 35,949,316 7
NON-CONTROLLING INTERESTS 267,890 - 269,140 -
Total equity 48,186,565 9 36,218,456 7 TOTAL $ 565,616,287 100 $ 532,706,570 100 The accompanying notes are an integral part of the consolidated financial statements.

- 8 -
UNION BANK OF TAIWAN AND SUBSIDIARIES CONSOLIDATED STATEMENTS OF COMPREHENSIVE INCOME FOR THE YEARS ENDED DECEMBER 31, 2017 AND 2016 (In Thousands of New Taiwan Dollars, Except Earnings Per Share)
Percentage
Increase 2017 2016 (Decrease) Amount % Amount % % NET INTEREST (Notes 33 and 43)
Interest revenues $ 10,268,804 82 $ 10,014,337 83 3 Interest expenses 3,677,756 29 3,709,965 31 (1)
Net interest 6,591,048 53 6,304,372 52 5
NET REVENUES OTHER THAN
INTEREST Commissions and fee revenues, net
(Notes 34 and 43) 2,298,017 18 2,423,489 20 (5) Gain on financial assets and liabilities
at fair value through profit or loss, net (Note 35) 356,479 3 382,758 3 (7)
Realized gain from available-for-sale financial assets, net (Notes 36 and 43) 830,130 7 461,840 4 80
Foreign exchange loss, net (159,723) (1) (16,025) - 897 Loss from asset impairment, net
(Notes 4 and 37) (799) - (49,283) - (98) Share of loss of associates (Notes 4
and 16) (326) - (347) - (6) Gain on financial assets measured at
cost, net 57,416 - 68,135 - (16) Securities brokerage fee revenues, net 203,732 2 198,476 2 3 Rental revenue 2,231,092 18 2,140,487 18 4 Other noninterest net gain 64,299 - 97,758 1 (34)
TOTAL NET REVENUES 12,471,365 100 12,011,660 100 4 PROVISIONS (Note 12)
Provision of allowance for doubtful accounts 356,861 3 171,542 2 108
OPERATING EXPENSES
Employee benefit expenses (Notes 4, 30 and 38) 3,352,574 27 3,345,749 28 -
Depreciation and amortization (Note 39) 1,937,510 15 1,820,860 15 6
Others (Notes 40 and 43) 3,437,849 28 3,362,722 28 2
Total operating expenses 8,727,933 70 8,529,331 71 2 (Continued)
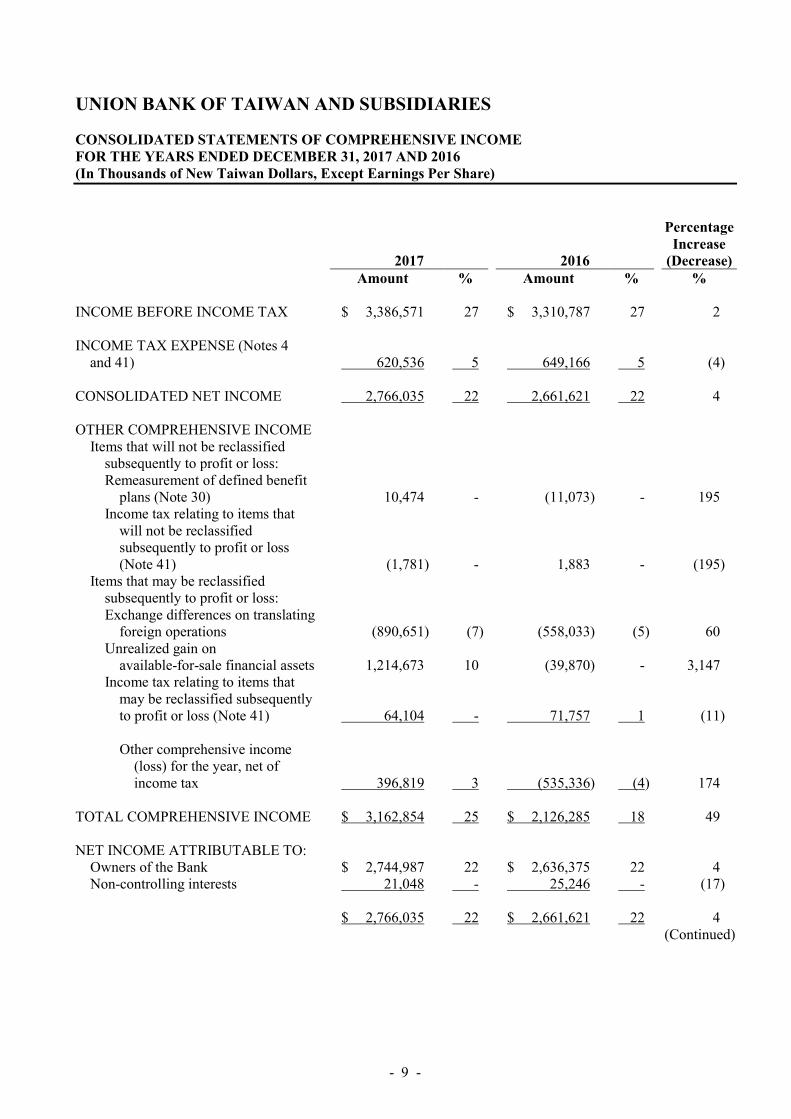
- 9 -
UNION BANK OF TAIWAN AND SUBSIDIARIES CONSOLIDATED STATEMENTS OF COMPREHENSIVE INCOME FOR THE YEARS ENDED DECEMBER 31, 2017 AND 2016 (In Thousands of New Taiwan Dollars, Except Earnings Per Share)
Percentage
Increase 2017 2016 (Decrease) Amount % Amount % % INCOME BEFORE INCOME TAX $ 3,386,571 27 $ 3,310,787 27 2 INCOME TAX EXPENSE (Notes 4
and 41) 620,536 5 649,166 5 (4) CONSOLIDATED NET INCOME 2,766,035 22 2,661,621 22 4 OTHER COMPREHENSIVE INCOME
Items that will not be reclassified subsequently to profit or loss: Remeasurement of defined benefit
plans (Note 30) 10,474 - (11,073) - 195 Income tax relating to items that
will not be reclassified subsequently to profit or loss (Note 41) (1,781) - 1,883 - (195)
Items that may be reclassified subsequently to profit or loss: Exchange differences on translating
foreign operations (890,651) (7) (558,033) (5) 60 Unrealized gain on
available-for-sale financial assets 1,214,673 10 (39,870) - 3,147 Income tax relating to items that
may be reclassified subsequently to profit or loss (Note 41) 64,104 - 71,757 1 (11)
Other comprehensive income
(loss) for the year, net of income tax 396,819 3 (535,336) (4) 174
TOTAL COMPREHENSIVE INCOME $ 3,162,854 25 $ 2,126,285 18 49 NET INCOME ATTRIBUTABLE TO:
Owners of the Bank $ 2,744,987 22 $ 2,636,375 22 4 Non-controlling interests 21,048 - 25,246 - (17)
$ 2,766,035 22 $ 2,661,621 22 4
(Continued)
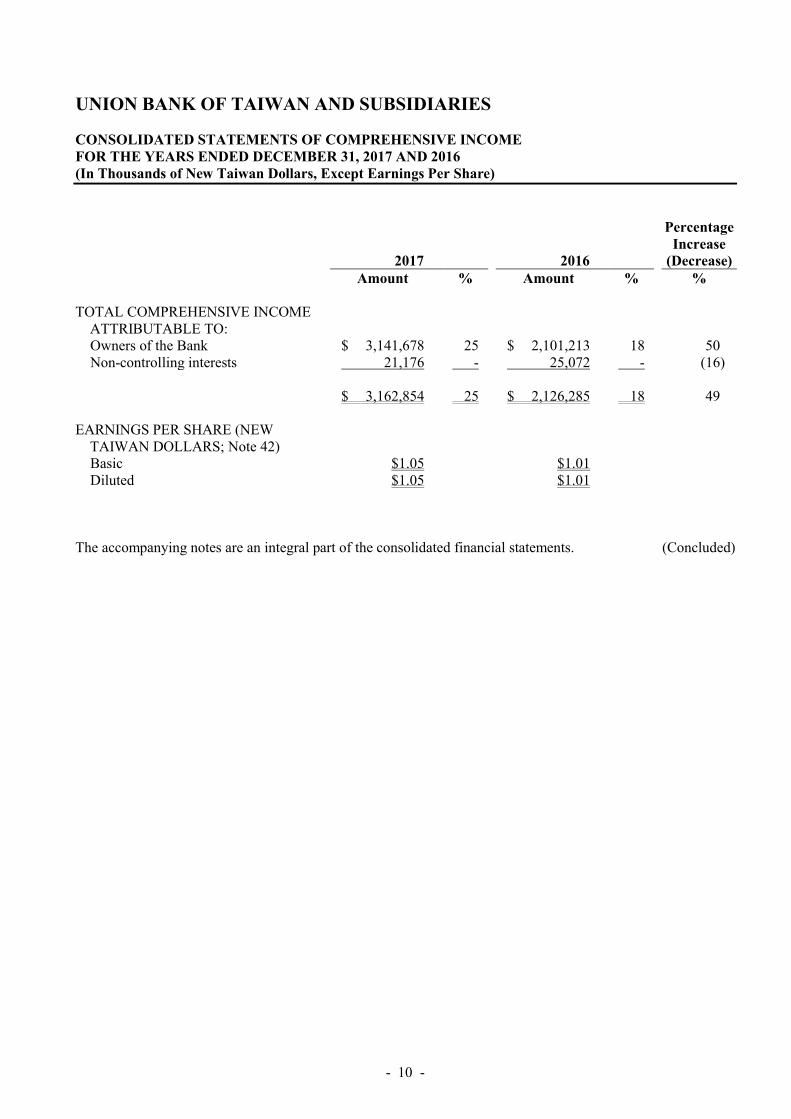
- 10 -
UNION BANK OF TAIWAN AND SUBSIDIARIES CONSOLIDATED STATEMENTS OF COMPREHENSIVE INCOME FOR THE YEARS ENDED DECEMBER 31, 2017 AND 2016 (In Thousands of New Taiwan Dollars, Except Earnings Per Share)
Percentage
Increase 2017 2016 (Decrease) Amount % Amount % % TOTAL COMPREHENSIVE INCOME
ATTRIBUTABLE TO: Owners of the Bank $ 3,141,678 25 $ 2,101,213 18 50 Non-controlling interests 21,176 - 25,072 - (16)
$ 3,162,854 25 $ 2,126,285 18 49 EARNINGS PER SHARE (NEW
TAIWAN DOLLARS; Note 42) Basic $1.05 $1.01 Diluted $1.05 $1.01
The accompanying notes are an integral part of the consolidated financial statements. (Concluded)
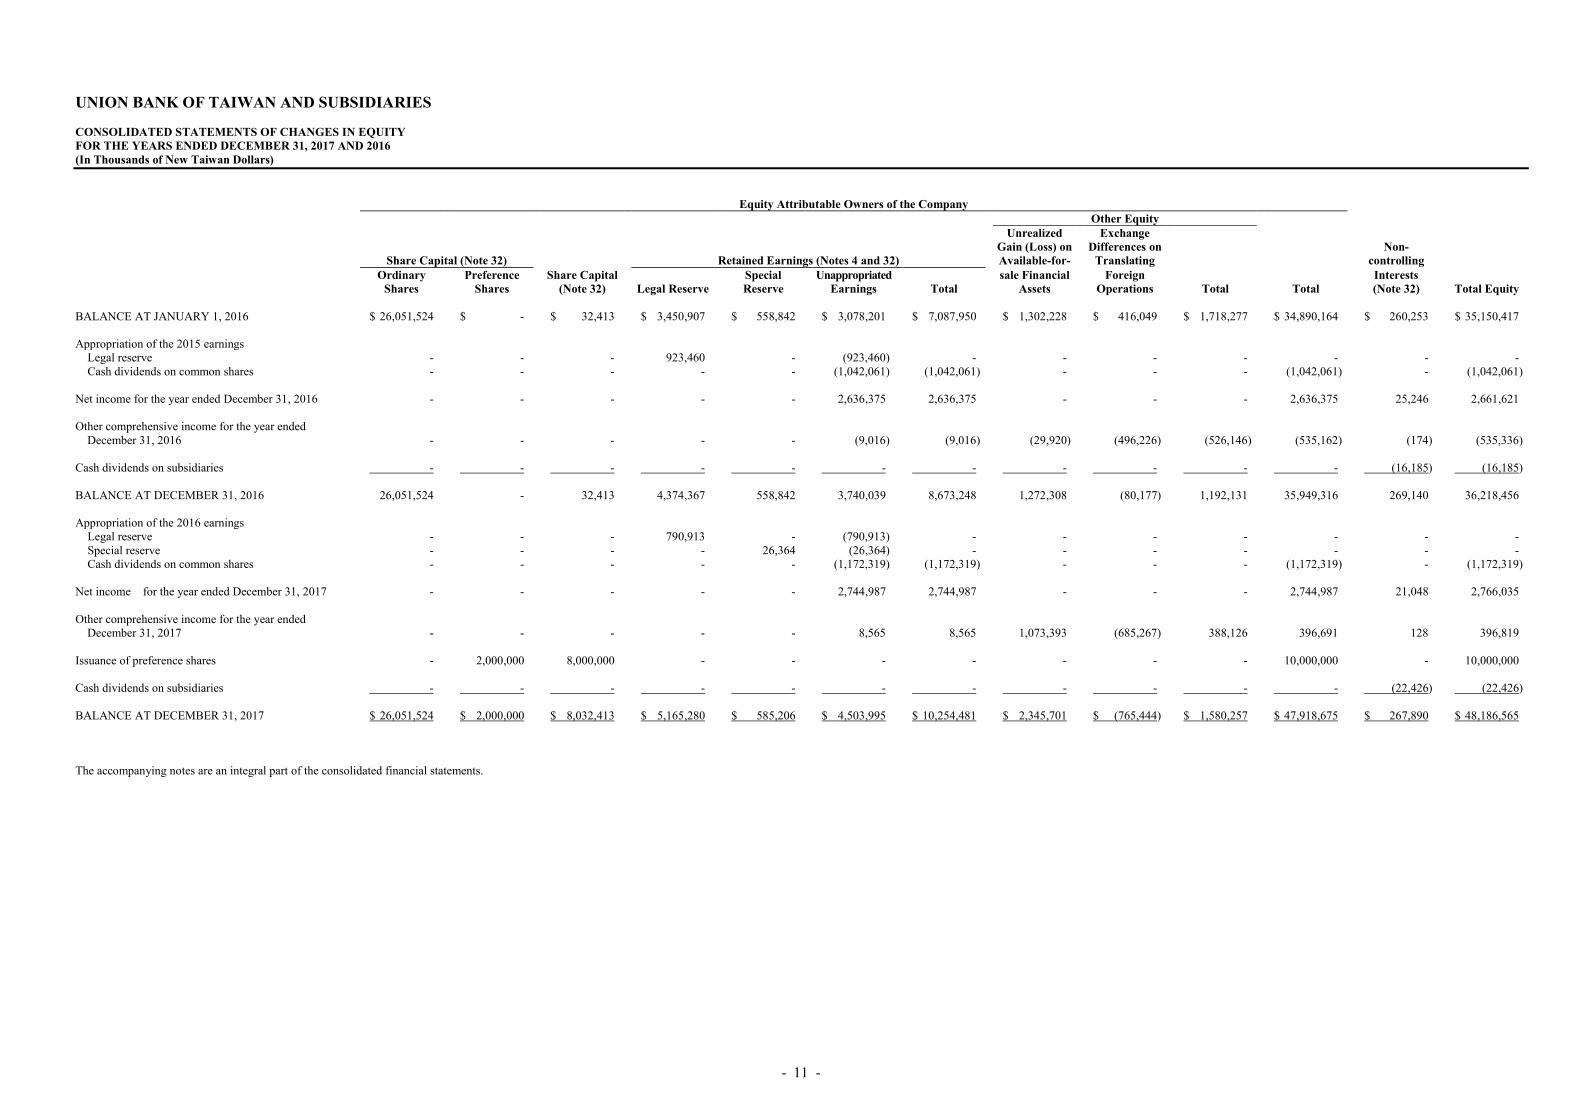
- 11 -
UNION BANK OF TAIWAN AND SUBSIDIARIES CONSOLIDATED STATEMENTS OF CHANGES IN EQUITY FOR THE YEARS ENDED DECEMBER 31, 2017 AND 2016 (In Thousands of New Taiwan Dollars)
Equity Attributable Owners of the Company Other Equity Unrealized Exchange Gain (Loss) on Differences on Non- Share Capital (Note 32) Retained Earnings (Notes 4 and 32) Available-for- Translating controlling Ordinary Preference Share Capital Special Unappropriated sale Financial Foreign Interests Shares Shares (Note 32) Legal Reserve Reserve Earnings Total Assets Operations Total Total (Note 32) Total Equity BALANCE AT JANUARY 1, 2016 $ 26,051,524 $ - $ 32,413 $ 3,450,907 $ 558,842 $ 3,078,201 $ 7,087,950 $ 1,302,228 $ 416,049 $ 1,718,277 $ 34,890,164 $ 260,253 $ 35,150,417 Appropriation of the 2015 earnings
Legal reserve - - - 923,460 - (923,460) - - - - - - - Cash dividends on common shares - - - - - (1,042,061) (1,042,061) - - - (1,042,061) - (1,042,061)
Net income for the year ended December 31, 2016 - - - - - 2,636,375 2,636,375 - - - 2,636,375 25,246 2,661,621 Other comprehensive income for the year ended
December 31, 2016 - - - - - (9,016) (9,016) (29,920) (496,226) (526,146) (535,162) (174) (535,336) Cash dividends on subsidiaries - - - - - - - - - - - (16,185) (16,185) BALANCE AT DECEMBER 31, 2016 26,051,524 - 32,413 4,374,367 558,842 3,740,039 8,673,248 1,272,308 (80,177) 1,192,131 35,949,316 269,140 36,218,456 Appropriation of the 2016 earnings
Legal reserve - - - 790,913 - (790,913) - - - - - - - Special reserve - - - - 26,364 (26,364) - - - - - - - Cash dividends on common shares - - - - - (1,172,319) (1,172,319) - - - (1,172,319) - (1,172,319)
Net income for the year ended December 31, 2017 - - - - - 2,744,987 2,744,987 - - - 2,744,987 21,048 2,766,035 Other comprehensive income for the year ended
December 31, 2017 - - - - - 8,565 8,565 1,073,393 (685,267) 388,126 396,691 128 396,819 Issuance of preference shares - 2,000,000 8,000,000 - - - - - - - 10,000,000 - 10,000,000 Cash dividends on subsidiaries - - - - - - - - - - - (22,426) (22,426) BALANCE AT DECEMBER 31, 2017 $ 26,051,524 $ 2,000,000 $ 8,032,413 $ 5,165,280 $ 585,206 $ 4,503,995 $ 10,254,481 $ 2,345,701 $ (765,444) $ 1,580,257 $ 47,918,675 $ 267,890 $ 48,186,565 The accompanying notes are an integral part of the consolidated financial statements.

- 12 -
UNION BANK OF TAIWAN AND SUBSIDIARIES CONSOLIDATED STATEMENTS OF CASH FLOWS FOR THE YEARS ENDED DECEMBER 31, 2017 AND 2016 (In Thousands of New Taiwan Dollars)
2017 2016 CASH FLOWS FROM OPERATING ACTIVITIES
Income before income tax $ 3,386,571 $ 3,310,787 Adjustments for:
Depreciation expenses 1,873,385 1,760,952 Amortization expenses 64,125 59,908 Provision of allowance for doubtful accounts 356,861 171,542 Gain on disposal of financial assets designated as at fair value
through profit or loss (356,479) (382,758) Interest expenses 3,677,756 3,709,965 Interest revenues (10,268,804) (10,014,337) Dividend income (241,044) (220,255) Share of loss of associates 326 347 Gain on disposal of properties and equipment (17,565) (27,242) Gain on disposal of investments (645,405) (299,132) Impairment loss recognized on financial assets 799 50,000 Reversal of impairment losses on nonfinancial assets - (717) Loss on disposal of collaterals - 241
Changes in operating assets and liabilities Due from the Central Bank and call loans to banks (3,641,413) (1,496) Financial assets at fair value through profit or loss (1,823,629) 142,775 Accounts receivable (224,260) (2,779,464) Discounts and loans (34,455,640) (3,746,390) Available-for-sale financial assets 6,348,871 (16,399,445) Held-to maturity financial assets (44,498,510) (2,957,960) Other financial assets 9,694,362 3,809,276 Due to the Central Bank and other banks 859,873 4,607,336 Financial liabilities at fair value through profit or loss (278,773) (259,375) Securities sold under repurchase agreements 1,399,839 1,887,201 Accounts payable 65,695 2,895,895 Deposits 17,430,555 10,600,809 Other financial liabilities 2,155 (843) Provisions for employee benefits (2,089) (806,649) Other liabilities 899 -
Cash used in operations (51,291,539) (4,889,029) Interest received 10,274,544 9,874,024 Dividends received 245,551 225,590 Interest paid (3,615,966) (3,686,394) Income tax returned (paid) (67,642) 1,012
Net cash generated from (used in) operating activities (44,455,052) 1,525,203
(Continued)
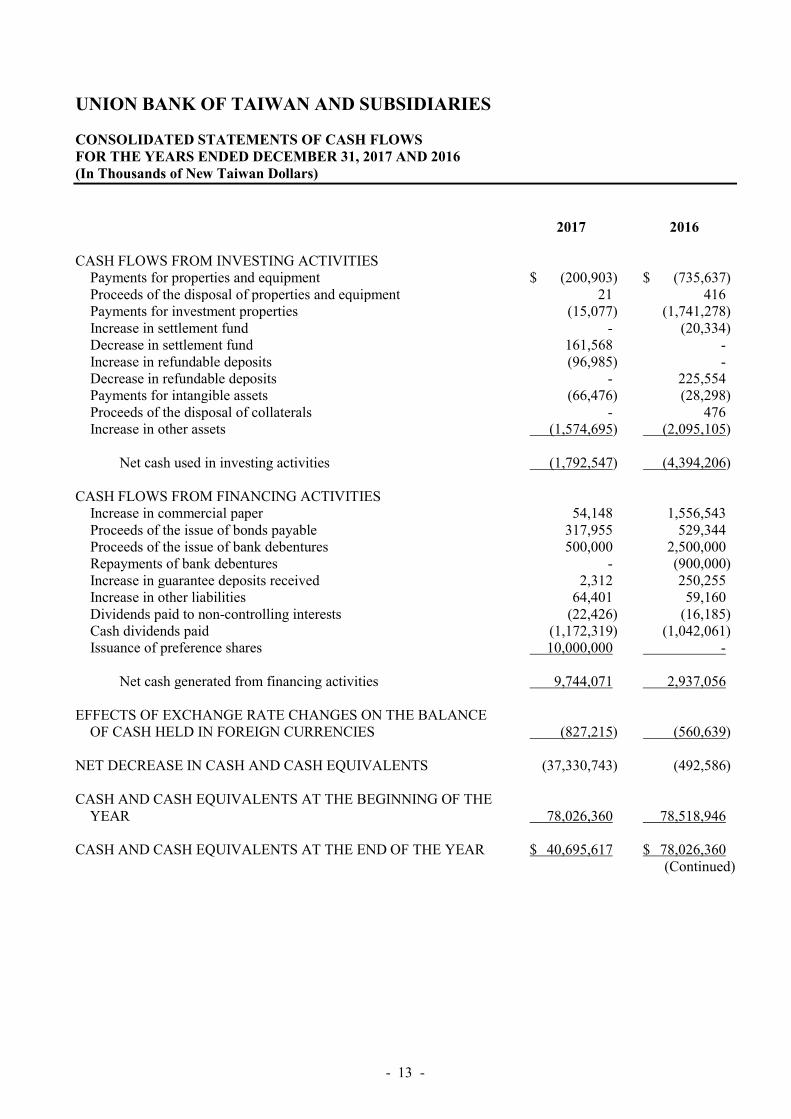
- 13 -
UNION BANK OF TAIWAN AND SUBSIDIARIES CONSOLIDATED STATEMENTS OF CASH FLOWS FOR THE YEARS ENDED DECEMBER 31, 2017 AND 2016 (In Thousands of New Taiwan Dollars)
2017 2016 CASH FLOWS FROM INVESTING ACTIVITIES
Payments for properties and equipment $ (200,903) $ (735,637) Proceeds of the disposal of properties and equipment 21 416 Payments for investment properties (15,077) (1,741,278) Increase in settlement fund - (20,334) Decrease in settlement fund 161,568 - Increase in refundable deposits (96,985) - Decrease in refundable deposits - 225,554 Payments for intangible assets (66,476) (28,298) Proceeds of the disposal of collaterals - 476 Increase in other assets (1,574,695) (2,095,105)
Net cash used in investing activities (1,792,547) (4,394,206)
CASH FLOWS FROM FINANCING ACTIVITIES
Increase in commercial paper 54,148 1,556,543 Proceeds of the issue of bonds payable 317,955 529,344 Proceeds of the issue of bank debentures 500,000 2,500,000 Repayments of bank debentures - (900,000) Increase in guarantee deposits received 2,312 250,255 Increase in other liabilities 64,401 59,160 Dividends paid to non-controlling interests (22,426) (16,185) Cash dividends paid (1,172,319) (1,042,061) Issuance of preference shares 10,000,000 -
Net cash generated from financing activities 9,744,071 2,937,056
EFFECTS OF EXCHANGE RATE CHANGES ON THE BALANCE
OF CASH HELD IN FOREIGN CURRENCIES (827,215) (560,639) NET DECREASE IN CASH AND CASH EQUIVALENTS (37,330,743) (492,586) CASH AND CASH EQUIVALENTS AT THE BEGINNING OF THE
YEAR 78,026,360 78,518,946 CASH AND CASH EQUIVALENTS AT THE END OF THE YEAR $ 40,695,617 $ 78,026,360
(Continued)

- 14 -
UNION BANK OF TAIWAN AND SUBSIDIARIES CONSOLIDATED STATEMENTS OF CASH FLOWS FOR THE YEARS ENDED DECEMBER 31, 2017 AND 2016 (In Thousands of New Taiwan Dollars)
Reconciliation of the cash and cash equivalents reported in the consolidated statements of cash flows with those reported in the consolidated balance sheets as of December 31, 2017 and 2016: December 31 2017 2016 Cash and cash equivalents in the consolidated balance sheets $ 12,136,172 $ 10,971,118 Due from the Central Bank and call loans to banks that meet the
definition of cash and cash equivalents in IAS 7 “Cash Flow Statements” 325,111 39,200,000
Securities purchased under agreements to resell that meet the definition of cash and cash equivalents in IAS 7 28,234,334 27,855,242
Cash and cash equivalents in consolidated statements of cash flows $ 40,695,617 $ 78,026,360 The accompanying notes are an integral part of the consolidated financial statements. (Concluded)

- 15 -
UNION BANK OF TAIWAN AND SUBSIDIARIES NOTES TO CONSOLIDATED FINANCIAL STATEMENTS FOR THE YEARS ENDED DECEMBER 31, 2017 AND 2016 (In Thousands of New Taiwan Dollars, Unless Stated Otherwise)
1. GENERAL INFORMATION
The Union Bank of Taiwan (the Bank) obtained approval from the Ministry of Finance (MOF) to be established on August 1, 1991 and was incorporated on December 31, 1991. It started operations on January 21, 1992. The Bank engages in activities allowed under the Banking Law, which cover deposits, loans, discounts, remittances, acceptances, issuance of guarantees and letters of credit, short-term bills transactions, investments, foreign exchange transactions, savings, trust, etc. On the Bank’s merger with Chung Shing Bank on March 19, 2005, the Bank took over all of the assets, liabilities and operating units of Chung Shing Bank. The Bank merged with the Union Bills Finance Corporation (UBF) on August 16, 2010, with the Bank as the survivor entity. On August 26, 2015, the board of directors of the Bank resolved to merge UIB in order to integrate the resources, strengthen management and business synergy. The merger is approved by FSC (Rule No. 10502022990). The effective date of this merger is August 1, 2016. As of December 31, 2017, the Bank’s operating units included Banking, Trust, Wealth Management, Security Finance, Bills Finance, International Banking Department of the Head Office, Union Insurance Brokerage agency, an Offshore Banking Unit (OBU), two overseas representative offices in Hong Kong and Vietnam, and 90 domestic branches (including Business Department). The operations of the Bank’s Trust Department are (1) trust business planning, managing and operating; and (2) custody of nondiscretionary trust funds in domestic and overseas securities and mutual funds. These foregoing operations are regulated under the Banking Law and Trust Law. The Bank’s shares are traded on the Taiwan Stock Exchange.
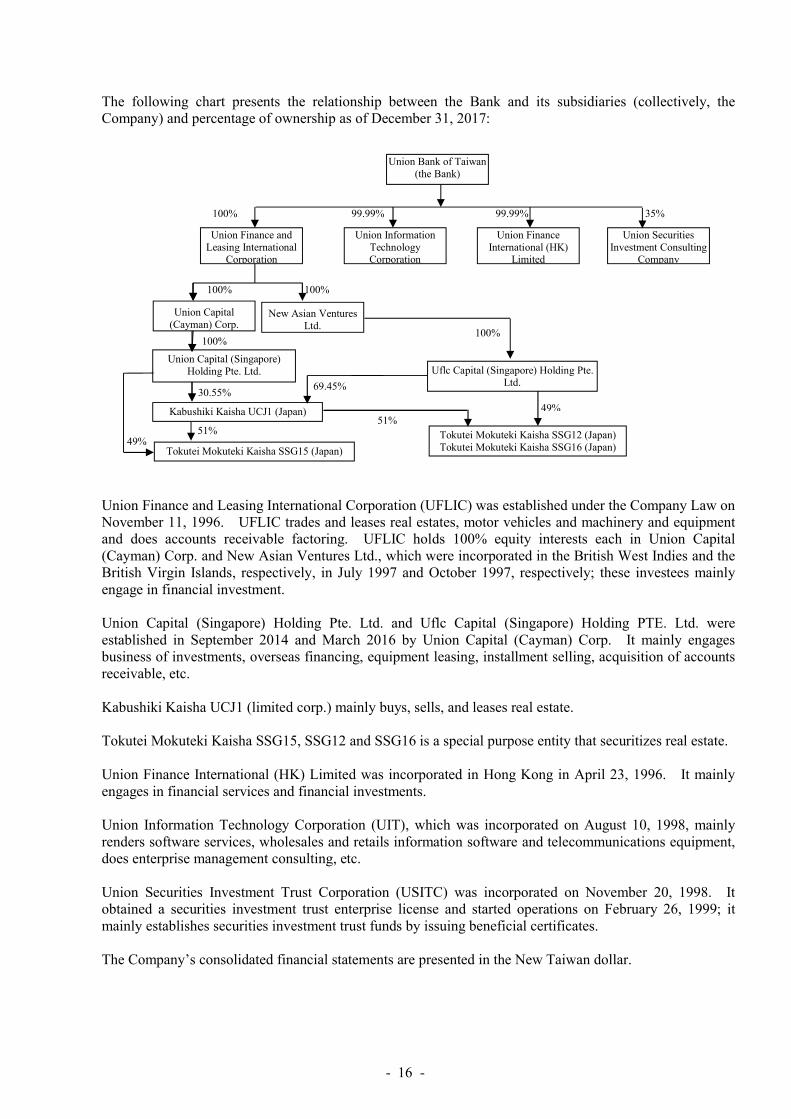
- 16 -
Union Bank of Taiwan (the Bank)
Union Securities Investment Consulting
Company
35%
Union Finance and Leasing International
Corporation
Union Information Technology Corporation
Union Finance International (HK)
Limited
100% 99.99% 99.99%
Union Capital (Singapore) Holding Pte. Ltd.
100%
30.55%
51% 49%
Kabushiki Kaisha UCJ1 (Japan)
Tokutei Mokuteki Kaisha SSG15 (Japan)
Union Capital (Cayman) Corp.
100%
New Asian Ventures Ltd.
100%
Uflc Capital (Singapore) Holding Pte. Ltd.
Tokutei Mokuteki Kaisha SSG12 (Japan) Tokutei Mokuteki Kaisha SSG16 (Japan)
100%
49%
69.45%
51%
The following chart presents the relationship between the Bank and its subsidiaries (collectively, the Company) and percentage of ownership as of December 31, 2017: Union Finance and Leasing International Corporation (UFLIC) was established under the Company Law on November 11, 1996. UFLIC trades and leases real estates, motor vehicles and machinery and equipment and does accounts receivable factoring. UFLIC holds 100% equity interests each in Union Capital (Cayman) Corp. and New Asian Ventures Ltd., which were incorporated in the British West Indies and the British Virgin Islands, respectively, in July 1997 and October 1997, respectively; these investees mainly engage in financial investment. Union Capital (Singapore) Holding Pte. Ltd. and Uflc Capital (Singapore) Holding PTE. Ltd. were established in September 2014 and March 2016 by Union Capital (Cayman) Corp. It mainly engages business of investments, overseas financing, equipment leasing, installment selling, acquisition of accounts receivable, etc. Kabushiki Kaisha UCJ1 (limited corp.) mainly buys, sells, and leases real estate. Tokutei Mokuteki Kaisha SSG15, SSG12 and SSG16 is a special purpose entity that securitizes real estate. Union Finance International (HK) Limited was incorporated in Hong Kong in April 23, 1996. It mainly engages in financial services and financial investments. Union Information Technology Corporation (UIT), which was incorporated on August 10, 1998, mainly renders software services, wholesales and retails information software and telecommunications equipment, does enterprise management consulting, etc. Union Securities Investment Trust Corporation (USITC) was incorporated on November 20, 1998. It obtained a securities investment trust enterprise license and started operations on February 26, 1999; it mainly establishes securities investment trust funds by issuing beneficial certificates. The Company’s consolidated financial statements are presented in the New Taiwan dollar.
- 17 -
2. APPROVAL OF FINANCIAL STATEMENTS The consolidated financial statements were approved by the Bank’s board of directors and authorized for issue on March 14, 2018.
3. APPLICATION OF NEW, AMENDED AND REVISED STANDARDS AND INTERPRETATIONS a. Initial application of the amendments to the Regulations Governing the Preparation of Financial Reports
by Public Banks and the International Financial Reporting Standards (IFRS), International Accounting Standards (IAS), Interpretations of IFRS (IFRIC), and Interpretations of IAS (SIC) (collectively, the “IFRSs”) endorsed and issued into effect by the FSC Except for the following, the initial application of the amendments to the Regulations Governing the Preparation of Financial Reports by Public Banks and the IFRSs endorsed and issued into effect by the FSC did not have any material impact on the Company’s accounting policies: 1) Amendment to IAS 36 “Recoverable Amount Disclosures for Non-financial Assets”
The amendment clarifies that the recoverable amount of an asset or a cash-generating unit is disclosed only when an impairment loss on the asset has been recognized or reversed during the period. Furthermore, if the recoverable amount of an item of property, plant and equipment for which impairment loss has been recognized or reversed is fair value less costs of disposal, the Company is required to disclose the fair value hierarchy. If the fair value measurements are categorized within (Level 2/Level 3), the valuation technique and key assumptions used to measure the fair value are disclosed. The discount rate used is disclosed if such fair value less costs of disposal is measured by using the present value technique.
2) Annual Improvements to IFRSs: 2010-2012 Cycle Several standards, including IFRS 2 “Share-based Payment”, IFRS 3 “Business Combinations” and IFRS 8 “Operating Segments”, were amended in this annual improvement. The amended IFRS 8 requires the Company to disclose the judgments made by management in applying the aggregation criteria to operating segments, including a description of the operating segments aggregated and the economic indicators assessed in determining whether the operating segments have “similar economic characteristics”. The amendment also clarifies that a reconciliation of the total of the reportable segments’ assets to the entity’s assets should only be provided if the segments’ assets are regularly provided to the chief operating decision-maker. When the amended IFRS 13 became effective in 2017, the short-term receivables and payables with no stated interest rate are measured at their invoice amounts without discounting, if the effect of not discounting is immaterial. IAS 24 “Related Party Disclosures” was amended to clarify that a management entity providing key management personnel services to the Company is a related party of the Company. Consequently, the Company is required to disclose as related party transactions the amounts incurred for the services paid or payable to the management entity for the provision of key management personnel services. However, disclosure of the components of such compensation is not required. When the amendment becomes effective in 2017, Company which provides key management personnel services to the Company, should be classified retrospectively as a related party and disclosed accordingly (refer to Note 40).

- 18 -
3) Annual Improvements to IFRSs: 2011-2013 Cycle Several standards, including IFRS 3, IFRS 13 and IAS 40 “Investment Property”, were amended in this annual improvement. IFRS 3 was amended to clarify that IFRS 3 does not apply to the accounting for the formation of all types of joint arrangements in the financial statements of the joint arrangement itself. The amendment is applied prospectively starting from January 1, 2017. The scope in IFRS 13 of the portfolio exception for measuring the fair value of the Company of financial assets and financial liabilities on a net basis was amended to clarify that it includes all contracts that are within the scope of, and accounted for in accordance with, IAS 39 or IFRS 9, even those contracts which do not meet the definitions of financial assets or financial liabilities within IAS 32. IAS 40 was amended to clarify that IAS 40 and IFRS 3 are not mutually exclusive and the application of both standards may be required to determine whether the investment property acquired is an acquisition of an asset or a business combination. The amendment is applied prospectively to acquisitions of investment property on or after January 1, 2017.
4) Amendments to IAS 16 and IAS 38 “Clarification of Acceptable Methods of Depreciation and Amortization” The entity should use appropriate depreciation and amortization method to reflect the pattern in which the future economic benefits of the property, plant and equipment and intangible asset are expected to be consumed by the entity. The amended IAS 16 “Property, Plant and Equipment” stipulates that a depreciation method that is based on revenue that is generated by an activity that includes the use of an asset is not appropriate. The amended standard does not provide any exception from this requirement. The amended IAS 38 “Intangible Assets” clarifies there is a rebuttable presumption that an amortization method that is based on revenue that is generated by an activity that includes the use of an intangible asset is not appropriate. This presumption can be overcome only in the following limited circumstances when: a) The intangible asset is expressed as a measure of revenue (for example, when there is a contract
that specifies the entity’s use of the intangible asset will expire upon the achievement of a revenue threshold); or
b) It can be demonstrated that revenue and the consumption of the economic benefits of the
intangible asset are highly correlated.
5) Annual Improvements to IFRSs: 2012-2014 Cycle Several standards, including IFRS 5 “Non-current assets held for sale and discontinued operations”, IFRS 7, IAS 19 and IAS 34 were amended in this annual improvement. IFRS 5 was amended to clarify that reclassification between non-current assets (or disposal Company) “held for sale” and non-current assets “held for distribution to owners” does not constitute a change to a plan of sale or distribution. Therefore, the previous accounting treatment is not reversed. The amendment also explains that assets that no longer meet the criteria for “held for distribution to owners” and do not meet the criteria for “held for sale” should be treated in the same way as assets that cease to be classified as held for sale. The amendment is applied prospectively to transactions that occur on or after January 1, 2017.

- 19 -
6) Amendments to IFRS 10, IFRS 12 and IAS 28 “Investment Entities: Applying the Consolidation Exception” The amendments clarify that when the Company (a non-investment entity) applies the equity method to an associate or a joint venture that is an investment entity, the Company may retain the fair value measurements that the associate or joint venture used for its subsidiaries. Prior to the amendments, the associate or joint venture measures its interest in subsidiaries at fair value but the fair value is unwound, and instead, those subsidiaries are consolidated in the associate’s or joint venture’s result in order to be equity-accounted by the Company. When the amendments are applied retrospectively starting from January 1, 2017, the Company elects to retain the measurement applied by the associate or joint venture to its interest in subsidiaries.
7) Amendments to the Regulations Governing the Preparation of Financial Reports by Securities Issuers The amendments include additions of several accounting items and requirements for disclosures of impairment of non-financial assets as a consequence of the IFRSs endorsed and issued into effect by the FSC. In addition, as a result of the post implementation review of IFRSs in Taiwan, the amendments also include an emphasis on certain recognition and measurement considerations and add requirements for disclosures of related party transactions and goodwill. The amendments stipulate that other companies or institutions of which the chairman of the board of directors or president serves as the chairman of the board of directors or the president of the Company, or is the spouse or second immediate family of the chairman of the board of directors or president of the Company, are deemed to have a substantive related party relationship, unless it can be demonstrated that no control, joint control, or significant influence exists. Furthermore, the amendments require the disclosure of the names of the related parties and the relationships with whom the Company has significant transactions. If the transaction amount or balance with a specific related party is 10% or more of the Company’s respective total transaction or balance, such transactions should be separately disclosed by the name of each related party. The amendments also require additional disclosure if there is a significant difference between the actual operation conditions after a business combination and the expected benefits at the acquisition date. When the amendments are applied retrospectively from January 1, 2017, the disclosures of related party transactions and impairment of goodwill are enhanced. Refer to Note 40.
b. The Regulations Governing the Preparation of Financial Reports by Public Banks and the International
Financial Reporting Standards (IFRS), International Accounting Standards (IAS), Interpretations of IFRS (IFRIC), and Interpretations of IAS (SIC) (collectively, the “IFRSs”) endorsed by the FSC for application starting from 2018
New IFRSs Effective Date
Announced by IASB (Note 1) Annual Improvements to IFRSs 2014-2016 Cycle Note 2 Amendments to IFRS 2 “Classification and Measurement of
Share-based Payment Transactions” January 1, 2018
IFRS 9 “Financial Instruments” January 1, 2018 Amendments to IFRS 9 and IFRS 7 “Mandatory Effective Date of
IFRS 9 and Transition Disclosures” January 1, 2018
Amendments to IFRS 9 “Prepayment Features with Negative Compensation”
January 1, 2019
(Continued)

- 20 -
New IFRSs Effective Date
Announced by IASB (Note 1) IFRS 15 “Revenue from Contracts with Customers” January 1, 2018 Amendments to IFRS 15 “Clarifications to IFRS 15 Revenue from
Contracts with Customers” January 1, 2018
IFRS 16 “Leases” January 1, 2019 Amendment to IAS 7 “Disclosure Initiative” January 1, 2017 Amendments to IAS 12 “Recognition of Deferred Tax Assets for
Unrealized Losses” January 1, 2017
Amendments to IAS 40 “Transfers of Investment Property” January 1, 2018 IFRIC 22 “Foreign Currency Transactions and Advance
Consideration” January 1, 2018
(Concluded) Note 1: Unless stated otherwise, the above New IFRSs are effective for annual periods beginning on
or after their respective effective dates. Note 2: The amendment to IFRS 12 is retrospectively applied for annual periods beginning on or after
January 1, 2017; the amendments to IAS 28 are retrospectively applied for annual periods beginning on or after January 1, 2018.
1) Annual Improvements to IFRSs 2014-2016 Cycle
Several standards, including IFRS 12 “Disclosure of Interests in Other Entities” and IAS 28 “Investments in Associates and Joint Ventures,” were amended in this annual improvement. The amendment to IFRS 12 clarifies that when an entity’s interest in a subsidiary, a joint venture or an associate is classified as held for sale or is included in a disposal group that is classified as held for sale, the entity is not required to disclose summarized financial information of that subsidiary, joint venture or associate in accordance with IFRS 12. However, all other requirements in IFRS 12 apply to interests in entities classified as held for sale in accordance with IFRS 5. The Group will apply the aforementioned amendment retrospectively.
2) IFRS 9 “Financial Instruments” and related amendments Classification, measurement and impairment of financial assets With regard to financial assets, all recognized financial assets that are within the scope of IAS 39 “Financial Instruments: Recognition and Measurement” are subsequently measured at amortized cost or fair value. Under IFRS 9, the requirement for the classification of financial assets is stated below. For the Company’s debt instruments that have contractual cash flows that are solely payments of principal and interest on the principal amount outstanding, their classification and measurement are as follows: a) For debt instruments, if they are held within a business model whose objective is to collect
contractual cash flows, the financial assets are measured at amortized cost and are assessed for impairment continuously with any impairment loss recognized in profit or loss. Interest revenue is recognized in profit or loss by using the effective interest method;

- 21 -
b) For debt instruments, if they are held within a business model whose objective is achieved by both collecting contractual cash flows and selling financial assets, the financial assets are measured at fair value through other comprehensive income (FVTOCI) and are assessed for impairment. Interest revenue is recognized in profit or loss by using the effective interest method, and other gains or losses shall be recognized in other comprehensive income, except for impairment gains or losses and foreign exchange gains and losses. When the debt instruments are derecognized or reclassified, the cumulative gain or loss previously recognized in other comprehensive income is reclassified from equity to profit or loss.
Except for the above, all other financial assets are measured at fair value through profit or loss. However, the Company may make an irrevocable election to present subsequent changes in the fair value of an equity investment (that is not held for trading) in other comprehensive income, with only dividend income generally recognized in profit or loss. No subsequent impairment assessment is required, and the cumulative gain or loss previously recognized in other comprehensive income cannot be reclassified from equity to profit or loss. The Company analyzed the facts and circumstances of its financial assets that exist at December 31, 2017 and performed the assessment of the impact of IFRS 9 on the classification and measurement of financial assets. Under IFRS 9: a) Listed shares, emerging market shares, and unlisted shares classified as available-for-sale will
be classified as at fair value through profit or loss. Listed shares, emerging market shares, and unlisted shares classified as available-for-sale will be designated as at fair value through other comprehensive income and the fair value gains or losses accumulated in other equity will be transferred directly to retained earnings instead of being reclassified to profit or loss on disposal. Besides this, unlisted shares measured at cost will be measured at fair value instead;
b) Mutual funds classified as available-for-sale will be classified as at fair value through profit or
loss because the contractual cash flows are not solely payments of principal and interest on the principal outstanding and they are not equity instruments; and
c) Debt investments classified as held-to-maturity financial assets/debt investments with no active
market and measured at amortized cost will be classified as measured at amortized cost under IFRS 9 because, on initial recognition, the contractual cash flows that are solely payments of principal and interest on the principal outstanding and these investments are held within a business model whose objective is to collect contractual cash flows/will be classified as at fair value through other comprehensive income under IFRS 9, because, on initial recognition, the contractual cash flows that are solely payments of principal and interest on the principal outstanding and these investments are held within a business model whose objective is achieved both by collecting contractual cash flows and selling financial assets/will be classified as at fair value through profit or loss, because, on initial recognition, the contractual cash flows are solely payments of principal and interest on the principal outstanding but the objective of the Company’s business model is not to collect contractual cash flows and neither is it achieved both by collecting contractual cash flows and selling financial assets/will be classified as at fair value through profit or loss, because, on initial recognition, the contractual cash flows are not solely payments of principal and interest on the principal outstanding.
IFRS 9 requires impairment loss on financial assets to be recognized by using the “Expected Credit Losses Model”. A loss allowance is required for financial assets measured at amortized cost, investments in debt instruments measured at FVTOCI, lease receivables, contract assets arising from IFRS 15 “Revenue from Contracts with Customers”, certain written loan commitments and financial guarantee contracts. A loss allowance for 12-month expected credit losses is required for a financial asset if its credit risk has not increased significantly since initial recognition. A loss allowance for full-lifetime expected credit losses is required for a financial asset if its credit risk has increased significantly since initial recognition and is not low. However, a loss allowance for
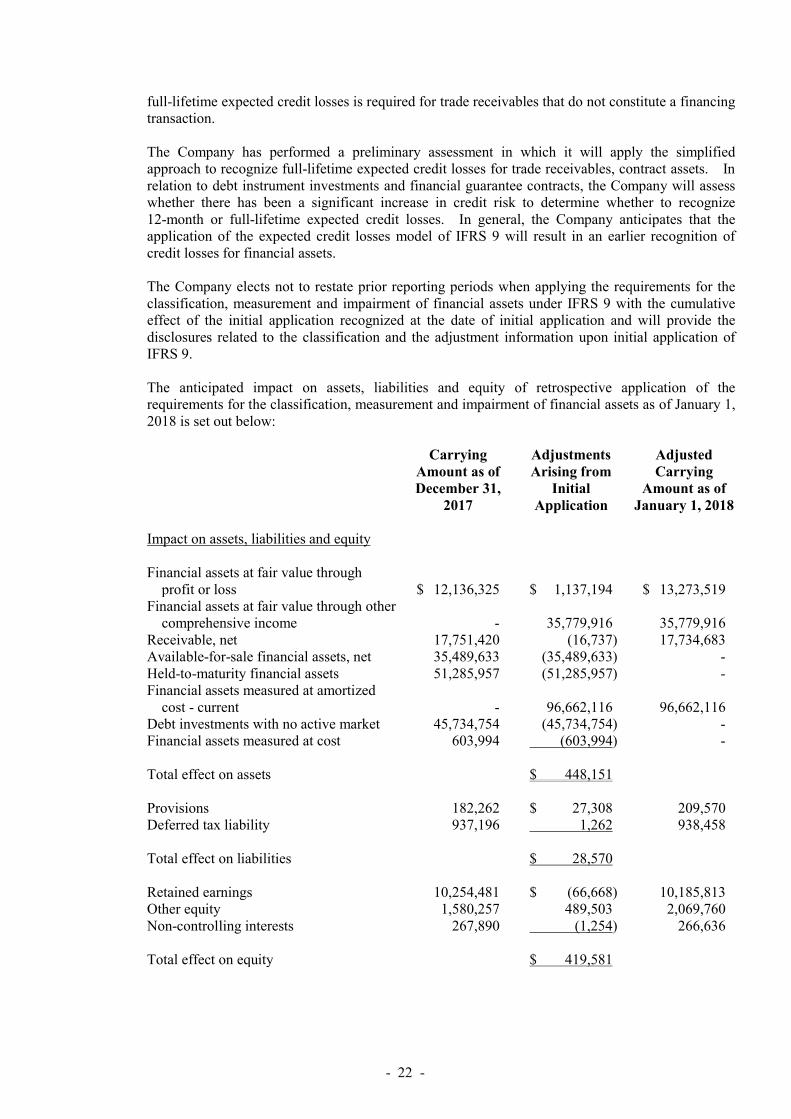
- 22 -
full-lifetime expected credit losses is required for trade receivables that do not constitute a financing transaction. The Company has performed a preliminary assessment in which it will apply the simplified approach to recognize full-lifetime expected credit losses for trade receivables, contract assets. In relation to debt instrument investments and financial guarantee contracts, the Company will assess whether there has been a significant increase in credit risk to determine whether to recognize 12-month or full-lifetime expected credit losses. In general, the Company anticipates that the application of the expected credit losses model of IFRS 9 will result in an earlier recognition of credit losses for financial assets. The Company elects not to restate prior reporting periods when applying the requirements for the classification, measurement and impairment of financial assets under IFRS 9 with the cumulative effect of the initial application recognized at the date of initial application and will provide the disclosures related to the classification and the adjustment information upon initial application of IFRS 9. The anticipated impact on assets, liabilities and equity of retrospective application of the requirements for the classification, measurement and impairment of financial assets as of January 1, 2018 is set out below:
Carrying Amount as of December 31,
2017
Adjustments Arising from
Initial Application
Adjusted Carrying
Amount as of January 1, 2018
Impact on assets, liabilities and equity Financial assets at fair value through
profit or loss $ 12,136,325 $ 1,137,194 $ 13,273,519 Financial assets at fair value through other
comprehensive income - 35,779,916 35,779,916 Receivable, net 17,751,420 (16,737) 17,734,683 Available-for-sale financial assets, net 35,489,633 (35,489,633) - Held-to-maturity financial assets 51,285,957 (51,285,957) - Financial assets measured at amortized
cost - current - 96,662,116 96,662,116 Debt investments with no active market 45,734,754 (45,734,754) - Financial assets measured at cost 603,994 (603,994) - Total effect on assets $ 448,151 Provisions 182,262 $ 27,308 209,570 Deferred tax liability 937,196 1,262 938,458 Total effect on liabilities $ 28,570 Retained earnings 10,254,481 $ (66,668) 10,185,813 Other equity 1,580,257 489,503 2,069,760 Non-controlling interests 267,890 (1,254) 266,636 Total effect on equity $ 419,581
- 23 -
3) IFRS 15 “Revenue from Contracts with Customers” and related amendment IFRS 15 establishes principles for recognizing revenue that apply to all contracts with customers, and will supersede IAS 18 “Revenue”, IAS 11 “Construction Contracts” and a number of revenue-related interpretations. When applying IFRS 15, an entity shall recognize revenue by applying the following steps: Identify the contract with the customer; Identify the performance obligations in the contract; Determine the transaction price; Allocate the transaction price to the performance obligations in the contract; and Recognize revenue when the entity satisfies a performance obligation. In identifying performance obligations, IFRS 15 and related amendment require that a good or service is distinct if it is capable of being distinct (for example, the Company regularly sells it separately) and the promise to transfer it is distinct within the context of the contract (i.e. the nature of the promise in the contract is to transfer each of those goods or services individually rather than to transfer combined items). Under IFRS 15, the Company will allocate the transaction price to each performance obligation identified in the contract on a relative stand-alone selling price basis. Under current standard, the Company applies residual value method to allocate the amount of revenue to be recognized. Incremental costs of obtaining a contract will be recognized as an asset to the extent the Company expects to recover those costs. Such asset will be amortized on a basis that is consistent with the transfer to the customer of the goods or services to which the asset relates. This will lead to the later recognition of charges for certain customer-obtaining costs. The Company chooses to apply IFRS 15 only to contracts that have not yet been completed on January 1, 2018, and the relevant cumulative effect will be adjusted to retain earning on that date.
4) Amendment to IAS 12 “Recognition of Deferred Tax Assets for Unrealized Losses” The amendment clarifies that the difference between the carrying amount of the debt instrument measured at fair value and its tax base gives rise to a temporary difference, even though there are unrealized losses on that asset, irrespective of whether the Company expects to recover the carrying amount of the debt instrument by sale or by holding it and collecting contractual cash flows. In addition, in determining whether to recognize a deferred tax asset, the Company should assess a deductible temporary difference in combination with all of its other deductible temporary differences, unless the tax law restricts the utilization of losses as deduction against income of a specific type, in which case, a deductible temporary difference is assessed in combination only with other deductible temporary differences of the appropriate type. The amendment also stipulates that, when determining whether to recognize a deferred tax asset, the estimate of probable future taxable profit may include some of the Company’s assets for more than their carrying amount if there is sufficient evidence that it is probable that the Company will achieve the higher amount, and that the estimate for future taxable profit should exclude tax deductions resulting from the reversal of deductible temporary differences. In assessing a deferred tax asset, the Company currently assumes it will recover the asset at its carrying amount when estimating probable future taxable profit; the amendments will be applied retrospectively in 2018.
- 24 -
5) Amendments to IAS 40 “Transfers of Investment Property” The amendments clarify that the Company should transfer to, or from, investment property when, and only when, the property meets, or ceases to meet, the definition of investment property and there is evidence of the change in use. In isolation, a change in management’s intentions for the use of a property does not provide evidence of a change in use. The amendments also clarify that the evidence of the change in use is not limited to those illustrated in IAS 40.
6) IFRIC 22 “Foreign Currency Transactions and Advance Consideration” IAS 21 stipulated that a foreign currency transaction shall be recorded on initial recognition in the functional currency by applying to the foreign currency amount the spot exchange rate between the functional currency and the foreign currency at the date of the transaction. IFRIC 22 further explains that the date of the transaction is the date on which an entity recognizes a non-monetary asset or non-monetary liability from payment or receipt of advance consideration. If there are multiple payments or receipts in advance, the entity shall determine the date of the transaction for each payment or receipt of advance consideration. The Company will apply IFRIC 22 prospectively to all assets, expenses and income recognized on or after January 1, 2018 within the scope of the interpretation.
d. New IFRSs in issue but not yet endorsed and issued into effect by the FSC
New IFRSs Effective Date
Announced by IASB (Note 1) Annual Improvements to IFRSs 2015-2017 Cycle January 1, 2019 Amendments to IFRS 9 “Prepayment Features with Negative
Compensation” January 1, 2019
Amendments to IFRS 10 and IAS 28 “Sale or Contribution of Assets between an Investor and Its Associate or Joint Venture”
To be determined by IASB
IFRS 16 “Leases” January 1, 2019 (Note 3) IFRS 17 “Insurance Contracts” January 1, 2021 Amendments to IAS 19 “Plan Amendment, Curtailment or
Settlement” January 1, 2019 (Note 4)
Amendments to IAS 28 “Long-term Interests in Associates and Joint Ventures”
January 1, 2019
IFRIC 23 “Uncertainty Over Income Tax Treatments” January 1, 2019 Note 1: Unless stated otherwise, the above New IFRSs are effective for annual periods beginning on
or after their respective effective dates. Note 2: The FSC permits the election for early adoption of the amendments starting from 2018. Note 3: On December 19, 2017, the FSC announced that IFRS 16 will take effect starting from
January 1, 2019. Note 4: The Company shall apply these amendments to plan amendments, curtailments or settlements
occurring on or after January 1, 2019.

- 25 -
1) Amendments to IFRS 10 and IAS 28 “Sale or Contribution of Assets between an Investor and its Associate or Joint Venture” The amendments stipulate that, when the Company sells or contributes assets that constitute a business (as defined in IFRS 3) to an associate or joint venture, the gain or loss resulting from the transaction is recognized in full. Also, when the bank loses control of a subsidiary that contains a business but retains significant influence or joint control, the gain or loss resulting from the transaction is recognized in full. Conversely, when the Company sells or contributes assets that do not constitute a business to an associate or joint venture, the gain or loss resulting from the transaction is recognized only to the extent of the unrelated investors’ interest in the associate or joint venture, i.e. the Company’s share of the gain or loss is eliminated. Also, when the Company loses control of a subsidiary that does not contain a business but retains significant influence or joint control over an associate or a joint venture, the gain or loss resulting from the transaction is recognized only to the extent of the unrelated investors’ interest in the associate or joint venture, i.e. the Company’s share of the gain or loss is eliminated.
2) IFRS 16 “Leases” IFRS 16 sets out the accounting standards for leases that will supersede IAS 17 and a number of related interpretations. Under IFRS 16, if the Company is a lessee, it shall recognize right-of-use assets and lease liabilities for all leases on the consolidated balance sheets except for low-value and short-term leases. The Company may elect to apply the accounting method similar to the accounting for operating leases under IAS 17 to low-value and short-term leases. On the statements of comprehensive income, the Company should present the depreciation expense charged on right-of-use assets separately from the interest expense accrued on lease liabilities; interest is computed by using the effective interest method. On the statements of cash flows, cash payments for the principal portion of lease liabilities are classified within financing activities; cash payments for the interest portion are classified within operating activities. The application of IFRS 16 is not expected to have a material impact on the accounting of the Company as lessor. When IFRS 16 becomes effective, the Company may elect to apply this standard either retrospectively to each prior reporting period presented or retrospectively with the cumulative effect of the initial application of this standard recognized at the date of initial application.
3) IFRIC 23 “Uncertainty Over Income Tax Treatments” IFRIC 23 clarifies that when there is uncertainty over income tax treatments, the Company should assume that the taxation authority will have full knowledge of all related information when making related examinations. If the Company concludes that it is probable that the taxation authority will accept an uncertain tax treatment, the Company should determine the taxable profit, tax bases, unused tax losses, unused tax credits or tax rates consistently with the tax treatments used or planned to be used in its income tax filings. If it is not probable that the taxation authority will accept an uncertain tax treatment, the Company should make estimates using either the most likely amount or the expected value of the tax treatment, depending on which method the Company expects to better predict the resolution of the uncertainty. The Company has to reassess its judgments and estimates if facts and circumstances change.
- 26 -
On initial application, the Company shall apply IFRIC 23 either retrospectively to each prior reporting period presented, if this is possible without the use of hindsight, or retrospectively with the cumulative effect of the initial application of IFRIC 23 recognized at the date of initial application.
4) Amendments to IFRS 9 “Prepayment Features with Negative Compensation” IFRS 9 stipulated that if a contractual term of a financial asset permits the issuer (i.e. the debtor) to prepay a debt instrument or permits the holder (i.e. the creditor) to put a debt instrument back to the issuer before maturity and the prepayment amount substantially represents unpaid amounts of principal and interest on the principal amount outstanding, which may include reasonable compensation for early termination, the financial asset has contractual cash flows that are solely payments of principal and interest on the principal amount outstanding. The amendments further explained that reasonable compensation may be paid or received by either of the parties, i.e. a party may receive reasonable compensation when it chooses to terminate the contract early. When the amendments become effective, the Company shall apply the amendments retrospectively. However, the Company may elect to recognize the cumulative effect of the initial application of the amendments in the opening carrying amount at the date of initial application, or to restate prior periods if, and only if, it is possible without the use of hindsight.
5) Annual Improvements to IFRSs 2015-2017 Cycle Several standards, including IFRS 3, IFRS 11, IAS 12 and IAS 23 “Borrowing Costs”, were amended in this annual improvement. IAS 23 was amended to clarify that, if any specific borrowing remains outstanding after the related asset is ready for its intended use or sale, that borrowing becomes part of the funds that an entity borrows generally when calculating the capitalization rate on general borrowings. The amendment shall be applied prospectively.
6) Amendments to IAS 19 “Plan Amendment, Curtailment or Settlement”
The amendments stipulate that, if a plan amendment, curtailment or settlement occurs, the current service cost and the net interest for the remainder of the annual reporting period are determined using the actuarial assumptions used for the remeasurement of the net defined benefit liabilities (assets). In addition, the amendments clarify the effect of a plan amendment, curtailment or settlement on the requirements regarding the asset ceiling. The amendment shall be applied prospectively.
Except for the above impact, as of the date the consolidated financial statements were authorized for issue, the Company is continuously assessing the possible impact that the application of other standards and interpretations will have on the Company’s financial position and financial performance, and will disclose the relevant impact when the assessment is completed.
4. SUMMARY OF SIGNIFICANT ACCOUNTING POLICIES
Statement of Compliance The financial statements have been prepared in accordance with the Regulations Governing the Preparation of Financial Reports by Public Banks and Regulations Governing the Preparation of Financial Reports by Securities Firms.
- 27 -
Basis of Preparation The financial statements have been prepared on the historical cost basis except for financial instruments that are measured at revalued amounts or fair values. Historical cost is generally based on the fair value of the consideration given in exchange for assets. When preparing its financial statements, the Company used the equity method to account for its investment in subsidiaries and associates. In order for the amounts of the net profit for the year, other comprehensive income for the year and total equity in the parent company only financial statements to be the same with the amounts attributable to the owner of the Company in its consolidated financial statements, adjustments arising from the differences in accounting treatment between parent company only basis and consolidated basis were made to investments accounted for using equity method, share of profit or loss of subsidiaries and associates, share of other comprehensive income of subsidiaries, associates and related equity items, as appropriate, in the financial statements. Foreign Currencies In preparing the financial statements of each group entity, transactions in currencies other than the Company’s functional currency (foreign currencies) are recognized at the rates of exchange prevailing at the dates of the transactions. At the end of each reporting period, monetary items denominated in foreign currencies are retranslated at the rates prevailing at that date. Exchange differences on monetary items arising from settlement or translation are recognized in profit or loss in the period in which they arise except for: Exchange differences on monetary items receivable from or payable to a foreign operation for which settlement is neither planned nor likely to occur (therefore forming part of the net investment in the foreign operation), which are recognized initially in other comprehensive income and reclassified from equity to profit or loss on disposal of the net investments. Non-monetary items measured at fair value that are denominated in foreign currencies are retranslated at the rates prevailing at the date when the fair value was determined. Exchange differences arising from the retranslation of non-monetary items are included in profit or loss for the period except for exchange differences arising from the retranslation of non-monetary items in respect of which gains and losses are recognized directly in other comprehensive income, in which cases, the exchange differences are also recognized in other comprehensive income. Non-monetary items that are measured at historical cost in a foreign currency are translated using the exchange rate at the date of the transaction. For the purposes of presenting financial statements, the assets and liabilities of the Company’s foreign operations (including subsidiaries, associates, joint ventures and branches in other countries that use currencies which are different from the currency of the Company) are translated into the presentation currency, the New Taiwan dollars, as follows: Assets and liabilities are translated at the exchange rates prevailing at the end of the reporting period; and income and expense items are translated at the average exchange rates for the period. The resulting currency translation differences are recognized in other comprehensive income. Investments Accounted for Using the Equity Method The Company uses the equity method to account for its investments in subsidiaries and associates. a. Investments in subsidiaries
A subsidiary is an entity (including a structured entity) that is controlled by the Company.

- 28 -
Under the equity method, an investment in a subsidiary is initially recognized at cost and adjusted thereafter to recognize the Company’s share of the profit or loss and other comprehensive income of the subsidiary. The Company also recognizes the changes in the Company’s share of equity of subsidiaries attributable to the Company. Changes in the Company’s ownership interest in a subsidiary that do not result in the Company losing control of the subsidiary are equity transactions. The Company recognizes directly in equity any difference between the carrying amount of the investment and the fair value of the consideration paid or received. When the Company’s share of losses of a subsidiary exceeds its interest in that subsidiary (which includes any carrying amount of the investment accounted for using the equity method and long-term interests that, in substance, form part of the Company’s net investment in the subsidiary), the Company continues recognizing its share of further losses. Any excess of the cost of acquisition over the Company’s share of the net fair value of the identifiable assets and liabilities of a subsidiary at the date of acquisition is recognized as goodwill, which is included within the carrying amount of the investment and is not amortized. Any excess of the Company’s share of the net fair value of the identifiable assets and liabilities over the cost of acquisition is recognized immediately in profit or loss. The Company assesses its investment for any impairment by comparing the carrying amount with the estimated recoverable amount as assessed based on the entire financial statements of the invested company. Impairment loss is recognized when the carrying amount exceeds the recoverable amount. If the recoverable amount of the investment subsequently increases, the Company recognizes the reversal of the impairment loss; the adjusted post-reversal carrying amount should not exceed the carrying amount that would have been recognized had no impairment loss been recognized in prior years. An impairment loss recognized on goodwill cannot be reversed in a subsequent period. When the Company loses control of a subsidiary, it recognizes the investment retained in the former subsidiary at its fair value at the date when control is lost. The difference between the fair value of the retained investment plus any consideration received and the carrying amount of the previous investment at the date when control is lost is recognized as a gain or loss in profit or loss. Besides, the Company accounts for all amounts previously recognized in other comprehensive income in relation to that subsidiary on the same basis as would be required if the Company had directly disposed of the related assets or liabilities. Profits or losses resulting from downstream transactions are eliminated in full only in the parent Bank’s financial statements. Profits and losses resulting from upstream transactions and transactions between subsidiaries are recognized only in the parent Bank’s financial statements only to the extent of interests in the subsidiaries that are not related to the Company.
b. Investment in associates
An associate is an entity over which the Company has significant influence and that is neither a subsidiary nor an interest in a joint venture. The Company uses the equity method to account for its investments in associates. Under the equity method, investments in an associate are initially recognized at cost and adjusted thereafter to recognize the Company’s share of the profit or loss and other comprehensive income of the associate. The Company also recognizes the changes in the Company’s share of the equity of associates attributable to the Group.

- 29 -
Any excess of the cost of acquisition over the Company’s share of the net fair value of the identifiable assets and liabilities of an associate or a joint venture at the date of acquisition is recognized as goodwill, which is included within the carrying amount of the investment and is not amortized. Any excess of the Company’s share of the net fair value of the identifiable assets and liabilities over the cost of acquisition, after reassessment, is recognized immediately in profit or loss. When the Company subscribes for additional new shares of an associate at a percentage different from its existing ownership percentage, the resulting carrying amount of the investment differs from the amount of the Company’s proportionate interest in the associate. The Company records such a difference as an adjustment to investments with the corresponding amount charged or credited to capital surplus - changes in capital surplus from investments in associates accounted for using the equity method. If the Company’s ownership interest is reduced due to its additional subscription of the new shares of the associate, the proportionate amount of the gains or losses previously recognized in other comprehensive income in relation to that associate is reclassified to profit or loss on the same basis as would be required if the investee had directly disposed of the related assets or liabilities. When the adjustment should be debited to capital surplus, but the capital surplus recognized from investments accounted for using the equity method is insufficient, the shortage is debited to retained earnings. When the Company’s share of losses of an associate equals or exceeds its interest in that associate (which includes any carrying amount of the investment accounted for using the equity method and long-term interests that, in substance, form part of the Company’s net investment in the associate), the Company discontinues recognizing its share of further losses. Additional losses and liabilities are recognized only to the extent that the Company has incurred legal obligations, or constructive obligations, or made payments on behalf of that associate. The entire carrying amount of an investment (including goodwill) is tested for impairment as a single asset by comparing its recoverable amount with its carrying amount. Any impairment loss recognized is deducted from the carrying amount of the investment. Any reversal of that impairment loss is recognized to the extent that the recoverable amount of the investment subsequently increases. The Company discontinues the use of the equity method from the date on which its investment ceases to be an associate. Any retained investment is measured at fair value at that date, and the fair value is regarded as the investment’s fair value on initial recognition as a financial asset. The difference between the previous carrying amount of the associate attributable to the retained interest and its fair value is included in the determination of the gain or loss on disposal of the associate. The Company accounts for all amounts previously recognized in other comprehensive income in relation to that associate on the same basis as would be required if that associate had directly disposed of the related assets or liabilities. If an investment in an associate becomes an investment in a joint venture or an investment in a joint venture becomes an investment in an associate, the Company continues to apply the equity method and does not remeasure the retained interest. When the Company entity transacts with its associate, profits and losses resulting from the transactions with the associate are recognized in the Company’ consolidated financial statements only to the extent that interests in the associate are not related to the Company.
Financial Instruments Financial assets and financial liabilities are recognized when the Company entity becomes a party to the contractual provisions of the instruments. Financial assets and financial liabilities are initially measured at fair value. Transaction costs that are directly attributable to an acquisition or issuance of financial assets and financial liabilities (other than financial assets and financial liabilities at fair value through profit or loss) are added to or deducted from the fair value of the financial assets or financial liabilities, as appropriate, on initial recognition. Transaction costs directly attributable to the acquisition of financial assets or financial liabilities at fair value through profit or loss are recognized immediately in profit or loss.

- 30 -
Financial assets All regular way purchases or sales of financial assets are recognized and derecognized on a trade date basis. a. Measurement category
Financial assets are classified into the following categories: Financial assets at fair value through profit or loss, held-to-maturity investments, available-for-sale financial assets, and loans and receivables. 1) Financial assets at fair value through profit or loss
Financial assets are classified as at fair value through profit or loss when such financial assets are either held for trading or designated as at fair value through profit or loss. A financial asset may be designated as at fair value through profit or loss upon initial recognition if: a) Such designation eliminates or significantly reduces a measurement or recognition
inconsistency that would otherwise arise; or b) The financial asset forms part of the Company of financial assets or financial liabilities or both,
which is managed and has performance evaluated on a fair value basis in accordance with the Company’s documented risk management or investment strategy, and information about the grouping is provided internally on that basis; or
c) The contract contains one or more embedded derivatives so that the entire hybrid (combined)
contract can be designated as at fair value through profit or loss. Financial assets at fair value through profit or loss are stated at fair value, with any gains or losses arising on remeasurement recognized in profit or loss. The net gain or loss recognized in profit or loss incorporates any dividend or interest earned on the financial asset. Fair value is determined in the manner described in Note 44. Investments in equity instruments under financial assets at fair value through profit or loss that do not have a quoted market price in an active market and whose fair value cannot be reliably measured and derivatives that are linked to and must be settled by the delivery of such unquoted equity instruments are subsequently measured at cost less any identified impairment loss at the end of each reporting period and presented in a separate line item as financial assets measured at cost. If, in a subsequent period, the fair value of the financial assets can be reliably measured, the financial assets are remeasured at fair value. The difference between the carrying amount and the fair value is recognized in profit or loss.
2) Held-to-maturity investments
Corporate bonds, government bonds and asset backed securities which the Company has the positive intent and ability to hold to maturity held-to-maturity investments. Subsequent to initial recognition, held-to-maturity investments are measured at amortized cost using the effective interest method less any impairment.
3) Available-for-sale financial assets Available-for-sale financial assets are non-derivatives that are either designated as available-for-sale or are not classified as loans and receivables, held-to-maturity investments or financial assets at fair value through profit or loss.

- 31 -
The Company holds government bonds, corporate bonds, listed stocks, mutual funds, negotiable certificates of deposit and commercial paper in an active market that are classified as trading and available-for-sale financial assets and are stated at fair value at each balance sheet date. Fair value is determined in the manner described in Note 44. Available-for-sale financial assets are measured at fair value. Changes in the carrying amounts of available-for-sale monetary financial assets (relating to changes in foreign currency exchange rates, interest income calculated using the effective interest method and dividends on available-for-sale equity investments) are recognized in profit or loss. Other changes in the carrying amount of available-for-sale financial assets are recognized in other comprehensive income and will be reclassified to profit or loss when such investments are disposed of or are determined to be impaired. Dividends on available-for-sale equity instruments are recognized in profit or loss when the Company’s right to receive the dividends is established. Available-for-sale equity investments that do not have a quoted market price in an active market and whose fair value cannot be reliably measured and derivatives that are linked to and must be settled by delivery of such unquoted equity investments are measured at cost less any identified impairment loss at the end of each reporting period and presented in a separate line item as financial assets measured at cost. If, in a subsequent period, the fair value of the financial assets can be reliably measured, the financial assets are remeasured at fair value. The difference between the carrying amount and the fair value is recognized in other comprehensive income on financial assets. Any impairment losses are recognized in profit and loss.
4) Loans and receivables Loans and receivables (including trade loans, receivables, cash and cash equivalent, debt investments with no active market, and nonperforming loans) are measured using the effective interest method at amortized cost less any impairment, except for short-term receivables when the effect of discounting is immaterial. Cash equivalents include time deposits with original maturities within 3 months from the date of acquisition, which are highly liquid, readily convertible to a known amount of cash and are subject to an insignificant risk of changes in value. These cash equivalents are held for the purpose of meeting short-term cash commitments.
b. Impairment of financial assets Financial assets, other than those at fair value through profit or loss, are assessed for indicators of impairment at the end of each reporting period. Financial assets are considered to be impaired when there is objective evidence, as a result of one or more events that occurred after the initial recognition of the financial assets, that the estimated future cash flows of the investment have been affected. Certain categories of financial assets, such as loans, receivables, nonperforming loans and debt investments with no active market, are assessed for impairment collectively even if they are assessed as not impaired individually. Objective evidence of impairment of a portfolio of discounts and loans, receivables and nonperforming loans could include the significant financial difficulty of the debtor, economic or legal reasons relating to the debtor’s financial difficulties, a counterparty’s compromise on or breach of a contract, and an asset becoming more than three months overdue. For financial assets carried at amortized cost, the amount of the impairment loss recognized is the difference between the asset’s carrying amount and the present value of estimated future cash flows, discounted at the financial asset’s original effective interest rate.

- 32 -
For financial assets carried at amortized cost, if, in a subsequent period, the amount of the impairment loss decreases and the decrease can be related objectively to an event occurring after the impairment was recognized, the previously recognized impairment loss is reversed through profit or loss to the extent that the carrying amount of the investment at the date of impairment is reversed does not exceed what the amortized cost would have been had the impairment not been recognized. For any available-for-sale equity investments, a significant or prolonged decline in the fair value of the security below its cost is considered to be objective evidence of impairment. For all other financial assets, objective evidence of impairment could include significant financial difficulty of the issuer or counterparty, breach of contract, such as a default or delinquency in interest or principal payments, it becoming probable that the borrower will enter bankruptcy or financial re-organization, or the disappearance of an active market for those financial asset because of financial difficulties. When an available-for-sale financial asset is considered to be impaired, cumulative gains or losses previously recognized in other comprehensive income are reclassified to profit or loss in the period. In respect of available-for-sale equity securities, impairment loss previously recognized in profit or loss is not reversed through profit or loss. Any increase in fair value subsequent to an impairment loss is recognized in other comprehensive income. In respect of available-for-sale debt securities, impairment loss is subsequently reversed through profit or loss if an increase in the fair value of the investment can be objectively related to an event occurring after the recognition of the impairment loss. For financial assets that are measured at cost, the amount of the impairment loss is measured as the difference between such an asset’s carrying amount and the present value of the estimated future cash flows discounted at the current market rate of return for a similar financial asset. Such impairment loss will not be reversed in subsequent periods. The carrying amount of the financial asset is reduced by the impairment loss directly for all financial assets with the exception of trade receivables and other receivables where the carrying amount is reduced through the use of an allowance account. When a trade receivable and other receivables are considered uncollectable, it is written off against the allowance account. Subsequent recoveries of amounts previously written off are credited against the allowance account. Changes in the carrying amount of the allowance account are recognized in profit or loss except for uncollectable trade receivables and other receivables that are written off against the allowance account.
c. Derecognition of financial assets The Company derecognizes a financial asset only when the contractual rights to the cash flows from the asset expire or when it transfers the financial asset and substantially all the risks and rewards of ownership of the asset to another party. On derecognition of a financial asset in its entirety, the difference between the asset’s carrying amount and the sum of the consideration received and receivable and the cumulative gain or loss that had been recognized in other comprehensive income is recognized in profit or loss.
Equity instruments Debt and equity instruments issued by the Company entity are classified as either financial liabilities or as equity in accordance with the substance of the contractual arrangements and the definitions of a financial liability and an equity instrument. An equity instrument is any contract that evidences a residual interest in the assets of an entity after deducting all of its liabilities. Equity instruments issued by the Company entity are recognized at the proceeds received, net of direct issue costs.

- 33 -
The repurchase of the Company’s own equity instruments is recognized in and deducted directly from equity. No gain or loss is recognized in profit or loss on the purchase, sale, issuance or cancellation of the Company’s own equity instruments. Financial liabilities a. Subsequent measurement
Except the following situations, all financial liabilities are carried at amortized cost using the effective interest method: 1) Financial liabilities at fair value through profit or loss
Financial liabilities are classified as at fair value through profit or loss when the financial liability are either held for trading or it is designated as at fair value through profit or loss. A financial liability may be designated as at fair value through profit or loss upon initial recognition when doing so results in more relevant information and if: a) Such designation eliminates or significantly reduces a measurement or recognition
inconsistency that would otherwise arise; or b) The financial liability forms part of a the Company of financial assets or financial liabilities or
both, which is managed and has performance evaluated on a fair value basis, in accordance with the Company’s documented risk management or investment strategy, and information about the grouping is provided internally on that basis; or
c) A contract contains one or more embedded derivatives so that the entire hybrid (combined)
contract can be designated as at fair value through profit or loss. For a financial liability designated as at fair value through profit or loss, the amount of changes in fair value attributable to changes in the credit risk of the liability is presented in other comprehensive income and it will not be subsequently reclassified to profit or loss. The remaining amount of changes in the fair value of that liability which incorporates any interest or dividend paid on the financial liability is presented in profit or loss. The gain or loss accumulated in other comprehensive income will be transferred to retained earnings when the financial liabilities are derecognized. If this accounting treatment related to credit risk would create or enlarge an accounting mismatch, all changes in fair value of the liability are presented in profit or loss. Fair value is determined in the manner described in Note 44.
2) Financial guarantee contracts
Financial guarantee contracts issued by the Company are initially measured at their fair values and, if not designated as at fair value through profit or loss, are subsequently measured at the higher of the best estimate of the obligation under the contract or the amount initially recognized less cumulative amortization recognized.
b. Derecognition of financial liabilities
The Company derecognizes financial liabilities when, and only when, the Company’s obligations are discharged, cancelled or they expire. The difference between the carrying amount of a financial liability derecognized and the consideration paid, including any non-cash assets transferred or liabilities assumed, is recognized in profit or loss.

- 34 -
Derivative financial instruments Derivatives are initially recognized at fair value at the date the derivative contracts are entered into and are subsequently remeasured to their fair value at the end of each reporting period. The resulting gain or loss is recognized in profit or loss immediately unless the derivative is designated and effective as a hedging instrument, in which event the timing of the recognition in profit or loss depends on the nature of the hedging relationship. When the fair value of derivative financial instruments is positive, the derivative is recognized as a financial asset; when the fair value of derivative financial instruments is negative, the derivative is recognized as a financial liability. Derivatives embedded in non-derivative host contracts are treated as separate derivatives when they meet the definition of a derivative; their risks and characteristics are not closely related to those of the host contracts and the contracts are not measured at fair value through profit or loss. Nonperforming Loans Under the “Regulations Governing the Procedures for Banking Institutions to Evaluate Assets and Deal with Nonperforming/Nonaccrual Loans” issued by the authorities, loans and other credits (including the accrued interests) that remain unpaid on their maturity are transferred immediately to nonperforming loans if the transfer is approved by the board of directors. Nonperforming loans transferred from loans are recognized as discounts and loans, and those transferred from other credits are recognized as other financial assets. Allowance for Doubtful Accounts and Reserve for Losses on Guarantees In determining the allowance for credit losses and the reserve for losses on guarantees, the Company assesses the balances of discounts and loans, receivables, nonperforming loans, and other financial assets as well as guarantees and acceptances for their collectability and their specific risks or general risks as of the balance sheet date. Under the regulations issued by the Ministry of Finance (MOF), the Company evaluates credit balances on the basis of their estimated collectability. The MOF regulations also require the grouping of loans into these five classes: Normal, special mention, substandard, with doubtful collectability and uncollectable; the minimum allowances for doubtful accounts and for losses on guarantees for these loans should be 1%, 2%, 10%, 50% and 100%, respectively, of outstanding credits. Later, the MOF issued a guideline stating that, within three years from January 1, 2011, the normal loans should have a minimum allowance of 1%, with the allowances for the four non-normal loans remaining the same. The Company believes it can meet this new allowance requirement within three years from January 1, 2011. Rule No. 10300329440 issued by FSC, stipulated the minimum the allowance for mortgage and improvement loans should be 1.5% by the end of 2016. Credits deemed uncollectable may be written off if the write-off is approved by the board of directors. Recoveries of amounts previously written off are credited to the allowance account. Repurchase and Resell Transactions Securities purchased under agreement to resell and securities sold under agreements to repurchase are generally treated as collateralized financing transactions. Interest earned on reverse repurchase agreements or interest incurred on repurchase agreements is recognized as interest income or interest expense over the life of each agreement.

- 35 -
Property and Equipment Property and equipment are stated at cost less accumulated depreciation and accumulated impairment loss. Freehold land is not depreciated. Depreciation of property and equipment is recognized using the straight-line method. Each significant part is depreciated separately. If a lease term is shorter than the assets’ useful lives, such assets are depreciated over the lease term. The estimated useful lives, residual values and depreciation methods are reviewed at the end of each reporting period, with the effects of any changes in the estimates accounted for on a prospective basis. For a contract where an owner of land provides land for construction of buildings by a property developer in exchange for a certain percentage of the buildings, any exchange gain or loss is recognized when the exchange transaction occurs, if the buildings acquired are classified as property, plant and equipment and the exchange transaction has commercial substance. On derecognition of an item of property and equipment, the difference between the sales proceeds and the carrying amount of the asset is recognized in profit or loss. Goodwill Goodwill arising from the acquisition of a business is carried at cost as established at the date of acquisition of the business less accumulated impairment loss. For the purposes of impairment testing, goodwill is allocated to each of the Company’s cash-generating units or the Company of cash-generating units (referred to as “cash-generating units”) that is expected to benefit from the synergies of the combination. A cash-generating unit to which goodwill has been allocated is tested for impairment annually or more frequently when there is an indication that the unit may be impaired, by comparing its carrying amount, including the attributed goodwill, with its recoverable amount. However, if the goodwill allocated to a cash-generating unit was acquired in a business combination during the current annual period, that unit shall be tested for impairment before the end of the current annual period. If the recoverable amount of the cash-generating unit is less than its carrying amount, the impairment loss is allocated first to reduce the carrying amount of any goodwill allocated to the unit and then pro rata to the other assets of the unit based on the carrying amount of each asset in the unit. Any impairment loss is recognized directly in profit or loss. Any impairment loss recognized on goodwill is not reversed in subsequent periods. If goodwill has been allocated to a cash-generating unit and the entity disposes of an operation within that unit, the goodwill associated with the operation which is disposed of is included in the carrying amount of the operation when determining the gain or loss on disposal and is measured on the basis of the relative values of the operation disposed of and the portion of the cash-generating unit retained. Intangible Assets Separate acquisition Intangible assets with finite useful lives that are acquired separately are initially measured at cost and subsequently measured at cost less accumulated amortization and accumulated impairment losses. Amortization is recognized on a straight-line basis. The estimated useful lives, residual values, and amortization methods are reviewed at the end of each reporting period, with the effect of any changes in the estimates accounted for on a prospective basis.

- 36 -
Derecognition On derecognition of an intangible asset, the difference between the net disposal proceeds and the carrying amount of the asset is recognized in profit or loss. Foreclosed Collaterals Collaterals assumed (included in other assets) are recorded at cost, which includes the assumed prices and any necessary repairs to make the collaterals saleable, and evaluated at the lower of cost or net realizable value as of the balance sheet date. Impairment of Tangible and Intangible Assets (Excluded Goodwill) At the end of each reporting period, the Company reviews the carrying amounts of its tangible and intangible assets, excluding goodwill, to determine whether there is any indication that those assets have suffered any impairment loss. If any such indication exists, the recoverable amount of the asset is estimated in order to determine the extent of the impairment loss. When it is not possible to estimate the recoverable amount of an individual asset, the Company estimates the recoverable amount of the cash-generating unit to which the asset belongs. Corporate assets are allocated to cash-generating units on a reasonable and consistent basis of allocation. The recoverable amount is the higher of fair value less costs to sell and value in use. If the recoverable amount of an asset or cash-generating unit is estimated to be less than its carrying amount, the carrying amount of the asset or cash-generating unit is reduced to its recoverable amount, with the resulting impairment loss recognized in profit or loss. When an impairment loss is subsequently reversed, the carrying amount of the corresponding asset or cash-generating unit is increased to the revised estimate of its recoverable amount, but only to the extent of the carrying amount that would have been determined had no impairment loss been recognized for the asset or cash-generating unit in prior years. A reversal of an impairment loss is recognized in profit or loss. Leasing Leases are classified as finance leases whenever the terms of the lease transfer substantially all the risks and rewards of ownership to the lessee. All other leases are classified as operating leases. a. The Company as lessor
Rental income from operating leases is recognized on a straight-line basis over the term of the relevant lease. Initial direct costs incurred in negotiating and arranging an operating lease are added to the carrying amount of the leased asset and amortized on a straight-line basis over the lease term. Lease incentives included in an operating lease are recognized as an asset. The aggregate cost of incentives is recognized as a reduction of rental income on a straight-line basis. Lease incentives are recognized as income in the period in which they are incurred.
b. The Company as lessee Lease payments under an operating lease are expensed on a straight-line basis over the lease period. Under operating lease, contingent rentals are recognized as expenses at current period. Lease incentives received under operating leases are recognized as a liability. The aggregate benefit of incentives is recognized as a reduction of rental expense on a straight-line basis.

- 37 -
Provisions Provisions, including those arising from contractual obligation specified in service concession arrangement to maintain or restore infrastructure before it is handed over to the grantor, are measured at the best estimate of the discounted cash flows of the consideration required to settle the present obligation at the end of the reporting period, taking into account the risks and uncertainties surrounding the obligation. When some or all of the economic benefits required to settle a provision are expected to be recovered from a third party, a receivable is recognized as an asset if it is virtually certain that reimbursement will be received and the amount of the receivable can be measured reliably. Employee Benefits a. Short-term employee benefits
Liabilities recognized in respect of short-term employee benefits are measured at the undiscounted amount of the benefits expected to be paid in exchange for the related service.
b. Retirement benefits Payments to defined contribution retirement benefit plans are recognized as an expense when employees have rendered service entitling them to the contributions. Defined benefit costs (including service cost, net interest and remeasurement) under the defined benefit retirement benefit plans are determined using the projected unit credit method. Service cost (including current service cost and past service cost) and net interest on the net defined benefit liability (asset) are recognized as employee benefits expense in the period they occur. Remeasurement, comprising actuarial gains and losses, the effect of the changes to the asset ceiling and the return on plan assets (excluding interest), is recognized in other comprehensive income in the period in which they occur. Remeasurement recognized in other comprehensive income is reflected immediately in retained earnings and will not be reclassified to profit or loss. Net defined benefit liability (asset) represents the actual deficit (surplus) in the Company’s defined benefit plan. Any surplus resulting from this calculation is limited to the present value of any refunds from the plans or reductions in future contributions to the plans.
c. Other long-term employee benefits Other long-term employee benefits are accounted for in the same way as the accounting required for a defined benefit plan except that remeasurement is recognized in profit or loss.
d. Termination benefits A liability for a termination benefit is recognized at the earlier of when the Company can no longer withdraw the offer of the termination benefit and when the Company recognizes any related restructuring costs.
Income Tax Income tax expense represents the sum of the tax currently payable and deferred tax. a. Current tax
According to the Income Tax Law, an additional tax at 10% of unappropriated earnings is provided for as income tax in the year the stockholders approve to retain the earnings.

- 38 -
Adjustments of prior years’ tax liabilities are added to or deducted from the current year’s tax provision.
b. Deferred tax Deferred tax is recognized on temporary differences between the carrying amounts of assets and liabilities in the financial statements and the corresponding tax bases used in the computation of taxable profit. Deferred tax liabilities are generally recognized for all taxable temporary differences. Deferred tax assets are generally recognized for all deductible temporary difference and unused loss carryforwards to the extent that it is probable that taxable profits will be available against which those deductible temporary differences can be utilized. Such deferred tax assets and liabilities are not recognized if the temporary difference arises from goodwill or from the initial recognition (other than in a business combination) of other assets and liabilities in a transaction that affects neither the taxable profit nor the accounting profit. Deferred tax liabilities are recognized for taxable temporary differences associated with investments in subsidiaries and associates, and interests in joint ventures, except where the Company can control the reversal of the temporary difference and it is probable that the temporary difference will not reverse in the foreseeable future. Deferred tax assets arising from deductible temporary differences associated with such investments and interests are recognized only to the extent that it is probable that there will be sufficient taxable profits against which to use the benefits of the temporary differences and these differences are expected to reverse in the foreseeable future. The carrying amount of deferred tax assets is reviewed at the end of each reporting period and reduced to the extent that it is no longer probable that sufficient taxable profits will be available to allow all or part of the asset to be recovered. A previously unrecognized deferred tax asset is also reviewed at the end of each reporting period and recognized to the extent that it has become probable that future taxable profit will allow the deferred tax asset to be recovered. Deferred tax assets and liabilities are measured at the amounts expected to be paid to (recovered from) taxation authorities, using the rates or laws that have been enacted or substantively enacted by the balance sheet date. The measurement of deferred tax liabilities and assets should reflect the tax consequences of how the Company expects, at the end of the reporting period, to recover or settle the carrying amount of its assets and liabilities.
c. Current and deferred taxes for the period For transactions recognized in profit or loss, current and deferred taxes are also recognized in profit or loss; for transactions recognized outside profit or loss, i.e., in other comprehensive income or directly in equity, the current and deferred taxes are also recognized in other comprehensive income or directly in equity. Where current tax or deferred tax arises from the initial accounting for a business combination, the tax effect is included in the accounting for the business combination.
Interest Revenue and Service Fees Interest revenue on loans is recorded by the accrual method. No interest revenue is recognized in the accompanying financial statements on loans and other credits extended by the Company that are classified as nonperforming loans. The interest revenue on these loans/credits is recognized upon collection. Under a Ministry of Finance regulation, the interest revenue on credits covered by agreements that extend their repayment periods is recorded as deferred revenue and recognized as revenue upon collection Revenue from brokerage is recognized when the earnings process has been completed.

- 39 -
5. CRITICAL ACCOUNTING JUDGMENTS AND KEY SOURCES OF ESTIMATION UNCERTAINTY In the application of the Company’s accounting policies, management is required to make judgments, estimates and assumptions about the carrying amounts of assets and liabilities that are not readily apparent from other sources. The estimates and associated assumptions are based on historical experience and other factors that are considered to be relevant. Actual results may differ from these estimates. The estimates and underlying assumptions are reviewed on an ongoing basis. Revisions to accounting estimates are recognized in the period in which the estimate is revised if the revision affects only that period or in the period of the revision and future periods if the revision affects both current and future periods. a. Estimated impairment of loans and receivables
When there is objective evidence of impairment loss, the Company takes into consideration the estimation of future cash flows. Impairment loss is measured as the difference between the asset’s carrying amount and the present value of estimated future cash flows (excluding future credit losses that have not been incurred) discounted at the financial asset’s original effective interest rate. If the actual future cash flows are less than expected, a material impairment loss may arise.
b. Recognition and measurement of defined benefit plans
Net defined benefit liabilities (assets) and the resulting defined benefit costs under defined benefit pension plans are calculated using the projected unit credit method. Actuarial assumptions comprise the discount rate, rate of employee turnover, and future salary increase, etc. Changes in economic circumstances and market conditions will affect these assumptions and may have a material impact on the amount of the expense and the liability.
6. CASH AND CASH EQUIVALENTS
December 31 2017 2016 Cash on hand $ 5,775,662 $ 5,818,152 Checks for clearing 4,042,078 3,563,014 Due from banks 2,318,432 1,589,952 $ 12,136,172 $ 10,971,118
7. DUE FROM THE CENTRAL BANK AND CALL LOANS TO BANKS
December 31 2017 2016 Deposit reserve - checking account $ 7,342,004 $ 3,985,664 Required deposit reserve 11,439,250 11,164,239 Deposit reserve - foreign-currency deposits 74,620 64,558 Call loans to banks 325,111 - Deposit account in Central Bank - 39,200,000 $ 19,180,985 $ 54,414,461

- 40 -
Under a directive issued by the Central Bank of the ROC, the Bank determines monthly the New Taiwan dollar (NTD)-denominated deposit reserves at prescribed rates based on the average balances of customers’ NTD-denominated deposits, which are subject to withdrawal restrictions. In addition, the foreign-currency deposit reserves are determined at rates prescribed for balances of foreign-currency deposits. These reserves may be withdrawn anytime and are noninterest earning.
8. FINANCIAL INSTRUMENTS AT FAIR VALUE THROUGH PROFIT OR LOSS
December 31 2017 2016 Financial assets held for trading Commercial paper $ 10,389,618 $ 8,300,747 Government bonds - 151,223 Quoted stocks 188,973 192,085 Mutual funds 1,020,400 128,425 11,598,991 8,772,480 Derivative instruments
Forward exchange contracts 311,723 418,515 Currency swap contracts 177,358 15,982 Option contracts 48,253 8,145
537,334 442,642 12,136,325 9,215,122 Financial assets designated as at fair value through profit or loss Principal guaranteed notes - 322,968 $ 12,136,325 $ 9,538,090 Financial liabilities held for trading Derivative instrument
Option contracts $ 48,259 $ 8,135 Forward exchange contracts 14,246 23,924 Currency swap contracts 120,879 7,464
$ 183,384 $ 39,523 The Company engaged in derivative transactions mainly to accommodate customers’ needs and manage its exposure positions. The financial risk management objective of the Company was to minimize risks due to changes in fair value or cash flows. The contract amounts (notional amounts) of the derivative transactions for accommodating customers’ needs and managing its exposure positions as of December 31, 2017 and 2016 were as follows: December 31 2017 2016 Currency swap contracts $ 31,633,669 $ 11,133,826 Forward exchange contracts 6,348,016 3,090,128 Option contracts
Buy 2,465,312 1,684,467 Sell 2,465,312 1,684,467
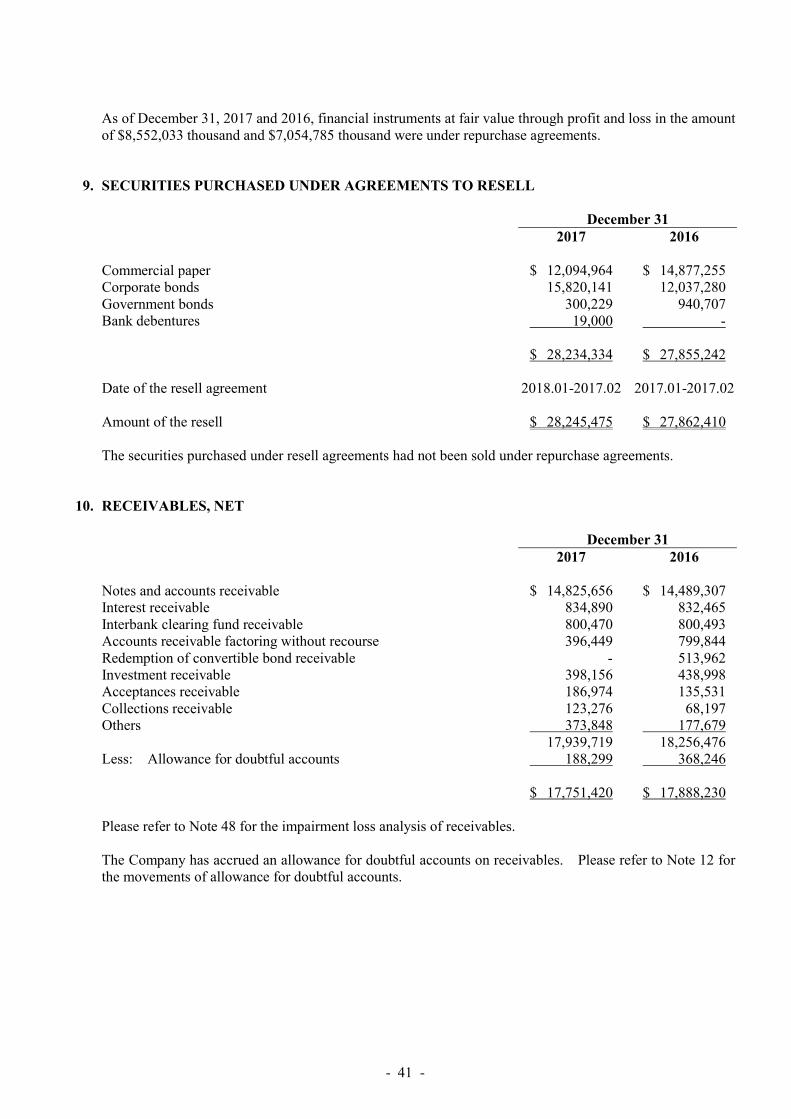
- 41 -
As of December 31, 2017 and 2016, financial instruments at fair value through profit and loss in the amount of $8,552,033 thousand and $7,054,785 thousand were under repurchase agreements.
9. SECURITIES PURCHASED UNDER AGREEMENTS TO RESELL
December 31 2017 2016 Commercial paper $ 12,094,964 $ 14,877,255 Corporate bonds 15,820,141 12,037,280 Government bonds 300,229 940,707 Bank debentures 19,000 - $ 28,234,334 $ 27,855,242 Date of the resell agreement 2018.01-2017.02 2017.01-2017.02 Amount of the resell $ 28,245,475 $ 27,862,410 The securities purchased under resell agreements had not been sold under repurchase agreements.
10. RECEIVABLES, NET
December 31 2017 2016 Notes and accounts receivable $ 14,825,656 $ 14,489,307 Interest receivable 834,890 832,465 Interbank clearing fund receivable 800,470 800,493 Accounts receivable factoring without recourse 396,449 799,844 Redemption of convertible bond receivable - 513,962 Investment receivable 398,156 438,998 Acceptances receivable 186,974 135,531 Collections receivable 123,276 68,197 Others 373,848 177,679 17,939,719 18,256,476 Less: Allowance for doubtful accounts 188,299 368,246 $ 17,751,420 $ 17,888,230 Please refer to Note 48 for the impairment loss analysis of receivables. The Company has accrued an allowance for doubtful accounts on receivables. Please refer to Note 12 for the movements of allowance for doubtful accounts.

- 42 -
11. DISCOUNTS AND LOANS, NET
December 31 2017 2016 Discounts and overdraft $ 212,176 $ 43,283 Accounts receivable - financing 14,290 29,690 Loans
Short-term - unsecured 61,312,117 48,432,945 - secured 59,564,827 53,347,371 Medium-term - unsecured 18,561,250 15,783,090 - secured 49,686,071 45,771,509 Long-term - unsecured 5,682,256 4,792,014 - secured 124,812,522 117,212,237
Import and export negotiations 37,962 22,985 Overdue loans 247,336 179,120 320,130,807 285,614,244 Less: Allowance for doubtful accounts 3,401,818 3,197,294 $ 316,728,989 $ 282,416,950 As of December 31, 2017 and 2016, the balances of nonaccrual loans were $247,336 thousand and $179,120 thousand, respectively. The unrecognized interest revenues on nonperforming loans were $6,751 thousand in 2017 and $5,241 thousand in 2016. In 2017 and 2016, the Company wrote off certain credits after completing the required legal procedures. Please refer to Note 48 for impairment loss analysis of discounts and loans. The Company had set up an allowance for doubtful accounts on discounts and loans. Please refer to Note 12 for the movements in the allowance for doubtful accounts.
12. ALLOWANCE FOR DOUBTFUL ACCOUNTS The movements in the allowance for doubtful accounts and reserve for losses on guarantees liabilities for the years ended December 31, 2017 and 2016 are summarized as follows: For the Year Ended December 31, 2017
Receivables Discounts and
Loans
Reserve for Losses on
Guarantees Total Balance at January 1, 2017 $ 368,246 $ 3,197,294 $ 134,621 $ 3,700,161 Allowance of allowance for
doubtful accounts 208,906 133,955 14,000 356,861 Write-offs (665,750) (296,290) - (962,040) Recovery of written-off credits 299,327 363,071 - 662,398 Reclassification - 9,500 (9,500) - Effects of exchange rate changes (22,430) (5,712) (146) (28,288) Balance at December 31, 2017 $ 188,299 $ 3,401,818 $ 138,975 $ 3,729,092

- 43 -
For the Year Ended December 31, 2016
Receivables Discounts and
Loans
Reserve for Losses on
Guarantees Total Balance at January 1, 2016 $ 113,358 $ 2,796,860 $ 194,006 $ 3,104,224 Allowance (reversal) of allowance
for doubtful accounts 100,436 130,467 (59,361) 171,542 Write-offs (173,535) (74,220) - (247,755) Recovery of written-off credits 327,987 345,452 - 673,439 Effects of exchange rate changes - (1,265) (24) (1,289) Balance at December 31, 2016 $ 368,246 $ 3,197,294 $ 134,621 $ 3,700,161
13. AVAILABLE-FOR-SALE FINANCIAL ASSETS
December 31 2017 2016 Overseas corporate bonds $ 10,132,247 $ 13,035,783 Overseas financial bonds 6,302,487 8,473,037 Domestic corporate bonds 4,150,714 4,424,558 Overseas government bonds 5,966,611 5,377,258 Domestic quoted stocks 3,741,246 3,419,143 Mutual funds 1,036,944 1,922,850 Overseas quoted stocks 3,207,689 2,377,519 Domestic government bonds 951,695 948,277 $ 35,489,633 $ 39,978,425 The available-for-sale financial assets amounting to $10,837,361 thousand and $14,636,448 thousand as of December 31, 2017 and 2016, respectively, had been sold under repurchase agreements.
14. HELD-TO-MATURITY FINANCIAL ASSETS
December 31 2017 2016 Convertible deposits $ 42,300,000 $ - Domestic government bonds 8,660,289 6,864,356 Domestic corporate bonds 300,000 300,000 Asset-based securities 25,668 27,759 $ 51,285,957 $ 7,192,115 The held-to-maturity investments had not been sold under repurchase agreements.

- 44 -
15. SUBSIDIARIES The investees included in the consolidated financial statements are as follows:
Percentage of
Ownership December 31
Investor Investee Main Businesses 2017 2016 The Bank Union Finance and Leasing
International Corporation (UFLIC)
Installment, leasing and accounts receivable factoring.
100.00 100.00 -
Union Information Technology Corporation (UIT)
Software and hardware product retail and distribution, system programming development, system development outsourcing, website design, e-commerce, etc.
99.99 99.99 -
Union Finance International (HK) Limited
Import and export financing. 99.99 99.99 -
Union Securities Investment Trust Corporation (USITC)
Securities investment trust. 35.00 35.00 Note 1
UFLIC Union Capital (Cayman) Corp. (Cayman)
Installment and leasing receivable factoring.
100.00 100.00 -
New Asian Ventures Ltd. (New Asian)
Investment, overseas financing, equipment leasing, installment selling, acquisition of accounts receivable, etc.
100.00 100.00 -
Union Capital (Cayman) Corp.
Union Capital (Singapore) Holding Pte. Ltd. (Union)
Investment, overseas financing, equipment leasing, installment selling, acquisition of accounts receivable, etc.
100.00 100.00 Notes 2 and 4
Uflc Capital (Singapore) Holding PTE. Ltd. (Uflc)
Investment, overseas financing, equipment leasing, installment selling, acquisition of accounts receivable, etc.
100.00 100.00 Notes 2 and 4
Union Capital (Singapore)
Kabushiki Kaisha UCJ1 (Japan) (KK)
Sale, purchasing and leasing of real estates, etc.
30.55 30.55 Notes 3 and 4
Holding Pte. Ltd.
Tokutei Mokuteki Kaisha SSG15 (Japan) (SSG15)
A real estate securitized special purpose company.
49.00 49.00 Notes 3 and 4
Uflc Capital (Singapore)
Kabushiki Kaisha UCJ1 (Japan) (KK)
Sale, purchasing and leasing of real estates, etc.
69.45 69.45 Notes 3 and 4
Holding PTE. Ltd.
Tokutei Mokuteki Kaisha SSG12 (Japan) (SSG12)
A real estate securitized special purpose company.
49.00 49.00 Notes 3 and 4
Tokutei Mokuteki Kaisha SSG16 (Japan) (SSG16)
A real estate securitized special purpose company.
49.00 49.00 Notes 3 and 4
Kabushiki Kaisha UCJ1 (Japan)
Tokutei Mokuteki Kaisha SSG15 Japan) (SSG15)
A real estate securitized special purpose company.
51.00 51.00 Notes 3 and 4
Tokutei Mokuteki Kaisha SSG12 (Japan) (SSG12)
A real estate securitized special purpose company.
51.00 51.00 Notes 3 and 4
Tokutei Mokuteki Kaisha SSG16 (Japan) (SSG16)
A real estate securitized special purpose company.
51.00 51.00 Notes 3 and 4
Note 1: The Company has control over the financial, operational and personnel policies of USITC; thus,
this subsidiary was included in the consolidated financial statements. Note 2: Union and Uflc were established in September 2014 and March 2016 by Cayman. The capital
was both US$1. Note 3: KK, SSG15, SSG12 and SSG16 were established by Union and Uflc in Japan to acquire
investment properties for securitization.

- 45 -
Note 4: The financial year-end date of Union, Uflc, KK, SSG15, SSG12 and SSG16 apply equity accounting are not December 31. The Company recognize balance statement on September 30, 2017 for consolidated financial statements. Appropriate adjustments have been made accordingly for the effects of significant transactions made between the subsidiaries’ year-end dates and December 31, 2017.
16. INVESTMENTS ACCOUNTED FOR USING THE EQUITY METHOD, NET
December 31 2017 2016 None individually material Union Real-Estate Management Corporation $ 53,121 $ 53,447 The summarized financial information in respect of the Company’s associate is set out below: For the Year Ended December 31 2017 2016 Net loss $ (326) $ (347) The Company’s share of the associate’s profit and other comprehensive income for 2017 and 2016 was based on the associate’s audited financial statements for the same reporting periods as those of the Company.
17. OTHER FINANCIAL ASSETS, NET
December 31 2017 2016 Debt instruments with no active markets, net $ 45,734,754 $ 51,433,548 Pledged assets (Note 44) 664,744 4,898,176 Due from banks - certificate of deposit 937,964 464,500 Financial assets carried at cost, net 603,994 600,059 Call loans to securities 298,480 - Others 27,903 7,460 $ 48,267,839 $ 57,403,743 a. Debt instruments with no active markets
Debt instruments with no active markets are guaranteed for American government of real estate mortgage secured bond. As of December 31, 2017 and 2016, debt instruments with no active markets and amounting to $15,415,779 thousand and $10,163,828 thousand, respectively, were under repurchase agreements.
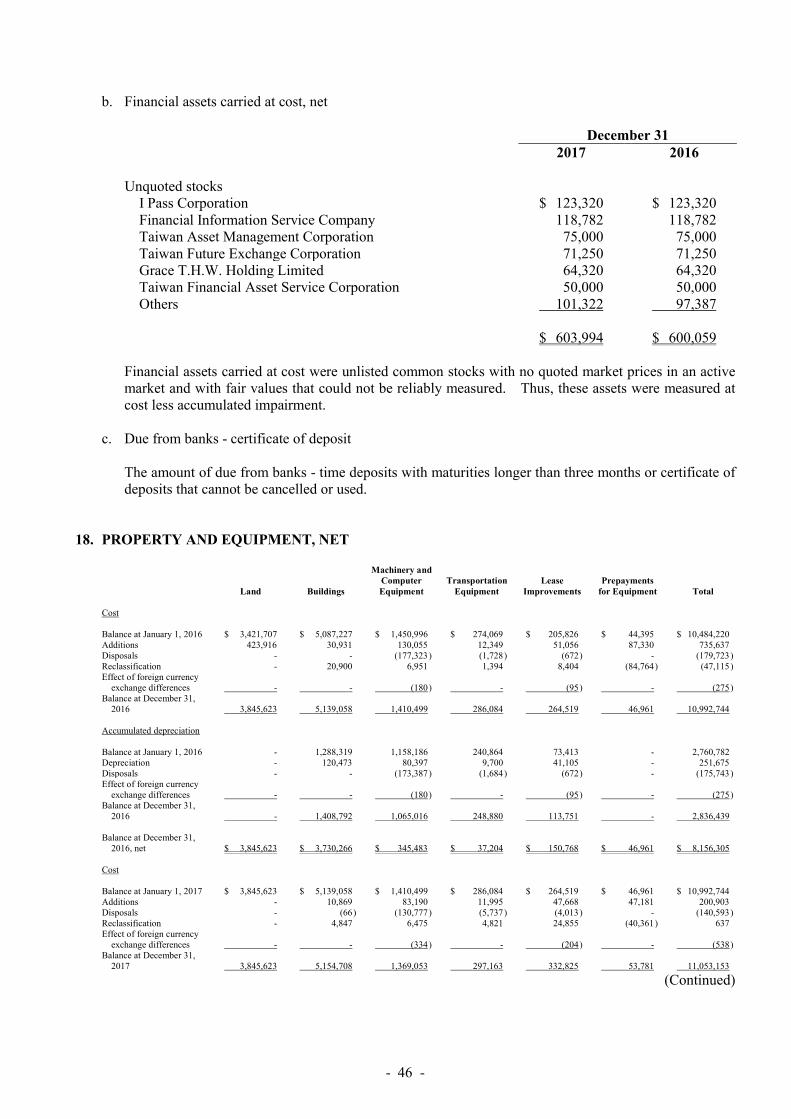
- 46 -
b. Financial assets carried at cost, net December 31 2017 2016 Unquoted stocks
I Pass Corporation $ 123,320 $ 123,320 Financial Information Service Company 118,782 118,782 Taiwan Asset Management Corporation 75,000 75,000 Taiwan Future Exchange Corporation 71,250 71,250 Grace T.H.W. Holding Limited 64,320 64,320 Taiwan Financial Asset Service Corporation 50,000 50,000 Others 101,322 97,387
$ 603,994 $ 600,059 Financial assets carried at cost were unlisted common stocks with no quoted market prices in an active market and with fair values that could not be reliably measured. Thus, these assets were measured at cost less accumulated impairment.
c. Due from banks - certificate of deposit The amount of due from banks - time deposits with maturities longer than three months or certificate of deposits that cannot be cancelled or used.
18. PROPERTY AND EQUIPMENT, NET
Land Buildings
Machinery and Computer Equipment
Transportation Equipment
Lease Improvements
Prepayments for Equipment Total
Cost Balance at January 1, 2016 $ 3,421,707 $ 5,087,227 $ 1,450,996 $ 274,069 $ 205,826 $ 44,395 $ 10,484,220 Additions 423,916 30,931 130,055 12,349 51,056 87,330 735,637 Disposals - - (177,323 ) (1,728 ) (672 ) - (179,723 ) Reclassification - 20,900 6,951 1,394 8,404 (84,764 ) (47,115 ) Effect of foreign currency
exchange differences - - (180 ) - (95 ) - (275 ) Balance at December 31,
2016 3,845,623 5,139,058 1,410,499 286,084 264,519 46,961 10,992,744 Accumulated depreciation Balance at January 1, 2016 - 1,288,319 1,158,186 240,864 73,413 - 2,760,782 Depreciation - 120,473 80,397 9,700 41,105 - 251,675 Disposals - - (173,387 ) (1,684 ) (672 ) - (175,743 ) Effect of foreign currency
exchange differences - - (180 ) - (95 ) - (275 ) Balance at December 31,
2016 - 1,408,792 1,065,016 248,880 113,751 - 2,836,439 Balance at December 31,
2016, net $ 3,845,623 $ 3,730,266 $ 345,483 $ 37,204 $ 150,768 $ 46,961 $ 8,156,305 Cost Balance at January 1, 2017 $ 3,845,623 $ 5,139,058 $ 1,410,499 $ 286,084 $ 264,519 $ 46,961 $ 10,992,744 Additions - 10,869 83,190 11,995 47,668 47,181 200,903 Disposals - (66 ) (130,777 ) (5,737 ) (4,013 ) - (140,593 ) Reclassification - 4,847 6,475 4,821 24,855 (40,361 ) 637 Effect of foreign currency
exchange differences - - (334 ) - (204 ) - (538 ) Balance at December 31,
2017 3,845,623 5,154,708 1,369,053 297,163 332,825 53,781 11,053,153
(Continued)

- 47 -
Land Buildings
Machinery and Computer Equipment
Transportation Equipment
Lease Improvements
Prepayments for Equipment Total
Accumulated depreciation Balance at January 1, 2017 $ - $ 1,408,792 $ 1,065,016 $ 248,880 $ 113,751 $ - $ 2,836,439 Depreciation - 123,755 96,302 10,404 41,100 - 271,561 Disposals - (18 ) (126,901 ) (5,273 ) (3,846 ) - (136,038 ) Effect of foreign currency
exchange differences - - (334 ) - (204 ) - (538 ) Balance at December 31,
2017 - 1,532,529 1,034,083 254,011 150,801 - 2,971,424 Balance at December 31,
2017, net $ 3,845,623 $ 3,622,179 $ 334,970 $ 43,152 $ 182,024 $ 53,781 $ 8,081,729
(Concluded) The above items of property and equipment are depreciated on a straight-line basis over the useful lives of the assets, estimated as follows: Buildings
Main buildings 50-55 years Equipment installed in buildings 5 years
Machinery and computer equipment 3-5 years Transportation equipment 3-5 years Lease improvements 5 years In August 2016, the Bank acquired a piece of land in Tucheng Dist. from New Taipei City through the public auction in order to construct business operation office for $423,916 thousand. The Bank completed the payment and obtained the ownership of the land in October 2016. On November 9, 2016, the board of directors of the Bank and UFLIC, the property developer, resolved respectively to enter into a cooperation contract with each other to cooperatively construct a building. Upon completion of the building, the ownership thereof will be attributed to the Company and UFLIC. Per contract, the Bank will provide its land (estimated cost amounting to $439,626 thousand) in Tucheng District, New Taipei City for constructing the building, and UFLIC will render funds and donate a piece of land originally reserved for the public facilities to the government in exchange for transfer development rights (TDR) to increase the building area. The funds and the TDR in the aggregate amount to $447,614 thousand. The building area increased due to the exercise of the TDR belongs to UFLIC.
19. INVESTMENT PROPERTIES, NET Land Buildings Total Cost Balance at January 1, 2016 $ 3,240,600 $ 532,268 $ 3,772,868 Additions 1,299,172 442,106 1,741,278 Net exchange difference 2,362 1,064 3,426 Balance at December 31, 2016 $ 4,542,134 $ 975,438 $ 5,517,572
(Continued)

- 48 -
Land Buildings Total Accumulated depreciation and impairment Balance at January 1, 2016 $ - $ (69,458) $ (69,458) Depreciation - (34,061) (34,061) Net exchange differences - 1,323 1,323 Balance at December 31, 2016 $ - $ (102,196) $ (102,196) Balance at December 31, 2016, net $ 4,542,134 $ 873,242 $ 5,415,376 Cost Balance at January 1, 2017 $ 4,542,134 $ 975,438 $ 5,517,572 Additions 132 14,945 15,077 Net exchange difference (74,994) (28,951) (103,945) Balance at December 31, 2017 $ 4,467,272 $ 961,432 $ 5,428,704 Accumulated depreciation and impairment Balance at January 1, 2017 $ - $ (102,196) $ (102,196) Depreciation - (38,342) (38,342) Net exchange differences - (3,732) (3,732) Balance at December 31, 2017 $ - $ (144,270) $ (144,270) Balance at December 31, 2017, net $ 4,467,272 $ 817,162 $ 5,284,434
(Concluded) The Company acquired investment properties amounting to $1,026,015 thousand and $668,984 thousand via SSG12 and SSG16 in Japan on February 4, 2016. The amount was based on the valuation by independent appraisers that were not the Company’s related parties. Investment properties are depreciated on a straight-line basis as follows: Buildings
Main buildings 15-50 years Equipment installed in buildings 6-15 years
The fair values of investment properties were $6,420,340 thousand and $6,500,254 thousand as of December 31, 2017 and 2016. The fair values were based on the valuation at these dates by independent appraisers that were not the Company’s related parties and estimated by the management according to the nearby transaction. Refer to Note 27 for information relating to investment properties pledged as guarantee.

- 49 -
20. GOODWILL The Bank acquired Chung Shing Bank (Chung Shing) on March 19, 2005 and recognized goodwill amounting to $3,309,000 thousand. The goodwill amortization period was five years, and the amortization expense in 2005 was $551,500 thousand. However, the amortization of goodwill became no longer required from January 1, 2006. The Bank merged with Union Bills Finance Corporation on August 16, 2010, with the Bank as the survivor entity, and recognized goodwill amounting to $130,498 thousand. For the impairment test on Chung Shing, the Bank treated individual business units as cash-generating units (CGUs). Goodwill resulting from the merger was allocated to the relevant CGUs. The recoverable amount was determined by the value in use of each CGU and was calculated at the present values of the cash flow forecast for the next five years based on the going-concern assumption. Future cash flows were estimated on the basis of Chung Shing’s present operations and will be adjusted depending on the business outlook and economic trends. As of December 31, 2017 and 2016, the balances of accumulated impairment both were $902,691 thousand.
21. OTHER ASSETS, NET
December 31 2017 2016 Assets leased to others, net $ 5,334,078 $ 5,201,173 Refundable deposits 1,708,194 1,772,777 Prepaid expenses 465,383 526,584 Prepaid pension (Note 30) 21,856 23,100 Others 61,286 98,434 $ 7,590,797 $ 7,622,068
22. DUE TO THE CENTRAL BANK AND CALL LOANS TO OTHER BANKS
December 31 2017 2016 Call loans from banks $ 7,787,895 $ 6,936,890 Due to Chunghwa Post Co., Ltd. 1,233,370 1,339,430 Overdraft 140,285 61,415 Due to the Central Bank and other banks 87,635 51,577 $ 9,249,185 $ 8,389,312

- 50 -
23. SECURITIES SOLD UNDER AGREEMENTS TO REPURCHASE December 31 2017 2016 Asset-based securities $ 12,042,309 $ 8,166,461 Corporate bonds 6,110,732 7,514,752 Commercial paper 8,557,700 6,908,529 Government bonds 3,317,499 5,459,089 Financial bonds 245,736 825,306 $ 30,273,976 $ 28,874,137 Date of repurchase agreement 2018.01-2018.05 2017.01-2017.06 Amount of repurchase agreement $ 30,311,830 $ 28,907,147
24. ACCOUNTS PAYABLE December 31 2017 2016 Notes and checks in clearing $ 4,042,080 $ 3,563,016 Accrued expenses 745,059 772,010 Interest payable 717,942 656,277 Investments payable 426,104 191,923 Collections payable 188,076 135,531 Bank acceptances payable 180,113 163,534 Tax payable 97,806 84,437 Others 711,644 1,414,736 $ 7,108,824 $ 6,981,464
25. DEPOSITS AND REMITTANCES
December 31 2017 2016 Checking deposits $ 5,384,983 $ 5,467,993 Demand deposits 72,883,867 67,049,529 Savings deposits 290,040,825 285,095,150 Time deposits 80,374,452 73,682,528 Negotiable certificates of deposit 238,300 250,700 Inward and outward remittances 127,043 73,015 $ 449,049,470 $ 431,618,915

- 51 -
26. BANK DEBENTURES
December 31 2017 2016 First issue of subordinated bank debentures in 2011; fixed rate at
2.78%; maturity: June 2018 $ 2,000,000 $ 2,000,000 First issue of subordinated bank debentures in 2012; fixed rate at
2.32%; maturity: March 2019 1,500,000 1,500,000 First issue of subordinated bank debentures in 2013; fixed rate at
2.10%; maturity: December 2020 3,000,000 3,000,000 First issue of subordinated bank debentures in 2015; fixed rate at
2.08%; maturity: April 2022 2,200,000 2,200,000 First issue of subordinated bank debentures in 2016; no maturity date
and non-cumulative; redeemable at face value plus interest accrued under the approval of the authorities when the issue term is over 5.1 years; fixed rate at 4.20% 2,500,000 2,500,000
First issue of subordinated bank debentures in 2017; no maturity date and non-cumulative; redeemable at face value plus interest accrued under the approval of the authorities when the issue term is over 5.1 years; fixed rate at 4.20% 500,000 -
$ 11,700,000 $ 11,200,000
27. BONDS PAYABLE
December 31 2017 2016 Overseas corporate bonds - secured $ 1,409,598 $ 1,135,884 SSG15 To comply with the Japanese law, whenever SSG15 issued secured corporate bonds, UCSH must transfer more than half of the shares of common stock of SSG15 held by UCSH to the legal entity Ippam Shadan Hojin UCJ1 (ISH UCJ1) in order to establish bankruptcy isolation mechanism. SSG15 issued five-year period secured corporate bonds face value JPY2,200,000 thousand secured by investment property as a guarantee. The book value of the investment property is 914,928 (NT$582,916 thousand) thousand. According to the contract, the issuance can be extended by one year. The interest rates are as follows: a. The first to fifth years: Base rate + 0.20%
Base rate: The Tokyo Swap Rate (TSR), six-month LIBOR-based 5-year JPY/JPY-interest swap rate displayed on page 17143 of the Telerate screen at 10:00 am (JST) on the day that is two business days before the Issuance Date.
b. The sixth year: Base interest rate + 1.20% Base rate: The 3-month TIBOR (based on 365 days) displayed as the Japanese yen TIBOR as published by the JBA TIBOR Administration on page 17097 of the Telerate screen at 11:00 am JST on the day that is two business days before the Interest Payment Date.

- 52 -
SSG12 SSG12 issued secured corporate bonds, KK must transfer more than half of the shares of common stock of SSG12 held by KK to the legal entity Ippam Shadan Hojin UCJ2 (ISH UCJ2) in order to establish bankruptcy isolation mechanism. SSG12 issued five-year period secured corporate bonds face value JPY1,920,000 thousand secured by investment property as a guarantee. The book value of the investment property is 976,737 thousand (NT$508,727 thousand). According to the contract, the issuance can be extended by one year. The interest rates are as follows: a. The first to fifth years: Base rate + 0.45%
Base rate: The five-year yen-yen swap rate displayed on Reuters Screen page 17143 as the index rate as of 10 a.m. Tokyo time two Business Days prior to the Issue Date.
b. The sixth year: Base interest rate + 0.45% Base rate: The three-month yen TIBOR published by JBA TIBOR Administration on page 17097 of the Telerate screen as of 11 a.m., Tokyo time two Business Days prior to the first day of each Interest Calculation Period during the Tail Period.
SSG16 SSG16 issued secured corporate bonds, KK must transfer more than half of the shares of common stock of SSG16 held by KK to the legal entity Ippam Shadan Hojin UCJ2 (ISH UCJ2) in order to establish bankruptcy isolation mechanism. SSG16 issued four-year period secured corporate bonds face value JPY1,200,000 thousand secured by investment property as a guarantee. The book value of the investment property is 630,917 thousand (NT$317,955 thousand). Issuance of Corporate bonds of base rate + 0.50% (base rate: The three-month yen TIBOR published by JBA TIBOR Administration on page 17097 of the Telerate screen as of 11 a.m., Tokyo time two Business Days prior to the first day of each Interest Calculation Period during the Tail Period).
28. OTHER FINANCIAL LIABILITIES December 31 2017 2016 Commercial paper $ 4,269,721 $ 4,215,572 Principals of structured products 20,358 14,953 Funds obtained from the government - intended for specific types of
loans 1,362 4,613 $ 4,291,441 $ 4,235,138
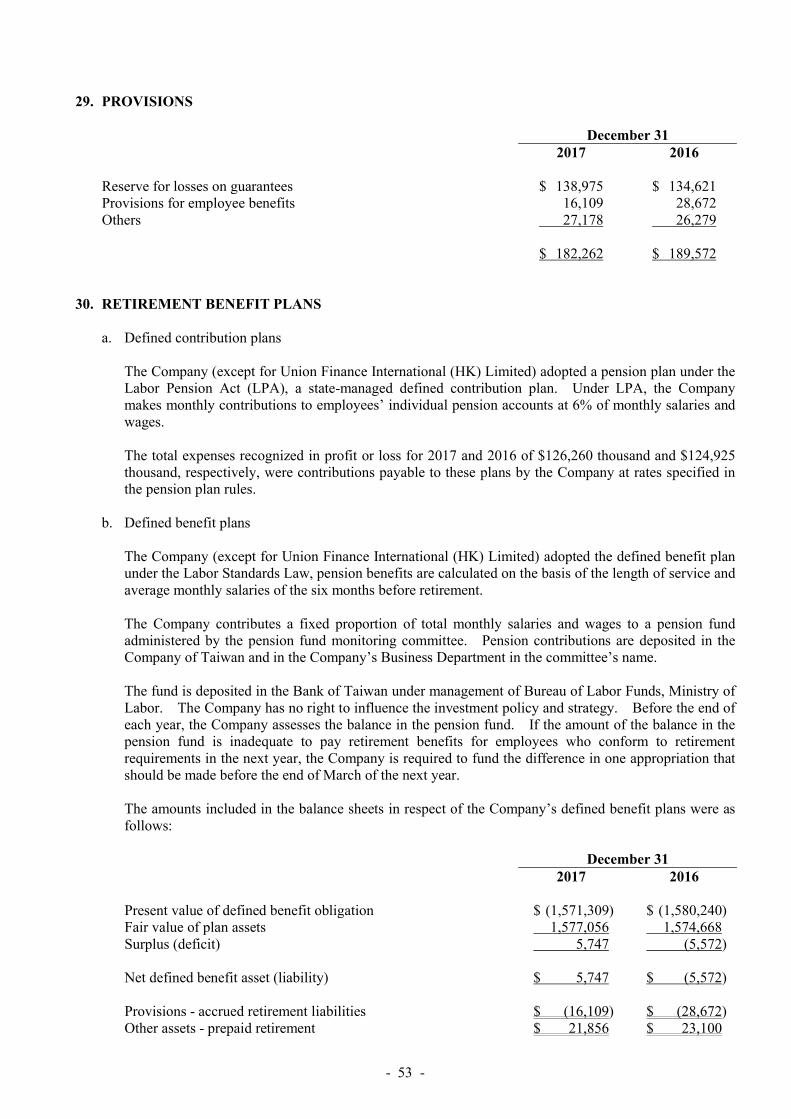
- 53 -
29. PROVISIONS
December 31 2017 2016 Reserve for losses on guarantees $ 138,975 $ 134,621 Provisions for employee benefits 16,109 28,672 Others 27,178 26,279 $ 182,262 $ 189,572
30. RETIREMENT BENEFIT PLANS
a. Defined contribution plans The Company (except for Union Finance International (HK) Limited) adopted a pension plan under the Labor Pension Act (LPA), a state-managed defined contribution plan. Under LPA, the Company makes monthly contributions to employees’ individual pension accounts at 6% of monthly salaries and wages. The total expenses recognized in profit or loss for 2017 and 2016 of $126,260 thousand and $124,925 thousand, respectively, were contributions payable to these plans by the Company at rates specified in the pension plan rules.
b. Defined benefit plans The Company (except for Union Finance International (HK) Limited) adopted the defined benefit plan under the Labor Standards Law, pension benefits are calculated on the basis of the length of service and average monthly salaries of the six months before retirement. The Company contributes a fixed proportion of total monthly salaries and wages to a pension fund administered by the pension fund monitoring committee. Pension contributions are deposited in the Company of Taiwan and in the Company’s Business Department in the committee’s name. The fund is deposited in the Bank of Taiwan under management of Bureau of Labor Funds, Ministry of Labor. The Company has no right to influence the investment policy and strategy. Before the end of each year, the Company assesses the balance in the pension fund. If the amount of the balance in the pension fund is inadequate to pay retirement benefits for employees who conform to retirement requirements in the next year, the Company is required to fund the difference in one appropriation that should be made before the end of March of the next year. The amounts included in the balance sheets in respect of the Company’s defined benefit plans were as follows: December 31 2017 2016 Present value of defined benefit obligation $ (1,571,309) $ (1,580,240) Fair value of plan assets 1,577,056 1,574,668 Surplus (deficit) 5,747 (5,572) Net defined benefit asset (liability) $ 5,747 $ (5,572) Provisions - accrued retirement liabilities $ (16,109) $ (28,672) Other assets - prepaid retirement $ 21,856 $ 23,100
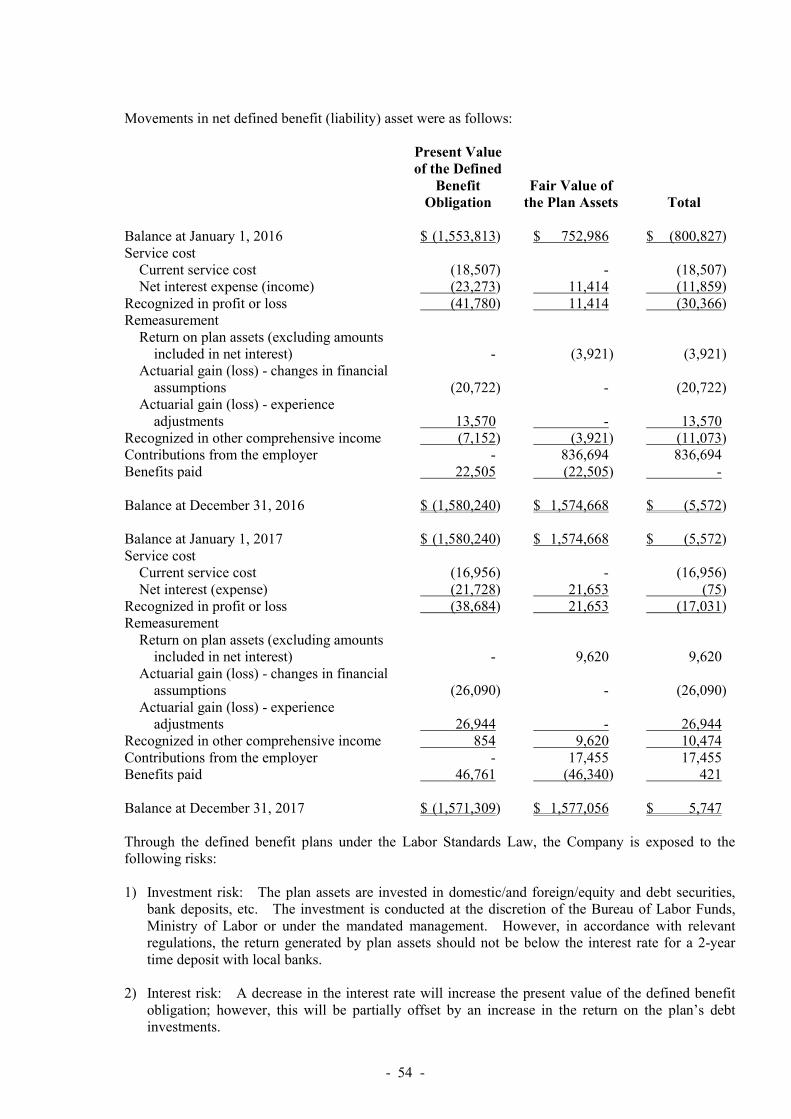
- 54 -
Movements in net defined benefit (liability) asset were as follows:
Present Value of the Defined
Benefit Obligation
Fair Value of the Plan Assets Total
Balance at January 1, 2016 $ (1,553,813) $ 752,986 $ (800,827) Service cost
Current service cost (18,507) - (18,507) Net interest expense (income) (23,273) 11,414 (11,859)
Recognized in profit or loss (41,780) 11,414 (30,366) Remeasurement
Return on plan assets (excluding amounts included in net interest) - (3,921) (3,921)
Actuarial gain (loss) - changes in financial assumptions (20,722) - (20,722)
Actuarial gain (loss) - experience adjustments 13,570 - 13,570
Recognized in other comprehensive income (7,152) (3,921) (11,073) Contributions from the employer - 836,694 836,694 Benefits paid 22,505 (22,505) - Balance at December 31, 2016 $ (1,580,240) $ 1,574,668 $ (5,572) Balance at January 1, 2017 $ (1,580,240) $ 1,574,668 $ (5,572) Service cost
Current service cost (16,956) - (16,956) Net interest (expense) (21,728) 21,653 (75)
Recognized in profit or loss (38,684) 21,653 (17,031) Remeasurement
Return on plan assets (excluding amounts included in net interest) - 9,620 9,620
Actuarial gain (loss) - changes in financial assumptions (26,090) - (26,090)
Actuarial gain (loss) - experience adjustments 26,944 - 26,944
Recognized in other comprehensive income 854 9,620 10,474 Contributions from the employer - 17,455 17,455 Benefits paid 46,761 (46,340) 421 Balance at December 31, 2017 $ (1,571,309) $ 1,577,056 $ 5,747 Through the defined benefit plans under the Labor Standards Law, the Company is exposed to the following risks: 1) Investment risk: The plan assets are invested in domestic/and foreign/equity and debt securities,
bank deposits, etc. The investment is conducted at the discretion of the Bureau of Labor Funds, Ministry of Labor or under the mandated management. However, in accordance with relevant regulations, the return generated by plan assets should not be below the interest rate for a 2-year time deposit with local banks.
2) Interest risk: A decrease in the interest rate will increase the present value of the defined benefit
obligation; however, this will be partially offset by an increase in the return on the plan’s debt investments.

- 55 -
3) Salary risk: The present value of the defined benefit obligation is calculated by reference to the future salaries of plan participants. As such, an increase in the salary of the plan participants will increase the present value of the defined benefit obligation.
The actuarial valuations of the present value of the defined benefit obligation were carried out by qualified actuaries. The principal assumptions used for the purposes of the actuarial valuations were as follows: December 31 2017 2016 Discount rate 1.225% 1.375% Expected rates of future salary increase 1.50%-3.00% 1.00%-3.00% If possible reasonable change in each of the significant actuarial assumptions will occur and all other assumptions will remain constant, the present value of the defined benefit obligation would increase (decrease) as follows: December 31 2017 2016 Discount rate(s)
0.25% increase $ (47,535) $ (49,702) 0.25% decrease $ 49,605 $ 51,956
Expected rate(s) of salary increase 0.25% increase $ 47,972 $ 50,319 0.25% decrease $ (46,228) $ (48,405)
The sensitivity analysis presented above may not be representative of the actual change in the present value of the defined benefit obligation as it is unlikely that the change in assumptions would occur in isolation of one another as some of the assumptions may be correlated. December 31 2017 2016 The expected contributions to the plan for the next year $ 24,571 $ 24,566 The average duration of the defined benefit obligation 12-16 years 13-16 years
c. Retirement benefits plans of Union Finance International (HK) Limited Union Finance International (HK) Limited has a defined contribution plan under foreign standards and regulations and is thus not covered by the Labor Pension Act and the Labor Standards Law. Its pension costs were $119 thousand in 2017 and $127 thousand in 2016.
31. OTHER LIABILITIES
December 31 2017 2016 Guarantee deposits received $ 2,362,921 $ 2,360,609 Advance receipts 486,850 432,465 Others 117,442 99,136 $ 2,967,213 $ 2,892,210

- 56 -
32. EQUITY
a. Capital stock Common stock
December 31 2017 2016 Number of shares authorized (in thousands) 4,500,000 3,000,000 Amount of shares authorized $ 45,000,000 $ 30,000,000 Number of shares issued and fully paid (in thousands) 2,605,152 2,605,152 Amount of shares issued $ 26,051,524 $ 26,051,524 Fully paid common shares, which have a par value of NT$10, carry one vote per share and carry a right to dividends. Preferred stock Due to the capital needs of the Bank for future long-term business development and operational scale expansion, the Bank’s shareholders approved and authorized the board of directors to issue ordinary shares or special shares for domestic cash capital increase (one or both, as appropriate) in accordance with the provisions of the Articles of Incorporation or the relevant laws and regulations, in order to raise the long-term funds. The total funds to be raised through issuing new shares as authorized this time shall not be more than NT$10 billion (inclusive) as the principle. The number of shares for issue shall not be more than 800,000,000 shares (inclusive) as the principle. On June 28, 2017, the Banks’s board of directors resolved to issue preferred stock - A totaling 200,000 thousand shares, with a par value of NT$10, at NT$50 per share in the total amount of NT$10,000,000 thousand on December 28, 2017. The issuance of shares has been approved by the FSC under Order No. 1060033586 issued on September 1, 2017. On October 24, 2017, the capital from issue of preferred stock - A amounted to NT$10,000,000 thousand. The preferred stock - A was listed on Taiwan Stock Exchange on December 1, 2017. The rights and other important conditions of issuance of the preferred stock - A are as follows: 1) Tenor: Perpetual. 2) Dividend yield: An annual dividend yield is set at 4.8% (5-year IRS 0.89125%+3.90875%) per
annum of the issue price at the pricing day. The 5-year IRS will be reset on the next business day after each fifth and half anniversary day after issuance thereafter. The pricing date for reset is the second business day of financial industry in Taipei immediately preceding each reset date. The 5-year IRS rate is the arithmetic mean of 5-year IRS rates appearing on Reuters pages “PYTWDFIX” and “COSMOS3” at 11:00 a.m. (Taipei time) on the relevant pricing date for reset. If such rate cannot be obtained, the Bank will determine the rate based on reasonable market price with good faith.
3) Dividend payment: Whereas the Company makes profit in a fiscal year, the profit shall be first
utilized for paying taxes, offset losses of previous years, and from the remaining profit set aside amount as legal reserve, and set aside or reverse special reserve in accordance with the laws and regulations, and distribute dividends to the preferred shareholders. The Bank has the sole discretion on the distribution of dividends of preferred stocks - A, which includes but not limited to the Bank’s discretion to resolve not to distribute dividends to the preferred shareholders if there is no surplus, or if earnings in the fiscal year are insufficient to fully pay off dividends to the

- 57 -
shareholders of the preferred stocks, or if the distribution of dividends of preferred stocks may cause Total Capital Adequacy Ratio to be less than the authority’s minimum requirement, or if the Bank has other essential considerations. If the Bank resolves not to distribute dividends to the preferred shareholders, the shareholders of preferred stock - A shall raise no objection. The unpaid dividend will not be carried forward to years with earnings. The stock dividends of preferred stocks - A are distributed by cash in one payment annually. After the shareholders, in their meeting, approved the appropriation of the earnings of the fiscal year as proposed by the board of directors and resolved to distribute from the earnings cash dividends, the board of directors sets the record date of preferred stock - A for payment of dividends. Dividend is calculated based on the proportion of the number of days that the stocks are issued in a fiscal year, starting from the date of issuance to the record date(or redemption date) of dividend. The amount of dividends distributed should be listed on the Dividend Statements.
4) Restrictions on payment of dividends to common shares: Except for the dividends prescribed in
the preceding subparagraphs herein, the shareholders of preferred stock - A are not entitled to participate in the distribution of cash or stock dividends with regard to the ordinary shares derived from earnings or capital reserves.
5) Redemption: After 5.5 years from the issue date, the bank may, subject to the competent
authority’s approval, redeem a portion or all of the outstanding shares of preferred stock - A at any time at the issue price. The rights and obligations associated with any remaining outstanding shares of preferred stock - A shall continue as specified herein. If the stockholders’ meeting approves the distribution of dividends in the year the Bank redeems the outstanding shares of preferred stock - A, the dividends payable shall be calculated at the ratio of the number of days outstanding from beginning of year to the redemption date to total days in a fiscal year.
6) Liquidation Preference: In the event of liquidation, except when the competent authority assigned
officials to take receivership over the Bank, order the Bank to suspend and wind up business, or liquidate the Bank, in accordance with the “Regulations Governing the Capital Adequacy and Capital Category of Banks”, the order of priority for the distribution of the earnings and assets of the shareholders of preferred stock - A is the same as that of a common stockholder, the shareholders of preferred stock - A shall be given priority to claim on the Bank’s remaining assets over the shareholders of common stocks, and equal to shareholders of other preferred stock issued by the Bank, but subordinate to the holders of Tier 2 capital, depositors, and other general creditors, and not more than the issuance amount of outstanding shares of preferred stock - A.
7) Voting rights or election rights: The shareholders of preferred stock - A are not entitled to any
voting rights or election rights in shareholders’ meeting. However, they may vote in preferred stock - A shareholders’ meetings and in general shareholder meetings with regard to agenda items concerning rights and obligations of the shareholders of preferred stock - A.
8) Preferred stock - A shall not be converted into common stocks. The shareholders of the preferred
stocks shall not require the Bank to redeem the rights of the preferred stocks - A. 9) When the bank issues new shares in cash, the shareholders of preferred stock - A and the common
stock shall be entitled to equivalent preemptive rights on the new shares.
b. Capital surplus
December 31 2017 2016 Issuance of preference shares $ 8,000,000 $ - Treasury stock transactions 32,413 32,413 $ 8,032,413 $ 32,413

- 58 -
The capital surplus from shares issued in excess of par (additional paid-in capital from issuance of common shares and treasury stock transactions) and donations may be used to offset a deficit; in addition, when the Company has no deficit, such capital surplus may be distributed as cash dividends or transferred to share capital limited to a certain percentage of the Company’s capital surplus and to once a year. The capital surplus from long-term investments, employee stock options and conversion options may not be used for any purpose.
c. Legal reserve Legal reserve should be appropriated until it equals the Company’s paid-in-capital. Legal reserve may be used to offset deficit. If the Company has no deficit and the legal reserve has exceeded 25% of its paid-in capital, the excess may be transferred to capital or distributed in cash. In addition, based on the Banking Act, if the legal reserve is less than the Company’s paid-in capital, the amount that may be distributed in cash should not exceed 15% of the Company’s paid-in-capital.
d. Special reserve
Items referred to under Rule No. 1010012865, Rule No. 1030006415 issued by the FSC and the directive titled “Questions and Answers for Special Reserves Appropriated Following Adoption of IFRSs” should be appropriated to or reversed from a special reserve by the Bank. If a special reserve appropriated on the first-time adoption of IFRSs relates to investment properties other than land, the special reserve may be reversed continuously over the period of use. The special reserve relating to land may be reversed on the disposal or reclassification of the related assets. The above special reserve may be used to offset a deficit; if the reserve has reached at least 50% of the paid-in capital, half of this special reserve may be capitalized. According to Order No. 10510001510 issued by the FSC, a special reserve should be appropriated between 0.5% and 1% of net income after tax when banks appropriate earnings of 2016 through 2018. Since 2017, the Company is allowed to reverse the special reserve at the amount of the costs of employee transfer and arrangement in connection with the development of financial technology. According to Order No. 1010012865 and No. 10510001510 issued by FSC that should appropriate special reserves. December 31 2017 2016 Balance at January 1, 2017 $ 558,842 $ 558,842 Special reserves appropriated 26,364 - Balance at December 31, 2017 $ 585,206 $ 558,842
e. Retained earnings and dividend policy
In accordance with the amendments to the Company Act in May 2015, the recipients of dividends and bonuses are limited to stockholders and do not include employees. The stockholders held their regular meeting on June 8, 2016 and, in that meeting, had resolved amendments to the Bank’s Articles of Incorporation (the Articles), particularly the amendment to the policy on dividend distribution and the addition of the policy on distribution of employees’ compensation. For the policies on distribution of employees’ compensation and remuneration of directors and supervisors before and after amendment, please refer to Employee benefits expense in Note 35.

- 59 -
The Bank’s Articles of Incorporation provide that annual net income less any prior years’ deficit should be appropriated in the following order: 1) 30% as legal reserve; 2) Special reserve, as deemed proper; 3) Remainder plus prior year’s unappropriated earnings: Dividends; These appropriations should be approved by the stockholders in, and given effect to in the financial statements of, the year following the year of earnings generation. The board of directors decides the appropriation and distribution of cash and stock dividends, taking into account the Bank’s overall financial and economic condition, future profitability and capital expenditure requirements. In principle, when the Bank of International Settlement ratio is lower than the ratio approved by the authorities plus 1%, primarily stock dividends will be declared. If the legal reserve has not reached the Bank’s paid-in capital, cash dividends are limited to 15% of the Bank’s paid-in capital. The plan on employees’ bonus and remuneration to directors and supervisors is proposed by the board of directors. Except for non-ROC resident stockholders, all stockholders receiving the dividends are allowed a tax credit equal to their proportionate share of the income tax paid by the Bank. The appropriations from the earnings of 2016 and 2015 were approved in stockholders’ meetings on June 20, 2017 and June 8, 2016, respectively. The appropriations and dividends per share were as follows: Appropriation of Earnings Dividends Per Share (NT$) 2016 2015 2016 2015 Legal reserve $ 790,913 $ 923,460 Special reserve 26,364 - Cash dividends on ordinary shares 1,172,319 1,042,061 $ 0.45 $ 0.40 The appropriations from the 2017 earnings were proposed by the board of directors on March 14, 2018. The appropriations, including the dividends per share, were as follows:
Appropriation
of Earnings Dividends Per Share (NT$)
Legal reserve $ 823,496 Special reserve 27,450 Cash dividends on ordinary shares 1,042,061 $0.40 Stock dividends on ordinary shares 781,546 0.30 Cash dividends on preference shares 90,740 0.45369863 (Note) Note: 69 days of outstanding in 2017 and 4.8% dividend yield. About the appropriation of earnings of 2017 will be approved in stockholders’ meetings in June 2018.
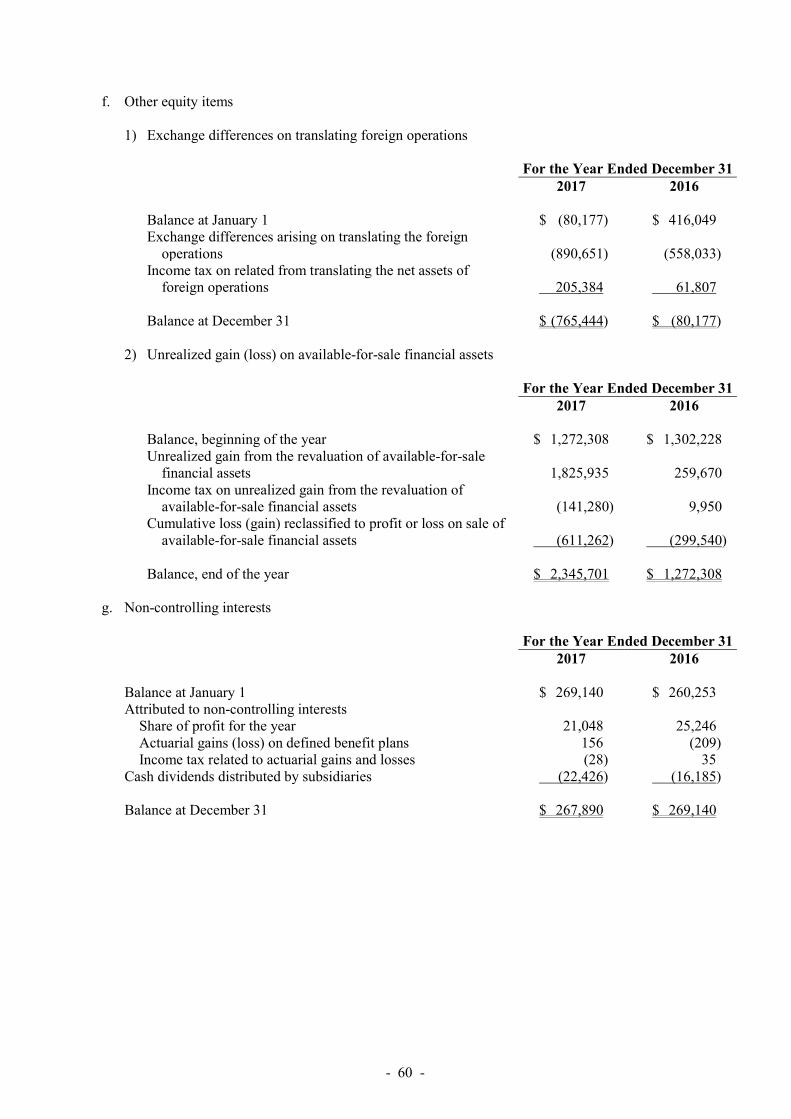
- 60 -
f. Other equity items 1) Exchange differences on translating foreign operations
For the Year Ended December 31 2017 2016 Balance at January 1 $ (80,177) $ 416,049 Exchange differences arising on translating the foreign
operations (890,651) (558,033) Income tax on related from translating the net assets of
foreign operations 205,384 61,807 Balance at December 31 $ (765,444) $ (80,177)
2) Unrealized gain (loss) on available-for-sale financial assets
For the Year Ended December 31 2017 2016 Balance, beginning of the year $ 1,272,308 $ 1,302,228 Unrealized gain from the revaluation of available-for-sale
financial assets 1,825,935 259,670 Income tax on unrealized gain from the revaluation of
available-for-sale financial assets (141,280) 9,950 Cumulative loss (gain) reclassified to profit or loss on sale of
available-for-sale financial assets (611,262) (299,540) Balance, end of the year $ 2,345,701 $ 1,272,308
g. Non-controlling interests
For the Year Ended December 31 2017 2016 Balance at January 1 $ 269,140 $ 260,253 Attributed to non-controlling interests
Share of profit for the year 21,048 25,246 Actuarial gains (loss) on defined benefit plans 156 (209) Income tax related to actuarial gains and losses (28) 35
Cash dividends distributed by subsidiaries (22,426) (16,185) Balance at December 31 $ 267,890 $ 269,140

- 61 -
33. NET INTEREST
For the Year Ended December 31 2017 2016 Interest revenue Discounts and loans $ 6,307,257 $ 6,143,904 Debt instruments with no active market 1,722,890 1,715,733 Credit card 726,838 706,213 Due from the Central Bank and call loans to other banks 329,808 392,912 Available-for-sale financial assets 953,877 845,680 Securities purchased under resell agreements 115,813 119,833 Held-to-maturity financial assets 84,481 63,214 Others 27,840 26,848 10,268,804 10,014,337 Interest expense Deposits 2,919,534 3,110,201 Securities sold under repurchase agreements 331,824 214,377 Bank debentures 322,024 291,833 Due to Chunghwa Post Co., Ltd. 12,115 14,366 Others 92,259 79,188 3,677,756 3,709,965 $ 6,591,048 $ 6,304,372
34. COMMISSIONS AND FEE REVENUES, NET
For the Year Ended December 31 2017 2016 Commission and fee revenues
Insurance commission $ 820,626 $ 1,220,848 Credit cards and cash cards 1,084,651 1,029,294 Trust business 382,052 255,903 Loan business 235,023 207,199 Interbank service fee 162,258 143,489 Underwriting business 65,963 105,940 Guarantee business 85,012 82,908 Others 218,304 194,401
3,053,889 3,239,982 Commission and fee expense
Credit card 590,427 663,369 Verification of credit 33,462 30,588 Interbank service fee 22,653 17,687 Acquiring liquidation deal 14,259 14,341 Others 95,071 90,508
755,872 816,493 $ 2,298,017 $ 2,423,489
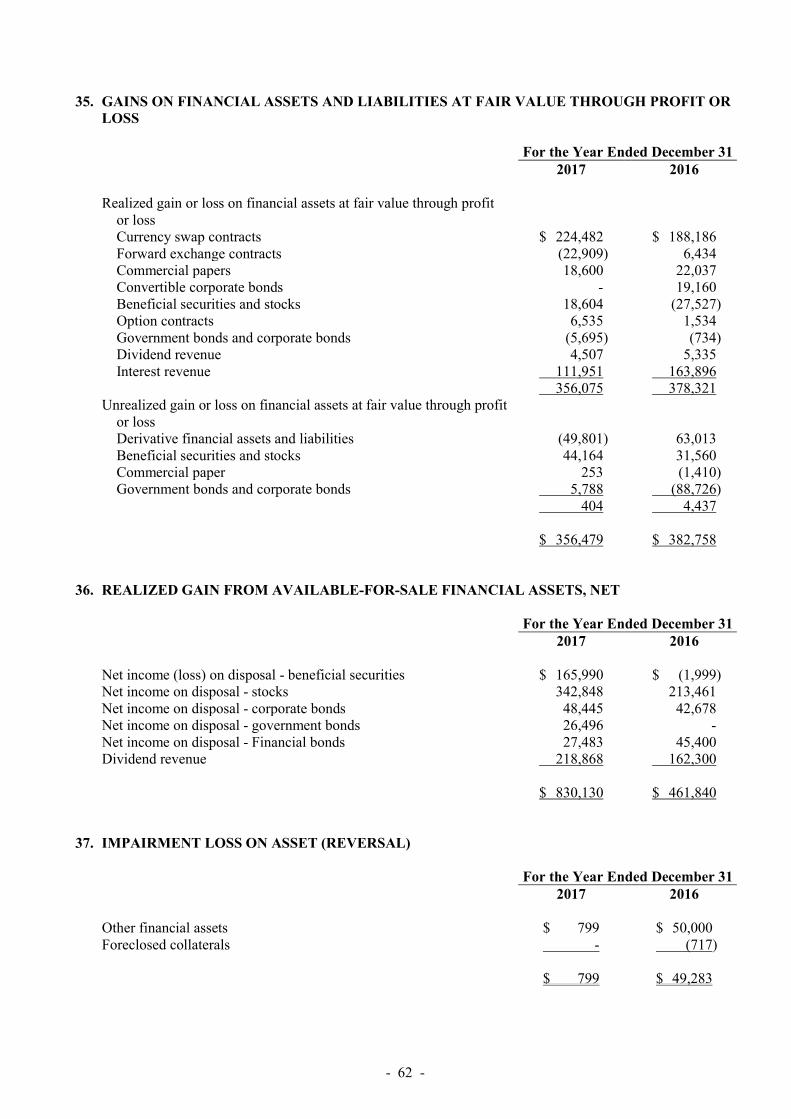
- 62 -
35. GAINS ON FINANCIAL ASSETS AND LIABILITIES AT FAIR VALUE THROUGH PROFIT OR LOSS
For the Year Ended December 31 2017 2016 Realized gain or loss on financial assets at fair value through profit
or loss Currency swap contracts $ 224,482 $ 188,186 Forward exchange contracts (22,909) 6,434 Commercial papers 18,600 22,037 Convertible corporate bonds - 19,160 Beneficial securities and stocks 18,604 (27,527) Option contracts 6,535 1,534 Government bonds and corporate bonds (5,695) (734) Dividend revenue 4,507 5,335 Interest revenue 111,951 163,896 356,075 378,321
Unrealized gain or loss on financial assets at fair value through profit or loss Derivative financial assets and liabilities (49,801) 63,013 Beneficial securities and stocks 44,164 31,560 Commercial paper 253 (1,410) Government bonds and corporate bonds 5,788 (88,726) 404 4,437 $ 356,479 $ 382,758
36. REALIZED GAIN FROM AVAILABLE-FOR-SALE FINANCIAL ASSETS, NET
For the Year Ended December 31 2017 2016 Net income (loss) on disposal - beneficial securities $ 165,990 $ (1,999) Net income on disposal - stocks 342,848 213,461 Net income on disposal - corporate bonds 48,445 42,678 Net income on disposal - government bonds 26,496 - Net income on disposal - Financial bonds 27,483 45,400 Dividend revenue 218,868 162,300 $ 830,130 $ 461,840
37. IMPAIRMENT LOSS ON ASSET (REVERSAL)
For the Year Ended December 31 2017 2016 Other financial assets $ 799 $ 50,000 Foreclosed collaterals - (717) $ 799 $ 49,283

- 63 -
38. EMPLOYEE BENEFIT EXPENSES
For the Year Ended December 31 2017 2016 Salaries and wages $ 2,159,038 $ 2,115,272 Bonus 707,164 759,421 Pension
Defined contribution plans 126,379 125,052 Defined benefit plans 17,031 30,366
Labor insurance and national health insurance 267,888 259,234 Others 75,074 56,404 $ 3,352,574 $ 3,345,749 In compliance with the Company Act as amended in May 2015 and the amended Articles of Incorporation of the Bank approved by the stockholders in their meeting on June 8, 2016, the Bank accrued employees’ compensation and remuneration of directors at the rates of between 1% to 5% and no higher than 0.1%, respectively, of net profit before income tax, employees’ compensation, and remuneration of directors. The employees’ compensation and remuneration of directors for the years ended December 31, 2017 and 2016 which have been approved by the Bank’s board of directors on March 14, 2018 and March 22, 2017, respectively, were as follows: Accrual rate For the Year Ended December 31 2017 2016 Employees’ compensation 1.84% 1.84% Remuneration of directors 0.09% 0.09% Amount For the Year Ended December 31 2017 2016 Cash Share Cash Share Employees’ compensation $ 62,164 $ - $ 60,602 $ - Remuneration of directors and
supervisors 3,041 - 2,964 - If there is a change in the amounts after the annual financial statements were authorized for issue, the differences are recorded as a change in the accounting estimate. There was no difference between the actual amounts of employees’ compensation and remuneration of directors in 2016 and 2015 and paid and the amounts recognized in the financial statements in 2016 and 2015. Information on the employees’ compensation and remuneration of directors resolved by the Bank’s board of directors in 2017 and 2016 is available at the Market Observation Post System website of the Taiwan Stock Exchange.

- 64 -
39. DEPRECIATION AND AMORTIZATION
For the Year Ended December 31 2017 2016 Property and equipment $ 271,561 $ 251,675 Investment properties 38,342 34,061 Assets leased 1,563,482 1,475,216 Intangible assets 64,125 51,923 Other assets - 7,985 $ 1,937,510 $ 1,820,860
40. OTHER OPERATING EXPENSES
For the Year Ended December 31 2017 2016 Rental $ 658,321 $ 616,379 Outsourcing service 295,866 314,283 Taxation and government fee 608,740 627,762 Postage/cable charge 247,713 235,551 Computer operating 165,376 161,181 Advertisement 492,702 419,055 Deposit insurance 131,783 127,965 Maintenance charge 123,993 120,407 Others 713,355 740,139 $ 3,437,849 $ 3,362,722
41. INCOME TAX
a. Income tax recognized in profit or loss The main components of income tax expense were as follows: For the Year Ended December 31 2017 2016 Current tax
Current year $ 117,534 $ 80,334 Additional 10% income tax on unappropriated earnings 63,776 110,493 Prior year’s adjustments 4 (7,564)
181,314 183,263 Deferred tax
Current year 439,222 465,903 Income tax expense recognized in profit or loss $ 620,536 $ 649,166

- 65 -
A reconciliation of accounting profit and current income tax expenses for the years ended December 31, 2017 and 2016 is as follows: For the Year Ended December 31 2017 2016 Income before tax $ 3,386,571 $ 3,310,787 Income tax expense at the 17% statutory rate $ 578,398 $ 567,925 Nondeductible expenses in determining taxable income 32,648 26,109 Additional income tax under the Alternative Minimum Tax Act 70,709 21,432 Unrecognized deductible temporary differences 52,384 42,751 Additional 10% income tax on unappropriated earnings 63,776 110,493 Tax-exempt income (232,793) (146,361) Other permanent differences 55,410 34,381 Adjustments for prior year’s tax 4 (7,564) Income tax expense recognized in profit or loss $ 620,536 $ 649,166 The applicable tax rate used by the Company (except for Union Finance International (HK) Limited) and Singapore was 17%, the applicable tax rate used by a subsidiary in Hong Kong was 16.5% and the applicable tax rate used by subsidiaries in Japan was 30%. In February 2018, it was announced by the President that the Income Tax Act in the ROC was amended and, starting from 2018, the corporate income tax rate will be adjusted from 17% to 20%. In addition, the rate of the corporate surtax applicable to 2018 unappropriated earnings will be reduced from 10% to 5%. Deferred tax assets and deferred tax liabilities recognized as at December 31, 2017 are expected to be adjusted and would increase by 206,995 thousand and 165,388 thousand, respectively, in 2018. As the manner of the 2018 appropriation of the 2017 earnings is uncertain, the income tax consequences on the 2017 unappropriated earnings cannot be reliably determined.
b. Income tax recognized in other comprehensive income
For the Year Ended December 31 2017 2016 Deferred tax Recognized in other comprehensive income:
Exchange differences on the translation of financial statements of foreign operations $ (205,384) $ (61,807)
Unrealized gains on available-for-sale financial assets 141,280 (9,950) Actuarial gains and losses on defined benefit plans 1,781 (1,883)
Total income tax expenses (profit) recognized in other
comprehensive income $ (62,323) $ (73,640)
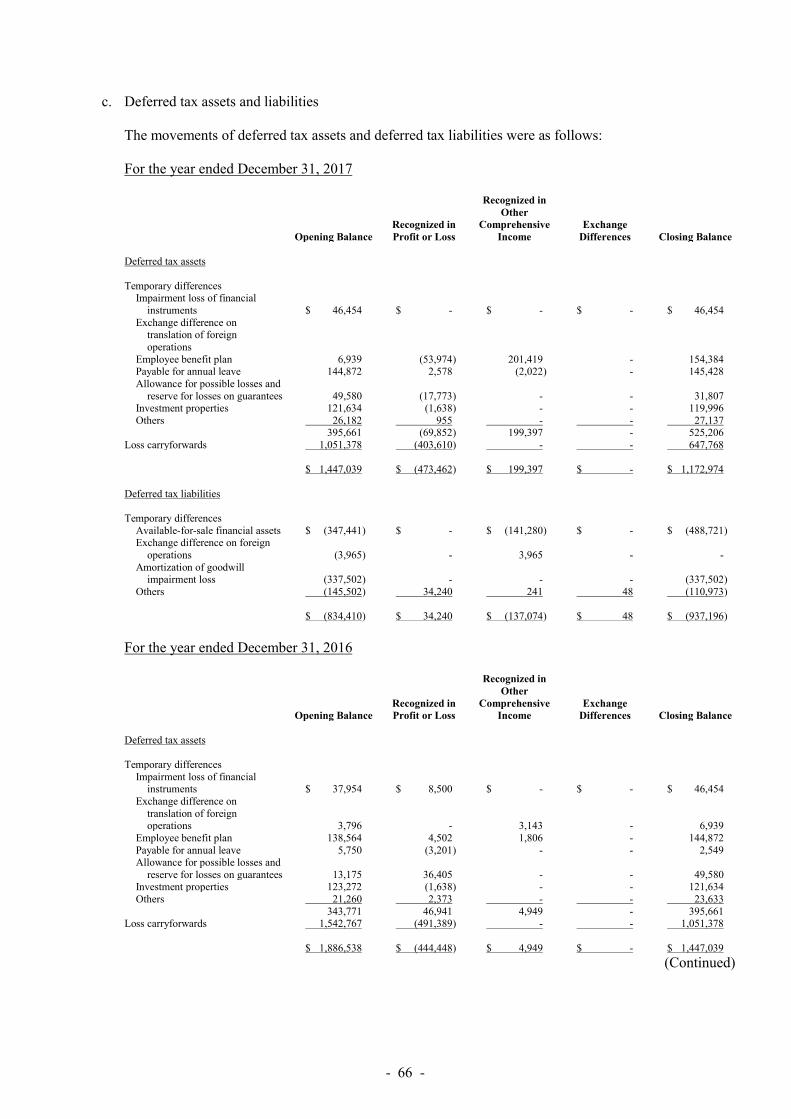
- 66 -
c. Deferred tax assets and liabilities
The movements of deferred tax assets and deferred tax liabilities were as follows: For the year ended December 31, 2017
Opening Balance Recognized in Profit or Loss
Recognized in Other
Comprehensive Income
Exchange Differences Closing Balance
Deferred tax assets Temporary differences
Impairment loss of financial instruments $ 46,454 $ - $ - $ - $ 46,454
Exchange difference on translation of foreign operations
Employee benefit plan 6,939 (53,974 ) 201,419 - 154,384 Payable for annual leave 144,872 2,578 (2,022 ) - 145,428 Allowance for possible losses and
reserve for losses on guarantees 49,580 (17,773 ) - - 31,807 Investment properties 121,634 (1,638 ) - - 119,996 Others 26,182 955 - - 27,137
395,661 (69,852 ) 199,397 - 525,206 Loss carryforwards 1,051,378 (403,610 ) - - 647,768 $ 1,447,039 $ (473,462 ) $ 199,397 $ - $ 1,172,974 Deferred tax liabilities Temporary differences
Available-for-sale financial assets $ (347,441 ) $ - $ (141,280 ) $ - $ (488,721 ) Exchange difference on foreign
operations (3,965 ) - 3,965 - - Amortization of goodwill
impairment loss (337,502 ) - - - (337,502 ) Others (145,502 ) 34,240 241 48 (110,973 ) $ (834,410 ) $ 34,240 $ (137,074 ) $ 48 $ (937,196 )
For the year ended December 31, 2016
Opening Balance Recognized in Profit or Loss
Recognized in Other
Comprehensive Income
Exchange Differences Closing Balance
Deferred tax assets Temporary differences
Impairment loss of financial instruments $ 37,954 $ 8,500 $ - $ - $ 46,454
Exchange difference on translation of foreign operations 3,796 - 3,143 - 6,939
Employee benefit plan 138,564 4,502 1,806 - 144,872 Payable for annual leave 5,750 (3,201 ) - - 2,549 Allowance for possible losses and
reserve for losses on guarantees 13,175 36,405 - - 49,580 Investment properties 123,272 (1,638 ) - - 121,634 Others 21,260 2,373 - - 23,633
343,771 46,941 4,949 - 395,661 Loss carryforwards 1,542,767 (491,389 ) - - 1,051,378 $ 1,886,538 $ (444,448 ) $ 4,949 $ - $ 1,447,039
(Continued)
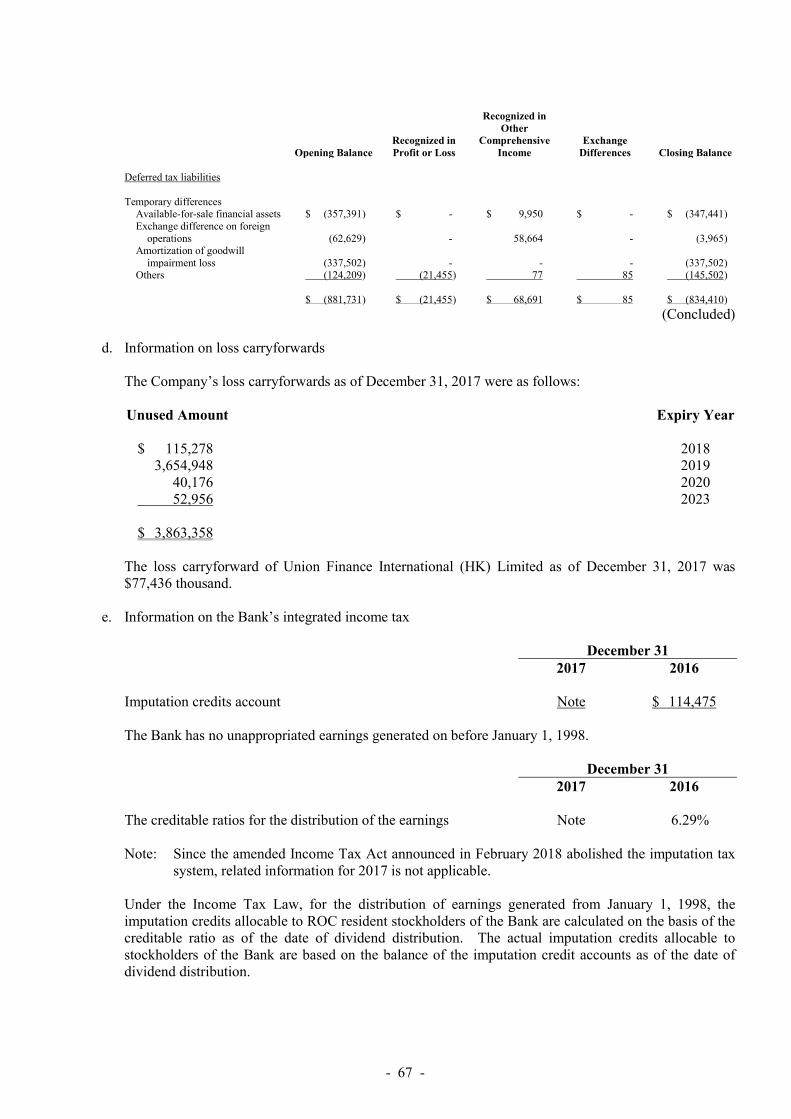
- 67 -
Opening Balance Recognized in Profit or Loss
Recognized in Other
Comprehensive Income
Exchange Differences Closing Balance
Deferred tax liabilities Temporary differences
Available-for-sale financial assets $ (357,391 ) $ - $ 9,950 $ - $ (347,441 ) Exchange difference on foreign
operations (62,629 ) - 58,664 - (3,965 ) Amortization of goodwill
impairment loss (337,502 ) - - - (337,502 ) Others (124,209 ) (21,455 ) 77 85 (145,502 ) $ (881,731 ) $ (21,455 ) $ 68,691 $ 85 $ (834,410 )
(Concluded) d. Information on loss carryforwards
The Company’s loss carryforwards as of December 31, 2017 were as follows: Unused Amount Expiry Year $ 115,278 2018 3,654,948 2019 40,176 2020 52,956 2023 $ 3,863,358 The loss carryforward of Union Finance International (HK) Limited as of December 31, 2017 was $77,436 thousand.
e. Information on the Bank’s integrated income tax
December 31 2017 2016 Imputation credits account Note $ 114,475 The Bank has no unappropriated earnings generated on before January 1, 1998. December 31 2017 2016 The creditable ratios for the distribution of the earnings Note 6.29% Note: Since the amended Income Tax Act announced in February 2018 abolished the imputation tax
system, related information for 2017 is not applicable. Under the Income Tax Law, for the distribution of earnings generated from January 1, 1998, the imputation credits allocable to ROC resident stockholders of the Bank are calculated on the basis of the creditable ratio as of the date of dividend distribution. The actual imputation credits allocable to stockholders of the Bank are based on the balance of the imputation credit accounts as of the date of dividend distribution.

- 68 -
f. Income tax assessments Examined and Cleared Union Bank of Taiwan Through 2015 Union Finance and Leasing International Through 2015 Union Information Technology Through 2015 Union Insurance Broker Through 2015 Union Securities Investment Trust Through 2015 The Bank disagreed with the ending balances’ assessment of imputation credit accounts (ICA) for 2012 and applied for a re-examination. National Tax Administration had reapproved in March 2017 and there is no major difference between the applied amount and the approved amount.
42. EARNINGS PER SHARE The numerators and denominators used in computing earnings per share (EPS) are summarized as follows: Denominator Earnings Numerator (Amounts) (Shares in Per Share (NT$) Pretax After Tax Thousands) Pretax After Tax 2017 Basic EPS
Income for the year attributable to common stockholders $ 3,313,250 $ 2,744,987 2,605,152 $ 1.27 $ 1.50
Bonus to employees - - 8,135 Diluted EPS $ 3,313,250 $ 2,744,987 2,613,287 $ 1.27 $ 1.50 2016 Basic EPS
Income for the year attributable to common stockholders $ 3,226,478 $ 2,636,375 2,605,152 $ 1.24 $ 1.01
Bonus to employees - - 8,328 Diluted EPS $ 3,226,478 $ 2,636,375 2,613,480 $ 1.23 $ 1.01 If the Company offered to settle compensation or bonuses paid to employees in cash or shares, the Company assumed the entire amount of the compensation or bonus will be settled in shares and the resulting potential shares were included in the weighted average number of shares outstanding used in the computation of diluted earnings per share, as the effect is dilutive. Such dilutive effect of the potential shares is included in the computation of diluted earnings per share until the number of shares to be distributed to employees is resolved in the following year.
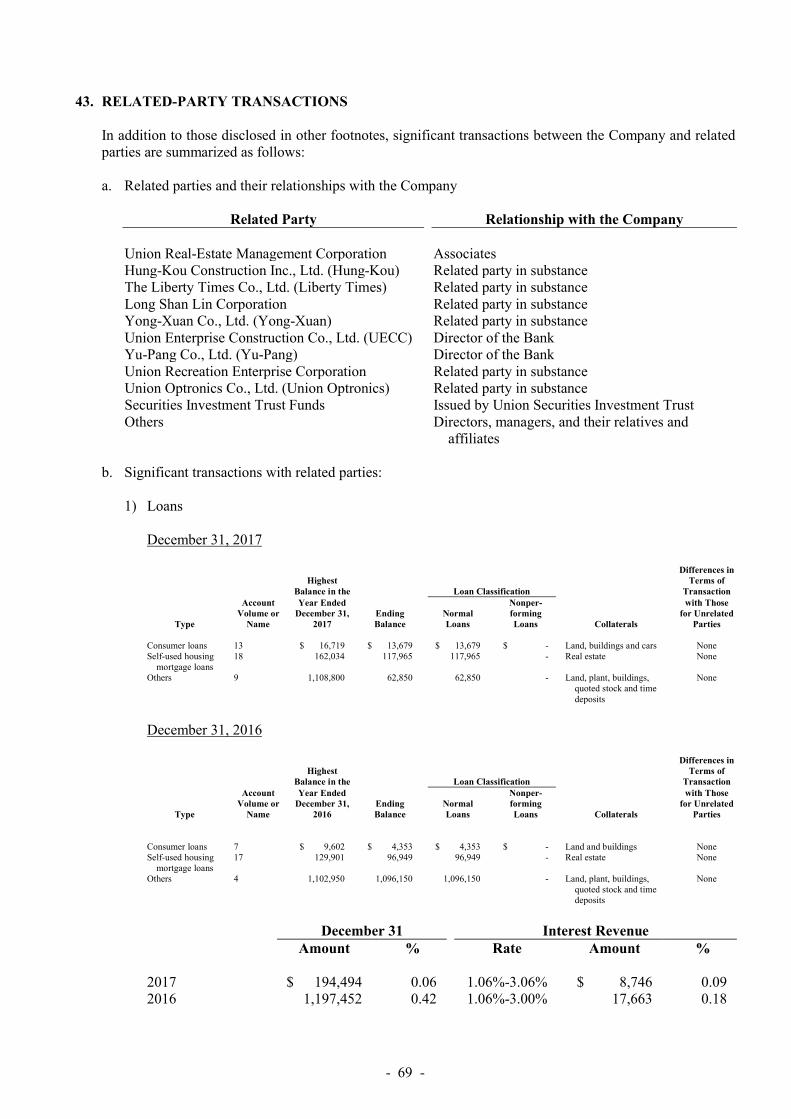
- 69 -
43. RELATED-PARTY TRANSACTIONS
In addition to those disclosed in other footnotes, significant transactions between the Company and related parties are summarized as follows: a. Related parties and their relationships with the Company
Related Party Relationship with the Company Union Real-Estate Management Corporation Associates Hung-Kou Construction Inc., Ltd. (Hung-Kou) Related party in substance The Liberty Times Co., Ltd. (Liberty Times) Related party in substance Long Shan Lin Corporation Related party in substance Yong-Xuan Co., Ltd. (Yong-Xuan) Related party in substance Union Enterprise Construction Co., Ltd. (UECC) Director of the Bank Yu-Pang Co., Ltd. (Yu-Pang) Director of the Bank Union Recreation Enterprise Corporation Related party in substance Union Optronics Co., Ltd. (Union Optronics) Related party in substance Securities Investment Trust Funds Issued by Union Securities Investment Trust Others Directors, managers, and their relatives and
affiliates b. Significant transactions with related parties:
1) Loans December 31, 2017
Highest
Balance in the Loan Classification
Differences in Terms of
Transaction
Account
Volume or Year Ended
December 31, Ending Normal Nonper- forming
with Those for Unrelated
Type Name 2017 Balance Loans Loans Collaterals Parties Consumer loans 13 $ 16,719 $ 13,679 $ 13,679 $ - Land, buildings and cars None Self-used housing
mortgage loans 18 162,034 117,965 117,965 - Real estate None
Others 9 1,108,800 62,850 62,850 - Land, plant, buildings, quoted stock and time deposits
None
December 31, 2016
Highest
Balance in the Loan Classification
Differences in Terms of
Transaction
Account
Volume or Year Ended
December 31, Ending Normal Nonper- forming
with Those for Unrelated
Type Name 2016 Balance Loans Loans Collaterals Parties Consumer loans 7 $ 9,602 $ 4,353 $ 4,353 $ - Land and buildings None Self-used housing
mortgage loans 17 129,901 96,949 96,949 - Real estate None
Others 4 1,102,950 1,096,150 1,096,150 - Land, plant, buildings, quoted stock and time deposits
None
December 31 Interest Revenue
Amount % Rate Amount % 2017 $ 194,494 0.06 1.06%-3.06% $ 8,746 0.09 2016 1,197,452 0.42 1.06%-3.00% 17,663 0.18

- 70 -
2) Deposits
December 31 Interest Expense Amount % Rate (Note) Amount % 2017 $ 5,221,542 1.16 0%-4.80% $ 33,578 0.91 2016 5,006,844 1.16 0%-4.80% 29,984 0.81 Note: Including foreign currency interest rate.
3) Guarantees and letters of credit December 31, 2017
Name
Highest Balance in the Year Ended
December 31, 2017
Ending Balance
Balance of Guarantees and Letters
of Credit (Note) Rate Collateral
Union Recreation Enterprise
Corporation $ 19,316 $ 19,316 $ - 0.5% Time deposits
The Liberty Times Co., Ltd. 2,524 2,483 - 0.05% Time deposits Long Shan Lin Corporation 71,040 71,040 - 0.5% Time deposits Union Optronics Corporation 76,709 76,709 - 0.75% Time deposits
December 31, 2016
Name
Highest Balance in the Year Ended
December 31, 2016
Ending Balance
Balance of Guarantees and Letters
of Credit (Note) Rate Collateral
Union Recreation Enterprise
Corporation $ 39,874 $ 19,316 $ - 0.3% Time deposits
The Liberty Times Co., Ltd. 11,484 - - - Time deposits Long Shan Lin Corporation 71,040 71,040 - 0.5% Time deposits
Note: Reserve for guarantee loss is provided on the basis of the estimated unrecoverable amount.
4) Leases
Under operating lease agreements with terms of one year to five years, the Company rents office spaces from related parties for use by the Company’s Head Office, Trust, International Banking Department, Wealth Management, Information Technology Department, Consumer Banking Department, Insurance Agency Department, Credit Card Department, Northern Collaterals Appraisal Center, five branches, USITC, UFLIC and UIT. Rentals are paid quarterly or are taken from lease deposits. Rental expenses and lease deposits were as follows:
Lease Deposit (Part of
Other Assets) Rental Expense (Part of
Other Operating Expense) Amount % Amount % 2017 Yu-Pang $ 459,983 26.93 $ 25,900 3.93 Hung-Kuo 218,768 12.81 101,476 15.41 Yong-Xuan 15,953 0.93 65,714 9.98 UECC 5,334 0.31 10,962 1.67
(Continued)
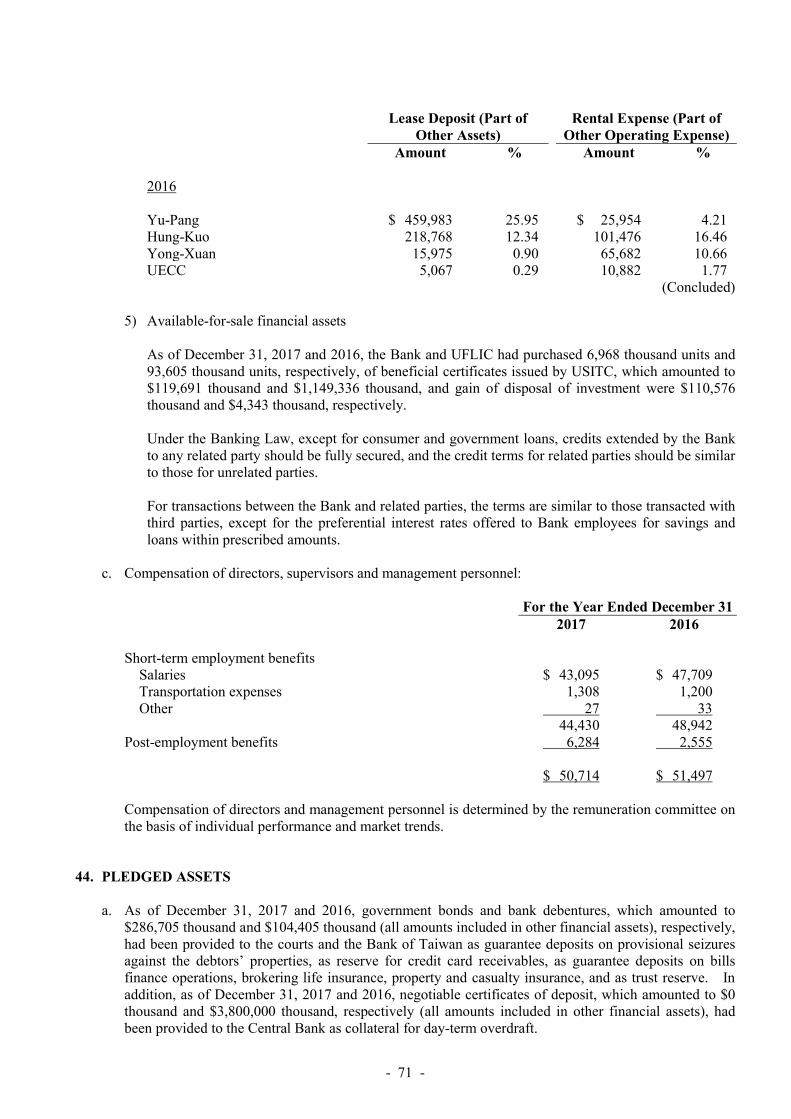
- 71 -
Lease Deposit (Part of
Other Assets) Rental Expense (Part of
Other Operating Expense) Amount % Amount % 2016 Yu-Pang $ 459,983 25.95 $ 25,954 4.21 Hung-Kuo 218,768 12.34 101,476 16.46 Yong-Xuan 15,975 0.90 65,682 10.66 UECC 5,067 0.29 10,882 1.77
(Concluded) 5) Available-for-sale financial assets
As of December 31, 2017 and 2016, the Bank and UFLIC had purchased 6,968 thousand units and 93,605 thousand units, respectively, of beneficial certificates issued by USITC, which amounted to $119,691 thousand and $1,149,336 thousand, and gain of disposal of investment were $110,576 thousand and $4,343 thousand, respectively. Under the Banking Law, except for consumer and government loans, credits extended by the Bank to any related party should be fully secured, and the credit terms for related parties should be similar to those for unrelated parties. For transactions between the Bank and related parties, the terms are similar to those transacted with third parties, except for the preferential interest rates offered to Bank employees for savings and loans within prescribed amounts.
c. Compensation of directors, supervisors and management personnel:
For the Year Ended December 31 2017 2016 Short-term employment benefits
Salaries $ 43,095 $ 47,709 Transportation expenses 1,308 1,200 Other 27 33
44,430 48,942 Post-employment benefits 6,284 2,555 $ 50,714 $ 51,497 Compensation of directors and management personnel is determined by the remuneration committee on the basis of individual performance and market trends.
44. PLEDGED ASSETS
a. As of December 31, 2017 and 2016, government bonds and bank debentures, which amounted to
$286,705 thousand and $104,405 thousand (all amounts included in other financial assets), respectively, had been provided to the courts and the Bank of Taiwan as guarantee deposits on provisional seizures against the debtors’ properties, as reserve for credit card receivables, as guarantee deposits on bills finance operations, brokering life insurance, property and casualty insurance, and as trust reserve. In addition, as of December 31, 2017 and 2016, negotiable certificates of deposit, which amounted to $0 thousand and $3,800,000 thousand, respectively (all amounts included in other financial assets), had been provided to the Central Bank as collateral for day-term overdraft.

- 72 -
b. As of December 31, 2017 and 2016, the Bank pledged a time deposit of $300,000 thousand (part of other financial assets) to Mega International Commercial Bank and Mizuho Bank to be part of the latter’s online bank-to-bank payment system.
c. The following assets of the Company had been used as collaterals to apply for loans, issue commercial
papers and apply for provisional seizure of certain assets:
December 31 2017 2016 Other financial assets
Pledge assets $ 70,718 $ 690,392 Investment property $ 2,522,582 $ 1,974,113
d. As of December 31, 2017 and 2016, notes receivable (not expired) amounting to $658,908 thousand
and $1,035,993 thousand had been used as collaterals to apply for loans and issue commercial papers.
45. CONTINGENCIES AND COMMITMENTS a. As of December 31, 2017 and 2016, the Company’s commitments consisted of the following:
December 31 2017 2016 Irrevocable standby loan commitment $ 85,654,457 $ 109,697,387 Unused credit card commitment 257,495,390 238,271,865 Unused letters of credit 1,241,648 860,155 Other guarantees 13,804,083 10,270,804 Collections for customers 28,800,426 30,941,654 Travelers’ checks consigned-in 116,832 115,788 Guarantee notes payable 570,700 4,265,400 Trust assets 68,285,472 59,974,657 Marketable securities under custody 5,180,415 4,262,547
b. The Company as a lessee The Company rents several office premises for its branches under operating leases with terms ranging between 2 and 20 years. All operating lease contracts over 5 years contain clauses for market rental reviews for every five years. The Company does not have a bargain purchase option to acquire the leased premises at the expiration of the lease period. As of December 31, 2017 and 2016, refundable deposits paid under operating leases were $807,931 thousand and $805,681 thousand, respectively (included in other assets - refundable deposits). The Company’s future minimum lease payments for noncancellable operating lease commitments were as follows: December 31 2017 2016 Within 1 year $ 436,507 $ 444,548 Over 1 year up to 5 years 858,653 1,135,301 Over 5 years 352,242 386,690 $ 1,647,402 $ 1,966,539

- 73 -
c. The Company as lessor
The Company rents out properties under operating leases with terms ranging between 3 and 20 years. All operating lease contracts contain market review clauses so that the lessee has an option to renew. The lessee does not have a bargain purchase option to acquire the property at the expiration of the lease period. As of December 31, 2017 and 2016, refundable deposits paid under operating leases were $81,313 thousand and $94,357 thousand, respectively (included in other liabilities - guarantee deposits received). The Company’s future minimum lease payments for noncancellable operating lease commitments were as follows: December 31 2017 2016 Within 1 year $ 243,797 $ 179,260 Over 1 year and up to 5 years 341,561 385,250 Over 5 years 71,422 84,556 $ 656,780 $ 649,066 The duration of leasing cars (included in other assets) is about 1 to 3 years. Minimum future annual rentals are as follows: December 31 2017 2016 Within 1 year $ 1,839,177 $ 1,828,030 Over 1 year to 5 years 1,629,586 1,581,947 $ 3,468,763 $ 3,409,977
d. Computer equipment purchase contracts As of December 31, 2017 and 2016, the Company had contracts to buy computer equipment and software for $89,925 thousand and $409,463 thousand, respectively, of which $53,380 thousand and $256,408 thousand had been paid as of December 31, 2017 and 2016, respectively.
e. Union Securities Investment Trust The private equity funds managed by USITC, a subsidiary of the Bank, were mainly invested in the Fairfield Sentry Funds (F Funds) of the Madoff Investment Securities’s (Madoff Company) Fairfield Company (Fairfield). On January 10, 2011, the liquidator of the F Funds sued USITC, the private equity funds managed by USITC and the beneficiaries who bought USITC’s private equity funds to demand the return of the redemption proceeds of US$17,206 thousand received by USITC’s private equity funds from the F Funds. This case remained pending before the Bankruptcy Court for the Southern District of New York.

- 74 -
Madoff Company’s liquidation trustee claimed that F Funds’ redemption proceeds from Madoff Company constituted unjust enrichment and thus sued USITC and F Funds on March 23, 2012 to demand the return of the redemption proceeds of US$17,206 thousand received by USITC’s private equity funds from F Funds. This case remained pending before the Bankruptcy Court for the Southern District of New York. USITC received the notification sent by the Taiwan Taipei District Court on the lawsuit filed against USITC by Madoff Company’s liquidation trustee on January 17, 2013; thus, USITC appointed American lawyers to deal with the litigation. The US Bankruptcy Court opened a court session to hear how to apply the District Court’s insights on the extra-territorial effects and the plaintiff’s request for limited disclosure of evidence, and presented the revised complaint to the defendant who was affected by the “good faith opinion”. The United States attorney wrote a letter to report the progress of the case on April 25, 2016 and November 15, 2017. The US Bankruptcy Court rejected the plaintiff’s request mentioned above. On December 7, 2016, the Bankruptcy Court of the Southern District of New York rejected the claim of Madoff Company’s liquidation trustee. In order to streamline processes, USITC has instructed American lawyers to accept the rejection on January 20, 2017.The plaintiff, Madoff Company, has filed an appeal and got approval from the United States Court of Appeals for the Second Circuit. The plaintiff should submit the appellate brief on January 10, 2018. The defendant should submit the replication on April 11, 2018. The plaintiff should submit the answer on April 26, 2018. The private equity funds managed by USITC and mainly invested in the F Funds of Fairfield had become a loss for USITC. Thus, on June 26, 2013, USITC joined Fairfield Greenwich, Citco and PwC in a class action litigation on this investment loss. Regarding the class action suit against Fairfield Greenwich, United States District Court of the Southern District of New York approved the settlement of the two parties on December 19, 2014. The settlement fee was distributed among the settling parties in February 2015. Regarding the class action suit against Citco, the two parties had already come to a settlement on August 12, 2015; the court also approved the settlement of Citco on November 20, 2015. The settlement fee is going to be distributed among the settling parties. Regarding the class action suit against PwC, the court gave a preliminary verdict of settlement to the two parties and opened a court session on May 6, 2016, for a hearing on the fairness of the settlement and the granting of permission; there has been no further appeals since then. The settlement fee would be distributed to the settling parties after deducting the approved amount of counselor fees and disbursement fees. The private equity funds managed by USITC received the check of settlement fee from Rust Consulting Inc. on January 3, 2017 and redeemed for cash on February 6, 2017.
46. TRUST BUSINESS UNDER THE TRUST LAW
Balance Sheet of Trust Accounts
December 31, 2017
Trust Assets Amount Trust Liabilities and Capital Amount Bank deposits $ 3,506,155 Management fee payable $ 5 Investments Income tax payable 423
Mutual funds 39,371,966 Marketable securities payable 10,430,388 Common stock 616,218 Trust capital 57,741,842 Short-term bills and securities Reserve and deficit 112,814 purchased under resell
agreements 153,414
Accounts receivable 5,693 Stock in custody 10,430,388 Real estate - land and building 14,201,638 Total $ 68,285,472 Total $ 68,285,472

- 75 -
Note: The foreign currency amount of mutual funds was included in OBU on December 31, 2017.
Balance Sheet of Trust Accounts
December 31, 2016
Trust Assets Amount Trust Liabilities and Capital Amount Bank deposits $ 3,045,051 Management fee payable $ - Investments Income tax payable 25
Mutual funds 38,199,360 Marketable securities payable 7,189,491 Common stock 269,587 Trust capital 52,866,325 Short-term bills and securities Reserve and deficit (81,184) purchased under resell
agreements 132,635 Accounts receivable 1,825 Stock in custody 7,189,491 Real estate - land and building 11,136,708 Total $ 59,974,657 Total $ 59,974,657 Note: The foreign currency amount of mutual funds was included in OBU on December 31, 2016.
Income Statement of Trust Accounts
Year Ended December 31, 2017 Amount Trust income
Interest revenue - demand accounts $ 521 Interest revenue - time deposits 10,051 Interest revenue - short-term bills and securities purchased under resell agreements 211 Cash dividends - common stock 17,336 Service fee allowances - common stock 2 Income from beneficial certificates 532 Realized capital gain - fund 448 Unrealized capital gain - common stock 160,012 Unrealized capital gain - fund 1,243
Total trust income 190,356 Trust expense
Management expense 8,509 Supervisor fee 80 Taxation 64,060 Agency fees 2,669 Realized capital loss - fund 177 Unrealized capital loss - common stock 2,367 Unrealized capital loss - fund 833 Others 120
Total trust expense 78,815 Loss before tax 111,541 Income tax expense (2,255) Net income $ 109,286 Note: The above trust income statements were not included in the Bank’s income statements.

- 76 -
Income Statement of Trust Accounts Year Ended December 31, 2016
Amount Trust income
Interest revenue - demand accounts $ 593 Interest revenue - time deposits 9,206 Interest revenue - short-term bills and securities purchased under resell agreements 246 Cash dividends - common stock 13,599 Income from beneficial certificates 271 Realized capital gain - fund 149 Unrealized capital gain - common stock 10,403 Unrealized capital gain - fund 482
Total trust income 34,949 Trust expense
Management expense 7,590 Supervisor fee 160 Lawyer fee 100 Taxation 86,014 Agency fees 1,212 Realized capital loss - fund 406 Unrealized capital loss - common stock 6,031 Unrealized capital loss - fund 663 Others 383
Total trust expense 102,559 Loss before tax (67,610) Income tax expense (1,332) Net loss $ (68,942) Note: The above trust income statements were not included in the Bank’s income statements.
Trust Property and Equipment Accounts December 31, 2017
Investment Portfolio Amount Bank deposits $ 3,506,155 Investments
Mutual funds 39,371,966 Common stock 616,218 Short-term bills and securities purchased under resell agreements 153,414
Accounts receivable 5,693 Stock in custody 10,430,388 Real estate - land and buildings 14,201,638 $ 68,285,472 Note: The foreign currency amount of mutual funds was included in OBU on December 31, 2017.

- 77 -
Trust Property and Equipment Accounts December 31, 2016
Investment Portfolio Amount Bank deposits $ 3,045,051 Investments
Mutual funds 38,199,360 Common stock 269,587 Short-term bills and securities purchased under resell agreements 132,635
Accounts receivable 1,825 Stock in custody 7,189,491 Real estate - land and buildings 11,136,708 $ 59,974,657 Note: The foreign currency amount of mutual funds was included in OBU on December 31, 2016.
47. FINANCIAL INSTRUMENTS
a. Three-level fair value hierarchy The definitions of each level of the fair value hierarchy are shown below: 1) Level 1
Level 1 financial instruments are traded in an active market in which there are quoted prices for identical assets and liabilities. An active market has the following characteristics: a) All financial instruments in the market are homogeneous. b) There are willing buyers and sellers in the market all the time. c) The public can access the price information easily. The products in this level, such as listed stocks and beneficial securities, usually have high liquidity or are traded in futures market or exchanges.
2) Level 2
The products in this level have fair values that can be inferred from either directly or indirectly observable inputs other than quoted prices in an active market. Examples of these inputs are: a) Quoted prices from the similar products in an active market. This means the fair value can be
derived from the current trading prices of similar products, and whether they are similar products should be judged on the characteristics and trading rules. The fair price valuation in this circumstance may be adjusted due to time differences, trading rule’s differences, interested parties’ prices, and the correlation of price between itself and the similar goods;
b) Quoted prices for identical or similar financial instruments in inactive markets; c) For the marking-to-model method, the inputs to this model should be observable (such as
interest rates, yield curves and volatilities). The observable inputs mean that they can be obtained from the market and can reflect the expectation of market participants;

- 78 -
d) Inputs that are derived from observable market data through correlation or other means. The fair values of products categorized in this level are usually calculated using a valuation model generally accepted by the market. Examples are forward contracts, cross-currency swap, simple interest bearing bonds, convertible bonds and commercial paper.
3) Level 3
The fair values of the products in this level are typically based on management assumptions or expectations other than the direct market data. For example, historical volatility used in valuing options is an unobservable input because it cannot represent the entire market participants’ expectation on future volatility. The products in this level are complex derivate financial instruments or products with prices that are provided by brokers. Examples are complex foreign exchange options.
b. The fair value hierarchies of the Company’s financial instruments as of December 31, 2017 and 2016 were as follows:
(In Thousands of New Taiwan Dollars)
December 31, 2017 Total Level 1 Level 2 Level 3 Measured at fair value on a recurring basis Nonderivative financial instruments Assets
Financial assets at fair value through profit or loss (FVTPL) Held-for-trading financial assets
Stock $ 188,973 $ 188,973 $ - $ - Beneficial certificates 1,020,400 1,020,400 - - Commercial paper 10,389,618 - 10,389,618 -
Available-for-sale financial assets Stock 6,948,935 6,948,935 - - Debt instruments 27,503,754 - 27,503,754 - Beneficial certificates 1,036,944 1,036,944 - -
Derivative financial instruments Assets
Financial assets at FVTPL 537,334 - 489,081 48,253 Liabilities
Financial liabilities at FVTPL 183,384 - 135,125 48,259
December 31, 2016 Total Level 1 Level 2 Level 3 Measured at fair value on a recurring basis Nonderivative financial instruments Assets
Financial assets at fair value through profit or loss (FVTPL) Held-for-trading financial assets
Stock $ 192,085 $ 192,085 $ - $ - Debt instruments 151,223 - 151,223 -
(Continued)

- 79 -
December 31, 2016 Total Level 1 Level 2 Level 3
Beneficial certificates $ 128,425 $ 128,425 $ - $ - Commercial paper 8,300,747 - 8,300,747 -
Financial assets designated as at FVTPL on initial recognition Principal guaranteed notes 322,968 - 322,968 -
Available-for-sale financial assets Stock 5,796,662 5,796,662 Debt instruments 32,258,913 - 32,258,913 - Beneficial certificates 1,922,850 1,922,850 - -
Derivative financial instruments Assets
Financial assets at FVTPL 442,642 - 434,497 8,145 Liabilities
Financial liabilities at FVTPL 39,523 - 31,388 8,135
(Concluded) c. The financial instruments measured at fair value
Fair value is the price that would be received to sell an asset or paid to transfer a liability in an orderly transaction between willing market participants with full understanding of the sale or transfer transaction. The fair values of financial instruments at fair value, available-for-sale financial assets and hedging derivative financial instruments with quoted price in an active market are based on their market prices; financial instruments with no quoted prices in an active market are estimated by valuation methods. 1) Marking to market
This method should be used first to determine fair value. Following are the principles to follow in marking to market: a) Ensure the consistency and integrity of market data. b) The source of market data should be transparent and easy to access and can be referred to by
independent resources. c) Listed securities with tradable prices should be valued at closing prices. d) Evaluating unlisted securities that lack tradable closing prices should use quoted prices from
independent brokers.
2) Marking to model The use of marking to model is suggested if marking to market is infeasible. This valuation methodology is based upon model inputs that are used to derive the value of the trading positions. The Company uses the same estimations and assumptions as those used by market participants to determine the fair value. The Company uses the forward rates provided by Reuters to estimate the fair values of forward contracts, foreign exchange swap contracts, interest rate swap and cross-currency swap contacts and the discounted cash flow method to calculate the fair values of each contract. For foreign exchange option transactions, the Company uses the option pricing models which are generally used by other market participants (e.g., the Black-Scholes model) to calculate the fair value of the contracts.

- 80 -
For debt instruments with no active market, the Company estimates fair values based on prices quoted by counterparties and adjusted in accordance with the results of the evaluation of a debtor’s credit.
3) Transfer between Level 1 and Level 2
There was no material transfer between Level 1 and Level 2 for 2017 and 2016.
4) Reconciliation of Level 3 items of financial instruments
a) Reconciliation of Level 3 items of financial assets For the year ended December 31, 2017
(In Thousands of New Taiwan Dollars)
Items Beginning Balance
Valuation Gains (Losses) Amount of Increase Amount of Decrease Ending Balance
In Net Income
In Other Comprehen- sive Income
Purchase or Change in Fair Value
Transfer to Level 3
Sale or Change in Fair Value
Transfer from Level 3
Financial assets at fair value through profit or loss Derivative
financial assets $ 8,145 $ 26,551 $ - $ 45,673 $ - $ (32,116 ) $ - $ 48,253
For the year ended December 31, 2016
(In Thousands of New Taiwan Dollars)
Items Beginning Balance
Valuation Gains (Losses) Amount of Increase Amount of Decrease Ending Balance
In Net Income
In Other Comprehen- sive Income
Purchase or Change in Fair Value
Transfer to Level 3
Sale or Change in Fair Value
Transfer from Level 3
Financial assets at fair value through profit or loss Derivative
financial assets $ 24,194 $ (13,284 ) $ - $ 28,978 $ - $ (31,743 ) $ - $ 8,145
b) Reconciliation of Level 3 items of financial liabilities
For the year ended December 31, 2017
(In Thousands of New Taiwan Dollars)
Items Beginning Balance
Valuation Gains (Losses) Amount of Increase Amount of Decrease Ending Balance
In Net Income
In Other Comprehen- sive Income
Purchase or Change in Fair Value
Transfer to Level 3
Sale or Change in Fair Value
Transfer from Level 3
Financial liabilities at fair value through profit or loss Derivative
financial liabilities $ 8,135 $ 25,151 $ - $ 51,515 $ - $ (36,542 ) $ - $ 48,259
For the year ended December 31, 2016
(In Thousands of New Taiwan Dollars)
Items Beginning Balance
Valuation Gains (Losses) Amount of Increase Amount of Decrease Ending Balance
In Net Income
In Other Comprehen- sive Income
Purchase or Change in Fair Value
Transfer to Level 3
Sale or Change in Fair Value
Transfer from Level 3
Financial liabilities at fair value through profit or loss Derivative
financial liabilities $ 24,190 $ (12,039 ) $ - $ 32,520 $ - $ (36,536 ) $ - $ 8,135

- 81 -
5) The quantification information of Level 3
Item Product Fair Value Valuation Technique
Significant Unobservable
Inputs
Interval (Weighted-
average)
Relation Between Input and Fair Value
Derivative financial Instruments
Financial assets at
fair value through profit or loss
Foreign exchange options
$ 48,253 Option pricing model
Ratio AUD/USD 5.82%-7.66%
EUR/GBP 6.60%-6.85%
EUR/USD 6.34%-6.41%
GBP/AUD 6.78%-7.24%
NZD/USD 7.35%-8.12%
USD/JPY 7.29%
USD/TWD 4.4%-4.86%
USD/ZAR 14.48%-14.99%
The higher the ratio is, the higher fair value
Derivative financial instruments
Financial liabilities
at fair value through profit or loss
Foreign exchange options
48,259 Option pricing model
Ratio AUD/USD 5.82%-7.66%
EUR/GBP 6.60%-6.85%
EUR/USD 6.34%-6.41%
GBP/AUD 6.78%-7.24%
NZD/USD 7.35%-8.12%
USD/JPY 7.29%
USD/TWD 4.4%-4.86%
USD/ZAR 14.48%-14.99%
The higher the ratio is, the higher fair value
6) Sensitivity analysis of Level 3 fair value if reasonably possible alternative assumptions used
The Company’s Level 3 financial instruments are foreign exchange options. When engaging in foreign exchange option transactions, the Company makes a match for other banks and customers. Thus, the Company does not hold positions, and its source of profit and loss is from receiving and paying premiums. The sensitivity analysis has no effect on profit and loss since the Company does back-to-back transactions and the assets offset the liabilities.
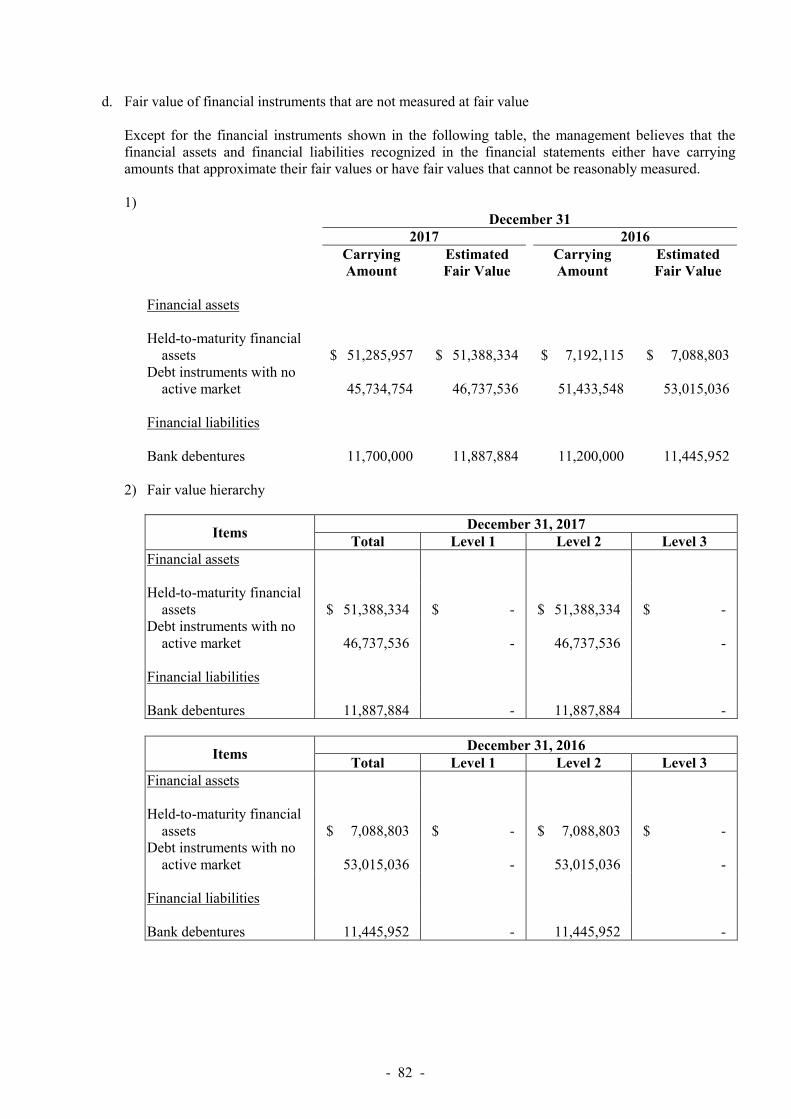
- 82 -
d. Fair value of financial instruments that are not measured at fair value
Except for the financial instruments shown in the following table, the management believes that the financial assets and financial liabilities recognized in the financial statements either have carrying amounts that approximate their fair values or have fair values that cannot be reasonably measured. 1)
December 31 2017 2016
Carrying Amount
Estimated Fair Value
Carrying Amount
Estimated Fair Value
Financial assets Held-to-maturity financial
assets $ 51,285,957 $ 51,388,334 $ 7,192,115 $ 7,088,803 Debt instruments with no
active market 45,734,754 46,737,536 51,433,548 53,015,036 Financial liabilities Bank debentures 11,700,000 11,887,884 11,200,000 11,445,952
2) Fair value hierarchy
Items December 31, 2017
Total Level 1 Level 2 Level 3 Financial assets Held-to-maturity financial
assets $ 51,388,334 $ - $ 51,388,334 $ - Debt instruments with no
active market 46,737,536 - 46,737,536 - Financial liabilities Bank debentures 11,887,884 - 11,887,884 -
Items December 31, 2016
Total Level 1 Level 2 Level 3 Financial assets Held-to-maturity financial
assets $ 7,088,803 $ - $ 7,088,803 $ - Debt instruments with no
active market 53,015,036 - 53,015,036 - Financial liabilities Bank debentures 11,445,952 - 11,445,952 -

- 83 -
48. FINANCIAL RISK MANAGEMENT
a. Overview To deal with any expected or unexpected business risk, the Company has established a comprehensive risk management system to allocate resources effectively and efficiently, strengthen business competitiveness, mitigate operational risk to a tolerable or acceptable level, and maintain the capital adequacy ratio to meet the minimum requirements of the authorities and the Basel Accord framework.
b. Risk management framework The board of directors, which occupies the highest level in the Company’s risk management framework, reviews risk management policies, the overall risk management framework and organization structure for carrying out responsibilities and exercising accountability. The Asset/Liability Management Committee inspects management reports or information provided by business units and the Risk Management Division. The Risk Management Division is an independent unit that is in charge of reviewing the risk management system designed by business units and the compliance with risk management requirements; this division also submits risk management reports to the authorities and develops a series of risk management tools to assess the risks identified. Business units establish risk control procedures, manage and monitor the implementation of those controls in operation units. Operation units perform daily risk management work and internal controls to ensure the accuracy and completeness of the risk management information generated.
c. Credit risk 1) Credit risk definitions and sources
Credit risk refers to the risk of losses caused by borrowers, debtors, or counterparties’ failure to fulfill their contractual obligations due to deteriorating financial position or other factors. It arises principally from transactions involving discounts, loans, credit cards, due from or call loans to banks, debt investments and derivatives etc., and also from off-balance sheet products such as guarantees, acceptance, letters of credit and commitments.
2) Strategy/objectives/policies and processes
a) Credit risk management strategy: The Company has established the “Credit Risk Management Standards of Union Bank of Taiwan” as the basis of planning, implementing, and managing credit risk management system.
b) Credit risk management objective: The objectives are to establish and implement an effective
credit risk management mechanism to mitigate credit risk, archive operational and management goals, and balance business development and risk control.
c) Credit risk management policy: The policies are meant to ensure that credit risk falls within an
acceptable range and that adequate capital is maintained to meet credit risk management objectives and create maximum risk-adjusted returns.
d) Credit risk management process: The Company carries out credit risk identification, credit risk
measurement, credit risk mitigation, credit risk monitoring and control and credit risk reporting process as part of its credit risk management mechanism.
- 84 -
3) Credit risk management framework a) The board of directors: The board of directors, the top risk supervisor of the Company,
reviews risk management policies, operational risk limits and the design and change of credit risk management framework.
b) Asset/Liability Management Committee: This committee inspects management reports or
information provided by business units and the Risk Management Division. c) Risk Management Division: The Risk Management Division is an independent unit that is in
charge of the work related to three pillars of Basel and reviews the risk management system designed by business units and the compliance with risk management requirements; the division also submits risk management reports to the authorities and develops risk management tools to assess the risk identified.
d) Business units: Business units are responsible for establishing risk management regulations
and risk control procedures and managing and monitoring the implementation of those controls in operation units.
e) Operation units: Under the risk management regulations and procedures set by business units,
operation units perform daily risk management work and internal controls and prepares reports on these tasks.
4) Credit risk measurement, control and reporting
a) The range of credit risk reporting:
i. Each business unit will regularly report the promotion of the business and the allocation of risk assets to the Assets/Liability Management Committee (ALMC).
ii. The Company’s risk management department regularly monitors the credit limit control
situations and reports to the ALMC the credit concentration and the status of each business’ achieving BIS (Bank for International Settlements) goals. The department also presents the volume of business NPL situation, credit concentration and the execution of credit risk control to the Board.
b) Measurement system:
The Company’s credit risk management adopts the use of the standardized approach to calculate capital charge and regularly submits related reports to the government. The risk management division and business units implement the Company’s management system and monitors the credit exposure of the business, industry, and countries as well as the concentration of credit and collateral to effectively measure and manage investment portfolio.
5) Mitigation of risks or hedging of credit risk The Company is exposed to loss on each credit risk faced by its business. Thus, depending on the nature of the business and the cost considerations, the Company will take appropriate remeasures to control risk. The Company’s information systems provide information that can be used in managing risk control procedures, and the risk management division reports to the board every six months the business risk management status.

- 85 -
6) Maximum exposure to credit risk
The maximum credit exposures of assets in the consolidated balance sheet are almost equivalent to their carrying values. These off-balance sheet maximum credit exposures (excluding collaterals and other credit enhancement instruments) are shown as follows:
Off-Balance Sheet Items The Maximum Credit Exposure December 31,
2017 December 31,
2016 Irrevocable standby loan commitment $ 2,199,776 $ 9,482,533 Unused letters of credit 1,241,648 860,155 Other guarantees 13,804,083 10,270,804 Unused credit card commitments 257,495,390 238,271,865
December 31, 2017 Collateral Netting
Arrangements Other Credit Enhancement Total
In-balance sheet items Discount and loans $ 248,662,563 $ - $ - $ 248,662,563
December 31, 2016 Collateral Netting
Arrangements Other Credit Enhancement Total
In-balance sheet items Discount and loans $ 226,779,935 $ - $ - $ 226,779,935
7) Concentrations of credit risk exposure
Concentrations of credit risk arise when a number of counterparties or exposure have comparable economic characteristics, or such counterparties are engaged in similar activities, or operate in the same geographical areas or industry sectors, so that their collective ability to meet contractual obligations is uniformly affected by changes in economic or other conditions. There can be credit risk concentrations in a bank’s assets, liabilities, or off-balance sheet items through the execution or processing of transactions (either product or service), or through a combination of exposures across these broad categories. These exposures can cover credits, loans and deposits, call loans to banks, investments, receivables and derivatives. To minimize its credit risk, the Company maintains a diversified portfolio; limits its exposure to any one geographic region, country or individual creditor; and closely monitors its exposures. The Company’s most significant concentrations of credit risk are summarized as follows: a) By industry
December 31, 2017 December 31, 2016 Amount % Amount %
Private enterprises $ 84,654,639 25.19 $ 71,596,120 24.05 Public enterprises 5,000,000 1.49 5,000,000 1.68 Government organizations 42,032,219 12.51 33,036,805 11.10 Nonprofit organizations 694,719 0.21 917,924 0.31 Private organizations 202,610,903 60.30 186,430,171 62.64 Foreign enterprises 1,024,743 0.30 663,332 0.22 Total 336,017,223 100.00 297,644,352 100.00

- 86 -
b) By geographical area The Company’s operations are mainly in Taiwan.
c) By collaterals
December 31, 2017 December 31, 2016 Amount % Amount %
Unsecured $ 80,394,252 23.92 $ 63,101,890 21.20 Secured
Financial instruments 8,134,418 2.42 7,229,286 2.43 Stocks 9,397,235 2.80 9,284,626 3.12 Properties 213,097,461 63.42 194,540,140 65.36 Movables 16,925,126 5.04 15,813,134 5.31 Guarantees 6,288,007 1.87 5,520,845 1.86 Others 1,780,724 0.53 2,154,431 0.72
Total 336,017,223 100.00 297,644,352 100.00

- 87 -
8) Credit quality and impairment assessment
Some financial assets - cash and cash equivalents, due from the Central Bank and call loans to other banks, financial assets at fair value through profit or loss, repos and debt securities, refundable deposits, guaranty bonds and clearing and settlement fund - are regarded as having very low credit risk because of the good credit ratings of counterparties. Other financial assets not regarded as having low credit risk are summarized as follows: a) Discounts, loans and receivables
December 31, 2017
Neither Past Due Nor Impaired Past Due But Not Impaired
(B)
Impaired Amount
(C)
Total (A)+(B)+(C)
Loss Recognized (D)
Net Total (A)+(B)+(C)-(D) Excellent Good Acceptable No Ratings Subtotal (A)
With Objective Evidence of Impairment
With No Objective
Evidence of Impairment
Receivables Credit card business $ 8,756,311 $ 4,596,438 $ 37,114 $ - $ 13,389,863 $ 190,760 $ 1,205,206 $ 14,785,829 $ 63,838 $ 27,863 $ 14,694,128 Acceptances receivable 123,578 63,396 - - 186,974 - - 186,974 - 1,000 185,974 Accounts receivable
factoring without recourse - 396,449 - - 396,449 - - 396,449 - 3,964 392,485
Others 2,307,849 119,158 27,004 4,087 2,458,098 3,081 109,288 2,570,467 90,711 923 2,478,833 Overdue guaranty deposits - - - - - - 25,105 25,105 - - 25,105 Discounts and loans
Consumer finance 82,148,042 59,308,582 23,229,244 3,282,059 167,967,927 563,963 205,953 168,737,843 71,261 1,708,041 166,958,541 Corporate banking 108,350,302 39,278,948 2,045,235 186,763 149,861,248 157,307 1,374,409 151,392,964 162,389 1,460,127 149,770,448
December 31, 2016
Neither Past Due Nor Impaired Past Due But Not Impaired
(B)
Impaired Amount
(C)
Total (A)+(B)+(C)
Loss Recognized (D)
Net Total (A)+(B)+(C)-(D) Excellent Good Acceptable No Ratings Subtotal (A)
With Objective Evidence of Impairment
With No Objective
Evidence of Impairment
Receivables Credit card business $ 8,705,928 $ 3,932,822 $ 40,380 $ - $ 12,679,130 $ 200,846 $ 1,287,067 $ 14,167,043 $ 62,126 $ 34,319 $ 14,070,598 Acceptances receivable 97,552 37,979 - - 135,531 - - 135,531 - 476 135,055 Accounts receivable
factoring without recourse - 799,844 - - 799,844 - - 799,844 - 3,504 796,340
Others 2,491,905 106,932 23,617 3,901 2,626,355 1,815 525,888 3,154,058 267,780 41 2,886,237 Overdue guaranty deposits - - - - - - 3,765 3,765 - - 3,765 Discounts and loans
Consumer finance 88,535,794 42,291,881 20,657,009 2,930,474 154,415,158 331,607 134,205 154,880,970 63,497 1,656,388 153,161,085 Corporate banking 74,787,465 53,177,163 806,354 219,925 128,990,907 17,379 1,724,988 130,733,274 227,124 1,250,285 129,255,865

- 88 -
b) Credit quality analysis of securities
December 31, 2017
Neither Past Due Nor Impaired Amount (Note) Past Due But Not
Impaired (B) Impaired Amount
(C) Total
(A)+(B)+(C)
Loss Recognized (D) Net Total
(A)+(B)+(C)-(D) Investment Grade Non-investment
Grade No Ratings Subtotal (A)
With Objective Evidence of Impairment
With Objective Evidence of Impairment
Available-for-sale financial assets Investments in bonds $ 25,760,437 $ 1,743,317 $ - $ 27,503,754 $ - $ - $ 27,503,754 $ - $ - $ 27,503,754 Investments in stocks 6,694,060 254,875 - 6,948,935 - - 6,948,935 - - 6,948,935 Others 119,691 - 917,253 1,036,944 - - 1,036,944 - - 1,036,944
Held-to-maturity financial assets Investments in bonds 8,985,957 - - 8,985,957 - - 8,985,957 - - 8,985,957 Others 42,300,000 - - 42,300,000 - - 42,300,000 - - 42,300,000
Other financial assets Investments in bonds 45,734,754 - - 45,734,754 - 258,245 45,992,999 - 258,245 45,734,754 Investments in stocks - - 603,994 603,994 - - 603,994 - - 603,994
December 31, 2016
Neither Past Due Nor Impaired Amount (Note) Past Due But Not
Impaired (B) Impaired Amount
(C) Total
(A)+(B)+(C)
Loss Recognized (D) Net Total
(A)+(B)+(C)-(D) Investment Grade Non-investment
Grade No Ratings Subtotal (A)
With Objective Evidence of Impairment
With Objective Evidence of Impairment
Available-for-sale financial assets Investments in bonds $ 30,717,571 $ 1,541,342 $ - $ 32,258,913 $ - $ - $ 32,258,913 $ - $ - $ 32,258,913 Investments in stocks 5,553,816 242,846 - 5,796,662 - - 5,796,662 - - 5,796,662 Others 631,315 - 1,291,535 1,922,850 - - 1,922,850 - - 1,922,850
Held-to-maturity financial assets Investments in bonds 7,192,115 - - 7,192,115 - - 7,192,115 - - 7,192,115
Other financial assets Investments in bonds 51,433,548 - - 51,433,548 - 279,278 51,712,826 - 279,278 51,433,548 Investments in stocks - - 600,059 600,059 - - 600,059 - - 600,509
Note: The definitions are as follows: 1. Investment Grade: Credit rating is BBB - or higher or 1-5 TCRI corporate rating of TEJ if it is a publicly traded company. 2. Non-investment Grade: Credit rating is BB + or higher or 6-9 TCRI corporate rating of TEJ if it is a publicly traded company. 3. No Ratings: No external ratings.
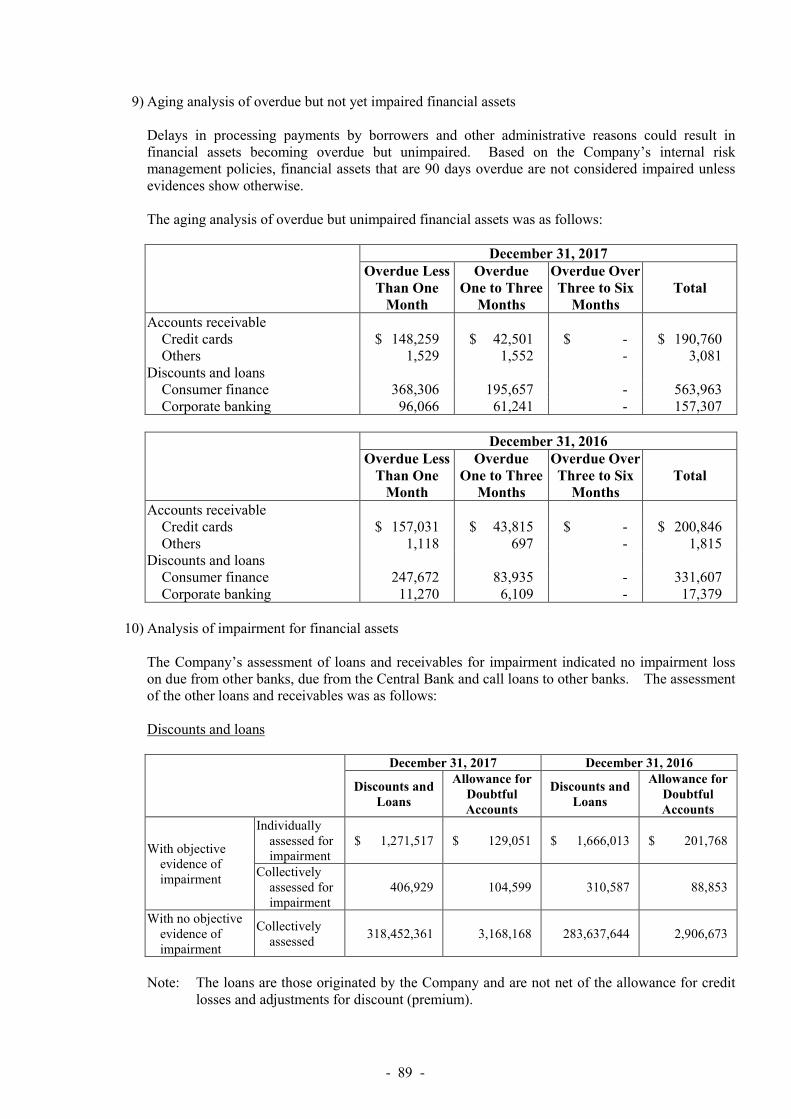
- 89 -
9) Aging analysis of overdue but not yet impaired financial assets Delays in processing payments by borrowers and other administrative reasons could result in financial assets becoming overdue but unimpaired. Based on the Company’s internal risk management policies, financial assets that are 90 days overdue are not considered impaired unless evidences show otherwise. The aging analysis of overdue but unimpaired financial assets was as follows:
December 31, 2017 Overdue Less
Than One Month
Overdue One to Three
Months
Overdue Over Three to Six
Months Total
Accounts receivable Credit cards $ 148,259 $ 42,501 $ - $ 190,760 Others 1,529 1,552 - 3,081
Discounts and loans Consumer finance 368,306 195,657 - 563,963 Corporate banking 96,066 61,241 - 157,307
December 31, 2016 Overdue Less
Than One Month
Overdue One to Three
Months
Overdue Over Three to Six
Months Total
Accounts receivable Credit cards $ 157,031 $ 43,815 $ - $ 200,846 Others 1,118 697 - 1,815
Discounts and loans Consumer finance 247,672 83,935 - 331,607 Corporate banking 11,270 6,109 - 17,379
10) Analysis of impairment for financial assets
The Company’s assessment of loans and receivables for impairment indicated no impairment loss on due from other banks, due from the Central Bank and call loans to other banks. The assessment of the other loans and receivables was as follows: Discounts and loans
December 31, 2017 December 31, 2016
Discounts and Loans
Allowance for Doubtful Accounts
Discounts and Loans
Allowance for Doubtful Accounts
With objective evidence of impairment
Individually assessed for impairment
$ 1,271,517 $ 129,051 $ 1,666,013 $ 201,768
Collectively assessed for impairment
406,929 104,599 310,587 88,853
With no objective evidence of impairment
Collectively assessed
318,452,361 3,168,168 283,637,644 2,906,673
Note: The loans are those originated by the Company and are not net of the allowance for credit
losses and adjustments for discount (premium).

- 90 -
Receivables
December 31, 2017 December 31, 2016
Receivables Allowance for
Doubtful Accounts
Receivables Allowance for
Doubtful Accounts
With objective evidence of impairment
Individually assessed for impairment
$ 127,247 $ 88,419 $ 543,382 $ 265,653
Collectively assessed for impairment
1,214,203 66,562 1,292,073 64,253
With no objective evidence of impairment
Collectively assessed
16,598,269 33,318 16,421,021 38,340
Note: The receivables are those originated by the Company and are not net of the allowance for
credit losses and adjustments for discount (premium).
11) Analysis of impairment for financial assets On the basis of the result of a credit evaluation, the Company may require collaterals before drawings are made on the credit facilities. For minimized credit risk, appropriate collaterals are required on the basis of the borrowers’ financials and debt service capabilities. All guarantees and appraisal procedures follow the authorities’ relevant regulations and the Company’s internal rules. The Company’s internal rules describe the acceptable types of collaterals, appraisal methods, appraisal process, and post-approval collateral management, which require the close monitoring of the value of collaterals to ensure repayment security. The main collateral types are summarized as follows: a) Real estate b) Other property c) Securities/stock d) Deposits/certificates of deposits e) Credit guarantee fund or government guarantee
d. Liquidity risk
1) Source and definition of liquidity risk
Liquidity risk means banks cannot provide sufficient funding for asset size growth and for meeting obligations on matured liabilities or have to make late payments to counterparties or raise emergency funding to cover funding gaps.
2) Liquidity risk management strategy and principles
a) The board of directors, the top risk supervisor of the Company, regularly reviews liquidity risk
management policies. The Asset/Liability Management Committee, the top liquidity risk executive of the Company, supervises the implementation of liquidity risk monitoring and control procedures and is responsible for taking any needed remedial measures.
b) In making internal transfer pricing, performance evaluation and new product development
decisions, the operation units take liquidity cost and product effectiveness and risks into consideration and align their decisions with the Company’s overall liquidity risk management policies.

- 91 -
c) The fund procurement department implements funding strategies in accordance with the conservatism principle to diversify the funding sources and negotiate reasonable repayment periods to ensure continuing participation in the lending market, and maintains a close relationship with fund providers to strengthen financing channels and ensure the stability and reliability of fund sources.
d) To strengthen liquidity risk management, the Company has regulations requiring the daily
execution of risk management procedures and the monitoring of implementation to maintain sufficient liquidity.
e) The risk management units report the Company’s liquidity position to the Asset/Liability
Management Committee monthly and report the Company’s liquidity risk management to the board of directors regularly.
3) The liquidity risk analysis of the cash inflow and outflow of assets and liabilities held for liquidity
risk refers to the amounts of the obligations for the remaining maturity periods, i.e., from the reporting date to the contract maturity dates. The maturity analysis of financial assets and financial liabilities: a) For maintaining solvency and meeting the needs of emergency assistance arrangements, the
Company holds cash and high-quality, liquid interest-bearing assets. The assets held for liquidity risk management include cash and cash equivalents, due from Central Bank and call loans to other banks, financial assets at fair value through profit or loss, discounts and loans, available-for-sale financial assets, held-to-maturity financial assets, and debt instruments with no active market, etc.
b) The Company disclosed the analysis of cash outflows from nonderivative financial liabilities by
the residual maturities as of the balance sheet dates. The amounts of cash outflows are based on contractual cash flows, so some amounts may not correspond to those that shown in the consolidated balance sheets. i. The maturity analysis of financial liabilities
December 31, 2017
Due in
One Month
Due Between after One Month
and Three Months
Due Between after Three
Months and Six Months
Due Between after Six Months
and One Year Due after One Year Total
Due to the Central Bank and call
loans to other banks $ 7,042,561 $ 391,618 $ 1,054,647 $ 15,000 $ 745,359 $ 9,249,185 Securities sold under agreements
to repurchase 29,401,925 865,759 6,292 - - 30,273,976 Accounts payables 5,248,396 1,094,083 559,327 186,882 20,136 7,108,824 Deposits and remittance 37,615,836 56,761,648 63,566,801 132,744,399 158,360,786 449,049,470 Bank debentures - - 2,000,000 - 9,700,000 11,700,000 Bonds payable - - - - 1,409,598 1,409,598 Other liabilities 4,305,564 77,876 172,006 285,133 1,813,783 6,654,362
December 31, 2016
Due in
One Month
Due Between after One Month
and Three Months
Due Between after Three
Months and Six Months
Due Between after Six Months
and One Year Due after One Year Total
Due to the Central Bank and call
loans to other banks $ 4,732,107 $ 1,678,665 $ 1,123,745 $ 28,300 $ 826,495 $ 8,389,312 Securities sold under agreements
to repurchase 28,239,364 589,823 44,950 - - 28,874,137 Accounts payables 5,294,808 926,272 573,736 164,487 22,161 6,981,464 Deposits and remittance 37,753,552 46,204,095 52,523,343 108,635,052 186,502,873 431,618,915 Bank debentures - - - - 11,200,000 11,200,000 Bonds payable - - - - 1,135,884 1,135,884 Other liabilities 2,781,545 1,553,994 148,216 304,287 1,807,705 6,595,747

- 92 -
ii. The maturity analysis of derivatives financial liabilities - forward exchange contracts and currency swap contracts
December 31, 2017
0-30 Days 31-90 Days 91-180 Days 181 Days-
1 Year Over 1 Year Total Derivative financial liabilities
to be settled at gross amounts Cash outflow $ 9,182,329 $ 14,086,845 $ 180,444 $ 76,408 $ - $ 23,526,026 Cash inflow 9,130,874 14,004,333 179,429 75,817 - 23,390,453
Subtotal 51,455 82,512 1,015 591 - 135,573 Derivative financial liabilities
to be settled at net amounts Forward exchange
contracts - - - - - - $ 51,455 $ 82,512 $ 1,015 $ 591 $ - $ 135,573
December 31, 2016
0-30 Days 31-90 Days 91-180 Days 181 Days-
1 Year Over 1 Year Total Derivative financial liabilities
to be settled at gross amounts Cash outflow $ 3,058,981 $ 662,483 $ 421,300 $ 176,211 $ - $ 4,318,975 Cash inflow 3,038,160 652,804 416,978 173,221 - 4,281,163
Subtotal 20,821 9,679 4,322 2,990 - 37,812 Derivative financial liabilities
to be settled at net amounts Forward exchange
contracts - - - - - - $ 20,821 $ 9,679 $ 4,322 $ 2,990 $ - $ 37,812
iii. The maturity analysis of derivatives financial liabilities-option contracts
December 31, 2017
0-30 Days 31-90 Days 91-180 Days 181 Days-
1 Year Over 1 Year Total Derivative financial liabilities
to be settled at net amounts $ 3,560 $ 7,482 $ 2,380 $ 2,480 $ - $ 15,902
December 31, 2016
0-30 Days 31-90 Days 91-180 Days 181 Days-
1 Year Over 1 Year Total Derivative financial liabilities
to be settled at net amounts $ (1,318 ) $ (3,018 ) $ (2,567 ) $ (3,924 ) $ - $ (10,827 )
e. Market risk
1) Source and definition of market risk Market risk is defined as an unfavorable change in market prices (such as interest rates, exchange rates, stock prices and commodity prices), which may cause financial instruments classified in the trading book to give rise to a potential loss on or off the balance sheet.
2) Market risk management strategy and processes The Bank implements the “Market Risk Management Standards of Union Bank of Taiwan”, which had been approved by the board of directors, as the basis of market risk management. The market risk management processes are risk identification, risk measurement, risk monitoring and control, risk reporting and risk mitigation.
- 93 -
a) Risk identification: For balance sheet and off-balance sheet items, the Company identifies and assesses market risk factors of products and the investment business and subjects them to risk management, monitoring and control procedures.
b) Risk measurement: In principle, each investment or transaction has at least one risk
measurement tool - such as sensitivity analysis, value at risk and stress testing, which can be applied to variables, such as fair market value and notional amounts, to quantify market risk.
c) Risk monitoring and control: Each operation unit observes the risk limit regulation stated in its
operating manual and regularly monitors risk control. The department of risk management is responsible for summarizing and reporting the Bank’s overall market risk monitoring.
d) Risk reporting: The risk management reports are classified as regular report, over-limit report
and exception report. Regular reports are the management statements sent to the appropriate level in accordance with certain requirements. Over-limit reports are about situations in which risk limits are exceeded. Exception reports contain operation units’ recommendations on how to meet temporary business needs.
e) Risk mitigation: An operation unit may take certain action to reduce risk, such as hedging,
investment combination adjustment, position adjustment, setting a break-even point, halting new transactions, etc.
3) Market risk management framework
a) The board of directors: The board of directors, the Company’s top market risk supervisor,
reviews risk management policies, operational risk limits and the design and change of the credit risk management framework.
b) Asset/Liability Management Committee: The Asset/Liability Management Committee
inspects management reports or information provided by business units and the Risk Management Division.
c) Risk Management Division: The Risk Management Division is an independent unit in charge
of the work related to three pillars of Basel and of the development of market risk management tools to assess and control the risk identified through setting risk limits.
d) Operation units: Operation units perform daily market risk management work and report the
market risk of investment positions and related information to the authorities.
4) Market risk measurement, control and reporting a) The market risk of the trading book financial instruments is measured in accordance with the
fair market value or evaluation model and the profit and loss situation is evaluated regularly. b) The business units and the risk management division prepares management reports periodically
and report to the appropriate level. c) The market risk management system combines the evaluation of the front and middle offices to
generate information that will assist management in risk monitoring. Moreover, the system supports the capital accrual method being used by the Bank through generating internal and external reports for management’s decision, making.

- 94 -
5) Market risk measurement of trading book The Company assesses the market risk exposure of the trading book in conformity with an assessment model using publicly quoted market prices or other measurement methods, including interest rate sensitivity analysis (DV01 value) and stress tests. The interest rate sensitivity analysis (DV01 value) refers to changes in market interest by 1 basis point (0.01%); the abnormal stress test system deals with market volatility and involves the regular estimation of possible losses (stress loss) and of the impact of stress test scenarios on major asset portfolios and the Company’s profit and loss.
6) Banking book market risk a) Interest rate risk
The loans and deposits and other interest rate-related items in the Bank’s balance sheet, including interest rate sensitive assets and interest rate sensitive liabilities, are measured from the viewpoint of earnings because there is a risk of decrease in earnings due to adverse changes in interest rates for loans and deposits. The earnings viewpoint mainly emphasizes the impact of interest rates on earnings, especially short-term earnings. For 2017 and 2016, assuming all market risk indicators, except interest rates, remained constant, an interest rate increase or decrease by 100bps would result in an increase or decrease in profit before tax by $393,900 thousand and $(98,890) thousand, respectively.
b) Exchange rate risk The exchange rate risk of the banking book refers to the business operation of the International Banking Department of the Bank’s Head Office and the operating funds in foreign currencies required by the ROC or local regulations; if there are adverse exchange rate changes, the income statement or cumulative translation adjustments in equity would be negatively affected. The International Banking Department (IBD) of the Bank’s Head Office is a going concern, and its operating funds are foreign currencies for business needs. However, the exchange rate risk on these funds is not significant because the percentage of the operating funds to the Company’s total assets is small, as shown by the immaterial ratio of the IBD’s cumulative translation adjustment to the Banks’s net worth.

- 95 -
7) Foreign currency rate risk information The information of significant foreign financial assets and liabilities is as follows:
Unit: Each Foreign Currency (Thousands)/NT$(Thousands)
December 31, 2017
Foreign
Currencies Exchange
Rate New Taiwan
Dollars Financial assets USD $ 2,811,480 29.848 $ 83,917,068 JPY 19,119,596 0.2650 5,065,966 GBP 1,409 40.2053 56,652 AUD 128,377 23.2635 2,986,498 HKD 276,796 3.8189 1,057,063 CAD 15,168 23.7795 360,685 CNY 706,005 4.5790 3,232,822 SGD 1,507 22.3246 33,654 ZAR 853,238 2.4191 2,064,030 CHF 1,687 30.5507 51,529 THB 331 0.9153 303 NZD 26,935 21.2010 571,041 EUR 32,026 35.6773 1,142,605 Financial liabilities USD 2,367,764 29.848 70,673,019 JPY 12,988,826 0.2650 3,441,545 GBP 5,479 40.2053 220,266 AUD 131,390 23.2635 3,056,585 HKD 251,512 3.8189 960,507 CAD 15,163 23.7795 360,568 CNY 719,522 4.5790 3,294,719 SGD 1,445 22.3246 32,255 ZAR 853,645 2.4191 2,065,015 CHF 1,650 30.5507 50,402 THB 89 0.9153 81 NZD 26,955 21.2010 571,476 EUR 46,206 35.6773 1,648,507

- 96 -
December 31, 2016
Foreign
Currencies Exchange
Rate New Taiwan
Dollars Financial assets USD $ 2,602,786 32.279 $ 84,015,342 JPY 19,737,491 0.2757 5,441,626 GBP 2,149 39.6192 85,123 AUD 117,932 23.3087 2,748,838 HKD 195,029 4.1622 811,757 CAD 15,701 23.9281 375,698 CNY 468,192 4.6219 2,163,913 SGD 2,547 22.3075 56,808 ZAR 740,320 2.6379 1,952,854 CHF 1,229 31.5533 38,774 THB 507 0.9011 456 NZD 23,878 22.4210 535,368 EUR 26,141 33.9091 886,431 Financial liabilities USD 2,179,910 32.279 70,365,333 JPY 14,405,613 0.2757 3,971,627 GBP 7,184 39.6192 284,610 AUD 117,806 23.3087 2,745,893 HKD 178,256 4.1622 741,944 CAD 15,758 23.9281 377,068 CNY 471,818 4.6219 2,180,670 SGD 2,611 22.3075 58,234 ZAR 739,785 2.6379 1,951,442 CHF 1,234 31.5533 38,941 NZD 23,918 22.4210 536,265 EUR 37,181 33.9091 1,206,766

- 97 -
f. Transfers of financial assets.
Most of the transferred financial assets of the Bank that are not derecognized in their entirety are securities sold under repurchase agreements. According to these transactions, the right on cash flow of the transferred financial assets would be transferred to other entities and the associated liabilities of the Bank’s obligation to repurchase the transferred financial assets at a fixed price in the future would be recognized. As the Bank is restricted to use, sell or pledge the transferred financial assets throughout the term of transaction, and is still exposed to interest rate risks and credit risks on these instruments, the transferred financial assets are not derecognized in their entirety. The details of financial assets that are not derecognized in their entirety and the associated financial liabilities are as following:
December 31, 2017
Category of Financial Assets
Carrying Amount of
Transferred Financial
Asset
Carrying Amount of Associated Financial Liability
Fair Value of Transferred
Financial Asset
Fair Value of Associated Financial Liability
Fair Value of Net Position
Financial instruments at fair value through profit or loss Securities sold under
repurchase agreements $ 8,552,033 $ 8,557,700 $ 8,552,033 $ 8,557,700 $ (5,667) Available-for-sale financial
assets Securities sold under
repurchase agreements 10,837,361 9,673,967 10,837,361 9,673,967 1,163,394 Debt instruments with no
active market Securities sold under
repurchase agreements 15,415,779 12,042,309 15,716,202 12,042,309 3,673,893
December 31, 2016
Category of Financial Assets
Carrying Amount of
Transferred Financial
Asset
Carrying Amount of Associated Financial Liability
Fair Value of Transferred
Financial Asset
Fair Value of Associated Financial Liability
Fair Value of Net Position
Financial instruments at fair value through profit or loss Securities sold under
repurchase agreements $ 7,054,785 $ 7,073,524 $ 7,054,785 $ 7,073,524 $ (18,739) Available-for-sale financial
assets Securities sold under
repurchase agreements 14,636,448 13,634,152 14,636,448 13,634,152 1,002,296 Debt instruments with no
active market Securities sold under
repurchase agreements 10,163,828 8,166,461 10,438,839 8,166,461 2,272,378
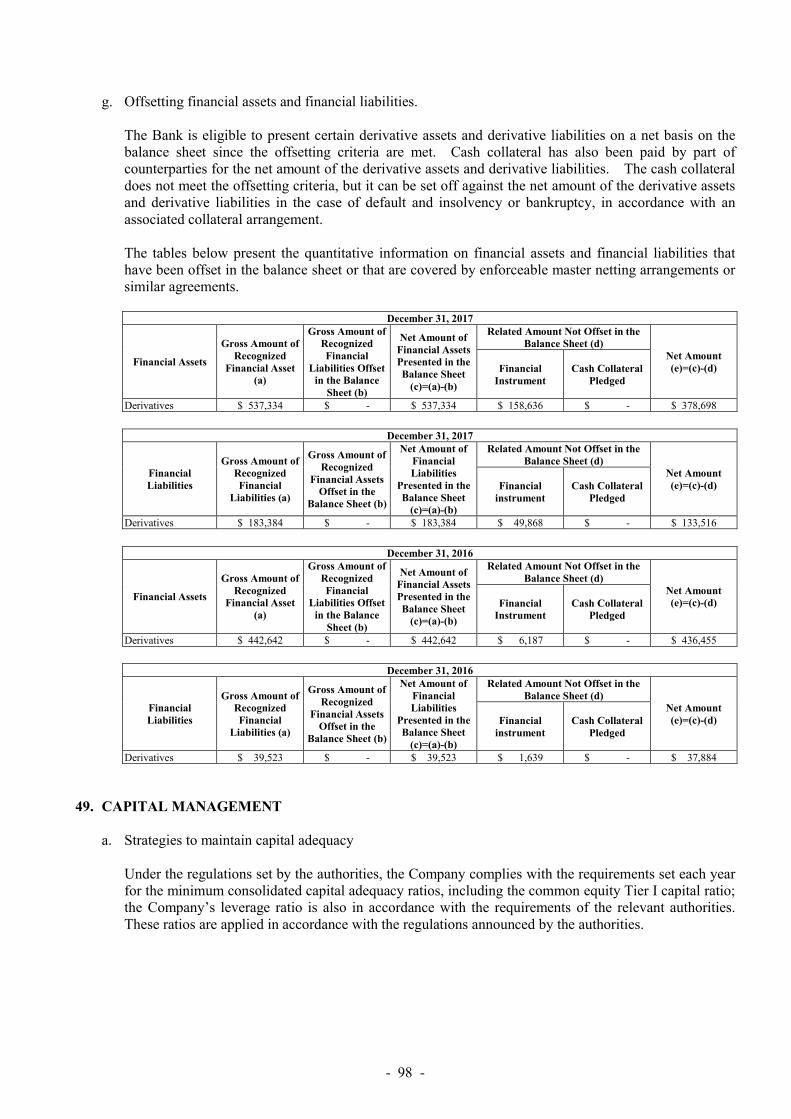
- 98 -
g. Offsetting financial assets and financial liabilities. The Bank is eligible to present certain derivative assets and derivative liabilities on a net basis on the balance sheet since the offsetting criteria are met. Cash collateral has also been paid by part of counterparties for the net amount of the derivative assets and derivative liabilities. The cash collateral does not meet the offsetting criteria, but it can be set off against the net amount of the derivative assets and derivative liabilities in the case of default and insolvency or bankruptcy, in accordance with an associated collateral arrangement. The tables below present the quantitative information on financial assets and financial liabilities that have been offset in the balance sheet or that are covered by enforceable master netting arrangements or similar agreements.
December 31, 2017
Financial Assets
Gross Amount of Recognized
Financial Asset (a)
Gross Amount of Recognized Financial
Liabilities Offset in the Balance
Sheet (b)
Net Amount of Financial Assets Presented in the Balance Sheet
(c)=(a)-(b)
Related Amount Not Offset in the Balance Sheet (d)
Net Amount (e)=(c)-(d) Financial
Instrument Cash Collateral
Pledged
Derivatives $ 537,334 $ - $ 537,334 $ 158,636 $ - $ 378,698
December 31, 2017
Financial Liabilities
Gross Amount of Recognized Financial
Liabilities (a)
Gross Amount of Recognized
Financial Assets Offset in the
Balance Sheet (b)
Net Amount of Financial Liabilities
Presented in the Balance Sheet
(c)=(a)-(b)
Related Amount Not Offset in the Balance Sheet (d)
Net Amount (e)=(c)-(d) Financial
instrument Cash Collateral
Pledged
Derivatives $ 183,384 $ - $ 183,384 $ 49,868 $ - $ 133,516
December 31, 2016
Financial Assets
Gross Amount of Recognized
Financial Asset (a)
Gross Amount of Recognized Financial
Liabilities Offset in the Balance
Sheet (b)
Net Amount of Financial Assets Presented in the Balance Sheet
(c)=(a)-(b)
Related Amount Not Offset in the Balance Sheet (d)
Net Amount (e)=(c)-(d) Financial
Instrument Cash Collateral
Pledged
Derivatives $ 442,642 $ - $ 442,642 $ 6,187 $ - $ 436,455
December 31, 2016
Financial Liabilities
Gross Amount of Recognized Financial
Liabilities (a)
Gross Amount of Recognized
Financial Assets Offset in the
Balance Sheet (b)
Net Amount of Financial Liabilities
Presented in the Balance Sheet
(c)=(a)-(b)
Related Amount Not Offset in the Balance Sheet (d)
Net Amount (e)=(c)-(d) Financial
instrument Cash Collateral
Pledged
Derivatives $ 39,523 $ - $ 39,523 $ 1,639 $ - $ 37,884
49. CAPITAL MANAGEMENT
a. Strategies to maintain capital adequacy Under the regulations set by the authorities, the Company complies with the requirements set each year for the minimum consolidated capital adequacy ratios, including the common equity Tier I capital ratio; the Company’s leverage ratio is also in accordance with the requirements of the relevant authorities. These ratios are applied in accordance with the regulations announced by the authorities.

- 99 -
b. Capital assessment program The capital ratios and leverage ratios are applied, analyzed, monitored and reported regularly, and are assigned to each business unit as the target capital adequacy ratios. The business units’ compliance with the ratio requirements is tracked regularly, and remedial action is taken if the capital and leverage ratio requirements are not met.
c. Capital adequacy
(Unit: In Thousands of New Taiwan Dollars, %)
Year
Items (Note 2)
December 31, 2017
Own Capital Adequacy Ratio
Consolidated Capital
Adequacy Ratio
Eligible capital
Common equity Tier 1 Ratio $ 31,867,478 $ 31,226,900 Other Tier 1 capital 12,146,864 12,878,925 Tier 2 capital 5,726,391 8,534,948 Eligible capital 49,740,733 52,640,773
Risk-weighted assets
Credit risk Standard 262,318,162 271,978,233 Internal rating-based approach - - Asset securitization 11,794,762 11,794,762
Operational risk
Basic indicator approach 17,986,588 20,976,363 Standard/alternative standardized
approach - -
Advanced measurement approach - -
Market risk Standard 24,757,659 25,883,018 Internal model approach - -
Total risk-weighted assets 316,857,171 330,632,376 Capital adequacy rate 15.70% 15.92% Ratio of common stockholders’ equity to risk-weighted assets 10.06% 9.44% Ratio of Tier 1 capital to risk-weighted assets 13.89% 13.34% Leverage ratio 7.30% 7.21%

- 100 -
Year
Items (Note 2)
December 31, 2016
Own Capital Adequacy Ratio
Consolidated Capital
Adequacy Ratio
Eligible capital
Common equity Tier 1 Ratio $ 30,419,225 $ 29,751,735 Other Tier 1 capital 1,664,565 2,378,925 Tier 2 capital 6,851,336 9,629,432 Eligible capital 38,935,126 41,760,092
Risk-weighted assets
Credit risk Standard 248,206,553 258,443,901 Internal rating-based approach - - Asset securitization 919,153 919,153
Operational risk
Basic indicator approach 17,384,500 19,969,925 Standard/alternative standardized
approach - -
Advanced measurement approach - -
Market risk Standard 22,483,575 23,893,763 Internal model approach - -
Total risk-weighted assets 288,993,781 303,226,742 Capital adequacy rate 13.47% 13.77% Ratio of common stockholders’ equity to risk-weighted assets 10.53% 9.81% Ratio of Tier 1 capital to risk-weighted assets 11.10% 10.60% Leverage ratio 5.68% 5.57% Note 1: Eligible capital and risk-weighted assets are calculated under the “Regulations Governing the
Capital Adequacy Ratio of Banks” and the “Explanation of Methods for Calculating the Eligible Capital and Risk-weighted Assets of Banks.”
Note 2: Formulas used were as follows:
1) Eligible capital = Common equity Tier 1 capital + Other Tier 1 capital + Tier 2 capital. 2) Risk-weighted assets = Risk-weighted asset for credit risk + Capital requirements for
operational risk and market risk x 12.5. 3) Capital adequacy ratio = Eligible capital ÷ Risk-weighted assets. 4) Ratio of Common equity Tier 1 capital to risk-weighted assets = Common equity Tier 1
capital ÷ Risk-weighted assets. 5) Ratio of Tier 1 capital to risk-weighted assets = (Common equity Tier 1 capital + Other
Tier 1 capital) ÷ Risk-weighted assets. 6) Leverage ratio = Tier 1 capital ÷ Exposure Measurement
The Banking Law and related regulations require that the Bank maintain its unconsolidated and consolidated CARs at a minimum of 8.625%, the Tier 1 Capital Ratio at a minimum of 6.625% and the Common Equity Tier 1 Ratio at a minimum of 5.125%. In addition, if the Bank’s CAR falls below the minimum requirement, the authorities may impose certain restrictions on the amount of cash dividends that the Bank can declare or, in certain conditions, totally prohibit the Bank from declaring cash dividends.

- 101 -
50. ASSET QUALITY, CONCENTRATION OF CREDIT EXTENSIONS, INTEREST RATE SENSITIVITY, PROFITABILITY AND MATURITY ANALYSIS OF ASSETS AND LIABILITIES Union Bank of Taiwan a. Credit risk
1) Asset quality
See Table 5. 2) Concentration of credit extensions
(In Thousands of New Taiwan Dollars, %)
December 31, 2017
Rank (Note 1)
Company Name Credit
Extension Balance
% to Net Asset Value
1 Group U - real estate development $ 1,895,359 3.96 2 Company B - other financial intermediation 1,583,550 3.30 3 Company V - other telecommunications market 1,476,000 3.08 4 Group D - real estate development 1,172,543 2.45 5 Group H - retail of other food and beverages 1,115,000 2.33 6 Company T - real estate development 996,449 2.08 7 Company O - financial intermediation 930,000 1.94 8 Company T - real estate development 892,442 1.86 9 Group F - manufacture of chemical material 805,896 1.68 10 Company P - renting and leasing of other transport
equipment 768,580 1.60
(In Thousands of New Taiwan Dollars, %)
December 31, 2016
Rank (Note 1)
Company Name Credit
Extension Balance
% to Net Asset Value
1 Group U - real estate development $ 1,728,080 4.81 2 Company B - other financial intermediation 1,623,773 4.52 3 Company V - other telecommunications market 1,499,844 4.17 4 Group D - real estate development 1,495,115 4.16 5 Group H - retail of other food and beverages 1,248,800 3.47 6 Company T - real estate development 891,380 2.48 7 Company O - financial intermediation 865,000 2.41 8 Company T - real estate development 708,000 1.97 9 Group F - manufacture of chemical material 630,185 1.75 10 Company P - renting and leasing of other transport
equipment 618,000 1.72

- 102 -
b. Market risk
Interest Rate Sensitivity December 31, 2017
(In Thousands of New Taiwan Dollars, %)
Items 1 to 90 Days 91 to 180 Days 181 Days to One Year
Over One Year Total
Interest rate-sensitive assets $ 376,966,538 $ 9,601,587 $ 11,136,138 $ 38,825,399 $ 436,529,662 Interest rate-sensitive liabilities 197,693,904 153,613,569 58,382,557 19,977,717 429,667,747 Interest rate-sensitive gap 179,272,634 (144,011,982) (47,246,419) 18,847,682 6,861,915 Net worth 47,621,711 Ratio of interest rate-sensitive assets to liabilities 101.60% Ratio of interest rate sensitivity gap to net worth 14.41%
December 31, 2016
(In Thousands of New Taiwan Dollars, %)
Items 1 to 90 Days 91 to 180 Days 181 Days to One Year
Over One Year Total
Interest rate-sensitive assets $ 303,648,998 $ 13,621,567 $ 16,719,210 $ 65,246,623 $ 399,236,398 Interest rate-sensitive liabilities 163,766,946 148,972,674 66,453,129 20,884,794 400,077,543 Interest rate-sensitive gap 139,882,052 (135,351,107) (49,733,919) 44,361,829 (841,145) Net worth 36,171,130 Ratio of interest rate-sensitive assets to liabilities 99.79% Ratio of interest rate sensitivity gap to net worth (2.33%)
Note 1: The above amounts included only New Taiwan dollar amounts held by the Bank’s Head
Office and branches (i.e., excluding foreign currency). Note 2: Interest rate-sensitive assets and liabilities mean the revenues or costs of interest-earning
assets and interest-bearing liabilities are affected by interest rate changes. Note 3: Interest rate sensitivity gap = Interest rate-sensitive assets - Interest rate-sensitive liabilities. Note 4: Ratio of interest rate-sensitive assets to liabilities = Interest rate-sensitive assets ÷ Interest
rate-sensitive liabilities (in New Taiwan dollars).
Interest Rate Sensitivity December 31, 2017
(In Thousands of U.S. Dollars, %)
Items 1 to 90 Days 91 to 180 Days 181 Days to One Year
Over One Year Total
Interest rate-sensitive assets $ 727,760 $ 144,129 $ 512,407 $ 1,667,860 $ 3,052,156 Interest rate-sensitive liabilities 1,226,308 300,065 475,541 352,259 2,354,173 Interest rate-sensitive gap (498,548) (155,936) 36,866 1,315,601 697,983 Net worth 49,704 Ratio of interest rate-sensitive assets to liabilities 129.65% Ratio of interest rate sensitivity gap to net worth 1,404.28%

- 103 -
December 31, 2016
(In Thousands of U.S. Dollars, %)
Items 1 to 90 Days 91 to 180 Days 181 Days to One Year
Over One Year Total
Interest rate-sensitive assets $ 89,734 $ 53,035 $ 118,086 $ 2,290,955 $ 2,551,810 Interest rate-sensitive liabilities 978,992 248,275 376,550 337,223 1,941,040 Interest rate-sensitive gap (889,258) (195,240) (258,464) 1,953,732 610,770 Net worth 33,054 Ratio of interest rate-sensitive assets to liabilities 131.47% Ratio of interest rate sensitivity gap to net worth 1,847.79%
Note 1: The above amounts included only U.S. dollar amounts held by the Bank’s Head Office,
domestic branches, OBU and overseas branches and excluded contingent assets and contingent liabilities.
Note 2: Interest rate-sensitive assets and liabilities mean the revenues or costs of interest-earning
assets and interest-bearing liabilities are affected by interest rate changes. Note 3: Interest rate sensitivity gap = Interest rate-sensitive assets - Interest rate-sensitive liabilities. Note 4: Ratio of interest rate-sensitive assets to liabilities = Interest rate-sensitive assets ÷ Interest
rate-sensitive liabilities (in U.S. dollars)
c. Liquidity risk
1) Profitability
(%)
Items Year Ended
December 31, 2017
Year Ended December 31,
2016
Return on total assets Before income tax 0.62 0.64 After income tax 0.50 0.51
Return on equity Before income tax 8.02 9.28 After income tax 6.55 7.46
Net income ratio 22.18 22.16 Note 1: Return on total assets = Income before (after) income tax ÷ Average total assets Note 2: Return on equity = Income before (after) income tax ÷ Average equity Note 3: Net income ratio = Income after income tax ÷ Total net revenues Note 4: Income before (after) income tax represents income for the years ended December 31,
2017 and 2016.

- 104 -
2) Maturity analysis of assets and liabilities
Maturity Analysis of Assets and Liabilities December 31, 2017
(In Thousands of New Taiwan Dollars)
Total Remaining Period to Maturity
1-30 Days 31-90 Days 91-180 Days 181 Days-
1 Year Over 1 Year
Main capital inflow on maturity $ 480,358,390 $ 115,895,675 $ 33,432,390 $ 46,879,896 $ 86,634,132 $ 197,516,297
Main capital outflow on maturity 560,344,544 64,889,855 69,540,305 73,713,185 149,777,827 202,423,372
Gap (79,986,154 ) 51,005,820 (36,107,915 ) (26,833,289 ) (63,143,695 ) (4,907,075 )
December 31, 2016
(In Thousands of New Taiwan Dollars)
Total Remaining Period to Maturity
1-30 Days 31-90 Days 91-180 Days 181 Days-
1 Year Over 1 Year
Main capital inflow on maturity $ 437,112,956 $ 111,586,563 $ 28,350,870 $ 38,197,116 $ 74,328,205 $ 184,650,202
Main capital outflow on maturity 529,154,086 55,838,927 52,344,727 62,887,509 137,719,453 220,363,470
Gap (92,041,130 ) 55,747,636 (23,993,857 ) (24,690,393 ) (63,391,248 ) (35,713,268 )
Note: The above amounts are book value held by the onshore branches and offshore banking unit of the Bank in U.S. dollars, without off-balance sheet amounts (for example, the issuance of negotiable certificate of deposits, bonds or stocks).
Maturity Analysis of Assets and Liabilities
December 31, 2017
(In Thousands of U.S. Dollars)
Total Remaining Period to Maturity
1-30 Days 31-90 Days 91-180 Days 181 Days-
1 Year Over 1 Year
Main capital inflow on maturity $ 3,323,479 $ 483,526 $ 466,456 $ 168,450 $ 512,438 $ 1,692,609
Main capital outflow on maturity 2,929,180 1,135,576 510,754 343,293 532,066 407,491
Gap 394,299 (652,050) (44,298) (174,843) (19,628) 1,285,118
December 31, 2016
(In Thousands of U.S. Dollars)
Total Remaining Period to Maturity
1-30 Days 31-90 Days 91-180 Days 181 Days-
1 Year Over 1 Year
Main capital inflow on maturity $ 2,734,149 $ 126,023 $ 91,909 $ 59,878 $ 115,787 $ 2,340,552
Main capital outflow on maturity 2,346,293 1,059,256 245,393 269,163 401,994 370,487
Gap 387,856 (933,233) (153,484) (209,285) (286,207) 1,970,065
Note: The above amounts are book value of the assets and liabilities held by the onshore branches
and offshore banking unit of the Bank in U.S. dollars, without off-balance amounts (for example, the issuance of negotiable certificate of deposits, bonds or stocks).

- 105 -
51. ADDITIONAL DISCLOSURES Following are the additional disclosures required by the Securities and Futures Bureau for the Bank and its investees: a. Related information of significant transactions and investees and (b) proportionate share in investees:
1) Financing provided: The Company - not applicable; investee - Table 1 (attached) 2) Endorsement/guarantee provided: None 3) Marketable securities held: The Company - not applicable; investee - Table 2 (attached) 4) Marketable securities acquired and disposed of at costs or prices of at least $300 million or 10% of
the paid-in capital: None 5) Acquisition of individual real estate at costs of at least $300 million or 10% of the paid-in capital:
Table 3 (attached) 6) Disposal of individual real estate at costs of at least $300 million or 10% of the paid-in capital:
None 7) Allowance of service fees to related parties amounting to at least $5 million: None 8) Receivables from related parties amounting to at least $300 million or 10% of the paid-in capital:
Table 4 (attached) 9) Sale of nonperforming loans: None 10) Asset securitization under the “Regulations for Financial Asset Securitization”: None 11) Other significant transactions which may affect the decisions of users of financial reports: Table 5
(attached) 12) Names, locations and other information of investees on which the Bank exercises significant
influence: Table 6 (attached) 13) Derivative transactions: Note 8
b. Investment in Mainland China: None
c. Intercompany relationships and significant intercompany transactions.
The detailed information of intercompany relationships and significant intercompany transactions are referred to Table 7 (attached).
52. OPERATING SEGMENTS
The information reported to the Company’s chief operating decision makers for the assessment of segment performance focuses mainly on operation and profitability. The Company’s reportable segments are as follows: a. Corporate banking unit: Corporate banking, foreign exchange business, debt management and public
treasury business, etc.

- 106 -
b. Consumer banking unit: Consumer banking, financial management and loan business, credit card business and car-loan business, etc.
c. Wealth management and trust unit: Wealth management and trust business, etc. d. Investing unit: Investing business in the financial market, etc. e. Leasing unit: Leasing of vehicles, buildings, etc. The analysis of the Bank’s operating revenue and results by reportable segment was as follows: For the Year Ended December 31, 2017
Corporate Banking
Consumer Banking
Wealth Management Investing Leasing Others Total
Net interest (Note) $ 1,175,116 $ 2,644,847 $ (218 ) $ 1,424,301 $ (94,859 ) $ 1,553,813 $ 6,703,000 Net commissions and fees
revenues 118,891 882,967 942,673 122,926 (666 ) 231,226 2,298,017 Net revenues other than
interest 120,443 (1,024 ) 4,682 664,553 2,338,384 343,310 3,470,348 Total net revenues 1,414,450 3,526,790 947,137 2,211,780 2,242,859 2,128,349 12,471,365 Provisions (reversal) (43,264 ) 105,598 - 220,737 - 73,790 356,861 Operating expenses 697,608 2,500,534 543,350 192,373 2,042,365 2,751,703 8,727,933 Income before income tax $ 760,106 $ 920,658 $ 403,787 $ 1,798,670 $ 200,494 ($ 697,144 ) $ 3,386,571
For the Year Ended December 31, 2016
Corporate Banking
Consumer Banking
Wealth Management Investing Leasing Others Total
Net interest (Note) $ 1,169,036 $ 2,508,959 $ (286 ) $ 1,452,931 $ (98,413 ) $ 1,436,041 $ 6,468,268 Net commissions and fees
revenues 107,952 636,668 1,094,059 160,161 (1,015 ) 425,664 2,423,489 Net revenues other than
interest 531,466 (6,102 ) 3,553 416,710 2,251,983 (77,707 ) 3,119,903 Total net revenues 1,808,454 3,139,525 1,097,326 2,029,802 2,152,555 1,783,998 12,011,660 Provisions (reversal) (18,109 ) (12,182 ) - (32,240 ) - 234,073 171,542 Operating expenses 771,806 2,331,776 544,057 198,413 1,950,717 2,732,562 8,529,331 Income before income tax $ 1,054,757 $ 819,931 $ 553,269 $ 1,863,629 $ 201,838 ($ 1,182,637 ) $ 3,310,787
Note: Include interest revenue of financial assets at fair value through profit or loss.
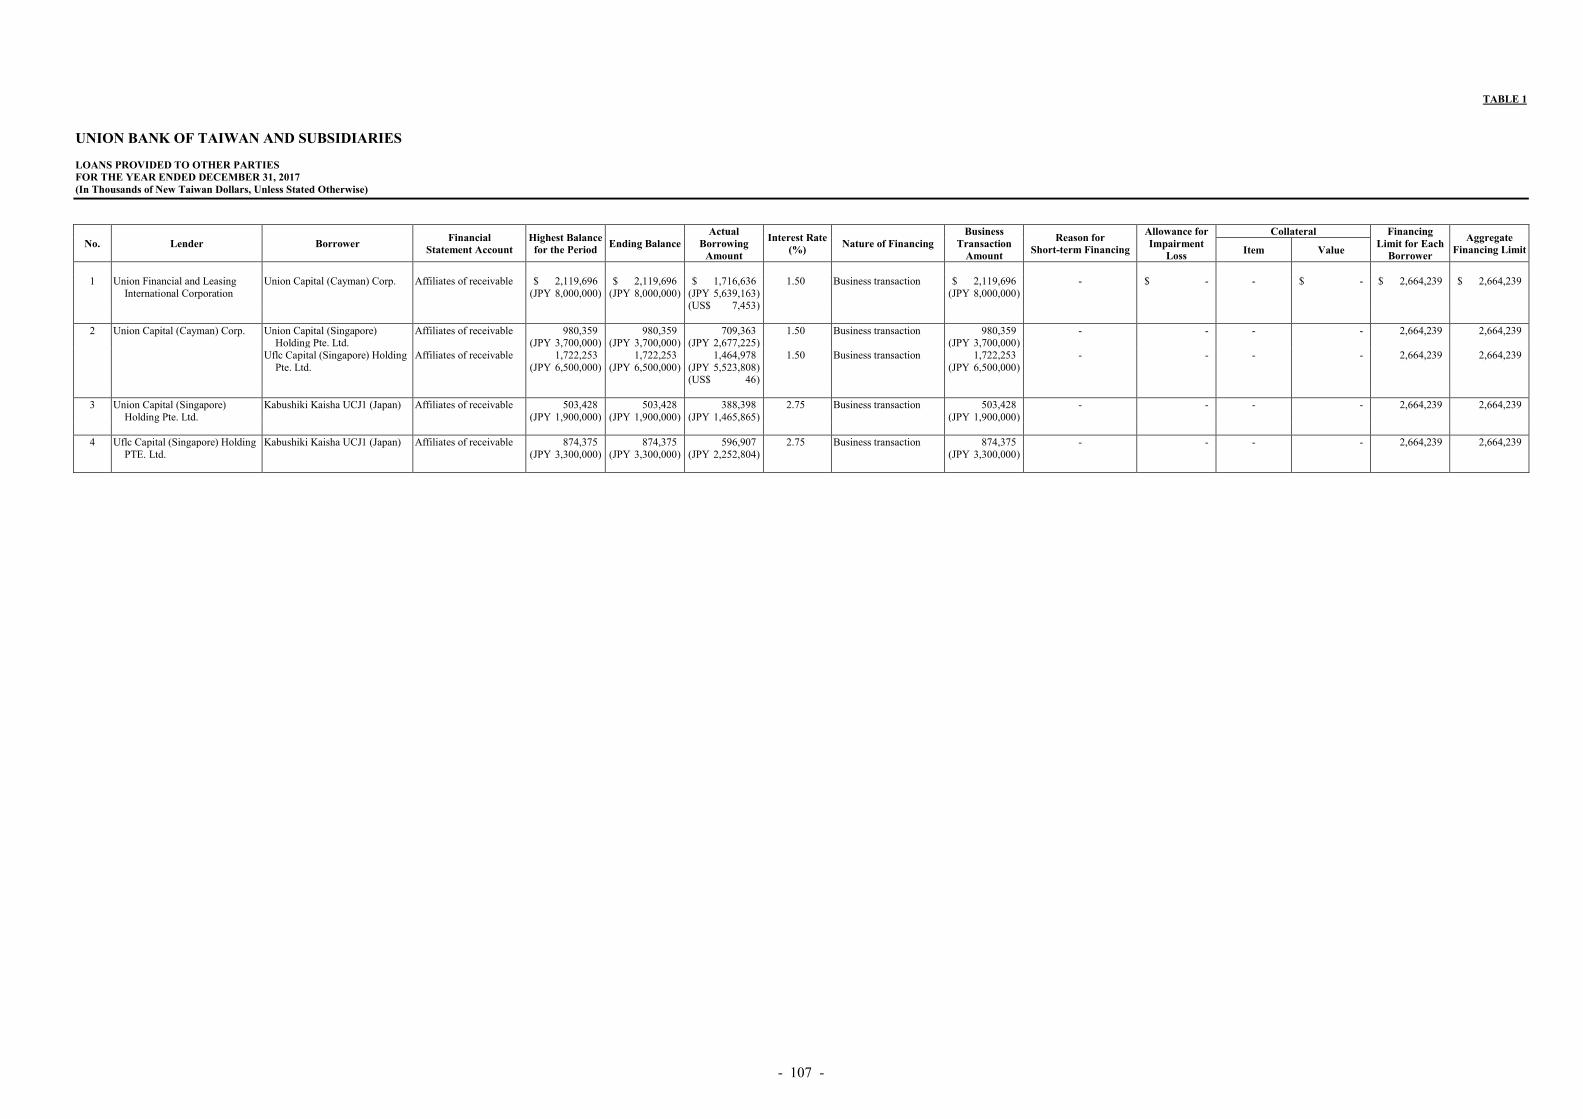
- 107 -
TABLE 1
UNION BANK OF TAIWAN AND SUBSIDIARIES LOANS PROVIDED TO OTHER PARTIES FOR THE YEAR ENDED DECEMBER 31, 2017 (In Thousands of New Taiwan Dollars, Unless Stated Otherwise)
No. Lender Borrower Financial
Statement Account Highest Balance for the Period
Ending Balance Actual
Borrowing Amount
Interest Rate (%)
Nature of Financing Business
Transaction Amount
Reason for Short-term Financing
Allowance for Impairment
Loss
Collateral Financing Limit for Each
Borrower
Aggregate Financing Limit Item Value
1 Union Financial and Leasing
International Corporation Union Capital (Cayman) Corp. Affiliates of receivable $ 2,119,696
(JPY 8,000,000 ) $ 2,119,696 (JPY 8,000,000 )
$ 1,716,636 (JPY 5,639,163 ) (US$ 7,453 )
1.50 Business transaction $ 2,119,696 (JPY 8,000,000 )
- $ - - $ - $ 2,664,239 $ 2,664,239
2 Union Capital (Cayman) Corp. Union Capital (Singapore)
Holding Pte. Ltd. Affiliates of receivable 980,359
(JPY 3,700,000 ) 980,359 (JPY 3,700,000 )
709,363 (JPY 2,677,225 )
1.50 Business transaction 980,359 (JPY 3,700,000 )
- - - - 2,664,239 2,664,239
Uflc Capital (Singapore) Holding Pte. Ltd.
Affiliates of receivable 1,722,253 (JPY 6,500,000 )
1,722,253 (JPY 6,500,000 )
1,464,978 (JPY 5,523,808 ) (US$ 46 )
1.50 Business transaction 1,722,253 (JPY 6,500,000 )
- - - - 2,664,239 2,664,239
3 Union Capital (Singapore)
Holding Pte. Ltd. Kabushiki Kaisha UCJ1 (Japan) Affiliates of receivable 503,428
(JPY 1,900,000 ) 503,428 (JPY 1,900,000 )
388,398 (JPY 1,465,865 )
2.75 Business transaction 503,428 (JPY 1,900,000 )
- - - - 2,664,239 2,664,239
4 Uflc Capital (Singapore) Holding
PTE. Ltd. Kabushiki Kaisha UCJ1 (Japan) Affiliates of receivable 874,375
(JPY 3,300,000 ) 874,375 (JPY 3,300,000 )
596,907 (JPY 2,252,804 )
2.75 Business transaction 874,375 (JPY 3,300,000 )
- - - - 2,664,239 2,664,239

- 108 -
TABLE 2
UNION BANK OF TAIWAN AND SUBSIDIARIES ENDORSEMENTS/GUARANTEES PROVIDED FOR THE YEAR ENDED DECEMBER 31, 2017 (In Thousands of New Taiwan Dollars, Unless Stated Otherwise)
No. Endorser/Guarantor
Endorsee/Guarantee
Limits on Endorsement/
Guarantee Given on Behalf of Each Party
Maximum Amount
Endorsed/ Guaranteed During the
Period
Outstanding Endorsement/
Guarantee at the End of the
Period
Actual Borrowing
Amount
Amount Endorsed/
Guaranteed by Collateral
Ratio of Accumulated Endorsement/ Guarantee to Net Equity in
Latest Financial Statements
(%)
Aggregate Endorsement/
Guarantee Limit
Endorsement/ Guarantee Given
by Parent on Behalf of
Subsidiaries
Endorsement/ Guarantee Given by Subsidiaries
on Behalf of Parent
Endorsement/ Guarantee Given
on Behalf of Companies in
Mainland China
Note Name Relationship
1 Union Financial and Leasing
International Corporation Union Capital (Cayman) Corp. Union Financial and Leasing
International Corporation and subsidiaries
$ 2,664,239 $ 746,200 (US$ 25,000)
$ 746,200 (US$ 25,000)
$ - $ - 28.01 $ 2,664,239 Yes No No

- 109 -
TABLE 3
UNION BANK OF TAIWAN AND SUBSIDIARIES MARKETABLE SECURITIES HELD DECEMBER 31, 2017 (In Thousands of New Taiwan Dollars and Foreign Currency, Unless Stated Otherwise)
Holding Company Type and Issuer/
Name of Marketable Security
Issuer’s Relationship with Holding
Company
Financial Statement Account
December 31, 2017
Note Shares/Piece/
Units (In Thousands)
Carrying Value
Percentage of
Ownership (%)
Market Value or Net Asset
Value
Union Finance and Leasing International Stock Corporation Masterlink Securities Corporation. - Available-for-sale financial assets 931 $ 8,101 0.06 $ 8,101 Note 4 China Chemical Corporation - Available-for-sale financial assets 356 6,646 0.12 6,646 Note 4 Hey-Song Corporation - Available-for-sale financial assets 4,551 143,129 1.13 143,129 Note 4 Union Capital (Cayman) Corp. Subsidiary Equity investment - equity method 50 517,572 100.00 517,572 Note 1 New Asian Ventures Ltd. Subsidiary Equity investment - equity method - 85,652 100.00 85,652 Note 1 ERA Communications Co., Ltd. - Unquoted equity instruments 425 1,415 0.33 1,415 Note 1 Beneficial certificates Union Advantage Global FI Portfolio Fund - Available-for-sale financial assets 6,614 100,088 100,088 Note 4 Union Golden Balance Fund - Available-for-sale financial assets 854 19,603 19,603 Note 4 Union Information Technology Corporation Stock ELTA Technology Co., Ltd. - Unquoted equity instruments 2,646 23,411 14.70 29,319 Note 3 Union Securities Investment Trust Stock Corporation (USITC) Fundrish Securities Co., Ltd. - Unquoted equity instruments 566 7,235 0.94 6,534 Note 2 Beneficial certificates Union Advantage Global FI Portfolio Fund - Financial assets at fair value through profit or loss 1,068 17,478 17,478 Note 4 Union Emerging Asia Bond A - Financial assets at fair value through profit or loss 486 5,539 5,539 Note 4 Union Money Market - Financial assets at fair value through profit or loss 1,230 16,154 16,154 Note 4 Union Golden Balance Fund - Financial assets at fair value through profit or loss 575 13,215 13,215 Note 4 Union Emerg Res-rich Countries HYBd A - Financial assets at fair value through profit or loss 800 8,894 8,894 Note 4 Union China - Financial assets at fair value through profit or loss 1,006 24,919 24,919 Note 4 Union Technology Fund - Financial assets at fair value through profit or loss 1,460 18,266 18,266 Note 4 Union APEC Balanced A - Financial assets at fair value through profit or loss 1,001 12,326 12,326 Note 4 Union Global ETF Fund - Financial assets at fair value through profit or loss 513 5,403 5,403 Note 4 Union Asian High Yield Bond A Financial assets at fair value through profit or loss 1,451 15,194 15,194 Note 4 Union Finance International (HK) Limited Bond HBOS Capital Funding LP - Available-for-sale financial assets 900 units US$ 917 US$ 917 Note 4
(Continued)

- 110 -
Holding Company Type and Issuer/
Name of Marketable Security
Issuer’s Relationship with Holding
Company
Financial Statement Account
December 31, 2017
Note Shares/Piece/
Units (In Thousands)
Carrying Value
Percentage of
Ownership (%)
Market Value or Net Asset
Value
Stock Apple Computer Inc. - Financial assets at fair value through profit or loss 17 US$ 2,945 US$ 2,945 Note 4 Merck & Co., Inc. - Financial assets at fair value through profit or loss 12 US$ 658 US$ 658 Note 4 EBAY Inc. - Financial assets at fair value through profit or loss 14 US$ 516 US$ 516 Note 4 Obsidian - Financial assets at fair value through profit or loss 119 US$ 148 US$ 148 Note 4 Qualcomm - Financial assets at fair value through profit or loss 5 US$ 320 US$ 320 Note 4 AT&T - Financial assets at fair value through profit or loss 10 US$ 389 US$ 389 Note 4 WMI Holdings - Financial assets at fair value through profit or loss 18 US$ 15 US$ 15 Note 4 New Asian Ventures Ltd. Stock Grace T.H.W. Holding Limited - Unquoted equity instruments 1,667 $ 64,320 0.81 US$ 2,714 Note 2 Union Capital (Cayman) Corp. Union Capital (Singapore) Holding Pte. Ltd. Subsidiary Equity investment - equity method - JPY 58,927 100.00 JPY 58,927 Note 5 Uflc Capital (Singapore) Holding Pte. Ltd. Subsidiary Equity investment - equity method - JPY 66,975 100.00 JPY 66,975 Note 5 Union Capital (Singapore) Holding Pte. Ltd. Kabushiki Kaisha UCJ1 Subsidiary Equity investment - equity method 9 JPY 470,173 30.55 JPY 470,173 Note 5 Tokutei Mokuteki Kaisha SSG15 Subsidiary Equity investment - equity method Note 7 JPY 700,750 49.00 JPY 700,750 Note 5 Kabushiki Kaisha UCJ1 Tokutei Mokuteki Kaisha SSG15 Subsidiary Equity investment - equity method Preferred stock
15 JPY 729,300 51.00 JPY 729,300 Note 5
Tokutei Mokuteki Kaisha SSG12 Subsidiary Equity investment - equity method Note 9 JPY 1,013,159 51.00 JPY 1,013,159 Note 5 Tokutei Mokuteki Kaisha SSG16 Subsidiary Equity investment - equity method Preferred stock
26 JPY 1,290,300 51.00 JPY 1,290,300 Note 5
Uflc Capital (Singapore) Holding Pte. Ltd. Kabushiki Kaisha UCJ1 Subsidiary Equity investment - equity method 21 JPY 1,068,923 69.45 JPY 1,068,923 Note 5 Tokutei Mokuteki Kaisha SSG12 Subsidiary Equity investment - equity method Note 8 JPY 973,477 49.00 JPY 973,477 Note 5 Tokutei Mokuteki Kaisha SSG16 Subsidiary Equity investment - equity method Note 6 JPY 1,239,750 49.00 JPY 1,239,750 Note 5 The Bank’s investees had investments in companies with shares having no quoted market prices. The net asset values of these companies were based on the following: Note 1: Union Finance and Leasing International Corporation:
a. ERA Communications Co., Ltd. - the audited statements of stockholders’ equity as of December 31, 2016. b. New Asian Ventures Ltd. and Union Capital (Cayman) Corp. - the audited statements of stockholders’ equity as of December 31, 2017.
Note 2: Union Securities Investment Trust. Corporation (USITC):
Fundrish Securities Co., Ltd. - the audited statements of stockholders’ equity as of December 31, 2017. New Asian Ventures Ltd.: Grace T.H.W. Holding Limited - unaudited statements of stockholders’ equity as of December 31, 2017.
Note 3: Union Information Technology Corporation: ELTA Technology Co., Ltd. - unaudited statements of stockholders’ equity as of December 31, 2017.
(Continued)
- 111 -
Note 4: The market values of the listed and OTC stocks included in financial assets at fair value through profit or loss and available-for-sale financial assets were based on the daily closing prices as of balance sheet date. The market values of beneficial certificates were based on net asset values as of the balance sheet date.
Note 5: Union Capital (Singapore) Holding Pte. Ltd., Uflc Capital (Singapore) Holding Pte. Ltd. and Tokutei Mokuteki Kaisha SSG15, SSG12 and SSG16 - the audited statements of stockholders’ equity as of September 30, 2017.
Kabushiki Kaisha UCJ1 - unaudited statements of stockholders’ equity as of September 30, 2017.
Note 6: Common stock 1 shares and preferred stock 25 thousand shares. Note 7: Common stock 1 shares and preferred stock 14 thousand shares. Note 8: Common stock 1 shares and preferred stock 19 thousand shares. Note 9: Preferred stock 20 thousand shares.
(Concluded)

- 112 -
TABLE 4
UNION BANK OF TAIWAN AND SUBSIDIARIES RECEIVABLES FROM RELATED PARTIES AMOUNTING TO AT LEAST NT$300 MILLION OR 10% OF THE PAID-IN CAPITAL DECEMBER 31, 2017 (In Thousands of New Taiwan Dollars, Unless Stated Otherwise)
Company Name Related Party Relationship Ending Balance Turnover Rate Overdue Amounts Received
in Subsequent Period
Allowance for Impairment Loss Amount Actions Taken
Union Finance and Leasing International
Corporation Union Capital (Cayman) Corp. Subsidiary $ 1,716,636
(JPY 5,639,163) (US$ 7,453)
- $ - - $ - $ -
Union Capital (Cayman) Corp. Union Capital (Singapore) Holding Pte. Ltd. Subsidiary 709,363
(JPY 2,677,225) - - - - -
Uflc Capital (Singapore) Holding Pte. Ltd. Subsidiary 1,464,978 (JPY 5,523,808) (US$ 46)
- - - - -
Union Capital (Singapore) Holding Pte. Ltd. Kabushiki Kaisha UCJ1 (Japan) Subsidiary 388,398
(JPY 1,465,865) - - - - -
Uflc Capital (Singapore) Holding Pte. Ltd. Kabushiki Kaisha UCJ1 (Japan) Subsidiary 596,907
(JPY 2,252,804) - - - - -
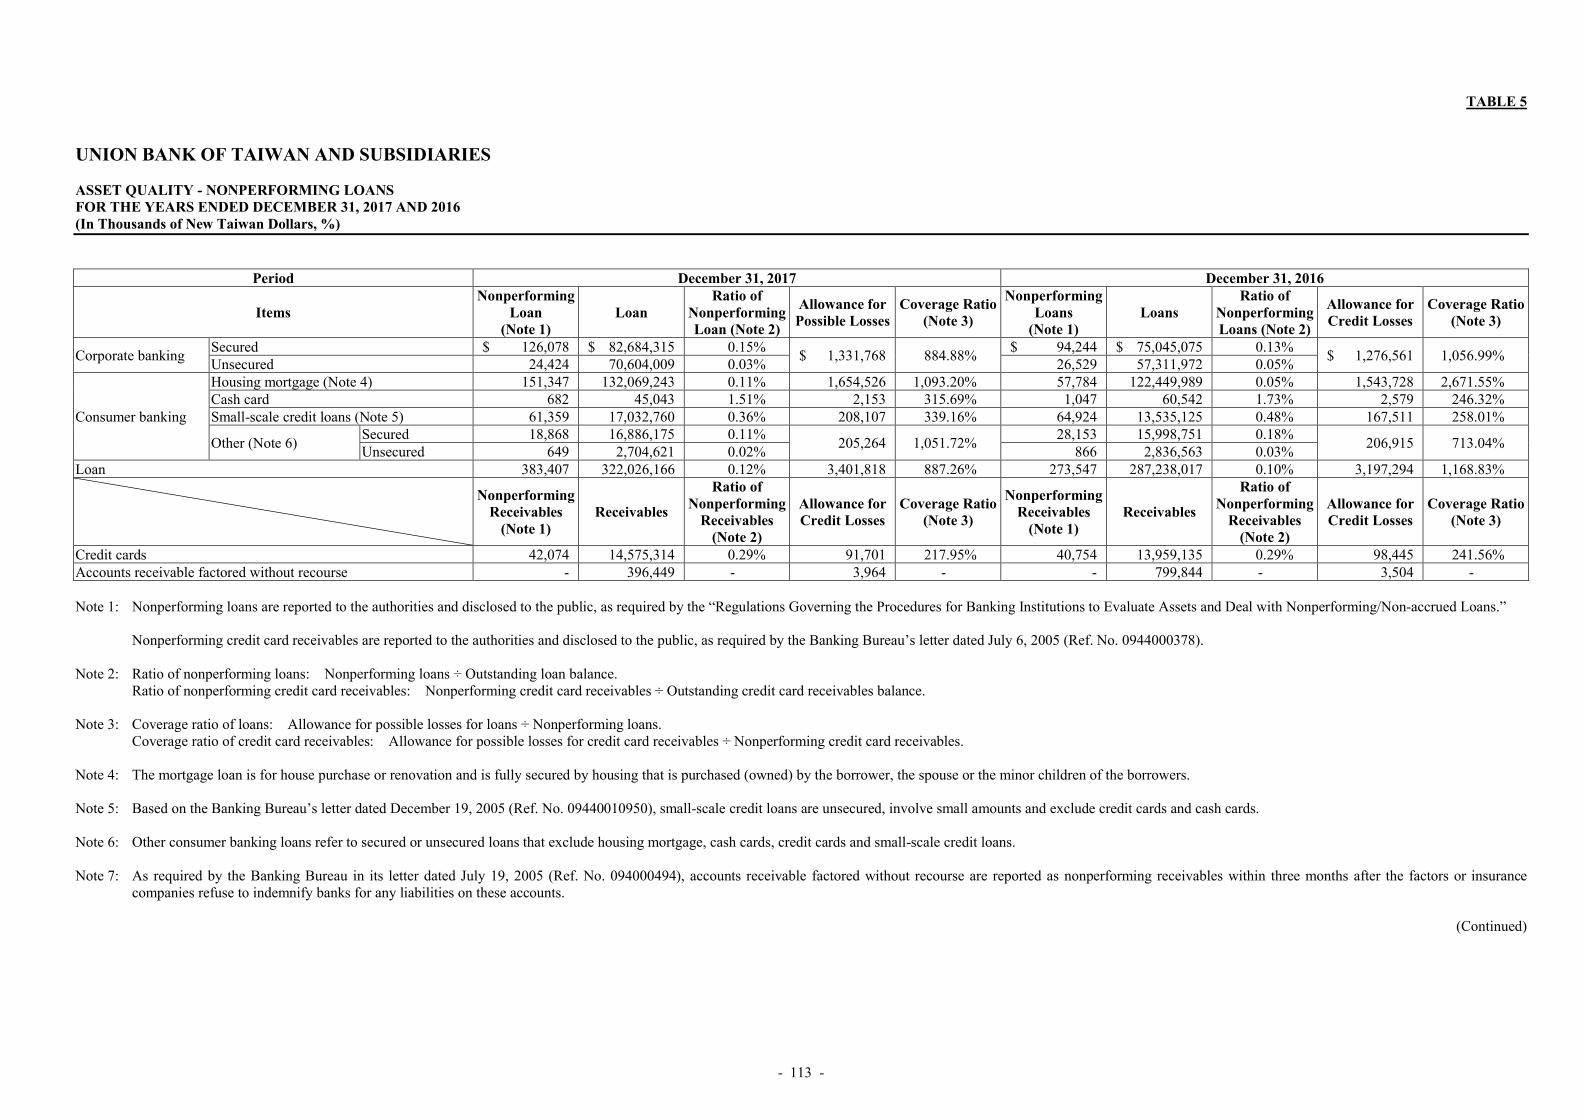
- 113 -
TABLE 5
UNION BANK OF TAIWAN AND SUBSIDIARIES ASSET QUALITY - NONPERFORMING LOANS FOR THE YEARS ENDED DECEMBER 31, 2017 AND 2016 (In Thousands of New Taiwan Dollars, %)
Period December 31, 2017 December 31, 2016
Items Nonperforming
Loan (Note 1)
Loan Ratio of
Nonperforming Loan (Note 2)
Allowance for Possible Losses
Coverage Ratio (Note 3)
Nonperforming Loans
(Note 1) Loans
Ratio of Nonperforming Loans (Note 2)
Allowance for Credit Losses
Coverage Ratio (Note 3)
Corporate banking Secured $ 126,078 $ 82,684,315 0.15%
$ 1,331,768 884.88% $ 94,244 $ 75,045,075 0.13%
$ 1,276,561 1,056.99% Unsecured 24,424 70,604,009 0.03% 26,529 57,311,972 0.05%
Consumer banking
Housing mortgage (Note 4) 151,347 132,069,243 0.11% 1,654,526 1,093.20% 57,784 122,449,989 0.05% 1,543,728 2,671.55% Cash card 682 45,043 1.51% 2,153 315.69% 1,047 60,542 1.73% 2,579 246.32% Small-scale credit loans (Note 5) 61,359 17,032,760 0.36% 208,107 339.16% 64,924 13,535,125 0.48% 167,511 258.01%
Other (Note 6) Secured 18,868 16,886,175 0.11%
205,264 1,051.72% 28,153 15,998,751 0.18%
206,915 713.04% Unsecured 649 2,704,621 0.02% 866 2,836,563 0.03%
Loan 383,407 322,026,166 0.12% 3,401,818 887.26% 273,547 287,238,017 0.10% 3,197,294 1,168.83%
Nonperforming Receivables
(Note 1) Receivables
Ratio of Nonperforming
Receivables (Note 2)
Allowance for Credit Losses
Coverage Ratio (Note 3)
Nonperforming Receivables
(Note 1) Receivables
Ratio of Nonperforming
Receivables (Note 2)
Allowance for Credit Losses
Coverage Ratio (Note 3)
Credit cards 42,074 14,575,314 0.29% 91,701 217.95% 40,754 13,959,135 0.29% 98,445 241.56% Accounts receivable factored without recourse - 396,449 - 3,964 - - 799,844 - 3,504 - Note 1: Nonperforming loans are reported to the authorities and disclosed to the public, as required by the “Regulations Governing the Procedures for Banking Institutions to Evaluate Assets and Deal with Nonperforming/Non-accrued Loans.”
Nonperforming credit card receivables are reported to the authorities and disclosed to the public, as required by the Banking Bureau’s letter dated July 6, 2005 (Ref. No. 0944000378). Note 2: Ratio of nonperforming loans: Nonperforming loans ÷ Outstanding loan balance.
Ratio of nonperforming credit card receivables: Nonperforming credit card receivables ÷ Outstanding credit card receivables balance. Note 3: Coverage ratio of loans: Allowance for possible losses for loans ÷ Nonperforming loans.
Coverage ratio of credit card receivables: Allowance for possible losses for credit card receivables ÷ Nonperforming credit card receivables. Note 4: The mortgage loan is for house purchase or renovation and is fully secured by housing that is purchased (owned) by the borrower, the spouse or the minor children of the borrowers. Note 5: Based on the Banking Bureau’s letter dated December 19, 2005 (Ref. No. 09440010950), small-scale credit loans are unsecured, involve small amounts and exclude credit cards and cash cards. Note 6: Other consumer banking loans refer to secured or unsecured loans that exclude housing mortgage, cash cards, credit cards and small-scale credit loans. Note 7: As required by the Banking Bureau in its letter dated July 19, 2005 (Ref. No. 094000494), accounts receivable factored without recourse are reported as nonperforming receivables within three months after the factors or insurance
companies refuse to indemnify banks for any liabilities on these accounts.
(Continued)

- 114 -
Not reported as nonperforming loans or nonperforming receivables
Items
Types
December 31, 2017 December 31, 2016 Not Reported as Nonperforming
Loan
Not Reported as Nonperforming
Receivable
Not Reported as Nonperforming
Loan
Not Reported as Nonperforming
Receivable Amounts of executed contracts on
negotiated debts not reported as nonperforming loans and receivables (Note 1) $ 42,254 $ 178,460 $ 56,493 $ 234,830
Amounts of discharged and executed contracts on clearance of consumer debts not reported as nonperforming loans and receivables (Note 2) 77,446 768,034 67,968 798,500
Total 119,700 946,494 124,461 1,033,330 Note 1: Amounts of executed contracts on negotiated debts that are not reported as nonperforming loans or receivables are reported in accordance with the Banking Bureau’s letter dated April 25, 2006 (Ref. No. 09510001270). Note 2: Amounts of discharged and executed contracts on clearance of consumer debts that are not reported as nonperforming loans or receivables are reported in accordance with the Banking Bureau’s letter dated September 15, 2008 (Ref.
No. 09700318940).
(Concluded)

- 115 -
TABLE 6
UNION BANK OF TAIWAN AND SUBSIDIARIES INFORMATION ON AND PROPORTIONATE SHARE IN INVESTEES DECEMBER 31, 2017 (In Thousands of New Taiwan Dollars)
Investee Company Location Main Business and Product
Percentage of
Ownership (%)
Carrying Value Investment Gain (Loss)
Proportionate Share of the Bank and Its Subsidiaries in Investees
Note Shares
(Thousands) Pro Forma
Shares (Note 2)
Total
Shares (Thousands)
Percentage of
Ownership (%)
Financial-related Union Finance and Leasing International
Corporation Taipei Installment, leasing and accounts receivable factoring 100.00 $ 2,664,239 $ 148,356 117,000 - 117,000 100.00 Note 3
Union Finance International (HK) Limited Hong Kong Import and export accommodation 99.99 99,514 33,476 30,000 - 30,000 99.99 Note 3 Union Securities Investment Trust Corporation Taipei Securities investment trust 35.00 144,248 11,333 10,500 - 10,500 35.00 Note 3 Union Information Technology Corporation Taipei Software and hardware product retail and distribution,
system programming development, system development outsourcing, website design, e-commerce, etc.
99.99 20,244 864 1,000 - 1,000 99.99 Note 3
Ipass Corporation Kaohsiung IC card 16.25 123,320 - 13,000 - 13,000 16.25 Taiwan Gin Lian Asset Management
Corporation Taipei Purchase, sale and management of nonperforming loans
from financial institutions 0.57 75,000 - 7,500 - 7,500 0.57
Taiwan Financial Asset Service Corporation Taipei Property auction 2.94 50,000 - 5,000 - 5,000 2.94 Huan Hua Securities Finance Co. Taipei Securities finance 0.53 20,055 - 2,103 - 2,103 0.53 Sunny Asset Management Co. Taipei Purchase, sell and manage nonperforming loans from
financial institution 6.44 3,864 - 386 - 386 6.44
Taipei Forex Inc. Taipei Foreign exchange brokering 0.81 2,113 - 160 - 160 0.81 Financial Information Service Co., Ltd. Taipei Information service 2.39 118,782 - 12,498 - 12,498 2.39 Taiwan Depository & Clearing Corporation Taipei Financial service 0.25 13,916 - 899 - 899 0.25 Taiwan Futures Exchange Co., Ltd. Taipei Futures clearing 2.04 71,250 - 6,422 - 6,422 2.04 Taiwan Mobile Payment Corporation Taipei International trade, data processing service 1.00 6,000 - 600 - 600 1.00 Nonfinancial-related Union Real-Estate Management Corporation Taipei Construction plan review and consulting 40.00 53,121 (326) 2,000 - 2,000 40.00 Note 3 Fu Hua Venture Corporation Taipei Investments 5.00 9,852 - 990 - 990 5.00 Li Yu Venture Corporation Taipei Investment 4.76 5,837 - 607 - 607 4.76 Lian An Service Corporation Taipei Security service 5.00 1,501 - 125 - 125 5.00 Taiwan Power Corporation Taipei Electricity-related business 0.0012 6,124 - 395 - 395 0.0012 Note 1: The investees’ information shown above is based on audited financial reports as of December 31, 2017. Note 2: Pro forma shares are considered if equity securities - convertible bonds, warrants, etc. - or derivative contracts such as stock options, are converted to shares.

- 116 -
TABLE 7
UNION BANK OF TAIWAN AND SUBSIDIARIES BUSINESS RELATIONSHIP AND SIGNIFICANT TRANSACTIONS AMONG THE BANK AND SUBSIDIARIES YEAR ENDED DECEMBER 31, 2017 (In Thousands of New Taiwan Dollars)
No. (Note 1)
Transacting Corporation Counterparty Flow of
Transaction (Note 2)
Description of Transaction
Financial Statement Account Amount Trading Terms Percentage of Total Revenue or Total
Assets (Note 3)
0 The Bank UFLIC and its subsidiaries a Deposits and remittances - demand deposits $ 64,209 Note 4 0.01 0 The Bank UFLIC and its subsidiaries a Deposits and remittances - checking deposits 17,327 Note 4 - 0 The Bank UFLIC and its subsidiaries a Deposits and remittances - time deposits 19,200 Note 4 - 1 UFLIC and its subsidiaries The Bank b Due from banks 100,736 Note 4 0.02 0 The Bank UFLIC and its subsidiaries a Deposits and remittances - time deposits 4,038 Note 4 - 1 UFLIC and its subsidiaries The Bank b Other assets 4,038 Note 4 - 0 The Bank UFLIC and its subsidiaries a Discounts and loans - short-term, secured 1,895,359 Note 4 0.34 1 UFLIC and its subsidiaries The Bank b Call loans and due to other banks - call loans from banks 1,895,359 Note 4 0.34 0 The Bank UFLIC and its subsidiaries a Other operating expenses 11,558 Note 4 0.09 1 UFLIC and its subsidiaries The Bank b Rental revenue 11,558 Note 4 0.09 0 The Bank UFLIC and its subsidiaries a Interest revenue 35,385 Note 4 0.28 1 UFLIC and its subsidiaries The Bank b Interest expense 35,385 Note 4 0.28 0 The Bank UFLIC and its subsidiaries a Rental revenue 1,814 Note 4 0.01 1 UFLIC and its subsidiaries The Bank b Other operating expenses 1,814 Note 4 0.01 0 The Bank UFLIC and its subsidiaries a Exchange loss 4,884 Note 4 0.04 1 UFLIC and its subsidiaries The Bank b Exchange gain 4,884 Note 4 0.04 0 The Bank Union Finance International (HK) Limited a Deposits and remittances - demand deposits 3,291 Note 4 - 2 Union Finance International (HK) Limited The Bank b Due from banks 3,291 Note 4 - 0 The Bank UIT a Deposits and remittances - demand deposits 23,442 Note 4 - 3 UIT The Bank b Due from banks 23,442 Note 4 - 0 The Bank UIT a Deposits and remittances - time deposits 1,088 Note 4 - 3 UIT The Bank b Other financial assets 1,088 Note 4 - 0 The Bank UIT a Other assets 29,238 Note 4 0.01 3 UIT The Bank b Other liabilities 29,238 Note 4 0.01 0 The Bank UIT a Other operating expenses 111,589 Note 4 0.89 3 UIT The Bank b Net revenues other than interest 111,589 Note 4 0.89 0 The Bank USITC a Deposits and remittances - demand deposits 2,052 Note 4 - 0 The Bank USITC a Deposits and remittances - time deposits 29,700 Note 4 0.01 0 The Bank USITC a Deposits and remittances - checking deposits 2 Note 4 - 5 USITC The Bank b Due from banks 31,754 Note 4 0.01 0 The Bank USITC a Deposits and remittances - time deposits 198,300 Note 4 0.04 5 USITC The Bank b Other financial assets 198,300 Note 4 0.04 0 The Bank USITC a Interest expense 2,547 Note 4 0.02 5 USITC The Bank b Interest revenue 2,547 Note 4 0.02 0 The Bank USITC a Commissions and fee revenues 18,050 Note 4 0.14 5 USITC The Bank b Commissions and fee expenses 18,050 Note 4 0.14 3 UIT UFLIC and its subsidiaries c Net revenues other than interest 5,614 Note 4 0.05
(Continued)

- 117 -
No. (Note 1)
Transacting Corporation Counterparty Flow of
Transaction (Note 2)
Description of Transaction
Financial Statement Account Amount Trading Terms Percentage of Total Revenue or Total
Assets (Note 3)
1 UFLIC and its subsidiaries UIT c Amortization expense $ 2,819 Note 4 0.02 1 UFLIC and its subsidiaries UIT c Other operating expenses 2,766 Note 4 0.02 1 UFLIC and its subsidiaries UIT c Advertisement expense 29 Note 4 - 6 UFLIC Union Capital (Cayman) Corp. c Receivables - receivables from related parties 1,729,517 Note 4 0.31 7 Union Capital (Cayman) Corp. UFLIC c Payables - payables to related parties 1,729,517 Note 4 0.31 6 UFLIC Union Capital (Cayman) Corp. c Interest revenue 24,707 Note 4 0.20 7 Union Capital (Cayman) Corp. UFLIC c Interest expense 24,707 Note 4 0.20 7 Union Capital (Cayman) Corp. Union Capital (Singapore) Holding PTE. Ltd. c Receivables - receivables from related parties 710,476 Note 4 0.13 8 Union Capital (Singapore) Holding PTE. Ltd. Union Capital (Cayman) Corp. c Payables - payables to related parties 710,476 Note 4 0.13 7 Union Capital (Cayman) Corp. Uflc Capital (Singapore) Holding PTE. Ltd. c Receivables - receivables from related parties 1,477,284 Note 4 0.26 10 Uflc Capital (Singapore) Holding PTE. Ltd. Union Capital (Cayman) Corp. c Payables - payables to related parties 1,477,284 Note 4 0.26 7 Union Capital (Cayman) Corp. Union Capital (Singapore) Holding PTE. Ltd. c Interest revenue 10,920 Note 4 0.09 8 Union Capital (Singapore) Holding PTE. Ltd. Union Capital (Cayman) Corp. c Interest expense 10,920 Note 4 0.09 7 Union Capital (Cayman) Corp. Uflc Capital (Singapore) Holding PTE. Ltd. c Interest revenue 22,350 Note 4 0.18 10 Uflc Capital (Singapore) Holding PTE. Ltd. Union Capital (Cayman) Corp. c Interest expense 22,350 Note 4 0.18 8 Union Capital (Singapore) Holding PTE. Ltd. Kabushiki Kaisha UCJ1 c Receivables - receivables from related parties 388,750 Note 4 0.07 9 Kabushiki Kaisha UCJ1 Union Capital (Singapore) Holding PTE. Ltd. c Payables - payables to related parties 388,750 Note 4 0.07 10 Uflc Capital (Singapore) Holding PTE. Ltd. Kabushiki Kaisha UCJ1 c Receivables - receivables from related parties 601,772 Note 4 0.11 9 Kabushiki Kaisha UCJ1 Uflc Capital (Singapore) Holding PTE. Ltd. c Payables - payables to related parties 601,772 Note 4 0.11 8 Union Capital (Singapore) Holding PTE. Ltd. Kabushiki Kaisha UCJ1 c Interest revenue 10,912 Note 4 0.09 9 Kabushiki Kaisha UCJ1 Union Capital (Singapore) Holding PTE. Ltd. c Interest expense 10,912 Note 4 0.09 10 Uflc Capital (Singapore) Holding PTE. Ltd. Kabushiki Kaisha UCJ1 c Interest revenue 15,784 Note 4 0.13 9 Kabushiki Kaisha UCJ1 Uflc Capital (Singapore) Holding PTE. Ltd. c Interest expense 15,784 Note 4 0.13
Note 1: The transacting corporation is identified in the No. column as follows:
a. 0 for parent company. b. Sequentially from 1 for subsidiaries.
Note 2: The flow of transactions is as follows:
a. From parent company to subsidiary. b. From subsidiary to parent company. c. Between subsidiaries.
Note 3: The percentage is calculated as follows:
a. Assets and liabilities: Ending balance divided by total consolidated assets. b. Income and expenses: The amount for the year ended divided by consolidated net income.
Note 4: The terms of the transactions between the Bank and related parties were similar to those for unrelated parties.
(Concluded)