Embed Size (px)
Citation preview
REGISTRATION NUMBER 201404241708 PRESIDENT Bonang Mohale VICE PRESIDENT Adrian Gore CEO Cas Coovadia NEDLAC CONVENOR Kaizer Moyane DIRECTORS Angela Russell Bongi Kunene Busisiwe Mavuso Christopher Campbell Deidre Penfold Gwarega Mangozhe John Dludlu John Purchase Leon Campher Roger Baxter Stavros Nicolaou Zoleka Lisa Roger Baxter Stavros Nicolaou Zoleka Lisa
NATIONAL OFFICE 61 Katherine Street Sandton 2196
PO Box 652807 Benmore 2010 wwwbusaorgza +27 11 784 8000
COVID-19 Cargo movement update1 Date 24 September 2021
Weekly Snapshot
Table 1 ndash Port volumes and air cargo flows week on week
Flows Current2 Previous3
Growth Import Export Total Import Export Total
Port Volumes (TEUs) 28 726 29 375 58 101 27 194 29 354 56 548 uarr3
Air Cargo (tons) 4 873 3 120 7 993 4 995 2 716 7 711 uarr4
Monthly Snapshot
Figure 1 ndash Monthly4 cargo capacity levels year on year (100 = baseline)
Figure 2 ndash International year-to-date flows 2019-20215 ocean yy (metric tonnes) amp air freight yy (kg millions)
Key Notes
bull An average of ~8 300 TEUs was handled per day this week uarr3 from last week
bull Local freight transport (in volume) decreased by darr47 in July 2021 compared with July 2020
1 This update contains a combined overview of air sea and road freight to and from South Africa in the last week This report is the 56th update 2 lsquoCurrentrsquo means the last 7 daysrsquo (a weekrsquos) worth of available data 3 lsquoPreviousrsquo means the preceding 8-14 daysrsquo (a weekrsquos) worth of available data 4 lsquoMonthlyrsquo means the last full monthrsquos worth of available data compared to the same month in 2020 For air Aug versus Aug The rest compared Jul 2021 versus Jul 2020 5 For ocean total Jan-Jul cargo in metric tonnes as reported by Transnet is used while for air Jan-Aug cargo to and from ORTIA is used
128
76
72
212
120
77
151
104
0 50 100 150 200 250
Containers (TEUs)
Dry bulk (MT)
Liquid bulk (MT)
Breakbulk (MT)
Vehicles (Units)
Total Cargo (excl Vehicles)
International Air Cargo
Domestic Air Cargo
0 50 100 150
2021
2020
2019
International Ocean Freight
0 50 100 150 200 250
2021
2020
2019
International Air Freight
2
bull Average cross-border queue time rose by uarr05 hrs with transit times also rising (uarr25 hrs see
below)
bull Rail cargo moved through Durban this week amounted to 3 489 containers darr24 from last week
bull The WCI remained stable for the first time in 23 weeks currently at $10 377 per 40-ft
bull Industry-wide cargo tonne-kilometres (CTKs) rose by uarr249 in the three months ended July 2021
Executive Summary
This update ndash the 57th of its kind ndash contains a consolidated overview of the South African supply chain and
the current state of international trade As an ongoing initiative created because of COVID-19 the industry
is pleased to see the back of the third wave as this week saw another decrease in positive cases Newly
reported COVID-19 infections averaged approximately 2 667 per day (darr39 from last weeks average 4 339)
As a result the total number of cases recorded in the country now stands at 292 million6 with the death
toll at 86 655 (up by 876 ndash which has reduced markedly in recent months) Indeed South Africa is moving
closer to normality as indicated by an increase in the normalcy index7 (up by 57 to 677 in the last two
weeks) Globally COVID-19 infections total more than 231 million with the death toll nearing 47 million
people
On the vaccination front more than 606 billion vaccine doses have now been administered worldwide8 For
South Africa this figure stands at ~167 million with a daily average of ~140 000 doses administered in the
past seven days falling well short of the daily target Fortunately as we have reported previously access to
vaccines is no longer an issue which is regrettably not the case for the rest of Africa and the developing
world This issue has become contentious globally with many fully vaccinated individuals in the developed
world now receiving booster shots In contrast others in the less developed world still have little prospect
of being vaccinated As UN Secretary-General Antonio Guterres said this week This is a moral indictment
of the state of our world It is an obscenity We passed the science test But we are getting an F in ethics9
Operationally our ports registered a satisfactory week number-wise Bar some delays at CTCT on Monday
the weather also played its part throughout the week as there were few weather-enforced delays The
seemingly ongoing issues with equipment were also less prevalent this week as the industry received few
reports of operational disruptions because of equipment breakdown and maintenance schedules These
issues were especially noticeable at the Port of Cape Town The industry is hopeful of continued
improvement in this regard However as we have said previously there needs to be a concerted drive to
streamline the procurement and maintenance of equipment as the constraints are often outside the control
of the departments using the equipment Lastly discussions took place this week regarding the
establishment of a container terminal at the Durban Point Precinct
On the rail cargo front cable theft continues to be an issue as TFR reported 38 cable theft cases on the
Container (formerly NATCOR) line over the previous weekend In a Transport Forum discussion Prof Jan
Havenga this week pointed out that South Africa could save its rail cargo industry as there is a significant
amount of rail-friendly cargo that should transfer from road freight to rail freight According to Stats SA
the current seasonally adjusted payload split is 2179 in favour of road Optimistically various stakeholders
appear to be determined efforts to get the rail industry running at full throttle once more The increased
possibility of third-party concessions is also encouraging
6 Johns Hopkins Coronavirus Resource Centre Coronavirus JJHU 7 Economist 13072021 The global normalcy index 8 Our World in Data Coronavirus (COVID-19) Vaccinations Our World in Data 9 Guterres A 21092021 UN chief grades world on vaccine rollout F in Ethics
3
Globally for the first time in 23 weeks the container industry did not see a rise in freight rates However
there is no immediate prospect of a reprieve for shippers as surcharges continue to impact the overall
freight cost while carriers seek to handle the crisis in equipment and slot capacity and these surcharges are
unlikely to disappear even as rates start to decline Other notable developments internationally include (1)
an update on congestion on the US West Coast (which remains clogged) with extended hours implemented
(2) another cyber-attack (CMA-CGM) and (3) The IMO defrauded by a North Korean vessel in a laundering
scheme (see the detailed summary below)
In the aviation sector domestic and international volumes increased by uarr4 this week which has continued
the recent overall trend Internationally the upward trend in air cargo volumes continued in the past three
months even though seasonally adjusted numbers show the growth has slowed compared with early 2021
At the same time the industry continues to experience a capacity crunch with high load factors and limited
belly hold capacity due largely to the primarily grounded passenger fleets Nevertheless growth drivers
support air cargo in the near term which will be boosted once passenger flights return to the sky ndash currently
at 42 capacity levels compared to 2019
Finally in concluding this edition the extended supply chain keeps hovering in positive territory statistically
even if only slightly The concerted efforts of most parties active in operations continue as do the moves to
expedite and harmonise border processes and facilitate international trade For example on the truck
booking system at Durban there is work being done by BUSA SAAFF Transnet and other stakeholders to
address the high level of cancellation of truck bookings We cannot afford to lose focus in these challenging
times As the Chinese proverb has it when the winds of change blow some people build walls others build
windmills Most industry role players are working overtime to build windmills However it remains critical
to ensure that any improvements made in securing our supply chain are maintained across the board
4
Contents
Weekly Snapshot 1
Monthly Snapshot 1
Key Notes 1
Executive Summary 2
Contents 4
1 Ports Update 5
a Container flow overview 5
b Summary of port operations 8
i Weather delays 8
ii Cape Town 8
iii Durban 8
iv Transnet Freight Rail (TFR) 9
v General 10
2 Air Update 10
a International air cargo 10
b Domestic air cargo 11
3 Road and regional Update 12
a South African land transport 12
b Cross-border delays 13
4 International Update 16
a Global container industry 16
i Global freight rates 16
ii Further developments of note 17
b Global aviation industry 18
5
1 Ports Update
This section provides an overview of the flow of containerised cargo through South Africas commercial
ports
a Container flow overview
The following table indicates the container flows reported for the last seven days and projections for the
next seven days
Table 2 ndash Container Ports ndash Weekly flow reported for 18 to 24 September 10
7-day flow forecast (18092021 ndash 24092021)
TERMINAL NO OF CONTAINERS TO DISCHARGE (IMPORT)
NO OF CONTAINERS TO LOAD (EXPORT)
DURBAN CONTAINER TERMINAL PIER 1 5 293 4 935
DURBAN CONTAINER TERMINAL PIER 2 13 199 12 456
CAPE TOWN CONTAINER TERMINAL 6 174 6 073
NGQURA CONTAINER TERMINAL 3 835 4 785
GQEBERHA CONTAINER TERMINAL 225 1 125
TOTAL 28 726 29 374
Source Transnet 2021 Updated 24092021
Table 3 ndash Container Ports ndash Weekly flow reported for 25 September to 1 October 11
7-day flow forecast (25092021 ndash 01102021)
TERMINAL NO OF CONTAINERS TO DISCHARGE (IMPORT)
NO OF CONTAINERS TO LOAD (EXPORT)
DURBAN CONTAINER TERMINAL PIER 1 5 938 7 543
DURBAN CONTAINER TERMINAL PIER 2 13 588 15 774
CAPE TOWN CONTAINER TERMINAL 4 490 6 405
NGQURA CONTAINER TERMINAL 5 088 8 379
GQEBERHA CONTAINER TERMINAL 909 1 480
TOTAL 30 013 39 581
Source Transnet 2021 Updated 24092021
An average of ~8 300 TEUs (uarr3) was handled per day for the last week (18 ndash 24 September Table 2) with
another increased average of around ~9 942 TEUs (uarr20) projected to be handled next week (25 September
ndash 1 October Table 3) Fortunately the numbers show that performance has increased in the last few weeks
Nevertheless we are still somewhat off the targets set as some operational problems continue to bedevil
the system On the positive side public-private stakeholder engagement continues to grow and improve
which has been a real shining light in an otherwise dim sky during the pandemic
For a holistic picture the following figure displays the rolling monthly average flow of total containerised
cargo movement for our commercial ports since the start of the nationwide lockdown A full breakdown of
the TNPA figures reported for August will be provided in next weeks edition
10 It remains important to note that a fair percentage (approximately 29 according to the most recent TNPA figures for July) of containers are neither imported nor exported but rather consist of empties Due to the ongoing container imbalances this proportion is fluctuating more than usual and has increased since December 2020 11 As notes above
6
Figure 3 ndash Monthly flow reported for total cargo movement (TEUs April 2020 to present month on month)
Source Calculated using data from Transnet 2021 Updated 24092021
The figures below show the weekly container flows for the previous seven days and projections for the next
seven days
Figure 4 ndash 7-day flow reported for total cargo movement (18 to 24 September per port day on day)
Source Calculated using data from Transnet 2021 Updated 24092021
0
50
100
150
200
250
300
350
Tho
usa
nd
s
DURBAN CONTAINER TERMINAL PIER 1 DURBAN CONTAINER TERMINAL PIER 2
CAPE TOWN CONTAINER TERMINAL NGQURA CONTAINER TERMINAL
GQEBERHA CONTAINER TERMINAL
0
500
1 000
1 500
2 000
2 500
3 000
3 500
4 000
4 500
5 000
18-Sep 19-Sep 20-Sep 21-Sep 22-Sep 23-Sep 24-Sep
Durban Container Terminal Pier 1 Durban Container Terminal Pier 2
Cape Town Container Terminal Ngqura Container Terminal
Gqeberha Container Terminal
7
Figure 5 ndash 7-day flow reported for total cargo movement (25 September to 1 October per port day on day)
Source Calculated using data from Transnet 2021 Updated 24092021
The following figure shows daily stack occupancy in both Durban terminals since the end of June with
pressure on operational fluidity a constant in the last few months Despite the onslaught landside
performance in the container yard has managed to keep up with both piers hovering around the optimal
65 stack occupancy level (with some fluctuations) in the last three weeks
Figure 6 ndash Stack occupancy in DCT general-purpose containers (23 August to present per pier day on day)
Source Calculated using data from Transnet 2021 Updated 24092021
0
500
1 000
1 500
2 000
2 500
3 000
3 500
4 000
4 500
5 000
5 500
6 000
25-Sep 26-Sep 27-Sep 28-Sep 29-Sep 30-Sep 01-Oct
Durban Container Terminal Pier 1 Durban Container Terminal Pier 2
Cape Town Container Terminal Ngqura Container Terminal
Gqeberha Container Terminal
0
10
20
30
40
50
60
70
80
90
11-Sep 12-Sep 13-Sep 14-Sep 15-Sep 16-Sep 17-Sep 18-Sep 19-Sep 20-Sep 21-Sep 22-Sep 23-Sep 24-Sep
Pier 1 Pier 2 Threshold
8
b Summary of port operations
The following sections provide a more in-depth overview of the operational performance of our commercial
ports over the last seven days
i Weather delays
This week started quite windy in Cape Town Fortunately waterside operations were affected only slightly
throughout the week
This week Durban port experienced much more favourable weather conditions with slightly stronger winds
picking up on Thursday afternoon coupled with some light rain
Waterside operations were challenged on Monday with strong WSW winds causing vessel ranging
However the wind moderated as the week progressed
ii Cape Town
Waterside operations were exceptionally challenging this week due to equipment shortages and labour
issues On Monday morning MPT Cape Town was operating with ships gear only as no mobile harbour cranes
were operational Only one crane was scheduled to be operational by Monday mid-morning Port
stakeholders further complained that the container stevedoring service employed by Transnet working on
container vessels especially at MPT was not efficient Allegations are that the personnel are inadequately
equipped and poorly trained Similar concerns were raised at other ports At Cape Town MPT stack
occupancy stood at 28 capacity for general-purpose containers and 20 for reefer containers
iii Durban
The terminals at Durban were also struggling to operate efficiently due to limited equipment and high stack
occupancy In addition DCT experienced tug availability issues over the previous weekend with a vessel at
FPT unable to move which subsequently delayed the berthing of a conventional reefer vessel waiting to
load citrus Furthermore the Durban port helicopter was reported out of service pending the arrival of
spares on Monday A total of 1474 gate moves were recorded on Monday at Pier 1 with 539 shifts 876
cancelled slots and 167 wasted slots At Pier 2 2 429 gate moves were recorded with 1 508 cancelled slots
350 wasted slots and 970 shifts
On Thursday Transnet announced that they were approaching the market to launch a Request for
Information (RFI) process regarding establishing a container terminal at the Point Precinct The RFI process
is for the design development financing construction operation and maintenance of such a container
terminal Once the interest and feasibility have been confirmed through the RFI process an open Request
for Proposal (RFP) process will follow On Thursday Pier 1 recorded 1305 gate moves 773 cancelled slots
221 wasted slots and 576 shifts In addition an accident on Sydney Road caused tipper trucks destined for
Maydon Warf to block the steel and Khongela bridges causing much-unwanted congestion in the area On
Friday stack occupancy at Pier 2 stood at 83 capacity for reefer containers and 55 at Pier 1
The following figure summarises port operations in Durban for the last two weeks focusing on gate moves
and time spent in the terminal
9
Figure 7 ndash Gate moves and time spent in the terminal (in minutes)
Source Calculated using data from Transnet 2021 Updated 24092021
iv Transnet Freight Rail (TFR)
Increasing reports of cable theft continue to raise significant concerns around the productivity of operations
at TFR TFR reported 38 cases of cable theft on the Container line over the previous weekend On
Wednesday Transnet informed its customers that they were experiencing OHTE power failure between
Union and Elsburg stations All trains were hauled by diesel locomotives through the dead section and delays
in train arrivals and departures from the Reef were experienced as a result
The following figure graphically illustrates the rail movement from Durban during the week showing a
notable decrease
Figure 8 ndash TFR Rail handled (Pier 1 and Pier 2)
Source Calculated using data from Transnet 2021 Updated 24092021
0
50
100
150
200
250
300
350
0
500
1000
1500
2000
2500
3000
3500
4000
4500
5000
11-Sep 12-Sep 13-Sep 14-Sep 15-Sep 16-Sep 17-Sep 18-Sep 19-Sep 20-Sep 21-Sep 22-Sep 23-Sep 24-Sep
Min
ute
s
Mo
ves
Pier 1 Gate Moves Pier 2 Gate Moves
Pier 1 Demonstrated Capacity Gate Moves Pier 2 Demonstrated Capacity Gate Moves
Pier 1 Time spent in port Pier 2 Time spent in port
Pier 2
Pier 1
0
50
100
150
200
250
300
350
400
450
18-Sep 19-Sep 20-Sep 21-Sep 22-Sep 23-Sep 24-Sep
Pier 1 Inbound Pier 1 Outbound Pier 2 Inbound Pier 2 Outbound
10
This week (18 to 24 September) rail cargo handled out of Durban averaged around 178 containers inbound
(45 for Pier 1 and 133 for Pier 2) and 392 containers outbound (46 for Pier 1 and 346 for Pier 2) per day
Total rail cargo moved through Durban for the week amounts to 3 489 containers darr24 lower than the
previous weeks 4 564 containers
v General
On Monday port users were urged by Transnet to properly process Cargo Dues on the Cash to Order system
as an increased number of abnormalities regarding the capturing of certain fields for Automotive and Break
Bulk cargo was noted Transnet also notified port users and other customers that they planned a National
search on Wednesday 22 September 2021 to search for missing containers
2 Air Update
a International air cargo
The following table shows the in- and outbound air cargo flows to and from ORTIA for the week starting 13
September For comparative purposes the average air freight cargo (inbound and outbound) handled at
ORTIA in September 2020 averaged ~731 369 kg per day For 2019 this average was ~900 778 kg per day
which is probably a more meaningful comparison and illustrates the extent to which volumes have fallen
over the last 18 months
Table 4 ndash International inbound and outbound cargo from OR Tambo
Flows 13-Sep 14-Sep 15-Sep 16-Sep 17-Sep 18-Sep 19-Sep
Volume inbound 568 230 312 739 449 723 456 725 381 939 356 069 885 843
Volume outbound 311 766 196 911 243 786 169 601 232 169 310 226 719 538
Total handled per day 879 996 509 650 693 509 626 326 614 108 666 295 1 605 381
Courtesy of ACOC Updated 22092021
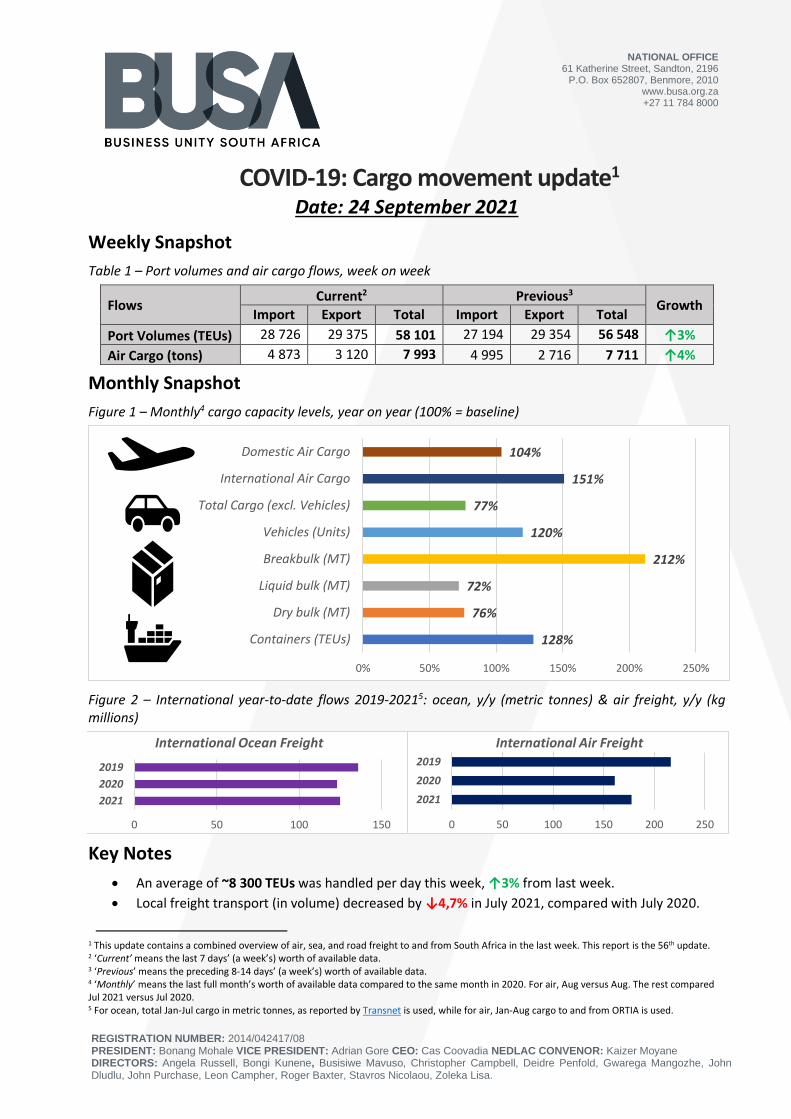
The daily average volume of air cargo handled at ORTIA over the seven days starting 13 September
amounted to 487 324 kg inbound and 312 000 kg outbound This amounts to an average of 799 324kg per
day or ~115 compared to August 2020 Compared to pre-COVID-19 times the level is currently only at
~81 compared with the same period in 2019
The following figure shows monthly international freight movement at ORTIA during the state of disaster
11
Figure 9 ndash International inbound and outbound cargo from OR Tambo (thousands)
Courtesy of ACOC Updated 22092021
b Domestic air cargo
The following table shows the domestic inbound and outbound air cargo flows for the duration of the
lockdown period as reported by the industry By way of comparison the average domestic air freight cargo
(inbound and outbound) for ORTIA handled in August 2020 was only ~59 559 kg12 per day
Table 5 ndash Total domestic inbound and outbound cargo
DATE AIRPORT CPT DUR ELS ORTIA PLZ OTHERS TOTAL
Mar-Dec rsquo20 Av 21 813 2 941 3 751 20 539 6 571 3 176 56 713
Jan Average 20 961 2 739 2 859 22 818 5 491 5 238 57 781
Feb Average 27 777 3 537 3 427 30 117 6 988 3 503 75 348
Mar Average 28 781 3 702 3 845 31 166 7 680 3 740 78 914
Apr Average 24 875 3 234 3 058 25 694 6 306 3 046 66 213
May Average 29 891 3 781 3 669 27 817 7 245 3 261 75 664
Jun Average 27 498 3 706 3 556 26 873 7 086 3 213 71 932
Jul Average 23 583 5 374 3 144 15 839 6 229 2 844 57 013
Aug Average 25 649 2 983 3 495 19 973 6 597 3 256 61 953
Sep Average 27 131 3 820 3 485 21 217 6 894 3 191 65 739
14-Sep-21 38 387 5 286 4 829 37 916 9 652 4 959 101 029
15-Sep-21 42 033 5 205 5 082 28 559 13 786 3 579 98 242
16-Sep-21 39 112 5 652 4 367 26 360 10 910 4 951 91 352
17-Sep-21 19 324 3 283 2 783 33 154 4 616 2 976 66 136
18-Sep-21 2 600 1 021 53 2 061 371 129 6 235
19-Sep-21 3 303 296 169 811 403 754 5 735
20-Sep-21 52 387 5 794 6 142 31 282 11 946 6 310 113 861
Y-T-D Totals 6 886 416 959 597 891 439 6 490 597 1 765 825 846 088 17 839 961
12 For Cape Town the figure corresponds to 34 369 kg per day and 3 129 kg per day for Durban during the same period (July 2020)
0
100
200
300
400
500
600
Inbound Outbound Linear (Inbound) Linear (Outbound)
12
Courtesy of BAC Updated 23092021
Currently the average domestic air cargo moved in the last week was ~68 941 kg per day which is uarr4
compared with the previous week and ~107 compared to September 2020
The following figure shows monthly domestic freight movement at our commercial airports during the state
of disaster with an upward trend in volumes registered since the start of the year
Figure 10 ndash Average domestic inbound and outbound cargo (thousands)
Courtesy of BAC Updated 23092021
3 Road and regional Update
a South African land transport
This week Stats SA released the monthly land transport statistics for July13 The headline figure shows that
the volume of goods transported (payload) decreased by darr47 in July 2021 compared with July 2020 Over
the same period the corresponding income also reduced this time around by darr31 The following figures
note the bi-monthly percentage change in the freight transportation sector
13 Stats SA 20092021 Land transport
-
5
10
15
20
25
30
35
Tho
usa
nd
s
CPT DUR ELS JNB
PLZ OTHERS Linear (CPT) Linear (JNB)
13
Figure 11 ndash Average domestic inbound and outbound cargo (thousands)
Source Stats SA
The seasonally adjusted payload decreased by darr07 in the three months ended July 2021 compared with
the previous three months Road freight decreased by darr06 and rail freight decreased by darr13 The
summary can be seen in the following table showing that the current seasonally adjusted domestic payload
split is 2179 in favour of road transport as highlighted elsewhere in this report
Table 6 ndash South African border closures
Payload Feb-Apr 2021 (000 tons)
Weight May-Jul 2021 (000 tons)
Change (3-months)
Share of total change ()
Rail 45 809 213 45 218 -13 -03
Road 168 761 787 167 769 -06 -05
Total 214 571 100 212 988 -07 -07
Source Stats SA
b Cross-border delays
The following events have caused some delays in the SADC region this week
bull This week delays continued at Beitbridge with long queues (up to 13km) and slow crossing times
Furthermore while the industry looks forward to opening the new parking area on 6 October
transporters are not happy with the proposed access fee of US$ 175 irrespective of direction or
load
bull The feedback from transporters has listed poor efficiency from government agencies together with
runners and clearing agents not working at night as the main drivers of the delays
bull Lastly some positive news comes from Zambia In response to the roadblocks and recurring delays
reported last week Zambias new Minister of Home Affairs has banned all police roadblocks except
14
for permanently authorised security blocks This positive move for trade facilitation should lead to
less extortion from truck drivers and motorists and improved transit times
Apart from these developments investigations continue into cross-border delays experienced at several
SADC border posts in the sub-region The following table uses geofencing data to summarise delays
experienced at various borders during the last week
Table 7 ndash Delays14 summary ndash Selected SADC borders
Countries Border Queue Time (hhmm)
Border Time (hhmm)
HGV Arrivals per day
HGV Tonnage per day
Weekly HGV Arrivals
HGV Delay Hours
Queue Time Delays
NamSA AriamsvleiNakop 200 900 100 3 000 700 24 640 1 400
SAZim Beit Bridge 9600 2500 943 28 290 6 601 151 823 633 696
MozZam CassacatizaMlolo 100 1600 60 1 800 420 5 880 420
ZamZim Chirundu 100 1700 616 18 480 4 312 64 680 4 312
MozMal Dedza 200 1700 50 1 500 350 5 250 700
SABot GroblersbrugMartins Drift 100 1200 400 12 000 2 800 28 000 2 800
ZamDRC Kasumbalesa 000 4600 592 17 760 4 144 165 760 0
ZamBot Kazungula 000 1900 212 6 360 1 484 25 228 0
SABot KopfonteinTlokweng 100 4800 100 3 000 700 32 200 700
MozZim MachipandaForbes 100 600 320 9 600 2 240 8 960 2 240
MozMal Milange 000 1900 40 1 200 280 4 760 0
ZimMoz Nyamapanda 100 200 100 3 000 700 0 700
SAMoz Ressano Garcia 1300 1800 400 12 000 2 800 44 800 36 400
SABot SkilpadshekPioneer Gate 1700 300 300 9 000 2 100 2 100 35 700
ZamZim Victoria Falls 100 500 114 3 420 798 2 394 798
MozMal ZobueMwanza 200 2200 100 3 000 700 14 000 1 400
4 647 139 410 32 529 642 075 721 266
Source TLC amp FESARTA week ending 21092021
The following graph shows the weekly change in cross-border times (and associated estimated cost) from
South Africas perspective As a recurring theme recently Beit Bridge continues to experience prolonged
crossing times as the industry awaits the opening of the new parking area on 6 October Cross-border road
transporters are hopeful of a marked improvement in the North-South corridor as the current dismal
situation is extremely detrimental for business
14 It should be noted that the root cause of the reported delays is uncertain at this point Moreover the delays may be multiple and widely distributed Therefore they cannot be exclusively attributed to a specific common cross-border problem since we do not have a transparent view of the entire border process in granular detail The causes of these bottlenecks typically include poor infrastructure road congestion and a lack of coordination between neighbouring countries and Customs (or OGA) stops among other trade obstacles
15
Figure 12 ndash Weekly cross-border delays and estimated cost from a South African border perspective (delay in hours cost in $ thousands)
Source TLC amp FESARTA week ending 21092021
The following figure depicts a similar picture to those above this time from a corridor perspective Again
significant transit delays on the North-South corridor have continued with the Trans Kalahari also
experiencing a sub-optimal week These two corridors have stood out recently as queue and transit times
on both have been exceptionally high
Figure 13 ndash Weekly cross-border delays and estimated cost from a corridor perspective (delay in hours cost in $ thousands)
Source TLC amp FESARTA week ending 21092021
-$2 000
$ 0
$2 000
$4 000
$6 000
$8 000
$10 000
$12 000
$14 000
0
20
40
60
80
100
120
$
20
per
ho
ur
Tho
usa
nd
s
Ho
urs
Cross-border Queue Times Cross-border Transit Time
Weekly Queue Time Delays Weekly Cost of Excess Border Delays
$- 200
$-
$ 200
$ 400
$ 600
$ 800
$1 000
$1 200
$1 400
0
5
10
15
20
25
Beira Corridor Dar Corridor MaputoCorridor
North-South Trans Kalahari Trans Oranje
$
20
per
ho
urTh
ou
san
ds
Ho
urs
Cross-border Queue Times Cross-border Transit Time
Weekly Queue Time Delays Weekly Cost of Excess Border Delays
16
In summary the cross-border queue time has averaged ~82 hours (rising by ~05 hours from last weeks
recorded time of ~77 hours) costing the transport industry an estimated $14 million (R230 million) This
weeks average cross-border transit times hovered around ~188 hours (rising by ~25 hours from the ~163
hours recorded last week) costing the transport industry ~$13 million (R205 million) As the table and
commentary above predicted border times have significantly increased from last week especially
throughout the North-South corridor As a result the total cost for the week amounts to ~R436 million
(down by ~R6 million or 14 from R443 million the previous week)
4 International Update
The following section provides some context of the global economy and the impact of COVID-19 on trade
In addition the section includes an update on (a) the global container industry and (b) the global aviation
industry
a Global container industry
i Global freight rates
After 22 consecutive weeks of increases Drewrys World Container Index (WCI) composite index stopped
its seemingly inexorable rise this week remaining steady at $10 377 per 40-ft container15 This settling of
rates comes following the announcements by CMA-CGM and Hapag-Lloyd that they would not continue to
increase spot rates as container prices on most trade lanes are at record highs But apart from exorbitant
freight rates surcharge levels are providing cause for concern as carriers seek to solve the crisis around
equipment and slot capacity Surcharges can be expected to persist even as rates begin to decline16
Consequently some lines have been accused of using creative pricing strategies as a cosmetic exercise to
disguise rate increases with surcharges as high as 80 of base freight rates not uncommon For the industry
in its entirety the following figure summarises the astonishing rise in the two-year spot price of the index
Figure 14 ndash World Container Index ndash Assessed by Drewry ($ per 40 ft container)
Source Drewry Ports and Terminal insights
15 Drewry Supply Chain Advisors 23092021 World Container Index 16 Baker J 22092021 Freight surcharges will remain even after rates ease
17
The average composite index now stands at a massive uarr329 higher compared to the same time last year
Furthermore the average composite index of the WCI for year-to-date is $6 888 per 40ft container which
is $4 492 higher than the five-year average of $2 396 Concerning the major transatlantic trade lanes freight
rates from Shanghai to Genoa gained uarr1 to reach $13 646 per 40ft box However spot rates from New
York to Rotterdam dropped darr8 to $1 107 Similarly Los Angeles to Shanghai and Shanghai to New York
fell darr3 and darr2 to reach $1 404 and $15 849 per 40ft box The other major lanes (Shanghai to Rotterdam
Rotterdam to Shanghai Shanghai to Los Angeles and Rotterdam to New York) remained stable at the
previous weekrsquos level Therefore Drewry expects rates to stay steady in the coming week But it must be
stressed again that the index does not account for rising surcharge levels
ii Further developments of note
Apart from the ongoing story of rising freight rates and port congestion mentioned above some additional
important developments occurred around the world this week including a further update on Ningbo
1 US West Coast congestion
a According to Marine Traffic efforts continue to clear the increased backlog on the US West
Coast with 70 container vessels still awaiting berthing on Friday17 But unfortunately ships
are arriving at the US west coast faster than their contents can be processed through the
system And with inventories low and needing replenishment there is little relief in sight18
Indeed some analysts predict the backlog will take months to clear19
b In an effort to alleviate the situation further the ports of Los Angeles and Long Beach are
extending gate hours during nights and weekends Los Angeles is expanding gate hours on
weekends while Long Beach keeps its gates open between 0200 and 070020
c Moreover the Port of Long Beach is instituting a pilot program for 24-hour cargo pick-up at
Pier T Terminal21 The pilot program will focus on the effort to reduce dwell time
2 CMA CGM confirms data leak after cyber-attack
a Another cyber-attack struck the shipping industry this time with the French carrier CMA
CGM reporting a leak involving limited customr information including employees names
positions email and phone details22
b Paul Dean global head of shipping at HFW said that There is one incident on a ship every
day and attacks on shipping have increased 900 in the three years to 2020 Almost
unbelievably this correlates into a ransomware attack once every 10 seconds23
3 IMO defrauded by North Korea vessel identity laundering scheme
a Washington DC non-profit C4ADS says the integrity of IMO ship registration is threatened
by elaborate and detailed plans that see sanctions-busting ships from North Korea Iran and
Venezuela transmitting under false IMO identities24
b The inquiry has revealed a process where vessels adopt a different identity on automatic
identification system (AIS) transmissions allowing sanctions-hit ships to adopt clean
identities25
17 Marine Traffic 24092021 Port of Los Angeles 18 Baker J 21092021 Box ships continue to pile up off US west coast 19 Baker J 23092021 US port congestion lsquowill take months to clearrsquo 20 Putzger I 21092021 LA amp Long Beach ports extend gate hours to curb congestion 21 Manadiar H 21092021 Port of Long Beach starts pilot program for 24-hour cargo pick up at its Pier T Terminal 22 Lloydrsquos List 19092021 CMA CGM confirms data leak after cyber-attack 23 Baker J 20092021 Shipping needs to be vigilant over cyber risks 24 Wiese Bockmann M 23092021 IMO lsquodefraudedrsquo by North Korea vessel identity laundering scheme 25 Chambers S 24092021 New report highlights the rise of vessel identity laundering
18
b Global aviation industry
Air cargo continues to report robust growth figures as industry-wide cargo tonne-kilometres (CTKs) rose by
uarr249 in the three months ended July 2021 compared to the same period in 2019 According to the latest
quarterly Cargo Chartbook these figures note that an upward trend in air cargo volumes continued in the
past three months Still seasonally adjusted numbers show the growth has slowed compared to early 2021
Nevertheless air cargo continues to perform strongly in the global goods trade as shown in the following
figure
Figure 15 ndash Air cargo growth and performance 2021 Q3 (yy growth)
Source IATA Economics
IATA notes that air cargo had been underperforming goods trade since late 2018 but this inverted in 2021
Air now benefits from the need of businesses to rapidly restock their inventories as economies reopen after
lockdowns In addition rapidly increasing sea freight costs and transit times have played their part This
situation is likely to continue for some time as many drivers of air cargo continue to be supportive despite
the spread of the Delta variant and supply chain congestion The major constraint in the industry continues
to be the capacity issue mainly due to the lack of belly space on international passenger flights as depicted
below
19
Figure 16 ndash Air cargo growth and performance 2021 Q3 (yy growth)
Source IATA Economics
Consequently international available Industry-wide cargo tonne-kilometres (ACTKs) have trended sideways
since the start of 2021 Airlines have increased dedicated freighters ACTKs to bulk up capacity by uarr276
compared to 2019 in the three months ended July 2021 However the increase in freighter capacity has not
offset reduced space availability as international belly ACTKs were darr395 over the same period
Fortunately cargo yields are trending upwards again providing support to cargo revenues although at a
cost to shippers who are simultaneously grappling with elevated ocean freight rates Lastly the upward
trends are expected to continue as 72 of respondents expected air cargo volumes to keep increasing in
the twelve months according to the heads of air cargo questioned in the IATA Confidence Survey26
26 IATA 30072021 Confidence Survey

2
bull Average cross-border queue time rose by uarr05 hrs with transit times also rising (uarr25 hrs see
below)
bull Rail cargo moved through Durban this week amounted to 3 489 containers darr24 from last week
bull The WCI remained stable for the first time in 23 weeks currently at $10 377 per 40-ft
bull Industry-wide cargo tonne-kilometres (CTKs) rose by uarr249 in the three months ended July 2021
Executive Summary
This update ndash the 57th of its kind ndash contains a consolidated overview of the South African supply chain and
the current state of international trade As an ongoing initiative created because of COVID-19 the industry
is pleased to see the back of the third wave as this week saw another decrease in positive cases Newly
reported COVID-19 infections averaged approximately 2 667 per day (darr39 from last weeks average 4 339)
As a result the total number of cases recorded in the country now stands at 292 million6 with the death
toll at 86 655 (up by 876 ndash which has reduced markedly in recent months) Indeed South Africa is moving
closer to normality as indicated by an increase in the normalcy index7 (up by 57 to 677 in the last two
weeks) Globally COVID-19 infections total more than 231 million with the death toll nearing 47 million
people
On the vaccination front more than 606 billion vaccine doses have now been administered worldwide8 For
South Africa this figure stands at ~167 million with a daily average of ~140 000 doses administered in the
past seven days falling well short of the daily target Fortunately as we have reported previously access to
vaccines is no longer an issue which is regrettably not the case for the rest of Africa and the developing
world This issue has become contentious globally with many fully vaccinated individuals in the developed
world now receiving booster shots In contrast others in the less developed world still have little prospect
of being vaccinated As UN Secretary-General Antonio Guterres said this week This is a moral indictment
of the state of our world It is an obscenity We passed the science test But we are getting an F in ethics9
Operationally our ports registered a satisfactory week number-wise Bar some delays at CTCT on Monday
the weather also played its part throughout the week as there were few weather-enforced delays The
seemingly ongoing issues with equipment were also less prevalent this week as the industry received few
reports of operational disruptions because of equipment breakdown and maintenance schedules These
issues were especially noticeable at the Port of Cape Town The industry is hopeful of continued
improvement in this regard However as we have said previously there needs to be a concerted drive to
streamline the procurement and maintenance of equipment as the constraints are often outside the control
of the departments using the equipment Lastly discussions took place this week regarding the
establishment of a container terminal at the Durban Point Precinct
On the rail cargo front cable theft continues to be an issue as TFR reported 38 cable theft cases on the
Container (formerly NATCOR) line over the previous weekend In a Transport Forum discussion Prof Jan
Havenga this week pointed out that South Africa could save its rail cargo industry as there is a significant
amount of rail-friendly cargo that should transfer from road freight to rail freight According to Stats SA
the current seasonally adjusted payload split is 2179 in favour of road Optimistically various stakeholders
appear to be determined efforts to get the rail industry running at full throttle once more The increased
possibility of third-party concessions is also encouraging
6 Johns Hopkins Coronavirus Resource Centre Coronavirus JJHU 7 Economist 13072021 The global normalcy index 8 Our World in Data Coronavirus (COVID-19) Vaccinations Our World in Data 9 Guterres A 21092021 UN chief grades world on vaccine rollout F in Ethics
3
Globally for the first time in 23 weeks the container industry did not see a rise in freight rates However
there is no immediate prospect of a reprieve for shippers as surcharges continue to impact the overall
freight cost while carriers seek to handle the crisis in equipment and slot capacity and these surcharges are
unlikely to disappear even as rates start to decline Other notable developments internationally include (1)
an update on congestion on the US West Coast (which remains clogged) with extended hours implemented
(2) another cyber-attack (CMA-CGM) and (3) The IMO defrauded by a North Korean vessel in a laundering
scheme (see the detailed summary below)
In the aviation sector domestic and international volumes increased by uarr4 this week which has continued
the recent overall trend Internationally the upward trend in air cargo volumes continued in the past three
months even though seasonally adjusted numbers show the growth has slowed compared with early 2021
At the same time the industry continues to experience a capacity crunch with high load factors and limited
belly hold capacity due largely to the primarily grounded passenger fleets Nevertheless growth drivers
support air cargo in the near term which will be boosted once passenger flights return to the sky ndash currently
at 42 capacity levels compared to 2019
Finally in concluding this edition the extended supply chain keeps hovering in positive territory statistically
even if only slightly The concerted efforts of most parties active in operations continue as do the moves to
expedite and harmonise border processes and facilitate international trade For example on the truck
booking system at Durban there is work being done by BUSA SAAFF Transnet and other stakeholders to
address the high level of cancellation of truck bookings We cannot afford to lose focus in these challenging
times As the Chinese proverb has it when the winds of change blow some people build walls others build
windmills Most industry role players are working overtime to build windmills However it remains critical
to ensure that any improvements made in securing our supply chain are maintained across the board
4
Contents
Weekly Snapshot 1
Monthly Snapshot 1
Key Notes 1
Executive Summary 2
Contents 4
1 Ports Update 5
a Container flow overview 5
b Summary of port operations 8
i Weather delays 8
ii Cape Town 8
iii Durban 8
iv Transnet Freight Rail (TFR) 9
v General 10
2 Air Update 10
a International air cargo 10
b Domestic air cargo 11
3 Road and regional Update 12
a South African land transport 12
b Cross-border delays 13
4 International Update 16
a Global container industry 16
i Global freight rates 16
ii Further developments of note 17
b Global aviation industry 18
5
1 Ports Update
This section provides an overview of the flow of containerised cargo through South Africas commercial
ports
a Container flow overview
The following table indicates the container flows reported for the last seven days and projections for the
next seven days
Table 2 ndash Container Ports ndash Weekly flow reported for 18 to 24 September 10
7-day flow forecast (18092021 ndash 24092021)
TERMINAL NO OF CONTAINERS TO DISCHARGE (IMPORT)
NO OF CONTAINERS TO LOAD (EXPORT)
DURBAN CONTAINER TERMINAL PIER 1 5 293 4 935
DURBAN CONTAINER TERMINAL PIER 2 13 199 12 456
CAPE TOWN CONTAINER TERMINAL 6 174 6 073
NGQURA CONTAINER TERMINAL 3 835 4 785
GQEBERHA CONTAINER TERMINAL 225 1 125
TOTAL 28 726 29 374
Source Transnet 2021 Updated 24092021
Table 3 ndash Container Ports ndash Weekly flow reported for 25 September to 1 October 11
7-day flow forecast (25092021 ndash 01102021)
TERMINAL NO OF CONTAINERS TO DISCHARGE (IMPORT)
NO OF CONTAINERS TO LOAD (EXPORT)
DURBAN CONTAINER TERMINAL PIER 1 5 938 7 543
DURBAN CONTAINER TERMINAL PIER 2 13 588 15 774
CAPE TOWN CONTAINER TERMINAL 4 490 6 405
NGQURA CONTAINER TERMINAL 5 088 8 379
GQEBERHA CONTAINER TERMINAL 909 1 480
TOTAL 30 013 39 581
Source Transnet 2021 Updated 24092021
An average of ~8 300 TEUs (uarr3) was handled per day for the last week (18 ndash 24 September Table 2) with
another increased average of around ~9 942 TEUs (uarr20) projected to be handled next week (25 September
ndash 1 October Table 3) Fortunately the numbers show that performance has increased in the last few weeks
Nevertheless we are still somewhat off the targets set as some operational problems continue to bedevil
the system On the positive side public-private stakeholder engagement continues to grow and improve
which has been a real shining light in an otherwise dim sky during the pandemic
For a holistic picture the following figure displays the rolling monthly average flow of total containerised
cargo movement for our commercial ports since the start of the nationwide lockdown A full breakdown of
the TNPA figures reported for August will be provided in next weeks edition
10 It remains important to note that a fair percentage (approximately 29 according to the most recent TNPA figures for July) of containers are neither imported nor exported but rather consist of empties Due to the ongoing container imbalances this proportion is fluctuating more than usual and has increased since December 2020 11 As notes above
6
Figure 3 ndash Monthly flow reported for total cargo movement (TEUs April 2020 to present month on month)
Source Calculated using data from Transnet 2021 Updated 24092021
The figures below show the weekly container flows for the previous seven days and projections for the next
seven days
Figure 4 ndash 7-day flow reported for total cargo movement (18 to 24 September per port day on day)
Source Calculated using data from Transnet 2021 Updated 24092021
0
50
100
150
200
250
300
350
Tho
usa
nd
s
DURBAN CONTAINER TERMINAL PIER 1 DURBAN CONTAINER TERMINAL PIER 2
CAPE TOWN CONTAINER TERMINAL NGQURA CONTAINER TERMINAL
GQEBERHA CONTAINER TERMINAL
0
500
1 000
1 500
2 000
2 500
3 000
3 500
4 000
4 500
5 000
18-Sep 19-Sep 20-Sep 21-Sep 22-Sep 23-Sep 24-Sep
Durban Container Terminal Pier 1 Durban Container Terminal Pier 2
Cape Town Container Terminal Ngqura Container Terminal
Gqeberha Container Terminal
7
Figure 5 ndash 7-day flow reported for total cargo movement (25 September to 1 October per port day on day)
Source Calculated using data from Transnet 2021 Updated 24092021
The following figure shows daily stack occupancy in both Durban terminals since the end of June with
pressure on operational fluidity a constant in the last few months Despite the onslaught landside
performance in the container yard has managed to keep up with both piers hovering around the optimal
65 stack occupancy level (with some fluctuations) in the last three weeks
Figure 6 ndash Stack occupancy in DCT general-purpose containers (23 August to present per pier day on day)
Source Calculated using data from Transnet 2021 Updated 24092021
0
500
1 000
1 500
2 000
2 500
3 000
3 500
4 000
4 500
5 000
5 500
6 000
25-Sep 26-Sep 27-Sep 28-Sep 29-Sep 30-Sep 01-Oct
Durban Container Terminal Pier 1 Durban Container Terminal Pier 2
Cape Town Container Terminal Ngqura Container Terminal
Gqeberha Container Terminal
0
10
20
30
40
50
60
70
80
90
11-Sep 12-Sep 13-Sep 14-Sep 15-Sep 16-Sep 17-Sep 18-Sep 19-Sep 20-Sep 21-Sep 22-Sep 23-Sep 24-Sep
Pier 1 Pier 2 Threshold
8
b Summary of port operations
The following sections provide a more in-depth overview of the operational performance of our commercial
ports over the last seven days
i Weather delays
This week started quite windy in Cape Town Fortunately waterside operations were affected only slightly
throughout the week
This week Durban port experienced much more favourable weather conditions with slightly stronger winds
picking up on Thursday afternoon coupled with some light rain
Waterside operations were challenged on Monday with strong WSW winds causing vessel ranging
However the wind moderated as the week progressed
ii Cape Town
Waterside operations were exceptionally challenging this week due to equipment shortages and labour
issues On Monday morning MPT Cape Town was operating with ships gear only as no mobile harbour cranes
were operational Only one crane was scheduled to be operational by Monday mid-morning Port
stakeholders further complained that the container stevedoring service employed by Transnet working on
container vessels especially at MPT was not efficient Allegations are that the personnel are inadequately
equipped and poorly trained Similar concerns were raised at other ports At Cape Town MPT stack
occupancy stood at 28 capacity for general-purpose containers and 20 for reefer containers
iii Durban
The terminals at Durban were also struggling to operate efficiently due to limited equipment and high stack
occupancy In addition DCT experienced tug availability issues over the previous weekend with a vessel at
FPT unable to move which subsequently delayed the berthing of a conventional reefer vessel waiting to
load citrus Furthermore the Durban port helicopter was reported out of service pending the arrival of
spares on Monday A total of 1474 gate moves were recorded on Monday at Pier 1 with 539 shifts 876
cancelled slots and 167 wasted slots At Pier 2 2 429 gate moves were recorded with 1 508 cancelled slots
350 wasted slots and 970 shifts
On Thursday Transnet announced that they were approaching the market to launch a Request for
Information (RFI) process regarding establishing a container terminal at the Point Precinct The RFI process
is for the design development financing construction operation and maintenance of such a container
terminal Once the interest and feasibility have been confirmed through the RFI process an open Request
for Proposal (RFP) process will follow On Thursday Pier 1 recorded 1305 gate moves 773 cancelled slots
221 wasted slots and 576 shifts In addition an accident on Sydney Road caused tipper trucks destined for
Maydon Warf to block the steel and Khongela bridges causing much-unwanted congestion in the area On
Friday stack occupancy at Pier 2 stood at 83 capacity for reefer containers and 55 at Pier 1
The following figure summarises port operations in Durban for the last two weeks focusing on gate moves
and time spent in the terminal
9
Figure 7 ndash Gate moves and time spent in the terminal (in minutes)
Source Calculated using data from Transnet 2021 Updated 24092021
iv Transnet Freight Rail (TFR)
Increasing reports of cable theft continue to raise significant concerns around the productivity of operations
at TFR TFR reported 38 cases of cable theft on the Container line over the previous weekend On
Wednesday Transnet informed its customers that they were experiencing OHTE power failure between
Union and Elsburg stations All trains were hauled by diesel locomotives through the dead section and delays
in train arrivals and departures from the Reef were experienced as a result
The following figure graphically illustrates the rail movement from Durban during the week showing a
notable decrease
Figure 8 ndash TFR Rail handled (Pier 1 and Pier 2)
Source Calculated using data from Transnet 2021 Updated 24092021
0
50
100
150
200
250
300
350
0
500
1000
1500
2000
2500
3000
3500
4000
4500
5000
11-Sep 12-Sep 13-Sep 14-Sep 15-Sep 16-Sep 17-Sep 18-Sep 19-Sep 20-Sep 21-Sep 22-Sep 23-Sep 24-Sep
Min
ute
s
Mo
ves
Pier 1 Gate Moves Pier 2 Gate Moves
Pier 1 Demonstrated Capacity Gate Moves Pier 2 Demonstrated Capacity Gate Moves
Pier 1 Time spent in port Pier 2 Time spent in port
Pier 2
Pier 1
0
50
100
150
200
250
300
350
400
450
18-Sep 19-Sep 20-Sep 21-Sep 22-Sep 23-Sep 24-Sep
Pier 1 Inbound Pier 1 Outbound Pier 2 Inbound Pier 2 Outbound
10
This week (18 to 24 September) rail cargo handled out of Durban averaged around 178 containers inbound
(45 for Pier 1 and 133 for Pier 2) and 392 containers outbound (46 for Pier 1 and 346 for Pier 2) per day
Total rail cargo moved through Durban for the week amounts to 3 489 containers darr24 lower than the
previous weeks 4 564 containers
v General
On Monday port users were urged by Transnet to properly process Cargo Dues on the Cash to Order system
as an increased number of abnormalities regarding the capturing of certain fields for Automotive and Break
Bulk cargo was noted Transnet also notified port users and other customers that they planned a National
search on Wednesday 22 September 2021 to search for missing containers
2 Air Update
a International air cargo
The following table shows the in- and outbound air cargo flows to and from ORTIA for the week starting 13
September For comparative purposes the average air freight cargo (inbound and outbound) handled at
ORTIA in September 2020 averaged ~731 369 kg per day For 2019 this average was ~900 778 kg per day
which is probably a more meaningful comparison and illustrates the extent to which volumes have fallen
over the last 18 months
Table 4 ndash International inbound and outbound cargo from OR Tambo
Flows 13-Sep 14-Sep 15-Sep 16-Sep 17-Sep 18-Sep 19-Sep
Volume inbound 568 230 312 739 449 723 456 725 381 939 356 069 885 843
Volume outbound 311 766 196 911 243 786 169 601 232 169 310 226 719 538
Total handled per day 879 996 509 650 693 509 626 326 614 108 666 295 1 605 381
Courtesy of ACOC Updated 22092021
The daily average volume of air cargo handled at ORTIA over the seven days starting 13 September
amounted to 487 324 kg inbound and 312 000 kg outbound This amounts to an average of 799 324kg per
day or ~115 compared to August 2020 Compared to pre-COVID-19 times the level is currently only at
~81 compared with the same period in 2019
The following figure shows monthly international freight movement at ORTIA during the state of disaster
11
Figure 9 ndash International inbound and outbound cargo from OR Tambo (thousands)
Courtesy of ACOC Updated 22092021
b Domestic air cargo
The following table shows the domestic inbound and outbound air cargo flows for the duration of the
lockdown period as reported by the industry By way of comparison the average domestic air freight cargo
(inbound and outbound) for ORTIA handled in August 2020 was only ~59 559 kg12 per day
Table 5 ndash Total domestic inbound and outbound cargo
DATE AIRPORT CPT DUR ELS ORTIA PLZ OTHERS TOTAL
Mar-Dec rsquo20 Av 21 813 2 941 3 751 20 539 6 571 3 176 56 713
Jan Average 20 961 2 739 2 859 22 818 5 491 5 238 57 781
Feb Average 27 777 3 537 3 427 30 117 6 988 3 503 75 348
Mar Average 28 781 3 702 3 845 31 166 7 680 3 740 78 914
Apr Average 24 875 3 234 3 058 25 694 6 306 3 046 66 213
May Average 29 891 3 781 3 669 27 817 7 245 3 261 75 664
Jun Average 27 498 3 706 3 556 26 873 7 086 3 213 71 932
Jul Average 23 583 5 374 3 144 15 839 6 229 2 844 57 013
Aug Average 25 649 2 983 3 495 19 973 6 597 3 256 61 953
Sep Average 27 131 3 820 3 485 21 217 6 894 3 191 65 739
14-Sep-21 38 387 5 286 4 829 37 916 9 652 4 959 101 029
15-Sep-21 42 033 5 205 5 082 28 559 13 786 3 579 98 242
16-Sep-21 39 112 5 652 4 367 26 360 10 910 4 951 91 352
17-Sep-21 19 324 3 283 2 783 33 154 4 616 2 976 66 136
18-Sep-21 2 600 1 021 53 2 061 371 129 6 235
19-Sep-21 3 303 296 169 811 403 754 5 735
20-Sep-21 52 387 5 794 6 142 31 282 11 946 6 310 113 861
Y-T-D Totals 6 886 416 959 597 891 439 6 490 597 1 765 825 846 088 17 839 961
12 For Cape Town the figure corresponds to 34 369 kg per day and 3 129 kg per day for Durban during the same period (July 2020)
0
100
200
300
400
500
600
Inbound Outbound Linear (Inbound) Linear (Outbound)
12
Courtesy of BAC Updated 23092021
Currently the average domestic air cargo moved in the last week was ~68 941 kg per day which is uarr4
compared with the previous week and ~107 compared to September 2020
The following figure shows monthly domestic freight movement at our commercial airports during the state
of disaster with an upward trend in volumes registered since the start of the year
Figure 10 ndash Average domestic inbound and outbound cargo (thousands)
Courtesy of BAC Updated 23092021
3 Road and regional Update
a South African land transport
This week Stats SA released the monthly land transport statistics for July13 The headline figure shows that
the volume of goods transported (payload) decreased by darr47 in July 2021 compared with July 2020 Over
the same period the corresponding income also reduced this time around by darr31 The following figures
note the bi-monthly percentage change in the freight transportation sector
13 Stats SA 20092021 Land transport
-
5
10
15
20
25
30
35
Tho
usa
nd
s
CPT DUR ELS JNB
PLZ OTHERS Linear (CPT) Linear (JNB)
13
Figure 11 ndash Average domestic inbound and outbound cargo (thousands)
Source Stats SA
The seasonally adjusted payload decreased by darr07 in the three months ended July 2021 compared with
the previous three months Road freight decreased by darr06 and rail freight decreased by darr13 The
summary can be seen in the following table showing that the current seasonally adjusted domestic payload
split is 2179 in favour of road transport as highlighted elsewhere in this report
Table 6 ndash South African border closures
Payload Feb-Apr 2021 (000 tons)
Weight May-Jul 2021 (000 tons)
Change (3-months)
Share of total change ()
Rail 45 809 213 45 218 -13 -03
Road 168 761 787 167 769 -06 -05
Total 214 571 100 212 988 -07 -07
Source Stats SA
b Cross-border delays
The following events have caused some delays in the SADC region this week
bull This week delays continued at Beitbridge with long queues (up to 13km) and slow crossing times
Furthermore while the industry looks forward to opening the new parking area on 6 October
transporters are not happy with the proposed access fee of US$ 175 irrespective of direction or
load
bull The feedback from transporters has listed poor efficiency from government agencies together with
runners and clearing agents not working at night as the main drivers of the delays
bull Lastly some positive news comes from Zambia In response to the roadblocks and recurring delays
reported last week Zambias new Minister of Home Affairs has banned all police roadblocks except
14
for permanently authorised security blocks This positive move for trade facilitation should lead to
less extortion from truck drivers and motorists and improved transit times
Apart from these developments investigations continue into cross-border delays experienced at several
SADC border posts in the sub-region The following table uses geofencing data to summarise delays
experienced at various borders during the last week
Table 7 ndash Delays14 summary ndash Selected SADC borders
Countries Border Queue Time (hhmm)
Border Time (hhmm)
HGV Arrivals per day
HGV Tonnage per day
Weekly HGV Arrivals
HGV Delay Hours
Queue Time Delays
NamSA AriamsvleiNakop 200 900 100 3 000 700 24 640 1 400
SAZim Beit Bridge 9600 2500 943 28 290 6 601 151 823 633 696
MozZam CassacatizaMlolo 100 1600 60 1 800 420 5 880 420
ZamZim Chirundu 100 1700 616 18 480 4 312 64 680 4 312
MozMal Dedza 200 1700 50 1 500 350 5 250 700
SABot GroblersbrugMartins Drift 100 1200 400 12 000 2 800 28 000 2 800
ZamDRC Kasumbalesa 000 4600 592 17 760 4 144 165 760 0
ZamBot Kazungula 000 1900 212 6 360 1 484 25 228 0
SABot KopfonteinTlokweng 100 4800 100 3 000 700 32 200 700
MozZim MachipandaForbes 100 600 320 9 600 2 240 8 960 2 240
MozMal Milange 000 1900 40 1 200 280 4 760 0
ZimMoz Nyamapanda 100 200 100 3 000 700 0 700
SAMoz Ressano Garcia 1300 1800 400 12 000 2 800 44 800 36 400
SABot SkilpadshekPioneer Gate 1700 300 300 9 000 2 100 2 100 35 700
ZamZim Victoria Falls 100 500 114 3 420 798 2 394 798
MozMal ZobueMwanza 200 2200 100 3 000 700 14 000 1 400
4 647 139 410 32 529 642 075 721 266
Source TLC amp FESARTA week ending 21092021
The following graph shows the weekly change in cross-border times (and associated estimated cost) from
South Africas perspective As a recurring theme recently Beit Bridge continues to experience prolonged
crossing times as the industry awaits the opening of the new parking area on 6 October Cross-border road
transporters are hopeful of a marked improvement in the North-South corridor as the current dismal
situation is extremely detrimental for business
14 It should be noted that the root cause of the reported delays is uncertain at this point Moreover the delays may be multiple and widely distributed Therefore they cannot be exclusively attributed to a specific common cross-border problem since we do not have a transparent view of the entire border process in granular detail The causes of these bottlenecks typically include poor infrastructure road congestion and a lack of coordination between neighbouring countries and Customs (or OGA) stops among other trade obstacles
15
Figure 12 ndash Weekly cross-border delays and estimated cost from a South African border perspective (delay in hours cost in $ thousands)
Source TLC amp FESARTA week ending 21092021
The following figure depicts a similar picture to those above this time from a corridor perspective Again
significant transit delays on the North-South corridor have continued with the Trans Kalahari also
experiencing a sub-optimal week These two corridors have stood out recently as queue and transit times
on both have been exceptionally high
Figure 13 ndash Weekly cross-border delays and estimated cost from a corridor perspective (delay in hours cost in $ thousands)
Source TLC amp FESARTA week ending 21092021
-$2 000
$ 0
$2 000
$4 000
$6 000
$8 000
$10 000
$12 000
$14 000
0
20
40
60
80
100
120
$
20
per
ho
ur
Tho
usa
nd
s
Ho
urs
Cross-border Queue Times Cross-border Transit Time
Weekly Queue Time Delays Weekly Cost of Excess Border Delays
$- 200
$-
$ 200
$ 400
$ 600
$ 800
$1 000
$1 200
$1 400
0
5
10
15
20
25
Beira Corridor Dar Corridor MaputoCorridor
North-South Trans Kalahari Trans Oranje
$
20
per
ho
urTh
ou
san
ds
Ho
urs
Cross-border Queue Times Cross-border Transit Time
Weekly Queue Time Delays Weekly Cost of Excess Border Delays
16
In summary the cross-border queue time has averaged ~82 hours (rising by ~05 hours from last weeks
recorded time of ~77 hours) costing the transport industry an estimated $14 million (R230 million) This
weeks average cross-border transit times hovered around ~188 hours (rising by ~25 hours from the ~163
hours recorded last week) costing the transport industry ~$13 million (R205 million) As the table and
commentary above predicted border times have significantly increased from last week especially
throughout the North-South corridor As a result the total cost for the week amounts to ~R436 million
(down by ~R6 million or 14 from R443 million the previous week)
4 International Update
The following section provides some context of the global economy and the impact of COVID-19 on trade
In addition the section includes an update on (a) the global container industry and (b) the global aviation
industry
a Global container industry
i Global freight rates
After 22 consecutive weeks of increases Drewrys World Container Index (WCI) composite index stopped
its seemingly inexorable rise this week remaining steady at $10 377 per 40-ft container15 This settling of
rates comes following the announcements by CMA-CGM and Hapag-Lloyd that they would not continue to
increase spot rates as container prices on most trade lanes are at record highs But apart from exorbitant
freight rates surcharge levels are providing cause for concern as carriers seek to solve the crisis around
equipment and slot capacity Surcharges can be expected to persist even as rates begin to decline16
Consequently some lines have been accused of using creative pricing strategies as a cosmetic exercise to
disguise rate increases with surcharges as high as 80 of base freight rates not uncommon For the industry
in its entirety the following figure summarises the astonishing rise in the two-year spot price of the index
Figure 14 ndash World Container Index ndash Assessed by Drewry ($ per 40 ft container)
Source Drewry Ports and Terminal insights
15 Drewry Supply Chain Advisors 23092021 World Container Index 16 Baker J 22092021 Freight surcharges will remain even after rates ease
17
The average composite index now stands at a massive uarr329 higher compared to the same time last year
Furthermore the average composite index of the WCI for year-to-date is $6 888 per 40ft container which
is $4 492 higher than the five-year average of $2 396 Concerning the major transatlantic trade lanes freight
rates from Shanghai to Genoa gained uarr1 to reach $13 646 per 40ft box However spot rates from New
York to Rotterdam dropped darr8 to $1 107 Similarly Los Angeles to Shanghai and Shanghai to New York
fell darr3 and darr2 to reach $1 404 and $15 849 per 40ft box The other major lanes (Shanghai to Rotterdam
Rotterdam to Shanghai Shanghai to Los Angeles and Rotterdam to New York) remained stable at the
previous weekrsquos level Therefore Drewry expects rates to stay steady in the coming week But it must be
stressed again that the index does not account for rising surcharge levels
ii Further developments of note
Apart from the ongoing story of rising freight rates and port congestion mentioned above some additional
important developments occurred around the world this week including a further update on Ningbo
1 US West Coast congestion
a According to Marine Traffic efforts continue to clear the increased backlog on the US West
Coast with 70 container vessels still awaiting berthing on Friday17 But unfortunately ships
are arriving at the US west coast faster than their contents can be processed through the
system And with inventories low and needing replenishment there is little relief in sight18
Indeed some analysts predict the backlog will take months to clear19
b In an effort to alleviate the situation further the ports of Los Angeles and Long Beach are
extending gate hours during nights and weekends Los Angeles is expanding gate hours on
weekends while Long Beach keeps its gates open between 0200 and 070020
c Moreover the Port of Long Beach is instituting a pilot program for 24-hour cargo pick-up at
Pier T Terminal21 The pilot program will focus on the effort to reduce dwell time
2 CMA CGM confirms data leak after cyber-attack
a Another cyber-attack struck the shipping industry this time with the French carrier CMA
CGM reporting a leak involving limited customr information including employees names
positions email and phone details22
b Paul Dean global head of shipping at HFW said that There is one incident on a ship every
day and attacks on shipping have increased 900 in the three years to 2020 Almost
unbelievably this correlates into a ransomware attack once every 10 seconds23
3 IMO defrauded by North Korea vessel identity laundering scheme
a Washington DC non-profit C4ADS says the integrity of IMO ship registration is threatened
by elaborate and detailed plans that see sanctions-busting ships from North Korea Iran and
Venezuela transmitting under false IMO identities24
b The inquiry has revealed a process where vessels adopt a different identity on automatic
identification system (AIS) transmissions allowing sanctions-hit ships to adopt clean
identities25
17 Marine Traffic 24092021 Port of Los Angeles 18 Baker J 21092021 Box ships continue to pile up off US west coast 19 Baker J 23092021 US port congestion lsquowill take months to clearrsquo 20 Putzger I 21092021 LA amp Long Beach ports extend gate hours to curb congestion 21 Manadiar H 21092021 Port of Long Beach starts pilot program for 24-hour cargo pick up at its Pier T Terminal 22 Lloydrsquos List 19092021 CMA CGM confirms data leak after cyber-attack 23 Baker J 20092021 Shipping needs to be vigilant over cyber risks 24 Wiese Bockmann M 23092021 IMO lsquodefraudedrsquo by North Korea vessel identity laundering scheme 25 Chambers S 24092021 New report highlights the rise of vessel identity laundering
18
b Global aviation industry
Air cargo continues to report robust growth figures as industry-wide cargo tonne-kilometres (CTKs) rose by
uarr249 in the three months ended July 2021 compared to the same period in 2019 According to the latest
quarterly Cargo Chartbook these figures note that an upward trend in air cargo volumes continued in the
past three months Still seasonally adjusted numbers show the growth has slowed compared to early 2021
Nevertheless air cargo continues to perform strongly in the global goods trade as shown in the following
figure
Figure 15 ndash Air cargo growth and performance 2021 Q3 (yy growth)
Source IATA Economics
IATA notes that air cargo had been underperforming goods trade since late 2018 but this inverted in 2021
Air now benefits from the need of businesses to rapidly restock their inventories as economies reopen after
lockdowns In addition rapidly increasing sea freight costs and transit times have played their part This
situation is likely to continue for some time as many drivers of air cargo continue to be supportive despite
the spread of the Delta variant and supply chain congestion The major constraint in the industry continues
to be the capacity issue mainly due to the lack of belly space on international passenger flights as depicted
below
19
Figure 16 ndash Air cargo growth and performance 2021 Q3 (yy growth)
Source IATA Economics
Consequently international available Industry-wide cargo tonne-kilometres (ACTKs) have trended sideways
since the start of 2021 Airlines have increased dedicated freighters ACTKs to bulk up capacity by uarr276
compared to 2019 in the three months ended July 2021 However the increase in freighter capacity has not
offset reduced space availability as international belly ACTKs were darr395 over the same period
Fortunately cargo yields are trending upwards again providing support to cargo revenues although at a
cost to shippers who are simultaneously grappling with elevated ocean freight rates Lastly the upward
trends are expected to continue as 72 of respondents expected air cargo volumes to keep increasing in
the twelve months according to the heads of air cargo questioned in the IATA Confidence Survey26
26 IATA 30072021 Confidence Survey

5
1 Ports Update
This section provides an overview of the flow of containerised cargo through South Africas commercial
ports
a Container flow overview
The following table indicates the container flows reported for the last seven days and projections for the
next seven days
Table 2 ndash Container Ports ndash Weekly flow reported for 18 to 24 September 10
7-day flow forecast (18092021 ndash 24092021)
TERMINAL NO OF CONTAINERS TO DISCHARGE (IMPORT)
NO OF CONTAINERS TO LOAD (EXPORT)
DURBAN CONTAINER TERMINAL PIER 1 5 293 4 935
DURBAN CONTAINER TERMINAL PIER 2 13 199 12 456
CAPE TOWN CONTAINER TERMINAL 6 174 6 073
NGQURA CONTAINER TERMINAL 3 835 4 785
GQEBERHA CONTAINER TERMINAL 225 1 125
TOTAL 28 726 29 374
Source Transnet 2021 Updated 24092021
Table 3 ndash Container Ports ndash Weekly flow reported for 25 September to 1 October 11
7-day flow forecast (25092021 ndash 01102021)
TERMINAL NO OF CONTAINERS TO DISCHARGE (IMPORT)
NO OF CONTAINERS TO LOAD (EXPORT)
DURBAN CONTAINER TERMINAL PIER 1 5 938 7 543
DURBAN CONTAINER TERMINAL PIER 2 13 588 15 774
CAPE TOWN CONTAINER TERMINAL 4 490 6 405
NGQURA CONTAINER TERMINAL 5 088 8 379
GQEBERHA CONTAINER TERMINAL 909 1 480
TOTAL 30 013 39 581
Source Transnet 2021 Updated 24092021
An average of ~8 300 TEUs (uarr3) was handled per day for the last week (18 ndash 24 September Table 2) with
another increased average of around ~9 942 TEUs (uarr20) projected to be handled next week (25 September
ndash 1 October Table 3) Fortunately the numbers show that performance has increased in the last few weeks
Nevertheless we are still somewhat off the targets set as some operational problems continue to bedevil
the system On the positive side public-private stakeholder engagement continues to grow and improve
which has been a real shining light in an otherwise dim sky during the pandemic
For a holistic picture the following figure displays the rolling monthly average flow of total containerised
cargo movement for our commercial ports since the start of the nationwide lockdown A full breakdown of
the TNPA figures reported for August will be provided in next weeks edition
10 It remains important to note that a fair percentage (approximately 29 according to the most recent TNPA figures for July) of containers are neither imported nor exported but rather consist of empties Due to the ongoing container imbalances this proportion is fluctuating more than usual and has increased since December 2020 11 As notes above
6
Figure 3 ndash Monthly flow reported for total cargo movement (TEUs April 2020 to present month on month)
Source Calculated using data from Transnet 2021 Updated 24092021
The figures below show the weekly container flows for the previous seven days and projections for the next
seven days
Figure 4 ndash 7-day flow reported for total cargo movement (18 to 24 September per port day on day)
Source Calculated using data from Transnet 2021 Updated 24092021
0
50
100
150
200
250
300
350
Tho
usa
nd
s
DURBAN CONTAINER TERMINAL PIER 1 DURBAN CONTAINER TERMINAL PIER 2
CAPE TOWN CONTAINER TERMINAL NGQURA CONTAINER TERMINAL
GQEBERHA CONTAINER TERMINAL
0
500
1 000
1 500
2 000
2 500
3 000
3 500
4 000
4 500
5 000
18-Sep 19-Sep 20-Sep 21-Sep 22-Sep 23-Sep 24-Sep
Durban Container Terminal Pier 1 Durban Container Terminal Pier 2
Cape Town Container Terminal Ngqura Container Terminal
Gqeberha Container Terminal
7
Figure 5 ndash 7-day flow reported for total cargo movement (25 September to 1 October per port day on day)
Source Calculated using data from Transnet 2021 Updated 24092021
The following figure shows daily stack occupancy in both Durban terminals since the end of June with
pressure on operational fluidity a constant in the last few months Despite the onslaught landside
performance in the container yard has managed to keep up with both piers hovering around the optimal
65 stack occupancy level (with some fluctuations) in the last three weeks
Figure 6 ndash Stack occupancy in DCT general-purpose containers (23 August to present per pier day on day)
Source Calculated using data from Transnet 2021 Updated 24092021
0
500
1 000
1 500
2 000
2 500
3 000
3 500
4 000
4 500
5 000
5 500
6 000
25-Sep 26-Sep 27-Sep 28-Sep 29-Sep 30-Sep 01-Oct
Durban Container Terminal Pier 1 Durban Container Terminal Pier 2
Cape Town Container Terminal Ngqura Container Terminal
Gqeberha Container Terminal
0
10
20
30
40
50
60
70
80
90
11-Sep 12-Sep 13-Sep 14-Sep 15-Sep 16-Sep 17-Sep 18-Sep 19-Sep 20-Sep 21-Sep 22-Sep 23-Sep 24-Sep
Pier 1 Pier 2 Threshold
8
b Summary of port operations
The following sections provide a more in-depth overview of the operational performance of our commercial
ports over the last seven days
i Weather delays
This week started quite windy in Cape Town Fortunately waterside operations were affected only slightly
throughout the week
This week Durban port experienced much more favourable weather conditions with slightly stronger winds
picking up on Thursday afternoon coupled with some light rain
Waterside operations were challenged on Monday with strong WSW winds causing vessel ranging
However the wind moderated as the week progressed
ii Cape Town
Waterside operations were exceptionally challenging this week due to equipment shortages and labour
issues On Monday morning MPT Cape Town was operating with ships gear only as no mobile harbour cranes
were operational Only one crane was scheduled to be operational by Monday mid-morning Port
stakeholders further complained that the container stevedoring service employed by Transnet working on
container vessels especially at MPT was not efficient Allegations are that the personnel are inadequately
equipped and poorly trained Similar concerns were raised at other ports At Cape Town MPT stack
occupancy stood at 28 capacity for general-purpose containers and 20 for reefer containers
iii Durban
The terminals at Durban were also struggling to operate efficiently due to limited equipment and high stack
occupancy In addition DCT experienced tug availability issues over the previous weekend with a vessel at
FPT unable to move which subsequently delayed the berthing of a conventional reefer vessel waiting to
load citrus Furthermore the Durban port helicopter was reported out of service pending the arrival of
spares on Monday A total of 1474 gate moves were recorded on Monday at Pier 1 with 539 shifts 876
cancelled slots and 167 wasted slots At Pier 2 2 429 gate moves were recorded with 1 508 cancelled slots
350 wasted slots and 970 shifts
On Thursday Transnet announced that they were approaching the market to launch a Request for
Information (RFI) process regarding establishing a container terminal at the Point Precinct The RFI process
is for the design development financing construction operation and maintenance of such a container
terminal Once the interest and feasibility have been confirmed through the RFI process an open Request
for Proposal (RFP) process will follow On Thursday Pier 1 recorded 1305 gate moves 773 cancelled slots
221 wasted slots and 576 shifts In addition an accident on Sydney Road caused tipper trucks destined for
Maydon Warf to block the steel and Khongela bridges causing much-unwanted congestion in the area On
Friday stack occupancy at Pier 2 stood at 83 capacity for reefer containers and 55 at Pier 1
The following figure summarises port operations in Durban for the last two weeks focusing on gate moves
and time spent in the terminal
9
Figure 7 ndash Gate moves and time spent in the terminal (in minutes)
Source Calculated using data from Transnet 2021 Updated 24092021
iv Transnet Freight Rail (TFR)
Increasing reports of cable theft continue to raise significant concerns around the productivity of operations
at TFR TFR reported 38 cases of cable theft on the Container line over the previous weekend On
Wednesday Transnet informed its customers that they were experiencing OHTE power failure between
Union and Elsburg stations All trains were hauled by diesel locomotives through the dead section and delays
in train arrivals and departures from the Reef were experienced as a result
The following figure graphically illustrates the rail movement from Durban during the week showing a
notable decrease
Figure 8 ndash TFR Rail handled (Pier 1 and Pier 2)
Source Calculated using data from Transnet 2021 Updated 24092021
0
50
100
150
200
250
300
350
0
500
1000
1500
2000
2500
3000
3500
4000
4500
5000
11-Sep 12-Sep 13-Sep 14-Sep 15-Sep 16-Sep 17-Sep 18-Sep 19-Sep 20-Sep 21-Sep 22-Sep 23-Sep 24-Sep
Min
ute
s
Mo
ves
Pier 1 Gate Moves Pier 2 Gate Moves
Pier 1 Demonstrated Capacity Gate Moves Pier 2 Demonstrated Capacity Gate Moves
Pier 1 Time spent in port Pier 2 Time spent in port
Pier 2
Pier 1
0
50
100
150
200
250
300
350
400
450
18-Sep 19-Sep 20-Sep 21-Sep 22-Sep 23-Sep 24-Sep
Pier 1 Inbound Pier 1 Outbound Pier 2 Inbound Pier 2 Outbound
10
This week (18 to 24 September) rail cargo handled out of Durban averaged around 178 containers inbound
(45 for Pier 1 and 133 for Pier 2) and 392 containers outbound (46 for Pier 1 and 346 for Pier 2) per day
Total rail cargo moved through Durban for the week amounts to 3 489 containers darr24 lower than the
previous weeks 4 564 containers
v General
On Monday port users were urged by Transnet to properly process Cargo Dues on the Cash to Order system
as an increased number of abnormalities regarding the capturing of certain fields for Automotive and Break
Bulk cargo was noted Transnet also notified port users and other customers that they planned a National
search on Wednesday 22 September 2021 to search for missing containers
2 Air Update
a International air cargo
The following table shows the in- and outbound air cargo flows to and from ORTIA for the week starting 13
September For comparative purposes the average air freight cargo (inbound and outbound) handled at
ORTIA in September 2020 averaged ~731 369 kg per day For 2019 this average was ~900 778 kg per day
which is probably a more meaningful comparison and illustrates the extent to which volumes have fallen
over the last 18 months
Table 4 ndash International inbound and outbound cargo from OR Tambo
Flows 13-Sep 14-Sep 15-Sep 16-Sep 17-Sep 18-Sep 19-Sep
Volume inbound 568 230 312 739 449 723 456 725 381 939 356 069 885 843
Volume outbound 311 766 196 911 243 786 169 601 232 169 310 226 719 538
Total handled per day 879 996 509 650 693 509 626 326 614 108 666 295 1 605 381
Courtesy of ACOC Updated 22092021
The daily average volume of air cargo handled at ORTIA over the seven days starting 13 September
amounted to 487 324 kg inbound and 312 000 kg outbound This amounts to an average of 799 324kg per
day or ~115 compared to August 2020 Compared to pre-COVID-19 times the level is currently only at
~81 compared with the same period in 2019
The following figure shows monthly international freight movement at ORTIA during the state of disaster
11
Figure 9 ndash International inbound and outbound cargo from OR Tambo (thousands)
Courtesy of ACOC Updated 22092021
b Domestic air cargo
The following table shows the domestic inbound and outbound air cargo flows for the duration of the
lockdown period as reported by the industry By way of comparison the average domestic air freight cargo
(inbound and outbound) for ORTIA handled in August 2020 was only ~59 559 kg12 per day
Table 5 ndash Total domestic inbound and outbound cargo
DATE AIRPORT CPT DUR ELS ORTIA PLZ OTHERS TOTAL
Mar-Dec rsquo20 Av 21 813 2 941 3 751 20 539 6 571 3 176 56 713
Jan Average 20 961 2 739 2 859 22 818 5 491 5 238 57 781
Feb Average 27 777 3 537 3 427 30 117 6 988 3 503 75 348
Mar Average 28 781 3 702 3 845 31 166 7 680 3 740 78 914
Apr Average 24 875 3 234 3 058 25 694 6 306 3 046 66 213
May Average 29 891 3 781 3 669 27 817 7 245 3 261 75 664
Jun Average 27 498 3 706 3 556 26 873 7 086 3 213 71 932
Jul Average 23 583 5 374 3 144 15 839 6 229 2 844 57 013
Aug Average 25 649 2 983 3 495 19 973 6 597 3 256 61 953
Sep Average 27 131 3 820 3 485 21 217 6 894 3 191 65 739
14-Sep-21 38 387 5 286 4 829 37 916 9 652 4 959 101 029
15-Sep-21 42 033 5 205 5 082 28 559 13 786 3 579 98 242
16-Sep-21 39 112 5 652 4 367 26 360 10 910 4 951 91 352
17-Sep-21 19 324 3 283 2 783 33 154 4 616 2 976 66 136
18-Sep-21 2 600 1 021 53 2 061 371 129 6 235
19-Sep-21 3 303 296 169 811 403 754 5 735
20-Sep-21 52 387 5 794 6 142 31 282 11 946 6 310 113 861
Y-T-D Totals 6 886 416 959 597 891 439 6 490 597 1 765 825 846 088 17 839 961
12 For Cape Town the figure corresponds to 34 369 kg per day and 3 129 kg per day for Durban during the same period (July 2020)
0
100
200
300
400
500
600
Inbound Outbound Linear (Inbound) Linear (Outbound)
12
Courtesy of BAC Updated 23092021
Currently the average domestic air cargo moved in the last week was ~68 941 kg per day which is uarr4
compared with the previous week and ~107 compared to September 2020
The following figure shows monthly domestic freight movement at our commercial airports during the state
of disaster with an upward trend in volumes registered since the start of the year
Figure 10 ndash Average domestic inbound and outbound cargo (thousands)
Courtesy of BAC Updated 23092021
3 Road and regional Update
a South African land transport
This week Stats SA released the monthly land transport statistics for July13 The headline figure shows that
the volume of goods transported (payload) decreased by darr47 in July 2021 compared with July 2020 Over
the same period the corresponding income also reduced this time around by darr31 The following figures
note the bi-monthly percentage change in the freight transportation sector
13 Stats SA 20092021 Land transport
-
5
10
15
20
25
30
35
Tho
usa
nd
s
CPT DUR ELS JNB
PLZ OTHERS Linear (CPT) Linear (JNB)
13
Figure 11 ndash Average domestic inbound and outbound cargo (thousands)
Source Stats SA
The seasonally adjusted payload decreased by darr07 in the three months ended July 2021 compared with
the previous three months Road freight decreased by darr06 and rail freight decreased by darr13 The
summary can be seen in the following table showing that the current seasonally adjusted domestic payload
split is 2179 in favour of road transport as highlighted elsewhere in this report
Table 6 ndash South African border closures
Payload Feb-Apr 2021 (000 tons)
Weight May-Jul 2021 (000 tons)
Change (3-months)
Share of total change ()
Rail 45 809 213 45 218 -13 -03
Road 168 761 787 167 769 -06 -05
Total 214 571 100 212 988 -07 -07
Source Stats SA
b Cross-border delays
The following events have caused some delays in the SADC region this week
bull This week delays continued at Beitbridge with long queues (up to 13km) and slow crossing times
Furthermore while the industry looks forward to opening the new parking area on 6 October
transporters are not happy with the proposed access fee of US$ 175 irrespective of direction or
load
bull The feedback from transporters has listed poor efficiency from government agencies together with
runners and clearing agents not working at night as the main drivers of the delays
bull Lastly some positive news comes from Zambia In response to the roadblocks and recurring delays
reported last week Zambias new Minister of Home Affairs has banned all police roadblocks except
14
for permanently authorised security blocks This positive move for trade facilitation should lead to
less extortion from truck drivers and motorists and improved transit times
Apart from these developments investigations continue into cross-border delays experienced at several
SADC border posts in the sub-region The following table uses geofencing data to summarise delays
experienced at various borders during the last week
Table 7 ndash Delays14 summary ndash Selected SADC borders
Countries Border Queue Time (hhmm)
Border Time (hhmm)
HGV Arrivals per day
HGV Tonnage per day
Weekly HGV Arrivals
HGV Delay Hours
Queue Time Delays
NamSA AriamsvleiNakop 200 900 100 3 000 700 24 640 1 400
SAZim Beit Bridge 9600 2500 943 28 290 6 601 151 823 633 696
MozZam CassacatizaMlolo 100 1600 60 1 800 420 5 880 420
ZamZim Chirundu 100 1700 616 18 480 4 312 64 680 4 312
MozMal Dedza 200 1700 50 1 500 350 5 250 700
SABot GroblersbrugMartins Drift 100 1200 400 12 000 2 800 28 000 2 800
ZamDRC Kasumbalesa 000 4600 592 17 760 4 144 165 760 0
ZamBot Kazungula 000 1900 212 6 360 1 484 25 228 0
SABot KopfonteinTlokweng 100 4800 100 3 000 700 32 200 700
MozZim MachipandaForbes 100 600 320 9 600 2 240 8 960 2 240
MozMal Milange 000 1900 40 1 200 280 4 760 0
ZimMoz Nyamapanda 100 200 100 3 000 700 0 700
SAMoz Ressano Garcia 1300 1800 400 12 000 2 800 44 800 36 400
SABot SkilpadshekPioneer Gate 1700 300 300 9 000 2 100 2 100 35 700
ZamZim Victoria Falls 100 500 114 3 420 798 2 394 798
MozMal ZobueMwanza 200 2200 100 3 000 700 14 000 1 400
4 647 139 410 32 529 642 075 721 266
Source TLC amp FESARTA week ending 21092021
The following graph shows the weekly change in cross-border times (and associated estimated cost) from
South Africas perspective As a recurring theme recently Beit Bridge continues to experience prolonged
crossing times as the industry awaits the opening of the new parking area on 6 October Cross-border road
transporters are hopeful of a marked improvement in the North-South corridor as the current dismal
situation is extremely detrimental for business
14 It should be noted that the root cause of the reported delays is uncertain at this point Moreover the delays may be multiple and widely distributed Therefore they cannot be exclusively attributed to a specific common cross-border problem since we do not have a transparent view of the entire border process in granular detail The causes of these bottlenecks typically include poor infrastructure road congestion and a lack of coordination between neighbouring countries and Customs (or OGA) stops among other trade obstacles
15
Figure 12 ndash Weekly cross-border delays and estimated cost from a South African border perspective (delay in hours cost in $ thousands)
Source TLC amp FESARTA week ending 21092021
The following figure depicts a similar picture to those above this time from a corridor perspective Again
significant transit delays on the North-South corridor have continued with the Trans Kalahari also
experiencing a sub-optimal week These two corridors have stood out recently as queue and transit times
on both have been exceptionally high
Figure 13 ndash Weekly cross-border delays and estimated cost from a corridor perspective (delay in hours cost in $ thousands)
Source TLC amp FESARTA week ending 21092021
-$2 000
$ 0
$2 000
$4 000
$6 000
$8 000
$10 000
$12 000
$14 000
0
20
40
60
80
100
120
$
20
per
ho
ur
Tho
usa
nd
s
Ho
urs
Cross-border Queue Times Cross-border Transit Time
Weekly Queue Time Delays Weekly Cost of Excess Border Delays
$- 200
$-
$ 200
$ 400
$ 600
$ 800
$1 000
$1 200
$1 400
0
5
10
15
20
25
Beira Corridor Dar Corridor MaputoCorridor
North-South Trans Kalahari Trans Oranje
$
20
per
ho
urTh
ou
san
ds
Ho
urs
Cross-border Queue Times Cross-border Transit Time
Weekly Queue Time Delays Weekly Cost of Excess Border Delays
16
In summary the cross-border queue time has averaged ~82 hours (rising by ~05 hours from last weeks
recorded time of ~77 hours) costing the transport industry an estimated $14 million (R230 million) This
weeks average cross-border transit times hovered around ~188 hours (rising by ~25 hours from the ~163
hours recorded last week) costing the transport industry ~$13 million (R205 million) As the table and
commentary above predicted border times have significantly increased from last week especially
throughout the North-South corridor As a result the total cost for the week amounts to ~R436 million
(down by ~R6 million or 14 from R443 million the previous week)
4 International Update
The following section provides some context of the global economy and the impact of COVID-19 on trade
In addition the section includes an update on (a) the global container industry and (b) the global aviation
industry
a Global container industry
i Global freight rates
After 22 consecutive weeks of increases Drewrys World Container Index (WCI) composite index stopped
its seemingly inexorable rise this week remaining steady at $10 377 per 40-ft container15 This settling of
rates comes following the announcements by CMA-CGM and Hapag-Lloyd that they would not continue to
increase spot rates as container prices on most trade lanes are at record highs But apart from exorbitant
freight rates surcharge levels are providing cause for concern as carriers seek to solve the crisis around
equipment and slot capacity Surcharges can be expected to persist even as rates begin to decline16
Consequently some lines have been accused of using creative pricing strategies as a cosmetic exercise to
disguise rate increases with surcharges as high as 80 of base freight rates not uncommon For the industry
in its entirety the following figure summarises the astonishing rise in the two-year spot price of the index
Figure 14 ndash World Container Index ndash Assessed by Drewry ($ per 40 ft container)
Source Drewry Ports and Terminal insights
15 Drewry Supply Chain Advisors 23092021 World Container Index 16 Baker J 22092021 Freight surcharges will remain even after rates ease
17
The average composite index now stands at a massive uarr329 higher compared to the same time last year
Furthermore the average composite index of the WCI for year-to-date is $6 888 per 40ft container which
is $4 492 higher than the five-year average of $2 396 Concerning the major transatlantic trade lanes freight
rates from Shanghai to Genoa gained uarr1 to reach $13 646 per 40ft box However spot rates from New
York to Rotterdam dropped darr8 to $1 107 Similarly Los Angeles to Shanghai and Shanghai to New York
fell darr3 and darr2 to reach $1 404 and $15 849 per 40ft box The other major lanes (Shanghai to Rotterdam
Rotterdam to Shanghai Shanghai to Los Angeles and Rotterdam to New York) remained stable at the
previous weekrsquos level Therefore Drewry expects rates to stay steady in the coming week But it must be
stressed again that the index does not account for rising surcharge levels
ii Further developments of note
Apart from the ongoing story of rising freight rates and port congestion mentioned above some additional
important developments occurred around the world this week including a further update on Ningbo
1 US West Coast congestion
a According to Marine Traffic efforts continue to clear the increased backlog on the US West
Coast with 70 container vessels still awaiting berthing on Friday17 But unfortunately ships
are arriving at the US west coast faster than their contents can be processed through the
system And with inventories low and needing replenishment there is little relief in sight18
Indeed some analysts predict the backlog will take months to clear19
b In an effort to alleviate the situation further the ports of Los Angeles and Long Beach are
extending gate hours during nights and weekends Los Angeles is expanding gate hours on
weekends while Long Beach keeps its gates open between 0200 and 070020
c Moreover the Port of Long Beach is instituting a pilot program for 24-hour cargo pick-up at
Pier T Terminal21 The pilot program will focus on the effort to reduce dwell time
2 CMA CGM confirms data leak after cyber-attack
a Another cyber-attack struck the shipping industry this time with the French carrier CMA
CGM reporting a leak involving limited customr information including employees names
positions email and phone details22
b Paul Dean global head of shipping at HFW said that There is one incident on a ship every
day and attacks on shipping have increased 900 in the three years to 2020 Almost
unbelievably this correlates into a ransomware attack once every 10 seconds23
3 IMO defrauded by North Korea vessel identity laundering scheme
a Washington DC non-profit C4ADS says the integrity of IMO ship registration is threatened
by elaborate and detailed plans that see sanctions-busting ships from North Korea Iran and
Venezuela transmitting under false IMO identities24
b The inquiry has revealed a process where vessels adopt a different identity on automatic
identification system (AIS) transmissions allowing sanctions-hit ships to adopt clean
identities25
17 Marine Traffic 24092021 Port of Los Angeles 18 Baker J 21092021 Box ships continue to pile up off US west coast 19 Baker J 23092021 US port congestion lsquowill take months to clearrsquo 20 Putzger I 21092021 LA amp Long Beach ports extend gate hours to curb congestion 21 Manadiar H 21092021 Port of Long Beach starts pilot program for 24-hour cargo pick up at its Pier T Terminal 22 Lloydrsquos List 19092021 CMA CGM confirms data leak after cyber-attack 23 Baker J 20092021 Shipping needs to be vigilant over cyber risks 24 Wiese Bockmann M 23092021 IMO lsquodefraudedrsquo by North Korea vessel identity laundering scheme 25 Chambers S 24092021 New report highlights the rise of vessel identity laundering
18
b Global aviation industry
Air cargo continues to report robust growth figures as industry-wide cargo tonne-kilometres (CTKs) rose by
uarr249 in the three months ended July 2021 compared to the same period in 2019 According to the latest
quarterly Cargo Chartbook these figures note that an upward trend in air cargo volumes continued in the
past three months Still seasonally adjusted numbers show the growth has slowed compared to early 2021
Nevertheless air cargo continues to perform strongly in the global goods trade as shown in the following
figure
Figure 15 ndash Air cargo growth and performance 2021 Q3 (yy growth)
Source IATA Economics
IATA notes that air cargo had been underperforming goods trade since late 2018 but this inverted in 2021
Air now benefits from the need of businesses to rapidly restock their inventories as economies reopen after
lockdowns In addition rapidly increasing sea freight costs and transit times have played their part This
situation is likely to continue for some time as many drivers of air cargo continue to be supportive despite
the spread of the Delta variant and supply chain congestion The major constraint in the industry continues
to be the capacity issue mainly due to the lack of belly space on international passenger flights as depicted
below
19
Figure 16 ndash Air cargo growth and performance 2021 Q3 (yy growth)
Source IATA Economics
Consequently international available Industry-wide cargo tonne-kilometres (ACTKs) have trended sideways
since the start of 2021 Airlines have increased dedicated freighters ACTKs to bulk up capacity by uarr276
compared to 2019 in the three months ended July 2021 However the increase in freighter capacity has not
offset reduced space availability as international belly ACTKs were darr395 over the same period
Fortunately cargo yields are trending upwards again providing support to cargo revenues although at a
cost to shippers who are simultaneously grappling with elevated ocean freight rates Lastly the upward
trends are expected to continue as 72 of respondents expected air cargo volumes to keep increasing in
the twelve months according to the heads of air cargo questioned in the IATA Confidence Survey26
26 IATA 30072021 Confidence Survey

10
This week (18 to 24 September) rail cargo handled out of Durban averaged around 178 containers inbound
(45 for Pier 1 and 133 for Pier 2) and 392 containers outbound (46 for Pier 1 and 346 for Pier 2) per day
Total rail cargo moved through Durban for the week amounts to 3 489 containers darr24 lower than the
previous weeks 4 564 containers
v General
On Monday port users were urged by Transnet to properly process Cargo Dues on the Cash to Order system
as an increased number of abnormalities regarding the capturing of certain fields for Automotive and Break
Bulk cargo was noted Transnet also notified port users and other customers that they planned a National
search on Wednesday 22 September 2021 to search for missing containers
2 Air Update
a International air cargo
The following table shows the in- and outbound air cargo flows to and from ORTIA for the week starting 13
September For comparative purposes the average air freight cargo (inbound and outbound) handled at
ORTIA in September 2020 averaged ~731 369 kg per day For 2019 this average was ~900 778 kg per day
which is probably a more meaningful comparison and illustrates the extent to which volumes have fallen
over the last 18 months
Table 4 ndash International inbound and outbound cargo from OR Tambo
Flows 13-Sep 14-Sep 15-Sep 16-Sep 17-Sep 18-Sep 19-Sep
Volume inbound 568 230 312 739 449 723 456 725 381 939 356 069 885 843
Volume outbound 311 766 196 911 243 786 169 601 232 169 310 226 719 538
Total handled per day 879 996 509 650 693 509 626 326 614 108 666 295 1 605 381
Courtesy of ACOC Updated 22092021
The daily average volume of air cargo handled at ORTIA over the seven days starting 13 September
amounted to 487 324 kg inbound and 312 000 kg outbound This amounts to an average of 799 324kg per
day or ~115 compared to August 2020 Compared to pre-COVID-19 times the level is currently only at
~81 compared with the same period in 2019
The following figure shows monthly international freight movement at ORTIA during the state of disaster
11
Figure 9 ndash International inbound and outbound cargo from OR Tambo (thousands)
Courtesy of ACOC Updated 22092021
b Domestic air cargo
The following table shows the domestic inbound and outbound air cargo flows for the duration of the
lockdown period as reported by the industry By way of comparison the average domestic air freight cargo
(inbound and outbound) for ORTIA handled in August 2020 was only ~59 559 kg12 per day
Table 5 ndash Total domestic inbound and outbound cargo
DATE AIRPORT CPT DUR ELS ORTIA PLZ OTHERS TOTAL
Mar-Dec rsquo20 Av 21 813 2 941 3 751 20 539 6 571 3 176 56 713
Jan Average 20 961 2 739 2 859 22 818 5 491 5 238 57 781
Feb Average 27 777 3 537 3 427 30 117 6 988 3 503 75 348
Mar Average 28 781 3 702 3 845 31 166 7 680 3 740 78 914
Apr Average 24 875 3 234 3 058 25 694 6 306 3 046 66 213
May Average 29 891 3 781 3 669 27 817 7 245 3 261 75 664
Jun Average 27 498 3 706 3 556 26 873 7 086 3 213 71 932
Jul Average 23 583 5 374 3 144 15 839 6 229 2 844 57 013
Aug Average 25 649 2 983 3 495 19 973 6 597 3 256 61 953
Sep Average 27 131 3 820 3 485 21 217 6 894 3 191 65 739
14-Sep-21 38 387 5 286 4 829 37 916 9 652 4 959 101 029
15-Sep-21 42 033 5 205 5 082 28 559 13 786 3 579 98 242
16-Sep-21 39 112 5 652 4 367 26 360 10 910 4 951 91 352
17-Sep-21 19 324 3 283 2 783 33 154 4 616 2 976 66 136
18-Sep-21 2 600 1 021 53 2 061 371 129 6 235
19-Sep-21 3 303 296 169 811 403 754 5 735
20-Sep-21 52 387 5 794 6 142 31 282 11 946 6 310 113 861
Y-T-D Totals 6 886 416 959 597 891 439 6 490 597 1 765 825 846 088 17 839 961
12 For Cape Town the figure corresponds to 34 369 kg per day and 3 129 kg per day for Durban during the same period (July 2020)
0
100
200
300
400
500
600
Inbound Outbound Linear (Inbound) Linear (Outbound)
12
Courtesy of BAC Updated 23092021
Currently the average domestic air cargo moved in the last week was ~68 941 kg per day which is uarr4
compared with the previous week and ~107 compared to September 2020
The following figure shows monthly domestic freight movement at our commercial airports during the state
of disaster with an upward trend in volumes registered since the start of the year
Figure 10 ndash Average domestic inbound and outbound cargo (thousands)
Courtesy of BAC Updated 23092021
3 Road and regional Update
a South African land transport
This week Stats SA released the monthly land transport statistics for July13 The headline figure shows that
the volume of goods transported (payload) decreased by darr47 in July 2021 compared with July 2020 Over
the same period the corresponding income also reduced this time around by darr31 The following figures
note the bi-monthly percentage change in the freight transportation sector
13 Stats SA 20092021 Land transport
-
5
10
15
20
25
30
35
Tho
usa
nd
s
CPT DUR ELS JNB
PLZ OTHERS Linear (CPT) Linear (JNB)
13
Figure 11 ndash Average domestic inbound and outbound cargo (thousands)
Source Stats SA
The seasonally adjusted payload decreased by darr07 in the three months ended July 2021 compared with
the previous three months Road freight decreased by darr06 and rail freight decreased by darr13 The
summary can be seen in the following table showing that the current seasonally adjusted domestic payload
split is 2179 in favour of road transport as highlighted elsewhere in this report
Table 6 ndash South African border closures
Payload Feb-Apr 2021 (000 tons)
Weight May-Jul 2021 (000 tons)
Change (3-months)
Share of total change ()
Rail 45 809 213 45 218 -13 -03
Road 168 761 787 167 769 -06 -05
Total 214 571 100 212 988 -07 -07
Source Stats SA
b Cross-border delays
The following events have caused some delays in the SADC region this week
bull This week delays continued at Beitbridge with long queues (up to 13km) and slow crossing times
Furthermore while the industry looks forward to opening the new parking area on 6 October
transporters are not happy with the proposed access fee of US$ 175 irrespective of direction or
load
bull The feedback from transporters has listed poor efficiency from government agencies together with
runners and clearing agents not working at night as the main drivers of the delays
bull Lastly some positive news comes from Zambia In response to the roadblocks and recurring delays
reported last week Zambias new Minister of Home Affairs has banned all police roadblocks except
14
for permanently authorised security blocks This positive move for trade facilitation should lead to
less extortion from truck drivers and motorists and improved transit times
Apart from these developments investigations continue into cross-border delays experienced at several
SADC border posts in the sub-region The following table uses geofencing data to summarise delays
experienced at various borders during the last week
Table 7 ndash Delays14 summary ndash Selected SADC borders
Countries Border Queue Time (hhmm)
Border Time (hhmm)
HGV Arrivals per day
HGV Tonnage per day
Weekly HGV Arrivals
HGV Delay Hours
Queue Time Delays
NamSA AriamsvleiNakop 200 900 100 3 000 700 24 640 1 400
SAZim Beit Bridge 9600 2500 943 28 290 6 601 151 823 633 696
MozZam CassacatizaMlolo 100 1600 60 1 800 420 5 880 420
ZamZim Chirundu 100 1700 616 18 480 4 312 64 680 4 312
MozMal Dedza 200 1700 50 1 500 350 5 250 700
SABot GroblersbrugMartins Drift 100 1200 400 12 000 2 800 28 000 2 800
ZamDRC Kasumbalesa 000 4600 592 17 760 4 144 165 760 0
ZamBot Kazungula 000 1900 212 6 360 1 484 25 228 0
SABot KopfonteinTlokweng 100 4800 100 3 000 700 32 200 700
MozZim MachipandaForbes 100 600 320 9 600 2 240 8 960 2 240
MozMal Milange 000 1900 40 1 200 280 4 760 0
ZimMoz Nyamapanda 100 200 100 3 000 700 0 700
SAMoz Ressano Garcia 1300 1800 400 12 000 2 800 44 800 36 400
SABot SkilpadshekPioneer Gate 1700 300 300 9 000 2 100 2 100 35 700
ZamZim Victoria Falls 100 500 114 3 420 798 2 394 798
MozMal ZobueMwanza 200 2200 100 3 000 700 14 000 1 400
4 647 139 410 32 529 642 075 721 266
Source TLC amp FESARTA week ending 21092021
The following graph shows the weekly change in cross-border times (and associated estimated cost) from
South Africas perspective As a recurring theme recently Beit Bridge continues to experience prolonged
crossing times as the industry awaits the opening of the new parking area on 6 October Cross-border road
transporters are hopeful of a marked improvement in the North-South corridor as the current dismal
situation is extremely detrimental for business
14 It should be noted that the root cause of the reported delays is uncertain at this point Moreover the delays may be multiple and widely distributed Therefore they cannot be exclusively attributed to a specific common cross-border problem since we do not have a transparent view of the entire border process in granular detail The causes of these bottlenecks typically include poor infrastructure road congestion and a lack of coordination between neighbouring countries and Customs (or OGA) stops among other trade obstacles
15
Figure 12 ndash Weekly cross-border delays and estimated cost from a South African border perspective (delay in hours cost in $ thousands)
Source TLC amp FESARTA week ending 21092021
The following figure depicts a similar picture to those above this time from a corridor perspective Again
significant transit delays on the North-South corridor have continued with the Trans Kalahari also
experiencing a sub-optimal week These two corridors have stood out recently as queue and transit times
on both have been exceptionally high
Figure 13 ndash Weekly cross-border delays and estimated cost from a corridor perspective (delay in hours cost in $ thousands)
Source TLC amp FESARTA week ending 21092021
-$2 000
$ 0
$2 000
$4 000
$6 000
$8 000
$10 000
$12 000
$14 000
0
20
40
60
80
100
120
$
20
per
ho
ur
Tho
usa
nd
s
Ho
urs
Cross-border Queue Times Cross-border Transit Time
Weekly Queue Time Delays Weekly Cost of Excess Border Delays
$- 200
$-
$ 200
$ 400
$ 600
$ 800
$1 000
$1 200
$1 400
0
5
10
15
20
25
Beira Corridor Dar Corridor MaputoCorridor
North-South Trans Kalahari Trans Oranje
$
20
per
ho
urTh
ou
san
ds
Ho
urs
Cross-border Queue Times Cross-border Transit Time
Weekly Queue Time Delays Weekly Cost of Excess Border Delays
16
In summary the cross-border queue time has averaged ~82 hours (rising by ~05 hours from last weeks
recorded time of ~77 hours) costing the transport industry an estimated $14 million (R230 million) This
weeks average cross-border transit times hovered around ~188 hours (rising by ~25 hours from the ~163
hours recorded last week) costing the transport industry ~$13 million (R205 million) As the table and
commentary above predicted border times have significantly increased from last week especially
throughout the North-South corridor As a result the total cost for the week amounts to ~R436 million
(down by ~R6 million or 14 from R443 million the previous week)
4 International Update
The following section provides some context of the global economy and the impact of COVID-19 on trade
In addition the section includes an update on (a) the global container industry and (b) the global aviation
industry
a Global container industry
i Global freight rates
After 22 consecutive weeks of increases Drewrys World Container Index (WCI) composite index stopped
its seemingly inexorable rise this week remaining steady at $10 377 per 40-ft container15 This settling of
rates comes following the announcements by CMA-CGM and Hapag-Lloyd that they would not continue to
increase spot rates as container prices on most trade lanes are at record highs But apart from exorbitant
freight rates surcharge levels are providing cause for concern as carriers seek to solve the crisis around
equipment and slot capacity Surcharges can be expected to persist even as rates begin to decline16
Consequently some lines have been accused of using creative pricing strategies as a cosmetic exercise to
disguise rate increases with surcharges as high as 80 of base freight rates not uncommon For the industry
in its entirety the following figure summarises the astonishing rise in the two-year spot price of the index
Figure 14 ndash World Container Index ndash Assessed by Drewry ($ per 40 ft container)
Source Drewry Ports and Terminal insights
15 Drewry Supply Chain Advisors 23092021 World Container Index 16 Baker J 22092021 Freight surcharges will remain even after rates ease
17
The average composite index now stands at a massive uarr329 higher compared to the same time last year
Furthermore the average composite index of the WCI for year-to-date is $6 888 per 40ft container which
is $4 492 higher than the five-year average of $2 396 Concerning the major transatlantic trade lanes freight
rates from Shanghai to Genoa gained uarr1 to reach $13 646 per 40ft box However spot rates from New
York to Rotterdam dropped darr8 to $1 107 Similarly Los Angeles to Shanghai and Shanghai to New York
fell darr3 and darr2 to reach $1 404 and $15 849 per 40ft box The other major lanes (Shanghai to Rotterdam
Rotterdam to Shanghai Shanghai to Los Angeles and Rotterdam to New York) remained stable at the
previous weekrsquos level Therefore Drewry expects rates to stay steady in the coming week But it must be
stressed again that the index does not account for rising surcharge levels
ii Further developments of note
Apart from the ongoing story of rising freight rates and port congestion mentioned above some additional
important developments occurred around the world this week including a further update on Ningbo
1 US West Coast congestion
a According to Marine Traffic efforts continue to clear the increased backlog on the US West
Coast with 70 container vessels still awaiting berthing on Friday17 But unfortunately ships
are arriving at the US west coast faster than their contents can be processed through the
system And with inventories low and needing replenishment there is little relief in sight18
Indeed some analysts predict the backlog will take months to clear19
b In an effort to alleviate the situation further the ports of Los Angeles and Long Beach are
extending gate hours during nights and weekends Los Angeles is expanding gate hours on
weekends while Long Beach keeps its gates open between 0200 and 070020
c Moreover the Port of Long Beach is instituting a pilot program for 24-hour cargo pick-up at
Pier T Terminal21 The pilot program will focus on the effort to reduce dwell time
2 CMA CGM confirms data leak after cyber-attack
a Another cyber-attack struck the shipping industry this time with the French carrier CMA
CGM reporting a leak involving limited customr information including employees names
positions email and phone details22
b Paul Dean global head of shipping at HFW said that There is one incident on a ship every
day and attacks on shipping have increased 900 in the three years to 2020 Almost
unbelievably this correlates into a ransomware attack once every 10 seconds23
3 IMO defrauded by North Korea vessel identity laundering scheme
a Washington DC non-profit C4ADS says the integrity of IMO ship registration is threatened
by elaborate and detailed plans that see sanctions-busting ships from North Korea Iran and
Venezuela transmitting under false IMO identities24
b The inquiry has revealed a process where vessels adopt a different identity on automatic
identification system (AIS) transmissions allowing sanctions-hit ships to adopt clean
identities25
17 Marine Traffic 24092021 Port of Los Angeles 18 Baker J 21092021 Box ships continue to pile up off US west coast 19 Baker J 23092021 US port congestion lsquowill take months to clearrsquo 20 Putzger I 21092021 LA amp Long Beach ports extend gate hours to curb congestion 21 Manadiar H 21092021 Port of Long Beach starts pilot program for 24-hour cargo pick up at its Pier T Terminal 22 Lloydrsquos List 19092021 CMA CGM confirms data leak after cyber-attack 23 Baker J 20092021 Shipping needs to be vigilant over cyber risks 24 Wiese Bockmann M 23092021 IMO lsquodefraudedrsquo by North Korea vessel identity laundering scheme 25 Chambers S 24092021 New report highlights the rise of vessel identity laundering
18
b Global aviation industry
Air cargo continues to report robust growth figures as industry-wide cargo tonne-kilometres (CTKs) rose by
uarr249 in the three months ended July 2021 compared to the same period in 2019 According to the latest
quarterly Cargo Chartbook these figures note that an upward trend in air cargo volumes continued in the
past three months Still seasonally adjusted numbers show the growth has slowed compared to early 2021
Nevertheless air cargo continues to perform strongly in the global goods trade as shown in the following
figure
Figure 15 ndash Air cargo growth and performance 2021 Q3 (yy growth)
Source IATA Economics
IATA notes that air cargo had been underperforming goods trade since late 2018 but this inverted in 2021
Air now benefits from the need of businesses to rapidly restock their inventories as economies reopen after
lockdowns In addition rapidly increasing sea freight costs and transit times have played their part This
situation is likely to continue for some time as many drivers of air cargo continue to be supportive despite
the spread of the Delta variant and supply chain congestion The major constraint in the industry continues
to be the capacity issue mainly due to the lack of belly space on international passenger flights as depicted
below
19
Figure 16 ndash Air cargo growth and performance 2021 Q3 (yy growth)
Source IATA Economics
Consequently international available Industry-wide cargo tonne-kilometres (ACTKs) have trended sideways
since the start of 2021 Airlines have increased dedicated freighters ACTKs to bulk up capacity by uarr276
compared to 2019 in the three months ended July 2021 However the increase in freighter capacity has not
offset reduced space availability as international belly ACTKs were darr395 over the same period
Fortunately cargo yields are trending upwards again providing support to cargo revenues although at a
cost to shippers who are simultaneously grappling with elevated ocean freight rates Lastly the upward
trends are expected to continue as 72 of respondents expected air cargo volumes to keep increasing in
the twelve months according to the heads of air cargo questioned in the IATA Confidence Survey26
26 IATA 30072021 Confidence Survey
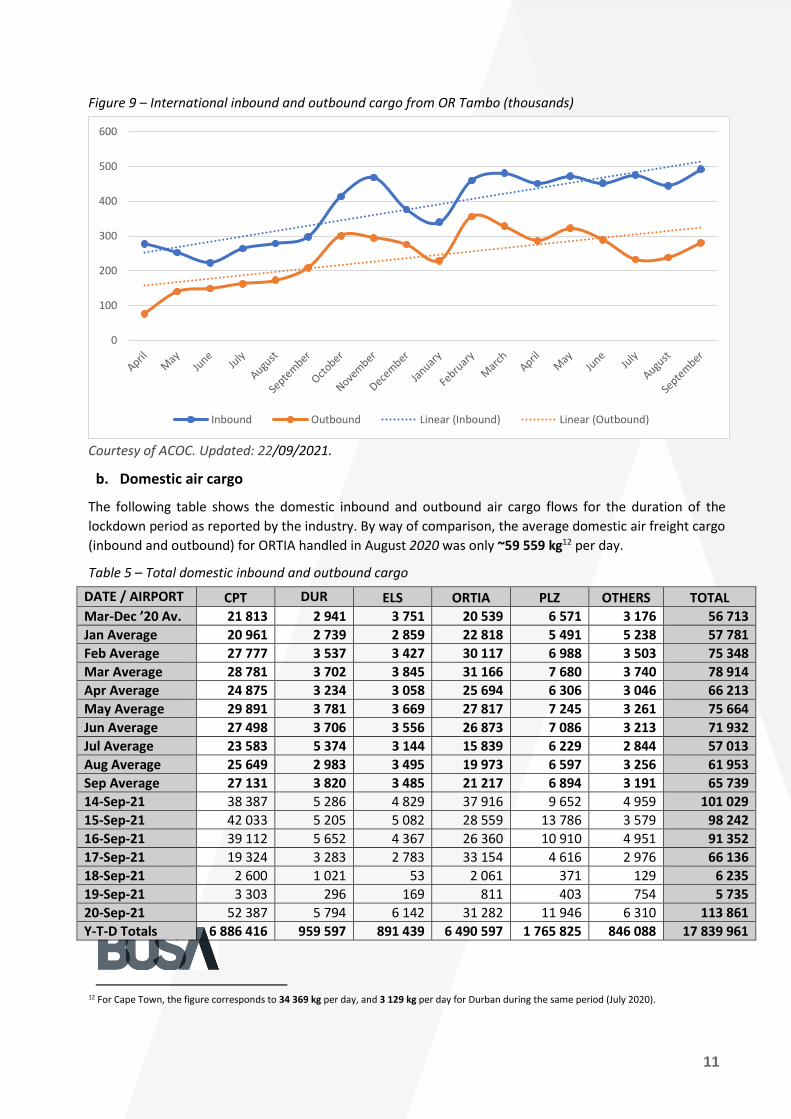
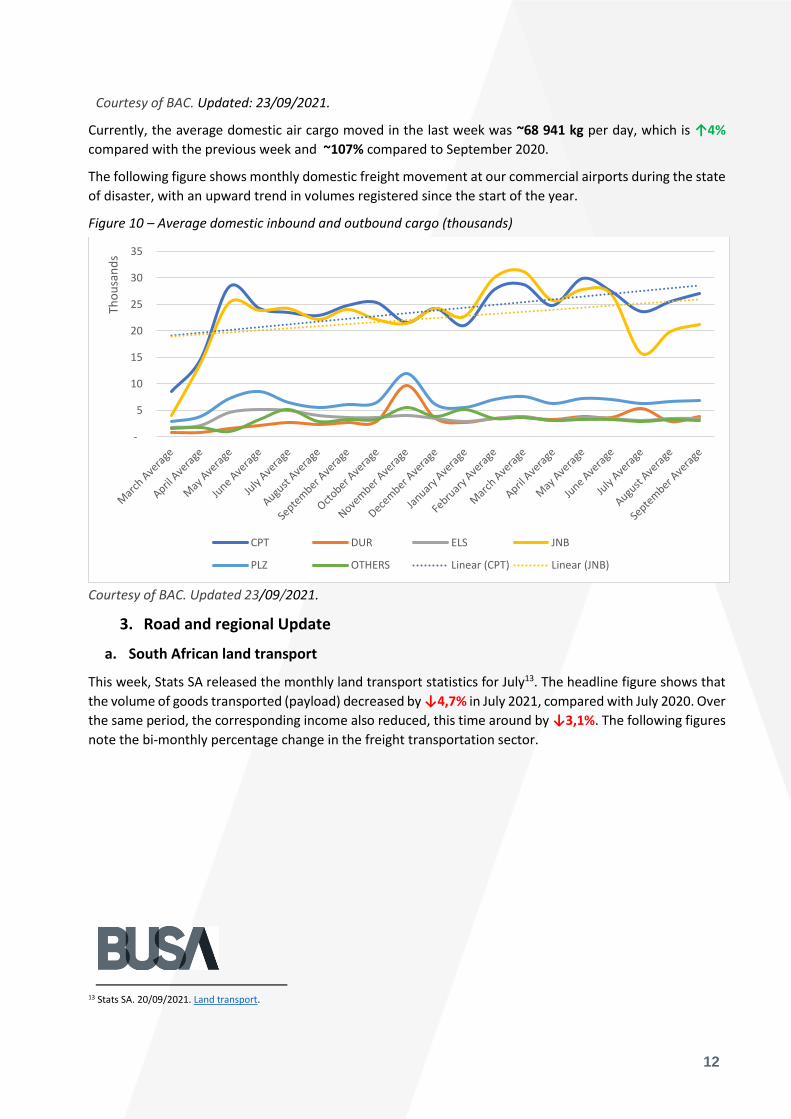
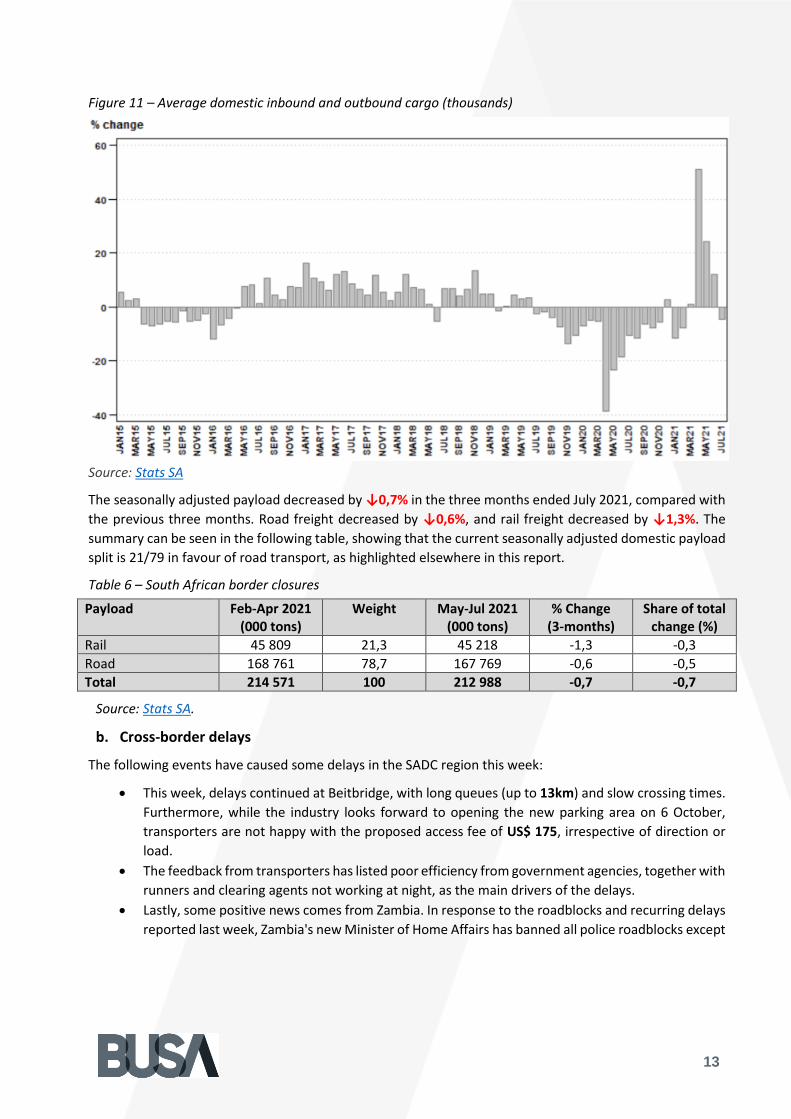
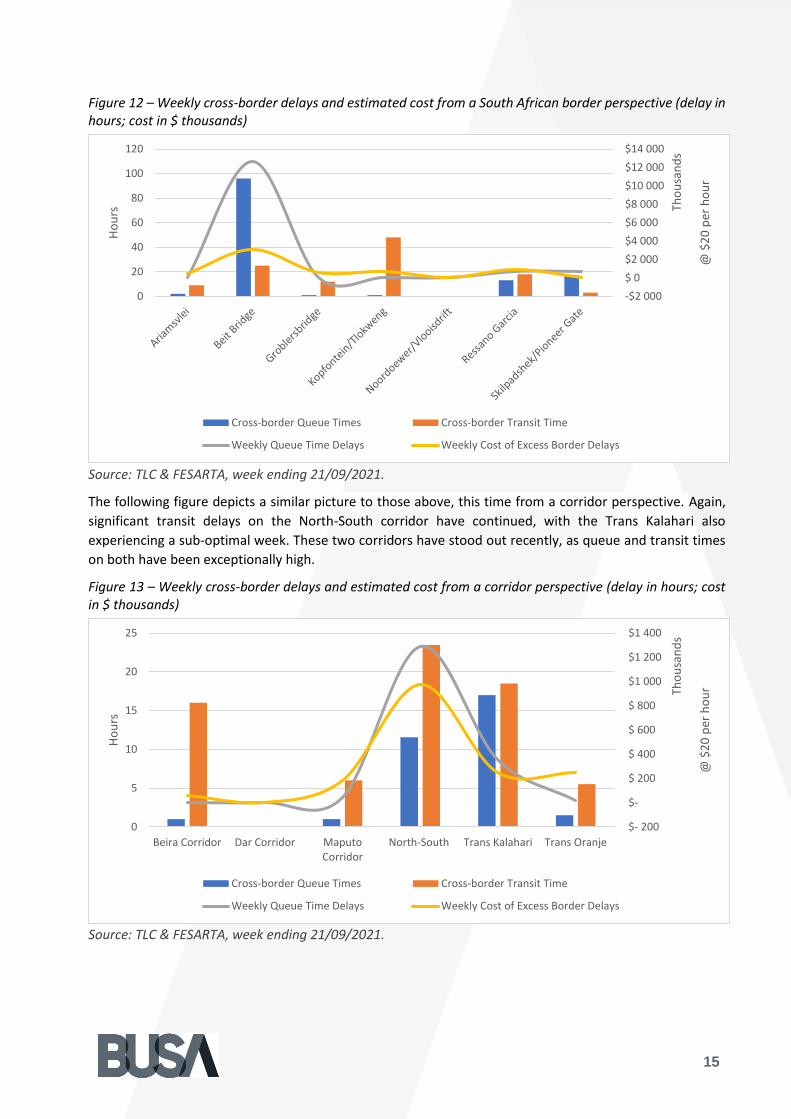
15
Figure 12 ndash Weekly cross-border delays and estimated cost from a South African border perspective (delay in hours cost in $ thousands)
Source TLC amp FESARTA week ending 21092021
The following figure depicts a similar picture to those above this time from a corridor perspective Again
significant transit delays on the North-South corridor have continued with the Trans Kalahari also
experiencing a sub-optimal week These two corridors have stood out recently as queue and transit times
on both have been exceptionally high
Figure 13 ndash Weekly cross-border delays and estimated cost from a corridor perspective (delay in hours cost in $ thousands)
Source TLC amp FESARTA week ending 21092021
-$2 000
$ 0
$2 000
$4 000
$6 000
$8 000
$10 000
$12 000
$14 000
0
20
40
60
80
100
120
$
20
per
ho
ur
Tho
usa
nd
s
Ho
urs
Cross-border Queue Times Cross-border Transit Time
Weekly Queue Time Delays Weekly Cost of Excess Border Delays
$- 200
$-
$ 200
$ 400
$ 600
$ 800
$1 000
$1 200
$1 400
0
5
10
15
20
25
Beira Corridor Dar Corridor MaputoCorridor
North-South Trans Kalahari Trans Oranje
$
20
per
ho
urTh
ou
san
ds
Ho
urs
Cross-border Queue Times Cross-border Transit Time
Weekly Queue Time Delays Weekly Cost of Excess Border Delays
16
In summary the cross-border queue time has averaged ~82 hours (rising by ~05 hours from last weeks
recorded time of ~77 hours) costing the transport industry an estimated $14 million (R230 million) This
weeks average cross-border transit times hovered around ~188 hours (rising by ~25 hours from the ~163
hours recorded last week) costing the transport industry ~$13 million (R205 million) As the table and
commentary above predicted border times have significantly increased from last week especially
throughout the North-South corridor As a result the total cost for the week amounts to ~R436 million
(down by ~R6 million or 14 from R443 million the previous week)
4 International Update
The following section provides some context of the global economy and the impact of COVID-19 on trade
In addition the section includes an update on (a) the global container industry and (b) the global aviation
industry
a Global container industry
i Global freight rates
After 22 consecutive weeks of increases Drewrys World Container Index (WCI) composite index stopped
its seemingly inexorable rise this week remaining steady at $10 377 per 40-ft container15 This settling of
rates comes following the announcements by CMA-CGM and Hapag-Lloyd that they would not continue to
increase spot rates as container prices on most trade lanes are at record highs But apart from exorbitant
freight rates surcharge levels are providing cause for concern as carriers seek to solve the crisis around
equipment and slot capacity Surcharges can be expected to persist even as rates begin to decline16
Consequently some lines have been accused of using creative pricing strategies as a cosmetic exercise to
disguise rate increases with surcharges as high as 80 of base freight rates not uncommon For the industry
in its entirety the following figure summarises the astonishing rise in the two-year spot price of the index
Figure 14 ndash World Container Index ndash Assessed by Drewry ($ per 40 ft container)
Source Drewry Ports and Terminal insights
15 Drewry Supply Chain Advisors 23092021 World Container Index 16 Baker J 22092021 Freight surcharges will remain even after rates ease
17
The average composite index now stands at a massive uarr329 higher compared to the same time last year
Furthermore the average composite index of the WCI for year-to-date is $6 888 per 40ft container which
is $4 492 higher than the five-year average of $2 396 Concerning the major transatlantic trade lanes freight
rates from Shanghai to Genoa gained uarr1 to reach $13 646 per 40ft box However spot rates from New
York to Rotterdam dropped darr8 to $1 107 Similarly Los Angeles to Shanghai and Shanghai to New York
fell darr3 and darr2 to reach $1 404 and $15 849 per 40ft box The other major lanes (Shanghai to Rotterdam
Rotterdam to Shanghai Shanghai to Los Angeles and Rotterdam to New York) remained stable at the
previous weekrsquos level Therefore Drewry expects rates to stay steady in the coming week But it must be
stressed again that the index does not account for rising surcharge levels
ii Further developments of note
Apart from the ongoing story of rising freight rates and port congestion mentioned above some additional
important developments occurred around the world this week including a further update on Ningbo
1 US West Coast congestion
a According to Marine Traffic efforts continue to clear the increased backlog on the US West
Coast with 70 container vessels still awaiting berthing on Friday17 But unfortunately ships
are arriving at the US west coast faster than their contents can be processed through the
system And with inventories low and needing replenishment there is little relief in sight18
Indeed some analysts predict the backlog will take months to clear19
b In an effort to alleviate the situation further the ports of Los Angeles and Long Beach are
extending gate hours during nights and weekends Los Angeles is expanding gate hours on
weekends while Long Beach keeps its gates open between 0200 and 070020
c Moreover the Port of Long Beach is instituting a pilot program for 24-hour cargo pick-up at
Pier T Terminal21 The pilot program will focus on the effort to reduce dwell time
2 CMA CGM confirms data leak after cyber-attack
a Another cyber-attack struck the shipping industry this time with the French carrier CMA
CGM reporting a leak involving limited customr information including employees names
positions email and phone details22
b Paul Dean global head of shipping at HFW said that There is one incident on a ship every
day and attacks on shipping have increased 900 in the three years to 2020 Almost
unbelievably this correlates into a ransomware attack once every 10 seconds23
3 IMO defrauded by North Korea vessel identity laundering scheme
a Washington DC non-profit C4ADS says the integrity of IMO ship registration is threatened
by elaborate and detailed plans that see sanctions-busting ships from North Korea Iran and
Venezuela transmitting under false IMO identities24
b The inquiry has revealed a process where vessels adopt a different identity on automatic
identification system (AIS) transmissions allowing sanctions-hit ships to adopt clean
identities25
17 Marine Traffic 24092021 Port of Los Angeles 18 Baker J 21092021 Box ships continue to pile up off US west coast 19 Baker J 23092021 US port congestion lsquowill take months to clearrsquo 20 Putzger I 21092021 LA amp Long Beach ports extend gate hours to curb congestion 21 Manadiar H 21092021 Port of Long Beach starts pilot program for 24-hour cargo pick up at its Pier T Terminal 22 Lloydrsquos List 19092021 CMA CGM confirms data leak after cyber-attack 23 Baker J 20092021 Shipping needs to be vigilant over cyber risks 24 Wiese Bockmann M 23092021 IMO lsquodefraudedrsquo by North Korea vessel identity laundering scheme 25 Chambers S 24092021 New report highlights the rise of vessel identity laundering
18
b Global aviation industry
Air cargo continues to report robust growth figures as industry-wide cargo tonne-kilometres (CTKs) rose by
uarr249 in the three months ended July 2021 compared to the same period in 2019 According to the latest
quarterly Cargo Chartbook these figures note that an upward trend in air cargo volumes continued in the
past three months Still seasonally adjusted numbers show the growth has slowed compared to early 2021
Nevertheless air cargo continues to perform strongly in the global goods trade as shown in the following
figure
Figure 15 ndash Air cargo growth and performance 2021 Q3 (yy growth)
Source IATA Economics
IATA notes that air cargo had been underperforming goods trade since late 2018 but this inverted in 2021
Air now benefits from the need of businesses to rapidly restock their inventories as economies reopen after
lockdowns In addition rapidly increasing sea freight costs and transit times have played their part This
situation is likely to continue for some time as many drivers of air cargo continue to be supportive despite
the spread of the Delta variant and supply chain congestion The major constraint in the industry continues
to be the capacity issue mainly due to the lack of belly space on international passenger flights as depicted
below
19
Figure 16 ndash Air cargo growth and performance 2021 Q3 (yy growth)
Source IATA Economics
Consequently international available Industry-wide cargo tonne-kilometres (ACTKs) have trended sideways
since the start of 2021 Airlines have increased dedicated freighters ACTKs to bulk up capacity by uarr276
compared to 2019 in the three months ended July 2021 However the increase in freighter capacity has not
offset reduced space availability as international belly ACTKs were darr395 over the same period
Fortunately cargo yields are trending upwards again providing support to cargo revenues although at a
cost to shippers who are simultaneously grappling with elevated ocean freight rates Lastly the upward
trends are expected to continue as 72 of respondents expected air cargo volumes to keep increasing in
the twelve months according to the heads of air cargo questioned in the IATA Confidence Survey26
26 IATA 30072021 Confidence Survey
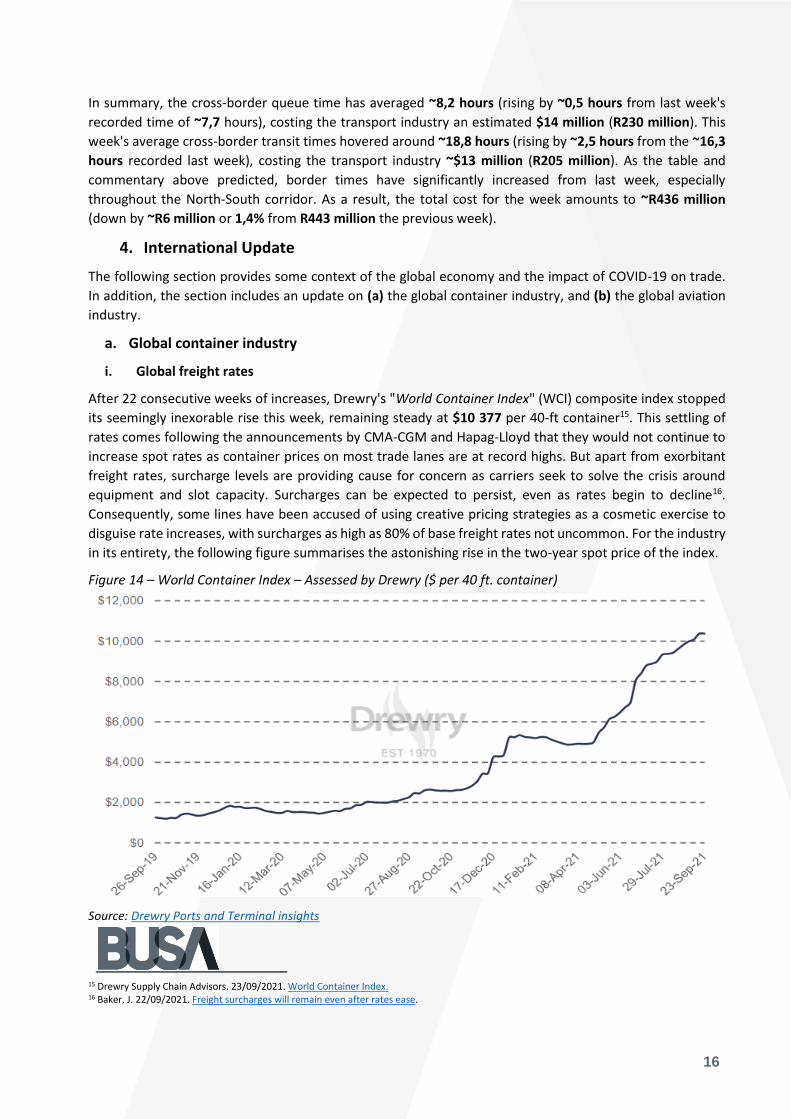
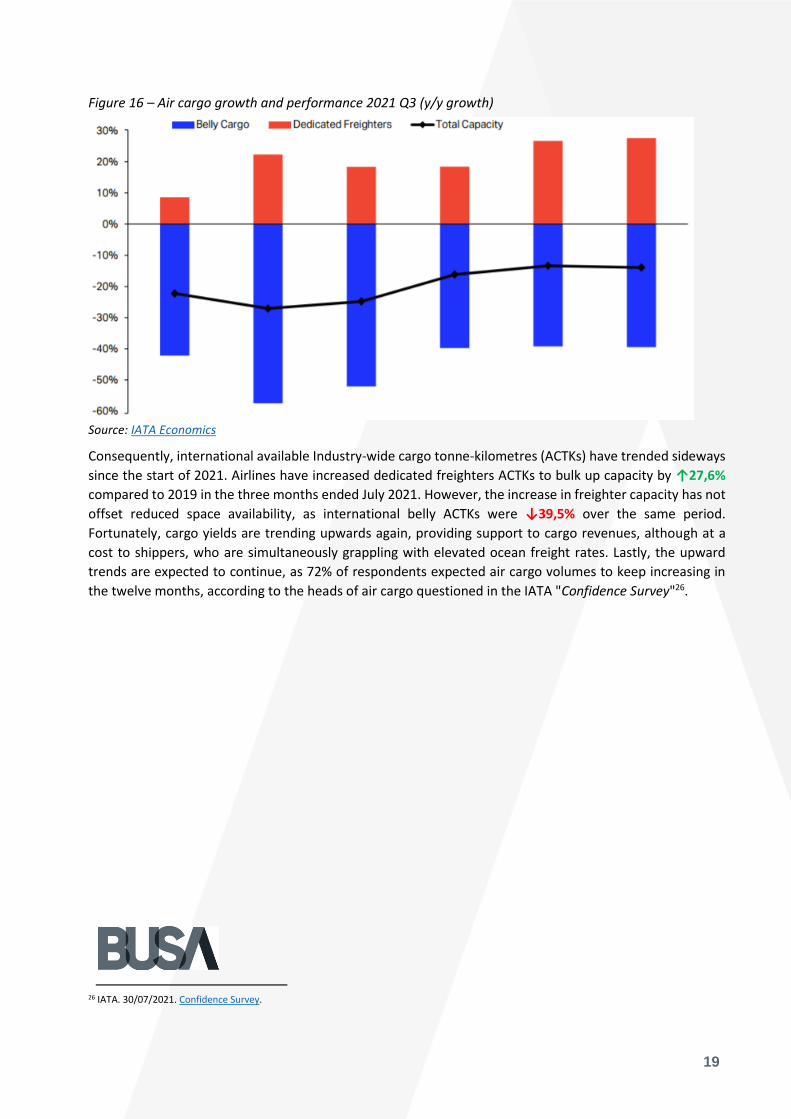