Embed Size (px)
Citation preview

National Health Expenditures 1995 Katharine R Levit Helen C Lazenby Bradley R Braden Cathy A Cowan Patricia A McDonnell Lekha
Sivarajan Jean M Stiller Darleen K Won Carolyn S Donham Anna M Long and Madie W Stewart
This article presents data on health care spending for the United States covering expenditures for various types of medical services and products and their sources of funding from 1960 to 1995 In 1995 $9885 billion was spent to purchase health care in the United States up 55 percent from 1994 Growth in spending between 1993 and 1995 was the slowest in more than three decades primarily because of slow growth in private health insurance and outshyofpocket spending As a result the share of health spending funded by private sources fell reflecting the influence of increased enrollment in managed care plans
INIRODUCfiON
In todays health care system providers and third-party payers face intense pressures Increases in health care spendshying during the late 1980s and early 1990s in relation to overall economywide growth focused the attention of purchasers on the problems of rising costs As the Federal Government attempted to control cost increases associated with Medicare and Medicaid employers sponsoring health insurance for their workers evaluated alternatives to conventional private health insurance (PHI) plans more intensely Both the private and public sectors reactshyed with increased enrollment in managed care plans Under heightened pressure
The authors are with the Office of the Actuary Health Care Financing Administration (HCFA) The opinions expressed are those of the authors and do not necessarily reflect those of HCFA
from managed care plans to reduce cost growth health care providers were transshyformed from revenue generators who individually orchestrated activity within the health care system to cost centers within a larger managed care system (Duke 1996) Faced with competition for patients an increased proportion of providers are responding to incentives to minimize costs Managed care plans negotiated rate discounts with providers in return for provider access to large groups of patients these plans also altered patterns of care through an emphasis on preventive services and elimination of unnecessary care and demanded costshyconscious decisionmaking by providers in the delivery of health care Faced with lower expected revenue growth providers were forced to find ways to reduce expense growth to remain financially viable and competitive
Health system changes are reflected in the matrix of spending trends recorded in national health expenditures (NHE) Most prominently growth in health spending in 1994 and 1995 reached its lowest points in more than three decades of measuring health care spending (Figure 1) Nominal expenditures grew 51 percent in 1994 and 55 percent in 1995 real (inflation-adjustshyed) 1 growth measured 27 percent in 1994 and 28 percent in 1995 Decelerating growth reflects changes occurring within the provider and PHI components of the health care industry during the 1990s
Deflated using the gross domestic product chain-weighted price index
HEAL1H CARE FINANCING REVIEWFall 1996Volume ts Number 1 175
Figure 1 Percent Growth In National Health Expenditures and Gross Domestic Product and National
Health Expendttures as a Percent of Gross Domestic Product Calendar Years 1960-95
I
middot I I I I I I I 1
I I I I I I
f I 1 1
bullbullbull
bull
bullbull
I bullbull
1 I I 1 I I r
I I
bull bull
National Health Expenditures 18 Gross Domestic Product
16
14
1 lbull
10
bull bull 6 bullbull bullbull 4
bull bull 2+-----------r------r-----------------r-----T
16
14
National Health Expenditures as a Percent of Gross Oomestk Product
12
bull
6
4+----------------------------------------- 1960 1965 1970 1975 1980 1965 1990 1995
CalendarYear
SOURCE Health Care Finaring Administration Office of the Actuary Data from the Office of National Health Statistics
HEALTII CARE FINANCING REVIEWFali1996Vol~met8Numbert 176
During the 1993-95 period health care spending as a percent of gross domestic product (GDP) exhibiteq virtually no change It stabilized between 135 and 136 percent (Figure 1) There were three additional periods since 1960 when the NHE share of GDP remained stable for 3shyyear periods 1964-66 1977-79 and 1982-84 Each of these periods was characterized by strong GDP growth For the first time in more than three decades however stabilshyity in NHE as a percent of G D P in the 1993-95 period was precipitated by a slowdown in the rate of growth of health care spending rather than an upswing in overall economic growth
The effects of health system changes are evident in the contrast between private and public sector financing From 1960 to 1990 growth in spending by both the private and public sectors was similar with only two notable exceptions the period 1966-67 when Medicare and Medicaid were introduced and the period 1974-75 which recorded the effects ofthe 1973 expansion of Medicare to cover the disabled population Each of these major expansions in public program coverages produced offsetting step-wise shifts in public and private financing responsibilities with the share shouldered by the public sector increasing The unique feature of the shift toward a larger public share beginning in 1990 is that it was not driven by public sector initiatives to add new populations or expand services although the number of people covered by the Medicaid program did increase In fact public sector expenditure growth has continued at approximately the same average annual rate since 1990 (99 percent) as between 1980 and 1990 (105 percent) At the same time average annual growth in private spending decelshyerated markedly between 1990 and 1995 to 52 percent from the 112-percent
average annual growth experienced during the 1980-90 period (Figure 2)
The disparity in growth among different types of personal health care (PHC) services narrowed in 1995 For all services except other personal health care spendshying growth ranged from a low of 45 percent (for hospital services) to a high of 89 percent (for dental services) The one exception other personal health care services which accounts for 28 percent of PHC is dominated by Medicaid home- and community-based waivers and miscellashyneous services that are provided by non-health care establishmentsz Spending for this sector grew 149 percent in 1995 faster than all other PHC sectors but slower than it did in 1994 (Table 1)
The changing distribution of health care spending mirrors the impact of managed care and to a lesser extent changes in Medicare payment policies The share of PHC eXPenditures spent on hospital and physician services has declined over the past 5 years while spending on home health services nursing home care and other personal health care services has increased These increases have paralleled increases in Medicare spending for home health and skilled nursing facility services
In the rest of this article we describe the changes occurring in several key sectors of the health care industry focusing on their impact on health care spending trends Data cited in the remaining discusshysion but not shown in an accompanying table or figure can be found in Figure 9 and Tables 8-17 at the end of this article
HOSPITAL CARE
Hospital care expenditures the single largest component of personal health
2Non-health care establishments include facilities such as schools military facilities social services agencies and conunushynity center5
HEALTil CARE FINANCING REVIEWFall 1996Volume 18 Number 1 177
Figure 2 Percent Growth and Percent Share of Public and Private National Health Expenditures
CalendarYears 1975middot95
Shares of National Health Expenditures
~----------------~------------
------------- _ shy
middotmiddot+--------------------------~ =
__-middot~--
1985 1990 1995
CalendarYear
SOURCE Health Care Financing Administration Office of the Actuary Data from the Office of National HeaRh Statistics
spending at 398 percent amounted to $3501 billion in 1995 Registering growth of less than 5 percent in the last 2 years spending for hospital services was among the slowest growing of any PHC services
The American Hospital Associations (1995) panel survey of community hospishytals reports that overall admissions per 1000 population increased in 1995 by 04 percent the first such increase in more than a decade Growth in admissions per 1000 population in 1995 comes from admissions for the population age 65 and over meanwhile admissions per 1000 for the population under age 65 continued to
decline but at a slower rate Despite the slight increase in admissions per 1000 population inpatient days in community hospitals continued to fall by almost 3 percent overall indicating declining overall length of stay When the number of beds is not reduced to match the decline in days occupancy rates fall and excess capacity grows In 1995 overall occupancy rates in community hospitals fell to less than 60 percent (Heffler et al 1996) the lowest rate in history Such rates put renewed pressure on hospitals to develop new sources of revenues to negotiate with managed care plans for access to patients
HEALni CARE FINANCING REVIEWFali1996Volume 18 Nber 1 178
Table 1
~ sect l
~ ~
~ ~
f ~
I ~ ~
t
Personal Health Care Expenditure Aggregate Amounts Percent Distribution and Average Annual Percent Change by Type of Expenditure Selected CalendarYeara1960~95
Type of Expenditure 1960 1970 1980 198S 1990 1991 1992 1993 1994 1995
Amount in Billions Persooal Health Care $236 $638 $2170 $3764 $6147 $6766 $7405 $7669 $8279 $6766
Hospital Care 93 280 1027 1683 2564 2823 3054 3233 3350 3501 Physician Services 53 136 452 836 1463 1592 1757 1827 1906 2016 Dental Services 20 47 133 217 316 333 370 392 421 458 Other Professional Services 06 14 64 166 347 383 421 463 491 526 Home Health Care 01 02 24 56 131 161 196 230 263 266 Drugs and Other Medical Non-Durables 42 88 216 371 599 SS6 712 750 777 834 Prescription Drugs 27 55 120 212 377 421 466 494 513 555
Vision Products and Other Medical Durables 06 16 38 67 105 112 119 125 129 138 Nursing Home Care 08 42 176 307 509 572 623 670 724 779 Other Personal Health Care 07 13 40 61 112 136 154 179 217 250
Percent Distribution Personal Health Care 1000 1000 1000 1000 1000 1000 1000 1000 1000 1000
Hospital Care 393 439 473 447 417 417 412 411 405 398Physician Services 224 213 208 222 238 235 237 232 230 229Dental Services 83 73 ~1 58 51 49 50 50 51 52Other Professional Services 26 22 29 44 56 57 57 59 59 60Home Health Care 02 03 11 15 21 24 26 29 32 33 Drugs and Other MedJcal Non-Durables 180 138 100 98 97 97 96 95 94 95 Prescription Drugs 113 86 56 56 61 ~2 63 63 62 63
VISion Products and Other Medical Durables 27 25 17 18 17 17 16 16 16 16 Nursing Home Care 36 66 81 81 83 84 84 85 88 89 Other Personal Health Care 29 20 19 16 18 20 21 23 26 28
Average Annual Percent Change from Previous Year Shown Personal Heahh Care - 105 130 116 103 101 95 63 52 61
Hospital care - 117 139 104 88 101 82 59 36 45 Physician Services - 99 128 131 118 88 10-4 40 44 58 Dental Services - 91 111 102 78 56 110 60 73 89 Other Professional Services - 88 163 212 158 104 100 100 61 70 Home Health Care - 145 269 189 184 224 223 171 144 86 Drugs and Other Medical Non-Durables - 76 94 114 101 94 86 54 36 73 Prescription Drugs - 75 82 119 122 119 106 61 38 81
Vision Products and Other Medical Durables - 96 88 124 92 70 63 51 28 72 Nursing Home Care - 174 154 117 107 122 90 76 81 75 Other Personal Health Care - 65 120 88 129 207 133 164 216 149
NOTE Numbers rn8if not add to totals beealtse of rounding SOURCE Health Care financing Administration Offie of the amppound1uaJY Data from the Office of National Health Statistica
~
0
and to integrate both horizontally with other local and national hospital organizations and vertically with physicians and other health care providers and insurers (Duke 1996)
An increasing number of hospitals are expanding their lines of business to provide more than just inpatient and outpashytient hospital care In addition to fitness facilities and home health care agencies they are using excess bed capacity to add rehabilitation and skilled nursing or subacute care facilities to broaden their revenue base (Lewin-VHI Inc 1995) Creating subacute care facility units from underused inpatient units enables hospishytals to compete for the followup institutional care that discharged patients often need for full recovery Incentives exist for hospitals to discharge patients as soon as possible Medicares inpatient hospital payment is diagnosis-based and prospectively determined regardless of length of hospital stay Managed care plans which often pay for hospitalization on a daily rate also encourage fewer inpatient days But community nursing homes traditionally providing custodial services and limited medical care are frequently not staffed and equipped to handle patients discharged from hospitals quicker and sicker Hospitals with a subacute care unit can discharge patients from their hospital stays quickly and admit them to the skilled-nursing or subacute care unit for their followup care maximizshying their revenue from the overall stay Under Medicare a hospital is compensatshyed for the inpatient stay on a prospectively determined diagnosis-related group (DRG) basis and the nursing or subacute facility stay on a reasonable-cost basis (Anders 1996)
With the rise of enrollment in managed care plans and falling occupancy rates hospitals have been forced to consider the benefits of mergers and alliances with local
and national hospital organizations Squeezed by high operating expenses competition from market-area providers and the prices managed care organizations were willing to pay providers for services hospitals have sought alliances with similar community facilities or with national chains Some alliances have been based on geographic location and others on religious affiliation Most have been aimed at integrating services reducing competition and increasing cooperation in order to compete effectively for managed care business (Duke 1996) Increasingly largeshyly consolidated for-profit hospital organizations are buying non-profit facilishyties facing difficulties in the highly competitive hospital marketplace Forshyprofit chains strengthen the market position of acquired facilities by cutting costs Communities worry however that takeovers of their local facilities will threatshyen the existence of hospital-provided charity and preventive services and cost jobs in their community (Langley and Sharpe 1996 Rundle 1996)
Expenditures for inpatient services in community hospitals accounted for 62 percent of all hospital revenues in 1995 (fable 2) Growth in inpatient expendishytures has slowed since 1990 paralleling decreases in inpatient days and length of stay Some of this deceleration can be attribshyuted to the rise of managed care According to the HMO and PPO Industry Profile health maintenance organizations (liMOs) the most restrictive type of managed care plan cover about 20 percent of the resident population HM0 members experience fewer total hospital days per thousand fewer admissions per thousand and shorter average lengths of stay than the population at large HM0 members were hospitalized about two-thirds as often as the population as a whole in 1993 [and] spent about half as many days in
HEAL1H CARE FINANCING REVIEWFall 1996Yclume tamp Number t 180
~ ~ l
~ z ~ ~ l ~
~ ~ bullbull ~ zbull ~
Table 2 Hospital Revenues Percent Distribution and Annual Percent Growth
Calendar Years 1990middot95
Type of Hospital 1990 1991 1992 1993 1994 1995
Revenues in Millions Total $256447 $282272 $305357 $323272 $334966 $350120
Non-Federal 238570 262533 284665 301217 312323 326877 Community 221604 245476 267881 284891 296333 311283
Inpatient 169221 163516 196452 206410 210426 216593 Outpatient 52363 61960 71429 78481 85907 94691
Non-Community 16966 17057 16784 16326 15990 15594 Federal 17877 19739 20692 22055 22643 23242
Percent Distribution TotaJ 100 100 100 100 100 100
Non-Federal 93 93 93 93 93 93 Community
Inpatient 86 66
87 88 64
88 64
88 83
89 62
Outpatient 20 22 23 24 26 27 Non-Community 7 6 5 5 5 4
Federal 7 7 7 7 7 7
Annual Percent Growth Total 107 101 82 59 36 45
Non-Federal 109 100 84 58 37 47 Community 113 108 91 63 40 50
Inpatient 91 84 70 51 19 29 Outpatient 189 183 153 99 95 102
Non-Community 56 05 -16 -27 -21 -25 Federal 89 104 48 66 27 26
NOTE Non-comrrunity non-Federal hospitals include long-term care hospitals (where the average length of stay is 30 days or longer) psychiatric hospitals alcohol and chemical dependency hospitals units of institutions such as prison hospitals or college infirmaries chronic disea5e hospitalo~ 11nd some in5titution$ for the mentally retorded
SOURCE Heath Care Financing Administration Office of the Actuary Data from lhe Office of National Health Statistics
sect
the hospital Growth in other types of managed care organizations (especially PPOs) and the increasing use of utilizashytion review by indemnity health insurance plans may also have contributed to this trend (Dial et al 1996)
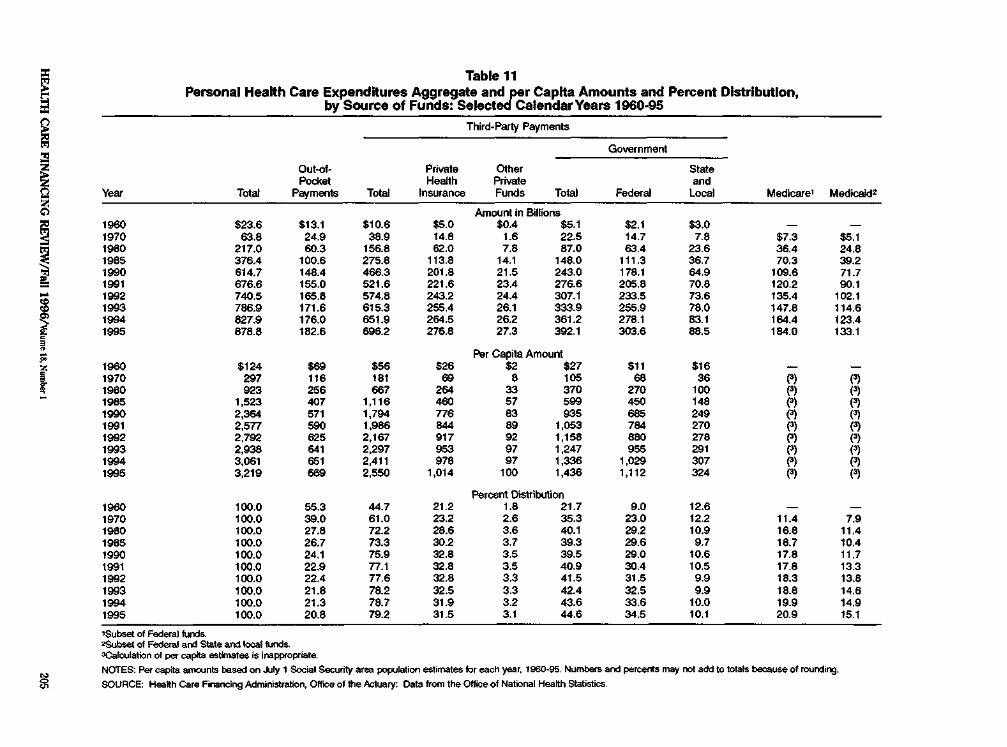
Nearly all hospital care was financed by third parties in 1995 with only 33 percent paid by consumers in out-of-pocket expenshyditures PHI accounted for a 323-percent share Total public funding accounted for a 612-percent share Medicare and Medicaid the primary subset of public payers financed 470 percent of hospital care The remaining 32 percent of hospital revenues carne from philanthropic and non-patient sources such as hospital gift shops parking facilities and cafeterias
PHYSICIAN SERVICES
Expenditures for physician services reached $2016 billion in 1995 an increase of 58 percent from the previous year Spending for services in this sector accounted for 229 percent of PHC For the last 3 years growth in spending for physishycian services has been lower than the growth in overall PHC expenditures This slow growth is linked to the expansion of managed care
The health care system in the United States has historically been controlled by providers with physicians typically decidshying type and place of treatment In recent years the growth of managed care has caused the locus of control to shift from provider to insurer (Zwanziger and Melnick 1996) with the insurer having more input into treatment plans This fundamental change in the health care delivery system has been precipitating changes in the organization of physician practices demand for types of physician specialties utilization of physician services and income of physicians In 1993
and 1994 these changes contributed to the slowdown of growth in expenditures for physician services By 1995 physician expenditures showed a slight upturn in growth rate although growth was still lower than the growth in PHC spending There is anecdotal evidence to suggest that increased utilization and referral to specialists may be part of the reason for the slight acceleration in growth (Wooton 1996 Rice et al 1996)
The share of physician expenditures funded by PHI rose between 1990 and 1995 consistent with managed cares emphasis on services provided by primary care physicians Meanwhile the share funded by Medicare remained unchanged as a result of the implementation of the Medicare Fee Schedule (MFS) to pay physicians for services and volume perforshymance standards (VPS) to limit the effect of induced utilization increases Payment mechanisms used by both managed care and Medicare put pressure on physicians to curb expenditure growth There is no evidence to suggest that physicians shifted costs to private insurers with the advent of the MFS because physicians were restrained by market forces from raising pricesbull Managed care and MFS caused spending growth to drop to 58 percent in 1995 from 115 percent in 1990
Changes in the way physicians deliver services are evident in US Bureau of the Census (1996) data on revenue sources of physician offices From 1992 to 1994 the
3Medicare implemented the VPS in 1990 and the physician fee schedule based on a resource-based relative value scale (RBRVS) in 1992
4However physicians were able to increase the volume of services to privately insured patients and recoup some of their income by increased utilization (Rice et al 1996) snata cited are for taxable employer firms only they exclude information from physician establishments that are tax-exempt andor have no employees and from offices of osteopathicphysicians The NHE physician category is more inclusive than this subset of physician office data The NHE category includes both taxable and tax-exempt physicians (medical doctors and doctors of osteopathy) as well as employer and non-employerphysicians
HEALTH CARE FINANCING REVIEWFalii996Volumet8Numbert 182
percentage of revenues earned from the delivery of inpatient hospital services fell while those earned through the delivery of services in doctors offices and hospital outpatient settings rose (fable 3) Part of the decline in percentage of revenues from hospital services may be associated with falling number of inpatient days
Growth in managed care enrollment had a direct impact on physician organizations The number of physicians signing contracts with managed care organizations is on the rise In 1990 61 percent of physi-dans had a managed care contract by 1995 that proportion had grown to 83 percent Although physician participation middot in managed care had grown substantially the percent of revenues received through managed care contracts grew more slowly from 28 percent in 1990 to 33 percent in 1995 (Emmons and Simon 1996)
As the number of managed care contracts has increased the structure of physician practices has changed Group practices have become more prevalent Physicians have joined together in larger group practices to offer the breadth of services necessary to attract managed care contracts and to consolidate expenses Groups can also absorb some of the risk
associated with managed care contracts Within physician practices the proportion of physicians who are employed has increased while the proportion of physishydans in solo practices or self-employed in group practices has declined (Kletke Emmons and Gillis 1996) Employed physicians tend to work fewer hours see fewer patients and earn lower income than physicians who own a practice (American Medical Association 1996) As the number of employed physicians increases earnings of physicians on average could fall
In 1994 physicians income decreased for the first time in recent history This may be a result of the growth in managed-care contracts The decline was more pronounced for the high earners while the income of low earners continued to rise (Simon and Born 1996) The decline also affected primary care physicians and procedur~riented physicians differently Primary care physicians income increased faster than average while the income of procedur~riented physicians declined or increased at a slower-than-average rate (Moser 1996)
As the impact of managed care on the health industry has increased there has been more emphasis on primary and
Table 3 Sources of Receipts In Physician Officest Calendar Years 1992middot94
Source of Receipts 1992 1993 1994 1992 1993 1994
Amount in Billions Percent Distribution TotaJ $1414 $1445 $1504 1000 1000 1000
Patient Care and Other Professional Services 1377 1409 1472 974 975 979 Patient Care Services 1305 1336 1399 923 924 930
Laboratory Services 72 76 79 51 54 52 X-Ray Services 141 137 140 100 95 93 Hospital Inpatient Services 318 304 311 225 210 207 Hospital Outpatient Services 167 179 191 118 124 127 Services Delivered in Physician Offices 596 626 670 422 433 446 Other Services Delivered at Other Sites 10 10 09 07 07 06
Other Medical Professional Services 72 74 72 51 51 48 Merchandise Sales 17 16 16 12 11 11
Prescription Drugs 03 03 04 02 02 03 Other 14 12 12 10 06 08
All Other Sources 20 21 16 14 14 11
Information for taxable employer firms only
SOURCE US Departmelll of Commerce Bureau of the Census Data from the Services Anrua( Survey 1994
HEALTII CARE FINANCING REVIEWFall 1996Volllme 18 Number 1 183
preventive care and less on the services of specialists Since 1990 the demand for specialists has dropped as measured by physician recruitment advertising while the demand for generalists has been rising (Seifer Troupin and Rubenfeld 1996) This change in type of physician will also affect the future of medical schools and the type of training available to incoming students As an indication of this trend the percent of recently graduated residents unable to find full-time jobs in their specialties amounted to more than 6 percent in two hospital-based specialities (anesthesiology and pathology) and one surgical specialty (plastic surgery) Similar rates for various primary care specialists were 21 percent or less (Miller Jonas and Whitcomb 1996)
Utilization of physician services remained stable over the 1993-94 period at approximately 6 contacts per person per year after rising steadily from 53 contacts per year in 1989 (National Center for Health Statistics 1996) The contribution to the increase in number of physician contacts per person differed by age group For the population age 65 years or over the number of physician contacts per person grew consistently between 1989 and 1994 but experienced a particushylarly large increase between 1990 and 1991 For the population age 15-64 utilizashytion increased between 1989 and 1992 but
has remained fairly constant since (fable 4) possibly a response to increased enrollment in managed care
PRESCRIPTION DRUGS
Americans purchased $555 billion worth of prescription drugs in 1995 (fable 5) Prescription drug spending growth was slower than that of PHC in 1993 and 1994 (61 and 38 percent respectively) but jumped to 2 percentage points faster than PHC in 1995 (81 percent) Surveys show that about two-thirds of the accelerated 1995 growth comes from an increase in the number of prescriptions sold Depending on the survey used this increase ranged from 57 (IMS America 1996) to 78 percent (Schondelmeyer and Seoane-Vazquez 1996)
The key to the utilization changes lies in changes in the sources paying for prescripshytion drugs Third parties are absorbing an increasing share of prescription drug expenshyditures Between 1990and 1995 the share of prescription drug spending paid out of pocket rell 9 percentage points offset by larger shares paid by third-party payers PHI share increased 5 percentage points and the Medicaid share increased 4 percentage points (FigUre 3) Even smaller payers such as the US Department of Veterans Mfairs and US Department of Defense through the latters Civilian Health and Medical
Table 4 Physician Contacts1 per Person by Age Calendar Years 1987middot94
Age Group 1987 1986 1989 1990 1991 1992 1993 1994
Number Total2 54 53 53 55 56 59 60 60
Under 1 5 Years 45 46 46 45 47 46 49 46 15-44 Years 46 47 46 46 47 50 50 50 45-64 Years 64 61 61 64 as 72 71 73 65 Years or Over 89 87 89 92 104 106 109 113
bullA consultation wijh a plltsiolan (or another perampln working under a ptjsieians supervision) In person or t1f telephone for examination diagnosis treatment or advice Place of contact includes office hospital outpatient clinic emergency room telephone home clinic heaRh maintenance orgarishyzation and other places located outside a hospital ~ge-adiJsted
SOURCE (Nation~ Center for Health Statistic$ 1995)
HEAL1H CARE FINANCING REVIEWFall 1996Vdume 18 Number 1 184
Table 5 Expenditures for Drugs and Other Medical Non-Durables by Source of Funds
Calendar Years 1990-95
Source of Funds 1990 1991 1992 1993 1994 1995
Amount in Billions Drugs and Non-Durable Medical Products $599 $656 $712 $750 $777 $834
Prescription Drugs 377 421 466 494 513 555 Out-of-Podltet Payments 182 193 204 212 214 219 Third-Party Payments 195 229 262 282 299 336
Private Health Insurance 130 152 180 191 198 221 Medicaid 51 62 67 77 65 96 General Assistance 09 09 09 09 10 10 Other Government 04 05 05 05 06 07
Non-Presaiptlon Drugs and Other Medical Non-Durables2 222 234 246 256 264 279
Out-of-Podltet Payments 222 234 246 256 264 279
Percent Distribution by Source of Funds Within Each Category Prescription Drugs too 100 too 100 100 100
Out-of-Pocket Payments Third-Party Payments
~ laquo ~ ~ ~
~ ~ ~ ~ ~ M Private Health Insurance ~ ~ ~ ~ ~ ~ Medicaid 14 15 14 16 17 18 General Assistance 2 2 2 2 2 2 Other Government 1 1 1 1 1 1
Non-Prescription Drugs and Other Medical Non-Durables2 100 100 100 100 100 100
Out-of-Pocket Payments 100 100 100 100 100 100
This daampS of expenditure measure~ spending for prescriptilln drugs over-the-counter medicines and sundries purchased in retail outlets The value of drugs and other produets provided by hospials rursing homes or health pmfessionals is included in estimates of speoling klr these providers seVices bullAssumes no third-party payments lor non-pre$Cfiptioo drugumd other medical non-durables
NOTE Numbers and percerrtages may not add to totals because of rounding
SOURCE Heatth Care Financing Administration Office of the Actuary Date from the Office of Na~onal HeaHh Statistics
Program for the Uniformed Services (CHAMPUS) experienced impressive growth in drug expenditures
There are several contributing reasons for high prescription drug spending growth in 1995 First the existence of third-party coverage increases the likelishyhood that individuals will fill prescriptions and the switch to managed care iocreases the likelihood even more More than 9 out of 10 employees enrolled in an employershysponsored health plan in medium and large firms had coverage for outpatient prescription drugs throughout the 1980s and 1990s (Baker and Kramer 1995) Although most medical plans have covered outpatient drugs for many years the shift of plan subscribers between traditional feeshyfor-service plans and managed care plans has had an effect on out-of-pocket payment requirements In traditional fee-for-service
plans outpatient prescription drugs are typically covered under general plan covershyages that require a yearly deductible Under a deductible arrangement the plan subscriber is responsible for all medical charges including prescription drug charges until those charges exceed the deductible6 By contrast HMO plans require only a nominal dollar copayment per prescription typically $3 or $5 (US Bureau of Labor Statistics 1994) The relatively low out-of-pocket costs of prescription drugs in HMOs and other managed care plans may help to explain the recent growth in the demand for and utilization of prescription drug benefits
Although pharmaceutical manufacturers initially feared that managed care plans
According to KPMG Peat Marwick (1995) the average single plan deductible for a fee-for-service plan was $257 in 1995 and the family deductible was $603
HEALTH CARE FINANCING REVIEWFall1996VOiumet8Numbert 185
Figure 3 Prescription Drug Spending by Type of Payer
CalendarYears 1990-95
60 -
bullbullbullbullbullbullbullbullbullbullbullmiddot Out-of-Pocket Payments 55 - ---shy Private Health Insurance
- - - - - - Medicaid and Other Public 50 -
middotbullbullbullmiddotmiddotmiddotmiddotbullbull 45 - bullbull
j Jl- bullbullbullbull middotbullmiddotmiddotbullmiddotmiddotbullbullmiddotbullmiddotmiddotmiddotmiddotmiddotmiddotmiddotmiddotmiddotbullmiddot__________________________ middot_middot_middotmiddot_middotmiddot~middot~--~-middot~
30
25
20-
-------------------------shy15 -t---------------------r-------~------
1990 1991 1 1993 1994 1995
CalendarYear
shy
shy
SOURCE Health Care Finaring Administration Office of the Actuary Data from the Office of National Health Statislics
would restrict drugs sales they now believe that managed care has been partly responsimiddot ble for recent increases in prescription drug sales To reduce the use of more expensive services prescription drugs are frequently ordered as an inexpensive way to control chronic illnesses uncovered through prevenshytive screening Low copayments required by managed care plans also encourage patients to fill more prescriptions than they did when facing higher copayments or deductibles or the entire cost of the prescription
Second the sites where drugs are dispensed are changing with more prescriptions being filled in retail outlets Fewer prescriptions are dispensed in the hospital setting (partly because of fewer
7Jn the NHE the prescription drug category only measures purchases in retail outlets Sales of drugs through hospitals physician offices nursing homes and other non-retail sites are captured in their respective expenditure category
inpatient days) and potentially more in the retail market Hospital purchases of prescription drugs remained flat over the past 3 years at $10 billion (IMS America 1996) This differs significantly from the retail pharmacy experience where the number of prescriptions dispensed through drug stores mass merchandisers food stores and mail-order firms grew 57 percent from 1994 to 1995 the secondshylargest growth recorded in recent history The growth of managed care has boosted sales of drugs through mail-order firms Mail order is frequently used to purchase drugs used to treat chronic conditions estimated to cover 60 percent of prescripshytion drug sales in 1995 (Day 1996) Prompted by employers interested in cutting prescription drug costs managed care plans emphasize use of mail order
HEALTH CARE FINANCING REVIEWFali1996VolumelRNumberl 186
Cost savings from mail-order firms come through bulk purchasing and processing of prescriptions However there is concern that maH-order firms often middotSUbsidiaries of drug manufacturers may favor the drugs of parent drug manufacturers on their formulary list (Genuardi Stiller and TrapnelL 1996)
Third increased spending on prescripshytion drug advertisements may be influencing consumers to request specific brand-name drugs from physicians (Tanouye 1996) Spending on direct-toshyconsumer prescription advertisements has more than doubled since 1992 (Figure 4)
Fourth one obvious factor in expendishyture growth is price per prescription Prices increased 19 percent in 1995 as measured by the Consumer Price Index
(CPI) and 27 percent as measured by the Producer Price Index (PPI) s In addition manufacturers began to constrain the growth of rebates in 1995 NHE subtracts rebates paid by manufacturers to thirdshyparty payers such as private insurance and Medicaid thus decreasing the price paid by third parties Therefore when rebate growth slowed in 1995 price growth reflected in NHE estimates accelerated Industry observers state that manufacturshyers have moved to performance-based rebates where specific volume or sales quotas must be met in order for a rebate to be paid Manufacturer rebates to Medicaid also fell as a proportion of total
IIThe PPI is designed to measure transaction prices and is dif(ershyent from the CPI which in some cases measures list or full charge prices~ (Heffler et al 1996)
Figure 4 Spending by Prescription Drug Manufacturers for Dlrect~tomiddotConsumer Advertisements
CalendarYears 1992middot95
$400
$357
$350
$300
e $25()
~ D 15bullc
$200
g i $150
$100
$5()
0
1992 1993 1994 1995 C81endarYear
SOURCE Conlan M lnYour-Face Pharmacy Will the Boom in R~ Ads AimEid at Consumers CortirMJe Drug Topics 140(13)92-98 July 8 1996
HEALTII CARE FINANCING REVIEWFall 1996Vclume 18 Number 1 187
Medicaid drug expenditures Because Medicaid rebates are based on best prices available to private purchasers falling rebates in the private market affect rebates paid to Medicaid
WNG-TERM CARE
Long-term care (LTC) includes spending for care received through freestanding nursing homes and home health agencies This sector accounted for almost oneshyeighth of PHC expenditures in 1995 or $1065 billion with public programs mainly Medicaid and Medicare financing 574 percent (fable 6) The share of LTC spendshying paid by Medicare more than doubled from 1990 to 1995 Growth in Medicare expenditures for home health and nursing home carelo accelerated sharply in 1988 when Medicare relaxed its conditions for
9Jn NHE home health agencies and nursing facility services provided through hospitals are included under hospital expen ditures iONursing home coverage under Medicare is limited to care provided in a participating skilled nursing facility after at least a 3-day acute care hospital inpatient stay
coverage and payment for these benefits Also affecting the accelerated growth for nursing home care are lingering effects of the short-lived Medicare Catastrophic Coverage Act of 1988
Public policy experts are concerned about the large public funding commitshyment to LTC that is expected to grow even larger over the next several decades In 1995 there were an estimated 342 million people age 65 and over by the year 2020 this number is expected to increase to 528 million (Social Security Administration 1996) Of all people age 65 and over 113 percent are age 85 or over the age group at risk of needing nursing home care and 443 percent are age 75 or over the age group most likely to need services from home health agencies Growth in the size of the elderly population emphasizes the increasing health care costs for LTC services that this population will generate much of which comes from public sources
Private sources predominately out-ofshypocket payments by patients or their families account for the remaining 426
Table 6 LongmiddotTerm Care Expenditures for Nursing Home and Home HeaHh Care1
by Source of Funds Calendar Years 1990-95 Source of Funds 1990 1991 1992 1993 1994 1995
Amount in Billions Total $640 $732 $819 $900 $987 $1065
Percent Distribution Private Funds 517 490 469 449 440 426
Out-of-Pocket Payments 404 378 359 341 333 325 Private Health Insurance 64 63 61 59 58 55 Other Private Funds 48 49 50 49 49 46
Public Funds 483 510 531 551 560 574 Federal Funds 309 326 353 380 391 405
Medicare 73 85 111 137 159 178 Medicaid 220 226 227 227 216 211 Department of Veterans Affairs 16 16 15 16 16 15
State and Local Funds 174 184 178 171 169 169 Medicaid 173 183 176 169 167 167 General Assistance 01 01 02 02 02 02
Total Medicaid 393 408 403 396 383 379 Medicaid and Medicare 466 493 514 533 542 556
Includes only those expenditures br services provided 111 freestanding rorsing homes and home health agencies Add~klnal services are provided ty hospital-based nursing homes and home hedh agencies
SOURCE Health Care Financing Administration Office of the AcluayenY Data from the Office of National Heatth Statistlos
HEALTII CARE FINANCING REVIEWFaii1996Vdumet8Numbert 188
percent of funds spent on LTC The share of LTC spending from out-of-pocket sources has been falling mostly offset by the rising share of Medicare spending Another segment of private funding is PHI Private health insurers have been aggresshysively marketing LTC insurance policies An estimated 38 million LTC insurance policies had been sold by December of 1994 (Health Insurance Association of America to be published) However despite evidence of increased private insurshyance coverage the PHI share of total spending for LTC has changed little over the past 5 years Consumer advocacy groups are concerned that consumers may not understand the conditions for payment of benefits established by some private health insurers These conditions may be severely limiting consumers chances of receiving benefits under their LTC policies Conditions for payment are based on combinations of impairments related to the need for assistance with activities of daily living (Alecxih and Lutzky 1996) Policyholders lose coverage when they are unable to afford continued payment of the high premiums required to keep policies in force the Health Insurance Association of America (1996) estimates a 6-percent average annual lapse rate after the first year for all LTC policies Also most policyshyholders with active policies are healthy with no immediate need for covered services These factors may be limiting the growth in PHI payments for benefits relative to new contract growth
Additional expenditures for LTC are included with hospital care in NHE In 1995 Medicare and Medicaid financed an additionshyal $57 billion for hospital-based nursing home care and $60 billion for hospital-based home health agency services Medicaid expenditures for a variety of home- and community-based waivers are considered to be LTC expenditures by some people
Expenditures for these services are included with other personal health care in NHE In fiscal year 1995 Medicaid funded $24 billion for services covered by home- and commushynity-based waivers
Nursing Home Care
In 1995 spending for nursing home care climbed to $779 billion and accounted for 89 percent of total spending for PHC Growth in nursing home care expenditures decelerated from 81 percent in 1994 to 75 percent in 1995 The nursing home expendishyture estimate for 1995 implies a $127 average charge per day for care in freestanding nursing facilities At that rate a 1-year stay would cost more than $46000 in 1995
The public share of funding for nursing home care increased for the fifth consecushytive year Although Medicaid is the major public payer funding 465 percent of nursing home care in 1995 increases in the public share of nursing home funding resulted from Medicare spending growth The Medicare share 94 percent in 1995 increased from 33 percent in 1990 with expenditures averaging growths of 35 percent annually throughout the period
Evidence suggests that average national nursing home occupancy rates are declinshying thereby creating excess beds (DuNah et al 1995) Competition from alternative forms of health care delivery such as home health agencies and assistshyed-living facilities contributes to declining occupancy and decelerating revenue growth In response to the slowdown in revenue growth some nursing homes are converting their unused beds into subacute care units (Lewin-VHI Inc 1995) The advantages to nursing facilities
ltThe adequacy or inadequacy of the nursing home bed supply compared with the size of the vulnerable population varies by Stale and is subject to interpretation by State officials respondshying to the question of adequacy
HEAL1H CARE FINANCING REVIEWFall 1996Volume t8 Number I 89
of creating a subacute care unit are twofold First subacute care units are designed to better accommodate the more intensive nursing care needs of patients discharged from hospitals quicker and sicker Both Medicare with its PPS and managed care plans receiving capitated payments for enrollees health care needs exert pressure on hospitals to constrain lengths of stay Nursing homes that capitalshyize on this growing market of patients by establishing subacute care units bolster declining occupancy rates Second patients requiring these services are more likely to be Medicare or private-pay patients Given that both Medicare and PHI pay at higher rates than Medicaid these subacute units could help to produce higher revenue streams
Because subacute care units require more skilled better trained and therefore more costly personnel and more expensive highshytechnology equipment expenditures for nursing home care are likely to rise as more facilities convert beds to these type of units
Home Health Care
Expenditures for freestanding private and public home health agencies amounted to $286 billion in 1995 Expenditures for the services and products provided by these agencies were 33 percent of PHC expenditures in 1995 a small but increasing share
Public sources predominately Medicare and Medicaid financed 553 percent of home health care spending in 1995 Out-ofshypocket payments by patients or their families funded one-half of all private spending PHI and non-patient revenue equally funded the residual portion of private spending
Growth in spending for borne health care decelerated steadily from a high of282 percent in 1990 to 86 percent in 1995 In 1988 Medicare
relaxed its home health care ooverage and e1igi bility criteria The number of home health agencies providing these Medicare services grew quickly to meet increased demand by Medicare beneficiaries Growth in Medicare home health expenditures peaked at 515 percent in 1990 and steadily derelerated to 179 percent in 1995 Themore recent deceleration in growth reoorded in the NHE is partially artnlJut able to NHE measuring only payments to freestanding home health agencies as home health care payments to hospital-based home health agenciesare included under hospital care and have been growing faster than those for freestanding agencies In recent years Medicare has sought to identifY and ultimately to proseshycute home health providers participating in fraud or abuse activities This may be having some etrect on the industry ltNerall because of Medicares status as the largest public payer
Home health agencies seeking to maintain or boost revenue levels are also developing subacute care units (LewinshyVHI Inc 1995) As with nursing homes these units or groups of more highly trained staff are designed to better serve patients discharged from hospitals but still in need of substantial home care for full recovery from their illnesses
MANAGED CARE
In recent years enrollment in employershysponsored PHI has shifted dramatically away from conventional fee-for-service insurance into managed care plans Such plans typically charge lower average premiums than traditional indemnity plans (Foster Higgins 1994 KPMG Peat Marwick 1995) by controlling provider costs and utilization of services In 1986 almost 90 percent of health plan particishypants in medium and large firms12 enrolled in traditional fee-for-service plans howevshy
J2Small firms and State and local governments showed similar trends
HEALTII CARE FINANCING REVIEWFall 1996Volume 18 Numberl
er by 1993 the number of participants had dropped to 50 percent (US Bureau of Labor Statistics 1994) Enrollment in HMOs typically the most restrictive of the managed care plans grew from 13 percent to about 23 percent of all employer-plan participants between 1986 and 1993
The fastest growing type of managed care plan was the preferred provider organization (PPO) These plans grew from 1 percent of health plan participants in 1986 to 26 percent in 1993 (US Bureau of Labor Statistics 1994) PPOs attempt to lower costs by establishing networks of providers that are paid according to negotiated fee schedules Many traditional fee-for-service plans now also generate a list of preferred providers for participants The advantage to
the participant for using the preferred provider is lower out-of-pocket costs
Survey data from KPMG Peat Marwick (1994 1995) (Figure 5) indicate that employees continue to migrate away from conventional fee-for-service plans and into managed care plans13 In 1995 HMO enrollment in employer-sponsored plans nearly equaled the enrollment in convenshytional plans it is predicted to edge ahead in 1996 (KPMG Peat Marwick to be published) Almost one-half of the US resident population was covered by an HMO or PPO plan in 1994 (Dial et al 1996) (Figure 6)
l3This can also be a function of the plans that the employer chooses to offer
Figure 5 Percent of Employees Enrolled in EmployermiddotSponsored Health Plans
by Type of Plan Calendar Years 1993middot95
50
45 42
40 sect 1993
bull 1994
35 lllll1995
i ~ 30 shyE w 250
~ 20
15
10
5
0 Conventional Health Preferred Point-of-Service
Plans Maintenance Provider Plans Organizations Organizations
SOURCE (KPMG Peat Marwick 1994-96
HEALTII CARE FINANCING REVIEWFall 1996Volbullmels Number 1 191
Figure 6 Percent of Medicare Enrollees Medicaid Recipients and US Population Enrolled In
Managed Health Care Plans 1992-95
~ Medicare
bull Medicaid
ffil] US Population
1992 1993 1994 1995
60
so
40
I 30
J 20
10
0
NOTE Figures giVen for US resident population enrollment in managed care for 1992 and 1993 exclude dependerts and are the~re not strictly compara~able to later years
SOURCES Health Care Financing Administration Office of Managed Care (Dial et al 1996)
Covered Services
Throughout the late 1980s and early 1990s the breadth of services covered by employer-sponsored PHI greatly expandshyed For example an increasing number of insurance plans began offering home health and hospice care coverage as less expensive alternatives to hospital stays Much of this expansion was driven by cost-containment strategies aimed at substituting lower cost services for more expensive care and by the desire to attract healthier participants
The rise in the availability of covered services was accelerated by the migration of employers and employees toward managed care health plans including HMO PPO and point-of-service (POS) plans Managed care health plans particushy
larly HMOs were much more likely to provide their members with coverage for many basic preventive services such as routine physical examinations well-baby care well-child care and immunizations and inoculations For example data from KPMG Peat Marwick (1995) indicate that in 1995 HMO enrollees were almost twice as likely to be covered for adult physicals as enrollees in conventional plans
Although conventional plans have been slow to catch up many have greatly expandshyed their coverage during the first hall of the 1990s into areas such as adult physicals and well-baby and well-child care However despite such increases these conventional plans still lag most managed care plans particularly HMOs in the overall level of preventive services coverage
HEAL1H CARE FINANCING REVIEWFalll996VdumetsNW11bert 192
Expansions in covered services continmiddot ued in 1996 More recent survey data from KPM G Peat Marwick indicate that the biggest increases for preventive services were in POS plans POS plan offerings for both adult physicals and wellmiddot child care coverage increased and HM0 plans were increasingly likely to cover chiropractic care Although just over oneshyhalf the HM0 plans are now offering such coverage they still remain far behind nonshyHMO plans which almost universally cover chiropractic services
MEDICARE
Medicares Hospital Insurance and Supplementary Medical Insurance programs funded $187 billion of spending for health services and supplies in 1995 an 116-percent increase over 1994 spending Ninety-eight percent of these expenditures were for PHC services for the 375 million aged and disabled Medicare beneficiaries enrolled on July 1 1995
Medicare is the largest public payer for PHC expenditures and for each of the service components covered by the program except nursing home care Over time with few exceptions Medicare has financed increasingly larger shares of spending for each service component In 1995 Medicare funded 209 percent of spending for PHC a full percentage point more than it funded in 1994 One-third of all spending for hospital care and one-fifth of expenditures for physician services are funded by Medicare Faster growth in the Medicare population compared with the general population and the aging of frail elderly Medicare enrollees are contributing factors to these increasing funding shares
Medicare expenditures for hospital care totaled $1126 billion in 1995 105 percent higher than in 1994 Expenditures for hospital care services cover inpatient
outpatient and hospital-based home health agency and skilled nursing facility services Relatively high growth in Medicare hospital expenditures that has continued in recent years may be in part the result of expansions of hospital-based subacute units that allow Medicare patients to be discharged quickly from hospitalization and admitted into the same facilitys subacute care unit This permits hospitals to limit expenses incurred for Medicare hospitalizations which are compensated at a fixed amount regardless of length of stay and continue treating the patient under Medicares cost-based reimbursement policies for skilled nursing home care (Anders 1996)
Medicare and Pill Comparison
The 1996 Medicare Trustees Report predicts that growth in Medicare spending will deplete the Medicare Hospital Insurance trust fund by early in 2001 and recommends that Congress act quickly to reduce the growth in program costs Such action would extend the date of trust fund exhaustion and provide the time necessary to solve the long-term financial imbalance between costs and income (Board of Trustees Federal Hospital Insurance Trust Fund 1996)
The debate over how to fix the imbalance between Medicare income and expenditures inevitably involves raising taxes or lowering expenditure growth The latter is particularshyly relevant in 1994-95 when spending growth in Medicare exceeded that of PHI Between 1993 and 1995 aggregate spending under the Medicare program (benefits plus administrative costs) increased at an 113shypercent average annual rate while spending for PHI (benefits plus the net cost of insurshyance) grew only 25 percent annually Part of the difference is attributable to differential growth in enrollment (Levit et al 1996)
HEALTH CARE FINANCING REVIEWFa111996Vdume18Numberl 193
Since the inception of the program Medicare enrollment has grown at twice the rate of PHI enrollment In 1995 this trend continued Medicare enrollment grew 16 percent compared with PHI enrollment growth of 09 percent
To remove this source of difference we calculated spending on a per enrollee basis for 1969-95 From 1969 to 1993 per enrollee spending by Medicare and PHI grew at similar rates (Figure 1) During the 1969-93 period average annual growth in Medicare per enrollee spending was slightly slower than growth in PHI spending overall and for each type of service except durable medical products (FtgUre 8) In 1994 and 1995 t4fhe durable category covers a different product line for the elderly and non-elderly Medical durable products purchased by the non-elderly consist primarily of eyeglasses and hearing aids while the Medicare population uses a wide variety of durable medical equipment and supplies
trends in growth rates for these two payers suddenly diverged Average annual growth in Medicare per enrollee spending for all PHC changed very little from past rates while average annual growth in per enrollee PHI spending decelerated dramatically Medicare spending for benefits per enrollee grew more than 25 times as fast as PHI spending per enrollee
Medicare spending growth moderated slightly for each type of service except home health and nursing home care during the 1993-95 period Expenditure growth in home health and nursing home services was affected by changes in the law and in Medicare regulations the residmiddot
Figure 7 Growth In per Enrollee Expenditures by Medicare and Private Health Insurance
Calendar Years 1970-95
bullbull bull bullbull bull
25
middotbull bull --- Medicarebull bullbullbullbull
20 bullbullbullbullbull bullbullbullbullbullbullbull Private Health Insurance
bullbull bull15 bullbull I middot-middot 10
5
0~---------------------- 1970 1975 1980 1985 1990 1995
bullExpenditures Include benefits and administration br Mricare and benefits and net oost of insurance for prilnrte health in~~Urance SOURCE Health Care Rnancing Admiristratlon Office of lhe Actuary Data from the Office of Natiooal Health Statietics
HEALTH CARE FINANCING REVIEWFall 1996klume ts Number 1 194
Figure 8 Average Annual Growth In Private Health Insurance and Medicare per Enrollee Benefits
Calendar Years 196993 and 1993-95
Private Health Insurance
~ 1969-93
bull 1993-95
30
5
0
Personal Hospital Care Physician Other Home Health Medical Nursing Health Care Services Professional Services Ourables Home Care Expenditures Services
SOURCE Hea~h Care Finaocing Admbullnistration Office of the Actuary Data from thE Office of National HeaRh Statistics
HEAL1H CARE FINANCING REVIEWFali1996Volumet8Numbert 195
ual effects of which were still being felt in 199515 Medicares continued strong growth in hospital services parallels the growth in admissions for the population over 65 years of age It also reftects the NHE definition of hospital services that includes not only inpatient services but outpatient services (including those provided through hospital-based home health agencies) and services in skilled nursing home units that are compensated on a reasonablltgteost basis Strong growth in Medicare physician expenditures is somewhat misleading in that it includes bonuses paid to physicians through the MFS in 1994 and 1995 for their restraint in volume (and intensity) increases in 1992 and 199317 Similarly Medicare will incorshyporate penalties in its MFS in 1996 and 1997 for volume increases in 1994 and 1995 that exceeded the VPS
One reason for the difference in Medicare and PHI expenditure growth in 1994 and 1995 is the growth in number of persons enrolled in employer-sponsored managed care plans and managed cares increased influence over providers Managed care plans negotiate price discounts with providers in return for provider access to large groups of patients they emphasize preventive services and elimination of unnecessary care and they demand costMconscious decisionmakirg by providers in the delivery of health care Each of these aspects serves to limit
IsJn 1988 Medicare eased its coverage criteria for home health benefits This relaxation produced an expansion of benefits and acceJerated growth in home health expenditures Similarly residual effects from the 1988 Medicare Catastrophic CoverageAct and relaxation ofconditions for paymentunder Medicare led to accelerated growth in spending for nursing home care 16Both the Federal Government (using Standard Industrial Classification codes) and the American Hospital Association collect infonnation on an establishment basis and include revenues received for all services rendered by that establishshyment ITfwo years after performance Medicare VPS penalizes or rewards physicians through the MFS for increases in physician volume and intensity of services used by Medicare beneficiaries
growth in PHI funding of services Most Medicare enrollees are not enrolled in HMOs Providers serving these beneficiashyries are paid on a prospectively set basis (for inpatient hospital care) or on a reasonshyablltgteost basis (for most other institutional services) For HMOs enrolling Medicare beneficiaries Medicare pays 95 percent of the local fee-for-service average reimburseshyment Thus managed care price discounts and other factors present in the larger health care marketplace do not necessarily translate into lower Medicare costs Because payment is set in law Medicare has been unable to respond as quickly as PHI to changing market conditions Experts are still investigating why managed cares costs are low Is its success caused by elimination of unnecessary utilization negotiated price discounts favorable enrollee selection or some combination of these (Newhouse 1996) Has managed care had an impact on qual~ ty of health care services Some policymakers are anxious to move quickly to adopt managed care strategies in hopes of reducing Medicare costs Other policyshymakers citing the issues raised above prefer to move more cautiously
MEDICAID
Combined Federal and State Medicaid spending for PHC accounted for 151 percent of total PHC in 1995 or $1331 billion Medicaid largely funds institutional services In 1995 hospital care and nursing home care accounted for two-thirds (369 and 257 percent respectively) of combined Federal and State Medicaid spending The program is the largest thirdshyparty payer of nursing home care financing 465 percent in 1995
In fiscal year 1995 there were 363 million persons who received some type of Medicaid benefit The groups of children
HEALm CARE FINANCING REVIEWFall 1996Votume 18 Number t 196
and adults in families with dependent children represented 683 percent of all Medicaid recipients in 1995 yet consumed only 262 percent of program benefits Nearly one-half of all Medicaid recipients were children (172 million) who consumed only 150 percent of all Medicaid benefits These children also accounted for more than two-thirds of all family-based criteria recipients but consumed only a little more than one-half of the benefits to families Conversely the aged blind and disabled represented just over one-quarter of all recipients but consumed nearly threeshyquarters of program benefits (fable 7)
Medicaid is funded jointly by Federal and by State and local governments For a State to receive Federal matching funds it must adhere to minimum requirements for eligishybility and services set by the Federal Government Within this broad framework State governments are afforded considershyable flexibility in designing the total scope of the program within the constraints of the State budgetary process One way States use this flexibility is through Medicaid waivers There are two types of Medicaid waivers program waivers (including homeshyand community-based service waivers and freedom-of-choice waivers) and research and demonstration waivers Home- and community-based waivers18 ailow States to place Medicaid-eligible persons into alternashytive non-institutional settings for certain types of medical and personal care Freedom-of-choice waivers allow States to place Medicaid beneficiaries into mandatory managed care plans (where beneficiaries have a choice of a minimum of two providers) Research and demonstration waivers (section 1115 of the Social Security Act) allow Federal Medicaid requirements to be waived in order to conduct experimenshytal pilot or demonstration projects
18Authorized under section 1915 (c) of the Social Security AcL 19Authorized under section 1915 (b) of the Social Security Act
The recent slowdown in Medicaid expenshyditure growth from 1993 to 1994 (from 126 percent to 85 percent) which continued in 1995 (84 percent) was partially driven by a slowdown in the growth of overall program recipients (73 percent in 1993 to 48 percent in 1994 and 35 percent in 1995) In addition the change in the proportion of the Medicaid population enrolled in managed care rather than fee for service may also have contributed to the overall expenditure slowdown State Medicaid programs view managed care as a way to constrain cost growth In shifting recipients to managed care plans States also shift the risk for health care costs to the plans As an increasing number of States employed this cost-containment option managed care enrollment grew quite rapidly The Medicaid managed care population represhysented only 95 percent of all Medicaid recipients in fiscal year 1991 but by fiscal year 1995 tripled in share to 321 percent HMOs currently represent 62 percent of all Medicaid managed care programs prepaid health plans 25 percent primary care case management programs 12 percent and health insuring organizations 1 percent (Health Care Financing Administration 1995)
The slowdown in Medicaid expenditure growth between 1993 and 1994 was also marked by a sharp deceleration in Federal Medicaid spending (fhe State share of Medicaid expenditures however grew at a steady rate) There was a marked increase from 1993 to 1994 in the percentage of States with higher-than-average Federal matching rates who also showed lower-than-average expenditure growth In other words the poorest States showed the slowest growth in Medicaid spending during this period which slowed the growth in overall Federal matching contnbutions This composition change caused the Federal percentage contribution to Medicaid spending to fall
HEALTH CARE FINANCING REVIEWFall 1996Volume 18 Number t 197
Table 7 Medicaid Recipients and Expenditures bY
Eligibility Category Fiscal Year 1995
Percent Distribution Recipients Expenditures
(Thousands) (Billions) Recipients Expenditures
All8igibilily Categoriesl 36282 $1201 1000 1000 Aged Blind and Disabled 99n 859 275 715 Families 24767 315 683 262
Children 17164 180 473 150
Ad 7604 135 210 112
1 Includes cl1ild and aged and non-aged Mults categoriZed as Qther or unknown not shown separat~
2Adults in families wHh dlpelldelbulll cNldiW NOTE Data replrted on Health Care Financing Administration Form 2062
SOURCE Health Care Finanoklg Aclmini~Jtialion Bureau of Data Management and Strategy 1995
CONCLUSION
This article descnbes the latest shifts that have occurred within the health care system Growth in private seclnr spending fell to low rates between 1993 and 1995 contnbuting heavily to the slow overall spending growth in those years NHE as a share of the Nations output of goods and services was stable for 3 years breaking the trend of rapid annual increases regisshytered in the late 1980s and early 1990s Questions about whether these trends will continue and how the Federal sector (primarily Medicare) will react to current changes in the health care marketplace continue to be asked but the answers are not clear How will physicians react to slow or negative income growth How will managed care plans respond to rapid increases in prescription drug use How will issues of quality and bias selection be
addressed by managed care plans What will happen to managed care premium increases once the transition of privately insured persons to these plans has stabishylized We can watch the answers to these questions unfold in future NHE analyses
ACKNOWLEDGMENfS
The NHE are prepared in the Office of National Health Statistics within the Office of the Actuary Health Care Financing Administration under the general direcshytion of Daniel R Waldo Director The authors wish to thank their colleagues for their comments and suggestions on an earlier version of this report Mark Freeland Marian Gornick Richard Foster John Klemm Solomon Mussey Daniel Waldo John Wandishin and Carter Warfield
HEAL1H CARE FINANCING REVIEWFall 1996Volume 18 Number 1 198
Table 8 National Health Expenditures Aggregate and per Capita Amounts Percent Distribution
and Average Annual Percent Growth by Source of Funds Selected Years 1960middot95 ~ l ~
i~ ~ -~ IE ~ poundbullbull ~ zbull ~
1960 1970 1960 1985 1990 1991 1992 1993 1994 1995
National Health Expenditures Private Public
Federal State and Local
US Population~
Gross Domestic Product
National Health Expenditures Private Public
Federal State and Local
National Health Expenditures Private Public
Federal State and Local
National Health ExpendibJres
National Health Expenditures Private Public
Federal State and Local
US Population Gross Domestic Product
$269 202 66 29 37
1901
$527
$141 106
35 15 20
1000 752 248 109 139
51
-----
--
$732 455 277 178 99
2148
$1036
$341 212 129 93 46
1000 622 378 243 135
71
106 85
153 198 102
12 70
Amount in Billions $2472 $4282 $6975 $7617 $8342 $8921
1425 2539 4131 4414 4788 6055 1048 1743 2843 3203 3554 3665 720 1233 1958 2244 2539 2776 326 510 665 959 1016 1089
Number in Millions 2351 2471 2600 2626 2652 2679
Amount in Billions $2784 $4181 $5744 $5917 $6244 $6553
Per Cspita Amount $1052 $1733 $2683 $2901 $3145 $3330
606 1027 1589 1681 1605 1887 446 705 1094 1220 1340 1443 306 499 753 855 957 1036 140 206 341 365 363 407
Percent Distribution 1000 1000 1000 1000 1000 1000 576 593 592 580 574 567 424 407 408 420 426 433 291 288 281 295 304 311 133 119 127 126 122 122
Percent of Gross Domestic Product 89 102 121 129 134 136
Average Annual Percent Growth from Previous Year Shown 129 116 102 92 95 69 121 123 102 68 85 56 142 107 103 127 110 87 150 114 97 146 131 94 127 92 116 83 60 72
09 10 10 10 10 10 104 85 66 30 55 49
$9371 5172 4199 3019 1180
2704
$6936
$3465 1913 1553 1116
436
1000 552 446 322 126
135
51 23 86 87 84
10 58
$9085 5321 4564 3284 1280
2730
$7254
$3621 1949 1672 1203
469
1000 538 462 332 129
136
55 29 87 88 84
09 46
1July 1 Social Security area popdatloo estimates br each year 1960-95 NOTE Numbers and
SOURCE Health Care Finaneing Administration Office of the Actuary Data flom the Offioe of National Health Statistlca
percents may not add to lotala becaUse of rourdlng
~
i8
Figure 9 The Nations Health Dollar
Calendar Year 1995
bullbullbull
Hospital Care 36e
Where It Came From Private Health
Other Personal Health Care 25cent
Medicare
Other Spending
- - _
Where It Went
other Private
Out-of-Pocket Payments 19cent
Nursing Home Care
ftwsician Services 20lt
NCffES Other private includes Industrial lnplant Marth SlaquoVVces non-patient reverves and privately finaned construction Other peBOMI health care include$ dental services other professional services home health care drugs and othef non-durable medical products vision pOducls and other durable medical products and other misceRaneous health care servicegt Oher spending covers prowam administration and the net cost of prtate neatth insurance plaquonment poJblic heaHh and research and construc~on
SOURCE Health Care Anencing Admirlltration Office ofthe Actuary Data frorn the Office of National Health Statistics
HEAL11f CARE FINANCING REVIEWFall1996Volumet8Numbert
Table9 National Health Expenditures Aggregate Amounts and Average Annual Percent Change
by Type of Expendhure Selected CalendarYears 1960-95~
~
~ ll ~ ~
fJ
e
Typ Na
H
R Nat
H
e of Expenditure 1900 1970 1980 1985 1990 1991 1992 1990 1994 1995
Amount in Billions tional Health Expenditures $269 $732 $2472 $4282 $6975 $7617 $8342 $8921 $9371 $9885 ealth Services and Supplies 252 679 2356 4118 6729 7368 80amp7 8631 9067 9578 Personal HeaHh Care 236 638 2170 3764 6147 6766 7405 7869 8279 8788
Hospital Care 93 280 1027 1683 2564 2823 3054 3233 3350 3501 Physician Services 53 136 452 636 1463 1592 1757 1827 1906 2016 Dental Services 20 47 133 217 316 333 370 392 421 458 Other Professional Services 06 14 64 166 347 363 421 463 491 526 Home Health Care 01 02 24 56 131 161 196 230 263 286 Drugs and Other Medical Non-Durables 42 88 216 371 599 856 712 750 777 834 Vision Products and Other Medical Durables 06 16 38 67 105 112 119 125 129 138 Nursing Home Care 08 42 176 307 509 572 623 670 724 779 Other Personal Health Care 07 13 40 61 112 136 154 179 217 250
Program Administration and Net Cost of Private Health Insurance 12 27 118 238 386 388 427 509 506 477 Government Public Health Activities 04 13 67 116 196 214 234 253 282 314 esearch and Construction 17 53 116 164 245 249 275 290 304 307 Research1 07 20 55 78 122 129 142 145 158 166 Construction 10 34 62 85 123 120 134 145 146 140
Average Annual Percent Change from Previous Year Shown ional Health Expenditures - 106 129 116 102 92 95 69 51 55 ealth Services and Supplies - 104 132 118 103 95 95 70 51 56 Personal Health Care - 105 130 116 103 101 95 amp3 52 61
Hospi1al Care - 117 139 104 88 101 82 59 36 45 Physician Services - 99 128 131 118 88 104 40 44 58 Dental Services - 91 111 102 78 56 110 60 73 89 Other Professional Services - 88 163 212 158 104 100 100 61 70 Home Health Care - 145 269 189 184 224 223 171 144 86 Drugs and Other Medical Non-Durables - 76 94 114 101 94 86 54 36 73 Vision Products and Other Medical Ourables - 96 88 124 92 70 amp3 51 28 72 Nursing Home Csre - 174 154 117 107 122 90 76 81 75 Other Personal Health Care - 65 120 88 129 207 133 164 216 149
Program Administration and Net Cost of Private Health Insurance - 89 158 150 102 04 102 191 -o5 -58 Government Public Health Activities - 139 175 115 110 92 93 79 116 113
Research and Construction - 122 81 71 84 17 105 53 49 08 Research1 - 109 108 75 93 58 98 22 93 50 COnstruction - 129 62 67 76 -24 112 87 05 -38
bullR-nh and development ~Dpendilures of drug companies and other manufacturers and providers of medical equipment and supplies are exetuded from resaanh expendllureos but are included in 1he ecpendMe class in whieh the product falls
NOTE Numbers may not add to toCals because of rounding
SOURCE Health Care Financing Administation Office of the Actuary Data from 1he Offioe of National Health Statistics
i
~
fl Table 10 National Health ExpendHures ~ Source of Funds and Type of Expenditure
Selected alendarYears 1990-95 PltMde
Government Consumer
Year and tYpe of Expenditure Tolal
_ All
Funds Oth Total Oltrtof Pookel
Private Health
Insurance Tolal Federal
Slale end
Looel Amount in Billions National Health Expenditures $6975 $4131 $3606 $1484 $2324 $323 $2843 $1958 $885
Heahh Services and Supplies 6729 4029 3800 1484 2324 221 2700 1854 848 Personal Health Care 6147 3717 3502 1464 2018 215 2430 1781 649
Hospital Care 2564 1150 1043 103 940 107 1415 1066 349 Physician Services 1463 1014 987 354 833 27 450 359 91 Dental Services 316 307 306 154 151 01 09 05 04 Other Professional Services 347 282 256 142 114 26 65 43 22 Home Health Care 131 80 59 36 23 22 51 41 10 Drugs and Other Medical Non-Durables 599 635 635 404 130 - 65 31 34 Vlsloo Products and Other Medical Durables 105 77 77 67 09 - 28 26 01 Nursing Home Care 509 250 241 222 19 09 259 157 102 Other Personal Health Care 112 22 - - - 22 90 54 36
Program Administration and Net Cost of Private Health Insurance 386 312 306 - 306 06 74 49 25
Government Public Health Activities 196 - - - - - 196 24 172 Research and Construction 245 102 - - - 102 143 104 39
Research 122 10 - - - 10 113 95 17 Construction 123 93 - - - 93 30 08 22
1991 National Health Expenditures 7617 4414 4073 1550 2523 341 3203 2244 959
Health Services and Supplies 7368 4313 4073 1550 2523 240 3055 2138 917 Personal Health Care 6766 4000 3766 1550 2216 234 2766 2058 708
Hospital Care 2823 1231 1116 112 1004 115 1592 1238 353 Physician Services 1592 1100 1073 357 716 28 491 385 106 Dental Services 333 323 321 162 159 01 11 06 05 Other Professional Services 383 306 276 146 130 29 77 52 25 Home Health Care 161 93 68 43 25 25 67 55 12 Drugs and Other Medical Non-Durables 656 579 579 427 152 - 76 37 39 Vision Products and Other Medical Durables 112 78 78 69 09 - 34 32 01 Nursing Home Care 572 265 254 234 21 11 307 184 123 Other Personal Health Care 136 24 - - - 24 111 67 44
Program Administration and Net Cost of Private Health Insurance 388 313 307 - 307 06 75 53 22
Government Public Health Activities 214 - - - - - 214 27 187 Research and Construction 249 101 - - - 101 148 107 41
Research 129 11 - - - 11 118 99 19 Construction 120 90 - - - 90 30 07 23
See notes at end of tabla
~ ~ i Qz
i0 ~
~ ~ 0
bullz
bull
~ l
~ il z
sect ~ ~ -i$ 1 ~ bullIbullbullzbull
Table10-Continued National Health Expenditures a Source of Funds and Type of Expenditure
Selected alendarYears 1990--95 Private
Consumer Government
All Private State Private Out of Health and
Year and Type of ExpendHure Total Funds Tolal Pocket Insurance Olh~ Total Fampderal Looo
1992 Amount in Billions
National Health Expenditures $8342 $4788 $4428 $1658 $2770 $360 $3554 $2539 $1016 Health Services and Supplies 8067 4678 4428 1658 2770 250 3389 2421 968
Personal Health Care 7405 4334 4090 1658 2432 244 3071 2335 736 Hospital Care 3054 1292 1174 117 1057 118 1761 1415 347 Physician Services 1757 1231 1203 382 821 28 526 408 118 Dental Services 370 357 355 182 173 01 13 08 06 Other Professional Services 421 332 302 160 142 30 89 62 27 Home Health Care 196 108 79 50 29 29 88 74 14 Drugs and Other Medical Non-Durables 712 630 630 450 180 - 82 41 41 Vision Products and Other Medical Durables 119 81 81 73 09 - 37 36 01 Nursing Home Care 623 276 265 244 21 12 347 215 132 Other Personal Health Care 154 26 - - - 26 127 78 50
Program Administration and Net Cost of Private Health Insurance 427 344 338 - 338 06 84 55 28
Government Public Health Activities 234 - - - - - 234 30 204 Research and Construction 275 110 - - - 110 165 118 47
Aosaaroh 142 12 - - - 12 130 110 20 Construction 134 98 - - 98 35 08 28
1993 National Health Expenditures 8921 5055 4670 1716 2954 385 3865 2776 1089
Health Services and Supplies 8631 4937 4670 1716 2954 266 3694 2655 1039 Personal Health care 7869 4530 4269 1716 2554 261 3339 2559 780
Hospital Care 3233 1346 1224 119 1105 122 1886 1520 386 Physician Services 1827 1271 1240 375 BB5 31 556 435 120 Dental Services 392 375 373 191 183 02 17 10 o8 Other Professional Services 463 363 330 182 148 33 100 72 28 Home Health Care 230 119 87 56 31 32 111 95 15 Drugs and Other Medical Non-Durables 750 659 659 468 191 - 92 47 44 Vision Products and Other Medical Durables 125 84 84 75 09 - 41 40 01 Nursing Home Care 670 285 273 251 22 12 385 247 139 Other Personal Heahh Care 179 28 - - - 28 150 92 59
Program Administration and Net Cost of Private Health Insurance 509 406 401 - 401 06 102 64 39
Government Public Health Activities 253 - - - - - 253 33 220 Research and Construction 290 119 - - 119 171 121 50
Research 145 12 - - - 12 133 111 21 Construction 145 107 - - - 107 38 09 29
~
8 See notes at end of table
~ Table 10-Contlnued National Health Expenditures ~ Source of Funds and Type of Expenditure
5elected alendarYears 1990-95
bull Government Consumer
All Out of Private Heallh
Slate end
Year and Type of Expenditure Total Fbullnds Total Podltet Insurance Othelt Total Fede Looal
1994 Amount In BIUions National Health Expenditure $9371 $5172 $4787 $1760 $3027 $386 $4199 $3019 $1180
HeaHh Services and Supplies 9067 5055 4787 1760 3027 268 4012 2887 1126 Personal Health Care 8279 -7 4405 1760 2645 262 3612 21a1 831
Hospital Care 3350 1342 1228 113 1115 113 20oe 1629 379 Physician Services 1906 1315 1284 373 911 31 591 487 125 Dental Services 421 403 402 199 202 02 18 10 08 Other Professional Services 491 380 343 191 152 37 111 82 29 Home Health care Drugs and Other Medical Non-Durables
263 n7
128 677
94 677
60 478
33 34 198 -
135 101
117 52
17 49
VISion Products and Other Medcal Ourables 129 85 85 76 09 - 44 42 01 Nursing Home Care 724 306 293 269 24 14 418 2a9 149 Other Personal Health Care 217 31 - - - 31 187 113 73
Program Administration and Net Cost of Private Health Insurance 506 388 382 - 382 06 118 67 50
Government Public Health Activities 282 - - - - - 282 38 244 Research and Construction 304 118 - - - 118 187 132 55
Research 158 13 - - - 13 146 123 23 Construction 146 105 - - - 105 41 09 32
1995National Health Expenditures 9885 5321 4932 1826 3106 389 4564 3284 1280
Health Services and Supplies 9578 5212 4932 1826 3106 280 4387 3144 1222 Personal Health Care 8788 4867 4593 1826 2768 273 3921 3036 885
Hospital Care 3501 1358 1245 114 1131 113 2143 1753 390Physician Services 2016 1376 1339 369 970 37 640 509 131 Dental Services 458 440 438 218 220 02 18 10 08 Other Professional Services 526 399 360 202 158 39 127 96 31 Home Health Care 286 128 93 60 33 34 158 138 20 Drugs and Other Medical NonmiddotOurables 834 720 720 498 221 - 114 59 56 Vision Products and Other Medical Ourables Nursing Home Care
138 n9
87 326
87 311
78 286
09 -25 15
51 453
50 293
01 160
Other Personal Health Care 250 33 - - - 33 217 128 89Program Administra11on and Net
Cost of Private Health Insurance 477 345 339 - 339 06 132 71 61Government Public Health Activities 314 - - - - - 314 38 276
Research and Construction 307 109 - - - 109 197 140 57166 14 - - - 14 152 129 23
Construction 140 96 - - - 96 45 11 34
I ~ 1
~
Iill
~ -8 ~ ~ bull I -z bull bull
NOTES Research and deVelopment expenlilures of drug companies and other manufacturers and providers of medical equipment and supplies are excluded from research expeoditures but areIncluded in the expendihJre class in which the product falls Numbers may not add to totals because of rounding SOURCE Health Care Financing Administration Offioe of the Actuary Data from the Oflioe of National Health Statistics
Table 11 Personal Health Care Expenditures Aggregate anrcr Capha Amounts and Percent Distribution
by Source of Funds Select Calendar Years 1960-95 ~ ~ l
~ l5 ~ ~ ~
f bull z
bull
ThirdmiddotParty Payments
Government
Out-of- Private other State Podltet Health Private and
YeN Total Payments Total Insurance Funds Total Federal Local Medlcare1 Medlcald2
Amount in Billions 1960 $236 $131 $106 $50 $04 $51 $21 $30 1970 638 249 389 148 16 225 147 78 $73 $51 1980 2170 603 1568 620 78 870 634 236 384 248 1985 3764 1006 2758 1138 141 1480 1113 367 703 392 1990 6147 1484 4663 2018 215 2430 1781 649 1096 717 1991 6766 1550 5216 2216 234 2766 2058 708 1202 901 1992 7405 1658 5748 2432 244 3071 2335 736 1354 1021 1993 7869 1716 6153 2554 261 3339 2559 780 1478 1146 1994 8279 1760 6519 2645 262 3612 2781 831 1644 1234 1995 8788 1826 6962 2768 273 3921 3036 885 1840 1331
Per Capita Amount 1960 $124 $59 1970 297 116
$56 181
$26 $2 $27 8 108
$11 $16 36 r1 ()
1980 923 256 1985 1523 407
667 1116
264 460
33 370 87 599
270 460
100 148
rgtr1
I~ ()
1990 2364 571 1794 776 83 936 685 249 () I~ 1991 2577 590 1986 644 89 1053 794 270 rgt () 1992 2792 625 2167 917 92 1158 890 278 rgt () 1993 2938 941 2297 953 97 1247 955 291 rgt I~ 1994 3061 9511995 3219 2411
2560 978
1014 97 1336
100 1436 1029 1112
307 324
rgt ()
() I~
Percent Distribution 1960 1000 553 447 212 18 217 90 126 1970 1000 390 610 232 26 353 230 122 114 79 1980 1000 278 722 286 36 401 292 109 168 114 1985 1000 267 733 302 37 393 296 97 187 104 1990 1000 241 759 328 35 395 290 106 178 117 1991 1000 229 771 328 35 409 304 105 178 133 1992 1OClO 224 776 328 33 415 315 99 183 138 1993 1000 218 782 325 33 424 328 99 188 146 1994 1000 213 787 319 32 436 336 100 199 149 1995 1000 208 792 315 31 446 345 101 209 151
1Subset of Federal funds 2Subset of Fedeal ard State and local fUnds 3Cafclllation of per capita estimates Is Inappropriate NOTES Per capita amounts based on _ry 1 Social Security area population estimates for each year 1960-95 Numbers and percents may not add to totals because of rounding
~ SOURCE Health Care F-ancing Administration Office of the Actuary Data from the Office of National Health Statistics
~ Table 12 Hospital Care Expenditures Aggregate and per Capita Amounts and Percent Distribution
by Source of Funds Selected Calendar Years 1960-95
Out-ofshyPoclltet
Third-Party Payments
Government
Private OthB Hh Private
State YaM Total Payments Total Insurance Funds Total Federal Local Medicarel MedicaidZ
Amount In Billions 1960 $93 $19 $74 $33 $01 $39 $16 $23 1970 280 25 255 91 09 155 102 53 $54 $27 1980 1027 53 974 364 50 559 422 138 264 106 1985 1683 88 1595 587 83 925 725 200 491 158 1990 2564 103 2462 940 107 1415 1066 349 697 297 1991 2823 112 2711 1004 115 1592 1238 353 762 382 1992 3054 117 2936 1057 118 1761 1415 347 864 429 1993 3233 119 3114 1105 122 1886 1520 366 926 476 1994 3350 113 3237 1115 113 2008 1629 379 1019 499 1995 3501 114 3387 1131 113 2143 1753 390 1126 520
Per Capita Amount 1960 $49 $10 $39 $17 $1 $21 $9 $12 1970 130 12 119 42 4 72 47 25 (~ PI 1990 437 23 1985 681 36 1990 996 40 1991 1075 43 1992 1151 44
414 645 947
1032 1107
155 238 362 382 399
21 238 33 374 41 544 44 606 44 584
179 293 410 472 533
59 81
134 135 131
(I(I (~PI (~
PI (~ PI (IPI
1993 1207 44 1994 1239 42 1995 1283 42
1163 1197 1241
413 412 414
46 704 42 743 42 7S5
568 603 642
137 140 143
(~(I (~
PI (~
PI Percent Distribution
1960 1000 207 793 356 12 425 173 252 1970 1000 90 910 324 32 554 364 190 192 95 1980 1000 52 948 355 49 544 410 134 258 104 1985 1000 52 948 349 49 549 431 119 292 94 1990 1000 40 960 366 42 552 416 136 272 116 1991 1000 40 960 356 41 564 439 125 270 135 1992 1000 3S 962 346 39 577 453 114 283 141 1993 1000 37 963 342 38 584 470 113 286 147 1994 1000 34 966 333 34 600 486 113 304 149 1995 1000 33 967 323 32 612 501 111 322 146
bullSubset of Federal funds 2Subset of Federal and State and local funds ltCalculation of per eapita eamptimates is inappropriate
~ ~ el
~ ~ ~ ~ ~ ~
ltgt ~ ~ bull ~ zbull t
NOTES Per capita amounts based on July 1 Social Security area population estimates breach year 1960-95 Numbers and percents may not add to tlaquoals because of rounding
SOURCE Health Care Financing Administration OffiCe of the Actuary Data from the Office of National Health Statistics
Table 13 Physlelan Service Expenditures A~gregate and per Capita Amounts and Percent Distribution
by Source of unds Selected Calendar Years 1960S5 ~ ~ l
~ ~ ~ ~ I ~
~ ~ bulli ~ ~ ~
Ye ToteJ
Out-ofshyPodlte1
Payments
Third-Party Payments
Medicarebull Medicaid2 Tot~
Government
Private Olh0ltHealth
Insurance Funds ToteJ Federal
State ~d
Local
1960 1970 1880 1985 1990 1991 1992 1993 1994 1995
1980 1970 1880 1985 1990 1991 1992 1993 1994 1995
1980 1970 1980 1985 1990 1991 1992 1993 1994 1995
$53 136 452 836
1463 1592 1757 1827 1906 2016
$28 63
192 338 563 606 663 662 705 739
1000 1000 1000 1000 1000 1000 1000 1000 1000 1000
$33 57
146 244 354 357 382 375 373 369
$17 27 62 99
136 136 144 140 138 135
627 422 324 291 242 224 218 206 196 183
$20 78
306 593
1109 1235 1375 1451 1533 1648
$10 37
130 240 427 470 518 542 567 504
373 578 676 709 758 n6 782 794 804 817
$16 48
171 334 633 716 821 885 911 970
22 73
135 243 273 309 323 337 355
302 352 379 399 432 450 467 473 478 481
Amount in Billions $00 $04
00 31 04 131 14 245 27 450 28 491 28 526 31 556 31 591 37 840
Pet Capita Amount $0 $2
0 14 2 566
10 173 11 187 11 198 12 207 12 219 14 234
Percent Distribution 01 71 01 225 08 289 16 293 18 307 17 309 16 299 17 304 16 310 19 317
$01 22
100 196 359 385 408 435 467 509
$0 10 43 79
138 147 154 163 173 187
14 163 221 234 245 242 232 238 245 253
$03 08 31 49 91
106 118 120 125 131
$2 4
13 20 35 40 45 45 46 48
57 62 68 59 62 66 67 66 65 65
$17 80
165 295 307 316 334 362 400
(~ (~ () (~ (~ (~ (~ () (~
122 176 197 202 193 180 183 190 198
$06 25 35 71 92
112 126 134 143
(~ (~ (~ () () (~ () (~ I~
48 56 42 48 58 63 69 70 71
Subset of Federal funds 2Subset of Federal and State and local funds 3Calculation of per capita estimates is inappropriate
_
NOTES The figure 00 denotes less than $ampl m~lion tor aggregate amounts and 0 derotes less than $050 lor per capita amounts Per capita alnOJnt$ based on July 1 Social Security area population estimates for eaoh year 1960-95 Numbas and percents may not add to totals because of rounding
~ SOURCE Health Care Financing Administration Office of the Actua~y Data from the Office of National HeaHh Statistics
~
iil Table 14 Nursing Home Care Expenditures Aggregate and per Capita Amounts and Percent Distribution
by Souree of Funds Selected CalendarYeare1960-95
Tot~ - Out-of-Pooket
Payments T~
Private Health
Insurance
Third-Party Payments
Government
Medicare1 Medicaid2
Other Private Funds Tot~ Federal
Stateand
Local
1960 1970 t980 t985 1990 t99t 1992 1993 1994 1995
1960 1970 t980 t990 1992 1993 1994 1960 1970 1980 1990 1992 t993 1994 1995
$08 42
176 307 509 572 623 670 724 779
$4 20 75
124 196 218 235 250 268 285
1000 1000 1000 1000 1000 1000 1000 1000 1000 1000
$07 23 74
136 222 234 244 251 269 286
$3 11 3t 55 86 92 94
105
779 535 418 444 436 409 391 374 371 367
$02 20
103 171 287 338 379 420 455 493
$1 9
44 69
110 129 143 157 168 181
221 465 582 556 564 591 609 626 629 633
$00 00 02 08 19 21 2t 22 24 25
$0 0 t 3 7 8 8 8 9 g
00 04 12 27 37 36 34 33 33 33
Amount in Billions $01 $01
02 17 05 95 06 157 09 259 t 1 307 12 347 12 385 14 418 t5 453
Per Capita Amount $0 t 8 2 41 2 63 4 tOO 4 117 4 131 5 144 5 155 5 166
Percent Distribution 63 157 49 412 30 540 18 511 19 508 18 536 19 557 t9 575 19 577 19 581
$01 tO 56 92
157 184 215 247 269 293
$0 5
24 37 60 70 8t 92 99
107
79 248 318 298 308 322 345 368 371 376
$01 07 39 65
102 123 132 139 149 160
$0 3
t7 26 39 47 50 52 55 59
78 164 222 212 200 215 212 207 206 205
$01 03 04 t7 20 32 46 59 73
() p) () () p) p) () p) ()
34 t7 14 33 34 St 68 82 94
$09 88
145 231 275 302 324 342 362
() () () () () (~ () (~ p)
223 500 472 454 481 485 484 472 465
bullSubset of Fede~al fund~2Subset of Federal and State and local fund~
~Calculation of per capita estimates is inappropriate
~ ~ ~
~ ~ sect ~ ~
~
~ bull
bull ~
NOTES The figure 00 denotes less than $50 million for aggegate amounts and 0 denotes less than $050 for per capita amouRs Per capita amounts based on lJ~ 1 Social SectJrity aree population estimates breach year 1960-95 Numbers and percents may not add to totals because of rounding
SOURCE Health Care Financing Administration OffiCe of the Actuary Data from the Office of National HeaHh Statistics
bull
I sect
0 ~ sect5
I ~
~ f bullz
1-
Table 15 Other Personal Health Care Expenditurest Aggregate and per Capita Amounts and Percent Distribution
by Source of Funds Selected Calendar Years 1960-95
Yea- Total
OUt-of-
Payments
Third-PEny Payments
Medicare2 Medicaldl Total
Private 01her Heolth
Insurance Fnds Totol
Government
Federal
State and
looaJ
1960 1970 1990 1985 1990 1991 1992 1993 1994 1995
1960 1970 1990 1985 1990 1991 1992 1993 1994 1995
1960 1970 1980 1985 1990 1991 1992 1993 1994 1995
$82 180 515 939
1610 1780 1972 2139 2299 2492
$43 84
219 380 619 678 743 798 850 913
1000 1000 1000 1000 1000 1000 1000 1000 1000 1000
$72 144 329 538 804 848 915 971
1004 1057
$38 67
140 218 309 323 345 363 371 387
874 799 639 573 500 476 464 454 437 424
$10 36
186 401 805 932
1057 1168 1294 1435
$5 17 79
162 310 355 398 436 479 526
126 201 361 427 500 524 536 546 563 576
$01 09 82
208 427 476 533 562 595 641
$1 4
35 84
164 181 201 210 220 235
15 50
160 222 265 267 270 263 259 257
Amount in Billions $02 $07
05 22 19 85 39 154 72 306 80 376 86 437 95 512
104 595 108 685
Per Capita AmOUlt $1 $4 2 10
36 bull 16 28 118 30 143 33 165 35 191 38 220 40 251
Percent Distribution 30 81 28 123 36 165 41 164 45 190 45 211 44 222 44 239 45 259 43 275
$04 12 56
101 200 250 298 356 417 460
$2 6
24 41 7T 95
112 133 154 176
48 69
110 108 124 140 151 167 181 193
$03 10 28 53
107 126 139 155 178 205
$14
12 21 41 48 52 58 66 75
34 53 55 56 66 71 71 73 78 82
$01 17 42 87
114 142 172 204 240
(~ (~ (~ (~ (~ (~ (~ (~ (~
07 32 45 54 64 72 81 89 96
$08 28 53
118 152178 219 259 306
() ()() () () () () () ()
45 55 57 73 86 90
103 112 123
Personal health care expenditures other than tiYIse for hospital care physician serviees and rursing home eare 2Sub$et of Federal fuols ~Subset of Federal and State anclloeal funds ~leulation of per capita estimates is inappropriate
shy
NOTES Per capilli amounts tsed on llly 1 Social Security area population estirnatlS for each year 1960-95 Numbers and pereents may rKit add to totals because of 100nding
~ SOURCE Haallh Care flnencing Adminislllltion Office of the Ntuaty Data from the Oflic of Natlcnal Health Statistics
0
~ - Table 16
Personal Health Care Expenditures by Type of Expenditure and Source of Funds Selected Calendar Years 1991-95
Other Vision Products Olh~ Prates- Home Drugs and and other Nursing Personal
Hospital Physician DemeJ sional Health Other Medical Medical Home Health Source of Funds Total c Services Services Services c Non-Durables Durables c Ce
1991 Amount in Billions Personal Health Care Expenditures $6766 $2823 $1592 $333 $383 $161 $656 $112 $572 $136 Out-of-Pocket Pcyenments 1550 112 357 162 146 43 427 69 234 Third-Party Payments 5216 2711 1235 17J 237 117 229 43 338 136
Private Health Insurance 2216 1004 716 159 130 25 152 09 21 Other Private 234 115 28 01 29 25 - - 11 24 Government 2766 1592 491 11 77 67 76 34 307 111
Federal 2058 1238 365 06 52 55 37 32 184 67 Medicare 1202 762 307 - 41 42 - 30 20 Medicaid 545 254 53 05 03 13 35 - 153 29 01hOlt 310 222 25 01 08 - 01 02 12 39
State and local 708 353 106 05 25 12 39 01 123 44 Medcaid 355 128 38 04 03 12 27 - 122 22 Other 352 226 67 01 22 00 13 01 00 22
1992 Personal Health Care Expenditures 7405 3054 1757 370 421 196 712 119 623 154 Out-of-Pocket Patments 1656 117 362 162 160 50 450 73 244 Third-Party Payments 5746 2936 1375 166 261 146 262 46 379 154
Private Health Insurance 2432 1057 621 173 142 29 160 09 21 Other Private 244 116 28 01 30 29 - 12 26 Government 3071 1761 526 13 89 88 82 37 347 127
FedOltal 2335 1415 406 08 62 74 41 36 215 78 Medicare 1354 664 316 - 50 59 - 34 32 Medicaid 657 316 66 06 04 15 39 - 171 37 01helt 324 232 25 01 09 - 02 02 13 41
State and Local 736 347 118 06 27 14 41 01 132 50 Medicaid 364 111 45 05 03 13 28 - 131 27 01helt 371 235 73 01 24 00 13 01 01 23
1993 Personal Health Gare Expenditures 7869 3233 1827 392 463 230 750 125 670 179 Out-of-Pocket Payments 1716 119 375 191 162 56 468 75 251 Third-Party Payments 6153 3114 1451 202 261 174 282 50 420 179
Private Health Insurance 2554 1105 865 183 148 31 191 09 22 Other Priva1e 261 122 31 02 33 32 - - 12 28 Government 3339 1886 556 17 100 111 92 41 385 150
Fedltgtltal 2559 1520 435 10 72 95 47 40 247 92 Medicare 1478 926 334 - 57 78 - 37 46 Medicaid 740 350 76 09 06 18 45 - 187 50 01helt 341 244 26 01 09 - 02 03 14 42
State and local 760 366 120 08 28 15 44 01 139 59 Medicaid 406 126 50 07 04 15 32 - 138 35 Olhelt 374 240 70 01 24 01 13 01 01 24
See notlaquo at end of table
~~
~Qz
sect
~-fi~~
~
~ ~
Table 16-Continued Personal Health Care Expenditures by Type of Expenditure and Source of Funds Selected Calendar Years 1991-95
Vtsion Products Oth~
Hospital Physician Profes-
DemaJ sional Home Health
Drugs and and Other Other Medical Meltfioal
Nursing Home Health
Source of Funds To~ Calte Services Services Services Care Non-Durables Durables Calte Calte
1994 Amount In Billions Personal Health care Expenditures $8279 $3350 $1906 $421 $491 $263 $777 $129 $724 $217
Out-of-Pocket Payments 1760 113 373 199 191 60 478 76 269 Third-Party Payments 6619 3237 1533 222 301 203 299 53 455 217
Private Health Insurance 2645 1115 911 202 152 33 198 09 24 Other Private 262 113 31 02 37 34 - - 14 31 Government 3612 2008 591 18 111 135 101 44 418 187
Federal Medicare 2781 1644
1629 1019
467 362
10 82 - 67
117 98
52 42 - 39
269 59
113
Medicaid 78~ 3~2 80 09 06 19 49 - 194 64 Othelt 354 248 25 01 09 - 02 03 15 49
State and Local 831 379 125 08 29 17 49 01 149 73 Medicaid 451 137 55 07 05 16 36 - 148 47 01helt 380 242 70 01 24 01 13 01 01 26
1095 Personal Health Care Expenditues 8788 3501 2016 458 526 286 834 138 4ne 250
Out-offockampt Payments 1826 114 369 218 202 60 498 78 286 Third-Party Payments 6962 3387 1648 240 324 226 336 60 493 250
Private Health Insurance 2768 1131 970 220 158 33 221 09 25 Other Private 273 113 37 02 39 34 - - 15 33 Government 3921 2143 640 18 127 158 114 51 453 217
Federal 3036 1753 509 10 96 138 59 50 293 128 Medicare 1840 1126 400 - 78 116 - 46 73 Medicaid 831 372 84 09 08 22 56 - 203 78 01helt 365 255 26 01 10 - 03 03 16 50
State and Local 885 390 131 08 31 20 56 01 160 89 Medicaid 500 148 59 07 06 19 42 - 159 60 01helt 386 242 71 01 25 01 14 01 01 29
~
~ Q il sectElO- ~ ~bull~ f
NOTES The figure 00 denotes amounts tess than $50 million Medicaid ecpenditures exclude Part B premium payments to Medicare by States under buyJn agreements to cover premiums br eligible Medicloid recipients Numbers may not add to totals because of rounding
SOURCE Heallh Care Financing Administration Office of the Actuary Data from the Office of National Health Statistics
N--
~
Table 17Expenditures for Health Services and Supplies Under Public Programs by Type of Expenditure and Program Calendar Year 1995
Personal Health Care
VISion Olh0lt Drugs and Pltoduots
Professhy H~e Olhelt and Other Nursing Public All Hospital Physician Dental sional Health Medcal Medical Home Admlntsshy Heelh
Program Area Expenditures Total c~e Services Services Services Care Non-Durables Durables c~e OlhOlt tration Activities
Pub6c and Private Spending $9578 $8788 All Public Programs 4367 3921
Federal Funds 3144 3036 State and Local Funds 1222 885
Medicare 1870 1840 Medicaid 1410 1331
Fedeltel 868 831 State and Local 542 500
Other State and Local Public Assistance Programs 54 54
Department of Veterans Affairs 156 155 Department of Oefensez 135 133 Workers Compensation 198 181
Federal 06 06 State and local 192 175
State and local Hospitals3 123 123 Other Public Programs for
Personal Health Care4 106 104 Fedeuol 72 71 State and local 34 33
Government Public Heahh Activities 314 -Fedeuol 38 -State and local 276 -
Medicare and Medicaid 3280 3171
Exelude5 funds paid into the Medicare trust funds by States 21ncludes care br retirees and military dependents 3 Expenditures not offset by IGVlaquoWJSS
4lncludes program spending for maternal and child heahh votats Indian health services alooholism drug abuse and ment
$3501 $2016 2143 640 1753 509 390 131
1126 400 520 143 372 84 148 59
31 04 129 01 105 16 66 67 03 01 65
123
21 09 17 07 03 02 - -- -- -
1646 543
under buy-In agreemen
cational rehablitalion mal haatth and school health
Amount in Billions $458 $526 $286 $834
18 127 158 114 10 96 138 59 08 31 20 56
- 78 116 -16 14 41 98 09 08 22 56 07 06 19 42
01 03 01 10 00 - - 00 00 - - 02 - 21 - 04
~ - 01 00 - 20 - 04
01 10 - 00 01 09 - 00 00 02 - 00 - - - -- - - -- - - -
16 92 157 98
ts to cover premiums for Medicakl recipients
edical payments temporary disability insurance medic
$138 51 50 01
46 ---
00 03 -
01 00 01
01 01 00 ---
46
al payments P
$779 453 293 160
73 362 203 159
01 16 ----
--
---
435
ublic Health
$250 217 128 89
-138 78 60
04 06 09 ---
61 36 25 ---
138
Service a
$477 132
71 61
30 79 36 42
01 02 17 00 17
03 01 02 ---
109
nd other Fe
$314 314 38
276
314 38
276
deral ho$pimiddot
~ ~ ~
~ ~ ~ ~ ] ~ ~ bulli
-middotf
N
S
shy
OTES The fiJIre 00 denotes amounts less than $50 million Numbers may not add to total because oiiQUnding shyOURCE Health Care Financing Adminlslfation OffiCe of the Actuary Data from the OffiCe of National Heahh Statistics
REFERENCES
Alecxih LMB and Lutzky S How Do Alternative Eligibility Triggers Affect Access to Private LongshyTerm Care Insurance Public Policy Institute issue paper 9605 Washington DC American Association of Retired Persons August 1996 American Hospital Association National Hospital Panel Survey Unpublished Chicago 1995 American Medical Association Socioeconomic Characteristics of Medical Practice 1996 Chicago April1996 Anders G Pricey Operation A Plan to Cut Back on Medicare Expenses Goes Awry Costs Soar The Wall Street ]ournalAl October 3 1996 Baker C and Kramer N Employer-Sponsored Prescription Drug Benefits Employer Benefits Survey A BLS Reader US Department of Labor Bureau of Labor Statistics Bulletin 2459 Washington DC US Goverrunent Printing Office February 1995 Board of Trustees Federal Hospital Insurance Trust Fund The 1996 Annual Report ofthe Board of Trustees of the Federal Hospital Insurance Trust Fund Washington DC US Government Printing Office 1996 Day K Health Insurers Push the Envelope Costmiddot Cutting Drive Leads to a Boom in Mail-Order Prescriptions-and Worries for Drugstore Chains The Wall StreetjournalDl October 171996
Dial TH Pan L Bergsten C et al HMO amp PPO Industry Profile 1995middot96 Edition Washington DC American Association of Health Plans May 1996
Duke KS Hospitals in a Changing Health Care System Health Affairs 15(2)41 Summer 1996 DuNah R Jr Harrington C Bedney B et al Variations and Trends in State Nursing Facility Capacity 1978-93 Health Care Financing Review 17(1)183-199 Fall1995 Emmons DW and Simon CJ Managed Care Evolving Contractual Arrangements Socioeconomic Characteristics of Medical Practice 1996 Chicago American Medical Association April1996
Foster Higgins National Survey of EmployershySponsored Health Plans 1994 Report New York Foster Higgins Survey and Research Services 1994 Genuardi JS Stiller ]M and Trapnell G R Changing Prescription Drug Sector New Expenditure Methodologies Health Care Financing Review 17(3)191-204 Spring 1996
Goldberg J Doctors Earnings An Uphill Struggle Medical EcoMmics 73(17)250-261 Sept 9 1996 Health Care Financing Administration Medicaid Managed Care Enrollment Report Summary Statistics as ofJune 30 1995 Baltimore 1996
Health Insurance Association of America Source Book of Health Insurance Data 1996 Washington DC To be published Health Insurance Association of America Information from William Weller Senior Actuary Washington DC1996 Heffler SK Donham CS Won DK et al Health Care Indicators Hospital Employment and Price Indicators for the Health Care Industry Fourth Quarter 1995 and Annual Data for 1987middot95 Health Care Financing Review 17(4)217middot256 Sununer 1996
IMS America Data from the US Hospital Audit Plymouth Meeting PA 1996 Kletke PR Emmons DW and Gillis K D Current Trends in Physicians Practice Arrangement From Owners to Employees journal ofthe American Medical Association 276(7)555-560 August 21 1996 KPMG Peat Marwick Health Benefits in 1996 (Also yearly editions for 1991middot95) Newark NJ 1991-96 KPMG Peat Marwick Health Benefits in 1996 Newark NJ To be published
Langley M and Sharp A As Big Hospital Chains Take Over Nonprofits a Backlash is Growing The Wall StreetjournalA1 October 18 1996
Levi~ KR Lazenby HC Sivarajan L et a National Health Expenditures 1994 Health Care Financing Review 17(3)205-242 Spring 1966
lewinmiddotVHI Inc Subacute Care Policy Synthesis and Market Area Analysis Available on the Internet at httpaspeosdhhsgov daltcphomehtm Contract Number HHamp100-93-0012 Prepared for the Office of the Assistant Secretary for Planning and Evaluation US Department of Health and Human Services Washington DC 1995
Miller RS Jonas HS and Whitcomb ME The Initial Employment Status of Physicians Completing Training in 1994 journal of the American Medical Association 275(9)708-712 March 6 1996 Moser JW Trends and Patterns in Physician Income Socioeconomic Characteristics of Medical Practice 1996 Chicago American Medical Association April1996
HEALTIJ CARE FINANCING REVIEWFaJII996Vohlmei8Numberl 213
National Center for Health Statistics Health United States 1995 US Department of Health and Human Services Public Health Service Washington US Government Printing Office June 1996 Newhouse JP Reimbursing Health Plans and Health Providers Selection Versus Efficiency in Production journal of Economic Literature 34(3)1236-1263 September 1996 Rice T Stearns S DesHarnais S et al Do Physicians Cost Shift Health Affairs 15(3)215- 225 Fall1996 Rundle RL Tenet Healthcares Bid to Buy OrNda Signals It Means to Stay Independent The Wall Street ]ournalB3 October 18 1996 Schondelmeyer S and Seoane-Vazquez E Prescription Trends 1996 Survey American Druggist 213(6)25 June 1996
Seifer SD Troupin B Rubenfeld GD Changes in Marketplace Demand for Physicians journal of the American Medical Association 276(9)695-699 September 4 1996
Simon C J and Born PH Physician Earnings in a Changing Managed Care Environment Health Affairs 15(3)124-133 Fall1996
Social Security Administration Office of the Actuary Unpublished data used in the preparation of the 1996 Trustees Report Baltimore 1996 Tanouye E Managed Care Is Boosting Drug Sales The WaU Street ]ournalB10 October 17 1996 US Bureau of Labor Statistics Employee Benefits in Medium and Large Firms 1993 Bulletin 2456 US Deparbnent of Labor Washington US Government Printing Office November 1994 US Bureau of the Census Service Annual Survey 1994 US Deparbnent of Commerce Washington DC August 1996 Wooton S Physicians are Ordered to Limit Referrals Baltimore SunC3 August 3 1996
Zwanziger J and Melnick GA Can Managed Care Plans Control Health Care Costs Health Nfoirs 15(2)185-199 Summer 1996
Reprint Requests Anna Long Office of Nationa] Health Statistics Health Care Financing Administration 7500 Security Boulevard NJ02()2 Baltimore Maryland 21244-1850 ampmail alonglhcfagov
HEALm CARE FINANCING REVIEWFall 1996VolumetSNumberi 214

Figure 1 Percent Growth In National Health Expenditures and Gross Domestic Product and National
Health Expendttures as a Percent of Gross Domestic Product Calendar Years 1960-95
I
middot I I I I I I I 1
I I I I I I
f I 1 1
bullbullbull
bull
bullbull
I bullbull
1 I I 1 I I r
I I
bull bull
National Health Expenditures 18 Gross Domestic Product
16
14
1 lbull
10
bull bull 6 bullbull bullbull 4
bull bull 2+-----------r------r-----------------r-----T
16
14
National Health Expenditures as a Percent of Gross Oomestk Product
12
bull
6
4+----------------------------------------- 1960 1965 1970 1975 1980 1965 1990 1995
CalendarYear
SOURCE Health Care Finaring Administration Office of the Actuary Data from the Office of National Health Statistics
HEALTII CARE FINANCING REVIEWFali1996Vol~met8Numbert 176
During the 1993-95 period health care spending as a percent of gross domestic product (GDP) exhibiteq virtually no change It stabilized between 135 and 136 percent (Figure 1) There were three additional periods since 1960 when the NHE share of GDP remained stable for 3shyyear periods 1964-66 1977-79 and 1982-84 Each of these periods was characterized by strong GDP growth For the first time in more than three decades however stabilshyity in NHE as a percent of G D P in the 1993-95 period was precipitated by a slowdown in the rate of growth of health care spending rather than an upswing in overall economic growth
The effects of health system changes are evident in the contrast between private and public sector financing From 1960 to 1990 growth in spending by both the private and public sectors was similar with only two notable exceptions the period 1966-67 when Medicare and Medicaid were introduced and the period 1974-75 which recorded the effects ofthe 1973 expansion of Medicare to cover the disabled population Each of these major expansions in public program coverages produced offsetting step-wise shifts in public and private financing responsibilities with the share shouldered by the public sector increasing The unique feature of the shift toward a larger public share beginning in 1990 is that it was not driven by public sector initiatives to add new populations or expand services although the number of people covered by the Medicaid program did increase In fact public sector expenditure growth has continued at approximately the same average annual rate since 1990 (99 percent) as between 1980 and 1990 (105 percent) At the same time average annual growth in private spending decelshyerated markedly between 1990 and 1995 to 52 percent from the 112-percent
average annual growth experienced during the 1980-90 period (Figure 2)
The disparity in growth among different types of personal health care (PHC) services narrowed in 1995 For all services except other personal health care spendshying growth ranged from a low of 45 percent (for hospital services) to a high of 89 percent (for dental services) The one exception other personal health care services which accounts for 28 percent of PHC is dominated by Medicaid home- and community-based waivers and miscellashyneous services that are provided by non-health care establishmentsz Spending for this sector grew 149 percent in 1995 faster than all other PHC sectors but slower than it did in 1994 (Table 1)
The changing distribution of health care spending mirrors the impact of managed care and to a lesser extent changes in Medicare payment policies The share of PHC eXPenditures spent on hospital and physician services has declined over the past 5 years while spending on home health services nursing home care and other personal health care services has increased These increases have paralleled increases in Medicare spending for home health and skilled nursing facility services
In the rest of this article we describe the changes occurring in several key sectors of the health care industry focusing on their impact on health care spending trends Data cited in the remaining discusshysion but not shown in an accompanying table or figure can be found in Figure 9 and Tables 8-17 at the end of this article
HOSPITAL CARE
Hospital care expenditures the single largest component of personal health
2Non-health care establishments include facilities such as schools military facilities social services agencies and conunushynity center5
HEALTil CARE FINANCING REVIEWFall 1996Volume 18 Number 1 177
Figure 2 Percent Growth and Percent Share of Public and Private National Health Expenditures
CalendarYears 1975middot95
Shares of National Health Expenditures
~----------------~------------
------------- _ shy
middotmiddot+--------------------------~ =
__-middot~--
1985 1990 1995
CalendarYear
SOURCE Health Care Financing Administration Office of the Actuary Data from the Office of National HeaRh Statistics
spending at 398 percent amounted to $3501 billion in 1995 Registering growth of less than 5 percent in the last 2 years spending for hospital services was among the slowest growing of any PHC services
The American Hospital Associations (1995) panel survey of community hospishytals reports that overall admissions per 1000 population increased in 1995 by 04 percent the first such increase in more than a decade Growth in admissions per 1000 population in 1995 comes from admissions for the population age 65 and over meanwhile admissions per 1000 for the population under age 65 continued to
decline but at a slower rate Despite the slight increase in admissions per 1000 population inpatient days in community hospitals continued to fall by almost 3 percent overall indicating declining overall length of stay When the number of beds is not reduced to match the decline in days occupancy rates fall and excess capacity grows In 1995 overall occupancy rates in community hospitals fell to less than 60 percent (Heffler et al 1996) the lowest rate in history Such rates put renewed pressure on hospitals to develop new sources of revenues to negotiate with managed care plans for access to patients
HEALni CARE FINANCING REVIEWFali1996Volume 18 Nber 1 178
Table 1
~ sect l
~ ~
~ ~
f ~
I ~ ~
t
Personal Health Care Expenditure Aggregate Amounts Percent Distribution and Average Annual Percent Change by Type of Expenditure Selected CalendarYeara1960~95
Type of Expenditure 1960 1970 1980 198S 1990 1991 1992 1993 1994 1995
Amount in Billions Persooal Health Care $236 $638 $2170 $3764 $6147 $6766 $7405 $7669 $8279 $6766
Hospital Care 93 280 1027 1683 2564 2823 3054 3233 3350 3501 Physician Services 53 136 452 836 1463 1592 1757 1827 1906 2016 Dental Services 20 47 133 217 316 333 370 392 421 458 Other Professional Services 06 14 64 166 347 383 421 463 491 526 Home Health Care 01 02 24 56 131 161 196 230 263 266 Drugs and Other Medical Non-Durables 42 88 216 371 599 SS6 712 750 777 834 Prescription Drugs 27 55 120 212 377 421 466 494 513 555
Vision Products and Other Medical Durables 06 16 38 67 105 112 119 125 129 138 Nursing Home Care 08 42 176 307 509 572 623 670 724 779 Other Personal Health Care 07 13 40 61 112 136 154 179 217 250
Percent Distribution Personal Health Care 1000 1000 1000 1000 1000 1000 1000 1000 1000 1000
Hospital Care 393 439 473 447 417 417 412 411 405 398Physician Services 224 213 208 222 238 235 237 232 230 229Dental Services 83 73 ~1 58 51 49 50 50 51 52Other Professional Services 26 22 29 44 56 57 57 59 59 60Home Health Care 02 03 11 15 21 24 26 29 32 33 Drugs and Other MedJcal Non-Durables 180 138 100 98 97 97 96 95 94 95 Prescription Drugs 113 86 56 56 61 ~2 63 63 62 63
VISion Products and Other Medical Durables 27 25 17 18 17 17 16 16 16 16 Nursing Home Care 36 66 81 81 83 84 84 85 88 89 Other Personal Health Care 29 20 19 16 18 20 21 23 26 28
Average Annual Percent Change from Previous Year Shown Personal Heahh Care - 105 130 116 103 101 95 63 52 61
Hospital care - 117 139 104 88 101 82 59 36 45 Physician Services - 99 128 131 118 88 10-4 40 44 58 Dental Services - 91 111 102 78 56 110 60 73 89 Other Professional Services - 88 163 212 158 104 100 100 61 70 Home Health Care - 145 269 189 184 224 223 171 144 86 Drugs and Other Medical Non-Durables - 76 94 114 101 94 86 54 36 73 Prescription Drugs - 75 82 119 122 119 106 61 38 81
Vision Products and Other Medical Durables - 96 88 124 92 70 63 51 28 72 Nursing Home Care - 174 154 117 107 122 90 76 81 75 Other Personal Health Care - 65 120 88 129 207 133 164 216 149
NOTE Numbers rn8if not add to totals beealtse of rounding SOURCE Health Care financing Administration Offie of the amppound1uaJY Data from the Office of National Health Statistica
~
0
and to integrate both horizontally with other local and national hospital organizations and vertically with physicians and other health care providers and insurers (Duke 1996)
An increasing number of hospitals are expanding their lines of business to provide more than just inpatient and outpashytient hospital care In addition to fitness facilities and home health care agencies they are using excess bed capacity to add rehabilitation and skilled nursing or subacute care facilities to broaden their revenue base (Lewin-VHI Inc 1995) Creating subacute care facility units from underused inpatient units enables hospishytals to compete for the followup institutional care that discharged patients often need for full recovery Incentives exist for hospitals to discharge patients as soon as possible Medicares inpatient hospital payment is diagnosis-based and prospectively determined regardless of length of hospital stay Managed care plans which often pay for hospitalization on a daily rate also encourage fewer inpatient days But community nursing homes traditionally providing custodial services and limited medical care are frequently not staffed and equipped to handle patients discharged from hospitals quicker and sicker Hospitals with a subacute care unit can discharge patients from their hospital stays quickly and admit them to the skilled-nursing or subacute care unit for their followup care maximizshying their revenue from the overall stay Under Medicare a hospital is compensatshyed for the inpatient stay on a prospectively determined diagnosis-related group (DRG) basis and the nursing or subacute facility stay on a reasonable-cost basis (Anders 1996)
With the rise of enrollment in managed care plans and falling occupancy rates hospitals have been forced to consider the benefits of mergers and alliances with local
and national hospital organizations Squeezed by high operating expenses competition from market-area providers and the prices managed care organizations were willing to pay providers for services hospitals have sought alliances with similar community facilities or with national chains Some alliances have been based on geographic location and others on religious affiliation Most have been aimed at integrating services reducing competition and increasing cooperation in order to compete effectively for managed care business (Duke 1996) Increasingly largeshyly consolidated for-profit hospital organizations are buying non-profit facilishyties facing difficulties in the highly competitive hospital marketplace Forshyprofit chains strengthen the market position of acquired facilities by cutting costs Communities worry however that takeovers of their local facilities will threatshyen the existence of hospital-provided charity and preventive services and cost jobs in their community (Langley and Sharpe 1996 Rundle 1996)
Expenditures for inpatient services in community hospitals accounted for 62 percent of all hospital revenues in 1995 (fable 2) Growth in inpatient expendishytures has slowed since 1990 paralleling decreases in inpatient days and length of stay Some of this deceleration can be attribshyuted to the rise of managed care According to the HMO and PPO Industry Profile health maintenance organizations (liMOs) the most restrictive type of managed care plan cover about 20 percent of the resident population HM0 members experience fewer total hospital days per thousand fewer admissions per thousand and shorter average lengths of stay than the population at large HM0 members were hospitalized about two-thirds as often as the population as a whole in 1993 [and] spent about half as many days in
HEAL1H CARE FINANCING REVIEWFall 1996Yclume tamp Number t 180
~ ~ l
~ z ~ ~ l ~
~ ~ bullbull ~ zbull ~
Table 2 Hospital Revenues Percent Distribution and Annual Percent Growth
Calendar Years 1990middot95
Type of Hospital 1990 1991 1992 1993 1994 1995
Revenues in Millions Total $256447 $282272 $305357 $323272 $334966 $350120
Non-Federal 238570 262533 284665 301217 312323 326877 Community 221604 245476 267881 284891 296333 311283
Inpatient 169221 163516 196452 206410 210426 216593 Outpatient 52363 61960 71429 78481 85907 94691
Non-Community 16966 17057 16784 16326 15990 15594 Federal 17877 19739 20692 22055 22643 23242
Percent Distribution TotaJ 100 100 100 100 100 100
Non-Federal 93 93 93 93 93 93 Community
Inpatient 86 66
87 88 64
88 64
88 83
89 62
Outpatient 20 22 23 24 26 27 Non-Community 7 6 5 5 5 4
Federal 7 7 7 7 7 7
Annual Percent Growth Total 107 101 82 59 36 45
Non-Federal 109 100 84 58 37 47 Community 113 108 91 63 40 50
Inpatient 91 84 70 51 19 29 Outpatient 189 183 153 99 95 102
Non-Community 56 05 -16 -27 -21 -25 Federal 89 104 48 66 27 26
NOTE Non-comrrunity non-Federal hospitals include long-term care hospitals (where the average length of stay is 30 days or longer) psychiatric hospitals alcohol and chemical dependency hospitals units of institutions such as prison hospitals or college infirmaries chronic disea5e hospitalo~ 11nd some in5titution$ for the mentally retorded
SOURCE Heath Care Financing Administration Office of the Actuary Data from lhe Office of National Health Statistics
sect
the hospital Growth in other types of managed care organizations (especially PPOs) and the increasing use of utilizashytion review by indemnity health insurance plans may also have contributed to this trend (Dial et al 1996)
Nearly all hospital care was financed by third parties in 1995 with only 33 percent paid by consumers in out-of-pocket expenshyditures PHI accounted for a 323-percent share Total public funding accounted for a 612-percent share Medicare and Medicaid the primary subset of public payers financed 470 percent of hospital care The remaining 32 percent of hospital revenues carne from philanthropic and non-patient sources such as hospital gift shops parking facilities and cafeterias
PHYSICIAN SERVICES
Expenditures for physician services reached $2016 billion in 1995 an increase of 58 percent from the previous year Spending for services in this sector accounted for 229 percent of PHC For the last 3 years growth in spending for physishycian services has been lower than the growth in overall PHC expenditures This slow growth is linked to the expansion of managed care
The health care system in the United States has historically been controlled by providers with physicians typically decidshying type and place of treatment In recent years the growth of managed care has caused the locus of control to shift from provider to insurer (Zwanziger and Melnick 1996) with the insurer having more input into treatment plans This fundamental change in the health care delivery system has been precipitating changes in the organization of physician practices demand for types of physician specialties utilization of physician services and income of physicians In 1993
and 1994 these changes contributed to the slowdown of growth in expenditures for physician services By 1995 physician expenditures showed a slight upturn in growth rate although growth was still lower than the growth in PHC spending There is anecdotal evidence to suggest that increased utilization and referral to specialists may be part of the reason for the slight acceleration in growth (Wooton 1996 Rice et al 1996)
The share of physician expenditures funded by PHI rose between 1990 and 1995 consistent with managed cares emphasis on services provided by primary care physicians Meanwhile the share funded by Medicare remained unchanged as a result of the implementation of the Medicare Fee Schedule (MFS) to pay physicians for services and volume perforshymance standards (VPS) to limit the effect of induced utilization increases Payment mechanisms used by both managed care and Medicare put pressure on physicians to curb expenditure growth There is no evidence to suggest that physicians shifted costs to private insurers with the advent of the MFS because physicians were restrained by market forces from raising pricesbull Managed care and MFS caused spending growth to drop to 58 percent in 1995 from 115 percent in 1990
Changes in the way physicians deliver services are evident in US Bureau of the Census (1996) data on revenue sources of physician offices From 1992 to 1994 the
3Medicare implemented the VPS in 1990 and the physician fee schedule based on a resource-based relative value scale (RBRVS) in 1992
4However physicians were able to increase the volume of services to privately insured patients and recoup some of their income by increased utilization (Rice et al 1996) snata cited are for taxable employer firms only they exclude information from physician establishments that are tax-exempt andor have no employees and from offices of osteopathicphysicians The NHE physician category is more inclusive than this subset of physician office data The NHE category includes both taxable and tax-exempt physicians (medical doctors and doctors of osteopathy) as well as employer and non-employerphysicians
HEALTH CARE FINANCING REVIEWFalii996Volumet8Numbert 182
percentage of revenues earned from the delivery of inpatient hospital services fell while those earned through the delivery of services in doctors offices and hospital outpatient settings rose (fable 3) Part of the decline in percentage of revenues from hospital services may be associated with falling number of inpatient days
Growth in managed care enrollment had a direct impact on physician organizations The number of physicians signing contracts with managed care organizations is on the rise In 1990 61 percent of physi-dans had a managed care contract by 1995 that proportion had grown to 83 percent Although physician participation middot in managed care had grown substantially the percent of revenues received through managed care contracts grew more slowly from 28 percent in 1990 to 33 percent in 1995 (Emmons and Simon 1996)
As the number of managed care contracts has increased the structure of physician practices has changed Group practices have become more prevalent Physicians have joined together in larger group practices to offer the breadth of services necessary to attract managed care contracts and to consolidate expenses Groups can also absorb some of the risk
associated with managed care contracts Within physician practices the proportion of physicians who are employed has increased while the proportion of physishydans in solo practices or self-employed in group practices has declined (Kletke Emmons and Gillis 1996) Employed physicians tend to work fewer hours see fewer patients and earn lower income than physicians who own a practice (American Medical Association 1996) As the number of employed physicians increases earnings of physicians on average could fall
In 1994 physicians income decreased for the first time in recent history This may be a result of the growth in managed-care contracts The decline was more pronounced for the high earners while the income of low earners continued to rise (Simon and Born 1996) The decline also affected primary care physicians and procedur~riented physicians differently Primary care physicians income increased faster than average while the income of procedur~riented physicians declined or increased at a slower-than-average rate (Moser 1996)
As the impact of managed care on the health industry has increased there has been more emphasis on primary and
Table 3 Sources of Receipts In Physician Officest Calendar Years 1992middot94
Source of Receipts 1992 1993 1994 1992 1993 1994
Amount in Billions Percent Distribution TotaJ $1414 $1445 $1504 1000 1000 1000
Patient Care and Other Professional Services 1377 1409 1472 974 975 979 Patient Care Services 1305 1336 1399 923 924 930
Laboratory Services 72 76 79 51 54 52 X-Ray Services 141 137 140 100 95 93 Hospital Inpatient Services 318 304 311 225 210 207 Hospital Outpatient Services 167 179 191 118 124 127 Services Delivered in Physician Offices 596 626 670 422 433 446 Other Services Delivered at Other Sites 10 10 09 07 07 06
Other Medical Professional Services 72 74 72 51 51 48 Merchandise Sales 17 16 16 12 11 11
Prescription Drugs 03 03 04 02 02 03 Other 14 12 12 10 06 08
All Other Sources 20 21 16 14 14 11
Information for taxable employer firms only
SOURCE US Departmelll of Commerce Bureau of the Census Data from the Services Anrua( Survey 1994
HEALTII CARE FINANCING REVIEWFall 1996Volllme 18 Number 1 183
preventive care and less on the services of specialists Since 1990 the demand for specialists has dropped as measured by physician recruitment advertising while the demand for generalists has been rising (Seifer Troupin and Rubenfeld 1996) This change in type of physician will also affect the future of medical schools and the type of training available to incoming students As an indication of this trend the percent of recently graduated residents unable to find full-time jobs in their specialties amounted to more than 6 percent in two hospital-based specialities (anesthesiology and pathology) and one surgical specialty (plastic surgery) Similar rates for various primary care specialists were 21 percent or less (Miller Jonas and Whitcomb 1996)
Utilization of physician services remained stable over the 1993-94 period at approximately 6 contacts per person per year after rising steadily from 53 contacts per year in 1989 (National Center for Health Statistics 1996) The contribution to the increase in number of physician contacts per person differed by age group For the population age 65 years or over the number of physician contacts per person grew consistently between 1989 and 1994 but experienced a particushylarly large increase between 1990 and 1991 For the population age 15-64 utilizashytion increased between 1989 and 1992 but
has remained fairly constant since (fable 4) possibly a response to increased enrollment in managed care
PRESCRIPTION DRUGS
Americans purchased $555 billion worth of prescription drugs in 1995 (fable 5) Prescription drug spending growth was slower than that of PHC in 1993 and 1994 (61 and 38 percent respectively) but jumped to 2 percentage points faster than PHC in 1995 (81 percent) Surveys show that about two-thirds of the accelerated 1995 growth comes from an increase in the number of prescriptions sold Depending on the survey used this increase ranged from 57 (IMS America 1996) to 78 percent (Schondelmeyer and Seoane-Vazquez 1996)
The key to the utilization changes lies in changes in the sources paying for prescripshytion drugs Third parties are absorbing an increasing share of prescription drug expenshyditures Between 1990and 1995 the share of prescription drug spending paid out of pocket rell 9 percentage points offset by larger shares paid by third-party payers PHI share increased 5 percentage points and the Medicaid share increased 4 percentage points (FigUre 3) Even smaller payers such as the US Department of Veterans Mfairs and US Department of Defense through the latters Civilian Health and Medical
Table 4 Physician Contacts1 per Person by Age Calendar Years 1987middot94
Age Group 1987 1986 1989 1990 1991 1992 1993 1994
Number Total2 54 53 53 55 56 59 60 60
Under 1 5 Years 45 46 46 45 47 46 49 46 15-44 Years 46 47 46 46 47 50 50 50 45-64 Years 64 61 61 64 as 72 71 73 65 Years or Over 89 87 89 92 104 106 109 113
bullA consultation wijh a plltsiolan (or another perampln working under a ptjsieians supervision) In person or t1f telephone for examination diagnosis treatment or advice Place of contact includes office hospital outpatient clinic emergency room telephone home clinic heaRh maintenance orgarishyzation and other places located outside a hospital ~ge-adiJsted
SOURCE (Nation~ Center for Health Statistic$ 1995)
HEAL1H CARE FINANCING REVIEWFall 1996Vdume 18 Number 1 184
Table 5 Expenditures for Drugs and Other Medical Non-Durables by Source of Funds
Calendar Years 1990-95
Source of Funds 1990 1991 1992 1993 1994 1995
Amount in Billions Drugs and Non-Durable Medical Products $599 $656 $712 $750 $777 $834
Prescription Drugs 377 421 466 494 513 555 Out-of-Podltet Payments 182 193 204 212 214 219 Third-Party Payments 195 229 262 282 299 336
Private Health Insurance 130 152 180 191 198 221 Medicaid 51 62 67 77 65 96 General Assistance 09 09 09 09 10 10 Other Government 04 05 05 05 06 07
Non-Presaiptlon Drugs and Other Medical Non-Durables2 222 234 246 256 264 279
Out-of-Podltet Payments 222 234 246 256 264 279
Percent Distribution by Source of Funds Within Each Category Prescription Drugs too 100 too 100 100 100
Out-of-Pocket Payments Third-Party Payments
~ laquo ~ ~ ~
~ ~ ~ ~ ~ M Private Health Insurance ~ ~ ~ ~ ~ ~ Medicaid 14 15 14 16 17 18 General Assistance 2 2 2 2 2 2 Other Government 1 1 1 1 1 1
Non-Prescription Drugs and Other Medical Non-Durables2 100 100 100 100 100 100
Out-of-Pocket Payments 100 100 100 100 100 100
This daampS of expenditure measure~ spending for prescriptilln drugs over-the-counter medicines and sundries purchased in retail outlets The value of drugs and other produets provided by hospials rursing homes or health pmfessionals is included in estimates of speoling klr these providers seVices bullAssumes no third-party payments lor non-pre$Cfiptioo drugumd other medical non-durables
NOTE Numbers and percerrtages may not add to totals because of rounding
SOURCE Heatth Care Financing Administration Office of the Actuary Date from the Office of Na~onal HeaHh Statistics
Program for the Uniformed Services (CHAMPUS) experienced impressive growth in drug expenditures
There are several contributing reasons for high prescription drug spending growth in 1995 First the existence of third-party coverage increases the likelishyhood that individuals will fill prescriptions and the switch to managed care iocreases the likelihood even more More than 9 out of 10 employees enrolled in an employershysponsored health plan in medium and large firms had coverage for outpatient prescription drugs throughout the 1980s and 1990s (Baker and Kramer 1995) Although most medical plans have covered outpatient drugs for many years the shift of plan subscribers between traditional feeshyfor-service plans and managed care plans has had an effect on out-of-pocket payment requirements In traditional fee-for-service
plans outpatient prescription drugs are typically covered under general plan covershyages that require a yearly deductible Under a deductible arrangement the plan subscriber is responsible for all medical charges including prescription drug charges until those charges exceed the deductible6 By contrast HMO plans require only a nominal dollar copayment per prescription typically $3 or $5 (US Bureau of Labor Statistics 1994) The relatively low out-of-pocket costs of prescription drugs in HMOs and other managed care plans may help to explain the recent growth in the demand for and utilization of prescription drug benefits
Although pharmaceutical manufacturers initially feared that managed care plans
According to KPMG Peat Marwick (1995) the average single plan deductible for a fee-for-service plan was $257 in 1995 and the family deductible was $603
HEALTH CARE FINANCING REVIEWFall1996VOiumet8Numbert 185
Figure 3 Prescription Drug Spending by Type of Payer
CalendarYears 1990-95
60 -
bullbullbullbullbullbullbullbullbullbullbullmiddot Out-of-Pocket Payments 55 - ---shy Private Health Insurance
- - - - - - Medicaid and Other Public 50 -
middotbullbullbullmiddotmiddotmiddotmiddotbullbull 45 - bullbull
j Jl- bullbullbullbull middotbullmiddotmiddotbullmiddotmiddotbullbullmiddotbullmiddotmiddotmiddotmiddotmiddotmiddotmiddotmiddotmiddotbullmiddot__________________________ middot_middot_middotmiddot_middotmiddot~middot~--~-middot~
30
25
20-
-------------------------shy15 -t---------------------r-------~------
1990 1991 1 1993 1994 1995
CalendarYear
shy
shy
SOURCE Health Care Finaring Administration Office of the Actuary Data from the Office of National Health Statislics
would restrict drugs sales they now believe that managed care has been partly responsimiddot ble for recent increases in prescription drug sales To reduce the use of more expensive services prescription drugs are frequently ordered as an inexpensive way to control chronic illnesses uncovered through prevenshytive screening Low copayments required by managed care plans also encourage patients to fill more prescriptions than they did when facing higher copayments or deductibles or the entire cost of the prescription
Second the sites where drugs are dispensed are changing with more prescriptions being filled in retail outlets Fewer prescriptions are dispensed in the hospital setting (partly because of fewer
7Jn the NHE the prescription drug category only measures purchases in retail outlets Sales of drugs through hospitals physician offices nursing homes and other non-retail sites are captured in their respective expenditure category
inpatient days) and potentially more in the retail market Hospital purchases of prescription drugs remained flat over the past 3 years at $10 billion (IMS America 1996) This differs significantly from the retail pharmacy experience where the number of prescriptions dispensed through drug stores mass merchandisers food stores and mail-order firms grew 57 percent from 1994 to 1995 the secondshylargest growth recorded in recent history The growth of managed care has boosted sales of drugs through mail-order firms Mail order is frequently used to purchase drugs used to treat chronic conditions estimated to cover 60 percent of prescripshytion drug sales in 1995 (Day 1996) Prompted by employers interested in cutting prescription drug costs managed care plans emphasize use of mail order
HEALTH CARE FINANCING REVIEWFali1996VolumelRNumberl 186
Cost savings from mail-order firms come through bulk purchasing and processing of prescriptions However there is concern that maH-order firms often middotSUbsidiaries of drug manufacturers may favor the drugs of parent drug manufacturers on their formulary list (Genuardi Stiller and TrapnelL 1996)
Third increased spending on prescripshytion drug advertisements may be influencing consumers to request specific brand-name drugs from physicians (Tanouye 1996) Spending on direct-toshyconsumer prescription advertisements has more than doubled since 1992 (Figure 4)
Fourth one obvious factor in expendishyture growth is price per prescription Prices increased 19 percent in 1995 as measured by the Consumer Price Index
(CPI) and 27 percent as measured by the Producer Price Index (PPI) s In addition manufacturers began to constrain the growth of rebates in 1995 NHE subtracts rebates paid by manufacturers to thirdshyparty payers such as private insurance and Medicaid thus decreasing the price paid by third parties Therefore when rebate growth slowed in 1995 price growth reflected in NHE estimates accelerated Industry observers state that manufacturshyers have moved to performance-based rebates where specific volume or sales quotas must be met in order for a rebate to be paid Manufacturer rebates to Medicaid also fell as a proportion of total
IIThe PPI is designed to measure transaction prices and is dif(ershyent from the CPI which in some cases measures list or full charge prices~ (Heffler et al 1996)
Figure 4 Spending by Prescription Drug Manufacturers for Dlrect~tomiddotConsumer Advertisements
CalendarYears 1992middot95
$400
$357
$350
$300
e $25()
~ D 15bullc
$200
g i $150
$100
$5()
0
1992 1993 1994 1995 C81endarYear
SOURCE Conlan M lnYour-Face Pharmacy Will the Boom in R~ Ads AimEid at Consumers CortirMJe Drug Topics 140(13)92-98 July 8 1996
HEALTII CARE FINANCING REVIEWFall 1996Vclume 18 Number 1 187
Medicaid drug expenditures Because Medicaid rebates are based on best prices available to private purchasers falling rebates in the private market affect rebates paid to Medicaid
WNG-TERM CARE
Long-term care (LTC) includes spending for care received through freestanding nursing homes and home health agencies This sector accounted for almost oneshyeighth of PHC expenditures in 1995 or $1065 billion with public programs mainly Medicaid and Medicare financing 574 percent (fable 6) The share of LTC spendshying paid by Medicare more than doubled from 1990 to 1995 Growth in Medicare expenditures for home health and nursing home carelo accelerated sharply in 1988 when Medicare relaxed its conditions for
9Jn NHE home health agencies and nursing facility services provided through hospitals are included under hospital expen ditures iONursing home coverage under Medicare is limited to care provided in a participating skilled nursing facility after at least a 3-day acute care hospital inpatient stay
coverage and payment for these benefits Also affecting the accelerated growth for nursing home care are lingering effects of the short-lived Medicare Catastrophic Coverage Act of 1988
Public policy experts are concerned about the large public funding commitshyment to LTC that is expected to grow even larger over the next several decades In 1995 there were an estimated 342 million people age 65 and over by the year 2020 this number is expected to increase to 528 million (Social Security Administration 1996) Of all people age 65 and over 113 percent are age 85 or over the age group at risk of needing nursing home care and 443 percent are age 75 or over the age group most likely to need services from home health agencies Growth in the size of the elderly population emphasizes the increasing health care costs for LTC services that this population will generate much of which comes from public sources
Private sources predominately out-ofshypocket payments by patients or their families account for the remaining 426
Table 6 LongmiddotTerm Care Expenditures for Nursing Home and Home HeaHh Care1
by Source of Funds Calendar Years 1990-95 Source of Funds 1990 1991 1992 1993 1994 1995
Amount in Billions Total $640 $732 $819 $900 $987 $1065
Percent Distribution Private Funds 517 490 469 449 440 426
Out-of-Pocket Payments 404 378 359 341 333 325 Private Health Insurance 64 63 61 59 58 55 Other Private Funds 48 49 50 49 49 46
Public Funds 483 510 531 551 560 574 Federal Funds 309 326 353 380 391 405
Medicare 73 85 111 137 159 178 Medicaid 220 226 227 227 216 211 Department of Veterans Affairs 16 16 15 16 16 15
State and Local Funds 174 184 178 171 169 169 Medicaid 173 183 176 169 167 167 General Assistance 01 01 02 02 02 02
Total Medicaid 393 408 403 396 383 379 Medicaid and Medicare 466 493 514 533 542 556
Includes only those expenditures br services provided 111 freestanding rorsing homes and home health agencies Add~klnal services are provided ty hospital-based nursing homes and home hedh agencies
SOURCE Health Care Financing Administration Office of the AcluayenY Data from the Office of National Heatth Statistlos
HEALTII CARE FINANCING REVIEWFaii1996Vdumet8Numbert 188
percent of funds spent on LTC The share of LTC spending from out-of-pocket sources has been falling mostly offset by the rising share of Medicare spending Another segment of private funding is PHI Private health insurers have been aggresshysively marketing LTC insurance policies An estimated 38 million LTC insurance policies had been sold by December of 1994 (Health Insurance Association of America to be published) However despite evidence of increased private insurshyance coverage the PHI share of total spending for LTC has changed little over the past 5 years Consumer advocacy groups are concerned that consumers may not understand the conditions for payment of benefits established by some private health insurers These conditions may be severely limiting consumers chances of receiving benefits under their LTC policies Conditions for payment are based on combinations of impairments related to the need for assistance with activities of daily living (Alecxih and Lutzky 1996) Policyholders lose coverage when they are unable to afford continued payment of the high premiums required to keep policies in force the Health Insurance Association of America (1996) estimates a 6-percent average annual lapse rate after the first year for all LTC policies Also most policyshyholders with active policies are healthy with no immediate need for covered services These factors may be limiting the growth in PHI payments for benefits relative to new contract growth
Additional expenditures for LTC are included with hospital care in NHE In 1995 Medicare and Medicaid financed an additionshyal $57 billion for hospital-based nursing home care and $60 billion for hospital-based home health agency services Medicaid expenditures for a variety of home- and community-based waivers are considered to be LTC expenditures by some people
Expenditures for these services are included with other personal health care in NHE In fiscal year 1995 Medicaid funded $24 billion for services covered by home- and commushynity-based waivers
Nursing Home Care
In 1995 spending for nursing home care climbed to $779 billion and accounted for 89 percent of total spending for PHC Growth in nursing home care expenditures decelerated from 81 percent in 1994 to 75 percent in 1995 The nursing home expendishyture estimate for 1995 implies a $127 average charge per day for care in freestanding nursing facilities At that rate a 1-year stay would cost more than $46000 in 1995
The public share of funding for nursing home care increased for the fifth consecushytive year Although Medicaid is the major public payer funding 465 percent of nursing home care in 1995 increases in the public share of nursing home funding resulted from Medicare spending growth The Medicare share 94 percent in 1995 increased from 33 percent in 1990 with expenditures averaging growths of 35 percent annually throughout the period
Evidence suggests that average national nursing home occupancy rates are declinshying thereby creating excess beds (DuNah et al 1995) Competition from alternative forms of health care delivery such as home health agencies and assistshyed-living facilities contributes to declining occupancy and decelerating revenue growth In response to the slowdown in revenue growth some nursing homes are converting their unused beds into subacute care units (Lewin-VHI Inc 1995) The advantages to nursing facilities
ltThe adequacy or inadequacy of the nursing home bed supply compared with the size of the vulnerable population varies by Stale and is subject to interpretation by State officials respondshying to the question of adequacy
HEAL1H CARE FINANCING REVIEWFall 1996Volume t8 Number I 89
of creating a subacute care unit are twofold First subacute care units are designed to better accommodate the more intensive nursing care needs of patients discharged from hospitals quicker and sicker Both Medicare with its PPS and managed care plans receiving capitated payments for enrollees health care needs exert pressure on hospitals to constrain lengths of stay Nursing homes that capitalshyize on this growing market of patients by establishing subacute care units bolster declining occupancy rates Second patients requiring these services are more likely to be Medicare or private-pay patients Given that both Medicare and PHI pay at higher rates than Medicaid these subacute units could help to produce higher revenue streams
Because subacute care units require more skilled better trained and therefore more costly personnel and more expensive highshytechnology equipment expenditures for nursing home care are likely to rise as more facilities convert beds to these type of units
Home Health Care
Expenditures for freestanding private and public home health agencies amounted to $286 billion in 1995 Expenditures for the services and products provided by these agencies were 33 percent of PHC expenditures in 1995 a small but increasing share
Public sources predominately Medicare and Medicaid financed 553 percent of home health care spending in 1995 Out-ofshypocket payments by patients or their families funded one-half of all private spending PHI and non-patient revenue equally funded the residual portion of private spending
Growth in spending for borne health care decelerated steadily from a high of282 percent in 1990 to 86 percent in 1995 In 1988 Medicare
relaxed its home health care ooverage and e1igi bility criteria The number of home health agencies providing these Medicare services grew quickly to meet increased demand by Medicare beneficiaries Growth in Medicare home health expenditures peaked at 515 percent in 1990 and steadily derelerated to 179 percent in 1995 Themore recent deceleration in growth reoorded in the NHE is partially artnlJut able to NHE measuring only payments to freestanding home health agencies as home health care payments to hospital-based home health agenciesare included under hospital care and have been growing faster than those for freestanding agencies In recent years Medicare has sought to identifY and ultimately to proseshycute home health providers participating in fraud or abuse activities This may be having some etrect on the industry ltNerall because of Medicares status as the largest public payer
Home health agencies seeking to maintain or boost revenue levels are also developing subacute care units (LewinshyVHI Inc 1995) As with nursing homes these units or groups of more highly trained staff are designed to better serve patients discharged from hospitals but still in need of substantial home care for full recovery from their illnesses
MANAGED CARE
In recent years enrollment in employershysponsored PHI has shifted dramatically away from conventional fee-for-service insurance into managed care plans Such plans typically charge lower average premiums than traditional indemnity plans (Foster Higgins 1994 KPMG Peat Marwick 1995) by controlling provider costs and utilization of services In 1986 almost 90 percent of health plan particishypants in medium and large firms12 enrolled in traditional fee-for-service plans howevshy
J2Small firms and State and local governments showed similar trends
HEALTII CARE FINANCING REVIEWFall 1996Volume 18 Numberl
er by 1993 the number of participants had dropped to 50 percent (US Bureau of Labor Statistics 1994) Enrollment in HMOs typically the most restrictive of the managed care plans grew from 13 percent to about 23 percent of all employer-plan participants between 1986 and 1993
The fastest growing type of managed care plan was the preferred provider organization (PPO) These plans grew from 1 percent of health plan participants in 1986 to 26 percent in 1993 (US Bureau of Labor Statistics 1994) PPOs attempt to lower costs by establishing networks of providers that are paid according to negotiated fee schedules Many traditional fee-for-service plans now also generate a list of preferred providers for participants The advantage to
the participant for using the preferred provider is lower out-of-pocket costs
Survey data from KPMG Peat Marwick (1994 1995) (Figure 5) indicate that employees continue to migrate away from conventional fee-for-service plans and into managed care plans13 In 1995 HMO enrollment in employer-sponsored plans nearly equaled the enrollment in convenshytional plans it is predicted to edge ahead in 1996 (KPMG Peat Marwick to be published) Almost one-half of the US resident population was covered by an HMO or PPO plan in 1994 (Dial et al 1996) (Figure 6)
l3This can also be a function of the plans that the employer chooses to offer
Figure 5 Percent of Employees Enrolled in EmployermiddotSponsored Health Plans
by Type of Plan Calendar Years 1993middot95
50
45 42
40 sect 1993
bull 1994
35 lllll1995
i ~ 30 shyE w 250
~ 20
15
10
5
0 Conventional Health Preferred Point-of-Service
Plans Maintenance Provider Plans Organizations Organizations
SOURCE (KPMG Peat Marwick 1994-96
HEALTII CARE FINANCING REVIEWFall 1996Volbullmels Number 1 191
Figure 6 Percent of Medicare Enrollees Medicaid Recipients and US Population Enrolled In
Managed Health Care Plans 1992-95
~ Medicare
bull Medicaid
ffil] US Population
1992 1993 1994 1995
60
so
40
I 30
J 20
10
0
NOTE Figures giVen for US resident population enrollment in managed care for 1992 and 1993 exclude dependerts and are the~re not strictly compara~able to later years
SOURCES Health Care Financing Administration Office of Managed Care (Dial et al 1996)
Covered Services
Throughout the late 1980s and early 1990s the breadth of services covered by employer-sponsored PHI greatly expandshyed For example an increasing number of insurance plans began offering home health and hospice care coverage as less expensive alternatives to hospital stays Much of this expansion was driven by cost-containment strategies aimed at substituting lower cost services for more expensive care and by the desire to attract healthier participants
The rise in the availability of covered services was accelerated by the migration of employers and employees toward managed care health plans including HMO PPO and point-of-service (POS) plans Managed care health plans particushy
larly HMOs were much more likely to provide their members with coverage for many basic preventive services such as routine physical examinations well-baby care well-child care and immunizations and inoculations For example data from KPMG Peat Marwick (1995) indicate that in 1995 HMO enrollees were almost twice as likely to be covered for adult physicals as enrollees in conventional plans
Although conventional plans have been slow to catch up many have greatly expandshyed their coverage during the first hall of the 1990s into areas such as adult physicals and well-baby and well-child care However despite such increases these conventional plans still lag most managed care plans particularly HMOs in the overall level of preventive services coverage
HEAL1H CARE FINANCING REVIEWFalll996VdumetsNW11bert 192
Expansions in covered services continmiddot ued in 1996 More recent survey data from KPM G Peat Marwick indicate that the biggest increases for preventive services were in POS plans POS plan offerings for both adult physicals and wellmiddot child care coverage increased and HM0 plans were increasingly likely to cover chiropractic care Although just over oneshyhalf the HM0 plans are now offering such coverage they still remain far behind nonshyHMO plans which almost universally cover chiropractic services
MEDICARE
Medicares Hospital Insurance and Supplementary Medical Insurance programs funded $187 billion of spending for health services and supplies in 1995 an 116-percent increase over 1994 spending Ninety-eight percent of these expenditures were for PHC services for the 375 million aged and disabled Medicare beneficiaries enrolled on July 1 1995
Medicare is the largest public payer for PHC expenditures and for each of the service components covered by the program except nursing home care Over time with few exceptions Medicare has financed increasingly larger shares of spending for each service component In 1995 Medicare funded 209 percent of spending for PHC a full percentage point more than it funded in 1994 One-third of all spending for hospital care and one-fifth of expenditures for physician services are funded by Medicare Faster growth in the Medicare population compared with the general population and the aging of frail elderly Medicare enrollees are contributing factors to these increasing funding shares
Medicare expenditures for hospital care totaled $1126 billion in 1995 105 percent higher than in 1994 Expenditures for hospital care services cover inpatient
outpatient and hospital-based home health agency and skilled nursing facility services Relatively high growth in Medicare hospital expenditures that has continued in recent years may be in part the result of expansions of hospital-based subacute units that allow Medicare patients to be discharged quickly from hospitalization and admitted into the same facilitys subacute care unit This permits hospitals to limit expenses incurred for Medicare hospitalizations which are compensated at a fixed amount regardless of length of stay and continue treating the patient under Medicares cost-based reimbursement policies for skilled nursing home care (Anders 1996)
Medicare and Pill Comparison
The 1996 Medicare Trustees Report predicts that growth in Medicare spending will deplete the Medicare Hospital Insurance trust fund by early in 2001 and recommends that Congress act quickly to reduce the growth in program costs Such action would extend the date of trust fund exhaustion and provide the time necessary to solve the long-term financial imbalance between costs and income (Board of Trustees Federal Hospital Insurance Trust Fund 1996)
The debate over how to fix the imbalance between Medicare income and expenditures inevitably involves raising taxes or lowering expenditure growth The latter is particularshyly relevant in 1994-95 when spending growth in Medicare exceeded that of PHI Between 1993 and 1995 aggregate spending under the Medicare program (benefits plus administrative costs) increased at an 113shypercent average annual rate while spending for PHI (benefits plus the net cost of insurshyance) grew only 25 percent annually Part of the difference is attributable to differential growth in enrollment (Levit et al 1996)
HEALTH CARE FINANCING REVIEWFa111996Vdume18Numberl 193
Since the inception of the program Medicare enrollment has grown at twice the rate of PHI enrollment In 1995 this trend continued Medicare enrollment grew 16 percent compared with PHI enrollment growth of 09 percent
To remove this source of difference we calculated spending on a per enrollee basis for 1969-95 From 1969 to 1993 per enrollee spending by Medicare and PHI grew at similar rates (Figure 1) During the 1969-93 period average annual growth in Medicare per enrollee spending was slightly slower than growth in PHI spending overall and for each type of service except durable medical products (FtgUre 8) In 1994 and 1995 t4fhe durable category covers a different product line for the elderly and non-elderly Medical durable products purchased by the non-elderly consist primarily of eyeglasses and hearing aids while the Medicare population uses a wide variety of durable medical equipment and supplies
trends in growth rates for these two payers suddenly diverged Average annual growth in Medicare per enrollee spending for all PHC changed very little from past rates while average annual growth in per enrollee PHI spending decelerated dramatically Medicare spending for benefits per enrollee grew more than 25 times as fast as PHI spending per enrollee
Medicare spending growth moderated slightly for each type of service except home health and nursing home care during the 1993-95 period Expenditure growth in home health and nursing home services was affected by changes in the law and in Medicare regulations the residmiddot
Figure 7 Growth In per Enrollee Expenditures by Medicare and Private Health Insurance
Calendar Years 1970-95
bullbull bull bullbull bull
25
middotbull bull --- Medicarebull bullbullbullbull
20 bullbullbullbullbull bullbullbullbullbullbullbull Private Health Insurance
bullbull bull15 bullbull I middot-middot 10
5
0~---------------------- 1970 1975 1980 1985 1990 1995
bullExpenditures Include benefits and administration br Mricare and benefits and net oost of insurance for prilnrte health in~~Urance SOURCE Health Care Rnancing Admiristratlon Office of lhe Actuary Data from the Office of Natiooal Health Statietics
HEALTH CARE FINANCING REVIEWFall 1996klume ts Number 1 194
Figure 8 Average Annual Growth In Private Health Insurance and Medicare per Enrollee Benefits
Calendar Years 196993 and 1993-95
Private Health Insurance
~ 1969-93
bull 1993-95
30
5
0
Personal Hospital Care Physician Other Home Health Medical Nursing Health Care Services Professional Services Ourables Home Care Expenditures Services
SOURCE Hea~h Care Finaocing Admbullnistration Office of the Actuary Data from thE Office of National HeaRh Statistics
HEAL1H CARE FINANCING REVIEWFali1996Volumet8Numbert 195
ual effects of which were still being felt in 199515 Medicares continued strong growth in hospital services parallels the growth in admissions for the population over 65 years of age It also reftects the NHE definition of hospital services that includes not only inpatient services but outpatient services (including those provided through hospital-based home health agencies) and services in skilled nursing home units that are compensated on a reasonablltgteost basis Strong growth in Medicare physician expenditures is somewhat misleading in that it includes bonuses paid to physicians through the MFS in 1994 and 1995 for their restraint in volume (and intensity) increases in 1992 and 199317 Similarly Medicare will incorshyporate penalties in its MFS in 1996 and 1997 for volume increases in 1994 and 1995 that exceeded the VPS
One reason for the difference in Medicare and PHI expenditure growth in 1994 and 1995 is the growth in number of persons enrolled in employer-sponsored managed care plans and managed cares increased influence over providers Managed care plans negotiate price discounts with providers in return for provider access to large groups of patients they emphasize preventive services and elimination of unnecessary care and they demand costMconscious decisionmakirg by providers in the delivery of health care Each of these aspects serves to limit
IsJn 1988 Medicare eased its coverage criteria for home health benefits This relaxation produced an expansion of benefits and acceJerated growth in home health expenditures Similarly residual effects from the 1988 Medicare Catastrophic CoverageAct and relaxation ofconditions for paymentunder Medicare led to accelerated growth in spending for nursing home care 16Both the Federal Government (using Standard Industrial Classification codes) and the American Hospital Association collect infonnation on an establishment basis and include revenues received for all services rendered by that establishshyment ITfwo years after performance Medicare VPS penalizes or rewards physicians through the MFS for increases in physician volume and intensity of services used by Medicare beneficiaries
growth in PHI funding of services Most Medicare enrollees are not enrolled in HMOs Providers serving these beneficiashyries are paid on a prospectively set basis (for inpatient hospital care) or on a reasonshyablltgteost basis (for most other institutional services) For HMOs enrolling Medicare beneficiaries Medicare pays 95 percent of the local fee-for-service average reimburseshyment Thus managed care price discounts and other factors present in the larger health care marketplace do not necessarily translate into lower Medicare costs Because payment is set in law Medicare has been unable to respond as quickly as PHI to changing market conditions Experts are still investigating why managed cares costs are low Is its success caused by elimination of unnecessary utilization negotiated price discounts favorable enrollee selection or some combination of these (Newhouse 1996) Has managed care had an impact on qual~ ty of health care services Some policymakers are anxious to move quickly to adopt managed care strategies in hopes of reducing Medicare costs Other policyshymakers citing the issues raised above prefer to move more cautiously
MEDICAID
Combined Federal and State Medicaid spending for PHC accounted for 151 percent of total PHC in 1995 or $1331 billion Medicaid largely funds institutional services In 1995 hospital care and nursing home care accounted for two-thirds (369 and 257 percent respectively) of combined Federal and State Medicaid spending The program is the largest thirdshyparty payer of nursing home care financing 465 percent in 1995
In fiscal year 1995 there were 363 million persons who received some type of Medicaid benefit The groups of children
HEALm CARE FINANCING REVIEWFall 1996Votume 18 Number t 196
and adults in families with dependent children represented 683 percent of all Medicaid recipients in 1995 yet consumed only 262 percent of program benefits Nearly one-half of all Medicaid recipients were children (172 million) who consumed only 150 percent of all Medicaid benefits These children also accounted for more than two-thirds of all family-based criteria recipients but consumed only a little more than one-half of the benefits to families Conversely the aged blind and disabled represented just over one-quarter of all recipients but consumed nearly threeshyquarters of program benefits (fable 7)
Medicaid is funded jointly by Federal and by State and local governments For a State to receive Federal matching funds it must adhere to minimum requirements for eligishybility and services set by the Federal Government Within this broad framework State governments are afforded considershyable flexibility in designing the total scope of the program within the constraints of the State budgetary process One way States use this flexibility is through Medicaid waivers There are two types of Medicaid waivers program waivers (including homeshyand community-based service waivers and freedom-of-choice waivers) and research and demonstration waivers Home- and community-based waivers18 ailow States to place Medicaid-eligible persons into alternashytive non-institutional settings for certain types of medical and personal care Freedom-of-choice waivers allow States to place Medicaid beneficiaries into mandatory managed care plans (where beneficiaries have a choice of a minimum of two providers) Research and demonstration waivers (section 1115 of the Social Security Act) allow Federal Medicaid requirements to be waived in order to conduct experimenshytal pilot or demonstration projects
18Authorized under section 1915 (c) of the Social Security AcL 19Authorized under section 1915 (b) of the Social Security Act
The recent slowdown in Medicaid expenshyditure growth from 1993 to 1994 (from 126 percent to 85 percent) which continued in 1995 (84 percent) was partially driven by a slowdown in the growth of overall program recipients (73 percent in 1993 to 48 percent in 1994 and 35 percent in 1995) In addition the change in the proportion of the Medicaid population enrolled in managed care rather than fee for service may also have contributed to the overall expenditure slowdown State Medicaid programs view managed care as a way to constrain cost growth In shifting recipients to managed care plans States also shift the risk for health care costs to the plans As an increasing number of States employed this cost-containment option managed care enrollment grew quite rapidly The Medicaid managed care population represhysented only 95 percent of all Medicaid recipients in fiscal year 1991 but by fiscal year 1995 tripled in share to 321 percent HMOs currently represent 62 percent of all Medicaid managed care programs prepaid health plans 25 percent primary care case management programs 12 percent and health insuring organizations 1 percent (Health Care Financing Administration 1995)
The slowdown in Medicaid expenditure growth between 1993 and 1994 was also marked by a sharp deceleration in Federal Medicaid spending (fhe State share of Medicaid expenditures however grew at a steady rate) There was a marked increase from 1993 to 1994 in the percentage of States with higher-than-average Federal matching rates who also showed lower-than-average expenditure growth In other words the poorest States showed the slowest growth in Medicaid spending during this period which slowed the growth in overall Federal matching contnbutions This composition change caused the Federal percentage contribution to Medicaid spending to fall
HEALTH CARE FINANCING REVIEWFall 1996Volume 18 Number t 197
Table 7 Medicaid Recipients and Expenditures bY
Eligibility Category Fiscal Year 1995
Percent Distribution Recipients Expenditures
(Thousands) (Billions) Recipients Expenditures
All8igibilily Categoriesl 36282 $1201 1000 1000 Aged Blind and Disabled 99n 859 275 715 Families 24767 315 683 262
Children 17164 180 473 150
Ad 7604 135 210 112
1 Includes cl1ild and aged and non-aged Mults categoriZed as Qther or unknown not shown separat~
2Adults in families wHh dlpelldelbulll cNldiW NOTE Data replrted on Health Care Financing Administration Form 2062
SOURCE Health Care Finanoklg Aclmini~Jtialion Bureau of Data Management and Strategy 1995
CONCLUSION
This article descnbes the latest shifts that have occurred within the health care system Growth in private seclnr spending fell to low rates between 1993 and 1995 contnbuting heavily to the slow overall spending growth in those years NHE as a share of the Nations output of goods and services was stable for 3 years breaking the trend of rapid annual increases regisshytered in the late 1980s and early 1990s Questions about whether these trends will continue and how the Federal sector (primarily Medicare) will react to current changes in the health care marketplace continue to be asked but the answers are not clear How will physicians react to slow or negative income growth How will managed care plans respond to rapid increases in prescription drug use How will issues of quality and bias selection be
addressed by managed care plans What will happen to managed care premium increases once the transition of privately insured persons to these plans has stabishylized We can watch the answers to these questions unfold in future NHE analyses
ACKNOWLEDGMENfS
The NHE are prepared in the Office of National Health Statistics within the Office of the Actuary Health Care Financing Administration under the general direcshytion of Daniel R Waldo Director The authors wish to thank their colleagues for their comments and suggestions on an earlier version of this report Mark Freeland Marian Gornick Richard Foster John Klemm Solomon Mussey Daniel Waldo John Wandishin and Carter Warfield
HEAL1H CARE FINANCING REVIEWFall 1996Volume 18 Number 1 198
Table 8 National Health Expenditures Aggregate and per Capita Amounts Percent Distribution
and Average Annual Percent Growth by Source of Funds Selected Years 1960middot95 ~ l ~
i~ ~ -~ IE ~ poundbullbull ~ zbull ~
1960 1970 1960 1985 1990 1991 1992 1993 1994 1995
National Health Expenditures Private Public
Federal State and Local
US Population~
Gross Domestic Product
National Health Expenditures Private Public
Federal State and Local
National Health Expenditures Private Public
Federal State and Local
National Health ExpendibJres
National Health Expenditures Private Public
Federal State and Local
US Population Gross Domestic Product
$269 202 66 29 37
1901
$527
$141 106
35 15 20
1000 752 248 109 139
51
-----
--
$732 455 277 178 99
2148
$1036
$341 212 129 93 46
1000 622 378 243 135
71
106 85
153 198 102
12 70
Amount in Billions $2472 $4282 $6975 $7617 $8342 $8921
1425 2539 4131 4414 4788 6055 1048 1743 2843 3203 3554 3665 720 1233 1958 2244 2539 2776 326 510 665 959 1016 1089
Number in Millions 2351 2471 2600 2626 2652 2679
Amount in Billions $2784 $4181 $5744 $5917 $6244 $6553
Per Cspita Amount $1052 $1733 $2683 $2901 $3145 $3330
606 1027 1589 1681 1605 1887 446 705 1094 1220 1340 1443 306 499 753 855 957 1036 140 206 341 365 363 407
Percent Distribution 1000 1000 1000 1000 1000 1000 576 593 592 580 574 567 424 407 408 420 426 433 291 288 281 295 304 311 133 119 127 126 122 122
Percent of Gross Domestic Product 89 102 121 129 134 136
Average Annual Percent Growth from Previous Year Shown 129 116 102 92 95 69 121 123 102 68 85 56 142 107 103 127 110 87 150 114 97 146 131 94 127 92 116 83 60 72
09 10 10 10 10 10 104 85 66 30 55 49
$9371 5172 4199 3019 1180
2704
$6936
$3465 1913 1553 1116
436
1000 552 446 322 126
135
51 23 86 87 84
10 58
$9085 5321 4564 3284 1280
2730
$7254
$3621 1949 1672 1203
469
1000 538 462 332 129
136
55 29 87 88 84
09 46
1July 1 Social Security area popdatloo estimates br each year 1960-95 NOTE Numbers and
SOURCE Health Care Finaneing Administration Office of the Actuary Data flom the Offioe of National Health Statistlca
percents may not add to lotala becaUse of rourdlng
~
i8
Figure 9 The Nations Health Dollar
Calendar Year 1995
bullbullbull
Hospital Care 36e
Where It Came From Private Health
Other Personal Health Care 25cent
Medicare
Other Spending
- - _
Where It Went
other Private
Out-of-Pocket Payments 19cent
Nursing Home Care
ftwsician Services 20lt
NCffES Other private includes Industrial lnplant Marth SlaquoVVces non-patient reverves and privately finaned construction Other peBOMI health care include$ dental services other professional services home health care drugs and othef non-durable medical products vision pOducls and other durable medical products and other misceRaneous health care servicegt Oher spending covers prowam administration and the net cost of prtate neatth insurance plaquonment poJblic heaHh and research and construc~on
SOURCE Health Care Anencing Admirlltration Office ofthe Actuary Data frorn the Office of National Health Statistics
HEAL11f CARE FINANCING REVIEWFall1996Volumet8Numbert
Table9 National Health Expenditures Aggregate Amounts and Average Annual Percent Change
by Type of Expendhure Selected CalendarYears 1960-95~
~
~ ll ~ ~
fJ
e
Typ Na
H
R Nat
H
e of Expenditure 1900 1970 1980 1985 1990 1991 1992 1990 1994 1995
Amount in Billions tional Health Expenditures $269 $732 $2472 $4282 $6975 $7617 $8342 $8921 $9371 $9885 ealth Services and Supplies 252 679 2356 4118 6729 7368 80amp7 8631 9067 9578 Personal HeaHh Care 236 638 2170 3764 6147 6766 7405 7869 8279 8788
Hospital Care 93 280 1027 1683 2564 2823 3054 3233 3350 3501 Physician Services 53 136 452 636 1463 1592 1757 1827 1906 2016 Dental Services 20 47 133 217 316 333 370 392 421 458 Other Professional Services 06 14 64 166 347 363 421 463 491 526 Home Health Care 01 02 24 56 131 161 196 230 263 286 Drugs and Other Medical Non-Durables 42 88 216 371 599 856 712 750 777 834 Vision Products and Other Medical Durables 06 16 38 67 105 112 119 125 129 138 Nursing Home Care 08 42 176 307 509 572 623 670 724 779 Other Personal Health Care 07 13 40 61 112 136 154 179 217 250
Program Administration and Net Cost of Private Health Insurance 12 27 118 238 386 388 427 509 506 477 Government Public Health Activities 04 13 67 116 196 214 234 253 282 314 esearch and Construction 17 53 116 164 245 249 275 290 304 307 Research1 07 20 55 78 122 129 142 145 158 166 Construction 10 34 62 85 123 120 134 145 146 140
Average Annual Percent Change from Previous Year Shown ional Health Expenditures - 106 129 116 102 92 95 69 51 55 ealth Services and Supplies - 104 132 118 103 95 95 70 51 56 Personal Health Care - 105 130 116 103 101 95 amp3 52 61
Hospi1al Care - 117 139 104 88 101 82 59 36 45 Physician Services - 99 128 131 118 88 104 40 44 58 Dental Services - 91 111 102 78 56 110 60 73 89 Other Professional Services - 88 163 212 158 104 100 100 61 70 Home Health Care - 145 269 189 184 224 223 171 144 86 Drugs and Other Medical Non-Durables - 76 94 114 101 94 86 54 36 73 Vision Products and Other Medical Ourables - 96 88 124 92 70 amp3 51 28 72 Nursing Home Csre - 174 154 117 107 122 90 76 81 75 Other Personal Health Care - 65 120 88 129 207 133 164 216 149
Program Administration and Net Cost of Private Health Insurance - 89 158 150 102 04 102 191 -o5 -58 Government Public Health Activities - 139 175 115 110 92 93 79 116 113
Research and Construction - 122 81 71 84 17 105 53 49 08 Research1 - 109 108 75 93 58 98 22 93 50 COnstruction - 129 62 67 76 -24 112 87 05 -38
bullR-nh and development ~Dpendilures of drug companies and other manufacturers and providers of medical equipment and supplies are exetuded from resaanh expendllureos but are included in 1he ecpendMe class in whieh the product falls
NOTE Numbers may not add to toCals because of rounding
SOURCE Health Care Financing Administation Office of the Actuary Data from 1he Offioe of National Health Statistics
i
~
fl Table 10 National Health ExpendHures ~ Source of Funds and Type of Expenditure
Selected alendarYears 1990-95 PltMde
Government Consumer
Year and tYpe of Expenditure Tolal
_ All
Funds Oth Total Oltrtof Pookel
Private Health
Insurance Tolal Federal
Slale end
Looel Amount in Billions National Health Expenditures $6975 $4131 $3606 $1484 $2324 $323 $2843 $1958 $885
Heahh Services and Supplies 6729 4029 3800 1484 2324 221 2700 1854 848 Personal Health Care 6147 3717 3502 1464 2018 215 2430 1781 649
Hospital Care 2564 1150 1043 103 940 107 1415 1066 349 Physician Services 1463 1014 987 354 833 27 450 359 91 Dental Services 316 307 306 154 151 01 09 05 04 Other Professional Services 347 282 256 142 114 26 65 43 22 Home Health Care 131 80 59 36 23 22 51 41 10 Drugs and Other Medical Non-Durables 599 635 635 404 130 - 65 31 34 Vlsloo Products and Other Medical Durables 105 77 77 67 09 - 28 26 01 Nursing Home Care 509 250 241 222 19 09 259 157 102 Other Personal Health Care 112 22 - - - 22 90 54 36
Program Administration and Net Cost of Private Health Insurance 386 312 306 - 306 06 74 49 25
Government Public Health Activities 196 - - - - - 196 24 172 Research and Construction 245 102 - - - 102 143 104 39
Research 122 10 - - - 10 113 95 17 Construction 123 93 - - - 93 30 08 22
1991 National Health Expenditures 7617 4414 4073 1550 2523 341 3203 2244 959
Health Services and Supplies 7368 4313 4073 1550 2523 240 3055 2138 917 Personal Health Care 6766 4000 3766 1550 2216 234 2766 2058 708
Hospital Care 2823 1231 1116 112 1004 115 1592 1238 353 Physician Services 1592 1100 1073 357 716 28 491 385 106 Dental Services 333 323 321 162 159 01 11 06 05 Other Professional Services 383 306 276 146 130 29 77 52 25 Home Health Care 161 93 68 43 25 25 67 55 12 Drugs and Other Medical Non-Durables 656 579 579 427 152 - 76 37 39 Vision Products and Other Medical Durables 112 78 78 69 09 - 34 32 01 Nursing Home Care 572 265 254 234 21 11 307 184 123 Other Personal Health Care 136 24 - - - 24 111 67 44
Program Administration and Net Cost of Private Health Insurance 388 313 307 - 307 06 75 53 22
Government Public Health Activities 214 - - - - - 214 27 187 Research and Construction 249 101 - - - 101 148 107 41
Research 129 11 - - - 11 118 99 19 Construction 120 90 - - - 90 30 07 23
See notes at end of tabla
~ ~ i Qz
i0 ~
~ ~ 0
bullz
bull
~ l
~ il z
sect ~ ~ -i$ 1 ~ bullIbullbullzbull
Table10-Continued National Health Expenditures a Source of Funds and Type of Expenditure
Selected alendarYears 1990--95 Private
Consumer Government
All Private State Private Out of Health and
Year and Type of ExpendHure Total Funds Tolal Pocket Insurance Olh~ Total Fampderal Looo
1992 Amount in Billions
National Health Expenditures $8342 $4788 $4428 $1658 $2770 $360 $3554 $2539 $1016 Health Services and Supplies 8067 4678 4428 1658 2770 250 3389 2421 968
Personal Health Care 7405 4334 4090 1658 2432 244 3071 2335 736 Hospital Care 3054 1292 1174 117 1057 118 1761 1415 347 Physician Services 1757 1231 1203 382 821 28 526 408 118 Dental Services 370 357 355 182 173 01 13 08 06 Other Professional Services 421 332 302 160 142 30 89 62 27 Home Health Care 196 108 79 50 29 29 88 74 14 Drugs and Other Medical Non-Durables 712 630 630 450 180 - 82 41 41 Vision Products and Other Medical Durables 119 81 81 73 09 - 37 36 01 Nursing Home Care 623 276 265 244 21 12 347 215 132 Other Personal Health Care 154 26 - - - 26 127 78 50
Program Administration and Net Cost of Private Health Insurance 427 344 338 - 338 06 84 55 28
Government Public Health Activities 234 - - - - - 234 30 204 Research and Construction 275 110 - - - 110 165 118 47
Aosaaroh 142 12 - - - 12 130 110 20 Construction 134 98 - - 98 35 08 28
1993 National Health Expenditures 8921 5055 4670 1716 2954 385 3865 2776 1089
Health Services and Supplies 8631 4937 4670 1716 2954 266 3694 2655 1039 Personal Health care 7869 4530 4269 1716 2554 261 3339 2559 780
Hospital Care 3233 1346 1224 119 1105 122 1886 1520 386 Physician Services 1827 1271 1240 375 BB5 31 556 435 120 Dental Services 392 375 373 191 183 02 17 10 o8 Other Professional Services 463 363 330 182 148 33 100 72 28 Home Health Care 230 119 87 56 31 32 111 95 15 Drugs and Other Medical Non-Durables 750 659 659 468 191 - 92 47 44 Vision Products and Other Medical Durables 125 84 84 75 09 - 41 40 01 Nursing Home Care 670 285 273 251 22 12 385 247 139 Other Personal Heahh Care 179 28 - - - 28 150 92 59
Program Administration and Net Cost of Private Health Insurance 509 406 401 - 401 06 102 64 39
Government Public Health Activities 253 - - - - - 253 33 220 Research and Construction 290 119 - - 119 171 121 50
Research 145 12 - - - 12 133 111 21 Construction 145 107 - - - 107 38 09 29
~
8 See notes at end of table
~ Table 10-Contlnued National Health Expenditures ~ Source of Funds and Type of Expenditure
5elected alendarYears 1990-95
bull Government Consumer
All Out of Private Heallh
Slate end
Year and Type of Expenditure Total Fbullnds Total Podltet Insurance Othelt Total Fede Looal
1994 Amount In BIUions National Health Expenditure $9371 $5172 $4787 $1760 $3027 $386 $4199 $3019 $1180
HeaHh Services and Supplies 9067 5055 4787 1760 3027 268 4012 2887 1126 Personal Health Care 8279 -7 4405 1760 2645 262 3612 21a1 831
Hospital Care 3350 1342 1228 113 1115 113 20oe 1629 379 Physician Services 1906 1315 1284 373 911 31 591 487 125 Dental Services 421 403 402 199 202 02 18 10 08 Other Professional Services 491 380 343 191 152 37 111 82 29 Home Health care Drugs and Other Medical Non-Durables
263 n7
128 677
94 677
60 478
33 34 198 -
135 101
117 52
17 49
VISion Products and Other Medcal Ourables 129 85 85 76 09 - 44 42 01 Nursing Home Care 724 306 293 269 24 14 418 2a9 149 Other Personal Health Care 217 31 - - - 31 187 113 73
Program Administration and Net Cost of Private Health Insurance 506 388 382 - 382 06 118 67 50
Government Public Health Activities 282 - - - - - 282 38 244 Research and Construction 304 118 - - - 118 187 132 55
Research 158 13 - - - 13 146 123 23 Construction 146 105 - - - 105 41 09 32
1995National Health Expenditures 9885 5321 4932 1826 3106 389 4564 3284 1280
Health Services and Supplies 9578 5212 4932 1826 3106 280 4387 3144 1222 Personal Health Care 8788 4867 4593 1826 2768 273 3921 3036 885
Hospital Care 3501 1358 1245 114 1131 113 2143 1753 390Physician Services 2016 1376 1339 369 970 37 640 509 131 Dental Services 458 440 438 218 220 02 18 10 08 Other Professional Services 526 399 360 202 158 39 127 96 31 Home Health Care 286 128 93 60 33 34 158 138 20 Drugs and Other Medical NonmiddotOurables 834 720 720 498 221 - 114 59 56 Vision Products and Other Medical Ourables Nursing Home Care
138 n9
87 326
87 311
78 286
09 -25 15
51 453
50 293
01 160
Other Personal Health Care 250 33 - - - 33 217 128 89Program Administra11on and Net
Cost of Private Health Insurance 477 345 339 - 339 06 132 71 61Government Public Health Activities 314 - - - - - 314 38 276
Research and Construction 307 109 - - - 109 197 140 57166 14 - - - 14 152 129 23
Construction 140 96 - - - 96 45 11 34
I ~ 1
~
Iill
~ -8 ~ ~ bull I -z bull bull
NOTES Research and deVelopment expenlilures of drug companies and other manufacturers and providers of medical equipment and supplies are excluded from research expeoditures but areIncluded in the expendihJre class in which the product falls Numbers may not add to totals because of rounding SOURCE Health Care Financing Administration Offioe of the Actuary Data from the Oflioe of National Health Statistics
Table 11 Personal Health Care Expenditures Aggregate anrcr Capha Amounts and Percent Distribution
by Source of Funds Select Calendar Years 1960-95 ~ ~ l
~ l5 ~ ~ ~
f bull z
bull
ThirdmiddotParty Payments
Government
Out-of- Private other State Podltet Health Private and
YeN Total Payments Total Insurance Funds Total Federal Local Medlcare1 Medlcald2
Amount in Billions 1960 $236 $131 $106 $50 $04 $51 $21 $30 1970 638 249 389 148 16 225 147 78 $73 $51 1980 2170 603 1568 620 78 870 634 236 384 248 1985 3764 1006 2758 1138 141 1480 1113 367 703 392 1990 6147 1484 4663 2018 215 2430 1781 649 1096 717 1991 6766 1550 5216 2216 234 2766 2058 708 1202 901 1992 7405 1658 5748 2432 244 3071 2335 736 1354 1021 1993 7869 1716 6153 2554 261 3339 2559 780 1478 1146 1994 8279 1760 6519 2645 262 3612 2781 831 1644 1234 1995 8788 1826 6962 2768 273 3921 3036 885 1840 1331
Per Capita Amount 1960 $124 $59 1970 297 116
$56 181
$26 $2 $27 8 108
$11 $16 36 r1 ()
1980 923 256 1985 1523 407
667 1116
264 460
33 370 87 599
270 460
100 148
rgtr1
I~ ()
1990 2364 571 1794 776 83 936 685 249 () I~ 1991 2577 590 1986 644 89 1053 794 270 rgt () 1992 2792 625 2167 917 92 1158 890 278 rgt () 1993 2938 941 2297 953 97 1247 955 291 rgt I~ 1994 3061 9511995 3219 2411
2560 978
1014 97 1336
100 1436 1029 1112
307 324
rgt ()
() I~
Percent Distribution 1960 1000 553 447 212 18 217 90 126 1970 1000 390 610 232 26 353 230 122 114 79 1980 1000 278 722 286 36 401 292 109 168 114 1985 1000 267 733 302 37 393 296 97 187 104 1990 1000 241 759 328 35 395 290 106 178 117 1991 1000 229 771 328 35 409 304 105 178 133 1992 1OClO 224 776 328 33 415 315 99 183 138 1993 1000 218 782 325 33 424 328 99 188 146 1994 1000 213 787 319 32 436 336 100 199 149 1995 1000 208 792 315 31 446 345 101 209 151
1Subset of Federal funds 2Subset of Fedeal ard State and local fUnds 3Cafclllation of per capita estimates Is Inappropriate NOTES Per capita amounts based on _ry 1 Social Security area population estimates for each year 1960-95 Numbers and percents may not add to totals because of rounding
~ SOURCE Health Care F-ancing Administration Office of the Actuary Data from the Office of National Health Statistics
~ Table 12 Hospital Care Expenditures Aggregate and per Capita Amounts and Percent Distribution
by Source of Funds Selected Calendar Years 1960-95
Out-ofshyPoclltet
Third-Party Payments
Government
Private OthB Hh Private
State YaM Total Payments Total Insurance Funds Total Federal Local Medicarel MedicaidZ
Amount In Billions 1960 $93 $19 $74 $33 $01 $39 $16 $23 1970 280 25 255 91 09 155 102 53 $54 $27 1980 1027 53 974 364 50 559 422 138 264 106 1985 1683 88 1595 587 83 925 725 200 491 158 1990 2564 103 2462 940 107 1415 1066 349 697 297 1991 2823 112 2711 1004 115 1592 1238 353 762 382 1992 3054 117 2936 1057 118 1761 1415 347 864 429 1993 3233 119 3114 1105 122 1886 1520 366 926 476 1994 3350 113 3237 1115 113 2008 1629 379 1019 499 1995 3501 114 3387 1131 113 2143 1753 390 1126 520
Per Capita Amount 1960 $49 $10 $39 $17 $1 $21 $9 $12 1970 130 12 119 42 4 72 47 25 (~ PI 1990 437 23 1985 681 36 1990 996 40 1991 1075 43 1992 1151 44
414 645 947
1032 1107
155 238 362 382 399
21 238 33 374 41 544 44 606 44 584
179 293 410 472 533
59 81
134 135 131
(I(I (~PI (~
PI (~ PI (IPI
1993 1207 44 1994 1239 42 1995 1283 42
1163 1197 1241
413 412 414
46 704 42 743 42 7S5
568 603 642
137 140 143
(~(I (~
PI (~
PI Percent Distribution
1960 1000 207 793 356 12 425 173 252 1970 1000 90 910 324 32 554 364 190 192 95 1980 1000 52 948 355 49 544 410 134 258 104 1985 1000 52 948 349 49 549 431 119 292 94 1990 1000 40 960 366 42 552 416 136 272 116 1991 1000 40 960 356 41 564 439 125 270 135 1992 1000 3S 962 346 39 577 453 114 283 141 1993 1000 37 963 342 38 584 470 113 286 147 1994 1000 34 966 333 34 600 486 113 304 149 1995 1000 33 967 323 32 612 501 111 322 146
bullSubset of Federal funds 2Subset of Federal and State and local funds ltCalculation of per eapita eamptimates is inappropriate
~ ~ el
~ ~ ~ ~ ~ ~
ltgt ~ ~ bull ~ zbull t
NOTES Per capita amounts based on July 1 Social Security area population estimates breach year 1960-95 Numbers and percents may not add to tlaquoals because of rounding
SOURCE Health Care Financing Administration OffiCe of the Actuary Data from the Office of National Health Statistics
Table 13 Physlelan Service Expenditures A~gregate and per Capita Amounts and Percent Distribution
by Source of unds Selected Calendar Years 1960S5 ~ ~ l
~ ~ ~ ~ I ~
~ ~ bulli ~ ~ ~
Ye ToteJ
Out-ofshyPodlte1
Payments
Third-Party Payments
Medicarebull Medicaid2 Tot~
Government
Private Olh0ltHealth
Insurance Funds ToteJ Federal
State ~d
Local
1960 1970 1880 1985 1990 1991 1992 1993 1994 1995
1980 1970 1880 1985 1990 1991 1992 1993 1994 1995
1980 1970 1980 1985 1990 1991 1992 1993 1994 1995
$53 136 452 836
1463 1592 1757 1827 1906 2016
$28 63
192 338 563 606 663 662 705 739
1000 1000 1000 1000 1000 1000 1000 1000 1000 1000
$33 57
146 244 354 357 382 375 373 369
$17 27 62 99
136 136 144 140 138 135
627 422 324 291 242 224 218 206 196 183
$20 78
306 593
1109 1235 1375 1451 1533 1648
$10 37
130 240 427 470 518 542 567 504
373 578 676 709 758 n6 782 794 804 817
$16 48
171 334 633 716 821 885 911 970
22 73
135 243 273 309 323 337 355
302 352 379 399 432 450 467 473 478 481
Amount in Billions $00 $04
00 31 04 131 14 245 27 450 28 491 28 526 31 556 31 591 37 840
Pet Capita Amount $0 $2
0 14 2 566
10 173 11 187 11 198 12 207 12 219 14 234
Percent Distribution 01 71 01 225 08 289 16 293 18 307 17 309 16 299 17 304 16 310 19 317
$01 22
100 196 359 385 408 435 467 509
$0 10 43 79
138 147 154 163 173 187
14 163 221 234 245 242 232 238 245 253
$03 08 31 49 91
106 118 120 125 131
$2 4
13 20 35 40 45 45 46 48
57 62 68 59 62 66 67 66 65 65
$17 80
165 295 307 316 334 362 400
(~ (~ () (~ (~ (~ (~ () (~
122 176 197 202 193 180 183 190 198
$06 25 35 71 92
112 126 134 143
(~ (~ (~ () () (~ () (~ I~
48 56 42 48 58 63 69 70 71
Subset of Federal funds 2Subset of Federal and State and local funds 3Calculation of per capita estimates is inappropriate
_
NOTES The figure 00 denotes less than $ampl m~lion tor aggregate amounts and 0 derotes less than $050 lor per capita amounts Per capita alnOJnt$ based on July 1 Social Security area population estimates for eaoh year 1960-95 Numbas and percents may not add to totals because of rounding
~ SOURCE Health Care Financing Administration Office of the Actua~y Data from the Office of National HeaHh Statistics
~
iil Table 14 Nursing Home Care Expenditures Aggregate and per Capita Amounts and Percent Distribution
by Souree of Funds Selected CalendarYeare1960-95
Tot~ - Out-of-Pooket
Payments T~
Private Health
Insurance
Third-Party Payments
Government
Medicare1 Medicaid2
Other Private Funds Tot~ Federal
Stateand
Local
1960 1970 t980 t985 1990 t99t 1992 1993 1994 1995
1960 1970 t980 t990 1992 1993 1994 1960 1970 1980 1990 1992 t993 1994 1995
$08 42
176 307 509 572 623 670 724 779
$4 20 75
124 196 218 235 250 268 285
1000 1000 1000 1000 1000 1000 1000 1000 1000 1000
$07 23 74
136 222 234 244 251 269 286
$3 11 3t 55 86 92 94
105
779 535 418 444 436 409 391 374 371 367
$02 20
103 171 287 338 379 420 455 493
$1 9
44 69
110 129 143 157 168 181
221 465 582 556 564 591 609 626 629 633
$00 00 02 08 19 21 2t 22 24 25
$0 0 t 3 7 8 8 8 9 g
00 04 12 27 37 36 34 33 33 33
Amount in Billions $01 $01
02 17 05 95 06 157 09 259 t 1 307 12 347 12 385 14 418 t5 453
Per Capita Amount $0 t 8 2 41 2 63 4 tOO 4 117 4 131 5 144 5 155 5 166
Percent Distribution 63 157 49 412 30 540 18 511 19 508 18 536 19 557 t9 575 19 577 19 581
$01 tO 56 92
157 184 215 247 269 293
$0 5
24 37 60 70 8t 92 99
107
79 248 318 298 308 322 345 368 371 376
$01 07 39 65
102 123 132 139 149 160
$0 3
t7 26 39 47 50 52 55 59
78 164 222 212 200 215 212 207 206 205
$01 03 04 t7 20 32 46 59 73
() p) () () p) p) () p) ()
34 t7 14 33 34 St 68 82 94
$09 88
145 231 275 302 324 342 362
() () () () () (~ () (~ p)
223 500 472 454 481 485 484 472 465
bullSubset of Fede~al fund~2Subset of Federal and State and local fund~
~Calculation of per capita estimates is inappropriate
~ ~ ~
~ ~ sect ~ ~
~
~ bull
bull ~
NOTES The figure 00 denotes less than $50 million for aggegate amounts and 0 denotes less than $050 for per capita amouRs Per capita amounts based on lJ~ 1 Social SectJrity aree population estimates breach year 1960-95 Numbers and percents may not add to totals because of rounding
SOURCE Health Care Financing Administration OffiCe of the Actuary Data from the Office of National HeaHh Statistics
bull
I sect
0 ~ sect5
I ~
~ f bullz
1-
Table 15 Other Personal Health Care Expenditurest Aggregate and per Capita Amounts and Percent Distribution
by Source of Funds Selected Calendar Years 1960-95
Yea- Total
OUt-of-
Payments
Third-PEny Payments
Medicare2 Medicaldl Total
Private 01her Heolth
Insurance Fnds Totol
Government
Federal
State and
looaJ
1960 1970 1990 1985 1990 1991 1992 1993 1994 1995
1960 1970 1990 1985 1990 1991 1992 1993 1994 1995
1960 1970 1980 1985 1990 1991 1992 1993 1994 1995
$82 180 515 939
1610 1780 1972 2139 2299 2492
$43 84
219 380 619 678 743 798 850 913
1000 1000 1000 1000 1000 1000 1000 1000 1000 1000
$72 144 329 538 804 848 915 971
1004 1057
$38 67
140 218 309 323 345 363 371 387
874 799 639 573 500 476 464 454 437 424
$10 36
186 401 805 932
1057 1168 1294 1435
$5 17 79
162 310 355 398 436 479 526
126 201 361 427 500 524 536 546 563 576
$01 09 82
208 427 476 533 562 595 641
$1 4
35 84
164 181 201 210 220 235
15 50
160 222 265 267 270 263 259 257
Amount in Billions $02 $07
05 22 19 85 39 154 72 306 80 376 86 437 95 512
104 595 108 685
Per Capita AmOUlt $1 $4 2 10
36 bull 16 28 118 30 143 33 165 35 191 38 220 40 251
Percent Distribution 30 81 28 123 36 165 41 164 45 190 45 211 44 222 44 239 45 259 43 275
$04 12 56
101 200 250 298 356 417 460
$2 6
24 41 7T 95
112 133 154 176
48 69
110 108 124 140 151 167 181 193
$03 10 28 53
107 126 139 155 178 205
$14
12 21 41 48 52 58 66 75
34 53 55 56 66 71 71 73 78 82
$01 17 42 87
114 142 172 204 240
(~ (~ (~ (~ (~ (~ (~ (~ (~
07 32 45 54 64 72 81 89 96
$08 28 53
118 152178 219 259 306
() ()() () () () () () ()
45 55 57 73 86 90
103 112 123
Personal health care expenditures other than tiYIse for hospital care physician serviees and rursing home eare 2Sub$et of Federal fuols ~Subset of Federal and State anclloeal funds ~leulation of per capita estimates is inappropriate
shy
NOTES Per capilli amounts tsed on llly 1 Social Security area population estirnatlS for each year 1960-95 Numbers and pereents may rKit add to totals because of 100nding
~ SOURCE Haallh Care flnencing Adminislllltion Office of the Ntuaty Data from the Oflic of Natlcnal Health Statistics
0
~ - Table 16
Personal Health Care Expenditures by Type of Expenditure and Source of Funds Selected Calendar Years 1991-95
Other Vision Products Olh~ Prates- Home Drugs and and other Nursing Personal
Hospital Physician DemeJ sional Health Other Medical Medical Home Health Source of Funds Total c Services Services Services c Non-Durables Durables c Ce
1991 Amount in Billions Personal Health Care Expenditures $6766 $2823 $1592 $333 $383 $161 $656 $112 $572 $136 Out-of-Pocket Pcyenments 1550 112 357 162 146 43 427 69 234 Third-Party Payments 5216 2711 1235 17J 237 117 229 43 338 136
Private Health Insurance 2216 1004 716 159 130 25 152 09 21 Other Private 234 115 28 01 29 25 - - 11 24 Government 2766 1592 491 11 77 67 76 34 307 111
Federal 2058 1238 365 06 52 55 37 32 184 67 Medicare 1202 762 307 - 41 42 - 30 20 Medicaid 545 254 53 05 03 13 35 - 153 29 01hOlt 310 222 25 01 08 - 01 02 12 39
State and local 708 353 106 05 25 12 39 01 123 44 Medcaid 355 128 38 04 03 12 27 - 122 22 Other 352 226 67 01 22 00 13 01 00 22
1992 Personal Health Care Expenditures 7405 3054 1757 370 421 196 712 119 623 154 Out-of-Pocket Patments 1656 117 362 162 160 50 450 73 244 Third-Party Payments 5746 2936 1375 166 261 146 262 46 379 154
Private Health Insurance 2432 1057 621 173 142 29 160 09 21 Other Private 244 116 28 01 30 29 - 12 26 Government 3071 1761 526 13 89 88 82 37 347 127
FedOltal 2335 1415 406 08 62 74 41 36 215 78 Medicare 1354 664 316 - 50 59 - 34 32 Medicaid 657 316 66 06 04 15 39 - 171 37 01helt 324 232 25 01 09 - 02 02 13 41
State and Local 736 347 118 06 27 14 41 01 132 50 Medicaid 364 111 45 05 03 13 28 - 131 27 01helt 371 235 73 01 24 00 13 01 01 23
1993 Personal Health Gare Expenditures 7869 3233 1827 392 463 230 750 125 670 179 Out-of-Pocket Payments 1716 119 375 191 162 56 468 75 251 Third-Party Payments 6153 3114 1451 202 261 174 282 50 420 179
Private Health Insurance 2554 1105 865 183 148 31 191 09 22 Other Priva1e 261 122 31 02 33 32 - - 12 28 Government 3339 1886 556 17 100 111 92 41 385 150
Fedltgtltal 2559 1520 435 10 72 95 47 40 247 92 Medicare 1478 926 334 - 57 78 - 37 46 Medicaid 740 350 76 09 06 18 45 - 187 50 01helt 341 244 26 01 09 - 02 03 14 42
State and local 760 366 120 08 28 15 44 01 139 59 Medicaid 406 126 50 07 04 15 32 - 138 35 Olhelt 374 240 70 01 24 01 13 01 01 24
See notlaquo at end of table
~~
~Qz
sect
~-fi~~
~
~ ~
Table 16-Continued Personal Health Care Expenditures by Type of Expenditure and Source of Funds Selected Calendar Years 1991-95
Vtsion Products Oth~
Hospital Physician Profes-
DemaJ sional Home Health
Drugs and and Other Other Medical Meltfioal
Nursing Home Health
Source of Funds To~ Calte Services Services Services Care Non-Durables Durables Calte Calte
1994 Amount In Billions Personal Health care Expenditures $8279 $3350 $1906 $421 $491 $263 $777 $129 $724 $217
Out-of-Pocket Payments 1760 113 373 199 191 60 478 76 269 Third-Party Payments 6619 3237 1533 222 301 203 299 53 455 217
Private Health Insurance 2645 1115 911 202 152 33 198 09 24 Other Private 262 113 31 02 37 34 - - 14 31 Government 3612 2008 591 18 111 135 101 44 418 187
Federal Medicare 2781 1644
1629 1019
467 362
10 82 - 67
117 98
52 42 - 39
269 59
113
Medicaid 78~ 3~2 80 09 06 19 49 - 194 64 Othelt 354 248 25 01 09 - 02 03 15 49
State and Local 831 379 125 08 29 17 49 01 149 73 Medicaid 451 137 55 07 05 16 36 - 148 47 01helt 380 242 70 01 24 01 13 01 01 26
1095 Personal Health Care Expenditues 8788 3501 2016 458 526 286 834 138 4ne 250
Out-offockampt Payments 1826 114 369 218 202 60 498 78 286 Third-Party Payments 6962 3387 1648 240 324 226 336 60 493 250
Private Health Insurance 2768 1131 970 220 158 33 221 09 25 Other Private 273 113 37 02 39 34 - - 15 33 Government 3921 2143 640 18 127 158 114 51 453 217
Federal 3036 1753 509 10 96 138 59 50 293 128 Medicare 1840 1126 400 - 78 116 - 46 73 Medicaid 831 372 84 09 08 22 56 - 203 78 01helt 365 255 26 01 10 - 03 03 16 50
State and Local 885 390 131 08 31 20 56 01 160 89 Medicaid 500 148 59 07 06 19 42 - 159 60 01helt 386 242 71 01 25 01 14 01 01 29
~
~ Q il sectElO- ~ ~bull~ f
NOTES The figure 00 denotes amounts tess than $50 million Medicaid ecpenditures exclude Part B premium payments to Medicare by States under buyJn agreements to cover premiums br eligible Medicloid recipients Numbers may not add to totals because of rounding
SOURCE Heallh Care Financing Administration Office of the Actuary Data from the Office of National Health Statistics
N--
~
Table 17Expenditures for Health Services and Supplies Under Public Programs by Type of Expenditure and Program Calendar Year 1995
Personal Health Care
VISion Olh0lt Drugs and Pltoduots
Professhy H~e Olhelt and Other Nursing Public All Hospital Physician Dental sional Health Medcal Medical Home Admlntsshy Heelh
Program Area Expenditures Total c~e Services Services Services Care Non-Durables Durables c~e OlhOlt tration Activities
Pub6c and Private Spending $9578 $8788 All Public Programs 4367 3921
Federal Funds 3144 3036 State and Local Funds 1222 885
Medicare 1870 1840 Medicaid 1410 1331
Fedeltel 868 831 State and Local 542 500
Other State and Local Public Assistance Programs 54 54
Department of Veterans Affairs 156 155 Department of Oefensez 135 133 Workers Compensation 198 181
Federal 06 06 State and local 192 175
State and local Hospitals3 123 123 Other Public Programs for
Personal Health Care4 106 104 Fedeuol 72 71 State and local 34 33
Government Public Heahh Activities 314 -Fedeuol 38 -State and local 276 -
Medicare and Medicaid 3280 3171
Exelude5 funds paid into the Medicare trust funds by States 21ncludes care br retirees and military dependents 3 Expenditures not offset by IGVlaquoWJSS
4lncludes program spending for maternal and child heahh votats Indian health services alooholism drug abuse and ment
$3501 $2016 2143 640 1753 509 390 131
1126 400 520 143 372 84 148 59
31 04 129 01 105 16 66 67 03 01 65
123
21 09 17 07 03 02 - -- -- -
1646 543
under buy-In agreemen
cational rehablitalion mal haatth and school health
Amount in Billions $458 $526 $286 $834
18 127 158 114 10 96 138 59 08 31 20 56
- 78 116 -16 14 41 98 09 08 22 56 07 06 19 42
01 03 01 10 00 - - 00 00 - - 02 - 21 - 04
~ - 01 00 - 20 - 04
01 10 - 00 01 09 - 00 00 02 - 00 - - - -- - - -- - - -
16 92 157 98
ts to cover premiums for Medicakl recipients
edical payments temporary disability insurance medic
$138 51 50 01
46 ---
00 03 -
01 00 01
01 01 00 ---
46
al payments P
$779 453 293 160
73 362 203 159
01 16 ----
--
---
435
ublic Health
$250 217 128 89
-138 78 60
04 06 09 ---
61 36 25 ---
138
Service a
$477 132
71 61
30 79 36 42
01 02 17 00 17
03 01 02 ---
109
nd other Fe
$314 314 38
276
314 38
276
deral ho$pimiddot
~ ~ ~
~ ~ ~ ~ ] ~ ~ bulli
-middotf
N
S
shy
OTES The fiJIre 00 denotes amounts less than $50 million Numbers may not add to total because oiiQUnding shyOURCE Health Care Financing Adminlslfation OffiCe of the Actuary Data from the OffiCe of National Heahh Statistics
REFERENCES
Alecxih LMB and Lutzky S How Do Alternative Eligibility Triggers Affect Access to Private LongshyTerm Care Insurance Public Policy Institute issue paper 9605 Washington DC American Association of Retired Persons August 1996 American Hospital Association National Hospital Panel Survey Unpublished Chicago 1995 American Medical Association Socioeconomic Characteristics of Medical Practice 1996 Chicago April1996 Anders G Pricey Operation A Plan to Cut Back on Medicare Expenses Goes Awry Costs Soar The Wall Street ]ournalAl October 3 1996 Baker C and Kramer N Employer-Sponsored Prescription Drug Benefits Employer Benefits Survey A BLS Reader US Department of Labor Bureau of Labor Statistics Bulletin 2459 Washington DC US Goverrunent Printing Office February 1995 Board of Trustees Federal Hospital Insurance Trust Fund The 1996 Annual Report ofthe Board of Trustees of the Federal Hospital Insurance Trust Fund Washington DC US Government Printing Office 1996 Day K Health Insurers Push the Envelope Costmiddot Cutting Drive Leads to a Boom in Mail-Order Prescriptions-and Worries for Drugstore Chains The Wall StreetjournalDl October 171996
Dial TH Pan L Bergsten C et al HMO amp PPO Industry Profile 1995middot96 Edition Washington DC American Association of Health Plans May 1996
Duke KS Hospitals in a Changing Health Care System Health Affairs 15(2)41 Summer 1996 DuNah R Jr Harrington C Bedney B et al Variations and Trends in State Nursing Facility Capacity 1978-93 Health Care Financing Review 17(1)183-199 Fall1995 Emmons DW and Simon CJ Managed Care Evolving Contractual Arrangements Socioeconomic Characteristics of Medical Practice 1996 Chicago American Medical Association April1996
Foster Higgins National Survey of EmployershySponsored Health Plans 1994 Report New York Foster Higgins Survey and Research Services 1994 Genuardi JS Stiller ]M and Trapnell G R Changing Prescription Drug Sector New Expenditure Methodologies Health Care Financing Review 17(3)191-204 Spring 1996
Goldberg J Doctors Earnings An Uphill Struggle Medical EcoMmics 73(17)250-261 Sept 9 1996 Health Care Financing Administration Medicaid Managed Care Enrollment Report Summary Statistics as ofJune 30 1995 Baltimore 1996
Health Insurance Association of America Source Book of Health Insurance Data 1996 Washington DC To be published Health Insurance Association of America Information from William Weller Senior Actuary Washington DC1996 Heffler SK Donham CS Won DK et al Health Care Indicators Hospital Employment and Price Indicators for the Health Care Industry Fourth Quarter 1995 and Annual Data for 1987middot95 Health Care Financing Review 17(4)217middot256 Sununer 1996
IMS America Data from the US Hospital Audit Plymouth Meeting PA 1996 Kletke PR Emmons DW and Gillis K D Current Trends in Physicians Practice Arrangement From Owners to Employees journal ofthe American Medical Association 276(7)555-560 August 21 1996 KPMG Peat Marwick Health Benefits in 1996 (Also yearly editions for 1991middot95) Newark NJ 1991-96 KPMG Peat Marwick Health Benefits in 1996 Newark NJ To be published
Langley M and Sharp A As Big Hospital Chains Take Over Nonprofits a Backlash is Growing The Wall StreetjournalA1 October 18 1996
Levi~ KR Lazenby HC Sivarajan L et a National Health Expenditures 1994 Health Care Financing Review 17(3)205-242 Spring 1966
lewinmiddotVHI Inc Subacute Care Policy Synthesis and Market Area Analysis Available on the Internet at httpaspeosdhhsgov daltcphomehtm Contract Number HHamp100-93-0012 Prepared for the Office of the Assistant Secretary for Planning and Evaluation US Department of Health and Human Services Washington DC 1995
Miller RS Jonas HS and Whitcomb ME The Initial Employment Status of Physicians Completing Training in 1994 journal of the American Medical Association 275(9)708-712 March 6 1996 Moser JW Trends and Patterns in Physician Income Socioeconomic Characteristics of Medical Practice 1996 Chicago American Medical Association April1996
HEALTIJ CARE FINANCING REVIEWFaJII996Vohlmei8Numberl 213
National Center for Health Statistics Health United States 1995 US Department of Health and Human Services Public Health Service Washington US Government Printing Office June 1996 Newhouse JP Reimbursing Health Plans and Health Providers Selection Versus Efficiency in Production journal of Economic Literature 34(3)1236-1263 September 1996 Rice T Stearns S DesHarnais S et al Do Physicians Cost Shift Health Affairs 15(3)215- 225 Fall1996 Rundle RL Tenet Healthcares Bid to Buy OrNda Signals It Means to Stay Independent The Wall Street ]ournalB3 October 18 1996 Schondelmeyer S and Seoane-Vazquez E Prescription Trends 1996 Survey American Druggist 213(6)25 June 1996
Seifer SD Troupin B Rubenfeld GD Changes in Marketplace Demand for Physicians journal of the American Medical Association 276(9)695-699 September 4 1996
Simon C J and Born PH Physician Earnings in a Changing Managed Care Environment Health Affairs 15(3)124-133 Fall1996
Social Security Administration Office of the Actuary Unpublished data used in the preparation of the 1996 Trustees Report Baltimore 1996 Tanouye E Managed Care Is Boosting Drug Sales The WaU Street ]ournalB10 October 17 1996 US Bureau of Labor Statistics Employee Benefits in Medium and Large Firms 1993 Bulletin 2456 US Deparbnent of Labor Washington US Government Printing Office November 1994 US Bureau of the Census Service Annual Survey 1994 US Deparbnent of Commerce Washington DC August 1996 Wooton S Physicians are Ordered to Limit Referrals Baltimore SunC3 August 3 1996
Zwanziger J and Melnick GA Can Managed Care Plans Control Health Care Costs Health Nfoirs 15(2)185-199 Summer 1996
Reprint Requests Anna Long Office of Nationa] Health Statistics Health Care Financing Administration 7500 Security Boulevard NJ02()2 Baltimore Maryland 21244-1850 ampmail alonglhcfagov
HEALm CARE FINANCING REVIEWFall 1996VolumetSNumberi 214

~
fl Table 10 National Health ExpendHures ~ Source of Funds and Type of Expenditure
Selected alendarYears 1990-95 PltMde
Government Consumer
Year and tYpe of Expenditure Tolal
_ All
Funds Oth Total Oltrtof Pookel
Private Health
Insurance Tolal Federal
Slale end
Looel Amount in Billions National Health Expenditures $6975 $4131 $3606 $1484 $2324 $323 $2843 $1958 $885
Heahh Services and Supplies 6729 4029 3800 1484 2324 221 2700 1854 848 Personal Health Care 6147 3717 3502 1464 2018 215 2430 1781 649
Hospital Care 2564 1150 1043 103 940 107 1415 1066 349 Physician Services 1463 1014 987 354 833 27 450 359 91 Dental Services 316 307 306 154 151 01 09 05 04 Other Professional Services 347 282 256 142 114 26 65 43 22 Home Health Care 131 80 59 36 23 22 51 41 10 Drugs and Other Medical Non-Durables 599 635 635 404 130 - 65 31 34 Vlsloo Products and Other Medical Durables 105 77 77 67 09 - 28 26 01 Nursing Home Care 509 250 241 222 19 09 259 157 102 Other Personal Health Care 112 22 - - - 22 90 54 36
Program Administration and Net Cost of Private Health Insurance 386 312 306 - 306 06 74 49 25
Government Public Health Activities 196 - - - - - 196 24 172 Research and Construction 245 102 - - - 102 143 104 39
Research 122 10 - - - 10 113 95 17 Construction 123 93 - - - 93 30 08 22
1991 National Health Expenditures 7617 4414 4073 1550 2523 341 3203 2244 959
Health Services and Supplies 7368 4313 4073 1550 2523 240 3055 2138 917 Personal Health Care 6766 4000 3766 1550 2216 234 2766 2058 708
Hospital Care 2823 1231 1116 112 1004 115 1592 1238 353 Physician Services 1592 1100 1073 357 716 28 491 385 106 Dental Services 333 323 321 162 159 01 11 06 05 Other Professional Services 383 306 276 146 130 29 77 52 25 Home Health Care 161 93 68 43 25 25 67 55 12 Drugs and Other Medical Non-Durables 656 579 579 427 152 - 76 37 39 Vision Products and Other Medical Durables 112 78 78 69 09 - 34 32 01 Nursing Home Care 572 265 254 234 21 11 307 184 123 Other Personal Health Care 136 24 - - - 24 111 67 44
Program Administration and Net Cost of Private Health Insurance 388 313 307 - 307 06 75 53 22
Government Public Health Activities 214 - - - - - 214 27 187 Research and Construction 249 101 - - - 101 148 107 41
Research 129 11 - - - 11 118 99 19 Construction 120 90 - - - 90 30 07 23
See notes at end of tabla
~ ~ i Qz
i0 ~
~ ~ 0
bullz
bull
~ l
~ il z
sect ~ ~ -i$ 1 ~ bullIbullbullzbull
Table10-Continued National Health Expenditures a Source of Funds and Type of Expenditure
Selected alendarYears 1990--95 Private
Consumer Government
All Private State Private Out of Health and
Year and Type of ExpendHure Total Funds Tolal Pocket Insurance Olh~ Total Fampderal Looo
1992 Amount in Billions
National Health Expenditures $8342 $4788 $4428 $1658 $2770 $360 $3554 $2539 $1016 Health Services and Supplies 8067 4678 4428 1658 2770 250 3389 2421 968
Personal Health Care 7405 4334 4090 1658 2432 244 3071 2335 736 Hospital Care 3054 1292 1174 117 1057 118 1761 1415 347 Physician Services 1757 1231 1203 382 821 28 526 408 118 Dental Services 370 357 355 182 173 01 13 08 06 Other Professional Services 421 332 302 160 142 30 89 62 27 Home Health Care 196 108 79 50 29 29 88 74 14 Drugs and Other Medical Non-Durables 712 630 630 450 180 - 82 41 41 Vision Products and Other Medical Durables 119 81 81 73 09 - 37 36 01 Nursing Home Care 623 276 265 244 21 12 347 215 132 Other Personal Health Care 154 26 - - - 26 127 78 50
Program Administration and Net Cost of Private Health Insurance 427 344 338 - 338 06 84 55 28
Government Public Health Activities 234 - - - - - 234 30 204 Research and Construction 275 110 - - - 110 165 118 47
Aosaaroh 142 12 - - - 12 130 110 20 Construction 134 98 - - 98 35 08 28
1993 National Health Expenditures 8921 5055 4670 1716 2954 385 3865 2776 1089
Health Services and Supplies 8631 4937 4670 1716 2954 266 3694 2655 1039 Personal Health care 7869 4530 4269 1716 2554 261 3339 2559 780
Hospital Care 3233 1346 1224 119 1105 122 1886 1520 386 Physician Services 1827 1271 1240 375 BB5 31 556 435 120 Dental Services 392 375 373 191 183 02 17 10 o8 Other Professional Services 463 363 330 182 148 33 100 72 28 Home Health Care 230 119 87 56 31 32 111 95 15 Drugs and Other Medical Non-Durables 750 659 659 468 191 - 92 47 44 Vision Products and Other Medical Durables 125 84 84 75 09 - 41 40 01 Nursing Home Care 670 285 273 251 22 12 385 247 139 Other Personal Heahh Care 179 28 - - - 28 150 92 59
Program Administration and Net Cost of Private Health Insurance 509 406 401 - 401 06 102 64 39
Government Public Health Activities 253 - - - - - 253 33 220 Research and Construction 290 119 - - 119 171 121 50
Research 145 12 - - - 12 133 111 21 Construction 145 107 - - - 107 38 09 29
~
8 See notes at end of table
~ Table 10-Contlnued National Health Expenditures ~ Source of Funds and Type of Expenditure
5elected alendarYears 1990-95
bull Government Consumer
All Out of Private Heallh
Slate end
Year and Type of Expenditure Total Fbullnds Total Podltet Insurance Othelt Total Fede Looal
1994 Amount In BIUions National Health Expenditure $9371 $5172 $4787 $1760 $3027 $386 $4199 $3019 $1180
HeaHh Services and Supplies 9067 5055 4787 1760 3027 268 4012 2887 1126 Personal Health Care 8279 -7 4405 1760 2645 262 3612 21a1 831
Hospital Care 3350 1342 1228 113 1115 113 20oe 1629 379 Physician Services 1906 1315 1284 373 911 31 591 487 125 Dental Services 421 403 402 199 202 02 18 10 08 Other Professional Services 491 380 343 191 152 37 111 82 29 Home Health care Drugs and Other Medical Non-Durables
263 n7
128 677
94 677
60 478
33 34 198 -
135 101
117 52
17 49
VISion Products and Other Medcal Ourables 129 85 85 76 09 - 44 42 01 Nursing Home Care 724 306 293 269 24 14 418 2a9 149 Other Personal Health Care 217 31 - - - 31 187 113 73
Program Administration and Net Cost of Private Health Insurance 506 388 382 - 382 06 118 67 50
Government Public Health Activities 282 - - - - - 282 38 244 Research and Construction 304 118 - - - 118 187 132 55
Research 158 13 - - - 13 146 123 23 Construction 146 105 - - - 105 41 09 32
1995National Health Expenditures 9885 5321 4932 1826 3106 389 4564 3284 1280
Health Services and Supplies 9578 5212 4932 1826 3106 280 4387 3144 1222 Personal Health Care 8788 4867 4593 1826 2768 273 3921 3036 885
Hospital Care 3501 1358 1245 114 1131 113 2143 1753 390Physician Services 2016 1376 1339 369 970 37 640 509 131 Dental Services 458 440 438 218 220 02 18 10 08 Other Professional Services 526 399 360 202 158 39 127 96 31 Home Health Care 286 128 93 60 33 34 158 138 20 Drugs and Other Medical NonmiddotOurables 834 720 720 498 221 - 114 59 56 Vision Products and Other Medical Ourables Nursing Home Care
138 n9
87 326
87 311
78 286
09 -25 15
51 453
50 293
01 160
Other Personal Health Care 250 33 - - - 33 217 128 89Program Administra11on and Net
Cost of Private Health Insurance 477 345 339 - 339 06 132 71 61Government Public Health Activities 314 - - - - - 314 38 276
Research and Construction 307 109 - - - 109 197 140 57166 14 - - - 14 152 129 23
Construction 140 96 - - - 96 45 11 34
I ~ 1
~
Iill
~ -8 ~ ~ bull I -z bull bull
NOTES Research and deVelopment expenlilures of drug companies and other manufacturers and providers of medical equipment and supplies are excluded from research expeoditures but areIncluded in the expendihJre class in which the product falls Numbers may not add to totals because of rounding SOURCE Health Care Financing Administration Offioe of the Actuary Data from the Oflioe of National Health Statistics
Table 11 Personal Health Care Expenditures Aggregate anrcr Capha Amounts and Percent Distribution
by Source of Funds Select Calendar Years 1960-95 ~ ~ l
~ l5 ~ ~ ~
f bull z
bull
ThirdmiddotParty Payments
Government
Out-of- Private other State Podltet Health Private and
YeN Total Payments Total Insurance Funds Total Federal Local Medlcare1 Medlcald2
Amount in Billions 1960 $236 $131 $106 $50 $04 $51 $21 $30 1970 638 249 389 148 16 225 147 78 $73 $51 1980 2170 603 1568 620 78 870 634 236 384 248 1985 3764 1006 2758 1138 141 1480 1113 367 703 392 1990 6147 1484 4663 2018 215 2430 1781 649 1096 717 1991 6766 1550 5216 2216 234 2766 2058 708 1202 901 1992 7405 1658 5748 2432 244 3071 2335 736 1354 1021 1993 7869 1716 6153 2554 261 3339 2559 780 1478 1146 1994 8279 1760 6519 2645 262 3612 2781 831 1644 1234 1995 8788 1826 6962 2768 273 3921 3036 885 1840 1331
Per Capita Amount 1960 $124 $59 1970 297 116
$56 181
$26 $2 $27 8 108
$11 $16 36 r1 ()
1980 923 256 1985 1523 407
667 1116
264 460
33 370 87 599
270 460
100 148
rgtr1
I~ ()
1990 2364 571 1794 776 83 936 685 249 () I~ 1991 2577 590 1986 644 89 1053 794 270 rgt () 1992 2792 625 2167 917 92 1158 890 278 rgt () 1993 2938 941 2297 953 97 1247 955 291 rgt I~ 1994 3061 9511995 3219 2411
2560 978
1014 97 1336
100 1436 1029 1112
307 324
rgt ()
() I~
Percent Distribution 1960 1000 553 447 212 18 217 90 126 1970 1000 390 610 232 26 353 230 122 114 79 1980 1000 278 722 286 36 401 292 109 168 114 1985 1000 267 733 302 37 393 296 97 187 104 1990 1000 241 759 328 35 395 290 106 178 117 1991 1000 229 771 328 35 409 304 105 178 133 1992 1OClO 224 776 328 33 415 315 99 183 138 1993 1000 218 782 325 33 424 328 99 188 146 1994 1000 213 787 319 32 436 336 100 199 149 1995 1000 208 792 315 31 446 345 101 209 151
1Subset of Federal funds 2Subset of Fedeal ard State and local fUnds 3Cafclllation of per capita estimates Is Inappropriate NOTES Per capita amounts based on _ry 1 Social Security area population estimates for each year 1960-95 Numbers and percents may not add to totals because of rounding
~ SOURCE Health Care F-ancing Administration Office of the Actuary Data from the Office of National Health Statistics
~ Table 12 Hospital Care Expenditures Aggregate and per Capita Amounts and Percent Distribution
by Source of Funds Selected Calendar Years 1960-95
Out-ofshyPoclltet
Third-Party Payments
Government
Private OthB Hh Private
State YaM Total Payments Total Insurance Funds Total Federal Local Medicarel MedicaidZ
Amount In Billions 1960 $93 $19 $74 $33 $01 $39 $16 $23 1970 280 25 255 91 09 155 102 53 $54 $27 1980 1027 53 974 364 50 559 422 138 264 106 1985 1683 88 1595 587 83 925 725 200 491 158 1990 2564 103 2462 940 107 1415 1066 349 697 297 1991 2823 112 2711 1004 115 1592 1238 353 762 382 1992 3054 117 2936 1057 118 1761 1415 347 864 429 1993 3233 119 3114 1105 122 1886 1520 366 926 476 1994 3350 113 3237 1115 113 2008 1629 379 1019 499 1995 3501 114 3387 1131 113 2143 1753 390 1126 520
Per Capita Amount 1960 $49 $10 $39 $17 $1 $21 $9 $12 1970 130 12 119 42 4 72 47 25 (~ PI 1990 437 23 1985 681 36 1990 996 40 1991 1075 43 1992 1151 44
414 645 947
1032 1107
155 238 362 382 399
21 238 33 374 41 544 44 606 44 584
179 293 410 472 533
59 81
134 135 131
(I(I (~PI (~
PI (~ PI (IPI
1993 1207 44 1994 1239 42 1995 1283 42
1163 1197 1241
413 412 414
46 704 42 743 42 7S5
568 603 642
137 140 143
(~(I (~
PI (~
PI Percent Distribution
1960 1000 207 793 356 12 425 173 252 1970 1000 90 910 324 32 554 364 190 192 95 1980 1000 52 948 355 49 544 410 134 258 104 1985 1000 52 948 349 49 549 431 119 292 94 1990 1000 40 960 366 42 552 416 136 272 116 1991 1000 40 960 356 41 564 439 125 270 135 1992 1000 3S 962 346 39 577 453 114 283 141 1993 1000 37 963 342 38 584 470 113 286 147 1994 1000 34 966 333 34 600 486 113 304 149 1995 1000 33 967 323 32 612 501 111 322 146
bullSubset of Federal funds 2Subset of Federal and State and local funds ltCalculation of per eapita eamptimates is inappropriate
~ ~ el
~ ~ ~ ~ ~ ~
ltgt ~ ~ bull ~ zbull t
NOTES Per capita amounts based on July 1 Social Security area population estimates breach year 1960-95 Numbers and percents may not add to tlaquoals because of rounding
SOURCE Health Care Financing Administration OffiCe of the Actuary Data from the Office of National Health Statistics
Table 13 Physlelan Service Expenditures A~gregate and per Capita Amounts and Percent Distribution
by Source of unds Selected Calendar Years 1960S5 ~ ~ l
~ ~ ~ ~ I ~
~ ~ bulli ~ ~ ~
Ye ToteJ
Out-ofshyPodlte1
Payments
Third-Party Payments
Medicarebull Medicaid2 Tot~
Government
Private Olh0ltHealth
Insurance Funds ToteJ Federal
State ~d
Local
1960 1970 1880 1985 1990 1991 1992 1993 1994 1995
1980 1970 1880 1985 1990 1991 1992 1993 1994 1995
1980 1970 1980 1985 1990 1991 1992 1993 1994 1995
$53 136 452 836
1463 1592 1757 1827 1906 2016
$28 63
192 338 563 606 663 662 705 739
1000 1000 1000 1000 1000 1000 1000 1000 1000 1000
$33 57
146 244 354 357 382 375 373 369
$17 27 62 99
136 136 144 140 138 135
627 422 324 291 242 224 218 206 196 183
$20 78
306 593
1109 1235 1375 1451 1533 1648
$10 37
130 240 427 470 518 542 567 504
373 578 676 709 758 n6 782 794 804 817
$16 48
171 334 633 716 821 885 911 970
22 73
135 243 273 309 323 337 355
302 352 379 399 432 450 467 473 478 481
Amount in Billions $00 $04
00 31 04 131 14 245 27 450 28 491 28 526 31 556 31 591 37 840
Pet Capita Amount $0 $2
0 14 2 566
10 173 11 187 11 198 12 207 12 219 14 234
Percent Distribution 01 71 01 225 08 289 16 293 18 307 17 309 16 299 17 304 16 310 19 317
$01 22
100 196 359 385 408 435 467 509
$0 10 43 79
138 147 154 163 173 187
14 163 221 234 245 242 232 238 245 253
$03 08 31 49 91
106 118 120 125 131
$2 4
13 20 35 40 45 45 46 48
57 62 68 59 62 66 67 66 65 65
$17 80
165 295 307 316 334 362 400
(~ (~ () (~ (~ (~ (~ () (~
122 176 197 202 193 180 183 190 198
$06 25 35 71 92
112 126 134 143
(~ (~ (~ () () (~ () (~ I~
48 56 42 48 58 63 69 70 71
Subset of Federal funds 2Subset of Federal and State and local funds 3Calculation of per capita estimates is inappropriate
_
NOTES The figure 00 denotes less than $ampl m~lion tor aggregate amounts and 0 derotes less than $050 lor per capita amounts Per capita alnOJnt$ based on July 1 Social Security area population estimates for eaoh year 1960-95 Numbas and percents may not add to totals because of rounding
~ SOURCE Health Care Financing Administration Office of the Actua~y Data from the Office of National HeaHh Statistics
~
iil Table 14 Nursing Home Care Expenditures Aggregate and per Capita Amounts and Percent Distribution
by Souree of Funds Selected CalendarYeare1960-95
Tot~ - Out-of-Pooket
Payments T~
Private Health
Insurance
Third-Party Payments
Government
Medicare1 Medicaid2
Other Private Funds Tot~ Federal
Stateand
Local
1960 1970 t980 t985 1990 t99t 1992 1993 1994 1995
1960 1970 t980 t990 1992 1993 1994 1960 1970 1980 1990 1992 t993 1994 1995
$08 42
176 307 509 572 623 670 724 779
$4 20 75
124 196 218 235 250 268 285
1000 1000 1000 1000 1000 1000 1000 1000 1000 1000
$07 23 74
136 222 234 244 251 269 286
$3 11 3t 55 86 92 94
105
779 535 418 444 436 409 391 374 371 367
$02 20
103 171 287 338 379 420 455 493
$1 9
44 69
110 129 143 157 168 181
221 465 582 556 564 591 609 626 629 633
$00 00 02 08 19 21 2t 22 24 25
$0 0 t 3 7 8 8 8 9 g
00 04 12 27 37 36 34 33 33 33
Amount in Billions $01 $01
02 17 05 95 06 157 09 259 t 1 307 12 347 12 385 14 418 t5 453
Per Capita Amount $0 t 8 2 41 2 63 4 tOO 4 117 4 131 5 144 5 155 5 166
Percent Distribution 63 157 49 412 30 540 18 511 19 508 18 536 19 557 t9 575 19 577 19 581
$01 tO 56 92
157 184 215 247 269 293
$0 5
24 37 60 70 8t 92 99
107
79 248 318 298 308 322 345 368 371 376
$01 07 39 65
102 123 132 139 149 160
$0 3
t7 26 39 47 50 52 55 59
78 164 222 212 200 215 212 207 206 205
$01 03 04 t7 20 32 46 59 73
() p) () () p) p) () p) ()
34 t7 14 33 34 St 68 82 94
$09 88
145 231 275 302 324 342 362
() () () () () (~ () (~ p)
223 500 472 454 481 485 484 472 465
bullSubset of Fede~al fund~2Subset of Federal and State and local fund~
~Calculation of per capita estimates is inappropriate
~ ~ ~
~ ~ sect ~ ~
~
~ bull
bull ~
NOTES The figure 00 denotes less than $50 million for aggegate amounts and 0 denotes less than $050 for per capita amouRs Per capita amounts based on lJ~ 1 Social SectJrity aree population estimates breach year 1960-95 Numbers and percents may not add to totals because of rounding
SOURCE Health Care Financing Administration OffiCe of the Actuary Data from the Office of National HeaHh Statistics
bull
I sect
0 ~ sect5
I ~
~ f bullz
1-
Table 15 Other Personal Health Care Expenditurest Aggregate and per Capita Amounts and Percent Distribution
by Source of Funds Selected Calendar Years 1960-95
Yea- Total
OUt-of-
Payments
Third-PEny Payments
Medicare2 Medicaldl Total
Private 01her Heolth
Insurance Fnds Totol
Government
Federal
State and
looaJ
1960 1970 1990 1985 1990 1991 1992 1993 1994 1995
1960 1970 1990 1985 1990 1991 1992 1993 1994 1995
1960 1970 1980 1985 1990 1991 1992 1993 1994 1995
$82 180 515 939
1610 1780 1972 2139 2299 2492
$43 84
219 380 619 678 743 798 850 913
1000 1000 1000 1000 1000 1000 1000 1000 1000 1000
$72 144 329 538 804 848 915 971
1004 1057
$38 67
140 218 309 323 345 363 371 387
874 799 639 573 500 476 464 454 437 424
$10 36
186 401 805 932
1057 1168 1294 1435
$5 17 79
162 310 355 398 436 479 526
126 201 361 427 500 524 536 546 563 576
$01 09 82
208 427 476 533 562 595 641
$1 4
35 84
164 181 201 210 220 235
15 50
160 222 265 267 270 263 259 257
Amount in Billions $02 $07
05 22 19 85 39 154 72 306 80 376 86 437 95 512
104 595 108 685
Per Capita AmOUlt $1 $4 2 10
36 bull 16 28 118 30 143 33 165 35 191 38 220 40 251
Percent Distribution 30 81 28 123 36 165 41 164 45 190 45 211 44 222 44 239 45 259 43 275
$04 12 56
101 200 250 298 356 417 460
$2 6
24 41 7T 95
112 133 154 176
48 69
110 108 124 140 151 167 181 193
$03 10 28 53
107 126 139 155 178 205
$14
12 21 41 48 52 58 66 75
34 53 55 56 66 71 71 73 78 82
$01 17 42 87
114 142 172 204 240
(~ (~ (~ (~ (~ (~ (~ (~ (~
07 32 45 54 64 72 81 89 96
$08 28 53
118 152178 219 259 306
() ()() () () () () () ()
45 55 57 73 86 90
103 112 123
Personal health care expenditures other than tiYIse for hospital care physician serviees and rursing home eare 2Sub$et of Federal fuols ~Subset of Federal and State anclloeal funds ~leulation of per capita estimates is inappropriate
shy
NOTES Per capilli amounts tsed on llly 1 Social Security area population estirnatlS for each year 1960-95 Numbers and pereents may rKit add to totals because of 100nding
~ SOURCE Haallh Care flnencing Adminislllltion Office of the Ntuaty Data from the Oflic of Natlcnal Health Statistics
0
~ - Table 16
Personal Health Care Expenditures by Type of Expenditure and Source of Funds Selected Calendar Years 1991-95
Other Vision Products Olh~ Prates- Home Drugs and and other Nursing Personal
Hospital Physician DemeJ sional Health Other Medical Medical Home Health Source of Funds Total c Services Services Services c Non-Durables Durables c Ce
1991 Amount in Billions Personal Health Care Expenditures $6766 $2823 $1592 $333 $383 $161 $656 $112 $572 $136 Out-of-Pocket Pcyenments 1550 112 357 162 146 43 427 69 234 Third-Party Payments 5216 2711 1235 17J 237 117 229 43 338 136
Private Health Insurance 2216 1004 716 159 130 25 152 09 21 Other Private 234 115 28 01 29 25 - - 11 24 Government 2766 1592 491 11 77 67 76 34 307 111
Federal 2058 1238 365 06 52 55 37 32 184 67 Medicare 1202 762 307 - 41 42 - 30 20 Medicaid 545 254 53 05 03 13 35 - 153 29 01hOlt 310 222 25 01 08 - 01 02 12 39
State and local 708 353 106 05 25 12 39 01 123 44 Medcaid 355 128 38 04 03 12 27 - 122 22 Other 352 226 67 01 22 00 13 01 00 22
1992 Personal Health Care Expenditures 7405 3054 1757 370 421 196 712 119 623 154 Out-of-Pocket Patments 1656 117 362 162 160 50 450 73 244 Third-Party Payments 5746 2936 1375 166 261 146 262 46 379 154
Private Health Insurance 2432 1057 621 173 142 29 160 09 21 Other Private 244 116 28 01 30 29 - 12 26 Government 3071 1761 526 13 89 88 82 37 347 127
FedOltal 2335 1415 406 08 62 74 41 36 215 78 Medicare 1354 664 316 - 50 59 - 34 32 Medicaid 657 316 66 06 04 15 39 - 171 37 01helt 324 232 25 01 09 - 02 02 13 41
State and Local 736 347 118 06 27 14 41 01 132 50 Medicaid 364 111 45 05 03 13 28 - 131 27 01helt 371 235 73 01 24 00 13 01 01 23
1993 Personal Health Gare Expenditures 7869 3233 1827 392 463 230 750 125 670 179 Out-of-Pocket Payments 1716 119 375 191 162 56 468 75 251 Third-Party Payments 6153 3114 1451 202 261 174 282 50 420 179
Private Health Insurance 2554 1105 865 183 148 31 191 09 22 Other Priva1e 261 122 31 02 33 32 - - 12 28 Government 3339 1886 556 17 100 111 92 41 385 150
Fedltgtltal 2559 1520 435 10 72 95 47 40 247 92 Medicare 1478 926 334 - 57 78 - 37 46 Medicaid 740 350 76 09 06 18 45 - 187 50 01helt 341 244 26 01 09 - 02 03 14 42
State and local 760 366 120 08 28 15 44 01 139 59 Medicaid 406 126 50 07 04 15 32 - 138 35 Olhelt 374 240 70 01 24 01 13 01 01 24
See notlaquo at end of table
~~
~Qz
sect
~-fi~~
~
~ ~
Table 16-Continued Personal Health Care Expenditures by Type of Expenditure and Source of Funds Selected Calendar Years 1991-95
Vtsion Products Oth~
Hospital Physician Profes-
DemaJ sional Home Health
Drugs and and Other Other Medical Meltfioal
Nursing Home Health
Source of Funds To~ Calte Services Services Services Care Non-Durables Durables Calte Calte
1994 Amount In Billions Personal Health care Expenditures $8279 $3350 $1906 $421 $491 $263 $777 $129 $724 $217
Out-of-Pocket Payments 1760 113 373 199 191 60 478 76 269 Third-Party Payments 6619 3237 1533 222 301 203 299 53 455 217
Private Health Insurance 2645 1115 911 202 152 33 198 09 24 Other Private 262 113 31 02 37 34 - - 14 31 Government 3612 2008 591 18 111 135 101 44 418 187
Federal Medicare 2781 1644
1629 1019
467 362
10 82 - 67
117 98
52 42 - 39
269 59
113
Medicaid 78~ 3~2 80 09 06 19 49 - 194 64 Othelt 354 248 25 01 09 - 02 03 15 49
State and Local 831 379 125 08 29 17 49 01 149 73 Medicaid 451 137 55 07 05 16 36 - 148 47 01helt 380 242 70 01 24 01 13 01 01 26
1095 Personal Health Care Expenditues 8788 3501 2016 458 526 286 834 138 4ne 250
Out-offockampt Payments 1826 114 369 218 202 60 498 78 286 Third-Party Payments 6962 3387 1648 240 324 226 336 60 493 250
Private Health Insurance 2768 1131 970 220 158 33 221 09 25 Other Private 273 113 37 02 39 34 - - 15 33 Government 3921 2143 640 18 127 158 114 51 453 217
Federal 3036 1753 509 10 96 138 59 50 293 128 Medicare 1840 1126 400 - 78 116 - 46 73 Medicaid 831 372 84 09 08 22 56 - 203 78 01helt 365 255 26 01 10 - 03 03 16 50
State and Local 885 390 131 08 31 20 56 01 160 89 Medicaid 500 148 59 07 06 19 42 - 159 60 01helt 386 242 71 01 25 01 14 01 01 29
~
~ Q il sectElO- ~ ~bull~ f
NOTES The figure 00 denotes amounts tess than $50 million Medicaid ecpenditures exclude Part B premium payments to Medicare by States under buyJn agreements to cover premiums br eligible Medicloid recipients Numbers may not add to totals because of rounding
SOURCE Heallh Care Financing Administration Office of the Actuary Data from the Office of National Health Statistics
N--
~
Table 17Expenditures for Health Services and Supplies Under Public Programs by Type of Expenditure and Program Calendar Year 1995
Personal Health Care
VISion Olh0lt Drugs and Pltoduots
Professhy H~e Olhelt and Other Nursing Public All Hospital Physician Dental sional Health Medcal Medical Home Admlntsshy Heelh
Program Area Expenditures Total c~e Services Services Services Care Non-Durables Durables c~e OlhOlt tration Activities
Pub6c and Private Spending $9578 $8788 All Public Programs 4367 3921
Federal Funds 3144 3036 State and Local Funds 1222 885
Medicare 1870 1840 Medicaid 1410 1331
Fedeltel 868 831 State and Local 542 500
Other State and Local Public Assistance Programs 54 54
Department of Veterans Affairs 156 155 Department of Oefensez 135 133 Workers Compensation 198 181
Federal 06 06 State and local 192 175
State and local Hospitals3 123 123 Other Public Programs for
Personal Health Care4 106 104 Fedeuol 72 71 State and local 34 33
Government Public Heahh Activities 314 -Fedeuol 38 -State and local 276 -
Medicare and Medicaid 3280 3171
Exelude5 funds paid into the Medicare trust funds by States 21ncludes care br retirees and military dependents 3 Expenditures not offset by IGVlaquoWJSS
4lncludes program spending for maternal and child heahh votats Indian health services alooholism drug abuse and ment
$3501 $2016 2143 640 1753 509 390 131
1126 400 520 143 372 84 148 59
31 04 129 01 105 16 66 67 03 01 65
123
21 09 17 07 03 02 - -- -- -
1646 543
under buy-In agreemen
cational rehablitalion mal haatth and school health
Amount in Billions $458 $526 $286 $834
18 127 158 114 10 96 138 59 08 31 20 56
- 78 116 -16 14 41 98 09 08 22 56 07 06 19 42
01 03 01 10 00 - - 00 00 - - 02 - 21 - 04
~ - 01 00 - 20 - 04
01 10 - 00 01 09 - 00 00 02 - 00 - - - -- - - -- - - -
16 92 157 98
ts to cover premiums for Medicakl recipients
edical payments temporary disability insurance medic
$138 51 50 01
46 ---
00 03 -
01 00 01
01 01 00 ---
46
al payments P
$779 453 293 160
73 362 203 159
01 16 ----
--
---
435
ublic Health
$250 217 128 89
-138 78 60
04 06 09 ---
61 36 25 ---
138
Service a
$477 132
71 61
30 79 36 42
01 02 17 00 17
03 01 02 ---
109
nd other Fe
$314 314 38
276
314 38
276
deral ho$pimiddot
~ ~ ~
~ ~ ~ ~ ] ~ ~ bulli
-middotf
N
S
shy
OTES The fiJIre 00 denotes amounts less than $50 million Numbers may not add to total because oiiQUnding shyOURCE Health Care Financing Adminlslfation OffiCe of the Actuary Data from the OffiCe of National Heahh Statistics
REFERENCES
Alecxih LMB and Lutzky S How Do Alternative Eligibility Triggers Affect Access to Private LongshyTerm Care Insurance Public Policy Institute issue paper 9605 Washington DC American Association of Retired Persons August 1996 American Hospital Association National Hospital Panel Survey Unpublished Chicago 1995 American Medical Association Socioeconomic Characteristics of Medical Practice 1996 Chicago April1996 Anders G Pricey Operation A Plan to Cut Back on Medicare Expenses Goes Awry Costs Soar The Wall Street ]ournalAl October 3 1996 Baker C and Kramer N Employer-Sponsored Prescription Drug Benefits Employer Benefits Survey A BLS Reader US Department of Labor Bureau of Labor Statistics Bulletin 2459 Washington DC US Goverrunent Printing Office February 1995 Board of Trustees Federal Hospital Insurance Trust Fund The 1996 Annual Report ofthe Board of Trustees of the Federal Hospital Insurance Trust Fund Washington DC US Government Printing Office 1996 Day K Health Insurers Push the Envelope Costmiddot Cutting Drive Leads to a Boom in Mail-Order Prescriptions-and Worries for Drugstore Chains The Wall StreetjournalDl October 171996
Dial TH Pan L Bergsten C et al HMO amp PPO Industry Profile 1995middot96 Edition Washington DC American Association of Health Plans May 1996
Duke KS Hospitals in a Changing Health Care System Health Affairs 15(2)41 Summer 1996 DuNah R Jr Harrington C Bedney B et al Variations and Trends in State Nursing Facility Capacity 1978-93 Health Care Financing Review 17(1)183-199 Fall1995 Emmons DW and Simon CJ Managed Care Evolving Contractual Arrangements Socioeconomic Characteristics of Medical Practice 1996 Chicago American Medical Association April1996
Foster Higgins National Survey of EmployershySponsored Health Plans 1994 Report New York Foster Higgins Survey and Research Services 1994 Genuardi JS Stiller ]M and Trapnell G R Changing Prescription Drug Sector New Expenditure Methodologies Health Care Financing Review 17(3)191-204 Spring 1996
Goldberg J Doctors Earnings An Uphill Struggle Medical EcoMmics 73(17)250-261 Sept 9 1996 Health Care Financing Administration Medicaid Managed Care Enrollment Report Summary Statistics as ofJune 30 1995 Baltimore 1996
Health Insurance Association of America Source Book of Health Insurance Data 1996 Washington DC To be published Health Insurance Association of America Information from William Weller Senior Actuary Washington DC1996 Heffler SK Donham CS Won DK et al Health Care Indicators Hospital Employment and Price Indicators for the Health Care Industry Fourth Quarter 1995 and Annual Data for 1987middot95 Health Care Financing Review 17(4)217middot256 Sununer 1996
IMS America Data from the US Hospital Audit Plymouth Meeting PA 1996 Kletke PR Emmons DW and Gillis K D Current Trends in Physicians Practice Arrangement From Owners to Employees journal ofthe American Medical Association 276(7)555-560 August 21 1996 KPMG Peat Marwick Health Benefits in 1996 (Also yearly editions for 1991middot95) Newark NJ 1991-96 KPMG Peat Marwick Health Benefits in 1996 Newark NJ To be published
Langley M and Sharp A As Big Hospital Chains Take Over Nonprofits a Backlash is Growing The Wall StreetjournalA1 October 18 1996
Levi~ KR Lazenby HC Sivarajan L et a National Health Expenditures 1994 Health Care Financing Review 17(3)205-242 Spring 1966
lewinmiddotVHI Inc Subacute Care Policy Synthesis and Market Area Analysis Available on the Internet at httpaspeosdhhsgov daltcphomehtm Contract Number HHamp100-93-0012 Prepared for the Office of the Assistant Secretary for Planning and Evaluation US Department of Health and Human Services Washington DC 1995
Miller RS Jonas HS and Whitcomb ME The Initial Employment Status of Physicians Completing Training in 1994 journal of the American Medical Association 275(9)708-712 March 6 1996 Moser JW Trends and Patterns in Physician Income Socioeconomic Characteristics of Medical Practice 1996 Chicago American Medical Association April1996
HEALTIJ CARE FINANCING REVIEWFaJII996Vohlmei8Numberl 213
National Center for Health Statistics Health United States 1995 US Department of Health and Human Services Public Health Service Washington US Government Printing Office June 1996 Newhouse JP Reimbursing Health Plans and Health Providers Selection Versus Efficiency in Production journal of Economic Literature 34(3)1236-1263 September 1996 Rice T Stearns S DesHarnais S et al Do Physicians Cost Shift Health Affairs 15(3)215- 225 Fall1996 Rundle RL Tenet Healthcares Bid to Buy OrNda Signals It Means to Stay Independent The Wall Street ]ournalB3 October 18 1996 Schondelmeyer S and Seoane-Vazquez E Prescription Trends 1996 Survey American Druggist 213(6)25 June 1996
Seifer SD Troupin B Rubenfeld GD Changes in Marketplace Demand for Physicians journal of the American Medical Association 276(9)695-699 September 4 1996
Simon C J and Born PH Physician Earnings in a Changing Managed Care Environment Health Affairs 15(3)124-133 Fall1996
Social Security Administration Office of the Actuary Unpublished data used in the preparation of the 1996 Trustees Report Baltimore 1996 Tanouye E Managed Care Is Boosting Drug Sales The WaU Street ]ournalB10 October 17 1996 US Bureau of Labor Statistics Employee Benefits in Medium and Large Firms 1993 Bulletin 2456 US Deparbnent of Labor Washington US Government Printing Office November 1994 US Bureau of the Census Service Annual Survey 1994 US Deparbnent of Commerce Washington DC August 1996 Wooton S Physicians are Ordered to Limit Referrals Baltimore SunC3 August 3 1996
Zwanziger J and Melnick GA Can Managed Care Plans Control Health Care Costs Health Nfoirs 15(2)185-199 Summer 1996
Reprint Requests Anna Long Office of Nationa] Health Statistics Health Care Financing Administration 7500 Security Boulevard NJ02()2 Baltimore Maryland 21244-1850 ampmail alonglhcfagov
HEALm CARE FINANCING REVIEWFall 1996VolumetSNumberi 214