Embed Size (px)
DESCRIPTION
Database Server Extension for managing and querying 4D gridded spatiotemporal data. Presented at the Edinburgh e-Science Institute Nov 1-2, 2005 conference on “Spatiotemporal Databases” by Ian Barrodale Barrodale Computing Services Ltd. (BCS) http://www.barrodale.com. - PowerPoint PPT Presentation
Citation preview
Database Server Extension for
managing and querying 4D gridded
spatiotemporal data
Presented at the Edinburgh e-Science Institute Nov 1-2, 2005 conference on “Spatiotemporal Databases”
by
Ian BarrodaleBarrodale Computing Services Ltd. (BCS)
http://www.barrodale.com
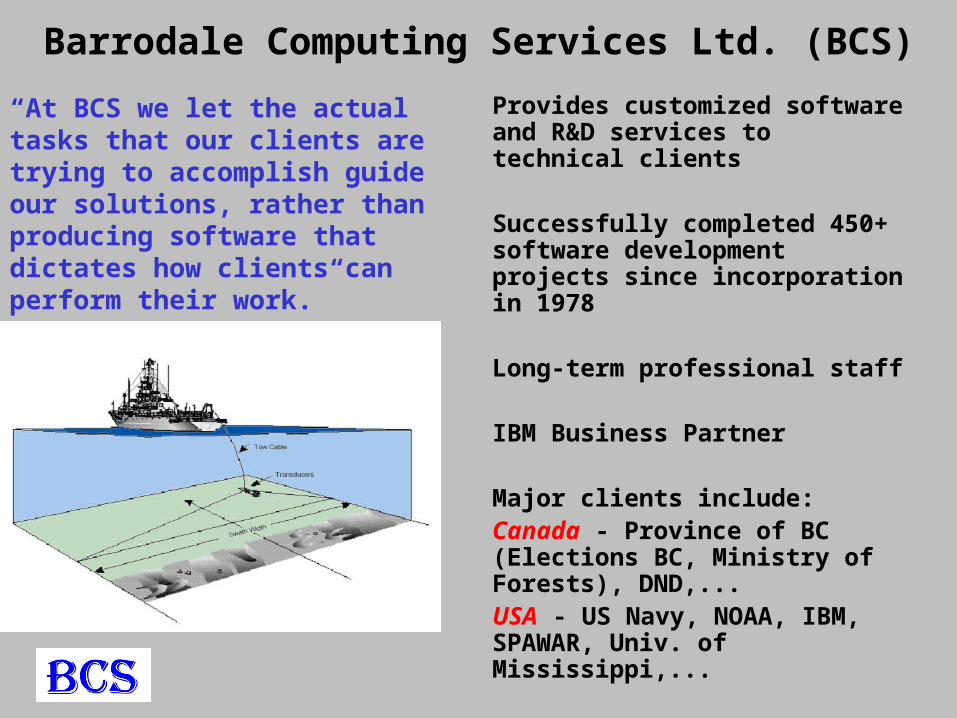
Barrodale Computing Services Ltd. (BCS)
“At BCS we let the actual tasks that our clients are trying to accomplish guide our solutions, rather than producing software that dictates how clients can perform their work.”
Provides customized software and R&D services to technical clients
Successfully completed 450+ software development projects since incorporation in 1978
Long-term professional staff
IBM Business Partner
Major clients include:Canada - Province of BC (Elections BC, Ministry of Forests), DND,...USA - US Navy, NOAA, IBM, SPAWAR, Univ. of Mississippi,...
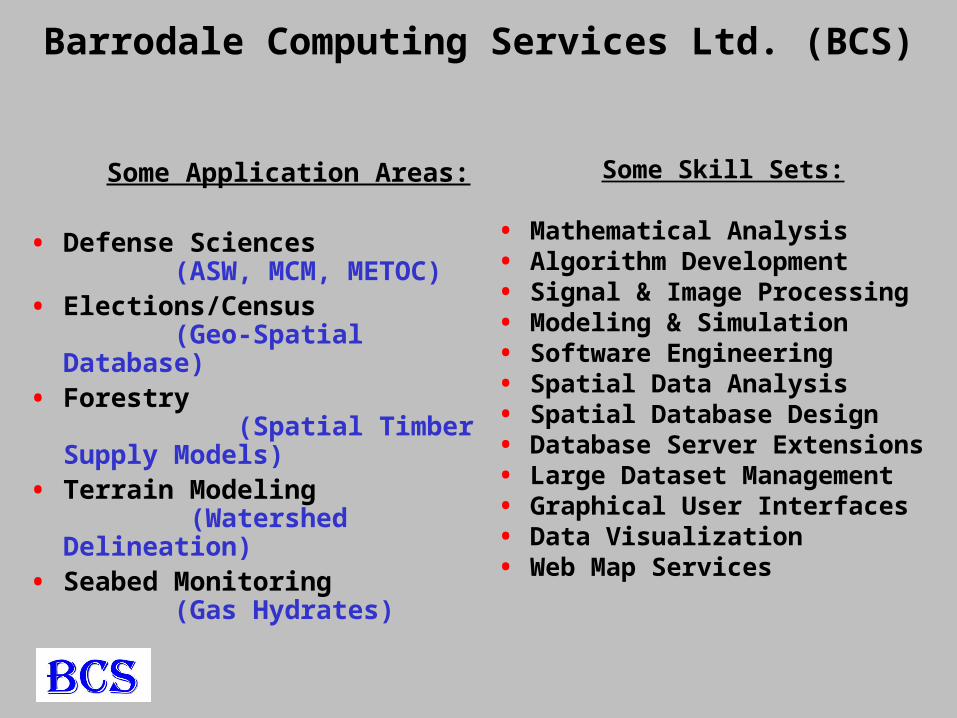
Barrodale Computing Services Ltd. (BCS)
Some Application Areas:
• Defense Sciences (ASW, MCM, METOC)
• Elections/Census (Geo-Spatial Database)
• Forestry (Spatial Timber Supply Models)
• Terrain Modeling (Watershed Delineation)
• Seabed Monitoring (Gas Hydrates)
Some Skill Sets:
• Mathematical Analysis• Algorithm Development• Signal & Image Processing• Modeling & Simulation• Software Engineering• Spatial Data Analysis• Spatial Database Design• Database Server Extensions• Large Dataset Management• Graphical User Interfaces• Data Visualization• Web Map Services
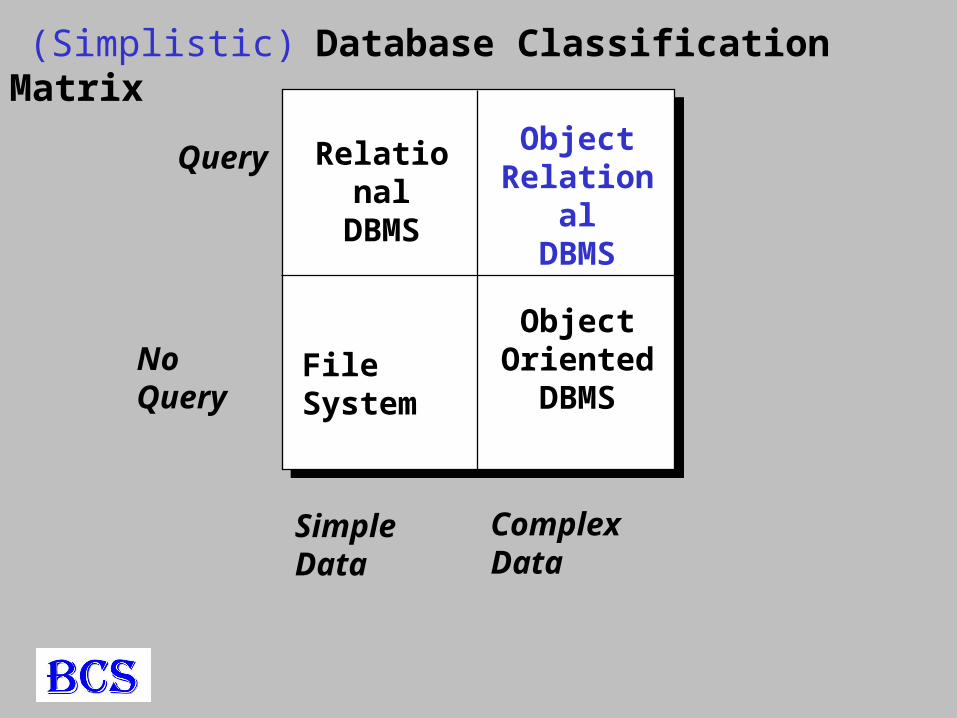
Complex DataSimple Data
Query
No Query File System
RelationalDBMS
ObjectOrientedDBMS
ObjectRelational
DBMS
(Simplistic) Database Classification Matrix
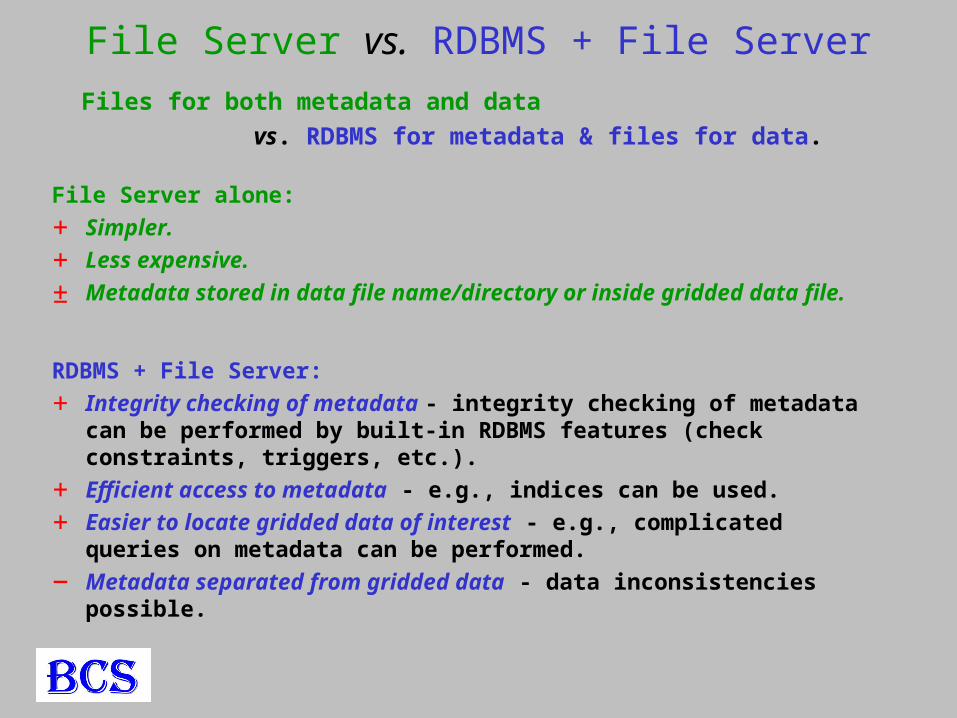
File Server vs. RDBMS + File Server
Files for both metadata and data
vs. RDBMS for metadata & files for data.
File Server alone:
+ Simpler.
+ Less expensive.
± Metadata stored in data file name/directory or inside gridded data file.
RDBMS + File Server:
+ Integrity checking of metadata - integrity checking of metadata can be performed by built-in RDBMS features (check constraints, triggers, etc.).
+ Efficient access to metadata - e.g., indices can be used.
+ Easier to locate gridded data of interest - e.g., complicated queries on metadata can be performed.
− Metadata separated from gridded data - data inconsistencies possible.
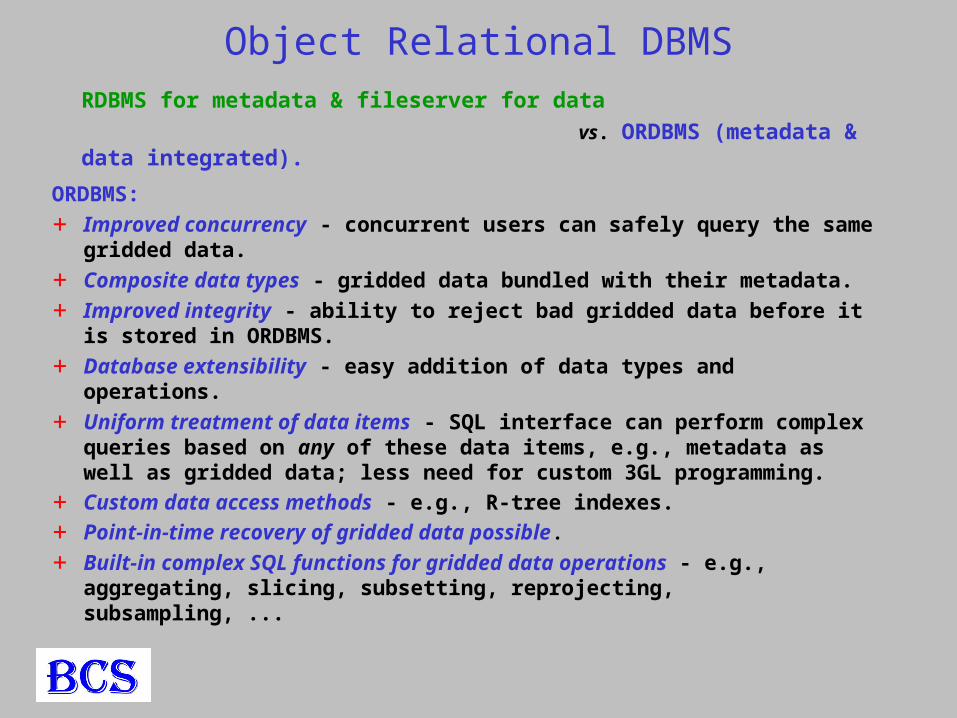
Object Relational DBMS
RDBMS for metadata & fileserver for data
vs. ORDBMS (metadata & data integrated).
ORDBMS:
+ Improved concurrency - concurrent users can safely query the same gridded data.
+ Composite data types - gridded data bundled with their metadata.
+ Improved integrity - ability to reject bad gridded data before it is stored in ORDBMS.
+ Database extensibility - easy addition of data types and operations.
+ Uniform treatment of data items - SQL interface can perform complex queries based on any of these data items, e.g., metadata as well as gridded data; less need for custom 3GL programming.
+ Custom data access methods - e.g., R-tree indexes.
+ Point-in-time recovery of gridded data possible.
+ Built-in complex SQL functions for gridded data operations - e.g., aggregating, slicing, subsetting, reprojecting, subsampling, ...
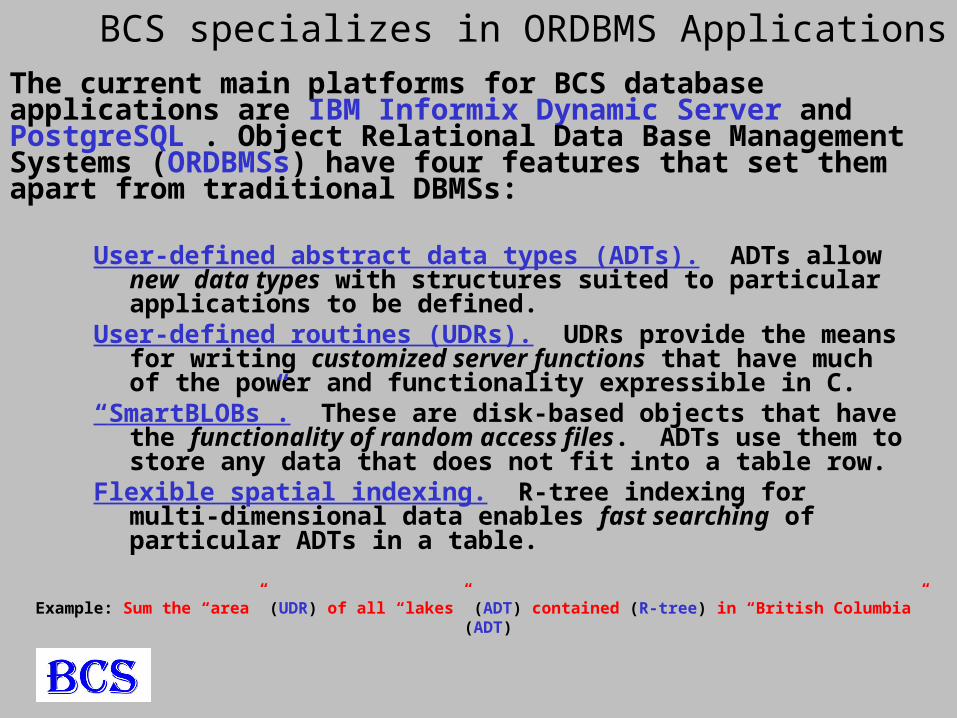
BCS specializes in ORDBMS ApplicationsThe current main platforms for BCS database applications are IBM Informix Dynamic Server and PostgreSQL . Object Relational Data Base Management Systems (ORDBMSs) have four features that set them apart from traditional DBMSs:
User-defined abstract data types (ADTs). ADTs allow new data types with structures suited to particular applications to be defined.
User-defined routines (UDRs). UDRs provide the means for writing customized server functions that have much of the power and functionality expressible in C.
“SmartBLOBs”. These are disk-based objects that have the functionality of random access files. ADTs use them to store any data that does not fit into a table row.
Flexible spatial indexing. R-tree indexing for multi-dimensional data enables fast searching of particular ADTs in a table.
Example: Sum the “area” (UDR) of all “lakes” (ADT) contained (R-tree) in “British Columbia” (ADT)
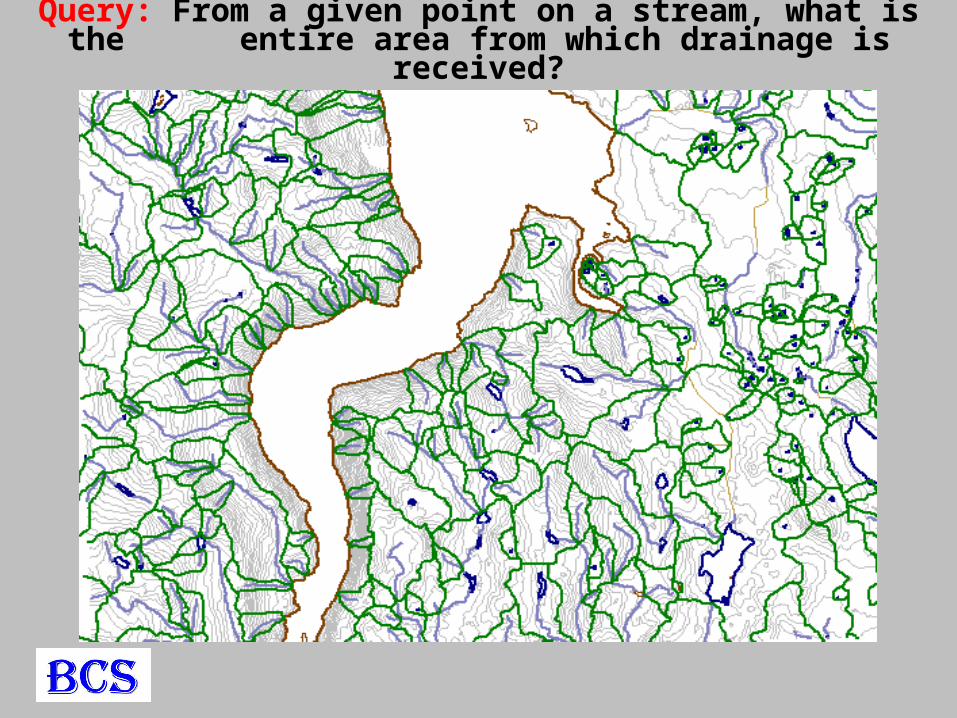
Query: From a given point on a stream, what is the entire area from which drainage is
received?
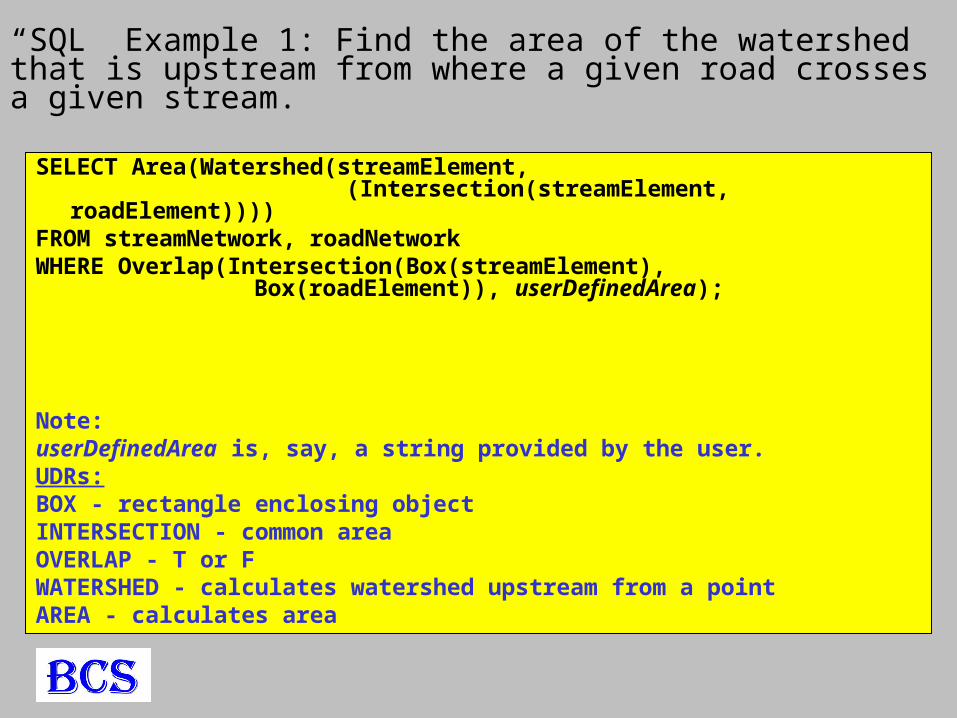
“SQL” Example 1: Find the area of the watershed that is upstream from where a given road crosses a given stream.
SELECT Area(Watershed(streamElement, (Intersection(streamElement, roadElement))))
FROM streamNetwork, roadNetworkWHERE Overlap(Intersection(Box(streamElement),
Box(roadElement)), userDefinedArea);
Note:userDefinedArea is, say, a string provided by the user.UDRs:BOX - rectangle enclosing objectINTERSECTION - common areaOVERLAP - T or FWATERSHED - calculates watershed upstream from a pointAREA - calculates area
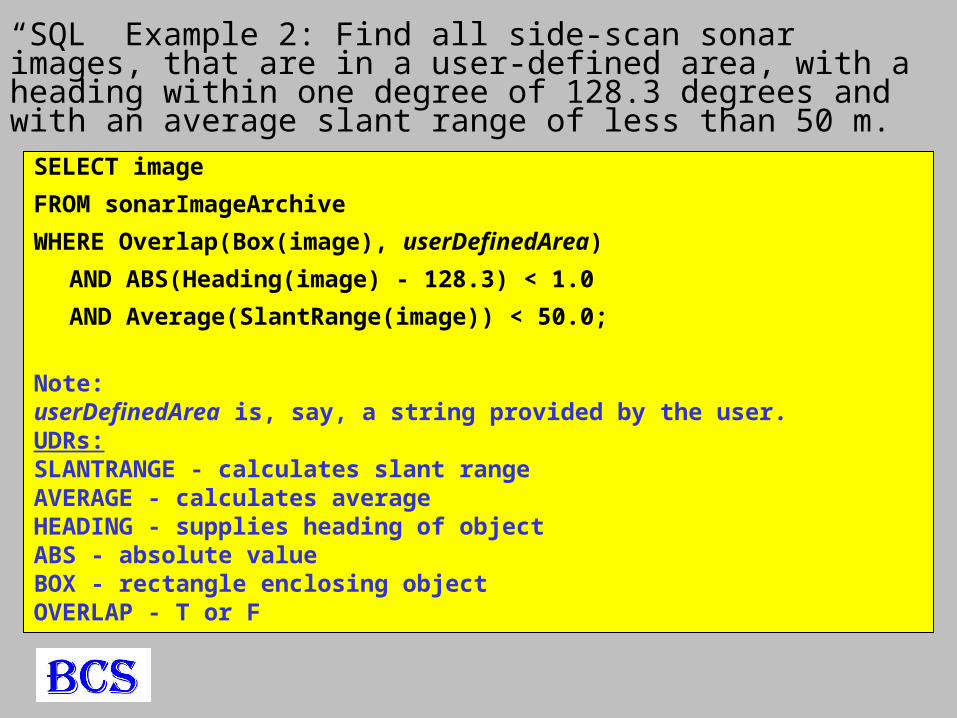
“SQL” Example 2: Find all side-scan sonar images, that are in a user-defined area, with a heading within one degree of 128.3 degrees and with an average slant range of less than 50 m.
SELECT image
FROM sonarImageArchive
WHERE Overlap(Box(image), userDefinedArea)
AND ABS(Heading(image) - 128.3) < 1.0
AND Average(SlantRange(image)) < 50.0;
Note:userDefinedArea is, say, a string provided by the user.UDRs:SLANTRANGE - calculates slant rangeAVERAGE - calculates averageHEADING - supplies heading of objectABS - absolute valueBOX - rectangle enclosing objectOVERLAP - T or F
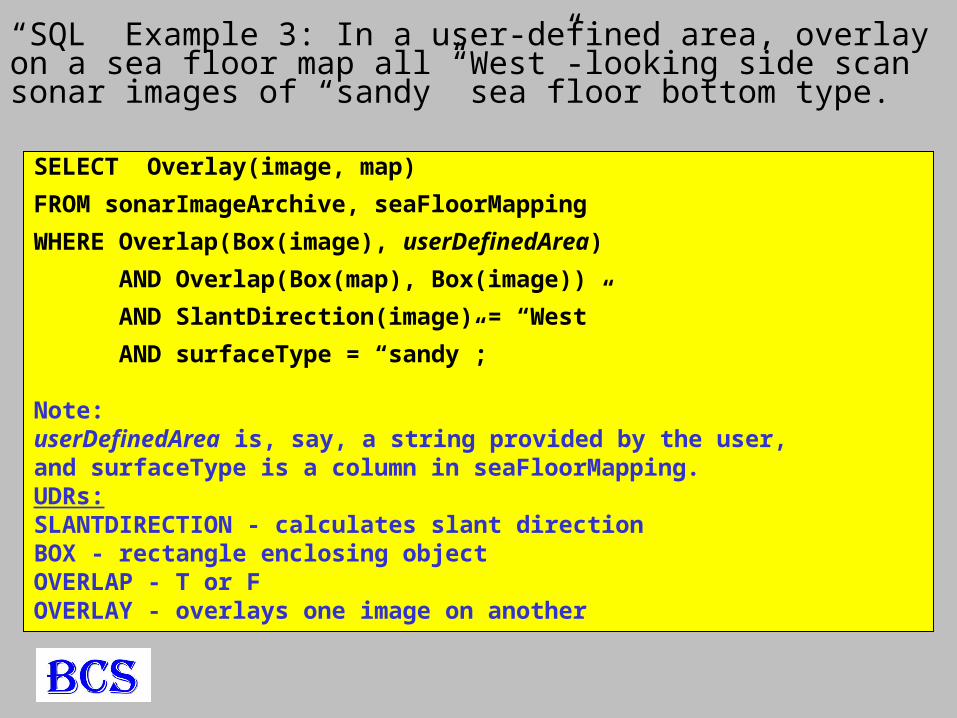
“SQL” Example 3: In a user-defined area, overlay on a sea floor map all “West”-looking side scan sonar images of “sandy” sea floor bottom type.
SELECT Overlay(image, map)
FROM sonarImageArchive, seaFloorMapping
WHERE Overlap(Box(image), userDefinedArea)
AND Overlap(Box(map), Box(image))
AND SlantDirection(image) = “West”
AND surfaceType = “sandy”;
Note:userDefinedArea is, say, a string provided by the user,and surfaceType is a column in seaFloorMapping.UDRs:SLANTDIRECTION - calculates slant directionBOX - rectangle enclosing objectOVERLAP - T or FOVERLAY - overlays one image on another
• Gridded data occurs in meteorology, oceanography, the life sciences, non-destructive testing, exploration for oil, natural gas, coal & diamonds,…
• These datasets range from simple, uniformly spaced grid points along a single dimension (e.g., time series) to multidimensional grids containing several types of values (e.g., 4D cubes of meteorological attributes).
• Grids have typically been stored in simple files and then manipulated by programs that operated on these files. Nowadays there is increasing justification for storing and manipulating gridded data in DBMSs: the principal advantages are their ability to (i) ensure data integrity and consistency, and (ii) provide diverse users with independent and effective query-based access to these data across multiple applications and systems.
Gridded Data in Databases
• However, implementing an efficient gridded DBMS can be very challenging, particularly when it involves Binary Large Objects (BLOBs), user-defined abstract datatypes (ADTs) that encapsulate grid data structures and attributes, and user-defined routines (UDRs) with which applications can create, manipulate and access the gridded data stored in these new datatypes.
• BCS has developed an efficient technology that supports database storage, update, and fast retrieval of gridded data; it uses BLOBs, ADTs, and UDRs.
• Our first implementation of this technology was a Grid DataBlade for IBM Informix, and then a Grid Extension for PostgreSQL; we are currently developing an analogous Grid Cartridge for use with Oracle.
Gridded Data in Databases
• is designed to handle 1D, 2D, 3D, 4D (and “5D”) grids.
• stores grids using SmartBLOBS and a (user-controlled) tiling scheme that together permit very efficient generation of products (e.g., oblique slices or 1D sticks from 4D grids).
• sometimes provides more than 50-fold increases in speed of data product generation compared to the conventional approach that does not involve tiling or SmartBLOBs.
• can store the data in, and convert it between, hundreds of mapping projections.
• can handle irregularly spaced grids in any/all grid dimensions.
• can handle the presence of multiple vector and/or scalar values.
• provides several interpolation options.
• provides for convenient database loading and extraction of grid files via one form of the commonly used NetCDF format.
• provides C, Java, and SQL application programming interfaces.
• is supplied with full user/programmer documentation.
The BCS Grid DataBlade/Extension
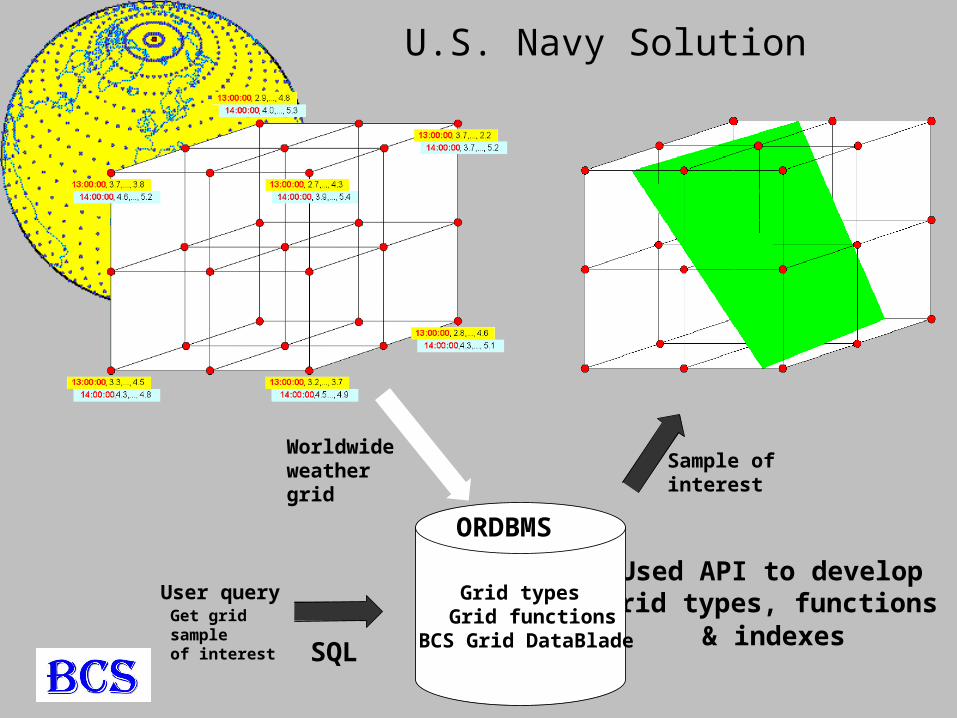
U.S. Navy Solution
Worldwide weather grid
Used API to developgrid types, functions
& indexes
Grid types Grid functions
BCS Grid DataBlade
ORDBMS
SQL
User queryGet grid sampleof interest
Sample of interest
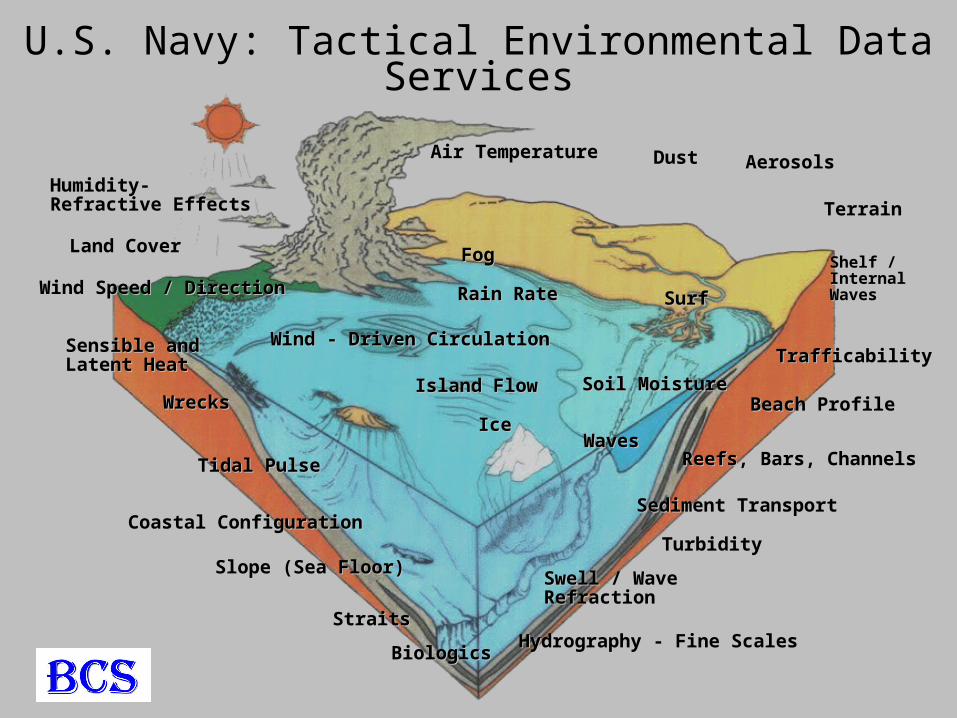
U.S. Navy: Tactical Environmental Data Services
Humidity-Humidity-Refractive EffectsRefractive Effects
Air TemperatureAir TemperatureAerosolsAerosolsDustDust
TrafficabilityTrafficability
FogFog
Soil MoistureSoil MoistureBeach ProfileBeach Profile
WavesWavesReefs, Bars, ChannelsReefs, Bars, Channels
Sediment TransportSediment Transport
Shelf /Shelf /InternalInternalWavesWaves
Swell / WaveSwell / WaveRefractionRefraction
Hydrography - Fine ScalesHydrography - Fine Scales
IceIce
BiologicsBiologics
Slope (Sea Floor)Slope (Sea Floor)
Coastal ConfigurationCoastal Configuration
Tidal PulseTidal Pulse
Sensible andSensible andLatent HeatLatent Heat
Wind Speed / DirectionWind Speed / Direction
Land CoverLand Cover
TerrainTerrain
SurfSurf
TurbidityTurbidity
Rain RateRain Rate
StraitsStraits
Island FlowIsland Flow
Wind - Driven CirculationWind - Driven Circulation
WrecksWrecks
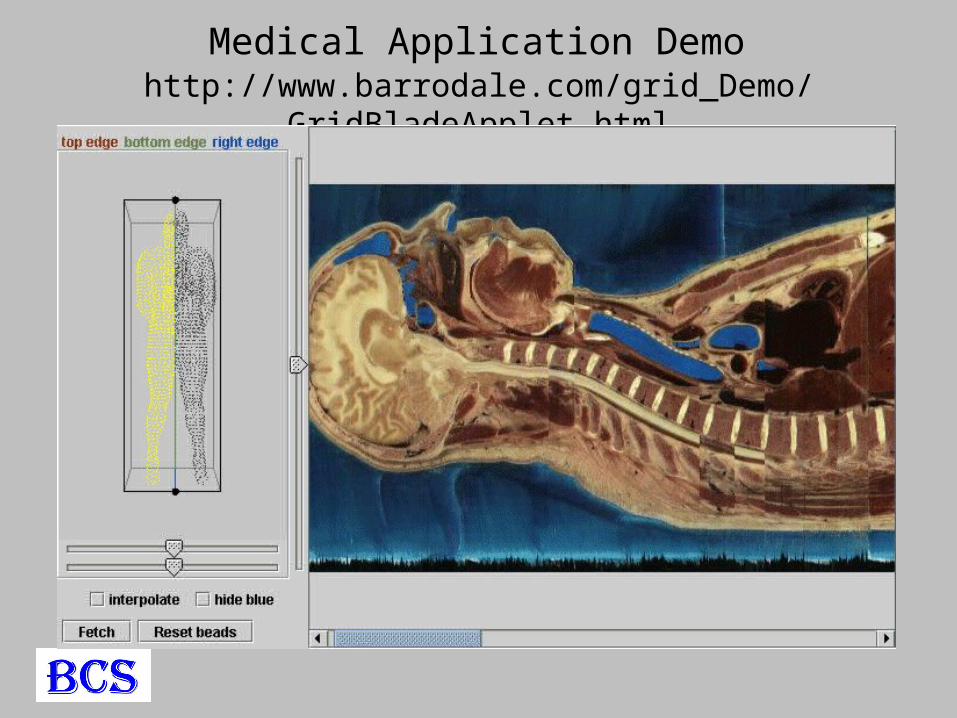
Medical Application Demohttp://www.barrodale.com/grid_Demo/GridBladeApplet.html
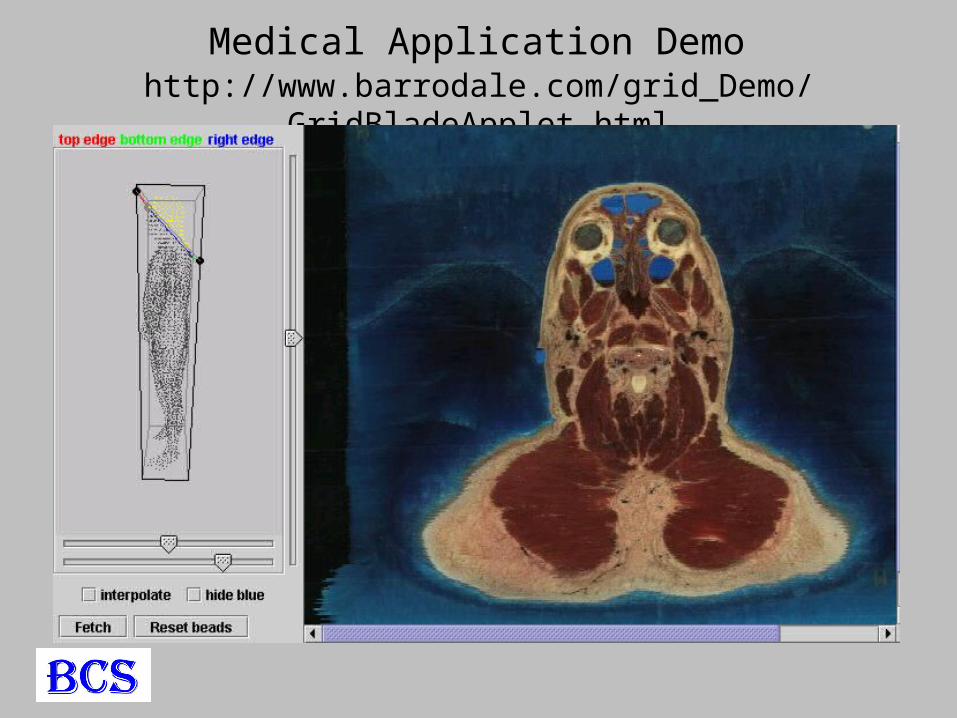
Medical Application Demohttp://www.barrodale.com/grid_Demo/GridBladeApplet.html
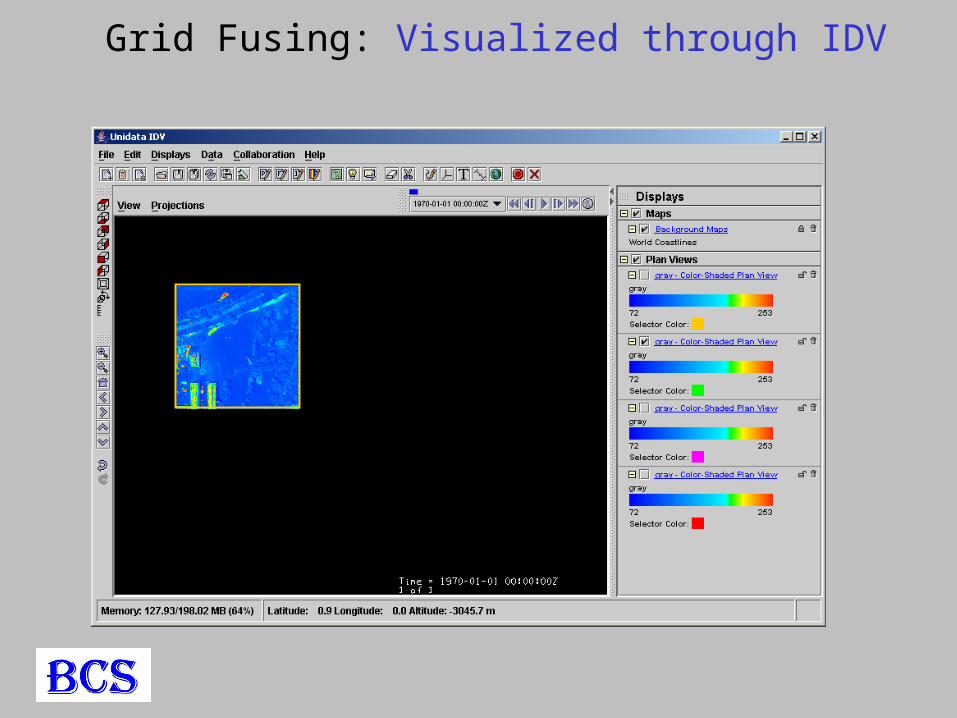
Grid Fusing: Visualized through IDV
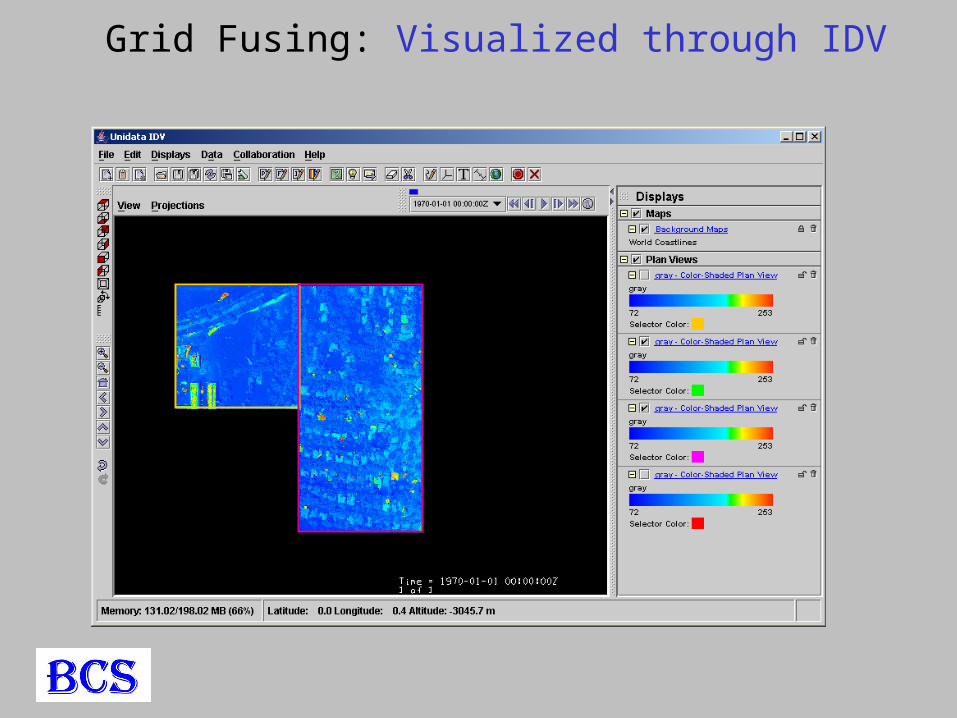
Grid Fusing: Visualized through IDV
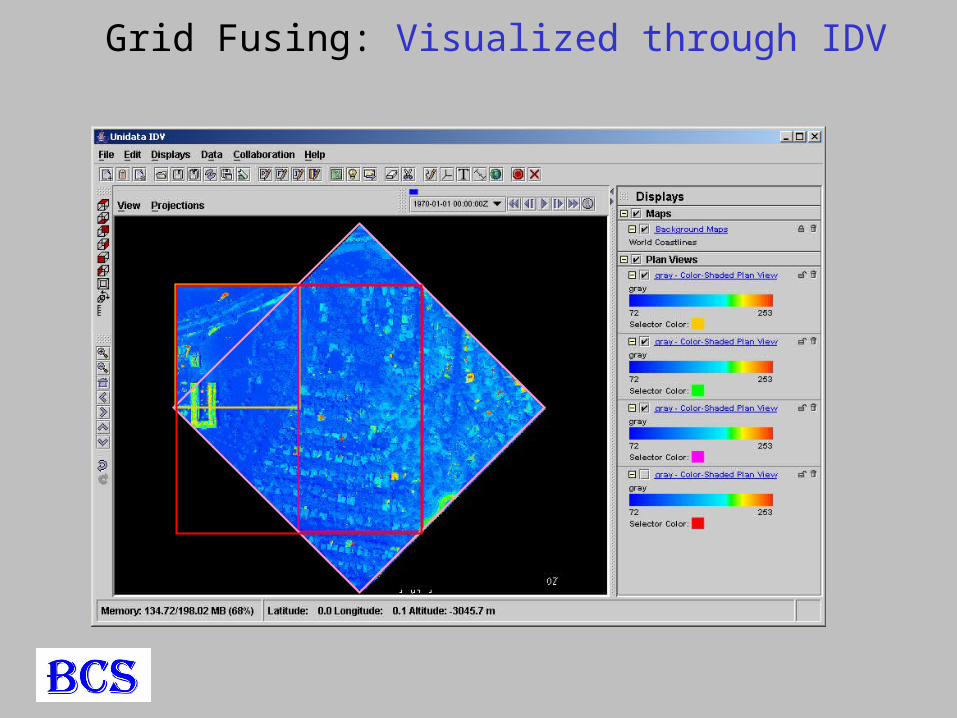
Grid Fusing: Visualized through IDV
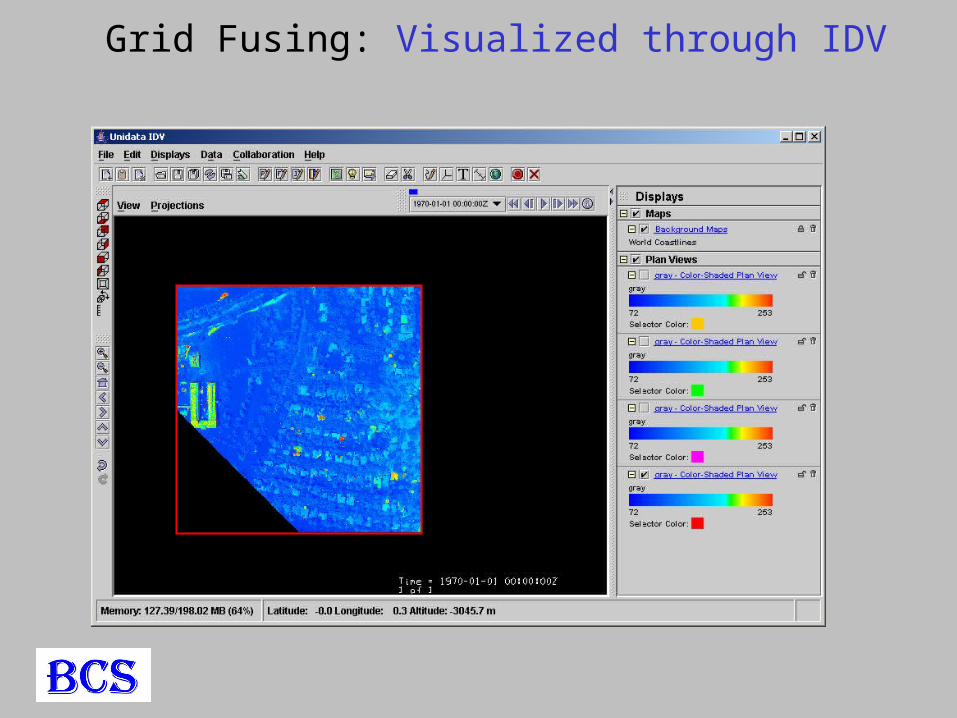
Grid Fusing: Visualized through IDV
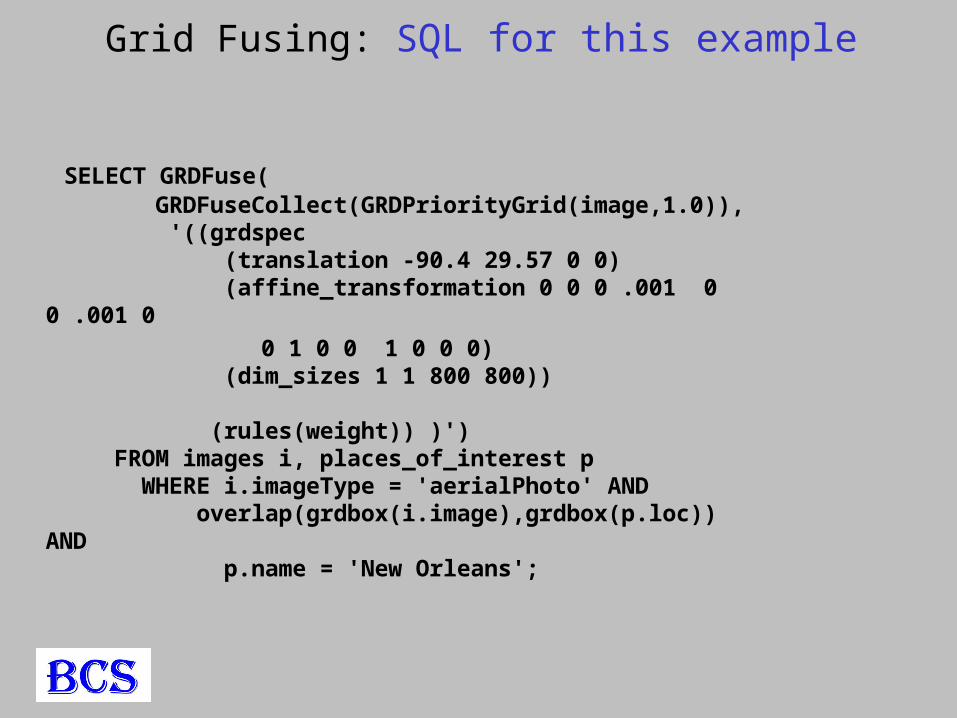
Grid Fusing: SQL for this example
SELECT GRDFuse( GRDFuseCollect(GRDPriorityGrid(image,1.0)), '((grdspec (translation -90.4 29.57 0 0) (affine_transformation 0 0 0 .001 0 0 .001 0
0 1 0 0 1 0 0 0) (dim_sizes 1 1 800 800)) (rules(weight)) )') FROM images i, places_of_interest p WHERE i.imageType = 'aerialPhoto' AND overlap(grdbox(i.image),grdbox(p.loc)) AND p.name = 'New Orleans';
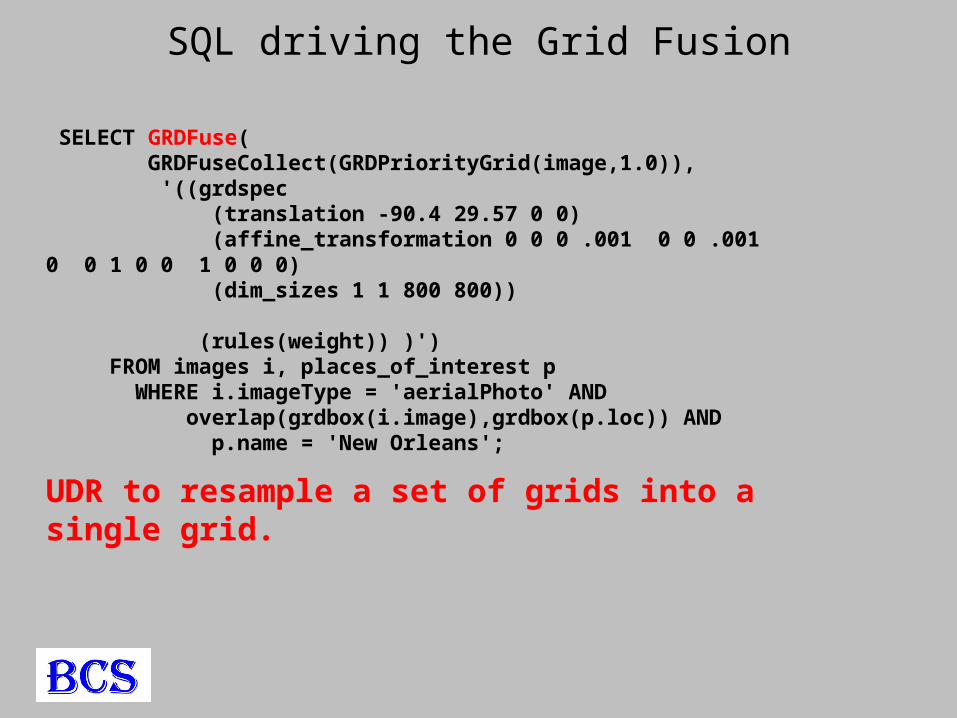
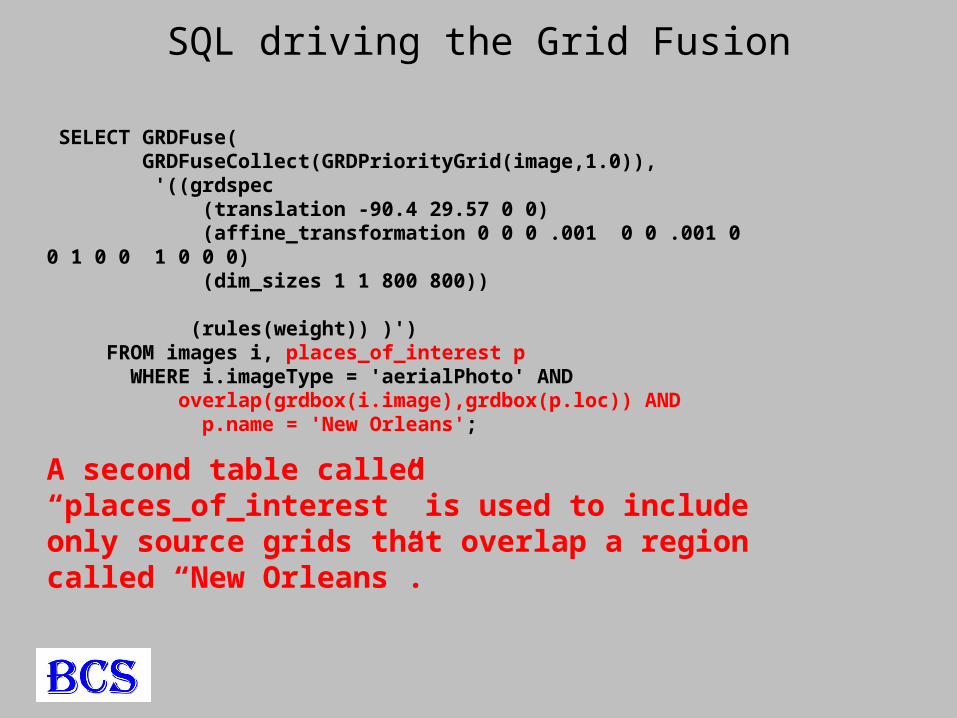
SQL driving the Grid Fusion
SELECT GRDFuse( GRDFuseCollect(GRDPriorityGrid(image,1.0)), '((grdspec (translation -90.4 29.57 0 0) (affine_transformation 0 0 0 .001 0 0 .001 0 0 1 0 0 1 0 0 0) (dim_sizes 1 1 800 800)) (rules(weight)) )') FROM images i, places_of_interest p WHERE i.imageType = 'aerialPhoto' AND overlap(grdbox(i.image),grdbox(p.loc)) AND p.name = 'New Orleans';
UDR to resample a set of grids into a single grid.
SQL driving the Grid Fusion
SELECT GRDFuse( GRDFuseCollect(GRDPriorityGrid(image,1.0)), '((grdspec (translation -90.4 29.57 0 0) (affine_transformation 0 0 0 .001 0 0 .001 0 0 1 0 0 1 0 0 0) (dim_sizes 1 1 800 800)) (rules(weight)) )') FROM images i, places_of_interest p WHERE i.imageType = 'aerialPhoto' AND overlap(grdbox(i.image),grdbox(p.loc)) AND p.name = 'New Orleans';
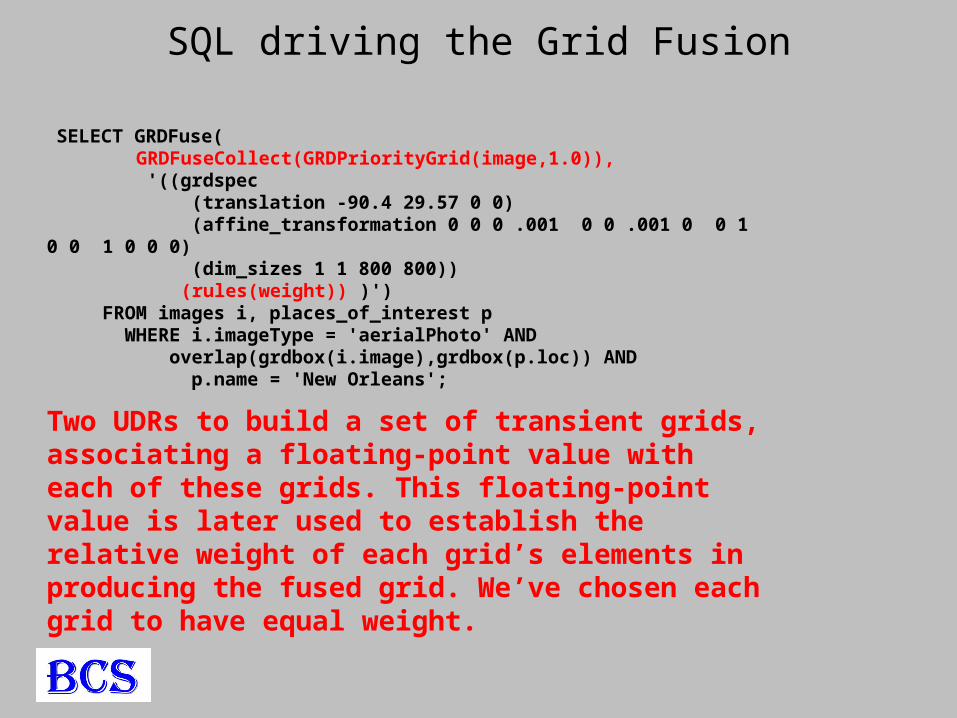
Two UDRs to build a set of transient grids, associating a floating-point value with each of these grids. This floating-point value is later used to establish the relative weight of each grid’s elements in producing the fused grid. We’ve chosen each grid to have equal weight.
SQL driving the Grid Fusion
SELECT GRDFuse( GRDFuseCollect(GRDPriorityGrid(image,1.0)), '((grdspec (translation -90.4 29.57 0 0) (affine_transformation 0 0 0 .001 0 0 .001 0 0 1 0 0 1 0 0 0) (dim_sizes 1 1 800 800)) (rules(weight)) )') FROM images i, places_of_interest p WHERE i.imageType = 'aerialPhoto' AND overlap(grdbox(i.image),grdbox(p.loc)) AND p.name = 'New Orleans';
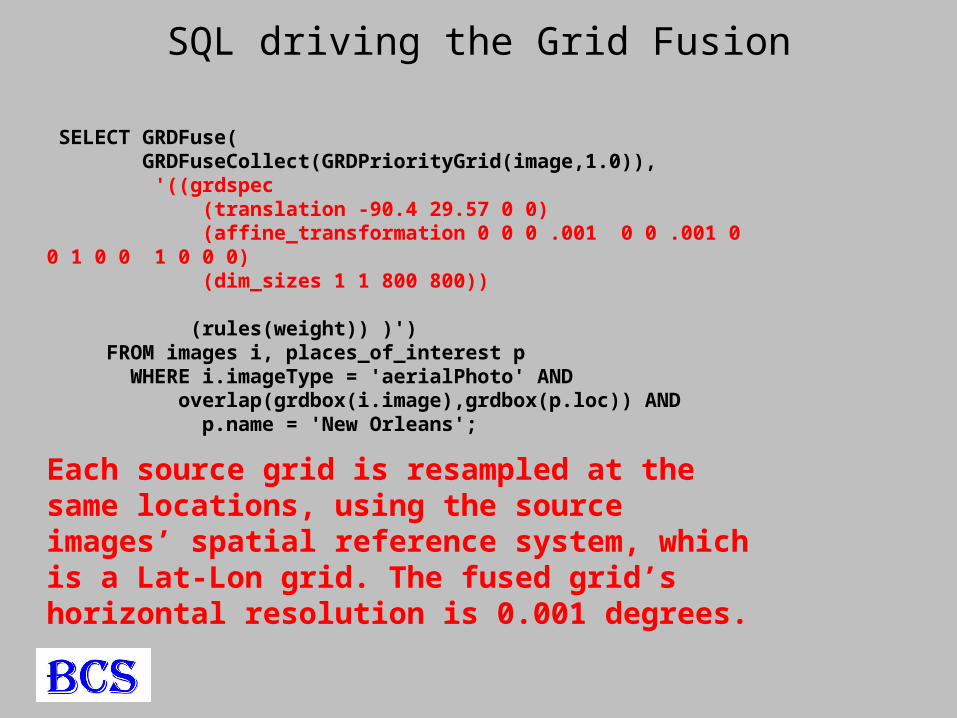
Each source grid is resampled at the same locations, using the source images’ spatial reference system, which is a Lat-Lon grid. The fused grid’s horizontal resolution is 0.001 degrees.
SQL driving the Grid Fusion
SELECT GRDFuse( GRDFuseCollect(GRDPriorityGrid(image,1.0)), '((grdspec (translation -90.4 29.57 0 0) (affine_transformation 0 0 0 .001 0 0 .001 0 0 1 0 0 1 0 0 0) (dim_sizes 1 1 800 800)) (rules(weight)) )') FROM images i, places_of_interest p WHERE i.imageType = 'aerialPhoto' AND overlap(grdbox(i.image),grdbox(p.loc)) AND p.name = 'New Orleans';
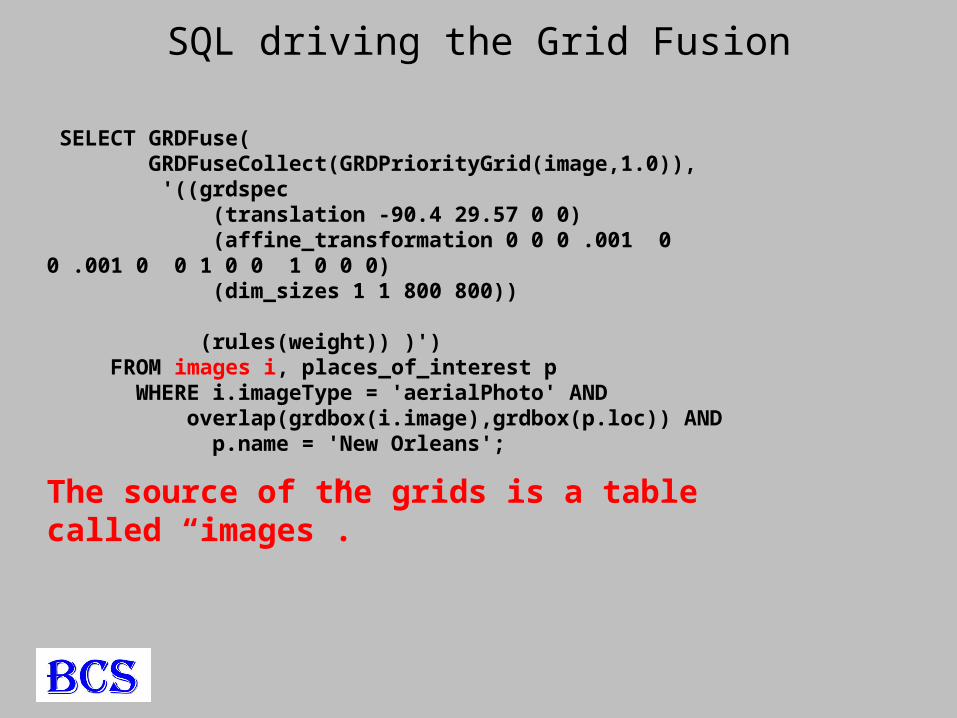
The source of the grids is a table called “images”.
SQL driving the Grid Fusion
SELECT GRDFuse( GRDFuseCollect(GRDPriorityGrid(image,1.0)), '((grdspec (translation -90.4 29.57 0 0) (affine_transformation 0 0 0 .001 0 0 .001 0 0 1 0 0 1 0 0 0) (dim_sizes 1 1 800 800)) (rules(weight)) )') FROM images i, places_of_interest p WHERE i.imageType = 'aerialPhoto' AND overlap(grdbox(i.image),grdbox(p.loc)) AND p.name = ‘New Orleans';
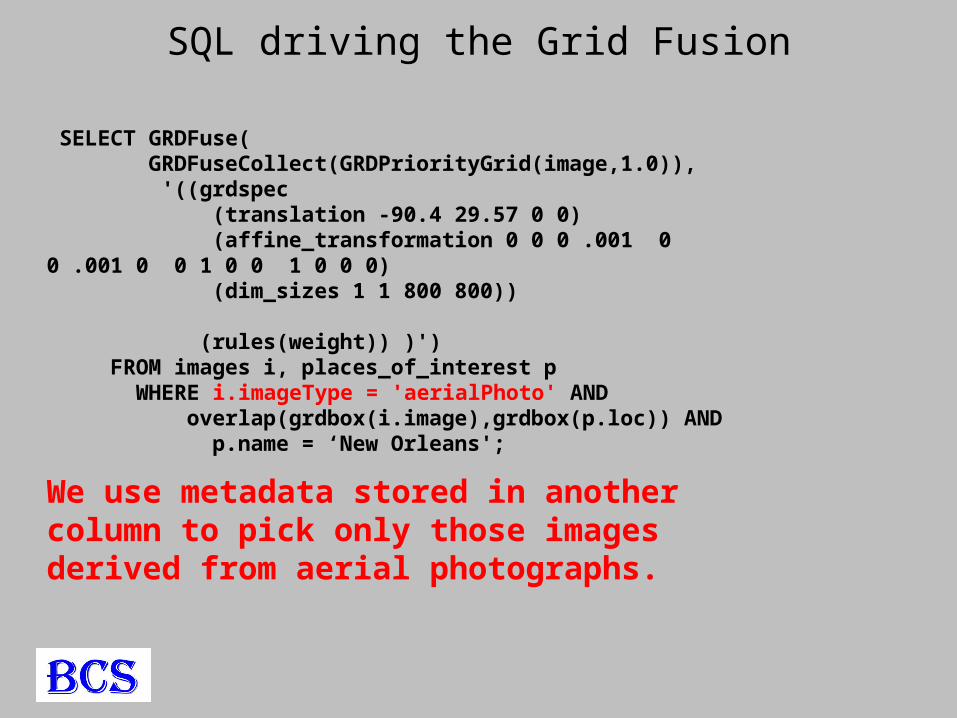
We use metadata stored in another column to pick only those images derived from aerial photographs.
SQL driving the Grid Fusion
SELECT GRDFuse( GRDFuseCollect(GRDPriorityGrid(image,1.0)), '((grdspec (translation -90.4 29.57 0 0) (affine_transformation 0 0 0 .001 0 0 .001 0 0 1 0 0 1 0 0 0) (dim_sizes 1 1 800 800)) (rules(weight)) )') FROM images i, places_of_interest p WHERE i.imageType = 'aerialPhoto' AND overlap(grdbox(i.image),grdbox(p.loc)) AND p.name = 'New Orleans';
A second table called “places_of_interest” is used to include only source grids that overlap a region called “New Orleans”.
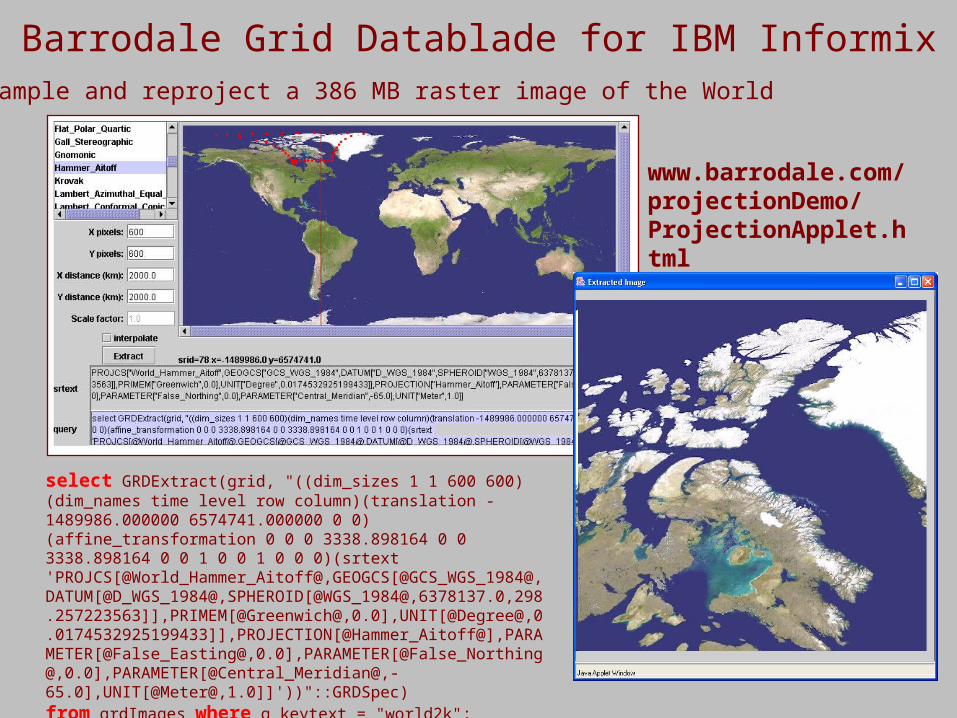
Barrodale Grid Datablade for IBM Informix
select GRDExtract(grid, "((dim_sizes 1 1 600 600)(dim_names time level row column)(translation -1489986.000000 6574741.000000 0 0)(affine_transformation 0 0 0 3338.898164 0 0 3338.898164 0 0 1 0 0 1 0 0 0)(srtext 'PROJCS[@World_Hammer_Aitoff@,GEOGCS[@GCS_WGS_1984@,DATUM[@D_WGS_1984@,SPHEROID[@WGS_1984@,6378137.0,298.257223563]],PRIMEM[@Greenwich@,0.0],UNIT[@Degree@,0.0174532925199433]],PROJECTION[@Hammer_Aitoff@],PARAMETER[@False_Easting@,0.0],PARAMETER[@False_Northing@,0.0],PARAMETER[@Central_Meridian@,-65.0],UNIT[@Meter@,1.0]]'))"::GRDSpec)from grdImages where g_keytext = "world2k";
Resample and reproject a 386 MB raster image of the World
www.barrodale.com/projectionDemo/ProjectionApplet.html
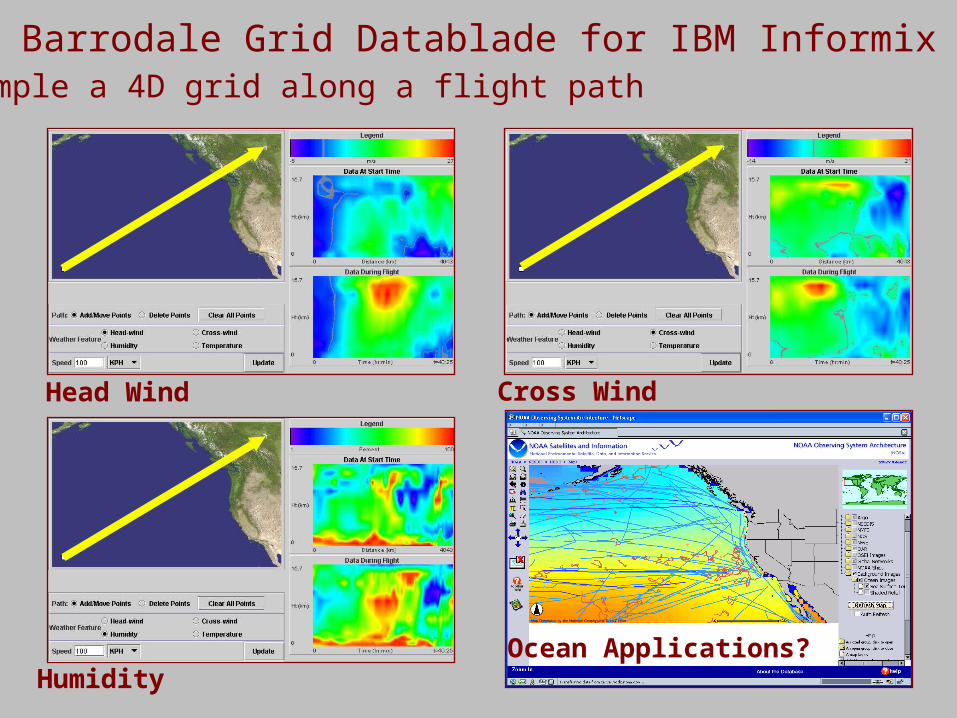
Barrodale Grid Datablade for IBM InformixSample a 4D grid along a flight path
Head Wind
Humidity
Cross Wind
Ocean Applications?
10m,10m,-100m
40m,30m,-100m
40m,20m,-100m
45m,10m,-100m40m,10m,-100m20m,10m,-100m
40m,30m,-90m
40m,30m,-50m
(t1,s1,p1)
(t6,s6,p6)
(t3,s3,p3)
(t4,s4,p4) (t5,s5,p5)
(t2,s2,p2)
EASTING
NORTHING
`
DEPTH
10m 20m 5m` ` ` `` `
`
`
`
`
40m
10m
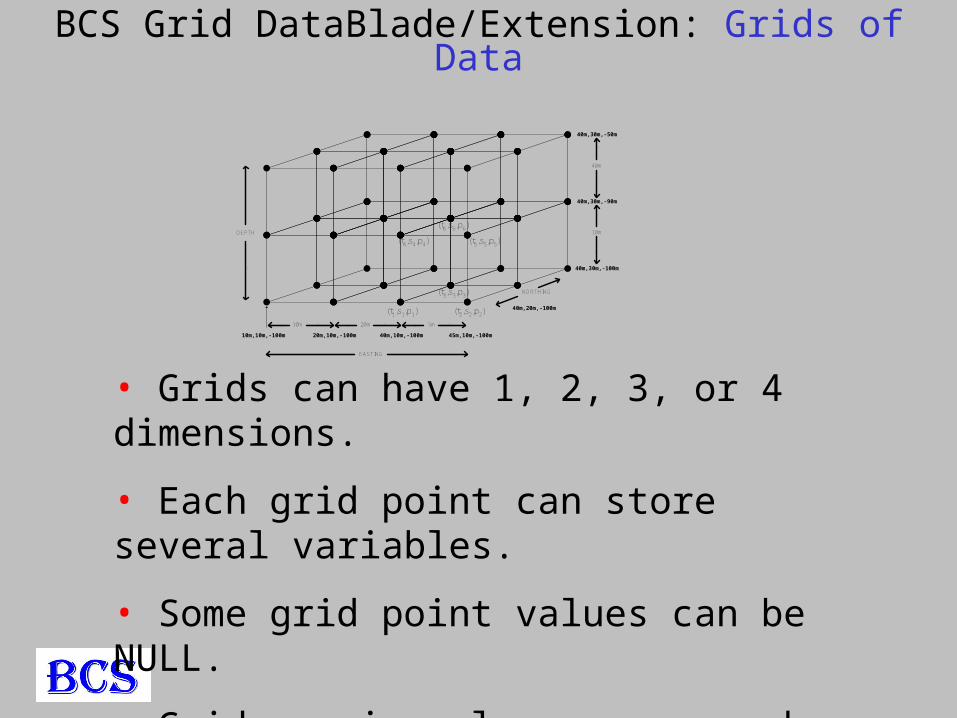
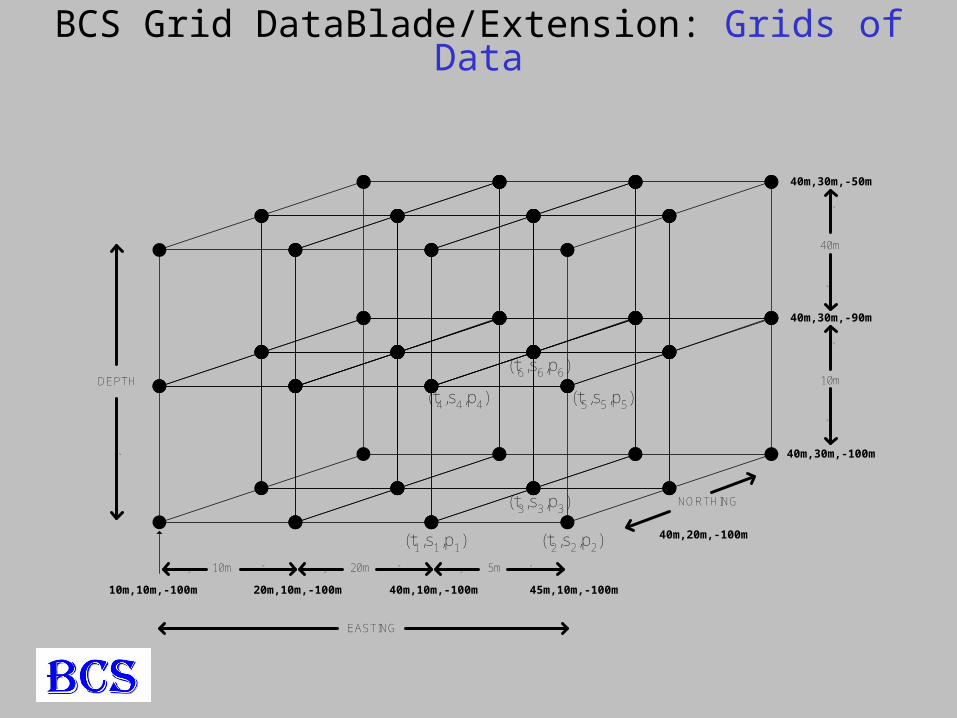
• Grids can have 1, 2, 3, or 4 dimensions.
• Each grid point can store several variables.
• Some grid point values can be NULL.
• Grid spacing along axes can be non-uniform.
BCS Grid DataBlade/Extension: Grids of Data
10m,10m,-100m
40m,30m,-100m
40m,20m,-100m
45m,10m,-100m40m,10m,-100m20m,10m,-100m
40m,30m,-90m
40m,30m,-50m
(t1,s1,p1)
(t6,s6,p6)
(t3,s3,p3)
(t4,s4,p4) (t5,s5,p5)
(t2,s2,p2)
EASTING
NORTHING
`
DEPTH
10m 20m 5m` ` ` `` `
`
`
`
`
40m
10m
BCS Grid DataBlade/Extension: Grids of Data
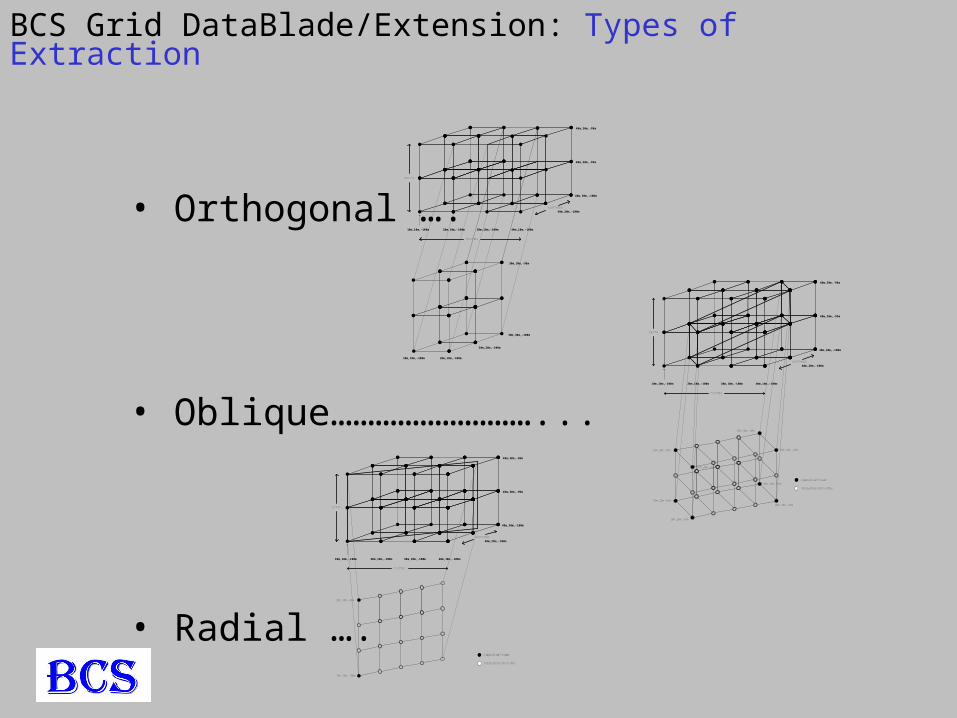
• Orthogonal ….
• Oblique………………………...
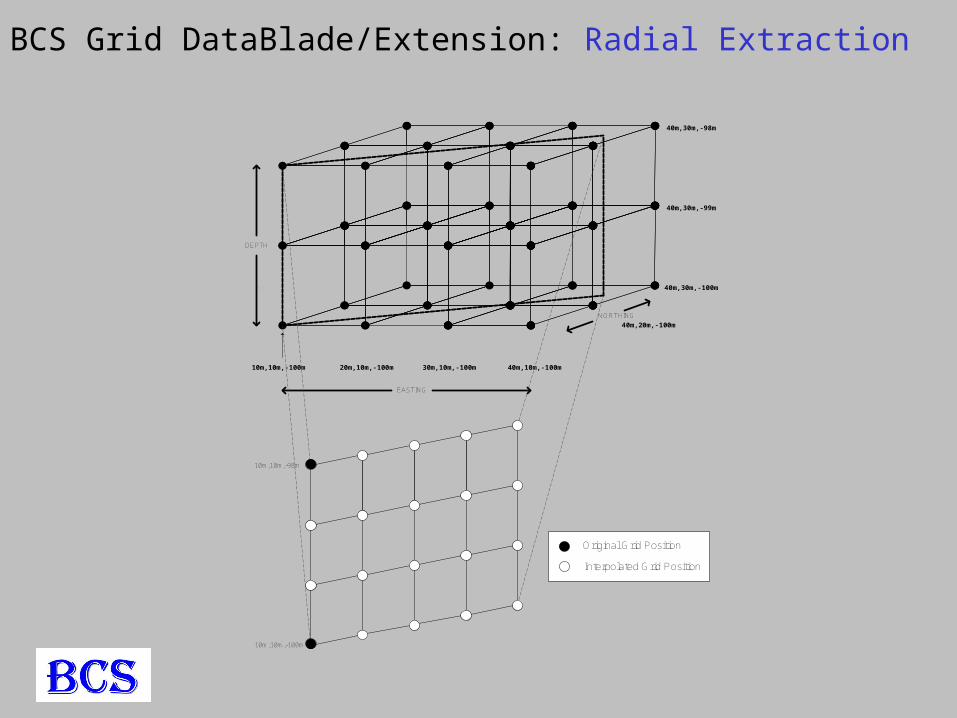
• Radial ….
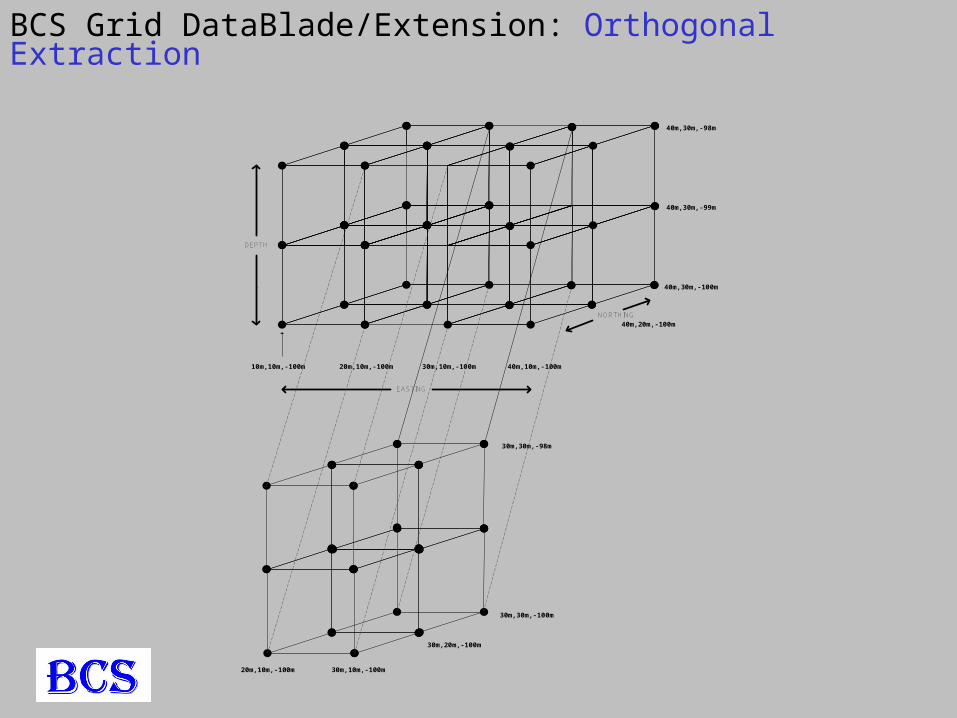
10m,10m,-100m
40m,30m,-100m
40m,20m,-100m
40m,10m,-100m30m,10m,-100m20m,10m,-100m
40m,30m,-99m
40m,30m,-98m
EASTING
NORTHING
`
DEPTH
20m,10m,-100m 30m,10m,-100m
30m,20m,-100m
30m,30m,-100m
30m,30m,-98m
10m,10m,-100m
40m,30m,-100m
40m,20m,-100m
40m,10m,-100m30m,10m,-100m20m,10m,-100m
40m,30m,-99m
40m,30m,-98m
EASTING
NORTHING
`
DEPTH
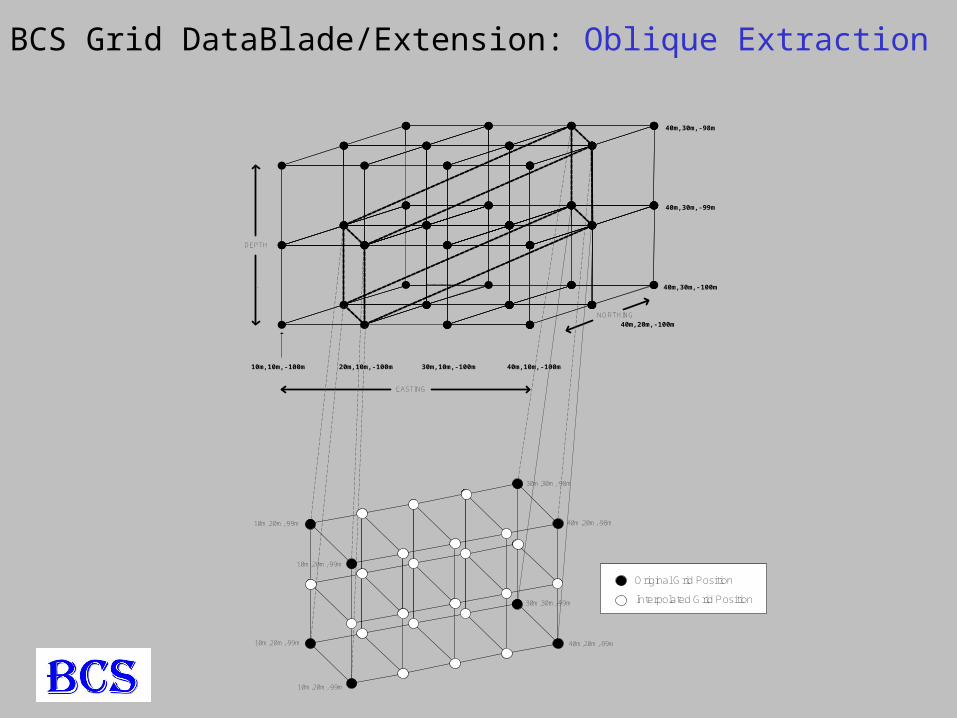
Original Grid Position
Interpolated Grid Position
10m,20m,-99m
10m,20m,-99m
10m,20m,-99m
10m,20m,-99m
30m,30m,-99m
40m,20m,-99m
40m,20m,-98m
30m,30m,-98m
10m,10m,-100m
40m,30m,-100m
40m,20m,-100m
40m,10m,-100m30m,10m,-100m20m,10m,-100m
40m,30m,-99m
40m,30m,-98m
EASTING
NORTHING
`
DEPTH
Original Grid Position
Interpolated Grid Position
10m,10m,-98m
10m,10m,-100m
BCS Grid DataBlade/Extension: Types of Extraction
10m,10m,-100m
40m,30m,-100m
40m,20m,-100m
40m,10m,-100m30m,10m,-100m20m,10m,-100m
40m,30m,-99m
40m,30m,-98m
EASTING
NORTHING
`
DEPTH
20m,10m,-100m 30m,10m,-100m
30m,20m,-100m
30m,30m,-100m
30m,30m,-98m
BCS Grid DataBlade/Extension: Orthogonal Extraction
10m,10m,-100m
40m,30m,-100m
40m,20m,-100m
40m,10m,-100m30m,10m,-100m20m,10m,-100m
40m,30m,-99m
40m,30m,-98m
EASTING
NORTHING
`
DEPTH
10m,20m,-99m
10m,20m,-99m
10m,20m,-99m
10m,20m,-99m
30m,30m,-99m
40m,20m,-99m
40m,20m,-98m
30m,30m,-98m
Original Grid Position
Interpolated Grid Position
BCS Grid DataBlade/Extension: Oblique Extraction
10m,10m,-100m
40m,30m,-100m
40m,20m,-100m
40m,10m,-100m30m,10m,-100m20m,10m,-100m
40m,30m,-99m
40m,30m,-98m
EASTING
NORTHING
`
DEPTH
10m,10m,-98m
10m,10m,-100m
Original Grid Position
Interpolated Grid Position
BCS Grid DataBlade/Extension: Radial Extraction
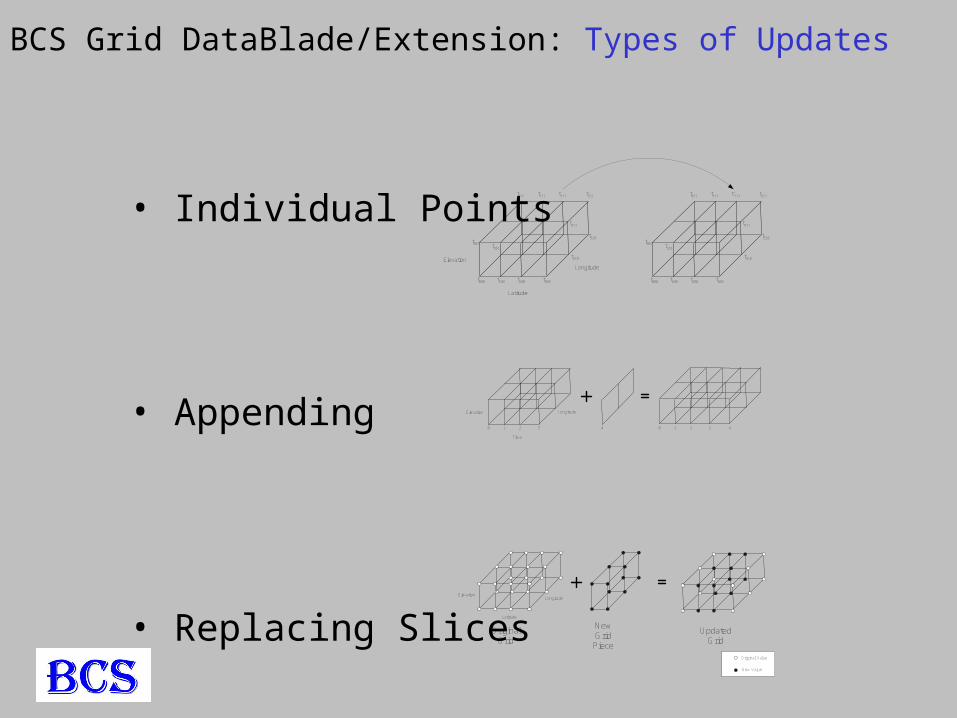
• Individual Points
• Appending
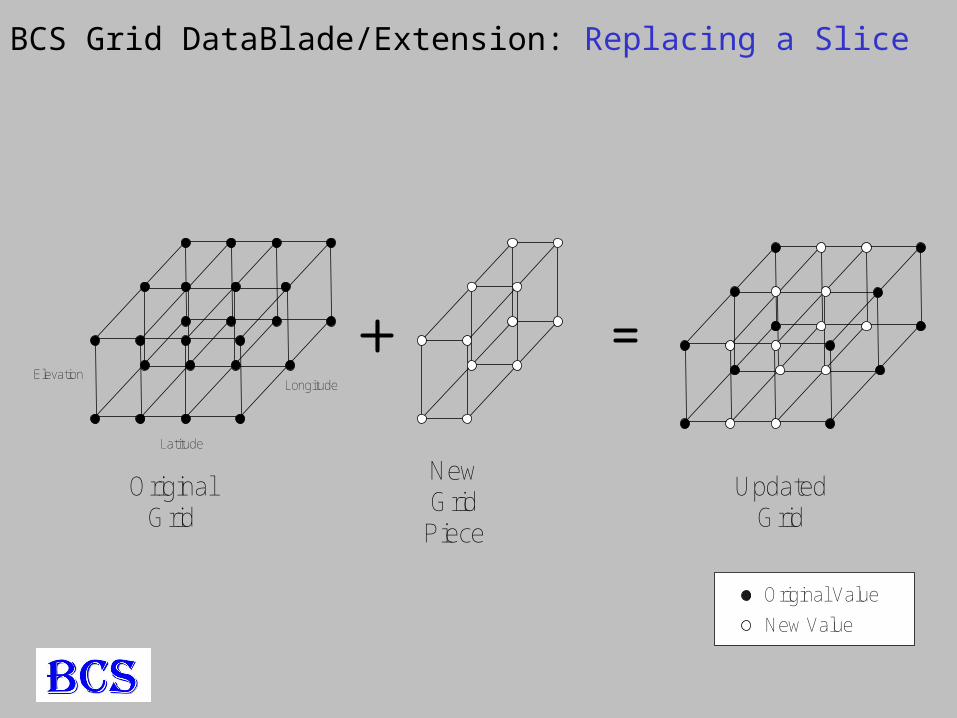
• Replacing Slices
Longitude
Latitude
Elevation
t000 t300t200t100
t001
t310
t311
t101
t021 t321t221t121
t320
t000 t300t200t100
t001
t310
t311
t101
t021 t321t'221t121
t320
Longitude
Time
Elevation
0 321 44 0 321
Longitude
Latitude
Elevation
Original Value
New Value
OriginalGrid
UpdatedGrid
NewGrid
Piece
BCS Grid DataBlade/Extension: Types of Updates
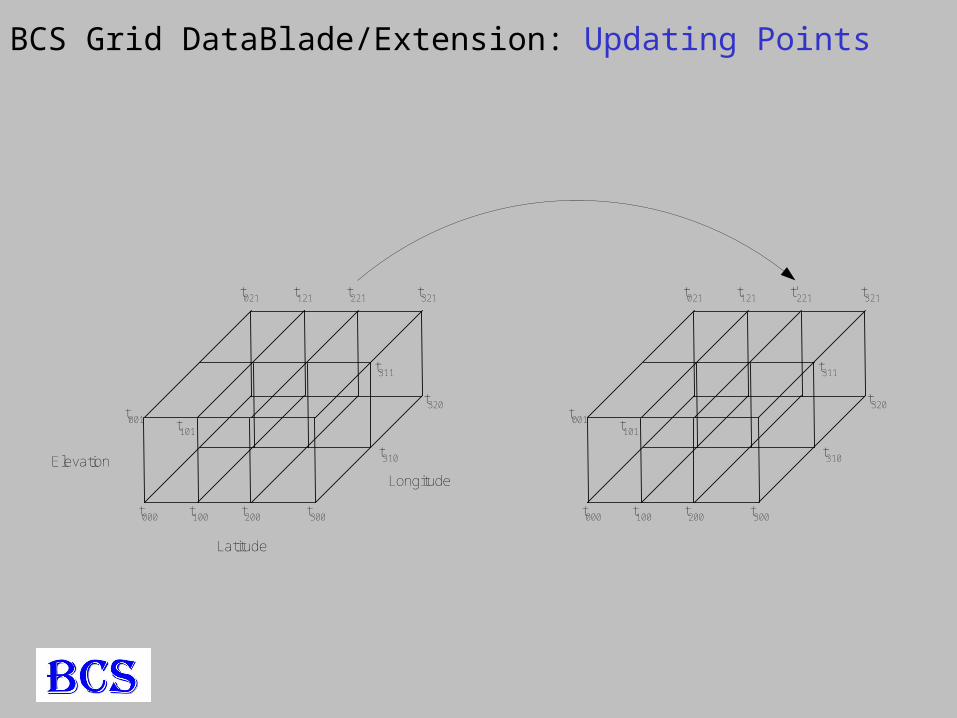
Longitude
Latitude
Elevation
t000 t300t200t100
t001
t310
t311
t101
t021 t321t221t121
t320
t000 t300t200t100
t001
t310
t311
t101
t021 t321t'221t121
t320
BCS Grid DataBlade/Extension: Updating Points
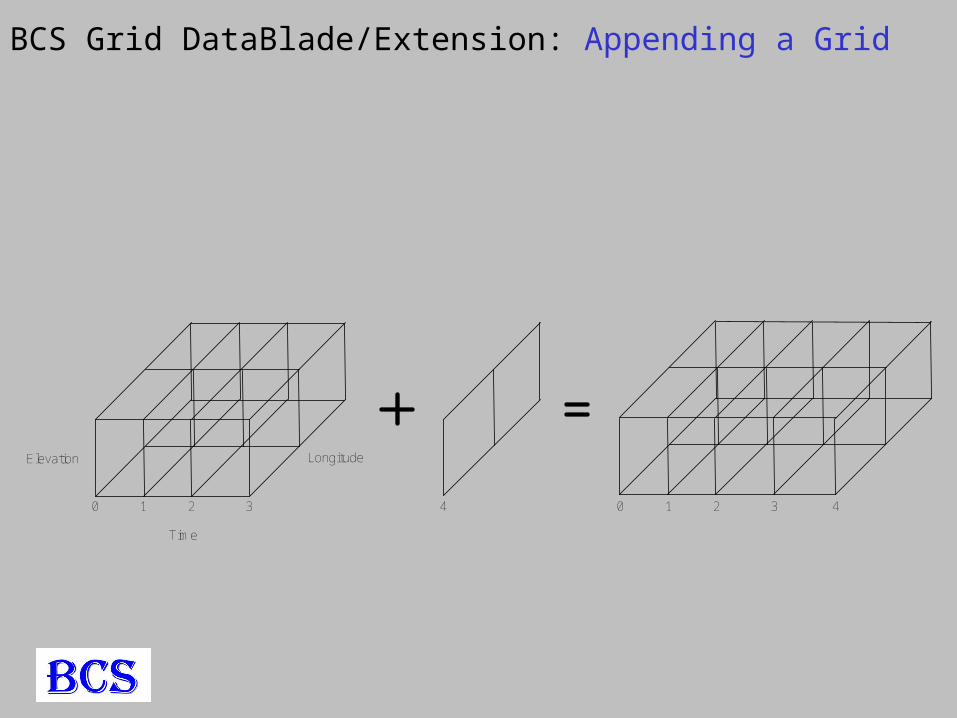
Longitude
Time
Elevation
0 321 44 0 321
BCS Grid DataBlade/Extension: Appending a Grid
Longitude
Latitude
Elevation
OriginalGrid
UpdatedGrid
NewGrid
Piece
Original Value
New Value
BCS Grid DataBlade/Extension: Replacing a Slice
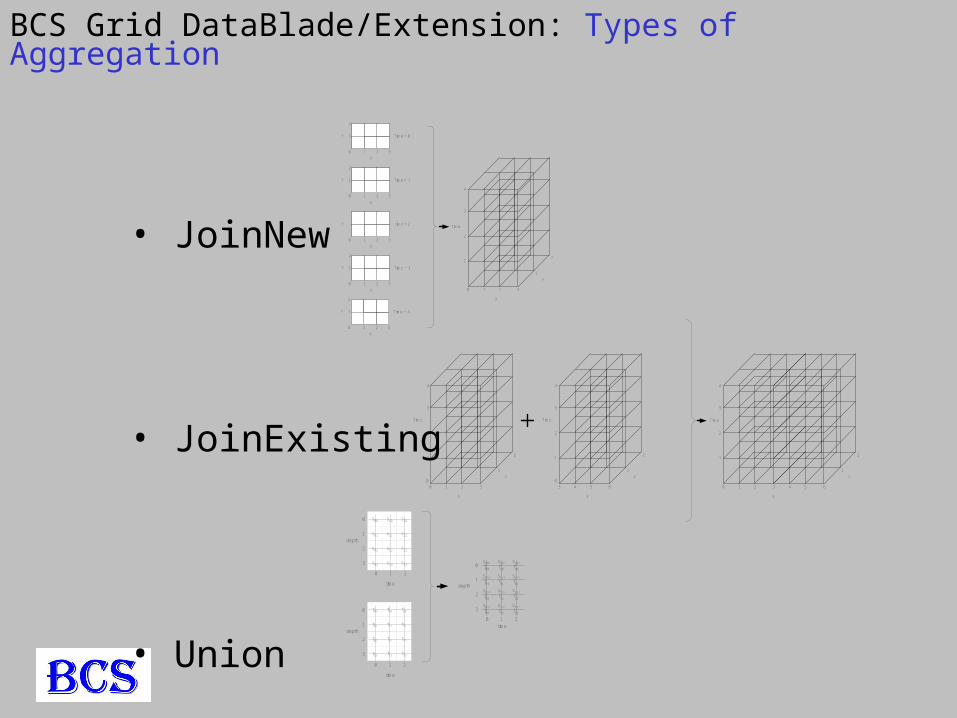
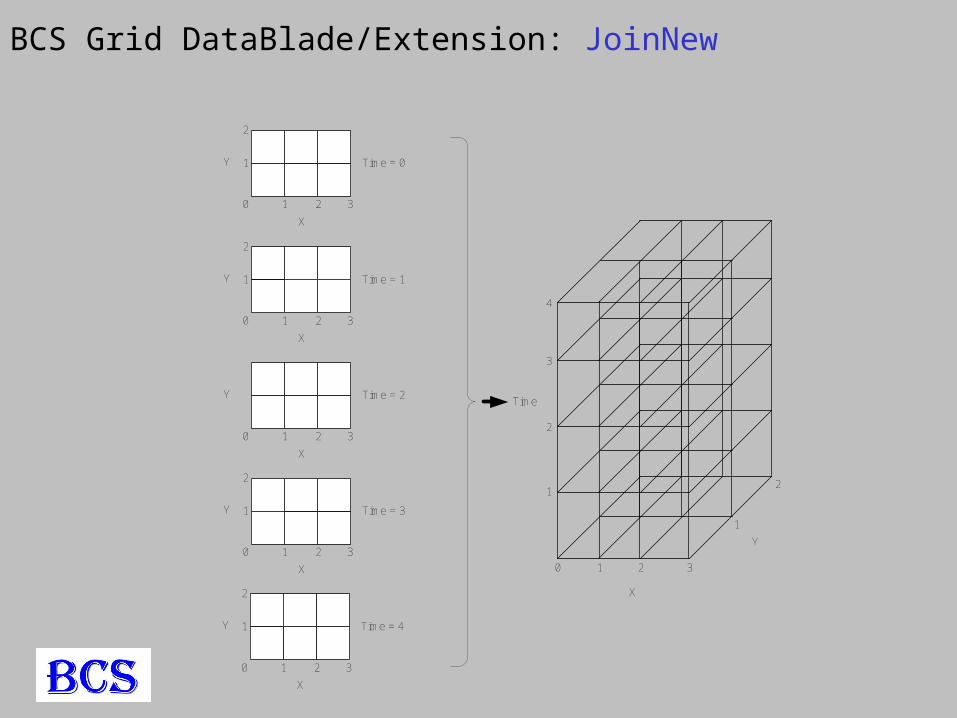
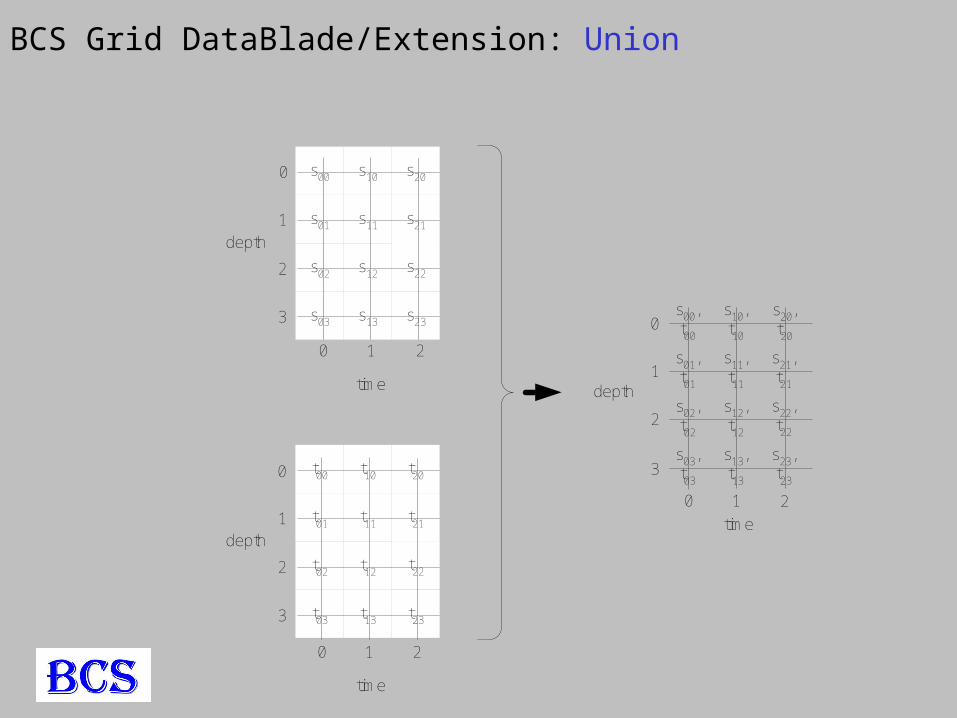
• JoinNew
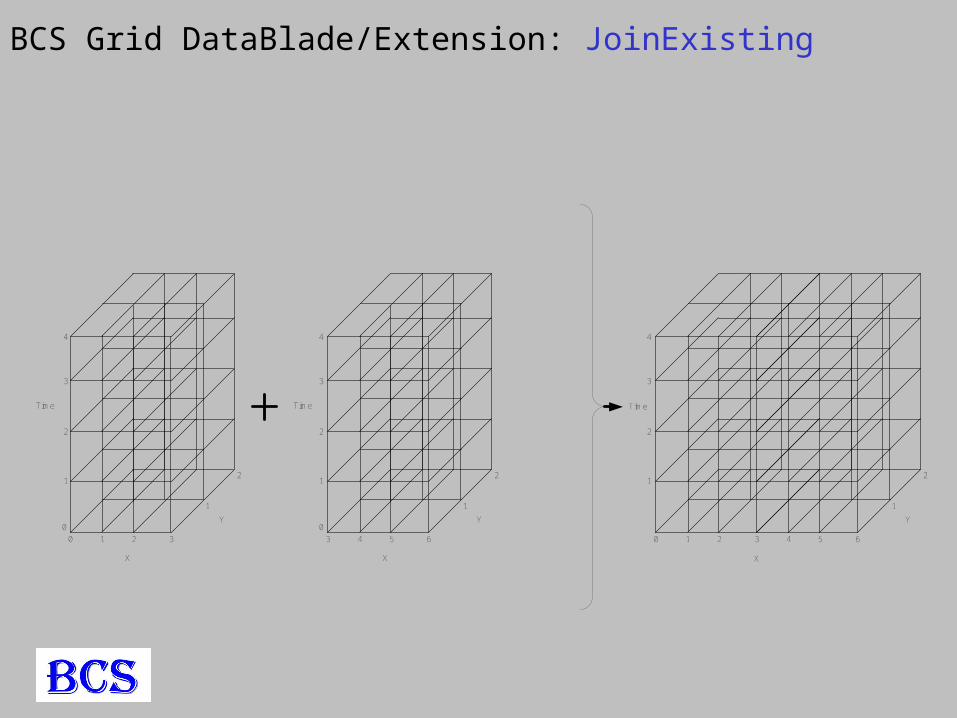
• JoinExisting
• Union
Y
X
Time = 0
0
1
2
1 32
Y
X
Time = 4
0
1
2
1 32
Y
X
Time = 3
0
1
2
1 32
Y
X
Time = 2
0
1
2
1 32
Y
X
Time = 1
0
1
2
1 32
Y
X
Time
0 1 32
1
2
3
4
X
Time
0 1 32
1
2
3
4
1
2
Y
X
Time
0 1 32
1
2
3
4
1
2
Y
X
Time
3 4 65
1
2
3
4
1
2
Y
4 65
00
s00
s21s11s01
s20s10
depth
time
0
1
0
1 2
s02
s23s13s03
s22s122
3
t00
t21t11t01
t20t10
depth
time
0
1
0
1 2
t02
t23t13t03
t22t122
3
depth
time
1
0
2
3
s00,t00
s21,t21
s11,t11
s10,t10
0 1 2
s02,t02
s23,t23
s13,t13
s03,t03
s22,t22
s12,t12
s20,t20
s01,t01
BCS Grid DataBlade/Extension: Types of Aggregation
Y
X
Time = 0
0
1
2
1 32
Y
X
Time = 4
0
1
2
1 32
Y
X
Time = 3
0
1
2
1 32
Y
X
Time = 2
0
1
2
1 32
Y
X
Time = 1
0
1
2
1 32
Y
X
Time
0 1 32
1
2
3
4
BCS Grid DataBlade/Extension: JoinNew
X
Time
0 1 32
1
2
3
4
1
2
Y
X
Time
0 1 32
1
2
3
4
1
2
Y
X
Time
3 4 65
1
2
3
4
1
2
Y
4 65
00
BCS Grid DataBlade/Extension: JoinExisting
s00
s21s11s01
s20s10
depth
time
0
1
0
1 2
s02
s23s13s03
s22s122
3
t00
t21t11t01
t20t10
depth
time
0
1
0
1 2
t02
t23t13t03
t22t122
3
depth
time
1
0
2
3
s00,t00
s21,t21
s11,t11
s10,t10
0 1 2
s02,t02
s23,t23
s13,t13
s03,t03
s22,t22
s12,t12
s20,t20
s01,t01
BCS Grid DataBlade/Extension: Union
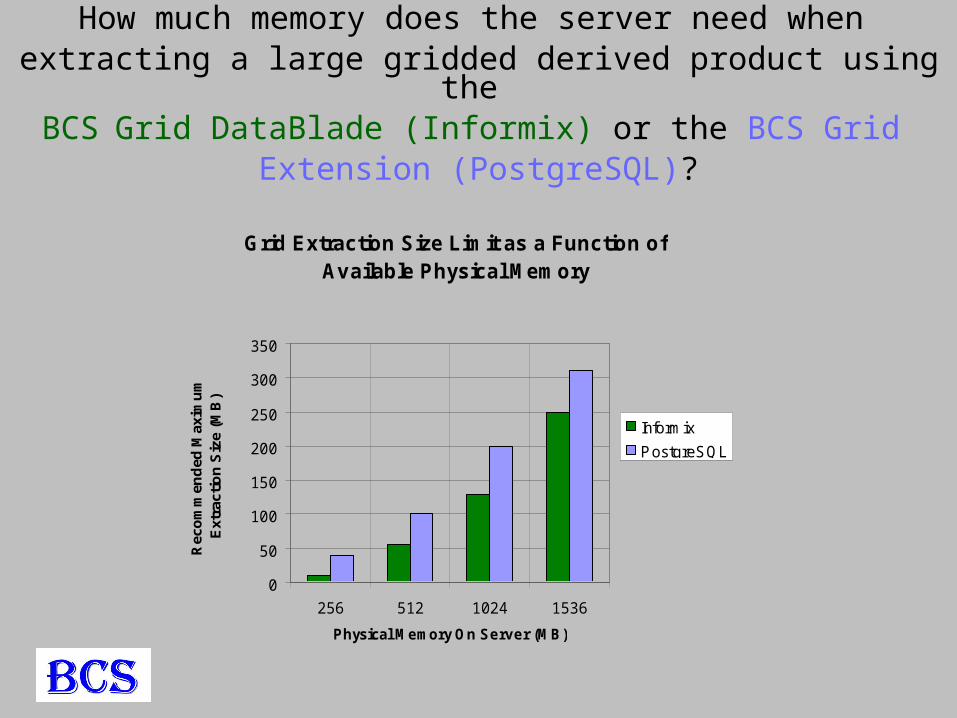
Grid Extraction Size Limit as a Function of Available Physical Memory
0
50
100
150
200
250
300
350
256 512 1024 1536
Physical Memory On Server (MB)
Rec
om
men
ded
Max
imu
m
Ext
ract
ion
Siz
e (M
B)
Informix
PostgreSQL
How much memory does the server need when
extracting a large gridded derived product using the BCS Grid DataBlade (Informix) or the BCS Grid
Extension (PostgreSQL)?
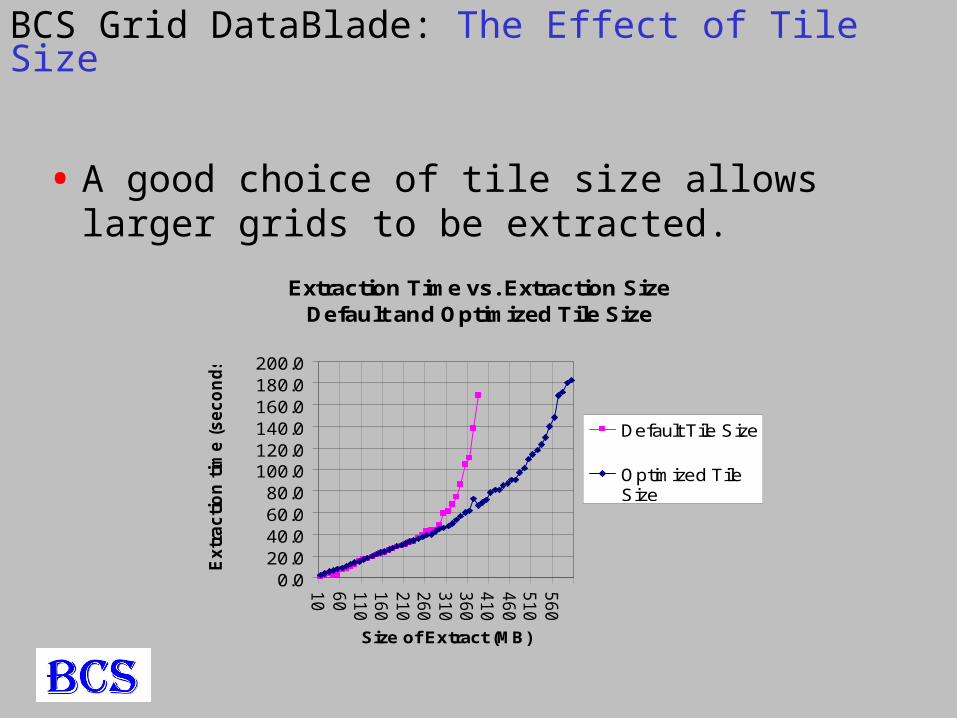
BCS Grid DataBlade: The Effect of Tile Size
• A good choice of tile size allows larger grids to be extracted.
Extraction Time vs. Extraction Size Default and Optimized Tile Size
0.020.040.060.080.0
100.0120.0140.0160.0180.0200.0
10
60
11
01
60
21
02
60
31
03
60
41
04
60
51
05
60
Size of Extract (MB)
Ex
tra
cti
on
tim
e (
se
co
nd
s)
Default Tile Size
Optimized TileSize
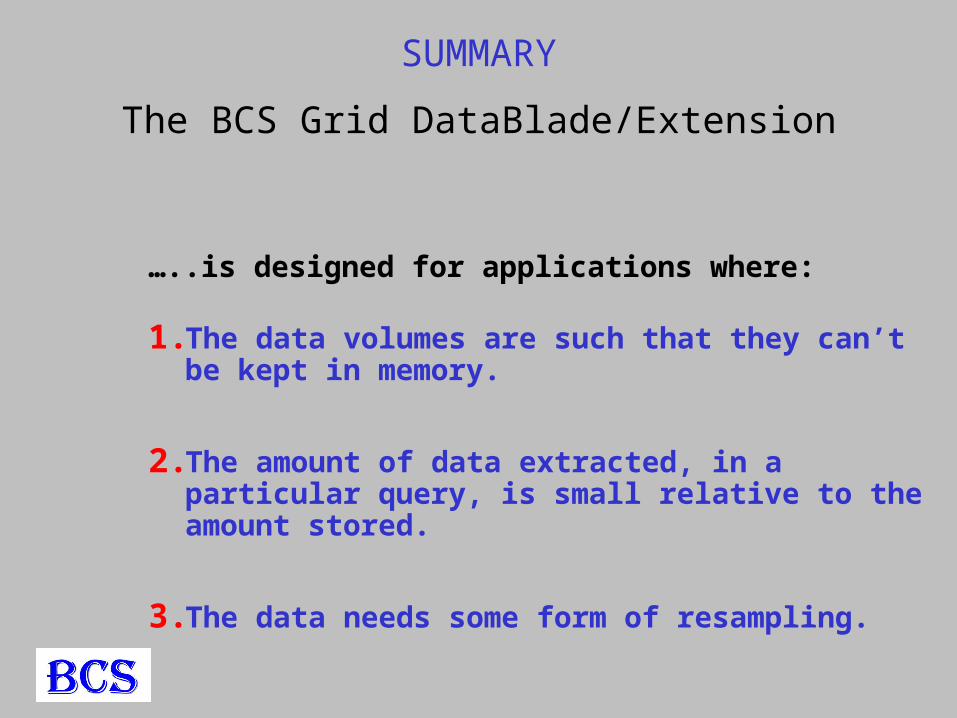
…..is designed for applications where:
1. The data volumes are such that they can’t be kept in memory.
2. The amount of data extracted, in a particular query, is small relative to the amount stored.
3. The data needs some form of resampling.
SUMMARY
The BCS Grid DataBlade/Extension
CONTACT INFORMATION:
Dr. Ian Barrodale, President
Barrodale Computing Services Ltd. (BCS)
P.O. Box 3075 STN CSC
Victoria BC V8W 3W2 Canada
(250) 472 4332 voice, (250) 472 4373 fax
e-mail: [email protected]
For more information about BCS projects, experience, and capabilities, please visit:
http://www.barrodale.com