Embed Size (px)
Citation preview

Long-Term Ecological Monitoring Program
Database Management
And
Status Report
Prepared by Jon Paynter and Susan L. Boudreau
September 15, 2003
Denali National Park and Preserve
P.O. Box 9 Denali Park, Alaska

2

3
Table of Contents _______________________________________________________________
INTRODUCTION..................................................................................................................... 5
PHYSICAL ENVIRONMENT................................................................................................... 7
Glacier Monitoring................................................................................................................. 7
Snow Monitoring ................................................................................................................. 13
Weather Monitoring............................................................................................................. 19
Air Quality ............................................................................................................................ 27
Soils Monitoring .................................................................................................................. 33
FLORA.................................................................................................................................. 39
Vegetation............................................................................................................................ 39
Mini-grid Pilot Project ......................................................................................................... 47
AQUATIC SYSTEMS............................................................................................................ 51
Aquatic Systems-Stream Channel Morphometry and Water Chemistry ........................ 51
Aquatic Invertebrates.......................................................................................................... 57
FAUNA.................................................................................................................................. 71
Wolf/Prey Interactions ........................................................................................................ 71
Small Mammals ................................................................................................................... 77
Bird Monitoring ................................................................................................................... 85

4
Tables Table 1. Summary of glacier monitoring data. ............................................................................................................ 9 Table 2. Weather Station Parameters ......................................................................................................................... 20 Table 3. Meteorological Instrumentation ................................................................................................................... 21 Table 4. Parameters measured by air quality monitoring networks in Denali. ................................................ 28 Table 5. Parameters relating to the size, condition and location of trees within vegetation monitoring
plots............................................................................................................................................................................ 42 Table 6. Parameters relating to the vegetation cover within quadrats in the Rock Creek permanent
vegetation monitoring plots. ................................................................................................................................ 42 Table 7. Parameters relating to the cone count data within quadrats in the Rock Creek permanent
vegetation monitoring plots. ................................................................................................................................ 43 Table 8. Parameters relating to the seed fall data within plots in the Rock Creek permanent vegetation
monitoring plots. ..................................................................................................................................................... 44 Table 9. Parameters relating to the annual growth selected trees within vegetation monitoring plots, as
measured by dendrometer Bands affixed at breast height.......................................................................... 44 Table 10. Water chemistry measurements for LTEM program. ........................................................................... 52 Table 11. Physical measurements for aquatic systems component.................................................................. 53 Table 12. Summary of stream studies undertaken in Denali National Park and Preserve, 1992 – 2003. ... 58 Table 13. Three lines of spreadsheet showing data as entered in the field. ..................................................... 78 Table 14. A section of the output generated when using the cross tab function to count the number of
captures during each sampling event. .............................................................................................................. 78 Table 15. A section of the output generated when using the cross tab function to count the number of
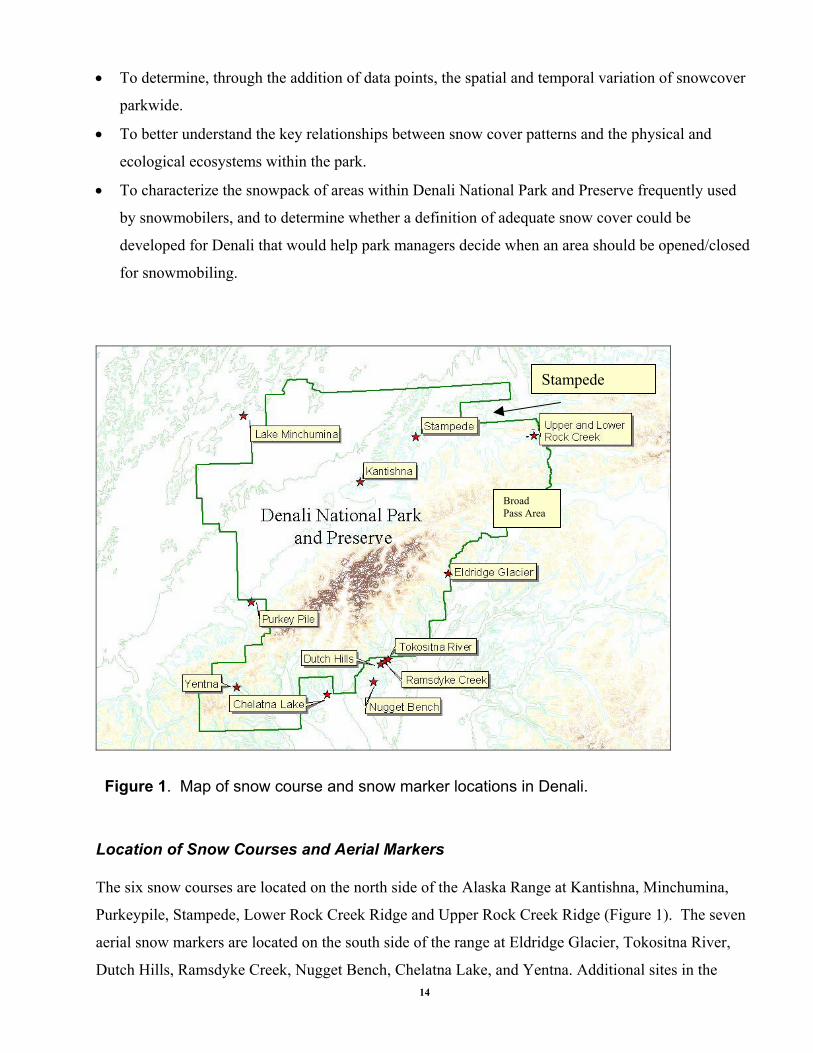
new captures and recaptures during each sampling event. ........................................................................ 79 Table 16. Column names and description for small mammal capture data frame in S-PLUS. ..................... 80 Table 17. Components of a capture history object in S-PLUS. ............................................................................ 81 Figures Figure 1. Map of snow course and snow marker locations in Denali. ...................................... 14

5
Introduction Jon Paynter, Denali National Park and Preserve
The purpose of the data management function is to provide standards for the management of digital
data collected as part of the Long-Term Ecological Monitoring (LTEM) program at Denali National
Park and Preserve (Denali) to ensure the protection, reliability and availability of that data.
Natural resource data has been collected by a number of different programs and activities engaged in
the management of Denali National Park and Preserve. The Denali LTEM program has developed
datasets in a variety of disciplines. This data was first collected within the Rock Creek drainage and
later expanded to sites throughout the park.
There are 19 datasets under the LTEM umbrella within the disciplines of Glaciers, Snowfall, Weather,
Soils, Vegetation, Aquatic Systems, Aquatic Invertebrates, Wolf/Prey Interactions, Small Mammals,
Eagles/Gyrfalcons, and Passerines. This chapter contains reports from each discipline describing why
the data was collected, how it was collected, and how it was finally archived, in the case of final
products, or updated, with active datasets. Each discipline’s section contains an introduction,
descriptions of database design, data collection, entry and quality assurance, and data synthesis and
analysis. In addition, Federal Geographic Data Committee (FGDC) compliant metadata is included
for each dataset. The metadata is maintained with two software packages. The first is the Inventory
and Monitoring program’s Dataset Catalog (v. 2003.1). This package maintains a basic inventory of
each dataset and can be considered a metadata-lite version of the documentation. More robust,
FGDC-format metadata is maintained using SMSS (v. 3.2). The metadata is presented on a CD as an
appendix attached to the report.
Maintenance of the various datasets is the responsibility of the respective principal investigator. A
copy of most of the datasets is kept on the GIS data server at Denali Headquarters and periodically
updated with more recent versions. Some of the collection efforts are part of larger regional or
national datasets which have their own procedures for archiving and metadata preparation. Access to
these data is available through the internet.

6
In late 1999, the Denali LTEM program began the first attempt to synthesize the separate databases of
the various research projects into a single relational database, based on the model of the Channel
Islands (CHIS) LTEM database. Because the Denali database must incorporate data that have been
collected since 1992, it has been a very complex procedure. The advantages of having a single
relational database for the LTEM data far outweigh the difficulties of locating data on various
computers, however, and will ultimately aid future park researchers in obtaining information.
In 2000, most of the database work involved determining the structure of the master database. Only
active databases from current projects were focused on. By obtaining the data fields from original
tables or spreadsheets, and normalizing the structure of the individual project databases, the
significance of each data field and relationship to other data fields in the table was made clear. These
normalized tables will then be incorporated more readily into the final relational database.
Ultimately, it is the intention of the LTEM program to merge the datasets from Denali into the larger
Central Alaska Network (CAKN) of the Inventory and Monitoring program. The standards for all
aspects of database management will likely be modified at that time to conform to the Network’s
protocols.

7
Physical Environment Glacier Monitoring Guy Adema, Denali National Park and Preserve
Introduction Glaciers are a major feature in Denali National Park and Preserve, currently covering about 17%, 1
million acres, of the park. Unlike other major features such as lakes, mountains, and rivers, glaciers
advance and retreat as climate fluctuates. Glacier behavior in Denali varies from apparent steady flow
glaciers to erratic surge-type glaciers. This variety offers opportunities to study glacier movements
dominated by climate as well as those that are influenced by other factors.
The objective of the glacier LTEM program in Denali is to establish the baseline conditions of selected
glaciers and to detect and understand glacial processes. Pursuing this objective will allow for the
detection of the effects of climate fluctuations as they happen and to better understand the natural
evolution of the Denali landscape, much of which has been shaped by glacial processes. The data
obtained can be used to test dynamic models of climate and glacier flow and emerging hypotheses
regarding the effects of climate change. The data can also be used to estimate the effects of these
changes on related other systems such as the discharge of glacier-fed rivers.
Database Design & Sampling Approach The glacier monitoring program has seven main monitoring components: index glacier measurements,
benchmark glacier measurements, terminus monitoring, longitudinal surveys, movement surveys,
surge monitoring, and photo documentation.
Index glacier measurements consist of survey and snow depth and density measurements that occur
twice annually (both ends of the hydrological year) at a single site on two glaciers, the Traleika and
Kahiltna. Data were stored in USGS-maintained Lotus databases until 1997, when they were
transferred to Denali. Denali then began converting the data reduction routines into Microsoft (MS)
Excel format. Currently, the data are reduced and stored in a MS Excel workbook with a nested Visual
Basic processing and interface routine.

8
Benchmark glacier measurements consist of survey and snow depth and density measurements that
occur twice annually (both ends of the hydrological year) at four sites on the East Fork Toklat Glacier.
The data are reduced and stored in MS Excel format.
Longitudinal, movement, and terminus surveys are performed periodically on selected glaciers (see
Table 1). The survey data are stored tabular form and as a spatial coverage. Data analysis is performed
with standard software, including ArcGIS, Grapher and AutoCAD. Surge monitoring is also
accommodated with this suite of software through similar techniques.
Photo documentation is performed periodically on selected glaciers (see Table 1). Prior to 2001 data
were stored as slides and air photos. Beginning in 2001, photo documentation is performed digitally
and images are stored in tiled image format. Database storage options are being researched and it is
expected that digital data will be stored in Extensis Portfolio.

9
Table 1. Summary of glacier monitoring data. Year Traleika1
Index Kahiltna2 Index
East Fork Toklat3
Terminus Monitoring4
Longitudinal Surveys5
Movement Surveys6
Surge Monitoring7
Photos8
1991 spring,
fall
spring, fall
1992 spring,
fall
spring, fall Middle and
West Toklat,
Foraker
Muldrow
1992 spring,
fall
spring, fall Middle and
West
Polychrome,
Cantwell
Muldrow
spring,
fall
spring, fall Muldrow Muldrow
1994 spring,
fall
spring, fall Muldrow Muldrow
1995 spring,
fall
spring, fall Muldrow
1996 spring,
fall
spring, fall Muldrow Slippery Park flight
1997 spring,
fall
spring, fall Installation,
fall
1998 spring,
fall
spring, fall spring, fall
1999 spring,
fall
spring, fall spring, fall
2000 none none none
20019 spring,
fall
spring, fall spring, fall Heron, Sunrise,
Sunset,
Muldrow,
Kahiltna,
Polychrome
Muldrow Muldrow,
Tokositna
Lacuna,
Tokositna
Upper
Muldrow
200210 spring,
fall
spring, fall spring,, fall Cantwell,
Middle Fork
Toklat
SE Kahilna,
Middle Fork
Toklat,
Polychrome
Ruth,
Muldrow,
Brooks
Middle
Muldrow
1 Surveying of index site on the Kahiltna Glacier. 2 Surveying of stake net on the East Fork Toklat Glacier. 3 Surveying of stake net on the East Fork Toklat Glacier. 4 Terminus surveys involve a detailed survey of the terminal position of the glacier. 5 Longitudinal surveys involve a detailed survey of the centerline of the glacier, allowing for general volume change calculations. 6 Movement surveys involve a precise survey of movement targets over a known time period in order to determine flow characteristics of a glacier. 7 Surge monitoring includes surveying, photo-documentation, stream monitoring, and any other related characteristics that can be recorded before, during, or after a glacier surge. 8 Photo documentation may be at surveyed photo-points, through oblique aerial photography, or re-occupying approximate locations of historical photos. 9 Additional Monitoring: Glacier landforms mapping on eleven glaciers, glacier invertebrate survey, temperature loggers installed at index sites. 10 Additional Monitoring: Radar depth measurements on East Fork Toklat, Southeast Kahilna, Muldrow. Water level meter installed on Muldrow outflow

10
Data Collection, Entry, and Quality Assurance Index and benchmark monitoring data are collected through detailed survey techniques and snow
depth and density measurements outlined in detail in Mayo (2001). From 1991-2001 surveys were
performed with conventional equipment using the resection technique. Beginning in 2001 surveys
were performed with differential Geographic Positioning System (GPS) equipment. Survey data are
recorded digitally and processed using Ashtech Solutions software. Snow data are collected manually
with standard USDA snow sampling equipment and recorded in a notebook. Both data sets are then
input to the reduction program using a graphic user interface that includes acceptable limits for each
field and flags potential erroneous entries.
Longitudinal, movement and terminus surveys are all performed using electronic equipment and data
are processed, reviewed, and stored without the potential for human interference.
Photo documentation is performed with a standard digital camera and notebook. It is expected that
data from the notebook, including photo location and orientation, will be input to the Extensis
Portfolio database.
Metadata Description of the complete NPS Dataset Catalog and Metadata File can be found on the attached
CD.
Data Synthesis and Analysis Data are analyzed annually, but due to the long-term approach of the monitoring, professionally
acceptable synthesis reports require many years of data (at least 10). Roush and Brease (1998)
provides a full summary of data from 1991-1997. The data also help affiliated research such as Arendt
and others (2002). An abstract of the compiled data has been accepted to the 2003 Annual Meeting of
the Geological Society of America and a technical report of data through 2003 is expected to be
prepared in 2004.
Results and Discussion The glacier monitoring program is one of the longest data sets encompassed by the LTEM program.
There are many data streams that are currently being reduced and stored in efficient data structures.
The next obvious action will be to integrate the multiple structures into an all-inclusive data structure,

11
allowing users to easily access reduced data, reduction methods, and result summaries. This is
currently being done to each of the individual components, after which it will be rolled-up into one
database that should be publicly accessible.
Reporting A data summary was produced in 1998 (Roush and Brease 1998) and will be completed again in 2004.
Annual, internal interim reports are produced that included data collected and subjective observations,
methodology refinements, and data summaries.
Literature Cited Arendt, Anthony A., Echelmeyer, Keith A., Harrison, William D., Lingle, Craig S., Valentine,
Virginia B., 2002, Rapid wastage of Alaska glaciers and their contribution to rising sea level, July
19, 2002, v. 297, pp. 382-386.
Mayo, Larry, 2001, Manual for Monitoring Glacier Responses to Climate at Denali National Park,
Alaska, Using the Index Site Method, camera-ready version with disks, 68 pages.
Roush and Brease 1998, 1991-1997 Glacier Monitoring, Denali National Park and Preserve, 33 pages.

12

13
Snow Monitoring
Pam Sousanes, Denali National Park and Preserve
Introduction Denali National Park & Preserve consists of six million acres with the highest peaks of the Alaska
Range arcing east-west creating two major climate regimes within it’s boundaries, a transitional
maritime climate to the south and a continental interior climate to the north. In the winter months most
of the precipitation falls as snow on the south side of the Alaska Range true to the transitional
maritime climate. The north side of the range receives snow, but usually not as much and is usually
less dense. The snow surveys are a good indicator of variation in winter precipitation from the
northern to the southern extents of the Park.
In cooperation with the U.S. Department of Agriculture Natural Resources Conservation Service
(NRCS), snow data were collected on a monthly basis at Denali National Park and Preserve from
November through April at thirteen sites in and around the park. Six of these sites are snow courses,
requiring ground measurements, and seven are aerial markers. The information collected for the snow
surveys includes snow depth, length of snow core, and sample weight. Snow density and snow water
equivalent (SWE) are calculated from the collected data. Aerial surveys are conducted for sites that
have no appropriate fixed wing landing area nearby. For the aerial surveys the snow depth is recorded
and density is calculated using data from the nearest site.
Purpose of Snow Data
The objectives of the snow survey are to efficiently obtain, manage, and disseminate high quality
information on snow, water, climate, and hydrologic conditions.
The specific park objectives are:
• To continue to provide snow data to the NRCS statewide network.
• To continue to provide data to park scientists and management and to outside researchers for
numerous projects spanning from maintenance to research.
14
• To determine, through the addition of data points, the spatial and temporal variation of snowcover
parkwide.
• To better understand the key relationships between snow cover patterns and the physical and
ecological ecosystems within the park.
• To characterize the snowpack of areas within Denali National Park and Preserve frequently used
by snowmobilers, and to determine whether a definition of adequate snow cover could be
developed for Denali that would help park managers decide when an area should be opened/closed
for snowmobiling.
Figure 1. Map of snow course and snow marker locations in Denali. Location of Snow Courses and Aerial Markers The six snow courses are located on the north side of the Alaska Range at Kantishna, Minchumina,
Purkeypile, Stampede, Lower Rock Creek Ridge and Upper Rock Creek Ridge (Figure 1). The seven
aerial snow markers are located on the south side of the range at Eldridge Glacier, Tokositna River,
Dutch Hills, Ramsdyke Creek, Nugget Bench, Chelatna Lake, and Yentna. Additional sites in the
Broad Pass Area
Stampede

15
Broad Pass area and the Stampede Road Corridor are sampled using standard NRCS snow survey
methods to determine whether the snow depth and density is adequate for snow mobile use in areas
popular with recreational users.
Database Design and Parameterization
Database Design The data are gathered at the park and sent to the NRCS for compilation and dissemination on a
statewide basis. All data are archived with NRCS. The NRCS has operated the Federal-State-Private
Cooperative Snow Surveys in the Western United States since 1935. Initially over 2000 snow courses
were established to collect information on mountain snowpack, which provides over 75 percent of the
West’s water supply. The current network consists of approximately 800 active snow courses. Data is
available via the Internet at http://www.ak.nrcs.usda.gov/Snow/snowsites.html. Data is also archived
at the park in an Excel spreadsheet for compilation and summary work for park reporting. The data is
imported from the NRCS web site.
Parameters Snow Course The parameters that are measured at the snow courses include snow depth and snow core length and
weight. From these measurements snow density and snow water equivalent are calculated.
Aerial Snow Marker Snow depth is the only parameter recorded for these sites. Snow density and snow water equivalent
are calculated based on information collected at the nearest snow course.
Data Collection, Entry, and Quality Assurance
Snow Courses Snow courses are permanently marked locations where snow depth and snow water equivalent are
measured. Most snow courses consist of five to ten sample points. The snow courses in Denali all have
five sample points. Individual measurements are averaged to derive one value of snow depth and SWE
for each course. A Carpenter snow tube is used to take the snow depth measurements at the snow
courses. Measurements are recorded on a “Snow Survey Notes” standard form SCS-ENG-708

16
provided by the NRCS. The data is recorded and then verified in the field. If a number is out of range
the point will be sampled again for verification. Ancillary data collected on the form includes state,
drainage basin, sampler, note taker, start time, end time, date, time, and sampling conditions at site.
Back in the office snow density and snow water equivalent is obtained by using the density
determination chart in the form notebook. The data sheet is photocopied and faxed immediately to the
data collection officer at NRCS. The original data sheets are then mailed to the NRCS office in
Anchorage and a paper copy is kept on file at the park. The data is entered from the NRCS web site
into the Excel spreadsheet after the winter season and verified with the paper copies at the park.
Aerial Markers Aerial markers are ten to twelve foot posts with horizontal slats affixed every foot. The snow depth is
obtained by flying in a fixed-wing aircraft past the markers at low altitude and reading the height of
the snow on the marker. Measurements are recorded on an “Aerial Marker Readings” standard form
SCS-ENG-166 provided by the NRCS. To ensure an accurate readings multiple passes are made
passed the marker to verify the measurement. Ancillary data recorded on the data sheet includes state,
drainage basin, observer, date, flying conditions, visibility, weather, and time. The data sheet is
photocopied and faxed immediately to the data collection officer at NRCS. The original data sheets are
then mailed to the NRCS office in Anchorage and a paper copy is kept on file at the park. The data is
entered from the NRCS web site into the Excel spreadsheet after the winter season and verified with
the paper copies at the park. Data QA/QC occurs during the sampling event as well as in the office
prior to mailing the data sheets. NRCS has their own QA/QC in place before the data is disseminated
to the public via the Internet.
Metadata We have provided a CD at the end of this report that has a complete description of the NPS Dataset
Catalog and Metadata File.
Data Synthesis and Analysis The snow survey data is summarized in annual reports either as a stand-alone report or as part of the
annual climate summary. NRCS also publishes Monthly Basin Outlooks for the state of Alaska that
includes data from the thirteen sites in and around DNP&P. The data is also available via the Internet.
Reports are on file for the determination of adequate snow for 1999-2001. Please see the Chapter II
Snow Monitoring Synthesis report for a list of relevant documents.

17
Conclusions The cooperation between the National Park Service and the Natural Resources Conservation Service
on snow monitoring has been successful for over 10 years at Denali. Both agencies benefit from the
collection and dissemination of the data. Because the protocols are standard for the entire western
region, data quality and comparability can be assured for the entire state. These data are available from
parks across the state which enables simple correlation among sites due to shared protocols – this is an
extremely valuable tool as we move ahead and look toward network ecosystem processes not limited
by park boundaries.

18

19
Weather Monitoring
Pam Sousanes, Denali National Park and Preserve
Introduction
Climate in Denali The climate of Denali National Park and Preserve is characterized by great spatial variability, and
includes both transitional maritime (influenced by the ocean) and continental (influenced by the
Alaska Range) climate subtypes. On the north side of the range, where park headquarters is located,
temperatures are typical of a continental climate with strong seasonal variations. There is also less
precipitation on the north side because of its location on the windward side of a major mountain range.
The maritime climate on the south side of the Alaska Range is influenced by the prevailing weather
patterns of the Gulf of Alaska, with milder air temperatures with less seasonal variation and more
precipitation.
There are currently 14 climate stations in and around Denali National Park and Preserve that are
generating data. Twelve of these sites are automated (Seven LTEM Stations, Four Remote Automated
Weather Stations-RAWS, and one Air Quality Station) and record hourly readings. Different programs
and networks are responsible for the different types of automated stations in the park, but all of the
data are archived in the same location as part of LTEM. The data from the three National Weather
Service (NWS) manual stations are also archived as part of LTEM.
Purpose of Climate Data The overall purpose of climate monitoring in Denali is to gather data in support of the numerous
research and monitoring efforts. Specific objectives include:
• Providing meteorological data for real time applications in park operations, including fire
management, mountain safety, aviation safety, and road maintenance.
• Collect data that can be used to determine how average climatic conditions vary throughout the
park.
• Provide a system of instruments that can be used to generally characterize climatic conditions
across the entire park.

20
Database Design and Parameterization Design The data from the early years of climate monitoring (1993-1995) were stored in files on a dedicated
LTEM computer that was backed up regularly. After 1996, these data were transferred to a physical
science technician computer where it was stored in raw data format and then compiled using MS Excel
– the data were backed up regularly on tapes. In 2000, a Microsoft Access database was designed for
all of the climate data collected in the park. As of 2003, all data are being entered into the Access
database. This database is backed up on a monthly basis in CD format. Data from the NWS
cooperative climate stations and RAWS site are also archived at the Western Regional Climate Center
(WRCC) and the National Climatic Data Center (NCDC).
Parameters The parameters that are measured at the climate stations include air temperature, relative humidity,
wind speed, wind direction, and precipitation. In addition to these variables there are certain stations
that measure solar radiation, barometric pressure and evaporation. Table 2 lists the parameters
measured at each station and Table 3 lists the instrumentation, units and recording interval.
Table 2. Weather Station Parameters
Station
Air Temp
Relative Humidity
Wind and Speed
Direction
Precip Barometric Pressure
Evapo Solar Radiation
NWS - Headquarters ▪ ▪ ▪ Eielson Visitor Center ▪ ▪ Wonder Lake ▪ ▪ Air Quality ▪ ▪ ▪ ▪ ▪ LTEM Rock Creek -Permafrost
▪ ▪ ▪ ▪
Forest ▪ ▪ ▪ ▪ Treeline ▪ ▪ ▪ ▪ Lower Ridge ▪ ▪ ▪ ▪ ▪ ▪ UpperRidge ▪ ▪ ▪ ▪ RAWS - Wonder Lake ▪ ▪ ▪ ▪ Minchumina ▪ ▪ ▪ ▪ McKinley River ▪ ▪ ▪ ▪ Ruth Glacier ▪ ▪ ▪ ▪ Stampede ▪ ▪ ▪ ▪ ▪ Dunkle Hills ▪ ▪ ▪ ▪ ▪

21
Table 3. Meteorological Instrumentation
Parameters Instruments Units Sampling Frequency Remarks
Air Temperature Relative Humidity/ Dew Point
Vaisala HMP35C or HMP45C Temperature/RH Probe
°C and % Avg/min/max stored hourly Sensor housed inside 12-plate gill radiation shield 2 m above ground level
Phys-Chem 107 Temperature/RH Probe
°C Avg/min/max stored hourly Same as above; replaced with HMP35C 7/14/94 (LR), 7/29/94 (UR)
Climatronics 100087 Temp Sensor, 100089 Dew Point Sensor
°C Averages stored hourly Aspirated sensor, 2 m above ground level
NWS Liquid-in-Glass Minimum and Maximum Thermometers
°F Manual, min/max collected daily
2 m above ground level
Wind Speed Wind Direction
RM Young Wind Monitor ° and m/s Mean horiz WS, unit vector mean WD, max WS, max WS direction stored hourly
3 m above ground level 10 m above ground level
Climatronics F460 Anemometer and Wind Vane
° and m/s Averages stored hourly 9 m above ground level
Barometric Pressure Vaisala PTA427 BP Transducer
millibars Averages stored hourly
Solar Radiation Li-Cor LI-200X Pyranometer Sensor
W/m² Averages stored hourly 2 m above ground level 3 m above ground level
Precipitation Sierra-Misco 2502 Tipping Bucket
mm Hourly totals stored hourly Collected when temps are mostly >0°C (6/1/94-9/30/94)
Climatronics 100508 Heated Tipping Bucket
mm Hourly totals stored hourly Heated tipping bucket, collected year-round
Belfort B5-780 Universal Weighing-Type Rain Gauge
In. Continuous strip chart Precipitation/event recorder, collected year-round
NWS Standard Eight-Inch Non-Recording Rain Gauge
In. Manual, total measured daily Collected year-round
Evaporation NWS Standard Evaporation Pan
In. Manual, measurements taken daily
Collected when temps are reliably >0°C (6/1/94-9/5/94)
*PF=Permafrost, FO=Forest, TL=Treeline, LR=Lower Ridge, UR=Upper Ridge, AQ=Air Quality, HQ=Headquarters

22
Data Collection, Entry, and Quality Assurance The Weather Monitoring Protocol (1997) provides more detailed information about the
equipment used, methods of data collection, and archiving of data (NPS 1997).
Rock Creek Weather Stations Campbell Scientific 21X data loggers are used for data collection at each of the five
stations established in Rock Creek in 1993. Measurements are taken at 60-second
intervals and recorded every hour. Programming within the data logger corrects negative
values for solar radiation and values greater than 100 for relative humidity. These data
are then stored on an external storage module. The storage modules are swapped out
monthly, and the data are downloaded into a computer. A cursory check of all data is
made to insure sensor functionality. The data are then imported into an Access database
where basic queries are run to compilation and summary reports. The data are archived in
this database and backed up regularly in multiple copies. The raw data in text format are
also kept and backed up in a separate file.
At the Air Quality site meteorological data are stored hourly on a SumX SX445 data
logger which can be accessed remotely via modem The data from this station are
available on the Internet at http://www.epa.gov/castnet/metdata. The data from this site
are also archived at the park at two locations.
National Weather Station Cooperative Station Data from this station are recorded daily on an NWS standard form WS B-92 data sheet
which is mailed to the National Weather Service each month and archived with the
National Climatic Data Center. These data sheets are taken by the physical science staff
and entered into the climate database following the data entry, data verification, and data
validation guidelines provided in the Data Management Protocols for Denali National
Park and Preserve (NPS, 1997). There are data validation fields built into the database to
record errors in data entry and a comment field to describe validation corrections. For
example if a number was entered wrong a “1” would be inserted in the verification field
and a description of the error would appear in the comment field.

23
Manual Stations Parkwide The data from the National Weather Service manual stations at Eielson Visitor Center
and Wonder Lake are handled in the same way as the headquarters data. These stations
are only run in the summer months from early June to mid September. The data are
recorded on the standard data form from NWS and entered into the climate database the
same way as the headquarters data.
Remote Automated Weather Stations The data loggers at these sites are either Handar 545 Data Collection Platforms or Forest
Technology Systems, Inc. data loggers. The data are recorded hourly and sent via GOES
High Data Rate satellite transmitter to Wallops Island, Virginia where the data can be
accessed by the Bureau of Land Management National Interagency Fire Management
Center (NIFC) in Boise, Idaho. The data from the RAWS stations are managed BLM and
archived with the WRCC. NIFC has a watchdog system in place for QA/QC with alert
messages going out to the station manager when a value appears wrong. The data are
available via the Internet at http://www.raws.dri.edu. The data are also archived by the
U.S. Forest Service Weather Information System (WIMS) and at the park in the climate
database.
New LTEM Stations Campbell Scientific CR10X-2m extended temperature data loggers are used on the two
new sites installed in 2002. The data from these stations are transmitted hourly via GOES
High Data Rate satellite transmitter to Wallops Island, Virginia. From there the data can
be accessed near real-time via Internet for up to 72 hours. The data are archived in the
climate database from the data logger however, due to the fact that data may not be
transmitted for any number of reasons through Wallops Island, but the hourly data are
recorded and stored on the data logger ensuring a complete record.
Metadata We have provided a CD at the end of this report that has a complete description of the
NPS Dataset Catalog and Metadata File.

24
Data Synthesis and Analysis Annual summaries were compiled for climate monitoring in 1994, 1996, 1998, 1999,
2000, and 2001, with a report in progress for 2002. For most of these years, the data from
the Rock Creek network including the NWS headquarters station were compiled and
summary charts and graphs indicating monthly means were presented. An analysis of the
Headquarters data was done in 2000 in concert with a tree ring analysis project in Rock
Creek (Juday, 2000) Reports for the Rock Creek stations include annual summaries, but a
complete analysis of all the data for all years of record has not been done. The 2001
annual report is the first summary to include a narrative presentation of the data as well as
summary charts and graphs. These data have been used to support a multitude of other
research projects in the park. However, meaningful climatic trend analysis will require a
substantially longer period of record.
Another vitally important aspect of the climate data is the public’s interest in the
information. Climate data have been used in a variety of different educational and public
outreach opportunities. Presentation of the LTEM climate monitoring program has been
given for a variety of professional conferences, informal presentations, and school
groups. Relevant documents can be found in the Chapter II Climate Monitoring Synthesis
Report
Conclusions It has been challenging to integrate all of the various types of climate data collected at
Denali National Park into one cohesive database. The protocols and data collection vary
depending on the project that the station is associated with and the corresponding type
and interval of collection. The LTEM climate monitoring component started with two
initial climate stations in 1993 and in ten years has expanded to include data collected
from fifteen stations. The Access database created in 2000 is a means of organizing the
plethora of data into one place. This database cannot remain static however; it must
evolve and change with the times.
Because these automated stations use external storage modules, real time information is
not available. There are many holes in the dataset from the Rock Creek stations due to a
number of issues. The first being that the stations are automated but do not transmit real

25
time data, and provide no indication of problems unless the site is visited. These sites are
visited monthly, but if a problem occurs within the month there will be a resulting gap in
the data. Winter maintenance in general is more difficult. Access to the sites in the winter
is by skis or snowshoes, and temperatures lower than –23°C generally delay the
maintenance schedule.
As part of the Central Alaska Network (CAKN), we are working on streamlining data
transfer between climate stations and a user interface available on the web that would be
available to the public. We are also working on an agreement with WRCC for archiving
procedures, and researching robust data quality and assurance techniques. New concepts
and designs that are developed for CAKN will include the existing stations at Denali - as
well as the existing stations at Wrangell-St. Elias National Park and Preserve and Yukon-
Charley Rivers National Preserve.
Literature Cited Juday, G.P. 2000. Recent climate and forest history of the Denali National
Park and Preserve Headquarters area, based on tree ring analysis. Agricultural and
Forestry Experiment Station. University of Alaska Fairbanks. Report to U.S.
Geological Survey Biological Research Division. 26 pp.+ figures.
National Park Service. 1997. Weather Monitoring Handbook. Denali National
Park and Preserve, Alaska. 22pp.
National Park Service. 1997. Data Management Protocol. Denali National Park
and Preserve. 44 pp.

26

27
Air Quality Andrea Blakesley, Denali National Park and Preserve
Introduction Long term monitoring of airborne contaminants in Denali is conducted through various
nationwide interagency and National Park Service air quality monitoring networks. Data
management, like all other aspects of network operations, is overseen by network
personnel. Each monitoring network is responsible for validating, archiving, reporting
and distributing data to the public.
Chemical and meteorological data are either recorded onto dataloggers on site and
automatically downloaded remotely by network personnel, or are the result of laboratory
analyses. With the exception of pH and conductivity measurements taken on a subset of
precipitation samples before the samples are shipped from the park, all analyses are
conducted by network operated or network contracted laboratories.
Database Design and Parameterization Data are archived separately by each nationwide monitoring network, and can be
downloaded or requested from the network sites on the internet. The permanent archival
databases are designed by network data managers. The following table lists the
parameters measured through each monitoring network.
28
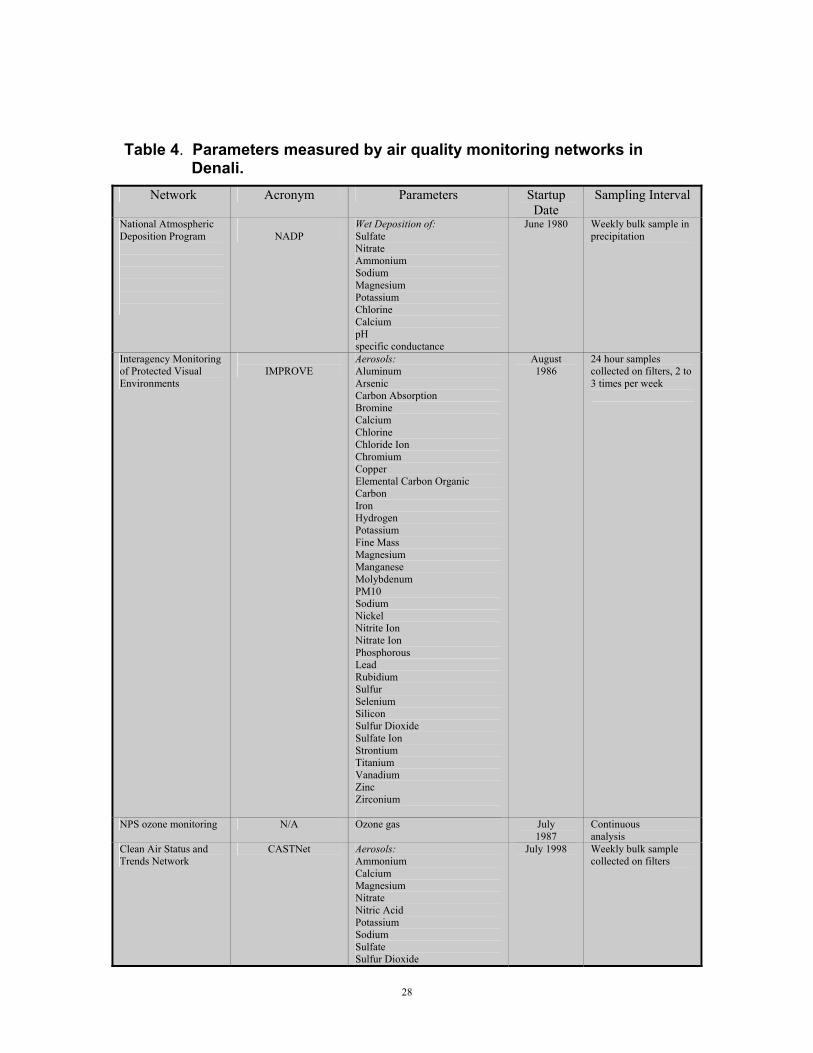
Table 4. Parameters measured by air quality monitoring networks in Denali.
Network Acronym Parameters Startup Date
Sampling Interval
National Atmospheric Deposition Program
NADP
Wet Deposition of: Sulfate Nitrate Ammonium Sodium Magnesium Potassium Chlorine Calcium pH specific conductance
June 1980 Weekly bulk sample in precipitation
Interagency Monitoring of Protected Visual Environments
IMPROVE
Aerosols: Aluminum Arsenic Carbon Absorption Bromine Calcium Chlorine Chloride Ion Chromium Copper Elemental Carbon Organic Carbon Iron Hydrogen Potassium Fine Mass Magnesium Manganese Molybdenum PM10 Sodium Nickel Nitrite Ion Nitrate Ion Phosphorous Lead Rubidium Sulfur Selenium Silicon Sulfur Dioxide Sulfate Ion Strontium Titanium Vanadium Zinc Zirconium
August 1986
24 hour samples collected on filters, 2 to 3 times per week
NPS ozone monitoring N/A Ozone gas July 1987
Continuous analysis
Clean Air Status and Trends Network
CASTNet Aerosols: Ammonium Calcium Magnesium Nitrate Nitric Acid Potassium Sodium Sulfate Sulfur Dioxide
July 1998 Weekly bulk sample collected on filters

29
Data Collection, Entry, and Quality Assurance The nationwide monitoring networks operate under quality assurance plans which are
approved by the respective interagency network steering committees. The NPS ozone
monitoring network follows EPA regulatory requirements for data collection and
validation.
Gaseous ozone is the only chemical parameter measured directly on site. The ozone
analyzer, which is calibrated on site nightly and audited twice a year, writes data
continuously to an on-site datalogger. Hourly averages are stored on the datalogger and
downloaded automatically each night by network data contractors in Colorado. On
weekdays, data from each ozone monitoring site are inspected by the data managers for
obvious anomalies and acceptable calibration results, and if a data quality problem is
discovered, the contractors will contact personnel on site to address the concern. Once a
month, there is a data review meeting among the data contractors, NPS Air Resources
Division staff, and network technical support staff to validate the previous month’s data.
The CASTNet and IMPROVE networks collect air samples on filters, which are analyzed
by network operated or network contracted laboratories. On-site numerical data
collection consists of air flow rate and elapsed sample time data recorded continuously
during sampling. Backup records of elapsed sample time and beginning and ending flow
rates are written on data sheets, which are shipped to the network laboratories along with
the exposed filters. IMPROVE data storage cards are also included in the filter shipment.
CASTNet flow data are recorded on the ozone datalogger, and are collected and validated
by ozone data contractors. Analytical data are validated by the networks before being
released.
The National Atmospheric Deposition Program instruments collect weekly precipitation
samples and measure precipitation amounts. When there is sufficient precipitation for
subsamples to be taken for field analyses, pH and specific conductance are measured

30
before the sample is shipped to the analytical laboratory. Field results are written on data
sheets and sent to the network laboratory along with the remainder of the sample.
Network personnel validate the data according to their quality assurance and quality
control plans. Once a year, audit samples are sent to the sites then back to the laboratory
to challenge the accuracy of field and laboratory analyses.
Metadata Metadata is available for each monitoring network, in formats specific to each network.
These can be downloaded from the internet along with the data files, at the following web
sites:
• NADP
http://nadp.sws.uiuc.edu/
• IMPROVE
http://vista.cira.colostate.edu/improve/
• NPS ozone monitoring
http://www2.nature.nps.gov/ard/gas/
• CASTNet
http://www.epa.gov/castnet/
Data Synthesis and Analysis Plan Data are analyzed, summarized and reported by each monitoring network. The
IMPROVE network publishes data synthesis reports once every three years, and the other
networks produce annual data summaries. Spatial and temporal trends are reported to
varying degrees by the networks, with an emphasis on trends in the contiguous 48 states.
In 2002 the NPS Air Resources Division published Air Quality in the National Parks, a
comprehensive overview of nationwide air quality, incorporating data from each
monitoring network.
Preliminary analyses conducted by park staff with assistance from a contracted
statistician helped define the seasonal patterns of airborne contaminant occurrence in
Denali, which closely match those reported for international transport of contaminants
into the arctic and subarctic. We plan to continue analyzing the data from a regional
31
perspective, to supplement the nationwide analyses that are being conducted by each
monitoring network.
Conclusion The airborne contaminant data collected as part of the Denali long term ecological
monitoring program are collected, validated, archived and distributed in a professional
manner through interagency partnerships. Each monitoring network produces and
follows stringent quality assurance plans to ensure permanent archival of high quality
airborne contaminant data. Park staff contribute to this effort by maintaining high
standards of data quality and data collection efficiency.
Literature Cited Malm, William C. et al. 2000. Spatial and Seasonal Patterns and Temporal Variability of
Haze and its Constituents in the United States: Report III.
National Atmospheric Deposition Program. 2002. National Atmospheric Deposition
Program 2001 Annual Summary. NADP Data Report 2002-01. Illinois State
Water Survey, Champaign, IL.
National Park Service Air Resources Division. 2002. Air quality in the national parks,
second edition.
National Park Service Air Resources Division. 2003. Annual Data Summary, Denali
National Park, 2002, National Park Service Gaseous Air Pollutant Monitoring
Network.
Rothert, Jane et al. 2002. Quality Assurance Plan, Version 1.3, August 21, 2002, National
Atmospheric Deposition Program, Central Analytical Laboratory.
Sisler, James F. et al. 1996. Spatial and Seasonal Patterns and Long Term Variability of
the Composition of the Haze in the United States: An Analysis of Data from the
IMPROVE Network, 1996.
Sisler, James F. et al. 1993. Spatial and Temporal Patterns and the Chemical Composition
of the Haze in the United States: An Analysis of Data from the IMPROVE
Network, 1988-1991.
U.S. Environmental Protection Agency. 2002. Clean Air Status and Trends Network
(CASTNet) 2001 Annual Report.

32
U.S. Environmental Protection Agency. 2003. Clean Air Status and Trends Network
(CASTNet) Quality Assurance Project Plan.
33
Soils Monitoring Ken Karle, Hydraulic Mapping and Modeling
Introduction Soil properties are the result of interactions among atmosphere, biosphere, and
lithosphere. Soils function not only as water-nutrient life media but also as redistributors
and regulators of most of the important fluxes of matter and energy. Soil properties are
also sensitive to environmental changes over time. Therefore, a soils component was
proposed for implementation in the Denali LTEM program. Soil studies were initiated
in one watershed, near Park Headquarters. Rock Creek was selected as the initial study
watershed because of several reasons, described elsewhere in this report. Soil inventories
were eventually expanded into other areas of the park, though intensive soil monitoring
was constrained to the Rock Creek watershed.
The initial soils study in the Rock Creek watershed was conducted by the SCS. This
study consisted of two elements: (1) a baseline geographic inventory of existing soils and
accessory properties across the Rock Creek watershed, and (2) detailed soil descriptions
and characterizations of soil at four individual sites.
The second component of the soil monitoring plan involved the establishment of long-
term monitoring sites, and was directed by Dr. Chien-Lu Ping of the University of
Alaska. Four sites were selected for long-term soils monitoring in the Rock Creek
watershed. Primary objectives at each site were to: 1) quantify micro-climatic
conditions, 2) compare environmental conditions between sites, and 3) identify and
monitor indicators of environmental change (Ping, 1993).
Finally, a parkwide soils inventory was conducted by NRCS. Soil delineations were
made using stereoscopic photo-interpretation of color infrared photography. Validation
of these delineations was performed by collecting field data within selected study sites

34
throughout the Park. Data collected at each transect stop included landform and site
properties, soil profile characteristics, and plant community data. Field work was
conducted between May 1997 and September 2001.
Database Design and Parameterization Separate databases were utilized for each of the three components described above. The
database for the SCS soil survey investigation of the Rock Creek watershed was
established and maintained by SCS staff. Sampled parameters included in that database
included soil types, soil properties (texture, thickness, depth, permeability, available
water capacity, gradation), and soil pH. Other parameters noted for each study site
included vegetation cover type, dominant vegetation, landform position, shape, runoff,
drainage, and slope (Moore, 1993).
For the intensive long-term soils monitoring program, an in-park database was
established. Data were maintained in ASCII or Excel files on the desktop computers of
various project personnel, until being transferred into the LTEM Access database in
2000. Instrumentation of the soils sites was begun during the summer of 1993 by Greg
Probst, a graduate student working at UAF. Soil parameters sampled at each study site
included soil temperatures, soil matrix potential, soil redox potential, depth to permafrost
(only at the Permafrost Site), and CO2 and CH4 emissions (Probst, NPS files, 1995). In
addition, a three-meter tower was erected at each soil monitoring site, and standard
meteorological parameters (air temperature, relative humidity, wind speed) were
measured and recorded.
The parkwide soil survey by NRCS was initiated by conducting soil delineations using
stereoscopic photo-interpretation of color infrared aerial photography (dated 7/80 through
82; nominal scale 1:60,000). Validation of these delineations was performed by
collecting field data within selected study sites throughout the Park. Study sites were
selected to represent typical landscape patterns and conditions within broader geographic
and physiographic units. Data collected at each transect stop included landform and site
properties, soil profile characteristics, and plant community data.

35
Data Collection, Entry, and Quality Assurance For the SCS soil survey of Rock Creek watershed, soils were examined in the field during
July 12-17, 1992, with a shovel and hand auger. Holes to a depth of one meter were dug
along transects that crossed major landforms, and notes about soil properties, landform,
and vegetation were taken at each hole. Additional soil descriptions and soil samples
were obtained at four representative sites during August 17-20, 1992. Laboratory
analysis was completed by the National Soils Laboratory (SCS) in Lincoln, Nebraska.
All field methods, soil descriptions, and classifications were done according to standard
USDA procedures; vegetation was described according to the Alaska vegetation
classification system (Viereck et al., 1992).
Data were collected for the long-term monitoring effort through the use of specialized
instrumentation installed at the four study sites. Soil parameters sampled at each study
site included: soil temperatures measured hourly (generally at depths of 2.5, 5, 10, 20, 50
and 100 cm) using thermocouples, soil matrix potential measured daily (at depths of 20,
50, 75, and 100 cm) using synthetic soil moisture blocks, and soil redox potential,
measured with Jensen's platinum-electrode at 2.5, 10, 20, and 50 cm depth from the soil
surface weekly and more frequently after rains, and recorded with Jensen's ORP meter
with reference electrode. All data were collected using Campbell Scientific 21X
dataloggers; data from these sites were periodically transferred from field storage
modules to the program computer database. None of the soil sensors have been
maintained since 1996. Though all generated data continued to be logged and stored,
most soil sensors have gradually ceased to function over the intervening years, and are
not being replaced or repaired as they fail. The meteorological sensors, however, are still
maintained at all but the Alpine Tundra site, and these continue to gather good data.
The NRCS parkwide soil survey delineated soil units from color infrared aerial
photograph using a combination of stereoscopic photo-interpretation and field transects.
Polygon boundaries were based on observed patterns and relationships of landforms,
soils, and vegetation. Linework was then transferred to registered mylar overlays on
orthophoto quads (scale 1:63,360) for scanning, digitizing, and georeferencing.

36
Preliminary digital data files were checked against corresponding orthophotos and aerial
photographs for accuracy of line placement. Polygons were attributed with soil map unit
symbols. To help validate line placement and document resource properties and
conditions represented by the polygons, field data were collected within selected study
sites throughout the Park. Study sites were selected to represent typical landscape
patterns and conditions within broader geographic and physiographic units. All polygons
in the study sites were transected. Data collected at each transect stop included landform
and site properties, soil profile characteristics, plant community data, and UTM
coordinates. Field data were entered into the NRCS Alaska Soil Survey Field Database
for management and analysis. Map unit composite data were entered into the National
Soil Information System (NASIS). Composite data include the kind and proportionate
extent of soil components and a variety of site, soil, and vegetation properties. Selected
NASIS data were extracted and included as attribute data with this digital data set.
Metadata We have provided a CD at the end of this report that has a complete description of the
NPS Dataset Catalog and Metadata File.
Data Synthesis and Analysis Plan The following list provides examples of what has been done with data from this study.
• Detailed soil map, soil description, genesis, and landscape settings of the Rock
Creek watershed (Moore, 1993).
• Discussion of soils-plant-climate relationships in Rock Creek, and potential for
extrapolation to other landscapes (Thorsteinson and Taylor, 1997).
• Research involving the effect of soil and stream water quality on primary
productivity in Rock Creek by examining the relationship between soil water
chemistry and nutrient levels (Popovics, 1999).
• Park-wide soils map (NRCS, in press).

37
Conclusions Soil data collected at the four intensive monitoring sites in the Rock Creek watershed
subsequent to 1994 have not yet been compiled or analyzed, and a report on findings or
trends has not been produced. Additionally, soil sensors have been gradually failing, and
collected data for the past several years may be faulty. However, an extensive database
now exists, and could provide valuable information for others considering long-term
monitoring of soil processes. Additionally, a comparison and analysis of the Denali soil
surveys conducted at two levels of scale (watershed and parkwide) should provide
program managers with excellent case studies of how such work can lead to integration
of other ecosystem monitoring and inventory components such as vegetation and wildlife.
Literature Cited Moore, J.P., 1993. Soil survey investigation: Rock Creek watershed, Denali National
Park, Alaska. USDA Soil Conservation Service, Anchorage, Alaska. 45 p.
Popovics, L.M., 1999. The effect of soil and stream water quality on primary and
secondary productivity of Rock Creek, Denali National Park and Preserve. Master’s
thesis, University of Alaska Fairbanks, Fairbanks, Alaska. 99 p.
Thorsteinson, L.K. and D.L. Taylor. 1997. A watershed approach to ecosystem
monitoring in Denali National Park and Preserve, Alaska. Journal of the American
Water Resources Association Vol. 33: 4: 795-810.
Viereck, L.A., C.T. Dyrness, A.R. Batten, and K.J. Wenzlick. 1992. The Alaska
vegetation classification. Gen. Tech. Rep. PNW-GTR-286. Portland, OR: USDA,
Forest Service, Pacific Northwest Research Station. 278 pp.

38

39
Flora Vegetation
Carl Roland, Denali National Park and Preserve
Introduction The initial design of the vegetation monitoring program was carried out at three study
sites arrayed on an elevation gradient within the Rock Creek drainage near park
headquarters (forest, treeline, and tundra). There were three identical replicates at each of
these monitoring sites. Measurements that were performed at these sites included the
following elements:
1) Estimates of percent cover, by species, determined by ocular estimate in a set of
quadrats located within permanent plots (performed twice in 1992-3 and 2000).
This was done in order to monitor any changes in the composition of the
vegetation of the permanent plots over time.
2) Measurements of tree diameter, position and condition within a 25 m by 25 m plot
(performed twice in 1992-3 and in 2000). All trees within these plots were
mapped and measured.
3) A set of six seed traps in each of the forest and treeline replicates (a total of 36
traps which were collected and sorted annually to provide an estimate of seed fall
and viability).
4) Dendrometers were installed on a sample of 23 white spruce trees (5 in each
forest replicate and a total of eight bands in the treeline replicates, where trees are
few and far between). These were read annually to provide an estimate of bole
growth for white spruce on an annual basis.
5) Cone counts were performed on the 23 spruce trees to which dendrometers bands
were affixed in 1992, in order to obtain an estimate of the number of cones
produced per year by white spruce.

40
6) Annual counts of number of berries produced by shrubs in two subplots of each of
the permanent plots. This data acquisition was discontinued in 200 following a
review of the first six years of data
7) Phenology of a group of plant species was tracked on a weekly basis each year, in
order to determine inter-annual variation in the timing of key events in the
development of the vegetation over a summer (such as bud break, flowering and
seed set). This protocol was also discontinued in 2000 after a review of the data.
Due to problems inherent in the original statistical design of the vegetation monitoring
component of LTEM, which are described in detail elsewhere (Roland 1998, Helm and
Roland 1999) few conclusions regarding treeline dynamics outside of the individual plots
themselves are warranted by the data that have been collected during this period of time.
However, we have assembled a useful data set that tracks the inter-annual patterns in the
relative reproductive output of white spruce (cones, seeds, and seed viability) and annual
rates of bole growth in a small sample of trees at two elevation stations: the treeline and
forest sites within the Rock Creek watershed. Because these spruce reproductive
parameters vary over very large spatial scales, the problems inherent in the design of the
initial program are less problematic than for other measured parameters.
Database Design and Parameterization Database Design The most current database that contains the data from the Rock Creek permanent
vegetation plots established under the original vegetation monitoring design was created
by resource trainee and database manager Sharon Kim, under the supervision of the
LTEM Coordinator and GIS Specialist. This is a relational database in MSAccess 2000
software that contains the following data streams: tree size, condition and location
information, plant species cover data from the quadrat observations, annual observations
of cone counts, seed counts and bole growth from dendrometer bands. Earlier MSAccess
databases for the program were created in 1997 by Laura Hudson, a vegetation ecologist
detailee to the Park, and Jim Thorne, LTEM-vegetation biological technician. This
database system consisted of five separate databases with data from each data stream kept

41
separately (tree mapping data, cover data, dendrometer data, seed data, cone count data).
These earlier database editions were combined to form the current database, which has a
relational structure that contains all of these data streams in one database structure
The vegetation database contains eight tables, five for archiving data (species cover, tree
size and position data, seed data, cone data, dendrometer data) and three “reference”
tables with location, sample event and tree identification information. A diagram of this
database structure is on a CD at the end of this report. More detailed summary of the
data acquisition protocols may be found in the protocol document for the original
vegetation monitoring program design (Densmore et al, 1998). I discuss the parameters
contained in these data tables in the following section.
Parameters Tree measurements for all trees within the permanent vegetation plots Trees were mapped at the time that the plots were first installed in 1992-3. the location
of each individual was recorded as an X Y coordinate within the center 25 m x 25 m
interior plots in the forest and treeline replicates. Each tree was measured for its diameter
at breast height and its total height. The species identity and comments regarding
condition of each tree were also recorded. Plot maps based on the location of these trees
were produced for each plot where trees occurred. Table 5 shows the data fields in the
table that was develop to archive the tree data.
Cover measurements for all ground vegetation within the permanent vegetation plots The community composition and dominance of the ground level vegetation was recorded
by the technicians who installed the plots in 1992-3. The methods used were to estimate
the cover of the ground surface for each species in a set of twelve 1 m2 quadrats. Percent
cover of the ground surface by shrubs was estimated in four 4 m2 quadrats in each plot..
There are serious problems with the use of this methodology for long term monitoring,
relating to the potential for large differences among observers. Table 6 shows the data
fields in the table that was develop to archive the species cover data.
42
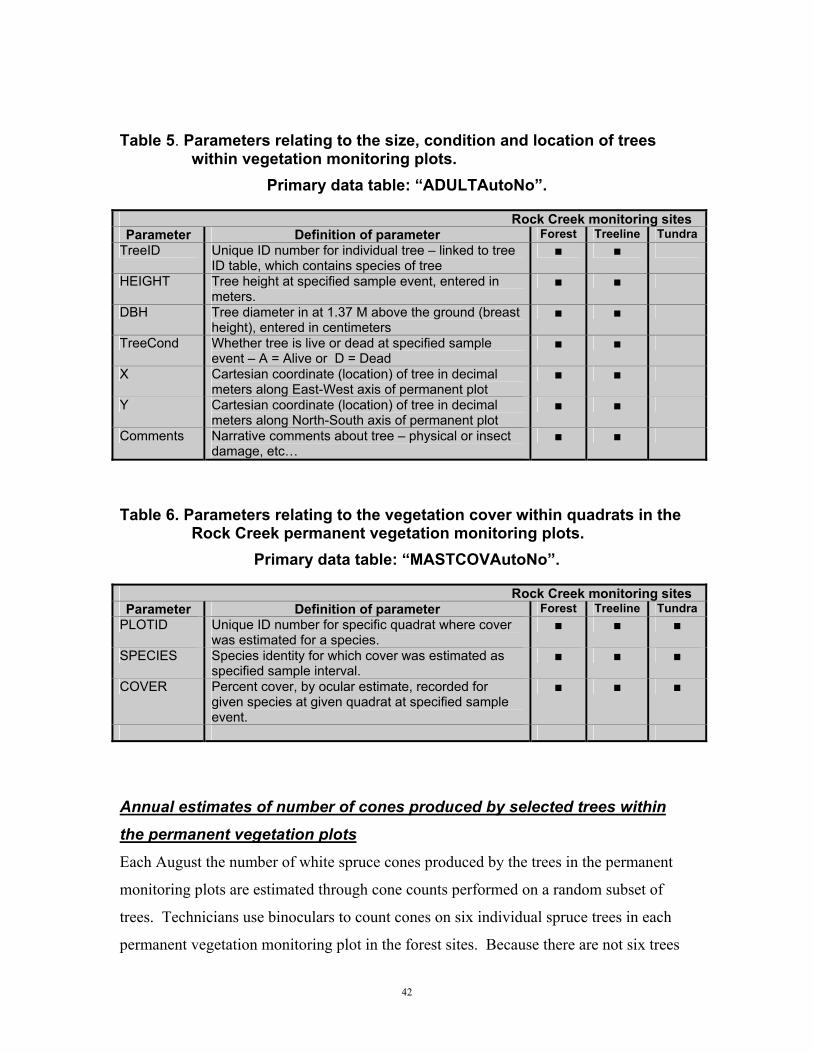
Table 5. Parameters relating to the size, condition and location of trees within vegetation monitoring plots.
Primary data table: “ADULTAutoNo”. Rock Creek monitoring sites Parameter Definition of parameter Forest Treeline Tundra
TreeID Unique ID number for individual tree – linked to tree ID table, which contains species of tree
■ ■
HEIGHT Tree height at specified sample event, entered in meters.
■ ■
DBH Tree diameter in at 1.37 M above the ground (breast height), entered in centimeters
■ ■
TreeCond Whether tree is live or dead at specified sample event – A = Alive or D = Dead
■ ■
X Cartesian coordinate (location) of tree in decimal meters along East-West axis of permanent plot
■ ■
Y Cartesian coordinate (location) of tree in decimal meters along North-South axis of permanent plot
■ ■
Comments Narrative comments about tree – physical or insect damage, etc…
■ ■
Table 6. Parameters relating to the vegetation cover within quadrats in the Rock Creek permanent vegetation monitoring plots.
Primary data table: “MASTCOVAutoNo”.
Rock Creek monitoring sites Parameter Definition of parameter Forest Treeline Tundra
PLOTID Unique ID number for specific quadrat where cover was estimated for a species.
■ ■ ■
SPECIES Species identity for which cover was estimated as specified sample interval.
■ ■ ■
COVER Percent cover, by ocular estimate, recorded for given species at given quadrat at specified sample event.
■ ■ ■
Annual estimates of number of cones produced by selected trees within the permanent vegetation plots Each August the number of white spruce cones produced by the trees in the permanent
monitoring plots are estimated through cone counts performed on a random subset of
trees. Technicians use binoculars to count cones on six individual spruce trees in each
permanent vegetation monitoring plot in the forest sites. Because there are not six trees

43
in the treeline sites, cone counts are performed on all of the trees that occur within the
inner permanent plots in the treeline sites. Table 7 shows the data fields in the table that
was develop to archive the cone count data.
Table 7. Parameters relating to the cone count data within quadrats in the Rock Creek permanent vegetation monitoring plots.
Primary data table: “CONEAutoNum”.
Rock Creek monitoring sites Parameter Definition of parameter Forest Treeline Tundra
TreeID Unique ID number for individual tree – linked to tree ID table, which contains species of tree
■ ■
ConeNumber The number of cones counted for tree at specified sampling interval
■ ■
Color The color of cones counted for tree at specified sampling interval
■ ■
Location/Comments Narrative comments concerning where cone counts were performed in relation to tree (direction and distance).
■ ■
Annual estimates of white spruce seed rain within the permanent vegetation plots We estimate the total white spruce seed rain and number of viable seeds that fall in the
forest and treeline vegetation plots by placing a set of six seed traps out each fall, and
collecting them in early spring. White spruce seeds are sorted from litter and counted.
These seeds are then subjected to carefully controlled germination trials. The number of
seeds that germinate are recorded following these germination trials. Table 8 shows the
data fields in the table that was develop to archive the seed trap and germination data.
44
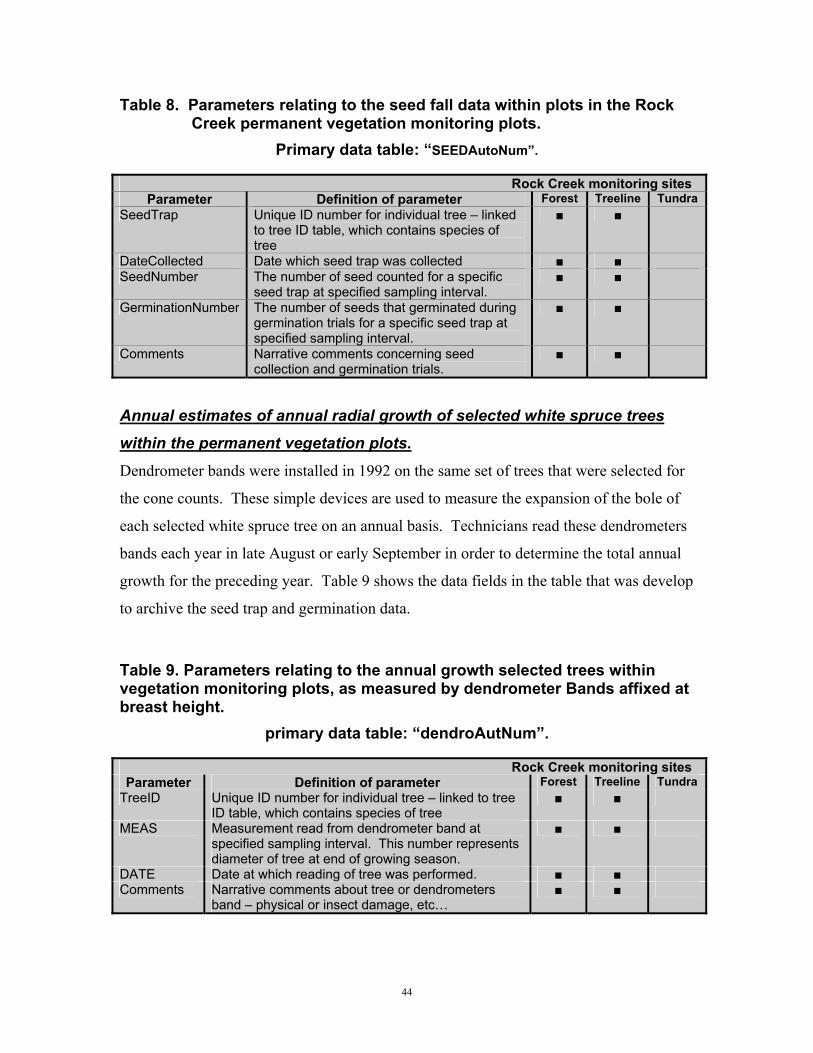
Table 8. Parameters relating to the seed fall data within plots in the Rock Creek permanent vegetation monitoring plots.
Primary data table: “SEEDAutoNum”.
Rock Creek monitoring sites Parameter Definition of parameter Forest Treeline Tundra
SeedTrap Unique ID number for individual tree – linked to tree ID table, which contains species of tree
■ ■
DateCollected Date which seed trap was collected ■ ■ SeedNumber The number of seed counted for a specific
seed trap at specified sampling interval. ■ ■
GerminationNumber The number of seeds that germinated during germination trials for a specific seed trap at specified sampling interval.
■ ■
Comments Narrative comments concerning seed collection and germination trials.
■ ■
Annual estimates of annual radial growth of selected white spruce trees within the permanent vegetation plots. Dendrometer bands were installed in 1992 on the same set of trees that were selected for
the cone counts. These simple devices are used to measure the expansion of the bole of
each selected white spruce tree on an annual basis. Technicians read these dendrometers
bands each year in late August or early September in order to determine the total annual
growth for the preceding year. Table 9 shows the data fields in the table that was develop
to archive the seed trap and germination data.
Table 9. Parameters relating to the annual growth selected trees within vegetation monitoring plots, as measured by dendrometer Bands affixed at breast height.
primary data table: “dendroAutNum”.
Rock Creek monitoring sites Parameter Definition of parameter Forest Treeline Tundra
TreeID Unique ID number for individual tree – linked to tree ID table, which contains species of tree
■ ■
MEAS Measurement read from dendrometer band at specified sampling interval. This number represents diameter of tree at end of growing season.
■ ■
DATE Date at which reading of tree was performed. ■ ■ Comments Narrative comments about tree or dendrometers
band – physical or insect damage, etc… ■ ■
45
Data Collection, Entry and Quality Assurance Data are recorded in the field on a set of standardized data forms, copied onto waterproof
paper. Data entry is performed by technicians who record the data in the field and the
data entry is checked by the principle investigator for the project for accuracy and
completion. Data for the annually monitored parameters are summarized each year and
any apparent anomalies in the data are thoroughly examined to verify the recorded
observations. Hard copies of the data sheets are stored in archival cabinets.
Metadata We have provided a CD at the end of this report that has a complete description of the
NPS Dataset Catalog and Metadata File.
Data Synthesis and Analysis Plan The data collected under the original design for the vegetation monitoring component of
LTEM were comprehensively reviewed in 1998 and 1999 (Roland 1999, Helm and
Roland 2000). The outcome of these analyses was the discontinuation of collection two
data streams (annual berry production and vegetation phenology) because of lack of data
quality and fundamental design problems. This review also demonstrated that the
underlying problems with the statistical design of the original monitoring plan were
serious and potentially warrant discontinuation of this set of monitoring activities. These
problems included lack of randomization and judgement-based sample selection as well
as the use of methods with high potential for significant observer differences (i.e. ocular
estimation technique used for the cover measurements).
Conclusions Based upon the aforementioned review of the existing vegetation monitoring design and a
careful process of setting measurable objectives for the program, the vegetation
monitoring component embarked upon an entirely new direction during the period 2000
until the present. This path has been focused on developing a landscape-scale vegetation
monitoring design that provides data concerning the vegetation cover of the park at a
much larger scale than encompassed by the watershed approach carried out in Rock

46
Creek. The results of this work will be described in a separate report that is currently
being prepared. The primary focus of the program has been on this new landscape-scale
paradigm for vegetation monitoring. However, we have continued to perform the
monitoring activities set out in the original design during this period of time, so that the
integrity of these data streams has been kept intact. The program needs to revaluate the
costs and benefits of continuing sampling under the original set of protocols once a
decision has been made concerning the shift to a landscape-scale monitoring approach.
That evaluation will occur within the next year.
Literature cited Densmore, Roseann, Mary Beth Cook and Phyllis Adams 1998. Inventory and
Monitoring Project, Vegetation Protocol, Denali National Park and Preserve.
Helm D. and Carl Roland, 1999. Evaluation of existing vegetation protocols for Denali
Long Term Ecological Monitoring Program.
Roland, Carl 1998. Summary and analysis of vegetation data from Denali Long Term
Ecological monitoring program permanent plots, 1992-1998.

47
Mini-grid Pilot Project
Carl Roland, Denali National Park and Preserve
Consistent with NPS data management standards, we have created a Microsoft Access®
database for storing and analyzing data collected under the Mini-grid landscape-scale
monitoring design. The design of the database is an integral part of the data acquisition,
storage, analysis and communication routines for this pilot study. We were very
fortunate to have the assistance of Angie Southwold, database programmer with the
Alaska Support office of the NPS in the design of the database for this project. By taking
full advantage of the relational capabilities of the software, the database design allows us
to reduce the time required for recording and entering data, yet still expeditiously
summarize the data in a variety of different ways quickly and easily. The use of data
entry masks for key fields, and automatic entry of certain important identification field
values through the use of nested sub-forms within the database allows for quality control
and the automation of several important database functions. In addition, digital images
recorded at each sample site are entered into the database structure and may be viewed
from within the database.
The structure of the database, including both tables and relationships can be found on the
Metadata CD at the end of this report. There are three primary types of tables in the
database:
1) Reference tables, which contain attribute data on individual records such as
species and are denoted with the prefix “ref_”
2) Data tables, into which the actual field data are entered (e.g., cover transects,
species composition, tree measurements, etc.) and are denoted by the prefix “tbl_”
3) Cross-reference tables, which are the products of combinations of data tables
and reference tables, which are denoted by the prefix “xref_” in the database
structure.

48
In designing the database, which occurred in tandem with development and testing of the
field data collection methods for the landscape-scale monitoring effort, we consistently
strove to maximize the flexibility of the data structures to retain the maximum array of
capabilities for exploring and summarizing the data. This fit with the principle
underlying this program to “expect the unexpected”. In other words, we did not want to
set up a narrowly-defined set of data structures that would limit our ability to reorganize
and reexamine the data according to either new hypotheses, or new ways of looking at the
data that evolve over the envisioned long term duration of the program. In addition, we
intended that the vegetation data serve as one of several “cornerstones” of the monitoring
program that should serve the needs of other components (such as the bird monitoring
component). The analysis requirements of other monitoring components may require the
data to be summarized differently than would be done for strictly vegetation purposes.
By striving for flexibility in data structures, we hope that we can provide data summaries
in numerous different formats that will suit the needs of other monitoring components.
A simple example of the benefits of the relational database structure is the following: the
database contains a reference table with one record for each plant taxon that has been
observed in the entire study. In this reference table, each taxon has a six-letter species
code in the key field for the table. This table contains attributes about each species,
including its taxonomy and synonyms, growth habit, nativity, conservation status, and
geographic range, among others. All of the actual data tables (such as species
composition, cover transects, etc…) are related to this reference table through the six-
letter species code. Thus by the simple entry of the species code, we are able to
summarize data not only by species, but by growth form (tree, shrub, forb etc…),
geographic range and all of the other related attributes contained in the taxon reference
table.
The relational nature of the database provides powerful additional capabilities to support
our ability for detecting changes in the biota over time. We might be able to detect
changes in the abundance of a particular class of plants long before it would be possible
to detect changes in any given species that is a member of that class. For example, a
significant drying trend in interior Alaska could result in an increase in grass abundance

49
on the landscape. If this increase in grass abundance was divided evenly among 10
species, it would be much easier to detect a change in the abundance of the class as a
whole, than to detect the much smaller change in abundance of any individual grass
species. Such analyses are greatly facilitated by the relational database structure adopted
for these data. Furthermore, for the purposes of (for example) faunal components of the
monitoring program, the ecological attribute of importance may precisely be the increase
in “grass”, not so much the individual species identities within this stratum.
StatServer® Data Summary Routines: the Llink Between Database and Data Analysis We have designed a set of statistical routines, using StatServer® software, to facilitate
summarizing and analyzing the vegetation data acquired during this study. A large
volume of data has already been acquired during field sampling for this program. For
example, the cover transect data table currently contains 33,693 records and the species
composition table contains 17,163 records, after just two seasons of pilot sampling. We
decided it was critical to create a set of automated data summary procedures that would
facilitate the examination and exploration of our data. We worked with Ed Debevec, a
biometrician with the Institute of Arctic Biology at the University of Alaska who created
a set of web-based data summary routines that can be performed by anyone with access
to the following website (which is currently passworded): http://fnemd-
1.iab.uaf.edu/statserver/.
These routines allow us to perform a large number of calculations and data summaries
quickly, without actually entering the database that is used to store the data for the
project. This web page also allows for quick and effective sharing of data over the
internet. Users can access a flexible set of tools to inspect the patterns of variation in
measured variables across all of the spatial scales using the majority of the monitoring
data we have collected during this pilot study. The statistical software that these routines
use is based on the S-Plus statistical software program.

50

51
Aquatic Systems Aquatic Systems-Stream Channel Morphometry and Water Chemistry Ken Karle, Hydraulic Mapping and Modeling
Introduction The aquatic systems component of the LTEM program focused on two aspects of aquatic
systems monitoring: water chemistry and stream channel morphometry. Water quality
monitoring is often utilized as a method of ecosystem trend detection for wilderness
areas. Characterizing surface water composition provides links to local geology,
morphology, nutrient status, and biological productivity. However, though water quality
is routinely recognized as an important component in monitoring programs, the
significance of geomorphic and hydrologic landscape characteristics is often ignored or
minimized when deciding which variables to monitor in a long-term ecological study.
Some earth scientists believe that changes in basin characteristics may provide
preliminary and direct indications of alteration in climate or land use, especially in areas
which respond quickly to such alterations. As such, the program was developed to
monitor for such geomorphic changes using measurements of channel geometry.
The purpose of this project was to develop and test prototype monitoring designs for
application in national park units throughout Alaska. The goal of the protocol
development was to be able to establish practical methods for obtaining an initial
characterization of existing hydrology and water chemistry in the study area.
Additionally, the protocols were designed to provide for the identification of long-term
temporal variations and trends for selected parameters.
Database Design and Parameterization The original database for most data from the Aquatic Systems sampling efforts for the
first several years of the program utilized dBASE III software, which ran on an MSDOS

52
system. Data from the continuously recording stream gaging station on Rock Creek were
originally stored as ASCII files, which were created and accessed through the Lotus 1-2-3
spreadsheet software. Data files were stored in four separate locations.
In 1998, all of the acquired data were quality-checked with original data sheets, and
transferred from dBASE III and spreadsheet files to an MS Access file, as part of a
programmatic database standardization effort. These data are currently stored and
regularly backed up on dedicated program computers. Data from two other water
chemistry studies (Popovics, 1999; Edwards and Tranel, 1999) are also found in the
program Access database.
For the main aquatic systems program, parameters were measured at two sampling
stations in the Rock Creek watershed. The parameters may be classified into three
components: chemical, physical, and biological. Table 10 lists the parameters measured
at the two stations for the water chemistry component. Table 11 lists the physical
parameters measured. The biological components include giardia lambia and coliform
bacteria.
Table 10. Water chemistry measurements for LTEM program.
Major Ions Nutrients Other
Ammonium (NH4) Total Phosphorous (P) pH
Calcium (Ca) Total Nitrogen (N) Conductivity
Chloride (Cl) Kjeldahl Nitrogen (TKN) Chlorophyll a
Magnesium (Mg) Water Temperature
Nitrate (NO3) Air Temperature
Nitrite (NO2)
Sulfate (SO4)
Dissolved Organic Carbon (DOC)
Ortho-Phosphate (PO4)
Potassium (K)
Alkalinity (as CaCO3)
Sodium (Na)

53
Table 11. Physical measurements for aquatic systems component.
Stream Discharge Channel Survey Other
continuous stage cross-sections bedload
discharge measurements profile pebble count
turbidity
suspended sediment
Data Collection, Entry, and Quality Assurance During the summer of 1992, project personnel established two permanent stream channel
reference sites in Rock Creek which were used for most subsequent aquatic systems
monitoring. A recording stream gaging station was installed immediately downstream of
the lower site. Hydrologic measurements, including stream discharge, suspended
sediment, and bedload, were collected at these two sites on a monthly basis from May
through September. This sampling frequency was selected to capture the vast majority of
annual water and mineral budget output from the watershed, including the spring break-
up discharge, typically the peak flow of the season. Water chemistry sampling included
major ions, selected nutrients, alkalinity, pH, and total organic carbon. Channel
morphometry measurements were made once a year.
Most chemical and nutrient parameters were sampled by taking a bottle of water at the
reference sites, following specific collection and handling procedures, and sending the
bottle to an analytical laboratory for processing. Two replicates were taken for each
parameter, at each sampling station and time. Several parameters, such as pH, water and
air temperature, and turbidity, were taken directly by field personnel, using hand-held
specialized instrumentation.
The recording stream gaging station originally used a Omnidata recorder, which used a
float to detect and digitally record changes in water surface elevation. After several
years, this system was replaced with an updated gage recorder, which used a pressure
transducer to send a digital signal to a data recorder at a set time interval.

54
Stage is correlated to stream discharge through a series of instantaneous discharge
measurements. Once enough measurements were made, a stage-discharge rating curve
was developed and used to provide continuous streamflow records. Discharge
measurements were made using a hand-held current meter (Price AA or Swoffer).
Stream channel morphometry measurements, such as cross-sections and longitudinal
profiles, were made using an engineer’s automatic level or transit-level.
Several methods were used to ensure laboratory accuracy and precision in processing
water chemistry samples. The initial quality control check involved the inclusion of field
blanks in the samples sent to the laboratory for analysis. To detect problems with
laboratory contamination, approximately one percent of all sample bottles were split into
two samples. Upon receipt from the analytical laboratory, all data was checked for
mistakes and corrected as necessary. Data were checked for violations of holding time.
If any occurred, a holding-time notice was inserted into the computer file. The
correctness of analyses for the primary replicate samples were checked using anion-
cation balances. Physical measurements, and related subsequent calculations, were
quality-checked by performing calculations by 2 people following field measurements.
The Stream Channel Reference Sites Protocol (Karle, 1997) provides complete details
about all methods of data collection, equipment used, database entry, and quality
assurance.
Metadata We have provided a CD at the end of this report that has a complete description of the
NPS Dataset Catalog and Metadata File.
Data Synthesis and Analysis Plan The following list provides examples of what has been done with data from this study.
• Hydrological, chemical and geomorphological characterization of the Rock Creek
watershed (Karle, 1998; Karle and Sousanes, 2000).

55
• Discussion of the use of hydrographs to predict seasonal ecological productivity
(Thorsteinson and Taylor, 1997).
• Implementation of sampling protocols for parkwide water quality study (Tranel
and Edwards, 1999).
• Research involving the effect of soil and stream water quality on primary
productivity in Rock Creek by examining the relationship between soil water
chemistry and nutrient levels (Popovics, 1999).
Conclusions At this time, no sampling of either water chemistry or stream channel geometry
components is being conducted in conjunction with the LTEM program. However, the
techniques presented in this study to develop an initial characterization of the chemistry
and geomorphology of the Rock Creek watershed could be used as a blueprint for active
inventory and monitoring programs and networks in Alaskan park units.
Literature Cited Edwards, P.J., and Tranel, M.J., 1999. Physical and chemical characterization of streams
and rivers within Denali National Park and Preserve. U.S. Forest Service,
Northeastern Forest Experiment Station, Timber and Watershed Laboratory, Parsons,
WV. 102p.
Karle, K.F., 1997. Stream channel reference sites: channel morphometry and water
chemistry monitoring protocol. National Park Service, Denali National Park and
Preserve, Alaska. 58 p.
Karle, K.F., 1998. Stream channel reference sites: analysis of water chemistry and
channel morphometry data, Rock Creek. National Park Service, Denali National
Park and Preserve, Alaska. 21 p.
Karle, K.F., and Sousanes, P.J., 2000. Stream channel reference sites for long-term
monitoring, Denali National Park. In proceedings: American Water Resources
Association 2000 Annual Spring Specialty Conference: Water Resources in Extreme
Environments. May 2000: 173-178.

56
Popovics, L.M., 1999. The effect of soil and stream water quality on primary and
secondary productivity of Rock Creek, Denali National Park and Preserve. Master’s
thesis, University of Alaska Fairbanks, Fairbanks, Alaska. 99 p.
Thorsteinson, L.K. and D.L. Taylor. 1997. A watershed approach to ecosystem
monitoring in Denali National Park and Preserve, Alaska. Journal of the American
Water Resources Association Vol. 33: 4: 795-810.

57
Aquatic Invertebrates Dr. Alexander M. Milner, University of Alaska Fairbanks
Introduction
The purpose of the research was to develop an understanding of stream ecosystems in
Denali National Park and Preserve (Denali) leading to a recommended approach for
monitoring their condition over time. The research has developed in 3 phases. In the 1st
phase (1992-1993), we studied macroinvertebrate communities in a single watershed -
Rock Creek. Rock Creek is a small watershed near park headquarters and was selected as
the initial location (Thorsteinson and Taylor 1997) for the Denali Long-Term Ecological
Monitoring Program (LTEM). In the 2nd phase (1994-1997), we expanded our work to
more of the park to develop a broader understanding of the river and streams and their
macroinvertebrate communities. During the 3rd phase (1998-2002), we continued to
monitor macroinvertebrate communities at a number of sites along the park road
established during Phase 2 to describe natural patterns of variation. We also conducted
experiments to help with final selection of monitoring attributes and methods. Table 12
summarizes the stream studies in Denali from 1992 to 2003.

58
Table 12. Summary of stream studies undertaken in Denali National Park and Preserve, 1992 – 2003.
Year(s) Summary of major work undertaken Principal Reference(s) 1992-1993
Commenced studies in Rock Creek as the prototype watershed for LTEM program
Milner & Gabrielson (1993); Milner & Major (1994)
1994 Quantitative study of macroinvertebrates along Park Road examining 27 stream sites.
Conn (1994); Milner & Roberts (1995)
1994-1997
Examination of nutrient flow in the Rock Creek watershed and its influence on stream communities.
Popovics (1999)
1995 Extensive study of macroinvertebrates at 58 sites over the entire Park and across 3 seasons. Collection of a wide range of physico-chemical variables at these sites.
Conn (1998); Conn & Milner (1998); Edwards & Tranel (1998)
1995 Macroinvertebrate study with relation to stream restoration in the Kantishna area.
Major (1996)
1996 Study of longitudinal variation in benthic macro-invertebrate communities along 10 rivers for three seasons. Long-term water temperature, chlorophyll a, and CBOM measurements.
Conn (1998); Conn & Milner (1998)
1998-2001
Continued collection of macroinvertebrates at 14 sites along the road corridor across two seasons to ascertain year-to-year variation in community structure. Evaluation of other techniques including use of D frames, algal sampling etc.
Conn & Milner (1999); Conn & Milner (2000); Oswood et al. (2002)
2000-2002
Determination of species composition of the Chironomidae at 58 sites using samples collected in 1995 at two time periods (late spring [June] and late summer [late August/early Sept.]).
Ray (2002)
2002 Further refinement of a predictive model for evaluating changes in macroinvertebrate community structure. Completion of recommended protocol. Collection and rearing of Chironomidae to refine identification
Milner et al. (2003)
Phase I Aquatic macroinvertebrate studies began in Rock Creek with the general objective of
determining the abundance and composition of the aquatic invertebrate community at 2
study sites: Upper Rock Creek, and Lower Rock Creek. In 1992, invertebrate densities
59
and diversity in Rock Creek were so low that meaningful metrics could not be calculated.
This finding of low productivity sparked efforts in 1993 to measure primary productivity
and leaf retention, and in 1994 experiments to determine what nutrients were limiting
primary productivity (i.e., the clay pot study). This finding also led to the funding of
Master’s student Lisa Popovics, co-supervised by UAF Soil Scientist Chen-Lu Ping and
Milner (Popovics 1999).
Phase II - Spatial Expansion In 1994, the aquatic invertebrate study expanded to study stream sites along the park
road. Samples of invertebrates and physical and chemical data were collected from 26
different streams that crossed the road. These data were used in TWINSPAN and
DECORANA analyses to determine if distinct stream groups were evident, based on their
macroinvertebrate community assemblages. The work in 1993 and 1994 was the subject
of the Master’s Thesis by Sarah Roberts (Roberts 1995).
In 1995, the aquatic invertebrate study was provided an important opportunity to further
expand the geographic extent of sampling and obtain data on a wider array of
environmental variables, particularly chemical variables. This opportunity came in the
form of a planned water quality inventory (Edwards and Tranel 1998), which had the
facility of helicopter access for visiting sites off the road. A total of 53 rivers and
streams, including streams on the south side of the Alaska Range, were sampled at
different times during the summer field season during this joint effort. Sites along the
road corridor sampled in 1994 were also included in this study to provide information
about intra and inter-annual variation. The 1995 data were also subject to similar
classification analyses.
The focus of effort in 1996 was to determine longitudinal variation in community
composition along a given stream, as compared to the amount of variation between
streams. This study was important to evaluate if one sampling site per stream would be
sufficiently representative. Eleven rivers and streams along the park road were sampled
at multiple locations and at different time periods throughout the summer. More
variation between streams of different types was found than within streams supporting

60
the concept that sampling at one site per stream would be sufficient to characterize most
river sectors. The work conducted in the spatial expansion phase was the subject of the
Ph.D. Thesis of Sarah Conn (Conn 1998).
Phase III - Further Investigations into Community Trends and Monitoring Methods
The third phase of the aquatic invertebrate study began in 1998 with commencement of a
3-year study (funded by the USGS-BRD National Park Monitoring Project). During this
phase, 14 long-term monitoring sites were established in streams along the park road,
including representative streams in each of the 6 stream groups identified in the 1995
classification. Experiments were also conducted to refine monitoring methods, and a
detailed examination of the chironomids (non-biting midges) collected in Denali streams
undertaken.
The work conducted in the spatial expansion phase demonstrated that a useful starting
point for long-term monitoring would be to examine communities in streams
representative of the 6 major stream groups identified in Phase II. Thus, 14 sites were
selected for continued sampling. All had been sampled in prior years of the study; so the
record for each site ranges from 7-9 years in the 1992-2002 period. All sites have been
sampled also at various times within the summer season, so we now have a better
understanding of within year and between year variability.
The third phase of work also included experiments to resolve questions raised during
reviews in the earlier phases about the overall monitoring approach and specific methods.
Some reviewers were critical that the approach was not in line with the most common
macroinvertebrate monitoring methods used in the United States, and with the method
being developed by the Alaska Department of Environmental Conservation, called the
Alaska Stream Condition Index. These other methods—often referred to as the
multimetric approach--generally rely on qualitative samples collected with a different
type of net (the D-net), and enumeration of only a portion of the total number of
organisms collected in sample (usually the first 300 counted). The data from these
samples are analyzed through the use of various metrics intended to provide indices of

61
overall diversity and of the proportion of indicator taxa present. Experiments were
conducted to compare the results of data collected and analyzed by the multimetric
approach embodied in the Alaska Stream Condition Index, and the quantitative approach
used in Denali LTEM. Part of this work also involved looking at the number of replicate
samples needed to describe the community present at a given time.
Experiments were also conducted to determine whether periphyton or some other
measure of primary productivity could be monitored. Another investigation concerned if
biovolume--a measure of overall volume of aquatic invertebrates in a sample—could be
used as a surrogate for biomass being easier to estimate. To better understand the
ecological relationships between streams and the surrounding landscape, the amount of
coarse benthic organic material (CBOM) in the streams of different types was examined
in relation to their macroinvertebrate communities. CBOM, derived generally from
overhanging riparian vegetation or decaying instream vegetation, is an important source
of food for some macroinvertebrates, and its availability depends on stream channel
dynamics (is there riparian vegetation and what is its character?) and hydrology (is
CBOM flushed out by flooding or retained in the stream?)
The last major focus of this phase of the work was to examine the chironomids collected
in previous years and identify them to genus and species, where possible. Identification
of chironomids is difficult and time-consuming because the head of each organism must
be mounted on a slide and examined under a microscope. Chironomids are the dominant
macroinvertebrate group in Denali streams, and by not identifying further than family,
much information about the true taxonomic richness of Denali stream communities was
being lost. To determine how the monitoring protocol should deal with this difficult, but
important, taxonomic group, the chironomids collected in spring and fall of 1995 (the
year of the intensive study with the environmental data were identified with over 22,000
head capsules being mounted. Further classification analyses were undertaken using
TWINSPAN. The chironomid study was the subject of the Master’s Thesis of James Ray
(Ray 2002).

62
Database Design & Parameterization The data collected during this study has been entered principally in Excel spreadsheets on
a year-by-year basis. Excel data can now be imported into most statistical packages using
multivariate analyses. Parameters selected for measurement were environmental
variables considered likely to influence macroinvertebrate community structure. Biotic
metrics were used to summarize the macroinvertebrate community structure and taxa
were allocated to functional feeding groups depending upon their major food source to
examine organic matter processing in these streams.
Data Collection, Entry, and Quality Assurance The Denali LTEM proposal provided only general guidance as to how comprehensive
aquatic systems monitoring was to be carried out. The proposal suggested that sampling
of all parameters (including aquatic invertebrates) would occur twice at each stream site
in early and late summer to represent high and low flow conditions. The only other
guideline was that the macroinvertebrate sampling sites would be co-located with the
other aquatic sampling sites, which would be spread throughout the park according to the
watershed design.
In general, the project has consisted of determining estimates of aquatic invertebrate
abundance at various locations and times during the open water season together with
measuring environmental variables. A number of methods are available for sampling
aquatic macroinvertebrates in Denali streams and rivers. Some methods provide
qualitative results; others provide quantitative results. The method selected for the
Denali aquatic macroinvertebrate studies was a Surber sampler in which a known area of
stream bed is disturbed which are washed by the current into a downstream net, thereby
resulting in a quantitative measure of abundance for each taxa (i.e., number/m²). Surber
samplers are chiefly used in stream habitats known as riffles, where the water is broken
as it moves over the substrate. Riffles are productive habitats for aquatic invertebrates
because they are well-oxygenated and provide gravel and cobble substrate. The main
reason for sampling in riffles is that riffles is that it is the dominant habitat in Denali
streams and rivers and also allows comparison between similar habitats so that you are
comparing “oranges” with “oranges”. While other stream habitats (e.g., pools) which

63
support aquatic invertebrates may also be present in a reach, sampling of these habitats is
more difficult to perform consistently and can influence the fauna found. Thus, the basic
method chosen at the outset for the Denali program was a quantitative method using
similar habitats proven to provide comparability between sites and also comparability to
other monitoring studies. At each sampling site, typically five replicate samples were
collected within riffle habitats using a Surber sampler with 343µm mesh net. Samples
were not pooled and no sub-sampling occurred in the laboratory – samples were counted
in their entirety. The rationale for the selection of this method was the importance of
repeatability for long-term monitoring.
Except for 1995 when helicopter access was available, all study sites have been accessed
using the park road, with the sampling locations generally within a short distance
upstream of the road crossing. A total of 57 river and stream sites have been sampled
during the project. Some sites were sampled in only one year (1995); while others have
been sampled eight to nine times over the 11-year period of the study. The majority of the
sampling has occurred on 14 streams representing the 6 stream types identified along the
park road.
Metadata We have provided a CD at the end of this report that has a complete description of the
NPS Dataset Catalog and Metadata File.
Data Synthesis and Analysis
A major emphasis of the aquatic macroinvertebrate study has focused on the development
of a stream classification system to characterize the diversity of stream types within the
park. The important environmental variables driving this classification have also been
determined. An indication of the stream types was viewed as critical to knowledgeable
deployment of monitoring effort. Stream classification was undertaken by using
macroinvertebrate community distributions at the stream sites and the multivariate
program Two-Way Indicator SPecies ANalysis (TWINSPAN). Physical, chemical and
riparian zone variables at each sampling site have been used to identify the significant
variables driving the groupings using DEtrended CORrespondence ANAlysis

64
(DECORANA). Jaccard’s similarity Index has been used to compare similarity of the
macroinvertebrate community between sites and from year to year to examine
persistence. Further a predictive model has been developed for Denali National Park
using the TWINSPAN groupings and multiple discriminant analysis that allow an
expected macroinvertebrate fauna to be developed at any test using a small number of
environmental variables. The observed fauna is then compared against this expected
fauna to determine similarity. The principal results are summarized below.
• The 45 river sites sampled in 1995 were classified into six distinct groups
supporting similar macroinvertebrate communities; (1) small stable streams, (2)
groundwater-fed streams, (3) streams in the Kantishna region of the Park, (4)
larger streams with some glacial influence, (5) unstable clearwater streams and (6)
glacier-fed streams. Channel stability, water turbidity and altitude were the most
important variables of the 19 measured that govern community structure between
these six groups. Similarity coefficients indicated that the first three groups were
the most distinct in terms of their community structure and difference from the
other groups.
• Studies in 1996 of longitudinal zonation of macroinvertebrate communities along
10 streams and rivers indicated a much higher degree of similarity between sites
within the same watershed than to sites between different watersheds.
• Long-term variation in macroinvertebrate communities at 14 reference sites was
monitored from 1994 to 2002. These data indicate significant natural variation in
a number of biotic ratio metrics (e.g. % Chironomidae and % EPT) and some taxa
were absent in certain years. These data have implications for biological
monitoring using ratio metrics as determinations made from data collected in one
year may actually be within natural variation, although the metric value is shown
to be significantly different from reference site data collected in another year.

65
• Jaccard’s similarity coefficients indicated assemblage persistence between years
was higher in the more stable streams. Persistence of macroinvertebrate
assemblages was significantly correlated with low total snow cover over the
winter inferring that high snow cover in the spring leads to high flood peaks,
which have a major effect on benthic stream communities.
• Functional feeding groups were dominated by collector gatherers averaging
between 60 to 80% across years due to the high abundance of Chironomidae.
Average predator abundance was typically less than 10%. Persistence was also
examined of functional feeding groups between years. Shredders and scrapers
varied markedly from year to year, presumably as a result of resource availability,
but predators and collector-gatherers were the most persistent. Chlorophyll a
levels ranged from 2.9 mg m-2 in the glacier-fed streams to 402 mg m-2 in the
stable clearwater streams and a significant relationship was found between these
levels and macroinvertebrate densities.
• Chironomidae, the dominant macroinvertebrate group, were analyzed in more
detail and five subfamilies, 30 genera and 65 species were identified from a total
of 35 streams. Orthocladiinae and Diamesinae were the dominant subfamilies and
a number of undescribed species were found. Taxa composition was significantly
different between the spring and the autumn. Deformities of larval mouthparts
were examined and the incidence in unimpaired streams was found to be low.
General Additive Models (GAMs) are being built to look at the important environmental
variables driving the distribution of the most common taxa in Denali streams as
compared to the entire community.
Conclusion There are no problems with the data and most of the data analyses are complete. One of
the strongest facets of this work has been examining the natural variation in
macroinvertebrate communities in Denali streams, which now spans 9 years for some

66
streams. It is important that this record be continued so that we can understand long term
environmental change against a background of natural year to year variation. This is very
important for streams at these high latitudes where our knowledge of this variation is
minimal. It would appear that winter snowpack and the extent of spring runoff is a major
driver of the persistence of these communities and is a variable that is closely related to
climate change.
Literature Cited Conn, S.C. (1998) Benthic macroinvertebrate communities in the rivers of Denali
National Park and Preserve, Alaska: An approach for watershed classification
and ecological monitoring. PhD Thesis, University of Birmingham, UK. 218 pp +
appendices.
Conn, S.C. and A.M. Milner (1998). Stream classification and the development of an
aquatic biomonitoring protocol for Denali National Park and Preserve. Institute
of Arctic Biology, University of Alaska Fairbanks unpublished report to the
United States Geological Survey – Biological Resources Division, Alaska. 43 pp
Conn, S.C. and A.M. Milner (1999) Development of a long-term ecological monitoring
program for Denali National Park and Preserve: Design of methods for monitoring stream communities and water quality - a study plan. Institute of
Arctic Biology, University of Alaska Fairbanks unpublished report to the United
States Geological Survey – Biological Resources Division, Alaska. 54 pp.
Edwards P.J., and M.J. Tranel (1998) Physical and chemical characterization of streams
and rivers within Denali National Park and Preserve. Final Report submitted to
USDI - NPS, Denali National Park and Preserve, Denali Park, AK by UDSA
Forest Service, Northeastern Forest Experiment Station, Timber and Watershed
Laboratory, Parsons, WV 26287. 102 pp.
Major E.B. (1996) Macroinvertebrate analysis to assess stream restoration for the U.S.
National Park Service, Final Report. Environmental and Natural Resources
Institute, University of Alaska, Anchorage, AK. 44pp.

67
Milner A.M. and E.B. Gabrielson (1993) Bioassessment of Rock Creek in Denali
National Park 1992 University of Alaska Anchorage unpublished Report to
National Park Service, Denali National Park & Preserve, Alaska 99755. 38pp.
Milner, A.M. and E.B. Major (1994) Stream monitoring of Rock Creek in Denali
National Park – 1993. University of Alaska Anchorage unpublished Report to
National Park Service, Denali National Park & Preserve, Alaska 99755. 18 pp +
appendices.
Milner A.M., S.C. Conn and J.C. Ray (2003) Development of a Long-term Ecological
Monitoring Program for Denali National Park and Preserve: Design of Methods
for Monitoring Stream Communities. Institute of Arctic Biology, University of
Alaska Fairbanks final report to US Geological Survey.
Oswood, M.W., N.F. Hughes, and A.M. Milner. (in press) Running waters of the Alaskan
boreal forest. In Alaska’s changing boreal forest. (Eds. Chapin, F.S.and M.W.
Oswood) Oxford University Press.
Popovics, L.M. 1999. The effect of soil and stream water quality on primary and
secondary productivity of Rock Creek, Denali National Park and Preserve,
Alaska. MS Thesis, University of Alaska, Fairbanks. 98 pp.
Ray, J.M. (2002) Chironomidae (Diptera) communities of the rivers in Denali National
Park and Preserve, Alaska. MS Thesis, University of Birmingham, UK. 199 pp +
appendices
Thorsteinson, L.K. and Taylor, D.L. (1997) A watershed approach to ecosystem
monitoring in Denali National Park and Preserve. Journal of the American
Water Resources Association 33:795-810.
List of Theses, Reports and Presentations Theses Conn, S.C. (1998) Benthic macroinvertebrate communities in the rivers of Denali
National Park and Preserve, Alaska: An approach for watershed classification
and ecological monitoring. PhD Thesis, University of Birmingham, UK. 218 pp +
appendices.

68
Ray, J.M. (2002) Chironomidae (Diptera) communities of the rivers in Denali National
Park and Preserve, Alaska. MS Thesis, University of Birmingham, UK. 199 pp +
appendices
Reports
Milner A.M.and S.C. Roberts (1995) A synoptic survey of 26 streams along the road
corridor of Denali National Park & Preserve July 1994. Environment and Natural
Resources Institute, University of Alaska Anchorage unpublished report to the
U.S. National Biological Survey, Alaska Science Center, Alaska. 29pp.
Roberts, S.C. and A.M. Milner (1996) Invertebrate survey of 53 streams in Denali
National Park and Preserve. Institute of Arctic Biology, University of Alaska
Fairbanks unpublished report to the U.S. National Biological Survey, Alaska
Science Center, Alaska 34 pp.
Conn, S.C. and A.M. Milner (1998). Stream classification and the development of an
aquatic monitoring protocol for Denali National Park and Preserve. Institute of
Arctic Biology, University of Alaska Fairbanks unpublished report to the United
States Geological Survey – Biological Resources Division, Alaska. 43 pp
Conn, S.C. and A.M. Milner (1999) Development of a long-term ecological monitoring
program for Denali National Park and Preserve: Design of methods for monitoring stream communities and water quality. A Study Plan. Institute of
Arctic Biology, University of Alaska Fairbanks unpublished report to the United
States Geological Survey – Biological Resources Division, Alaska. 54 pp
Conn, S.C. and A.M. Milner (1999) Development of a long-term ecological monitoring
program for Denali National Park and Preserve: Design of methods for the long
term monitoring of stream communities and water quality. Annual Progress
Report. Institute of Arctic Biology, University of Alaska Fairbanks unpublished
report to the United States Geological Survey – Biological Resources Division,
Alaska. 6 pp

69
Conn, S.C. and A.M. Milner (2000) Development of a long-term ecological monitoring
program for Denali National Park and Preserve: Design of methods for the long
term monitoring of stream communities and water quality. Annual Progress
Report. Institute of Arctic Biology, University of Alaska Fairbanks unpublished
report to the United States Geological Survey – Biological Resources Division,
Alaska. 34 pp
Oral Papers Roberts, S.C. and A.M. Milner (1998) Classification of rivers in Denali National Park,
Alaska for long term ecosystem monitoring. Presented to the Annual Meeting of
the British Ecological Society, Warwick, UK (December 1988)
Roberts, S.C. and A.M. Milner (1998) Classification of rivers in Denali National Park,
Alaska for long term ecosystem monitoring. Presented to the 46th annual meeting
of the North American Benthological Society, Prince Edward Island, Canada.
May 1998.
Conn, S.C. and A.M. Milner (1999) A shift in emphasis : using small organisms to look
at the big picture in Denali National Park and Preserve. Presented to the 50th
annual AAAS Alaska meeting at Denali Village, September 1999.
Conn, S.C. and A.M. Milner. (2000). Long term ecological monitoring of streams and
rivers in Denali National Park and Preserve, Alaska. Presented to the Denali
Long Term Ecological Monitoring Conference, October 24-25, 2000, Fairbanks,
Alaska.
Milner, A.M. and S.C. Roberts (2001) Long term ecological monitoring of streams in
Denali National Park, Alaska: Implications for reference conditions. Presented to
the xxth annual meeting of the American Society of Limnology and
Oceanography, Alburquerque, New Mexico, February 2000, in a special session
entitled Long Term Ecological Monitoring.

70

71
Fauna Wolf/Prey Interactions Layne Adams, USGS-Biological Research Division
Introduction Since its inception in 1986, the goal of the wolf/prey research at Denali has been to
monitor wolf and caribou populations in sufficient detail to determine the status and
trends of these species while understanding interrelationships of the Denali wolf/prey
system. In 1998, similar research on moose was added to the overall program. This
research program strived to gain understanding of the roles that winter severity,
differential landscape use, and relative vulnerability of prey species play in wolf/prey
relationships in Denali and, ultimately in determining the abundance and trends of all 3
species. Through the conduct of this research and monitoring program, Denali National
Park is provided with an annual assessment of the status and trends of wolves, caribou
and moose populations in the park and a thorough understanding of the natural and
human-caused factors that are influencing those population trends. Specific objectives
are as follows:
1. Monitor population trends, pup production, survival, distribution and harvest of
wolves in and adjacent to DENA north of the Alaska Range;
2. Determine population trends, calf production and survival, and adult survival in
the Denali Caribou Herd;
3. Investigate nutritional condition, calf production and survival, and adult
survival of moose in DENA north of the Alaska Range; and
4. Evaluate factors influencing the relationships among wolves and their ungulate
prey.

72
Database Design & Parameterization A wide variety of data have been collected during the 20 years of this study including but
not limited to physical measurements and condition of captured individuals,
radiotelemetry data, and various population surveys. These data are stored in various
ways depending on the type of data, their intended uses, and the priority for developing
electronic databases for analysis. For example, results of caribou composition surveys
and censuses are maintained only in hardcopy files and various summary tables, while
wolf radiotelemetry data are entered into electronic databases as they are collected.
Probably the most useful electronic databases developed for this study are those that
contain the radiotelemetry results. Currently such databases exist for wolves and caribou
during 1986-2003, but the moose telemetry data has not been entered to date.
Date Collection, Entry, and Quality Assurance Refer to study plans and publications for descriptions of data collection methods.
Electronic data currently are stored in DBASE V databases and EXCEL spreadsheets.
Entered data are checked manually and by portraying data spatially and graphically as
appropriate.
Metadata We have provided a CD at the end of this report that has a complete description of the
NPS Dataset Catalog and Metadata File.
Data Synthesis and Analysis Plan Data from this research program have been used to produce a variety of products and
many additional products are currently in development or planned.
Publication - Adams, L.G. in preparation. Factors influencing birth masses of Alaskan
caribou (intended for Journal of Animal Ecology)
Publication - Adams, L.G., and G. Matson. in preparation. Evaluation of cementum aging
of Alaskan caribou (intended for Wildlife Society Bulletin)

73
Publication - Adams, L.G., and G. R. Roffler. in preparation. Does compensatory weight
gain occur in free-ranging Alaskan caribou? (intended for Canadian Journal of Zoology)
Publication - Adams. L. G. in preparation. Population dynamics of gray wolves in Denali
National Park, Alaska (intended for Wildlife Monographs or Journal of Wildlife
Managment).
Publication - Adams, L.G. in preparation. Immobilization of Alaskan caribou with
carfentanil citrate and xylazine. (intended for Journal of Wildlife Management)
Publication - Adams, L. G., and S. D. Farley. in preparation. Are salmon an important
prey for gray wolves in interior Alaska?: evidence from stable isotope analyses. (intended
for Ecology).
Publication - Burch, J.W., L.G. Adams, E.H. Follmann, and E. A. Rexstad. drafted.
Evaluation of wolf density estimation from radiotelemetry data (intended for Journal of
Wildlife Management).
Publication - L.G. Adams. 2003. Marrow fat deposition and skeletal growth in caribou
calves. Journal of Wildlife Management 67(1):20-24
Publication - Ben-David, M., E. Shochat, and L.G. Adams. 2001. The utility of stable
isotope analysis in studying foraging ecology of herbivores: examples from moose and
caribou. Alces 37(2):421-434.
Publication - Zarnke, R.L., J. Evermann, J.M. Ver Hoef, M.E. McNay, R.D. Boertje, C.L.
Gardner, L.G. Adams, B.W. Dale, and J. Burch. 2001. Serologic survey for canine
coronavirus in wolves from interior Alaska, 1994-1999. Journal of Wildlife Diseases
37(4):740-745.
Thesis - Burch, J.W. 2001. Evaluation of wolf density estimation from radiotelemetry
data. M.S. Thesis. University of Alaska Fairbanks. 55pp.
Report - Adams, L.G. 2001. Population dynamics of wolves and their prey in Denali
National Park, Alaska: progress report (May 1998 - April 2000). USGS Alaska
Biological Science Center, Anchorage, AK. 26pp. + appendices.
Report - Adams, L.G. 1999. Population dynamics of wolves and their prey in Denali
National Park, Alaska: progress report. USGS Alaska Biological Science Center,
Anchorage, AK. 17pp. + appendices.

74
Publication - Merrill, S.B., L.G. Adams, M.E. Nelson, and L.D. Mech. 1998. Testing
releasable GPS radiocollars on wolves and white-tailed deer. Wildlife Society Bulletin
26(4):830-835.
Publication - Adams, L.G., and B.W. Dale. 1998. Reproductive performance of female
Alaskan caribou. Journal of Wildlife Management 62:1184-1195.
Book - Mech, L.D., L.G. Adams, T.J. Meier, J.W. Burch, and B.W.Dale. 1998. The
wolves of Denali. University of Minnesota Press. 238pp.
Publication - Adams, L.G., and B.W. Dale. 1998. Timing and synchrony of parturition in
Alaska caribou. Journal of Mammalogy 79:287-294.
Publication - Smith, D., T.J. Meier, E. Geffen, L.D. Mech, J.W. Burch, L.G. Adams, and
R.K. Wayne. 1997. Is incest common in gray wolf packs? Behavioral Ecology 8(3):384-
391.
Report - Adams, L.G., L.D. Mech, and K. Stahlnecker. 1997. Wolf monitoring protocol,
Denali National Park and Preserve, Alaska 1986-97. USGS Alaska Biological Science
Center, Anchorage, AK. 17pp.
Thesis - Adams, L.G. 1996. Calf production and survival in the Denali Caribou Herd,
Alaska. Ph.D. Thesis. University of Minnesota, St. Paul. 152pp.
Publication - Adams, L.G., F.J. Singer, and B.W. Dale. 1995. Caribou calf mortality in
Denali National Park, Alaska. Journal of Wildlife Management 59(3):584-594.
Publication - Adams, L.G., B.W. Dale, and L.D. Mech. 1995. Wolf predation on caribou
calves in Denali National Park, Alaska. Pages 245-260 in L.N. Carbyn, S.H. Fritts, and
D.R. Seip, eds. Ecology and conservation of wolves in a changing world - proceedings of
the second North American symposium on wolves. Canadian Circumpolar Institute
Occasional Paper 35. University of Alberta, Edmonton. 642pp.
Publication - Meier, T.J., J.W. Burch, L.D. Mech, and L.G. Adams. 1995. Pack structure
and genetic relatedness among wolf packs in a naturally regulated population. Pages 293-
302 in L.N. Carbyn, S.H. Fritts, and D.R. Seip, eds. Ecology and conservation of wolves
in a changing world - proceedings of the second North American symposium on wolves.
Canadian Circumpolar Institute Occasional Paper 35. University of Alberta, Edmonton.
642pp.

75
Publication - Mech, L.D., T.J. Meier, J.W. Burch, and L.G. Adams. 1995. Patterns of
prey selection by wolves in Denali National Park, Alaska. Pages 231-243 in L.N. Carbyn,
S.H. Fritts, and D.R. Seip, eds. Ecology and conservation of wolves in a changing world -
proceedings of the second North American symposium on wolves. Canadian Circumpolar
Institute Occasional Paper 35. University of Alberta, Edmonton. 642pp.
Publication - Adams, L.G., and L.D. Mech. 1995. Population trends of wolves and
caribou in Denali National Park, Alaska. Pages 347-348 in E.T. LaRoe, G.S. Farris, C.E.
Puckett, P.D. Doran, and M.J. Mac, eds. Our living resources: a report to the nation on
the distribution, abundance, and health of U.S. plants, animals and ecosystems. U.S.
Department of Interior, National. Biological Service, Washington, DC. 530pp.
Publication - Mech, L.D. 1993. Resistance of young wolf pups to inclement weather.
Journal of Mammalogy 74:485-486.
Publication - Lehman, N., P. Clarkson, L.D. Mech, T.J. Meier, and R.K. Wayne. 1992. A
study of the genetic relationships within and among wolf packs using DNA fingerprinting
and mitochrondial DNA. Behavioural Ecology and Sociobiology 30:83-94.
Popular article - Adams, L.G. 1992. Snowfall tips the balance of wolf-caribou
relationships in Denali National Park. Pages 56-57 in Highlights of natural resource
management. U.S. Department of Interior, National Park Service, Washington, DC. 67pp.
Publication - Davis, J.L., L.G. Adams, P. Valkenburg, and D.J. Reed. 1991. The
relationship between caribou body weight and age and cohort specific reproduction.
Pages 115-142 in Butler, C.E. and S.P. Mahoney (eds.). Proceedings of the fourth North
American caribou workshop. Newfoundland and Labrador Wildlife Division, St. John's,
Newfoundland. 529pp.
Publication - Mech, L.D., T.J. Meier, and J.W. Burch. 1991. Denali Park wolf studies:
implications for Yellowstone. Transaction of the North American Wildlife and Natural
Resources Conference 56:86-90.
Report - Mech, L.D., T.J. Meier, J.W. Burch, and L.G. Adams. 1991. Demography and
distribution of wolves, Denali National Park and Preserve, Alaska - Progress Report,
1986-1990. U.S. National Park Service Natural Resources Progress Report AR-91/01.
Anchorage, AK. 37pp.

76
Popular article - Mech, L.D. 1989. Stubborn hunter in a harsh land. National Wildlife
(Aug/Sept.) 5pp.
Report - Adams, L.G., B.W. Dale, and B. Shults. 1989. Population status and calf
mortality of the Denali Caribou Herd, Denali National Park and Preserve, Alaska - 1984-
1988. U.S. National Park Service Natural Resources Progress Report AR-89/13.
Anchorage, AK. 131pp.
Publication - Adams, L.G., B.W. Dale, and F.J. Singer. 1988. Neonatal mortality in the
Denali Caribou Herd. Proceedings of the third North American caribou workshop. Alaska
Department of Fish and Game Wildlife Technical Bulletin 8:33-34.
Publication - Adams, L.G., P. Valkenburg, and J.L. Davis. 1988. Efficacy of carfentanil
citrate and naloxone for field immobilization of Alaskan caribou. Proceedings of the third
North American caribou workshop. Alaska Department of Fish and Game Wildlife
Technical Bulletin 8:167-168.
Popular article - Meier, T.J. 1988. Wolf research in Denali. Page 9 in Highlights of
natural resource management. U.S. Department of Interior, National Park Service,
Washington, DC. 35pp.
Popular article - Adams, L.G. 1987. Fate of caribou calves studied in Denali.Page 16 in
Highlights of natural resource management. U.S. Department of Interior, National Park
Service, Washington, DC. 53pp.
Report - Adams, L.G. 1986. Population status and neonatal mortality of the Denali
Caribou Herd-progress report. U.S. National Park Service Natural Resources Progress
Report AR-86/05. Anchorage, AK. 13pp.

77
Small Mammals Compiled by Susan L. Boudreau, Denali National Park and Preserve11 Principal Investigators: Eric Rexstad, University of Alaska Fairbanks and Ed Debevec, University of Alaska Fairbanks
Introduction Monitoring of small mammal populations in Denali National Park and Preserve has been
going on continuously since 1992, making it the longest dataset in the Denali Long-Term
Ecological Monitoring program (LTEM). Coincidentally this data stream is also the
longest dataset for microtine populations ever collected in Alaska.
The philosophy underlying the small mammal LTEM monitoring efforts (Rexstad 1994)
is to estimate animal abundance on ~1ha study plots clustered within watersheds in the
Denali road corridor. Repeated sampling of these study plots has allowed the assessment
of dynamics of these populations through time (Rexstad and Debevec 2002).
Database Design and Parameterization12 Sixteen study plots are located in five sampling sites: Rock Creek watershed;Teklanika
River; Polychrome Pass; and Stony Dome area; and McKinley Bar trail. Sherman
livetraps are deployed on the plots for 4-day periods beginning on Sunday evenings and
concluding on Thursday evenings. Each sampling plot is approximately 0.8 ha in area,
and is laid out in a square configuration. Field procedures followed methodology
described by Furtsch (1995) and Rexstad (1996) in which traps are baited with sunflower
seeds and bedding, and checked three times per day. Captured individuals were identified
11 This narrative is based on “Small Mammal Monitoring at the Landscape Scale Denali National Park and Preserve” Rexstad and Debevec 2000 NPS Annual Report; “Denali Long-Term Ecological Monitoring Program-Protocol For Long-Term Monitoring of Small Mammal Populations Draft 1.2” 2001Rexstad et. al. on file in Denali National Park and Preserve; and “1992-1998 Report on Small Mammal Data Description” 1998 Rexstad and Debevec on file in Denali National Park and Preserve. 12 For more information see “Denali Long-Term Ecological Monitoring Program-Protocol For Long-Term Monitoring of Small Mammal Populations Draft 1.2” 2001 Rexstad et. al. on file in Denali National Park and Preserve.

78
by sex and species, and weight and reproductive status was determined. Unmarked
individuals are implanted with passive integrated transponder (PIT) tags and released.
Data Collection, Entry, and Quality Assurance13 Field data is entered directly into a Hewlett Packard Palmtop PC. In the field, data are
entered into a LOTUS spreadsheet (Table 13).
Table 13. Three lines of spreadsheet showing data as entered in the field.
While in the field, data are transferred from the Palmtop to a laptop on a nightly basis.
Data are saved to the hard disk and also to a floppy disk; therefore, at the end of each
field day there are three copies of the data. In the case of Palmtop failure, one day’s data
at most could be lost.
On a weekly basis, the data have to be readied by the crew leader for further analysis by
the primary investigator. The cross tab function in Corel’s Quattro Pro is used to
summarize the data in a format that is simple and easy to read. For our purposes, cross
tabs are used to summarize the number of captures at each plot during each sampling
session (Table 14), and also to look at the number of new captures and recaptures during
each sampling event (Table 15).
Table 14. A section of the output generated when using the cross tab function to count the number of captures during each sampling event.
Date 28-Aug-00 29-Aug-00 30-Aug-00Hour 6 13 20 6 13 20 6 13 RF1 9 2 9 11 5 6 14 5 RF2 1 1 1 8 2 4 8 4
13 See protocol for “Long-term Monitoring of Small Mammal Populations” Rexstad, Debevec, and MacDonald 2001 on file in Denali National Park and Preserve.
Date Hour Plot X Y Tag Number N/R Species Sex Weight Comments
08/21/00 6 RF1 8 A 413905C267 N CLRU F 26 LACTATING
08/21/00 6 RF1 6 I SOSP 4 MORT SHREW
08/21/00 6 RF1 3 B 4142652D23 R MIMI 46

79
RR1 9 6 8 13 6 6 13 9 RR2 14 4 10 17 9 10 20 5 TOTAL 33 13 30 49 22 26 55 23
Table 15. A section of the output generated when using the cross tab function to count the number of new captures and recaptures during each sampling event.
28-Aug-00 29-Aug-00 TOTAL 6 13 20 6 13 20
CLRU N 20 5 7 14 1 47 R 6 5 15 25 16 20 87
MIOE N 2 1 1 4 R 5 3 5 9 5 6 33
RS 1 1 2 SOSP 1 1
TOTAL 33 13 30 49 22 26 174 Metadata We have provided a CD at the end of this report that has a complete description of the
NPS Dataset Catalog and Metadata File.
Data Synthesis and Analysis
Calculating Abundance Estimates Using CAPTURE When a trapping session is complete and the data have been verified, the raw data are
imported into S-PLUS. The 16 data fields are as follows:

80
Table 16. Column names and description for small mammal capture data frame in S-PLUS.
Data Field Description LOCATION * Site name (ROCK, TEK, POLY, etc.) YEAR * Year data were collected SESSION * Session number within year DATE Month, day, and year that capture occurred HOUR Trap check within day (6=0600, 13=1300, 20=2000) PLOT Name of trapping grid or web X X label for trap within plot Y Y label for trap within plot TAG Tag number of individual TOECLIP Identifying toeclip used for part of 1992 N.R New capture (N) or recapture (R) SPEC 4-character species identification code SEX Sex identification (M, F) WT Weight in grams MORT * Logical value (T=mortality, F=not mortality) COMMENTS Additional comments
The spreadsheet described in Table 13 is imported into S-PLUS as a new data frame
using the Import Data command or by cut and pasting into an empty data sheet. Other
data frames within S-PLUS are used to record the dates and times that each plot is
checked. The data frame rock.sessions lists all trap checks at Rock Creek and the
data.frame other.sessions lists trap checks at all other sites. The first 4 fields in each
data frame are YEAR, SESSION, DATE, and TIME as described above for allyears.
Each additional field is for a specific plot and consists of a logical response: True if the
plot was checked at that date and time, and False if not. These data frames are needed for
generating capture histories on those occasions when there were no captures on a plot
during a trap check.
These 3 data frames (allyears, rock.sessions, and other.sessions) are used to estimate
abundances using CAPTURE. The function capture.history() is used to generate
capture histories for a given year, plot, session, species, and optionally sex. Common

81
species codes to use are CLRU (Clethrionomys rutilis) and MISP (all Microtus species).
The function capture.history() returns a list comprised of the following objects:
Table 17. Components of a capture history object in S-PLUS.
Object Description call Repeats the function call location Site name year Sample year session Session number within year plot Plot name spec Species sex Sex (NA if both used) capture.history Capture history matrix (1=captured, 0=not captured) trap.checks Date and times of all trap checks is.mort Logical vector (T=mortality, F=not mortality)
Once the capture history is generated, it is used with the function capture() to call the
program CAPTURE to generate the abundance estimate. By default, CAPTURE
performs a model selection routine and generates estimates under all possible models.
The results of the model selection routine are output to the S-PLUS commands window.
The analyst looks over the results and selects a model from the menu. The abundance
estimate with standard error and 95% confidence interval for the selected model are then
displayed. We record the species, plot name, session number, abundance estimate (N),
standard error (SE), confidence interval, model selected, M(t+1), and the number of
mortalities. The data frames rock.estimates and other.estimates contain abundance
estimates for Rock Creek and all other sites, respectively.
Data archival in MS Access At the end of each field season, data are collected and added to the MS Access database.
The database consists of six tables and a data query form that allows for filtering the data
by year, location, plot, session, and species. The Captures table is the equivalent of the
allyears data frame in S-PLUS, containing all the individual capture data from all years
in the study. All other tables are simple informational tables that give a general

82
description of the locations sampled (Locations), detailed locations of every plot (Plots),
a brief schedule of plots used in each year (Plots Used), a listing of session dates and
personnel (Sessions), and vegetation surveys performed at Rock Creek (Vegetation).
Discussion
WEB presentation of data With the 2000 field season, we began posting current information about the small
mammal study on a website. We were able to post maps and other site-specific
information that the field crew could access even before arriving in Fairbanks and we
could publish abundance estimates literally within hours of completing a session. The
website homepage is currently at:
http://mercury.bio.uaf.edu/~edebevec.staff/denali-sites/index.html
Literature Cited and Additional Information Cressie, N.A. 1993. Statistics for spatial data, revised edition. John Wiley & Sons, Inc.,
NY. 900pp.
Debevec, E.M. and E. Rexstad. 1999. Modeling temporal patterns in microtine
abundance in Denali National Park and Preserve. Poster presentation at Arctic
Division AAAS annual meeting.
Furtsch, P.R. 1995. Techniques for monitoring density and correlates of interannual
variation for northern red-backed voles (Clethrionomys rutilus) in Denali National
Park and Preserve, Alaska. Unpub. M.S. thesis, Univ of Alaska, Fairbanks. 131pp.
Innes, D.G.L., J.F. Bendell, B.J. Naylor, and B.A. Smith. 1990. High densities of the
masked shrew, Sorex cinereus, in jack pine plantations in northern Ontario.
American Midland Naturalist 124:330-341.
Lehmkuhl, K.L. 2000. Population dynamics and ecology of the yellow-cheeked voles
(Microtus xanthognathus) in early post-fire seres in Interior Alaska. Unpub. M.S.
thesis, Univ. of Alaska Fairbanks. 106pp.

83
Oakley, K., E. M. Debevec, and E. Rexstad. 1999. Development of a long-term
ecological monitoring program in Denali National Park and Preserve, Alaska.
North American Symposium: Toward a unified framework for inventorying and
monitoring forest ecosystem resources.
Otis, D.L., K.P. Burnham, G.C. White, and D.R. Anderson. 1978. Statistical inference
from capture data on closed animal populations. Wildlife Monographs 62:1-135.
Rexstad, E. 1996. Small mammal sampling protocol for long-term ecological monitoring
program, Denali National Park and Preserve. Unpub. report. 32pp.
Rexstad, E. 1994. Detecting differences in wildlife populations across stime and space.
Pages 219-228 in 59th North American Natural Resource and Wildlife
Conference.
Rexstad, E., and K.P. Burnham. 1991. Users guide for interactive program CAPTURE. CO
Coop. Fish & Wildlife Research Unit, Ft. Collins CO. 29pp.
Rexstad, E. and E.M. Debevec. 2002. Small mammal monitoring at the landscape scale
Denali National Park and Preserve. Report to USGS/BRD and National Park
Service . 36pp.
Skalski, J.R., and D.S. Robson. 1992. Techniques for wildlife investigations: design and
analysis of capture data. Academic Press, Inc., San Diego CA. 237pp.
Zippin, C., 1956. An evaluation of the removal method of estimating animal populations.
Biometrics. 12(2):163-18

84

85
Bird Monitoring Carol McIntyre, Denali National Park and Preserve
Introduction This report summarizes the databases and database management associated with the four
bird monitoring components of Denali’s Long-Term Ecological Monitoring program
(LTEM). All of the databases were specifically designed for the goals and objectives of
each project (see Chapter 2). The databases for the contemporary bird monitoring
projects are in the development stage.14
Purpose of Bird Monitoring Projects Each of the bird monitoring projects in Denali has specific goals and objectives. The
overall goals of each project are summarized below.
1. Historic bird monitoring projects
a. On and Off Road Point Counts: (summarized from Weicker and Benson
2002): The objectives of the passerine monitoring program in Denali
conducted by the Alaska Bird Observatory (ABO) were:
i. Develop a protocol to monitor population trends of common
landbirds in Denali. This objective was spatially limited to the
spruce forest habitats that could be easily accessed by the Denali
park road corridor. The development and testing of the protocol
occurred from 1993-1997.
14 For information on the role of birds in Denali’s ecosystems and the bird monitoring programs supported by the Denali LTEM program see “Synthesis and Evolution of the Prototype for Monitoring Subarctic Parks: 1991-2002 Perspective” (2003 Report on file in Denali National Park and Preserve)

86
ii. From 1997 – 2001, ABO’s primary objective was to continue
monitoring passerine population trends using on-road and off-road
point-count surveys.
b. Monitoring Avian Productivity and Survivorship: (summarized from
DeSante et al. 2001) The specific goals for the initial operation of the
MAPS program in Denali were:
i. Evaluate the ability and effectiveness of MAPS to provide a useful
component of the Denali LTEM program;
ii. Determine the effectiveness of various MAPS stations in Denali to
provide reliable demographic information on the landbirds of the
Alaskan montane environment; and,
iii. Develop detailed written protocols for the long-term monitoring of
landbird population and demographic parameters to be used in
Denali’s LTEM program, by refining and altering the MAPS
protocol to fit the specific needs of Denali.
2. Contemporary bird monitoring projects
a. Spatial and Temporal Changes in Passerine Distribution and Abundance:
(summarized from McIntyre 2003a) the primary objectives of this pilot
project are:
i. Describe the distribution (spatial patterns) and develop indices of
relative abundance of avian species.
ii. Describe and assess the variability, both spatial and temporal, of
bird assemblages.
iii. Investigate spatial and temporal variation in species richness and
community composition to better understand the ecological
patterns and underlying process that produce them.
b. Monitoring Reproductive Performance of Golden Eagles and Gyrfalcons:
(summarized from McIntyre 2003b) the primary goal of this long-term
ecological study are:

87
i. Monitor the occupancy of nesting territories and breeding activities
of Golden Eagles and Gyrfalcons.
ii. Describe spatial and temporal trends in reproductive performance
of Golden Eagles and Gyrfalcons.
iii. Identify factors affecting population trends of Golden Eagles and
Gyrfalcons.
Study Areas 1. Historic bird monitoring project study areas
a. On and Off Road point counts: provided by Weicker and Benson (2002)
b. Monitoring Avian Productivity and Survivorship (MAPS): provided by
DeSante et al (2002)
2. Contemporary bird monitoring project study areas
a. Spatial and Temporal Changes in Passerine Distribution and Abundance:
provided by Roland et al. in prep.
b. Monitoring Reproductive Performance of Golden Eagles and Gyrfalcons:
available on GIS by principal investigator or Jon Paynter. Raptor nest
sites are sensitive information and should not be shared with the public.
Database Designs and Parameterization
1. On and Off Road Point Counts: see Weicker and Benson (2002)
2. MAPS: see DeSante et al. (2002)
3. Spatial and temporal changes in the distribution and abundance of passerines:
simple Excel database with the fields:
a. Grid name: generic name of minigrid (alpha)
b. Point: unique point on minigrids (numeric).
c. Observer: First, Middle, Last initial of observer (alpha).
d. Recorder: First, Middle, and Lat initial of recorder (alpha).
e. Year: (numeric).
f. Day of year: calendar day of year (numeric).
g. Start time: start time of point count (numeric).
h. Background noise: numeric code for background noise (numeric).

88
i. Temp C: temperature (Celsius) recorded at beginning of survey (numeric).
j. WS: code for wind speed (categorical).
k. WD: code for wind direction (categorical).
l. SC: code for sky condition (categorical).
m. PC: code for precipitation (categorical).
n. Insects: code for insect abundance (categorical).
o. Aspect: aspect of point (numeric).
p. Slope: slope of the point (numeric).
q. Observation: observation number for point (numeric).
r. Species: four character alpha code for species (alpha).
s. AOU#: American Ornithologist Union species # (numeric).
t. # Birds: # birds at each detection (numeric).
u. Distance: distance of detection to observer, in meters (categorical).
v. Direction: direction of detection (compass bearing)(categorical).
w. Detection type: code for detection type (categorical, alpha).
x. 0-5 minutes: detected in 0-5 minute period of count (categorical).
y. 5-8 minutes: detected in 5-8 minute period of count (categorical).
z. Aerial?: was the detection of a flying bird (logical).
aa. Previous?: was the bird also detected on the previous point (logical).
A relational database integrating the passerine database with the vegetation database is
under development by Doug Wilder, database manager for the Central Alaska Monitoring
Network.
4. Golden Eagles and Gyrfalcons: simple Excel database for each year with the
following fields:
a. Territory name: generic name of nesting territory (alpha).
b. Area ID#: unique numeric identifier for nesting territory (numeric).
c. Surveyed: was the area surveyed in current year (logical)?
d. Occupied: was the area occupied in current year (logical)?
e. Laying Pair: was the area occupied by a pair that produced a clutch of
eggs (logical).

89
f. Successful pair: did the pair produce at least one fledgling (logical).
g. Nestlings: number of nestlings (numeric).
h. Fledglings: number of nestlings that fledged (numeric).
i. Observer: First, Middle, and Last initial of observer (alpha).
Carol McIntyre and Doug Wilder are developing a relational database integrating the
survey data with the nest site characteristics database (under development).
Data Collection, Data Entry, Data Quality Assurance, and Data Analyses Each bird monitoring project has specific information regarding data collection, data
entry, data quality assurance and data analyses.
1. Historic bird monitoring programs
a. On and Off-road Point Counts: All data for on and off-road point counts
were collected, compiled, and submitted to Denali NPP by staff of the
Alaska Bird Observatory. The data collection, data entry, and data
quality assurance process is described in detail in Weicker and Benson
(2002). When time and circumstances permitted, observers entered data
on a daily basis in the field using a laptop computer. Data were always
entered and proofed by surveyors that collected the data (Weicker and
Benson 2002). Data sheets were copied as soon as possible and stored in a
different location than the originals (Weicker and Benson 2002). The
Alaska Bird Observatory submitted electronic and paper copies of the data
to NPS at the completion of each field season. Additionally, ABO stored
all electronic data on a computer hard drive with back-ups stored at a
separate location (Weicker and Benson 2002). From 1993-1997, the
database management system Paradox was used for data entry and SAS
programs were used to analyze the data. From 1988 – 2002, data were
transferred to Excel and in 2001 were available in NPS Access database
(Weicker and Benson 2002). Data were analyzed using SPSS from 1998-
2002 (Weicker and Benson 2002).

90
b. MAPS: All aspects of data collection, data entry, and data quality
assurance for the MAPS program in Denali are describe in detail in the
Institute for Bird Populations (1997) and DeSante et al. (2001). All data
for the MAPS program were collected, compiled, and submitted to Denali
NPP by staff from the Institute for Bird Populations. The operation of the
MAPS stations in Denali is summarized in detail in DeSante and Burton
(1997). Staff from the Institute of Bird Populations completed the
computer entry of all banding data. The critical data from each banding
record were proofed by hand against the raw data and any computer-entry
errors were corrected. Computer entry of effort and vegetation data was
completed by IBP biologists using specifically designed data entry
programs (DeSante et al. 2001). All banding data were run through a
series of verification programs (DeSante et al. 2001). The various data
analyses of the MAPS data is described in detail in DeSante et al. (2001).
2. Contemporary bird monitoring programs
a. Spatial and temporal distribution and abundance of passerines: Data for
this project are collected and compiled by NPS staff at Denali National
Park and Preserve, Alaska. The data from each observation are proofed by
hand against the raw data and any computer-entry errors noted and
corrected. A log of all computer-entry errors is also kept. All data are
stored on hard copies (2 stored in separate locations) and electronically (2
stored in separate locations). Preliminary data analyses are being
performed using SPlus and PC Ord statistical software.
b. Monitoring reproductive performance of Golden Eagles and Gyrfalcons:
Data for this project are collected and compiled by NPS staff at Denali
National Park and Preserve, Alaska. The data from each survey are
proofed by hand against the raw data and mapping data. All data are
stored on hard copies (2 stored in separate locations) and electronically (2

91
copies stored in different locations). Data analyses associated with this
monitoring component have been completed using Statistix Statistical
Software and SPlus statistical software.
Metadata We have provided a CD at the end of this report that has a complete description of the
NPS Dataset Catalog and Metadata File.
Data Syntheses and Analyses Each bird monitoring project has specific data syntheses and analyses associated with
each program. The MAPS program, a continent-wide monitoring program, has complex
data analyses for estimating survivorship and productivity.
1. Historical bird monitoring projects
a. On and Off Road Point Counts: see: Pogson et al. (1993), Paton et
al. (1995), Paton, P.W.C. (1996), Paton and Pogson (1996a), Paton
and Pogson (1996b), Paton, P.W.C. (1997), Paton and Springer (1997),
Paton, P.W.C. (1997), Pogson and Rexstad (1993), Pogson et al.
(1994), Benson and Springer (1998), Benson (1999), Benson (2001),
and Weicker and Benson (2002).
b. MAPS: see DeSante and Burton (1993), DeSante et al. (1995),
DeSante and Walker (1996), DeSante and Burton (1997), De Sante et
al. (1997a), DeSante et al. (1997b), Institute for Bird Populations
(1997), Institute for Bird Populations (1998), Pyle et al. (2000),
DeSante et al. (2001), Pyle et al. (2001), and DeSante et al. (2002).
2. Contemporary bird monitoring projects
a. Spatial and temporal distribution and abundance of passerines:
preliminary analyses regarding frequency of occurrence and species
lists were developed for 2001 and 2002. All data are awaiting
community level analyses in 2004.

92
b. Monitoring Reproductive Performance of Golden Eagles and
Gyrfalcons: data analyses to this point have focused on changes in
reproductive parameters (McIntyre and Adams 1999, McIntyre 2002).
Route trend regression analyses to assess changes in productivity at a
nesting territory scale are in development.
Relevant Documents and Reports To avoid redundancy, all relevant documents and reports are listed and marked with an *
in the literature cited section of this report.
Conclusions The databases associated with the historical bird monitoring programs are well-described
and archived at Denali. The databases associated with the contemporary bird monitoring
programs are useful to staff at Denali and are in development with assistance from the
Central Alaska Monitoring Network’s database manager.
Literature Cited
*Benson, A.M. 1999. Landbird monitoring in Denali National Park and Preserve. 1999
annual report. Submitted to National Park Service. Alaska Bird Observatory, PO
Box 80505, Fairbanks, AK, 99708. 38 pages.
*Benson, A.M. 2001a. Passerine monitoring in Denali National Park and Preserve: 2000
annual report. Submitted to National Park Service. Alaska Bird Observatory, PO
Box 80505, Fairbanks, AK, 99708.
* Benson, A.M. 2001b. Passerine monitoring in Denali National Park and Preserve:
2001 annual report. Submitted to National Park Service. Alaska Bird
Observatory, PO Box 80505, Fairbanks, AK, 99708.
*Benson, A.M., and S.K. Springer. 1998. Landbird monitoring in Denali National Park
and Preserve: 1998 annual report. Submitted to the National Park Service.
Alaska Bird Observatory, PO Box 80505, Fairbanks, AK, 99708.
*DeSante, D.F., and K.M. Burton. 1993. The 1992 annual report of the Monitoring
Avian Productivity and Survivorship (MAPS) program in Denali National Park.
Unpublished report. Institute for Bird Populations, PO Box 1346, Point Reyes,
California, 94956.

93
DeSante, D.F., K.M. Burton, J.F. Saracco, and B.L. Walker. 1995. Productivity indices
and survival rate estimates from MAPS, a continent-wide program of constant-
effort mist netting in North America. Journal of Applied Statistics 22: 935-947.
*DeSante, D.F. and B.L. Walker. 1996. The 1995 annual report of the Monitoring Avian
Productivity and Survivorship (MAPS) program in Denali National Park.
Unpubl. report. The Institute for Bird Populations, PO Box 1346, Point Reye
Station, California, 94956.
*De Sante, D.F., and K.M. Burton. 1997. Part II, The MAPS Field Manual. Detailed
instructions for the establishment and operation of MAPS stations. The Institute
for Bird Populations, PO Box 1346, Point Reyes, California, 94956.
*De Sante, D.F., D.R. O’Grady, B. Walker, H. Smith, D. Froehlich, P. Pyle, E. Ruhlen,
P. Velez, and E. Feuss. 1997. MAPS analytical manual. Instructions for
verification, preparation, and analysis of data collection in the monitoring avian
productivity and survivorship (MAPS) program. The Institute for Bird
Populations, PO Box 1346, Point Reyes, California, 94956.
*DeSante, D.F., P. Pyle, and D.R. O’Grady. 1997. The 1996 annual report of the
Monitoring Avian Productivity and Survivorship (MAPS) program in Denali
National Park. Unpubl. report. The Institute for Bird Populations, PO Box 1346,
Point Reye Station, California, 94956.
*DeSante, D.F., P. Pyle, and D.R. O’Grady. 2001. The 2000 annual report of the
Monitoring Avian Productivity and Survivorship (MAPS) Program in Denali
National Park. Final Report. The Institute for Bird Populations, PO Box 1346,
Point Reye Station, California, 94956.
*DeSante, D.F., P. Pyle, and D.R. O’Grady. 2002. Ten-year (1992-2001) report of the
Monitoring Avian Productivity and Survivorship (MAPS) program in Denali
National Park. Final report. The Institute for Bird Populations, PO Box 1346,
Point Reye Station, California, 94956.

94
*Institute for Bird Populations. 1997. Monitoring Avian Productivity and Survivorship
(MAPS) in Denali National Park. A Handbook of the Field and Analytical
Techniques Needed to Monitor Primary Demographic Parameters of Landbirds in
National Parks, with Special Reference to Denali National Park and Preserve.
The Institute for Bird Populations, PO Box 1346, Point Reyes, California, 94956.
*Institute for Bird Populations. 1998. Monitoring Avian Productivity and Survivorship
(MAPS) in Denali National Park. A Handbook of the Field and Analytical
Techniques Needed to Monitor Primary Demographic Parameters of Landbirds in
National Parks, with Special Reference to Denali National Park and Preserve.
The Institute for Bird Populations, PO Box 1346, Point Reyes, California, 94956.
Kochert, M., K. Steenhof, C. McIntyre, and E. Craig. 2002. Golden Eagle (Aquila
chrysaetos). In The Birds of North America, No. 684. (A. Poole and F. Gill,
eds.). The Birds of North America, Inc. Philadelphia, PA.
*McIntyre, C.L. 1995. Nesting ecology of migratory Golden Eagles in Denali National
Park, Alaska. M. Sc. thesis, University of Alaska, Fairbanks, AK.
*McIntyre, C.L. 2001. Monitoring occupancy of nesting areas, reproductive success, and
nesting phenology of Golden Eagles and Gyrfalcons in Denali National Park,
Alaska. Denali National Park & Preserve Long-term Ecological Monitoring
Program. 2002 Progress Report. On file-Denali National Park and Preserve,
Alaska.
*McIntyre, C.L. 2002. Patterns in nesting area occupancy and reproductive success of
Golden Eagles in Denali National Park, Alaska. Journal of Raptor Research 36(1
supplement): 50-54.
*McIntyre, C. L and L.G. Adams. 1999. Reproductive characteristics of migratory
Golden Eagles in Denali National Park, Alaska. Condor 101(1): 115-123.
*McIntyre, C.L., M.W. Britten, and J. Dalle-Molle. 1988. Raptor nest inventory, Denali
National Park and Preserve, Alaska, 1979-1987. Natural Resources Progress
Report, AR-88.01, April 1988. Unpublished report on file at Denali National
Park and Preserve, Alaska.

95
*Paton, P.W.C., T.H. Pogson, and E. Rexstad. 1995. 1994 Field Season: development of
landbird monitoring protocols for National Parks in Alaska. Unpublished final
annual report to National Biological Survey. Alaska Bird Observatory, PO Box
8050, Fairbanks, AK 99708. 75 pp+ Tables and Figures.
*Paton, P.W.C. 1996. Draft landbird monitoring handbook. Denali National Park and
Preserve. Department of Natural Resource Science, University of Rhode Island,
Kingston, RI 02881. 44 pp.
*Paton, P.W. C. and T.H. Pogson. 1996. 1995 Field Season: development of landbird
monitoring protocols for National Parks in Alaska. Unpublished final annual
report to National Biological Survey. Alaska Bird Observatory, PO Box 8050,
Fairbanks, AK 99708. 69 pp+ Tables and Figures.
*Paton, P.W.C. and T.H. Pogson. 1996. Relative abundance, migration strategy, and
habitat use of birds breeding in Denali National Park, Alaska. Canadian Field
Naturalist 110 (4): 559-606.
*Paton, P.W.C. 1997. 1996 field season: development of landbird monitoring protocols
for National Parks in Alaska. Unpublished final annual report to National
Biological Survey. Alaska Bird Observatory, PO Box 8050, Fairbanks, AK
99708. 54 pp.
*Paton, P.W.C. and S.K. Springer. 1997. 1997 field season: monitoring landbirds in
Denali National Park using on-road and off-road point counts. Unpublished
report to National Park Service. Alaska Bird Observatory, PO Box 8050,
Fairbanks, AK 99708. 32 pp.
*Paton, P.W.C. 1997. Draft passerine monitoring handbook. Denali National Park and
Preserve. Department of Natural Resources Science, University of Rhode Island,
Kingston, RI 02881. 46 pp.
*Pogson, T.H., J. Bouton, T.D. Eskelin, and E. Rexstad. 1994. 1993 Field Season:
development of landbird monitoring protocols for National Parks in Alaska.
Unpublished final annual report to National Biological Survey. Alaska Bird
Observatory, PO Box 8050, Fairbanks, AK 99708. 51 pp+ Tables and Figures.

96
*Pyle, P., D.F. DeSante, and D.R. O’Grady. 1999. The 1998 annual report of the
monitoring avian productivity and survivorship (MAPS) program in Denali
National Park. The Institute for Bird Populations, PO Box 1346, Point Reyes
Station, California, 94956.
*Pyle, P., D.F. DeSante, and D.R. O’Grady. 2000. The 1999 annual report of the
monitoring avian productivity and survivorship (MAPS) program in Denali
National Park. The Institute for Bird Populations, PO Box 1346, Point Reyes
Station, California, 94956.
*Weicker, J. and A-M. Benson. 2002. Passerine monitoring handbook. Denali National
Park and Preserve. NPS Cooperative Agreement No. 9910-7-0015. Unpublished
report. Alaska Bird Observatory, PO Box 80505, Fairbanks, AK 99701.