Embed Size (px)
Citation preview

DATA SOURCES FOR TRADE POLICY ANALYSIS
Arun Jacob
ESCAP
Capacity Building on Trade Policy Analysis
24-25 October 2016,
Colombo, Sri Lanka

OVERVIEW
Nomenclatures
Trade data
Trade policy data
Ready to use trade and trade policy indicators
Integrated platforms : ITC & WITS
Micro-data
Data visualization tools
RECAP

WHAT KIND OF DATA DO WE NEED?
Data on trade flows Exports and imports: total, bilateral
Goods, services
Data on trade policies Tariffs
Non-tariff Measures (NTMs)
Trade indicators
Micro-data (firms, households)

NOMENCLATURES
Trade data have been recorded according to several product nomenclatures depending on the database and year: Harmonized Commodity Description and Coding System
(HS)
Standard International Trade Classification (SITC)
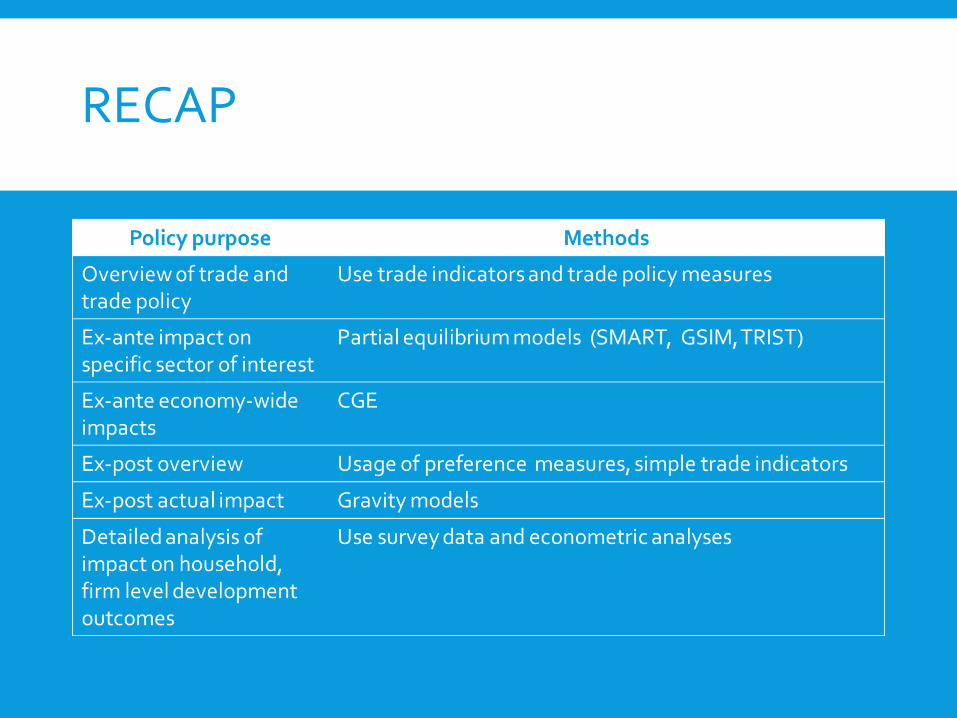
HARMONIZED SYSTEM (HS)
Last revised in 2012
Four harmonized levels, by decreasing degree of aggregation: Sections (21 lines)
Chapters (99 lines, also called "HS 2" because chapter codes have two digits)
Headings (HS 4, 1243 lines)
Subheadings (HS 6, more than 5000 lines including various special categories)
Levels beyond HS 6 (HS 8 and 10) are not harmonized so the description of product categories and their number differs between countries
HS2 and HS4 are the same in all revisions

MAIN DRAWBACK OF THE HARMONIZED SYSTEM
Originally designed to organize tariff collection
Traditional products like textile and clothing (Section XI) are over-represented in terms of number of subheadings compared to newer products in machinery, vehicles and instruments (Sections XVI, XVII and XVIII)
Share in number of HS 6 lines
Sha
re in
wor
ld tr
ade
Textile & clothing
Machinery
Vehicles
Chemicals
Base metals
Share in number of HS 6 lines
Sha
re in
wor
ld tr
ade
Textile & clothing
Machinery
Vehicles
Chemicals
Base metals

STANDARD INTERNATIONAL TRADE CLASSIFICATION (SITC)
SITC Revision 4 in 2006
Five levels: Sections (1 digit, 10 lines)
Divisions (2 digits, 67 lines)
Groups (3 digits, 262 lines)
Subgroups (4 digits, 1’023 lines)
Basic heading (5 digits, 2’970 lines)
Concordance tables between HS 6 2007 subheadings and SITC Rev. 4 basic headings (in both directions) are available on the UN Statistics Division webpage

Missing export data
• Export data monitored less carefully by customs administrations than import data
• Use import data from partner countries -"mirroring“
Confounding missing values and zero trade flows
Some Key Issues

WHERE TO FIND TRADE DATA?

AGGREGATE TRADE DATA
• WTO databases provide aggregate data on trade in goods and services
• Annually
• Quarterly
• Monthly
https://www.wto.org/english/res_e/statis_e/looking4_e.htm#top


DATABASES FOR BILATERAL TRADE FLOW ANALYSIS
• Aggregated bilateral trade data are available from the IMF Direction of Trade Statistics (DOT)
• DOTs provide bilateral import (c.i.f.) and import data of all products on subscription

DATABASES FOR DISAGGREGATED TRADE DATA
a. UN Comtrade
Covers bilateral trade flows at up to the HS 6 level for almost all countries up to 1962
All trade values are in thousands of current US dollars
UN Comtrade also reports volumes (in physical units) so that unit values can, at least in principle, be calculated for each good
Monthly (aggregated) data are free, but annual (bilateral) data are not. (Annual data are available through the World Bank’s WITS portal.)
b. Base Analytique du Commerce International (BACI)
Created by CEPII (Centre d'Etude Prospectives et d'Informations Internationales), a Paris-based institute, to reconcile discrepancies between UN Comtrade’s import and export data
BACI trails UN Comtrade with a two-year lag
BACI is freely available online to subscriber of COMTRADE database
BACI resolves zero vs. missing values problems

DATABASES FOR DISAGGREGATED TRADE AND PRODUCTION DATA
c. Trade, Production and Protection (TPP) database
Merges trade flows, production and trade protection data available from different sources into ISIC Rev. 2 data. It includes annual data on trade flows (exports and imports), domestic production (output,
value-added, employment, etc), and trade protection (tariffs and non-tariff barriers)
Data potentially cover 100 developing and developed countries over 1976-2004, but data availability varies by country and year.
d. CEPII Trade, Production and Protection database
Combines bilateral trade from BACI. Production figures are based on the TPP dataset , and complemented with figures by OECD and UNIDO. Bilateral protection data comes from the MAcMap project.
Proposes bilateral trade and production covers from 1980 to 2006 and 26 industrial sectors in the ISIC Revision 2.

TRADE IN SERVICES DATA
World Bank Databases on trade in services provides information on annual bilateral services trade flows in Mode 1 (cross-border trade) and Mode 2 (consumption abroad) for 199 countries across a multitude of sectors and years spanning 1985 and 2011
It consolidates multiple sources of bilateral trade data in services using mirror techniques, including the OECD, Eurostat, UN and IMF, as to provide a broader coverage of developed and developing countries over time
Mirror-technique is a method to retrieve export trade flows of a reporter by using information on imports of the partner country
The quality of trade data in services is still far away from being comparable to trade data for merchandise goods.

Where to find trade-policy data?

TARIFF DATA
a. Tariff data
WTO integrated database (IDB) and Consolidated Tariff Schedules database (CTS): MFN applied tariffs and imports of WTO Members at the tariff-line level which often means 8 digits, sometimes even 10 digits, starting in 1996
WTO Tariff Analysis Online (TAO)
• CEPII and ITC's MAcMap database: a set of files at the tariff line level of the bilateral measurement of applied tariff duties, taking regional agreements and trade preferences exhaustively into account.
WITS provides access to trade and tariffs databases: The WTO's IDB and CTS databases UN Comtrade UNCTAD's TRAINS database Global Preferential Trade Agreements Database

DATA ON NON-TARIFF MEASURES WTO databases: based on notifications
SPS
TBT (and also this database on Specific Trade Concerns)
Several limitations
Historical UNCTAD TRAINS database WTO notifications + other national sources
1992-2010
New TRAINS database UNCTAD+TNT+ITC+ Other IOs
Harmonized data collection on NTMS using UNCTAD 2012 classification of NTMs
Covers 56 countries accounting for 80 per cent of world trade
http://i-tip.unctad.org/


TRADE RESTRICTIVENESS DATA SETS


Global Trade Alert provides real-time information on state measurestaken during the current global downturn that are likely to affectforeign commerce.
It identifies the trading partners likely to be harmed by thesemeasures.

SERVICE TRADE RESTRICTIONS
OECD SERVICE TRADE RESTRICITIVENESS INDICES (UPDATED IN 2015)
http://www.oecd.org/tad/services-trade/services-trade-restrictiveness-index.htm
WORLD BANK SERVICE TRADE RESTRICITIVENESS
http://iresearch.worldbank.org/servicetrade/

TRADE AGREEMENTS DATA SET
WTO databases on RTA Database and PTA Database
ARTNeT supported Asia Pacific Trade and Investment Database (APTIAD) managed by ESCAP

WHERE TO FIND READY-TO-USE TRADE AND TRADE POLICY INDICATORS?

DATABASES PROVIDING READY-TO-USE TRADE INDICATORS
a. ITC Trade Map
Basic trade indicators based on UN COMTRADE data
Tables, graphs and maps –on export performance, international demand, alternative markets and competitive markets, as well as a directory of importing and exporting companies.
28

b. ITC Trade Competitiveness Map
For each country, Trade Competitiveness Map offers:

WITS TRADE OUTCOME INDICATORS
Calculate at country level using UN COMTRADE data
21 indicators of trade indicators to analyze trade performance
Divided into four categories: (i) composition, orientation, and growth of exports and imports,
(ii) degree of export diversification across products and markets,
(iii) technological sophistication of exports, and
(iv) survival rate of export relationships

ITC MARKET ACCESS MAP
Offers current and historical data on:
General, MFN and preferential tariff rates
Applied tariff rate quotas, including quota contingents and administration methods
Final bound tariffs of WTO member countries
Non-tariff measures (not in quantitative measurements but legal text) Trade remedies including antidumping, countervailing and safeguard duties
Rules and certificates of origin
Other non-tariff measures (market requirements), e.g. technical requirements and conformity assessments
Yearly export and import trade flows
These are based on various data sources: ITC, UNCTAD, World Bank, WTO

INTEGRATED PLATFORMS

ITC: http://www.intracen.org/
WITS: http://wits.worldbank.org/
WTO:
https://www.wto.org/
https://www.wto.org/english/res_e/statis_e/looking4_e.htm


MICRO DATA FOR IMPACT EVALUATIONS


EXAMPLE: MICRO DATA
2011 firm-level ITC NTM survey of Sri Lanka

DATA VISUALIZATION TOOLS

An Example:
The Observatory of Economic Complexity, MIT Media Lab, http://atlas.media.mit.edu/en/


SUMMARY
Data Type Source
Trade data WTO (aggregated); UN Comtrade, BACI,(disaggregated); TPP, CEPII (production data); World Bank Databases on trade in services
Trade Policy Data
Tariffs WTO Tariff Analysis Online (TAO), MAcMap,WITS
NTMS SPS, TBT,http://i-tip.unctad.org/
Trade barriers GTA ; Temporary Trade Barriers database
Integrated platforms (includingready-to-use indicators)
ITC, WITS
Microdata World bank catalogue
Data visualization MIT

THANK YOU
Arun Jacob, PhD
Trade Policy and Analysis Section
Trade, Investment and Innovation Division
United Nations Economic and Social Commission for Asia and the Pacific (ESCAP)
Bangkok, Thailand
Email: [email protected]