Embed Size (px)
Citation preview

Regulating Stationary Sources RECLAIM Cap & Trade Program
1
Mohsen Nazemi, P.E. Deputy Executive Officer
South Coast Air Quality Management District
U.S.-Iran Symposium
On Air Pollution in Mega Cities
September 4, 2013, UC Irvine

Federal - U.S. Environmental Protection Agency – Establishes national ambient air quality standards – Oversees State Air Programs – Regulates Mobile Sources (On-Road & Off-Road) – Establishes Stationary Source Standards
State - California Air Resources Board
– Establishes state ambient air quality standards – Regulates most mobile sources (On-Road) – Establishes Toxics Standards
Local - South Coast AQMD – Monitors and forecast air quality standards – Adopts local rules and regulations – Implements state and federal requirements – Regulates Stationary Sources
Air Quality Regulatory Framework
2

What is South Coast Air Quality Management District?
Local Air Pollution Control
Agency in Southern
California (All of Orange &
Portions of LA, Riverside &
San Bernardino Counties)
Population of 16.4 million
(about half of California
State’s population)
Area of 10,743 mi2
Worst air quality in the
U.S. (Ozone & PM 2.5)
3

South Coast Air Basin & Other U.S. Metropolitan Areas (Maximum Pollutant Concentrations as % of Federal Standards)
0%
50%
100%
150%
200%
South Coast Houston
Metropolitan
Phoenix New York Washington D.C. Atlanta Chicago
Max
imu
m C
on
cen
trat
ion
(%
Fe
de
ral
Stan
dar
d)
Criteria Pollutants by Metropolitan Area
Ozone (8-hour, 2008) Ozone (1-hour, Revoked)* PM2.5 (Annual)
PM2.5 (24-hour)++ PM10 (24-hour) NO2 (1-Hour)**
SO2 (1-Hour)*** Based on the former standard
** Based on the recently established standards++ Based on the filter data, excluding exceptional events
4

Los Angeles Compared to Tehran
5
•LA Population: 3.8 million •LA Area: 503 mi2
• Pop. Density: 7,600/mi2
•Tehran Population: 12.2 million •Tehran Area: 265 mi2
•Pop. Density: 46,000/mi2
•Tehran is 6 times more densely populated than LA
•Since 1900 - Population of Iran has increased 7 fold
while Tehran’s population has increased 60 fold

100 Years Ago: Electric Local Rail Transit
Los Angeles Pacific Electric Railway Depot, circa 1910
6

Los Angeles, 1927 http://framework.latimes.com/2013/03/11/los-angeles-pacific-electric-red-cars/#/3
Los Angeles Pacific Electric Red Car 1927
7
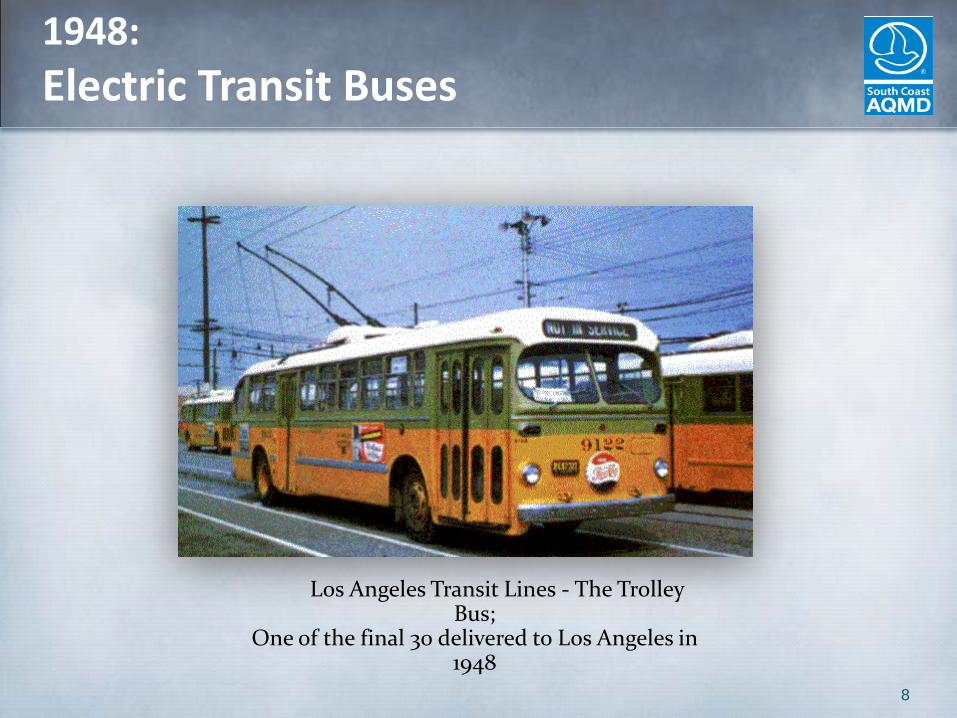
1948:
Electric Transit Buses
Los Angeles Transit Lines - The Trolley
Bus; One of the final 30 delivered to Los Angeles in
1948
8

Los Angeles — A No. 1522 Pacific Electric Red Car leaves the Pacific Electric Building at 6th and Main
streets heading to Long Beach in Los Angeles in Dec. 1960 shortly before service ended in 1961.
http://framework.latimes.com/2013/03/11/los-angeles-pacific-electric-red-cars/#/0
Los Angeles Pacific Electric Red Car December 1960
9

10
Death of the Red Cars - 1961

At It’s Peak in 1944 Electric Regional Rail Transit
Four Counties 1,150 Track Miles 900 Cars 109 Million Passengers
11

SCAQMD Engineering & Compliance
12
Count
Stationary Sources Regulated 27,000
Major Stationary Sources 432
Refineries (Total Crude Oil Capacity)
6 (0.99 mil bbls/day)
Power Plants (Total MWs Generation Capacity)
35 (16,000 MW)
Applications Processed 8,350 / Yr
Inspections Conducted 18,000 / Yr
Air Quality Complaints Received 8,800 / Yr
Asbestos Notifications Received 17,000 / Yr
Total Staff 306
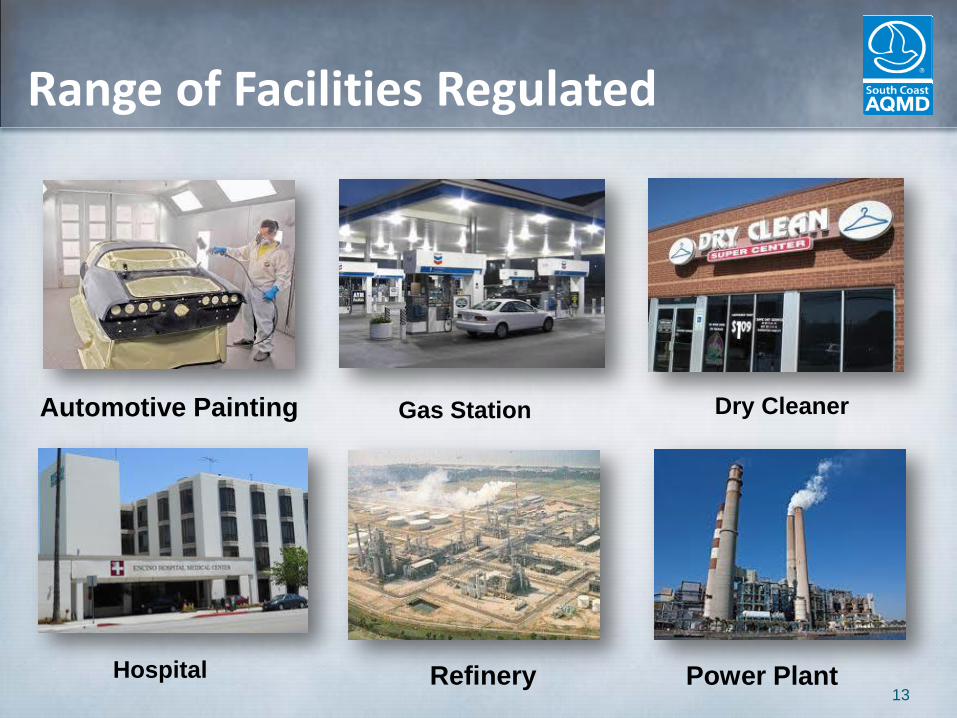
Refinery Power Plant
Automotive Painting Gas Station
Range of Facilities Regulated
Dry Cleaner
Hospital 13
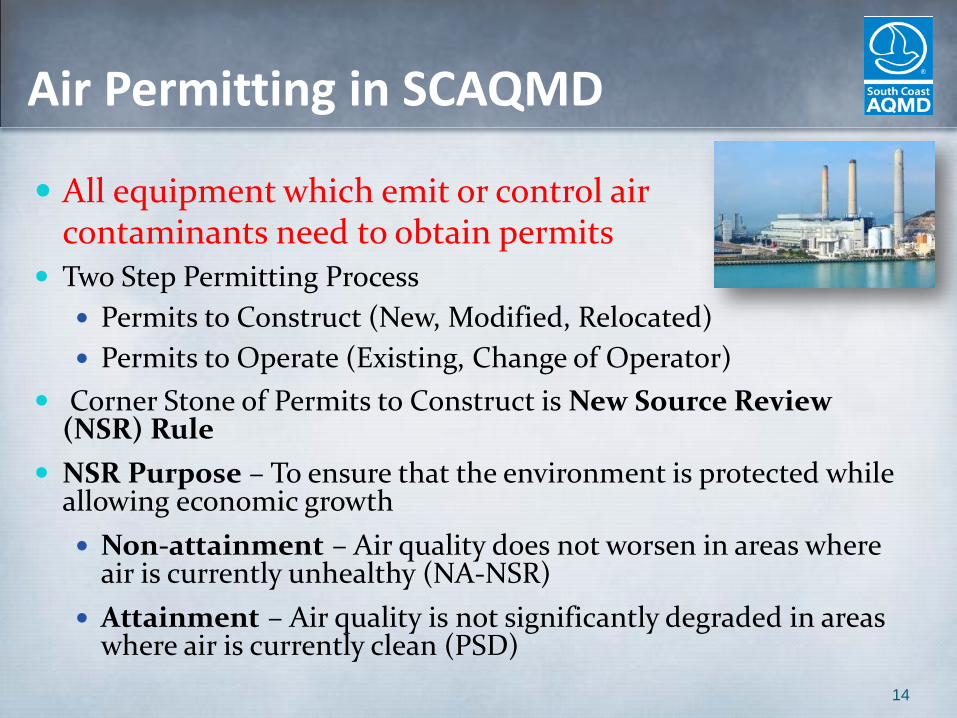
Air Permitting in SCAQMD
All equipment which emit or control air contaminants need to obtain permits Two Step Permitting Process
Permits to Construct (New, Modified, Relocated)
Permits to Operate (Existing, Change of Operator)
Corner Stone of Permits to Construct is New Source Review (NSR) Rule
NSR Purpose – To ensure that the environment is protected while allowing economic growth
Non-attainment – Air quality does not worsen in areas where air is currently unhealthy (NA-NSR)
Attainment – Air quality is not significantly degraded in areas where air is currently clean (PSD)
14

Main NA-NSR Requirements
Use of Best Available Control Technology (BACT)
Air Quality Modeling Analysis - Not create a new AAQS violation or make an existing violation significantly worse
Emission Offsets – Emission increases of Non-Attainment Pollutants are offset by the use of Emission Reduction Credits (ERCs)
Offset Ratio 1.2 to 1
Essential Public Services exempt from offsets
Public Notice – Emission or Toxic Health Risk
15

16
Emission Reduction Credits (ERCs)
ERCs are generated from:
Equipment shut-downs (primarily)
Voluntary add on controls
ERCs are issued by SCAQMD to businesses
ERCs are traded ($$) between businesses for use in
permitting

PM10 ERC Supply & Cost 2000 – 2013*
Supply dropped by 57% since 2000
Cost increased by 2,401% since 2000
Highest price of PM10 ERC (sold in 2009) is $350,000
per lb/day 2,123
1,187 1,145
941 872
803 779 846
945 955 907 928 911 909
$3,
859
$16
,917
$21
,710
$23
,64
9
$25
,372
$4
9,0
53
$6
9,4
35
$8
3,78
3
$12
7,8
87
$26
1,6
59
$18
9,3
20
$12
8,2
78
$10
5,0
00
$9
6,5
09
$-
$50,000
$100,000
$150,000
$200,000
$250,000
$300,000
0
500
1,000
1,500
2,000
2,500
2000 2001 2002 2003 2004 2005 2006 2007 2008 2009 2010 2011 2012 2013*
PM
10 E
RC
We
igh
ted
Ave
rag
e
Co
st (
$/lb
/da
y)
PM
10 E
RC
Su
pp
ly (
lbs/
da
y)
Year
ERC Supply (lbs/day) ERC Weighted Average Cost ($/lb/day)
*Through September 2013 17

Types of Permits
Traditional Equipment Permit– Command and Control
Facility Permit
– REgional CLean Air Incentives Market (RECLAIM)
– Major Sources (Title V of Federal Clean Air Act)
18

REgional Clean Air Incentives Market (RECLAIM) PROGRAM
Adopted in 1994 (Almost 20 years ago)
The largest NOx and SOx sources
Received initial allocations (RECLAIM Trading Credits - RTCs)
Facility declining annual
emissions caps
Reduce emissions or buy credits
Enhanced monitoring, reporting, and recordkeeping
19

NOx Emission Inventory
20
Point 1%
Reclaim 3%
Area 8%
On-Road 61%
Off-Road 25%
Aircrafts 2%
2008 NOx Emission Inventory
Total: 757 tons/day
21
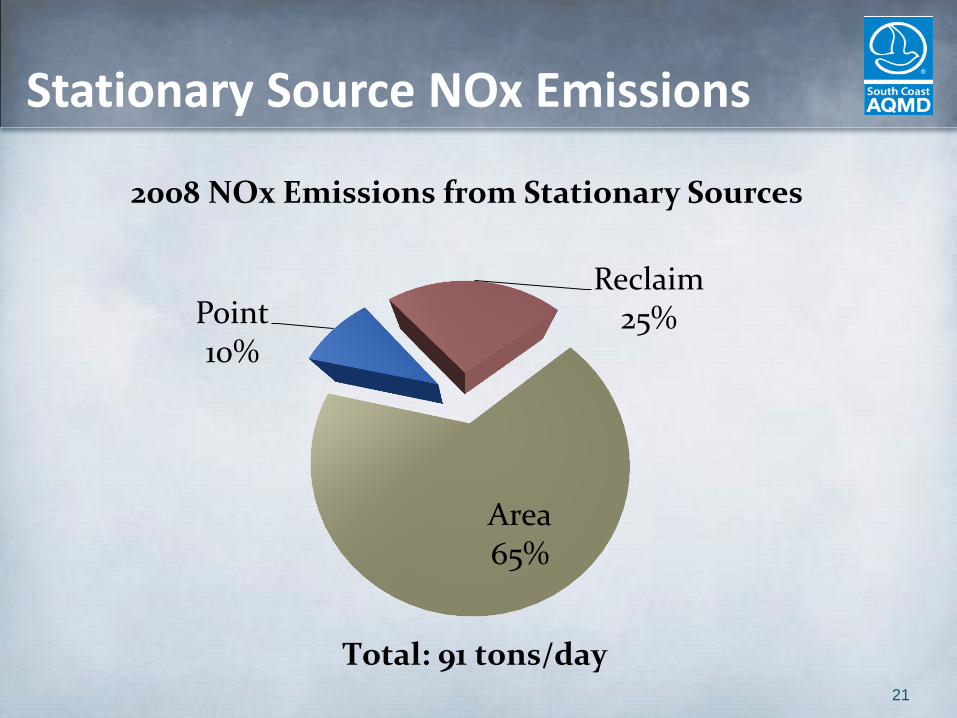
Stationary Source NOx Emissions
Point 10%
Reclaim 25%
Area 65%
2008 NOx Emissions from Stationary Sources
Total: 91 tons/day

For Facilities
Maximum Flexibility
Lower Compliance Costs Through Credit Trading
For Environment
Equivalent or Better Emissions Reductions
Promotes Control Technology Development
Enhanced Emission Monitoring
RECLAIM Program Benefits
22

23
RECLAIM Program Objectives
Same Level of Emission Reductions
Same or Lower Cost
Higher Compliance Confidence

1994 1995 1996 1997 1999 2000 2001 2002 2003
Em
issi
ons
Installation of Selective
Catalytic Reduction (SCR)
Control Equipment Bo
ile
r
1994 1995 1996 1997 1999 2000 2001 2002 2003
Em
issi
ons
Bo
iler
Seller Buyer
- Emission reduction = Financing for technology
- Emission exceedance for which RTC’s need to be purchased
Program Benefits/Objectives Max. Flexibility/Same or Lower Cost
24

RECLAIM RTC Allocations
Issued to facilities for all years at the beginning based on facility’s last 5 years emissions (1987-1992)
Two Cycle RTCs
Cycle 1 - January 1 through December 31
Cycle 2 - July 1 through June 3
Valid Only for Emissions Occurring During the cycle
25

26
27% Reduction
from 2000
58% Reduction
from 1994
22.5% Reduction
from 2012
Aggregate NOx Allocations
NOx Allocation Adjustments
0
5,000
10,000
15,000
20,000
25,000
30,000
35,000
40,000
45,000
NO
x (
ton
s)
Compliance Year

31% Reduction
from 2000
40% Reduction
from 1994
48% Reduction
from 2012
Aggregate SOx Allocations
SOx Allocation Adjustments
0
2,000
4,000
6,000
8,000
10,000
12,000
SO
x (
ton
s)
Compliance Year27

Monitoring, Reporting, and Recordkeeping (MRR)
Major Sources
Large Sources
Minor Sources
MRR are enhanced and the requirements dependent on source classification:
28

Equipment Categories Major Sources
Utility Boilers Turbines FCCUs
29

Equipment Categories Large Sources
Boilers Heaters
30

Equipment Categories Minor Sources
Emergency Generators
Portable ICEs Fire pumps
31
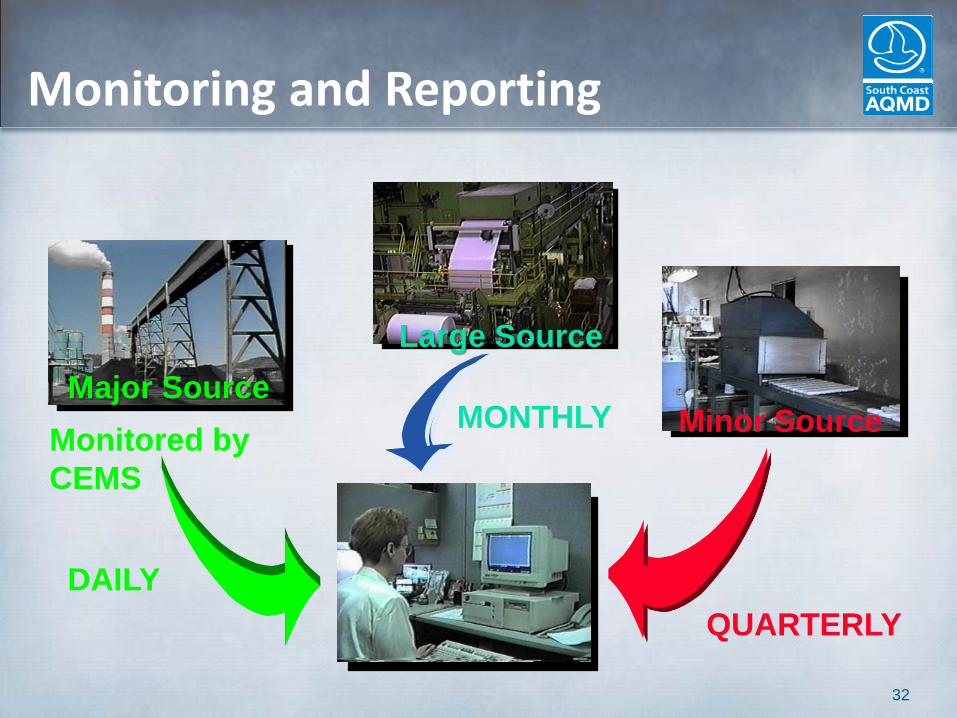
Monitoring and Reporting
Large Source
Minor Source
DAILY
MONTHLY Major Source
QUARTERLY
Monitored by
CEMS
32

NOx Continuous Emissions Monitoring System (CEMS)
NOx
Analyzer
O2
Analyzer
Fuel
Meter
Data
Acquisition
Device
RTU
Modem
To SCAQMD 33

Facility Audit Procedure
Annual Audit of Each Facility
Review Operational Records
Check CEMS Operations
Review Test Results
Emission Calculation Verifications
Confirm compliance with other rules
34

2011 Annual RECLAIM Audit Findings - Compliance
RECLAIM has 276 facilities at the end of Compliance Year 2011
RECLAIM met overall NOx and SOx emission goals:
NOx emissions 25% below allocations
SOx emissions 36% below allocations
RECLAIM had a high rate of facility compliance:
NOx Facilities* – 93%
SOx Facilities – 100%
35

36
0
10,000
20,000
30,000
40,000
50,000
1994 1999 2004 2009
NO
x (
ton
s)
Compliance Year
Total RTC Supply
Emissions
NOx emissions in CompYr 2011 were below Allocations by 2,388 tons (25%)
RECLAIM NOx Emissions vs. Allocations Trends
37
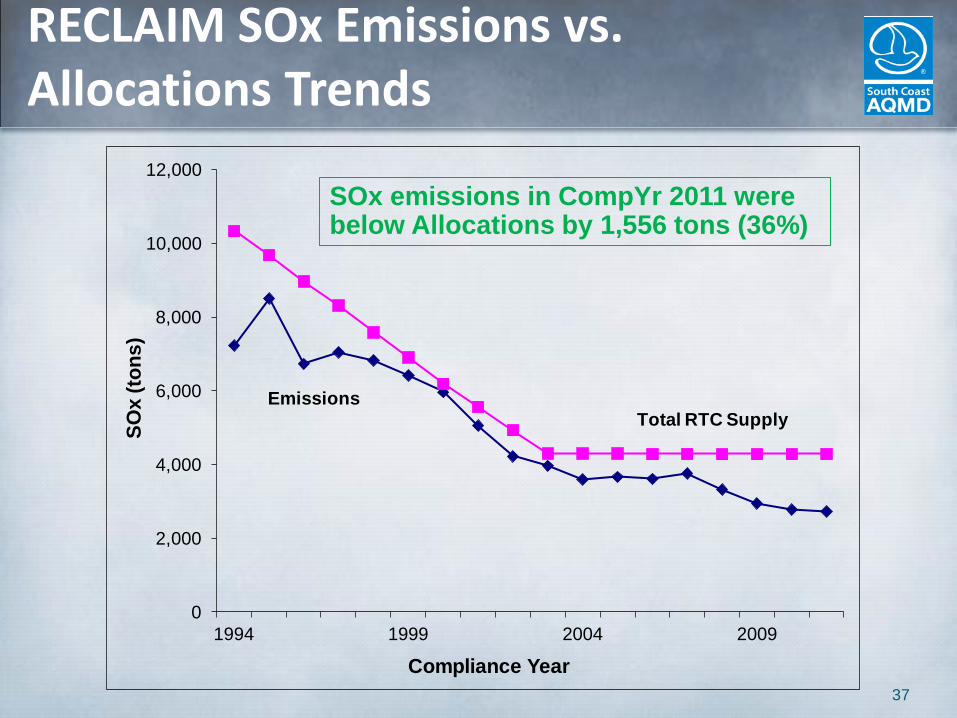
0
2,000
4,000
6,000
8,000
10,000
12,000
1994 1999 2004 2009
SO
x (
ton
s)
Compliance Year
Total RTC SupplyEmissions
SOx emissions in CompYr 2011 were below Allocations by 1,556 tons (36%)
RECLAIM SOx Emissions vs. Allocations Trends

2011 Annual RECLAIM Audit Findings - Credit Trading and Prices
DiscreteNOx$2.0
DiscreteSOx$0.03
IYB NOx$2.2
IYB SOx$14.6
Over $1 billion of RECLAIM Trading Credits (RTCs) traded
RTCs are traded as either Discrete Year or Infinite-Year Block (IYB)
$18.8 million worth of RTCs traded in CalYr 2012 ($12.9 million in CalYr 2011)
Value Traded
(Million $)
38

2011 Annual RECLAIM Audit Findings -Investor Participation During CalYr 2012
Investors are RTC holders who are not RECLAIM facility operators
Significant Investor participation in 2012 trades
RTC Type
Value Volume
NOx SOx NOx SOx
Discrete 57% 22% 59% 37%
IYB 68% 11% 64% 14%
39

40

Power Generation - Catalysts
Utility Boiler: 2 ppm NOx, CO ($2 to $5 Million)
Combined Cycle Turbine: ($6 to $10 Million) 2 ppm NOx, CO, and VOC; 5.0 ppmv NH3 at 15% O2
Simple Cycle Turbine: ($3 to $6 Million) 2.5 ppm NOx; 4 ppm CO; 2ppm VOC; 5.0 ppmv NH3 at 15% O2
41

Refinery Heaters
Heater: 5 ppm NOx, 10 ppm CO
SCR: 5.0 ppmv NH3 at 3% O2 {$11,200 – $17,000/ton reduced (based on 25 year life for SCR)}
42
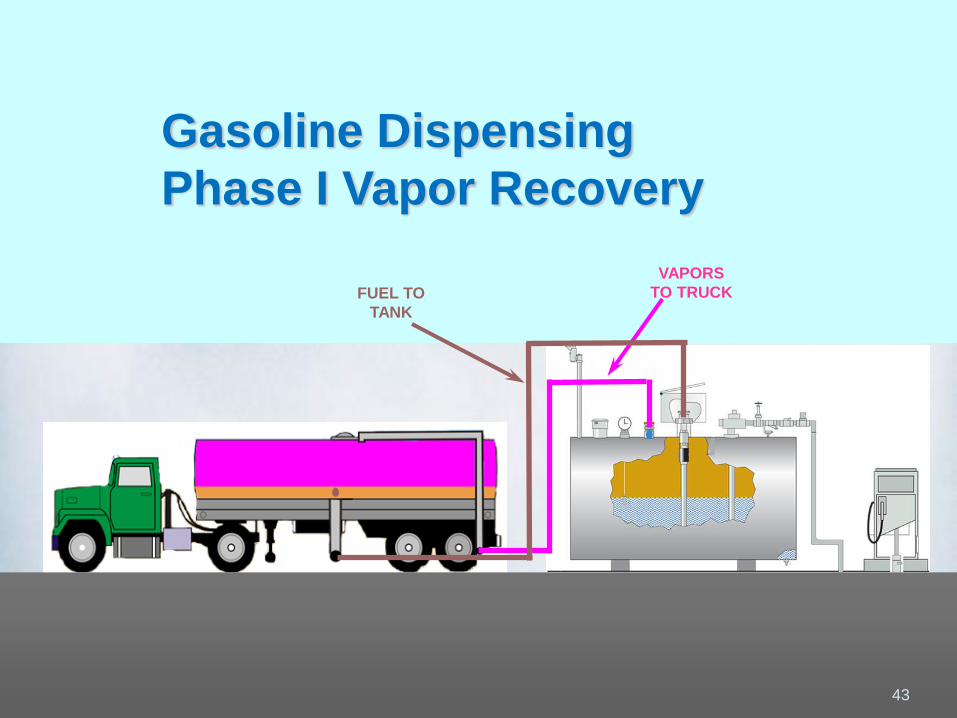
PHASE I VAPOR
RECOVERY
VAPORS
TO TRUCK FUEL TO
TANK
Gasoline Dispensing
Phase I Vapor Recovery
43

PHASE I VAPOR
RECOVERY
Gasoline Dispensing
Phase II Vapor Recovery
44

Gasoline Vapor Recovery
Total Retail gas consumption in 4 counties = 6.7
billion gallons in 2011
Phase I Vapor Recovery control 98% efficient
Phase II Vapor Recovery control 95% efficient
Overall VOC emission controlled = 150 tons/day
Control cost - $10,500/ton VOC controlled
45

Unique Challenges
46

Residential Fireplaces
47
Control of Particulates from Wood Burning Activities
Wood Smoke • Particulates primarily in <PM2.5 size range
• Source of Hazardous Air Pollutants (HAPs)
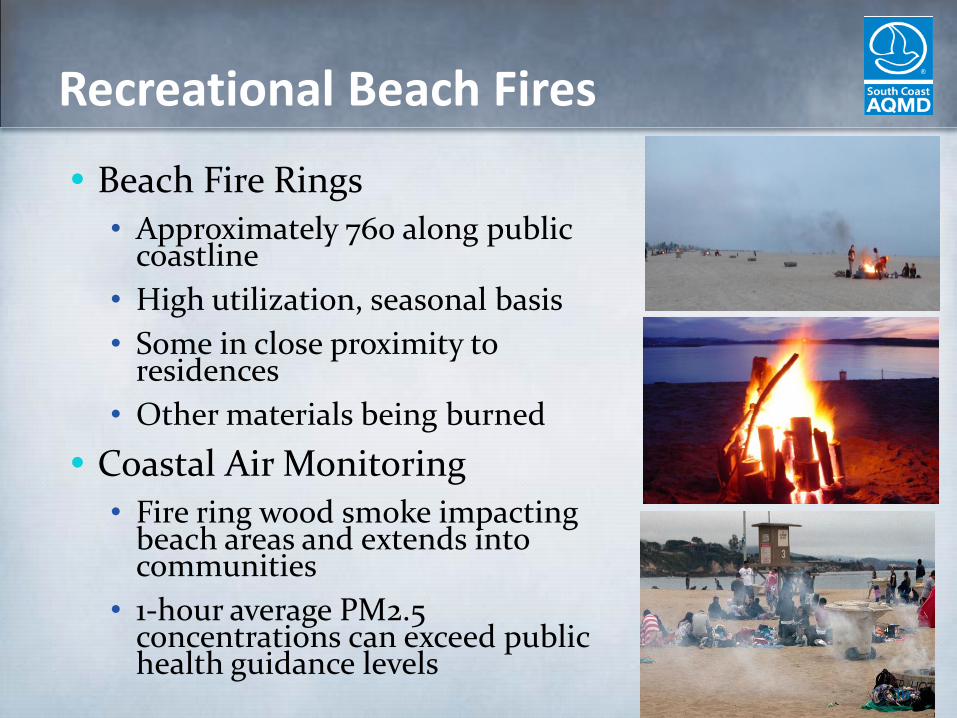
Recreational Beach Fires
Beach Fire Rings
• Approximately 760 along public coastline
• High utilization, seasonal basis
• Some in close proximity to residences
• Other materials being burned
Coastal Air Monitoring
• Fire ring wood smoke impacting beach areas and extends into communities
• 1-hour average PM2.5 concentrations can exceed public health guidance levels
48

Maximum Hourly PM2.5 Concentrations
0
100
200
300
400
500
600
700
800
Station Fire(2009)
July 4th, 2012 South CoastBasin (2012)
HuntingtonBeach
Corona delMar
BalboaBeach
Ma
xim
um
Ho
url
y P
M2.
5 C
on
cen
tra
tio
n
(ug
/m3)
USG = Unhealthy for Sensitive Groups Unhealthy – “consider canceling public events, based on public health and travel considerations” 49

Residential Wood Burning Curtailment
Mandatory wood burning curtailment day (No burn day)
Criteria for No Burn Day – PM2.5 exceeds 30 µg/m³ (Federal Standard)
Projected average of 10-25 No Burn days/year
Sole source of heat
Low income household
Ceremonial fired exempted under Rule 444
Requirements Exemptions
50

San Onofre Nuclear Generating Stations (SONGS) Shutdown
Southern California Edison (SCE) found radioactive leak from steam tubes in one of the two reactors
Since Jan. 2012, SCE has shutdown both SONGS Units 2 & 3
Total loss of 2,200 MWs
Shortfalls in South Orange County & San Diego
52
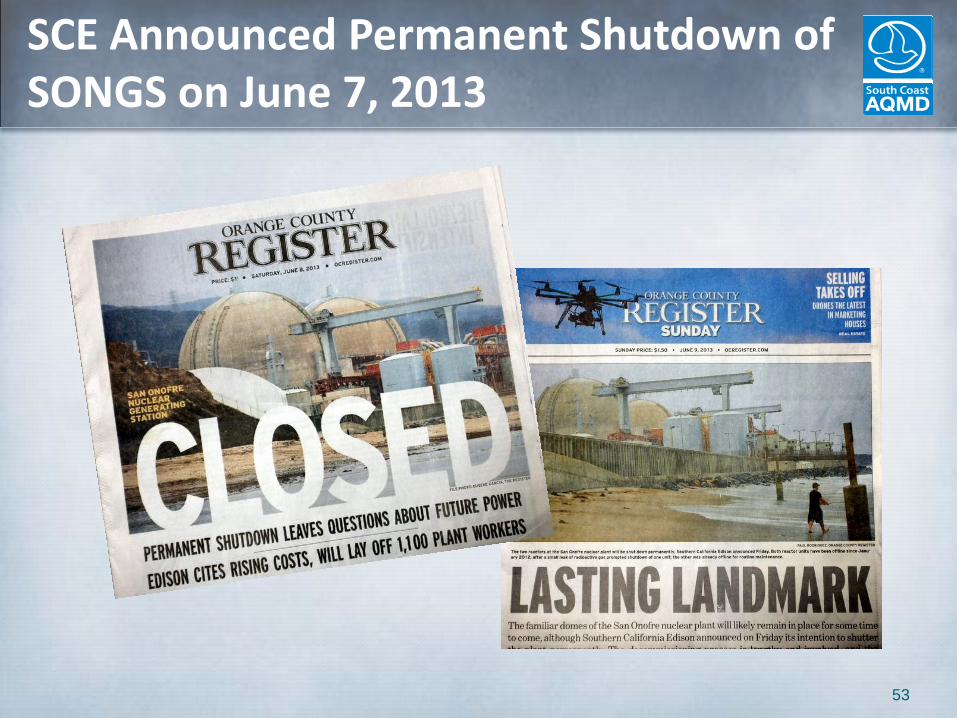
SCE Announced Permanent Shutdown of SONGS on June 7, 2013
53

19.6%
9.6%
21.4%
4.5%
21.7%
7.7%
0%
5%
10%
15%
20%
25%
Normal Scenario Extreme Scenario
Op
era
tin
g R
es
erv
e M
arg
in (
%)
ISO, SP26 and NP26 Operating Reserve Margins at 2013 Summer Peak
ISO
SP26
NP26
Stage 3 (Firm Load Shedding)
California Electricity Generation Operating Reserve Margins at 2013 Summer Peak
54
Stage 1
Stage 2
Updated: 5/30/13
Source: CAISO/CEC/SWRCB Presentation on June 17, 2013 at the Assembly Utilities & Commerce
Committee Hearing
Normal scenario operating reserve margins are adequate, extreme scenario
margins (1–10) are greater than 3% threshold

NOx Reductions Needed to Meet Federal Ozone Standards
1. Preliminary emissions estimates based on data from 2007 AQMP, updated where more recent data available: CARB 2010 projections for trucks and off-road
equipment; International Maritime Organization standards for vessels; EPA 2008 rule for locomotives; Vessels is average of high and low emissions estimates
based on varying deployment assumptions for IMO vessels and range of ports’ cargo forecasts. 2. Source: 2007 AQMP; analysis for 80 ppb fed standard. 3.
Preliminary analysis for 75 ppb fed standard 55

56