Embed Size (px)
Citation preview
’Don t look in front of you, look ahead of you
No. 1
5%
50%
Wearing a seat-belt reduces the risk of a fatal injury yet just over half of all countries have enacted good seat belt laws.
Only 4.8 billion people have seat belt laws that cover both front and rear seat occupants.
There is a four -fold increase in crash risk when talking on a mobile phone while driving.
Only 2.1 billion people have drink-driving laws in line with best practice.
Only 1.2 billion people have helmet laws that meet best practice and apply a helmet standard.
Road traffic deaths and injuries in low and middle income countries are estimated to cause economic losses of up to 5% GDP.
Road traffic death rates in low and middle income countries are more than double those in high income countries.
2030
2020
of the world’s road traffic deaths occur among people who are not in a car.
An adult pedestrian has less than a 20% chance of dying if struck by a car under 50 km/h.
75%
5%
23%
3 out of 4 road deaths are among men.
1.2 million
75%50%
The following data has been sourced from the WHO Global status Report on Road Safety 2015 – 180 countries out of a total of 195 WHO Member States, covering 6.97 billion people or 97% of the world’s population.
High income
Middle income
Low income
High income
Road traffic deaths per 100,000 population, by country income status
9.2
18.4
24.1
Low and middle-income countries are hardest hit, with 90% of global road traffic deaths.
Fatal casualties in Great Britain by road type
6%51%43%
Sources: World Health Organisation, Global Status Report on Road Safety 2015, UK Department for Transport.
Middle income
Low income
Lives are claimed by road traffic injuries each year.
Road traffic accidents are predicted to rise to the 5th leading cause of death by 2030.
The 2030 Agenda for Sustainable Development has set a goal of reducing road traffic deaths and injuries by 50% by 2020.
Road traffic accidents are the leading cause of death among those aged 15-29 years old.
12% 18%
70%
Population
74%
10%
Road trafficdeaths
16%
Ian Ellison and James PinderIan and James assess if we know how to use the terms workplace and workspace, to benefit organisations and people. Page 2
Duncan Young Duncan shares the learnings from an ongoing research project which uses new technology to examine employee wellbeing.Page 4
Dr Peggie Rothe Peggie investigates the relationship between open plan settings and the overall effectiveness of the space.Page 8
For the avoidance of any doubt, Leesman has never measured employee productivity. We believe organisations themselves are best placed to do that. But since 2010 we have asked every Leesman Office respondent to what extent the workplace provided “enables me to work productively”.
To help understand what exactly we’re testing, try transposing the words “work productively” with the central responsibility that employee has. So if a lawyer: “my workplace enables me to solve my client’s legal issues”. Or an info sec specialist at a bank: “my workplace enables me to protect the bank from hackers intent on bringing us down”.
Since spring 2016 Leesman has been heavily involved in supporting the Stoddart Review. This major piece of investigative work aimed to synthesize disparate industry rhetoric and present a coherent ‘one voice’ proposition on the role of workplace in organisational performance.
The exercise was superbly facilitated by the British Institute of Facilities Management who
have exercised real restraint in allowing the non-partisan enquiry team to sniff out topics and turn stones wherever necessary.
The Stoddart Review aimed to get the topic matter on corporate leadership teams’ radars. The pitch: your workplace impacts your P&L. So what? Every exec knows that workplace hits bottom line profitability. But our industry stands accused of failing to show how workplace design and management can proactively contribute to, rather than merely deplete, corporate profitability.
The riposte given for repeatedly failing to engage boards in this debate by architecture, design, workplace management and FM: executive boards are not interested. So the Stoddart Review sought to take a packaged case directly to the board, not arguing for board representation, but instead, for what they should be doing themselves – leveraging their physical and service infrastructures as key performance assets to increase
organisational effectiveness, revenues and margins.
One of the key strands of the Stoddart Review was a three-day open house where workplace thinkers presented to a review panel, of which I was a member. What quickly became clear, is that our industry is confused and embarrassed by its lack of understanding of productivity.
This was most evident in the numerous presentations that ignored the request to discuss employee productivity and instead explored the “productivity of space”. Too often we heard that more people in less space equalled higher productivity and that since measuring employee productivity was difficult, we must concentrate on making places more productive.
It’s not surprising then that boards were disinterested: the savings available are marginal. But employee productivity became a brick wall which most Stoddart Review open house presenters just hit head on.
Cognitive psychologists and accident investigators
call this “target fixation” – a visual fixation with the obstacle rather than the safe space around it, causing motorcyclists, pilots and five-year-olds riding bicycles without stabilisers for the first time, to collide with the object they have ample space and time to navigate safely. Skiers are taught to look not at the trees, but the space between the trees. Motorcyclists to look through the turn, not just at the apex. Workplace professionals are crashing into the problem rather than looking for the route around it.
Workplaces should be more productive. It’s an inconvenient obstacle for many that just 55% of the 215,000+ employees in the 1,600+ workplaces Leesman has measured since 2010 agree that their workplaces support their personal productivity. That’s concerning, no?
Workplaces have many reasons for being: to help build a sense of collective endeavour, reinforce brand values, or facilitate greater knowledge transfer. But underlining this all must surely be a fundamental
basic of enabling an employee to do the job they are employed to do… productively?
Executive boards have lost sight of this, in the main because their advisors have seen that it’s easier to manage the cost or occupant efficiency of space, than it is to face up to a workplace failing in its key reason for being. Workplace professionals have to come to terms with this and see the incredible opportunity to engage organisations in strategies to improve on those statistics and transform the global value proposition of workplaces.
The Stoddart Review still has much work to do to get to those executive boards. But those behind the study have the desire to try to do so. And initial findings are that boards do look ahead, not just at the apex, are interested and want to know more about employee productivity. Workplace professionals need to start looking forward, not just in front.
An inconvenient truth: across 1,600+ corporate workplaces, almost one in two employees do not believe that the workplace support them working productively. Understand why, then transform the workplace from a liability to an asset.
Issue 22leesmanindex.comData reported 31.12.16
Leesman Lmi
x.9Lmi 58.7 pre-occupancyLmi 65.7 post-occupancy
60.5
This issue: Building a high performing workplace, winning negotiations, corporate athletes and the impact of open plan
A briefing on global workplace strategy, management, satisfaction & effectivenessDelivering insights that drive better strategies
Don’t look in front, look ahead Our performance
215,243 respondents
1,690 locations
61% av response rate
Day 2 13%
Global distribution
UK 60,383 Nordics 53,442 Rest of Europe 47,107 Rest of world 46,250
Economic indicators
My workplace enables me to work productively
My workplace is a place I’m proud to bring visitors to
55%agree
50%agree
Data distribution
Post 14%
Post 14%
Pre 66%
Lmi 58.7 Lmi 65.7 Lmi 64.5
Data highlights
Imp
ortance
SatisfactionTop 3 Activities:Individual focused work, desk based 93% 76% Planned meetings 77% 79% Telephone conversations 77% 63%
Bottom 3 Activities:Video conferences 35% 58% Individual focused work away from your desk 35% 64% Using technical/ specialist equipment or materials 26% 65%
Top 3 Physical Features:Desk 90% 72% Chair 89% 67% Temperature control 81% 28%
Bottom 3 Physical Features:Shared storage 40% 41% Variety of different types of workspace 37% 29%Archive storage 34% 37%
Top 3 Service Features:Tea, coffee and other refreshment facilities 85% 62% General cleanliness 82% 61% IT Service/help desk 81% 58%
Bottom 3 Service Features:Internal signage 38% 47% Shower facilities 38% 33% Guest/visitor network access 36% 40%
Day 2 13%
2 –– Issue 22
Insight | James Pinder and Ian Ellison
There’s an internet meme that does the rounds about grammar. You’ve probably seen it. It’s about the difference between knowing your -ahem- stuff, and knowing you’re… well, you get the message.
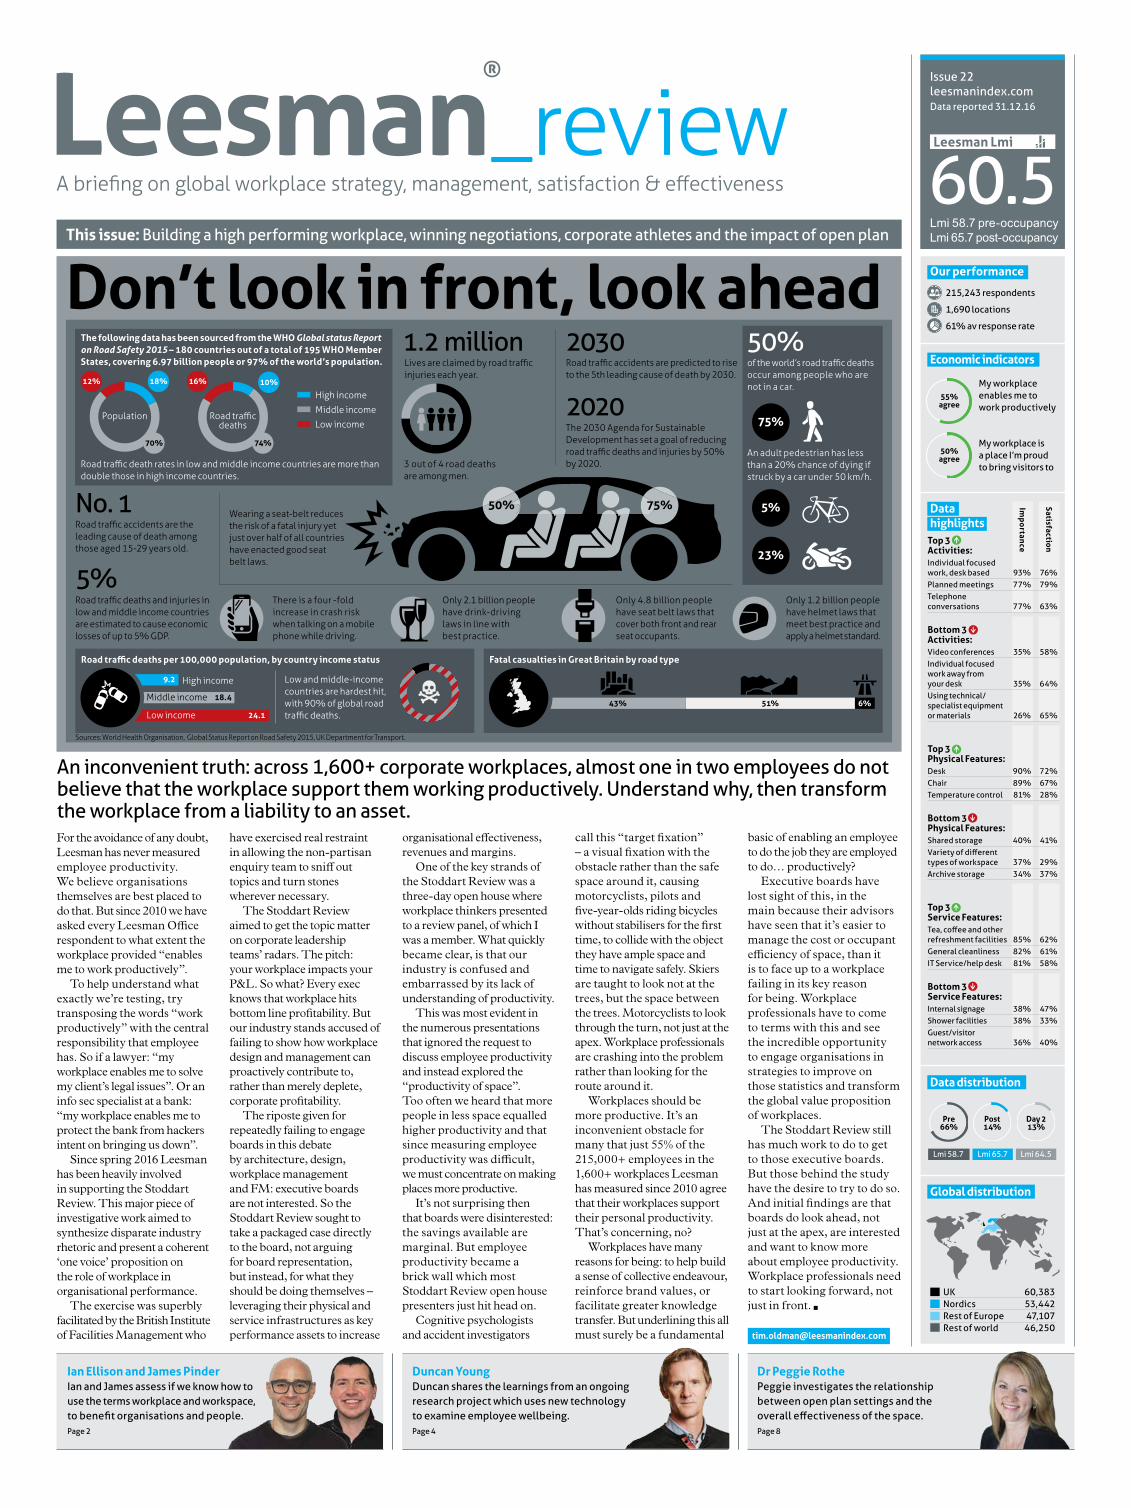
THE workplace equalizer
Workplace Matters
This article relates to this concept. It’s about how we understand the terms workspace and workplace, and whether we really know how to use them properly, in practical terms, to the benefit of our organisations and people.
The workspace industry is notorious for borrowing concepts and focusing on buzzwords and fads. People in the office sector seem to increasingly talk about place rather than space, perhaps without really understanding what the difference is. As a consequence, there is a real risk of the thinking and meaning behind the distinction being lost. And we would argue that building a “high performance workplace” is a challenge if the place/space nomenclatures are being too casually interchanged.
Words matter. They are a primary method we use to convey our thoughts and complex ideas. But we often implicitly assume that the person on the receiving end of our discourse understands things exactly as we do. So let’s take ‘workplace’. What does it mean to you? Pause for a moment here and have a ponder. If you’re in the built environment industry, your definition will most probably include some sort of physical, spatial element. But what if you’re from a HR or OD background? Chances are, any spatial element of workplace has been replaced by notions of organisational climate and culture. We’re not talking about those tom-ay-toe/tom-ah-toe type pronunciation differences here. This is about knowing your…
you know, rather than blindly adopting the phrases du jour.
The notion of place in built environment terms has its roots in urban planning and design. During the 1960s, urban activists like Jane Jacobs and behaviourists like William H Whyte began challenging the then growing conventional wisdoms of urban design. In reaction to top down and rigid planning solutions that favoured cars and shopping centres over people, Jacobs and Whyte foregrounded placemaking, both as a process and philosophy, to collaboratively reimagine public spaces as the heart of communities.
So from these foundations it becomes clear that places are fundamentally social. Turning our attention back now to workplace, we use a simple equation to capture this, and in doing so unite those different perspectives from HR and the built environment:
From here, we find it useful to frame conversations about work and workplace using the diagram above. It’s like an old-school graphic equaliser with two slide bars. One bar represents workspace, and the other
culture. Each bar runs from traditional to progressive.
So how would you position the bars to represent these two elements of your own organisation? Does one lead the other? How close are they? Have they drifted over time? Does your workspace represent your organisational culture? Now, think again. If you want to change one element, where would you move it and why?
Thinking about workplace this way is important because it shows the connectedness between the two elements. But how are they linked - with string or elastic? If you pull them too far apart, will the connected system fail? You can choose to change them independently. But many organisations make the mistake of focusing on their workspace (both physical and virtual) and either forgetting about culture, or hoping that changing their space will be a catalyst in itself.
All of a sudden the industry calling card of change your space, change your culture seems very significant, and even a potentially dangerous move. Workspace is always to some degree a reflection of your
organisation. It can help facilitate change, but it isn’t a silver bullet.
We can see evidence of our thesis here borne out through some recent Leesman insights:
1. Understand your workforce – employee activity profile (complexity) is more relevant than age, generation or gender
2. Variety is key – providing a mix of different settings and empowering employees to use them is of pivotal importance
3. Physical versus behaviour – high performance workplace does not come automatically
Just from these three points, the interplay between organisational space and culture – people doing what they do – is immediately clear. The first point nudges at both the need to understand specifically how your workforce works, rather than embrace easy and over-traded categorisations. The second turns to space, but suggests the social relevance of choice. But it is through the third that our workplace equation above really shines. High quality workspace provision is of limited use without significant
cultural consideration, through the way we go about doing what we do.
At this point it’s useful to return to the concepts of place and more specifically placemaking. If you’re going to genuinely embrace workplace, then it’s important to understand the thinking that sits behind placemaking. This is not a shopping list design exercise, or about lip service ‘consultation’. Placemaking is about action research, community participation, user-centred design, inclusivity and ownership. Heaven forbid, it’s about allowing people to change and adapt their space, rather than receive top down imposed solutions.
To use a certain built environment discipline’s title to really drive this point home, placemaking is less managing facilities and more enabling communities. In many respects the thinking behind placemaking resonates most significantly with some of the currently popular co-working spaces. For those that have been considered beyond the superficial ‘industrial chic’ aesthetic, such as the seminal Impact Hub in Westminster, designed by the iconoclastic and RIBA award-winning studio Architecture 00, the implicitly socio-spatial
(work)space + culture = (work)place.
Grammar: The difference between knowing your s--t and knowing you’re s--t.**
**
Culture
workspace
traditional Progressive
Leesman Review –– 3
3
We hear lots of talk about the ‘high-performing workplace’ and it is a great buzzword but what does it actually mean in practice and what do we need to do to achieve it?
My field is negotiation and, interestingly, this has given me an insight into what practical steps we can take to turn an organisation into a high-performing one.
You see, in the office we are negotiating all the time. Not just with our clients, suppliers and other external stakeholders but, crucially, with our internal stakeholders too. With our boss, with our team below us, with the IT team to build that new software, with the finance team to release more budget – the list is endless. Almost every interaction with a colleague is a negotiation.
So I believe a high-performing organisation is an organisation which can quickly reach win-win in all of these micro-negotiations.
Does it have to be win-win? Yes. If not, there will be resentment, de-motivation, dragging of heels, undermining and sabotage. Not the hallmarks of a high-performing organisation, I am sure you will agree.
Furthermore, what are those wins likely to be? Well, they are likely to be the business objectives for that individual, given where they are in the organisation. So the win-win outcome will (in theory at least) be the higher objectives for the overall organisation.
And quickly? Yes, this is important too. Because if it takes hours, days, weeks or months to reach that solution, it is a huge internal friction, a massive operational cost, slowing the organisation down. But if all staff are trained to think in terms of achieving win-win rapidly and efficiently, all this friction will be removed and the workplace will become so much more effective.
So How Do We Do It?If it’s about quick, win-win internal negotiations, we can break this down to 4 simple steps:
1. Be Clear About Your Win: Be very clear about the outcome you would like, be ambitious about this outcome and focus on the bigger picture.
2. Help Them Get Their Win: Step into their shoes and understand their perspective. Be ambitious for them, too. Help them achieve more than they might have thought possible themselves.
3. Resolve Any Deadlocks: Outcomes will frequently appear mutually exclusive but if you are creative and focus on the bigger picture, this is actually rarely the case. The best negotiators use compromise as a last resort; instead, by focussing on the bigger picture, they develop solutions which create more value so all parties are better off. If you need to, use neutral, independent benchmarks or third parties to reach a solution everyone agrees is fair.
4. Build Trust: The high-performing organisation is characterised by high levels of trust. Build trust by always delivering on your promises and by treating everyone fairly. Have verification procedures in place – it is these which will enable the trust and, over time, you won’t need to use them.
It sounds easy in theory and, actually, it is easier in practice than you might imagine. And if all your employees can operate by these principles, you’re a big step closer to having built a high-performing workplace.
The High-Performing Workplace A 4 Step Process
design considerations afford workplaces with community at their heart.
So what does this mean in practical terms, and how can it help you become more informed and aware regarding your workplace?
It’s about viewing space and culture together, not in isolation. It’s about gifting control back to the people that use space through the choices you provide and the leadership behaviours that empower and enable them. It’s about not just paying lip service to the term ‘workplace’ and doing
a bit of hollow consultation with those pesky users to tick the box. It’s about seeking genuine qualitative information to complement your quantitative data, in order to get past the what and into the why, particularly regarding the behavioural elements that underpin successful workplaces. Only then can decisions about your workplace become truly informed.
Here at 3edges we’re on a quest for more qualitative workplace understanding. We’ve recently launched the Workplace Matters
podcast, available on iTunes and Acast. It’s a platform to explore the rich, diverse ideas and perspectives that inform workplace knowledge, in contrast to the carefully choreographed conference slots we’re all too aware of. We hope you find it valuable. Because workplace does matter, once you really appreciate what it is.
Ian Ellison | Partner | 3edges
James Pinder PhD | Partner | 3edges
With 18 years’ experience spanning workplace and facilities management practice and education, Ian has developed a reputation as an engaging and entertaining thought leader. Passionate about the power of workplace to enable better business outcomes, his work at 3edges helps organisations to make better workplace decisions through action-led research, consultancy and education.
James is an applied researcher, consultant and educator with a longstanding interest in the workplace, and the impact it has on people and organisations. He is a skilled and experienced evaluator, adept at providing organisations with new insights and communicating those insights in ways that are engaging and easy to understand.
C W
C
W
1
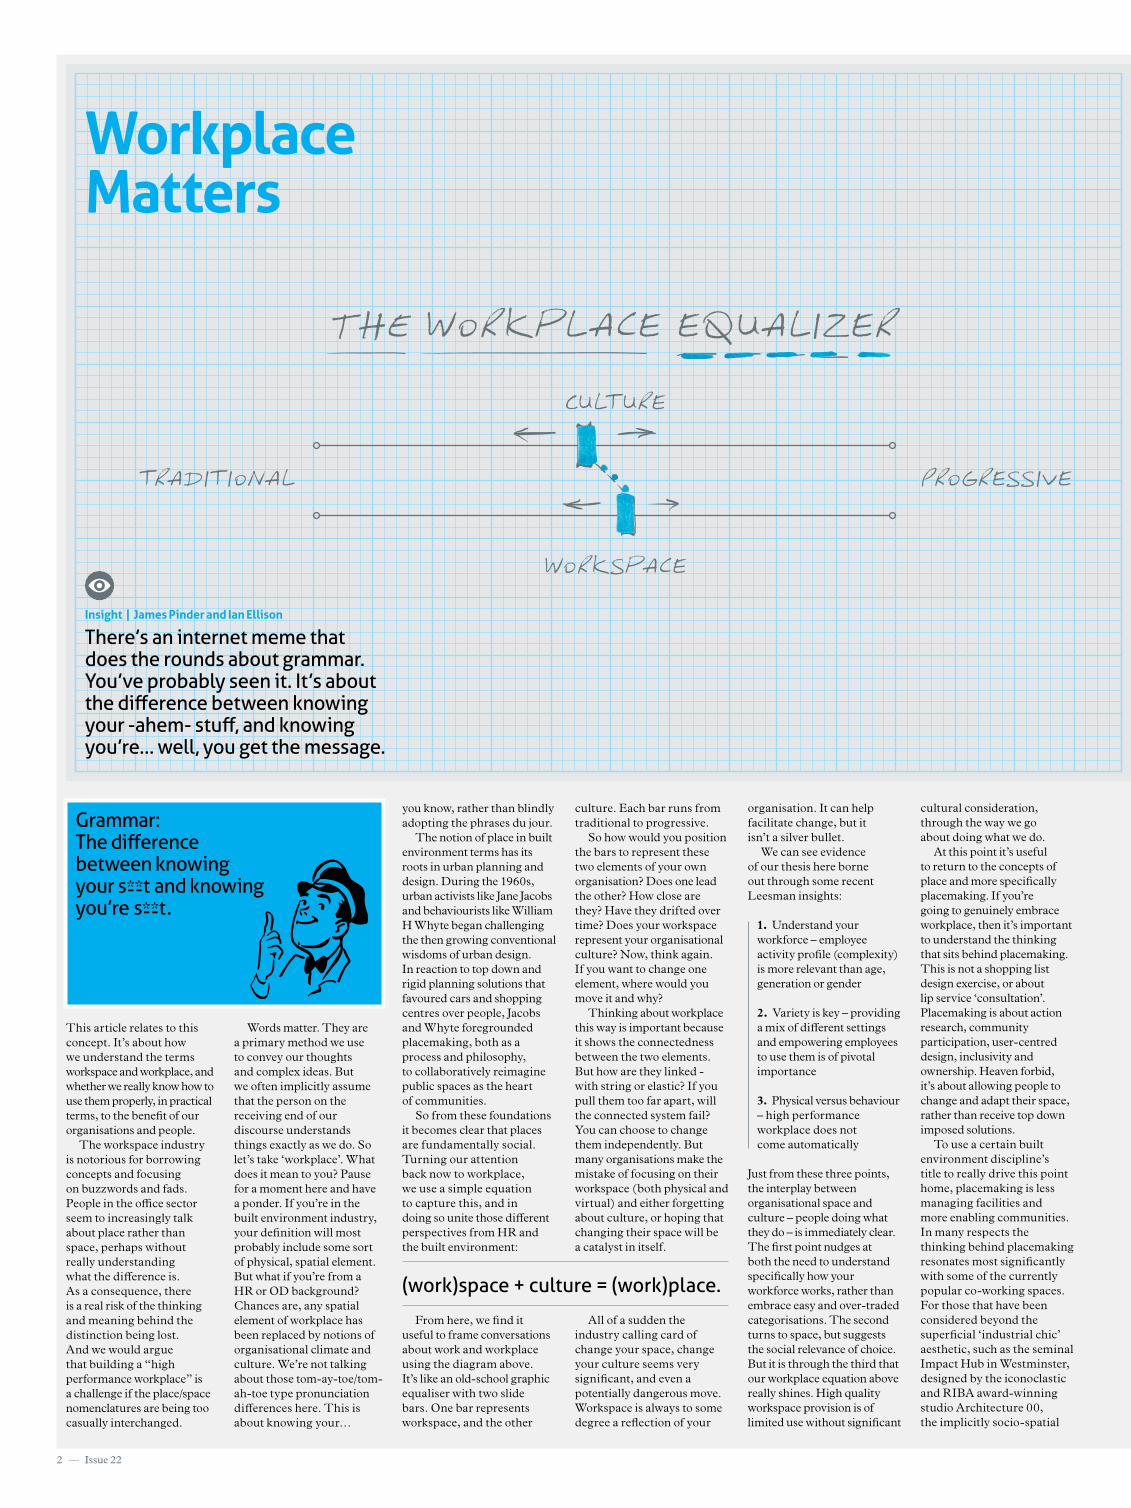
Progressive culture – terrible space
T P
C W
C
W
inhibiting workspace
in balance
Enabling workplace
2
Common misconception – space changes culture
W c
C
W
inhibiting culture
T P
A high performance workplace
T P
Progressive
Workplace ProgressiveCulture Traditional More important
Simon Horton is the author of The Leader’s Guide to Negotiation. He is a Visiting Lecturer at Imperial College and has taught negotiation and collaboration to the British Army, ExxonMobil, Slaughter and May and many other leading global organisations.
4 –– Issue 22
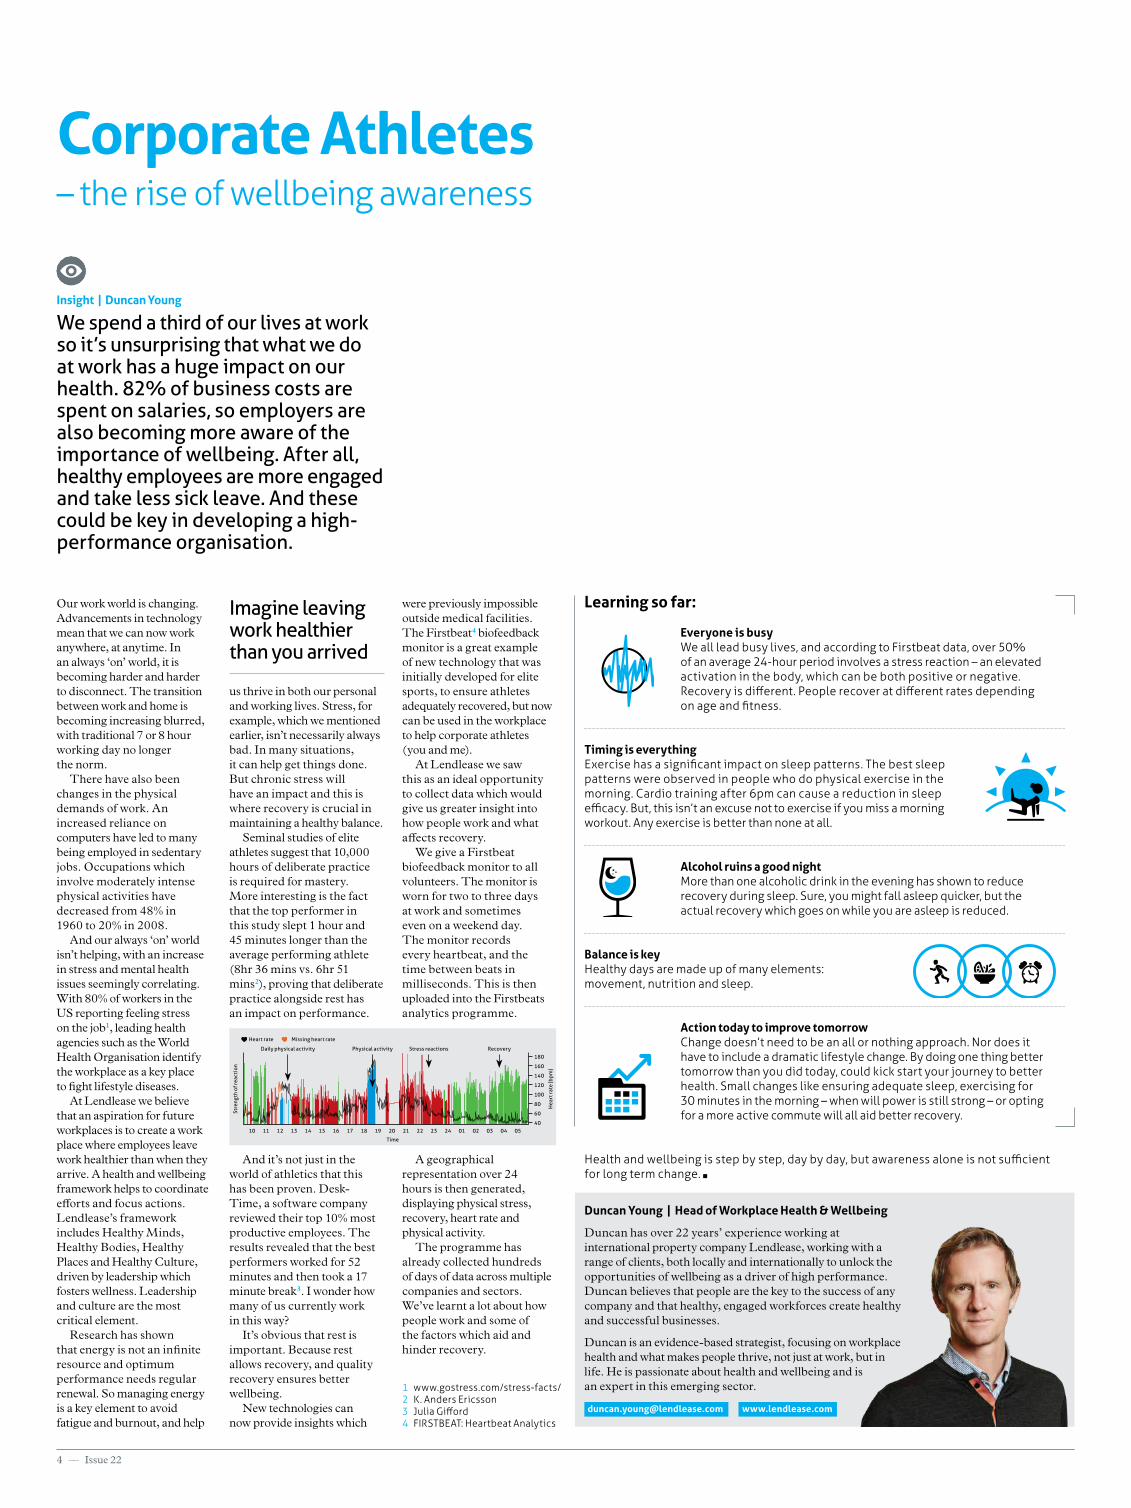
Insight | Duncan Young
We spend a third of our lives at work so it’s unsurprising that what we do at work has a huge impact on our health. 82% of business costs are spent on salaries, so employers are also becoming more aware of the importance of wellbeing. After all, healthy employees are more engaged and take less sick leave. And these could be key in developing a high- performance organisation.
Corporate Athletes
Our work world is changing. Advancements in technology mean that we can now work anywhere, at anytime. In an always ‘on’ world, it is becoming harder and harder to disconnect. The transition between work and home is becoming increasing blurred, with traditional 7 or 8 hour working day no longer the norm.
There have also been changes in the physical demands of work. An increased reliance on computers have led to many being employed in sedentary jobs. Occupations which involve moderately intense physical activities have decreased from 48% in 1960 to 20% in 2008.
And our always ‘on’ world isn’t helping, with an increase in stress and mental health issues seemingly correlating. With 80% of workers in the US reporting feeling stress on the job1, leading health agencies such as the World Health Organisation identify the workplace as a key place to fight lifestyle diseases.
At Lendlease we believe that an aspiration for future workplaces is to create a work place where employees leave work healthier than when they arrive. A health and wellbeing framework helps to coordinate efforts and focus actions. Lendlease’s framework includes Healthy Minds, Healthy Bodies, Healthy Places and Healthy Culture, driven by leadership which fosters wellness. Leadership and culture are the most critical element.
Research has shown that energy is not an infinite resource and optimum performance needs regular renewal. So managing energy is a key element to avoid fatigue and burnout, and help
us thrive in both our personal and working lives. Stress, for example, which we mentioned earlier, isn’t necessarily always bad. In many situations, it can help get things done. But chronic stress will have an impact and this is where recovery is crucial in maintaining a healthy balance.
Seminal studies of elite athletes suggest that 10,000 hours of deliberate practice is required for mastery. More interesting is the fact that the top performer in this study slept 1 hour and 45 minutes longer than the average performing athlete (8hr 36 mins vs. 6hr 51 mins2), proving that deliberate practice alongside rest has an impact on performance.
And it’s not just in the world of athletics that this has been proven. Desk-Time, a software company reviewed their top 10% most productive employees. The results revealed that the best performers worked for 52 minutes and then took a 17 minute break3. I wonder how many of us currently work in this way?
It’s obvious that rest is important. Because rest allows recovery, and quality recovery ensures better wellbeing.
New technologies can now provide insights which
were previously impossible outside medical facilities. The Firstbeat4 biofeedback monitor is a great example of new technology that was initially developed for elite sports, to ensure athletes adequately recovered, but now can be used in the workplace to help corporate athletes (you and me).
At Lendlease we saw this as an ideal opportunity to collect data which would give us greater insight into how people work and what affects recovery.
We give a Firstbeat biofeedback monitor to all volunteers. The monitor is worn for two to three days at work and sometimes even on a weekend day. The monitor records every heartbeat, and the time between beats in milliseconds. This is then uploaded into the Firstbeats analytics programme.
A geographical representation over 24 hours is then generated, displaying physical stress, recovery, heart rate and physical activity.
The programme has already collected hundreds of days of data across multiple companies and sectors. We’ve learnt a lot about how people work and some of the factors which aid and hinder recovery.
Duncan Young | Head of Workplace Health & Wellbeing
– the rise of wellbeing awareness
Duncan has over 22 years’ experience working at international property company Lendlease, working with a range of clients, both locally and internationally to unlock the opportunities of wellbeing as a driver of high performance. Duncan believes that people are the key to the success of any company and that healthy, engaged workforces create healthy and successful businesses.
Duncan is an evidence-based strategist, focusing on workplace health and what makes people thrive, not just at work, but in life. He is passionate about health and wellbeing and is an expert in this emerging sector.
[email protected] www.lendlease.com
Learning so far:
Everyone is busy We all lead busy lives, and according to Firstbeat data, over 50% of an average 24-hour period involves a stress reaction – an elevated activation in the body, which can be both positive or negative. Recovery is different. People recover at different rates depending on age and fitness.
Timing is everythingExercise has a significant impact on sleep patterns. The best sleep patterns were observed in people who do physical exercise in the morning. Cardio training after 6pm can cause a reduction in sleep efficacy. But, this isn’t an excuse not to exercise if you miss a morning workout. Any exercise is better than none at all.
Alcohol ruins a good night More than one alcoholic drink in the evening has shown to reduce recovery during sleep. Sure, you might fall asleep quicker, but the actual recovery which goes on while you are asleep is reduced.
Balance is keyHealthy days are made up of many elements: movement, nutrition and sleep.
Action today to improve tomorrowChange doesn’t need to be an all or nothing approach. Nor does it have to include a dramatic lifestyle change. By doing one thing better tomorrow than you did today, could kick start your journey to better health. Small changes like ensuring adequate sleep, exercising for 30 minutes in the morning – when will power is still strong – or opting for a more active commute will all aid better recovery.
Health and wellbeing is step by step, day by day, but awareness alone is not sufficient for long term change.
1 www.gostress.com/stress-facts/ 2 K. Anders Ericsson3 Julia Gifford4 FIRSTBEAT: Heartbeat Analytics
Heart rate Missing heart rate
Imagine leaving work healthier than you arrived
Stre
ngth
of r
eact
ion
Daily physical activity Physical activity Stress reactions Recovery
60
80
100
120
140
160
180
4010 2014 2412 2216 0218 0411 2115 0113 2317 0319 05
Hea
rt ra
te (b
pm
)
Time
Leesman Review –– 5
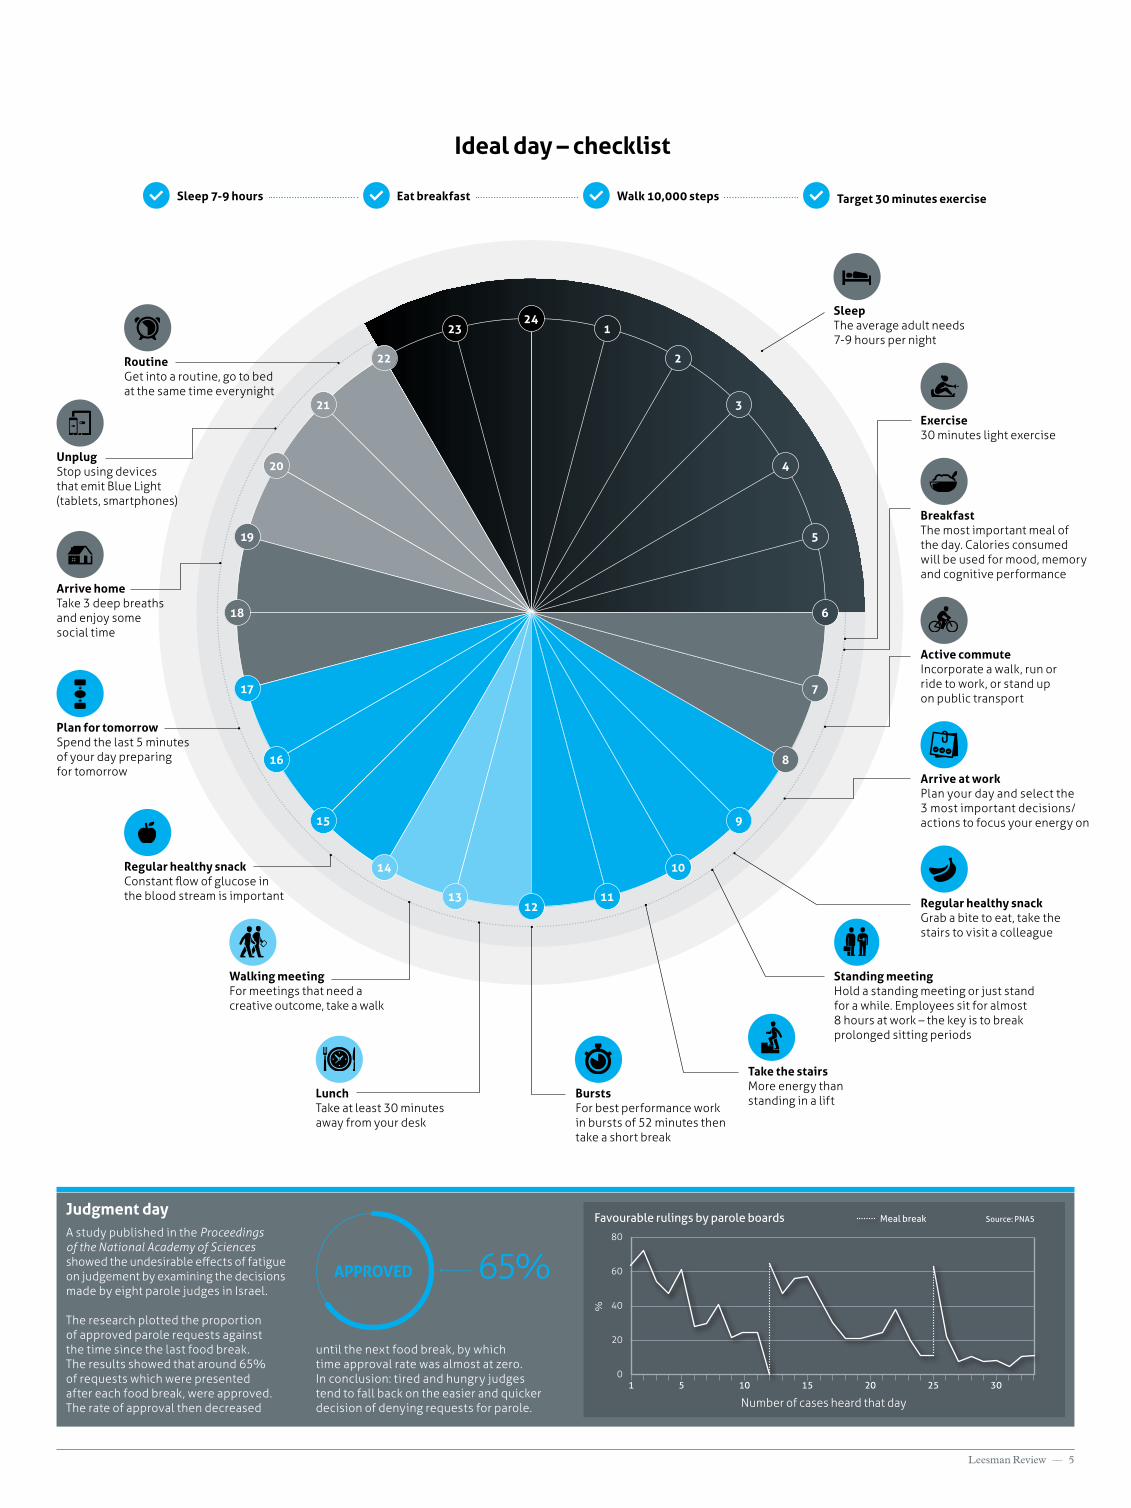
Judgment dayA study published in the Proceedings of the National Academy of Sciences showed the undesirable effects of fatigue on judgement by examining the decisions made by eight parole judges in Israel.
The research plotted the proportion of approved parole requests against the time since the last food break. The results showed that around 65% of requests which were presented after each food break, were approved. The rate of approval then decreased
until the next food break, by which time approval rate was almost at zero. In conclusion: tired and hungry judges tend to fall back on the easier and quicker decision of denying requests for parole.
SleepThe average adult needs 7-9 hours per night
Exercise30 minutes light exercise
BreakfastThe most important meal of the day. Calories consumed will be used for mood, memory and cognitive performance
Active commuteIncorporate a walk, run or ride to work, or stand up on public transport
Arrive at workPlan your day and select the 3 most important decisions/ actions to focus your energy on
Regular healthy snackGrab a bite to eat, take the stairs to visit a colleague
Standing meetingHold a standing meeting or just stand for a while. Employees sit for almost 8 hours at work – the key is to break prolonged sitting periods
Take the stairsMore energy than standing in a lift
BurstsFor best performance work in bursts of 52 minutes then take a short break
LunchTake at least 30 minutes away from your desk
Walking meetingFor meetings that need a creative outcome, take a walk
Regular healthy snackConstant flow of glucose in the blood stream is important
Plan for tomorrowSpend the last 5 minutes of your day preparing for tomorrow
UnplugStop using devices that emit Blue Light (tablets, smartphones)
RoutineGet into a routine, go to bed at the same time everynight
Arrive homeTake 3 deep breaths and enjoy some social time
12
24
13
1
14
2
11
23
10
22
15
3
16
4
17
5
9
21
8
20
7
19
618
Ideal day – checklist
Sleep 7-9 hours Target 30 minutes exerciseWalk 10,000 stepsEat breakfast
Favourable rulings by parole boards
0
60
80
20
40%
1 5 10 15 20 25 30
Number of cases heard that day
Meal break Source: PNAS
65%APPROVED
6 –– Issue 22
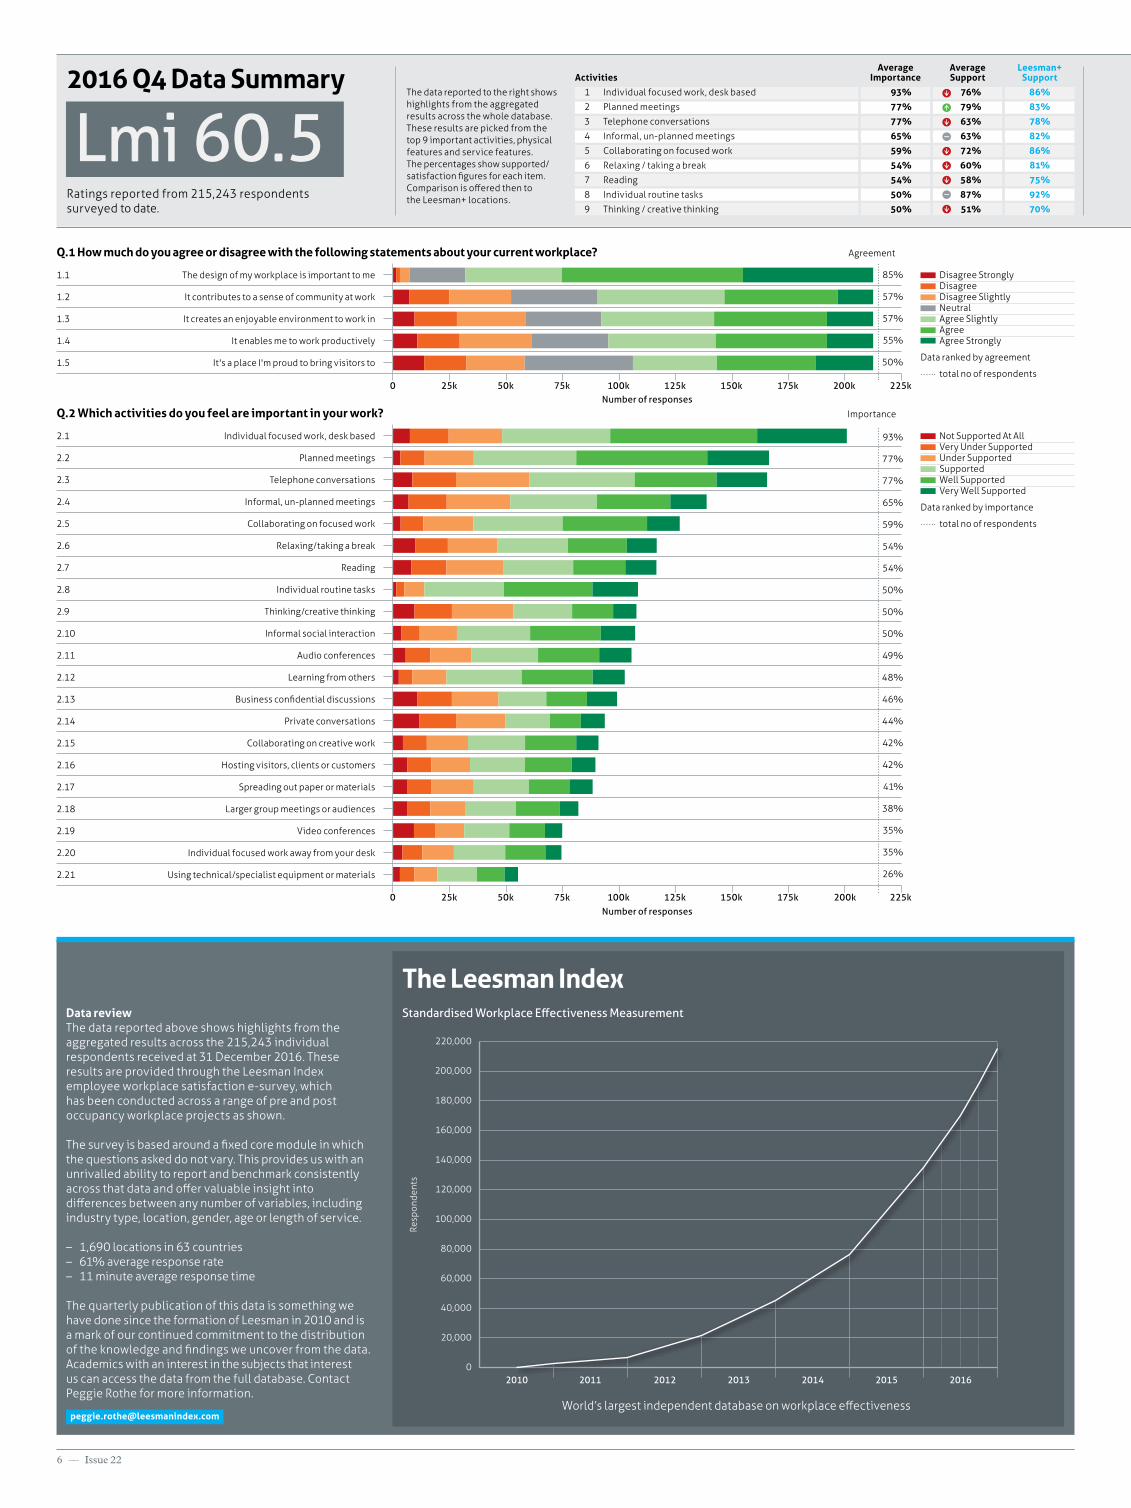
1.1 The design of my workplace is important to me
1.2 It contributes to a sense of community at work
1.3 It creates an enjoyable environment to work in
1.4 It enables me to work productively
1.5 It's a place I'm proud to bring visitors to
Q.1 How much do you agree or disagree with the following statements about your current workplace?
Disagree Strongly Disagree Disagree Slightly Neutral Agree Slightly Agree Agree Strongly
Data ranked by agreement
total no of respondents225k
225k
175k150k125k100k75k50k25k
2.1 Individual focused work, desk based
2.2 Planned meetings
2.3 Telephone conversations
2.4 Informal, un-planned meetings
2.5 Collaborating on focused work
2.6 Relaxing/taking a break
2.7 Reading
2.8 Individual routine tasks
2.9 Thinking/creative thinking
2.10 Informal social interaction
2.11 Audio conferences
2.12 Learning from others
2.13 Business confidential discussions
2.14 Private conversations
2.15 Collaborating on creative work
2.16 Hosting visitors, clients or customers
2.17 Spreading out paper or materials
2.18 Larger group meetings or audiences
2.19 Video conferences
2.20 Individual focused work away from your desk
2.21 Using technical/specialist equipment or materials
Q.2 Which activities do you feel are important in your work?
Number of responses
Number of responses
Not Supported At All Very Under Supported Under Supported Supported Well Supported Very Well Supported
Data ranked by importance
total no of respondents
93%
77%
77%
65%
59%
54%
54%
50%
50%
50%
49%
48%
46%
44%
42%
42%
41%
38%
35%
35%
26%
85%
57%
57%
55%
50%
0
0
Activities
1 Individual focused work, desk based 93% 76%
2 Planned meetings 77% 79%
3 Telephone conversations 77% 63%
4 Informal, un-planned meetings 65% 63%
5 Collaborating on focused work 59% 72%
6 Relaxing / taking a break 54% 60%
7 Reading 54% 58%
8 Individual routine tasks 50% 87%
9 Thinking / creative thinking 50% 51%
AverageSupport
Leesman+Support
86%
83%
78%
82%
86%
81%
75%
92%
70%
AverageImportance
The data reported to the right shows highlights from the aggregated results across the whole database. These results are picked from the top 9 important activities, physical features and service features. The percentages show supported/satisfaction figures for each item. Comparison is offered then to the Leesman+ locations.
2016 Q4 Data Summary
Lmi 60.5Ratings reported from 215,243 respondents surveyed to date.
Data review The data reported above shows highlights from the aggregated results across the 215,243 individual respondents received at 31 December 2016. These results are provided through the Leesman Index employee workplace satisfaction e-survey, which has been conducted across a range of pre and post occupancy workplace projects as shown.
The survey is based around a fixed core module in which the questions asked do not vary. This provides us with an unrivalled ability to report and benchmark consistently across that data and offer valuable insight into differences between any number of variables, including industry type, location, gender, age or length of service.
– 1,690 locations in 63 countries – 61% average response rate– 11 minute average response time
The quarterly publication of this data is something we have done since the formation of Leesman in 2010 and is a mark of our continued commitment to the distribution of the knowledge and findings we uncover from the data. Academics with an interest in the subjects that interest us can access the data from the full database. Contact Peggie Rothe for more information.
Agreement
Importance
200k
200k175k150k125k100k75k50k25k
Standardised Workplace Effectiveness Measurement
The Leesman Index
Resp
onde
nts
2010 20122011 2013 2014 2015 2016
World’s largest independent database on workplace effectiveness
0
20,000
120,000
100,000
200,000
220,000
60,000
160,000
80,000
180,000
40,000
140,000
Leesman Review –– 7
225k200k175k150k125k100k75k50k25k
225k200k175k150k125k100k75k50k25k
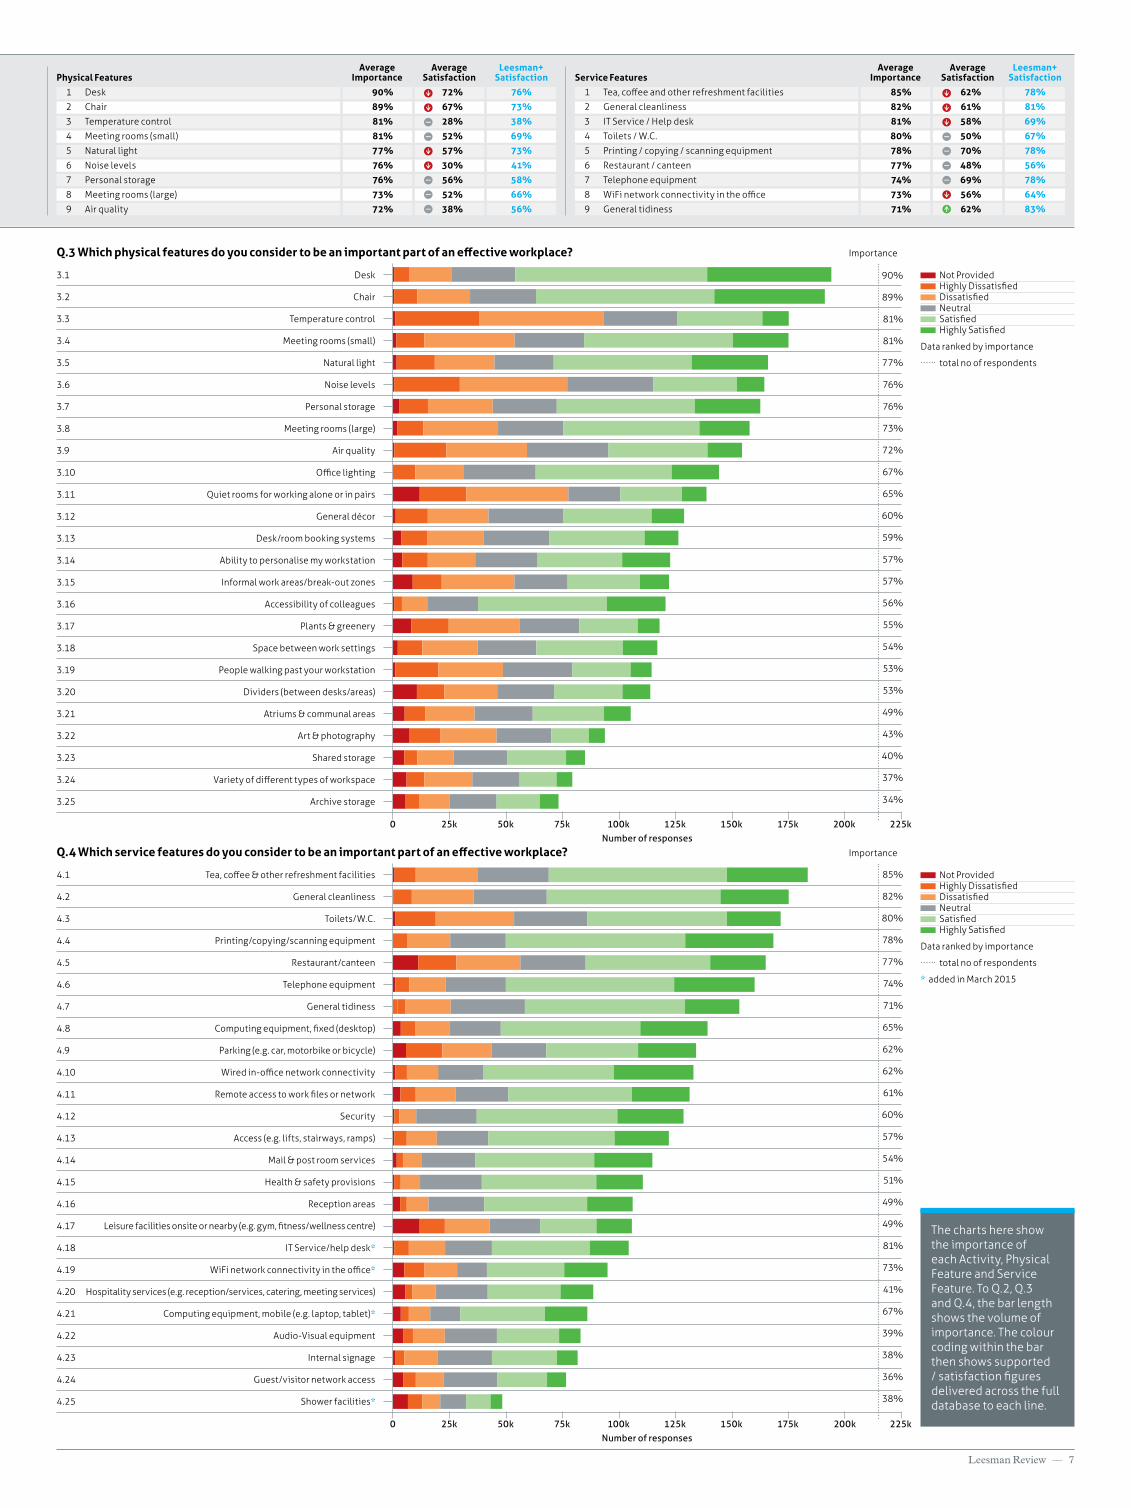
3.1 Desk
3.2 Chair
3.3 Temperature control
3.4 Meeting rooms (small)
3.5 Natural light
3.6 Noise levels
3.7 Personal storage
3.8 Meeting rooms (large)
3.9 Air quality
3.10 Office lighting
3.11 Quiet rooms for working alone or in pairs
3.12 General décor
3.13 Desk/room booking systems
3.14 Ability to personalise my workstation
3.15 Informal work areas/break-out zones
3.16 Accessibility of colleagues
3.17 Plants & greenery
3.18 Space between work settings
3.19 People walking past your workstation
3.20 Dividers (between desks/areas)
3.21 Atriums & communal areas
3.22 Art & photography
3.23 Shared storage
3.24 Variety of different types of workspace
3.25 Archive storage
The charts here show the importance of each Activity, Physical Feature and Service Feature. To Q.2, Q.3 and Q.4, the bar length shows the volume of importance. The colour coding within the bar then shows supported / satisfaction figures delivered across the full database to each line.
0Number of responses
Q.3 Which physical features do you consider to be an important part of an effective workplace?
Not Provided Highly Dissatisfied Dissatisfied Neutral Satisfied Highly Satisfied
Data ranked by importance
total no of respondents
Q.4 Which service features do you consider to be an important part of an effective workplace?
Number of responses
Not Provided Highly Dissatisfied Dissatisfied Neutral Satisfied Highly Satisfied
Data ranked by importance
total no of respondents
* added in March 2015
0
Physical Features Service Features
1 Desk 90% 72%
2 Chair 89% 67%
3 Temperature control 81% 28%
4 Meeting rooms (small) 81% 52%
5 Natural light 77% 57%
6 Noise levels 76% 30%
7 Personal storage 76% 56%
8 Meeting rooms (large) 73% 52%
9 Air quality 72% 38%
1 Tea, coffee and other refreshment facilities 85% 62%
2 General cleanliness 82% 61%
3 IT Service / Help desk 81% 58%
4 Toilets / W.C. 80% 50%
5 Printing / copying / scanning equipment 78% 70%
6 Restaurant / canteen 77% 48%
7 Telephone equipment 74% 69%
8 WiFi network connectivity in the office 73% 56%
9 General tidiness 71% 62%
AverageSatisfaction
AverageSatisfaction
Leesman+Satisfaction
76%
73%
38%
69%
73%
41%
58%
66%
56%
Leesman+Satisfaction
78%
81%
69%
67%
78%
56%
78%
64%
83%
AverageImportance
AverageImportance
Importance
Importance
4.1 Tea, coffee & other refreshment facilities
4.2 General cleanliness
4.3 Toilets/W.C.
4.4 Printing/copying/scanning equipment
4.5 Restaurant/canteen
4.6 Telephone equipment
4.7 General tidiness
4.8 Computing equipment, fixed (desktop)
4.9 Parking (e.g. car, motorbike or bicycle)
4.10 Wired in-office network connectivity
4.11 Remote access to work files or network
4.12 Security
4.13 Access (e.g. lifts, stairways, ramps)
4.14 Mail & post room services
4.15 Health & safety provisions
4.16 Reception areas
4.17 Leisure facilities onsite or nearby (e.g. gym, fitness/wellness centre)
4.18 IT Service/help desk*
4.19 WiFi network connectivity in the office*
4.20 Hospitality services (e.g. reception/services, catering, meeting services)
4.21 Computing equipment, mobile (e.g. laptop, tablet)*
4.22 Audio-Visual equipment
4.23 Internal signage
4.24 Guest/visitor network access
4.25 Shower facilities*
90%
89%
81%
81%
77%
76%
76%
73%
72%
67%
65%
60%
59%
57%
57%
56%
55%
54%
53%
53%
49%
43%
40%
37%
34%
85%
82%
80%
78%
77%
74%
71%
65%
62%
62%
61%
60%
57%
54%
51%
49%
49%
81%
73%
41%
67%
39%
38%
36%
38%
In his 2012 book “21st Century Management,”
So being successful in even the most creative, innovative and collaborative of job profiles will require some time to reflect and internalise on your own – and a high performing workplace will successfully provide space for this, alongside space for collaboration.
8 –– Issue 22
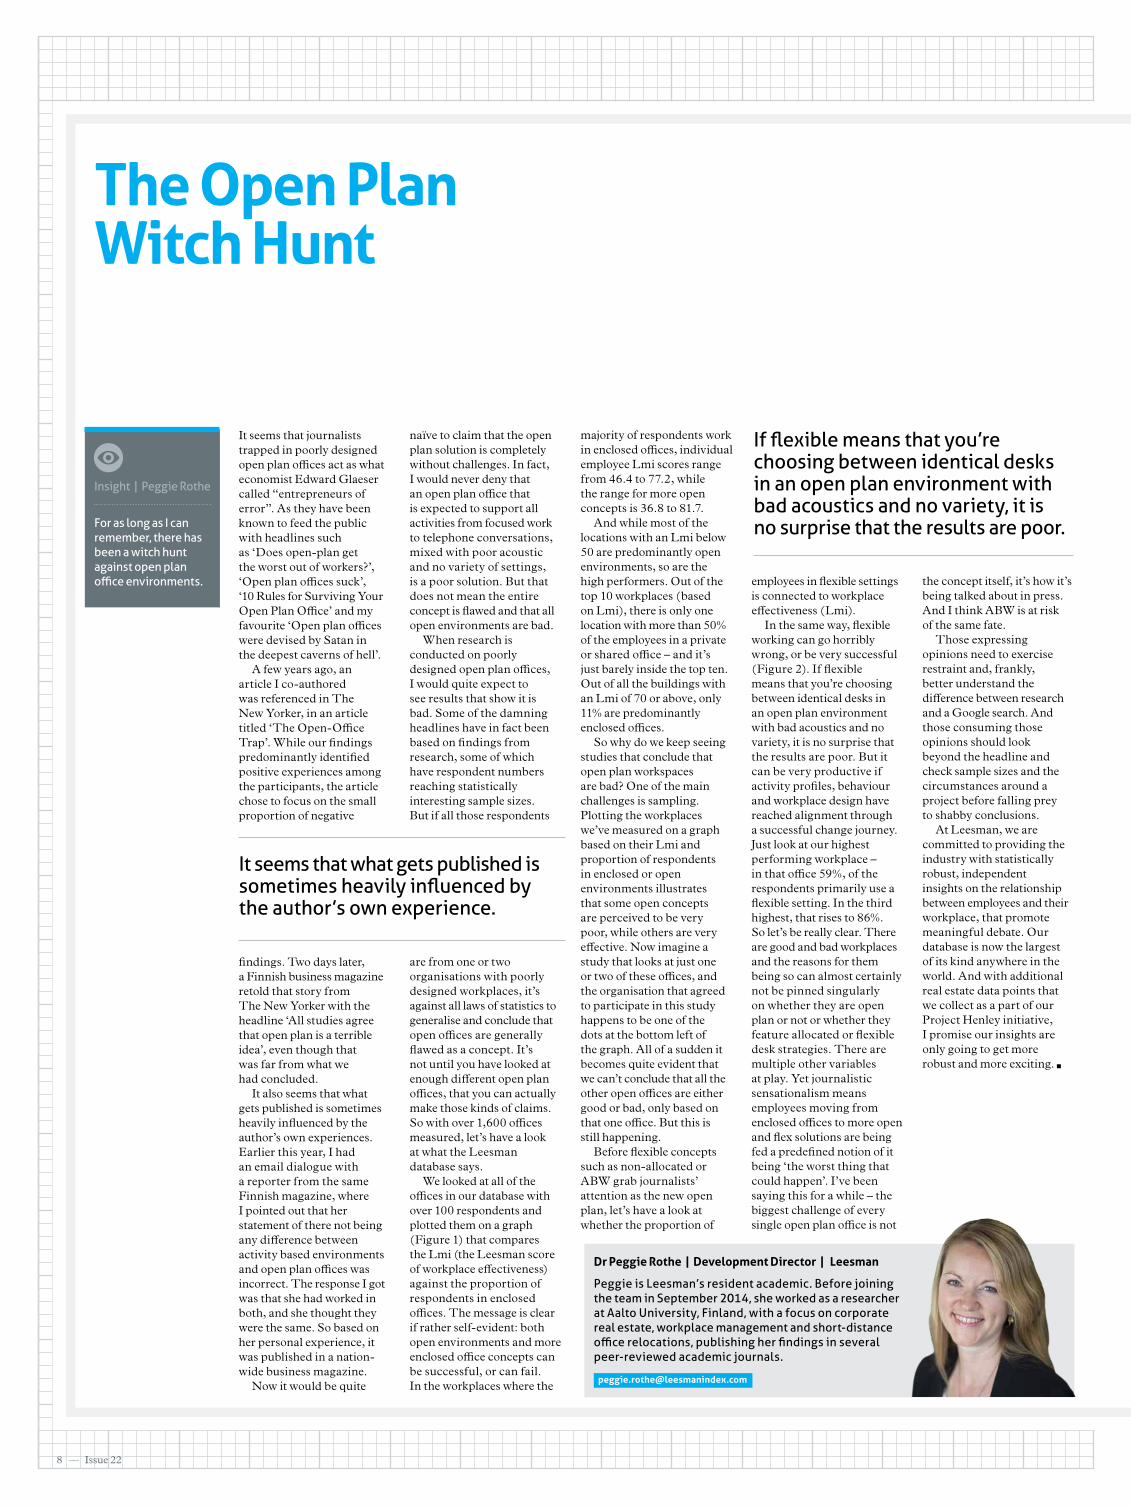
Dr Peggie Rothe | Development Director | Leesman
Peggie is Leesman’s resident academic. Before joining the team in September 2014, she worked as a researcher at Aalto University, Finland, with a focus on corporate real estate, workplace management and short-distance office relocations, publishing her findings in several peer-reviewed academic journals.
The Open Plan Witch Hunt
It seems that journalists trapped in poorly designed open plan offices act as what economist Edward Glaeser called “entrepreneurs of error”. As they have been known to feed the public with headlines such as ‘Does open-plan get the worst out of workers?’, ‘Open plan offices suck’, ‘10 Rules for Surviving Your Open Plan Office’ and my favourite ‘Open plan offices were devised by Satan in the deepest caverns of hell’.
A few years ago, an article I co-authored was referenced in The New Yorker, in an article titled ‘The Open-Office Trap’. While our findings predominantly identified positive experiences among the participants, the article chose to focus on the small proportion of negative
findings. Two days later, a Finnish business magazine retold that story from The New Yorker with the headline ‘All studies agree that open plan is a terrible idea’, even though that was far from what we had concluded.
It also seems that what gets published is sometimes heavily influenced by the author’s own experiences. Earlier this year, I had an email dialogue with a reporter from the same Finnish magazine, where I pointed out that her statement of there not being any difference between activity based environments and open plan offices was incorrect. The response I got was that she had worked in both, and she thought they were the same. So based on her personal experience, it was published in a nation-wide business magazine.
Now it would be quite
naïve to claim that the open plan solution is completely without challenges. In fact, I would never deny that an open plan office that is expected to support all activities from focused work to telephone conversations, mixed with poor acoustic and no variety of settings, is a poor solution. But that does not mean the entire concept is flawed and that all open environments are bad.
When research is conducted on poorly designed open plan offices, I would quite expect to see results that show it is bad. Some of the damning headlines have in fact been based on findings from research, some of which have respondent numbers reaching statistically interesting sample sizes. But if all those respondents
are from one or two organisations with poorly designed workplaces, it’s against all laws of statistics to generalise and conclude that open offices are generally flawed as a concept. It’s not until you have looked at enough different open plan offices, that you can actually make those kinds of claims. So with over 1,600 offices measured, let’s have a look at what the Leesman database says.
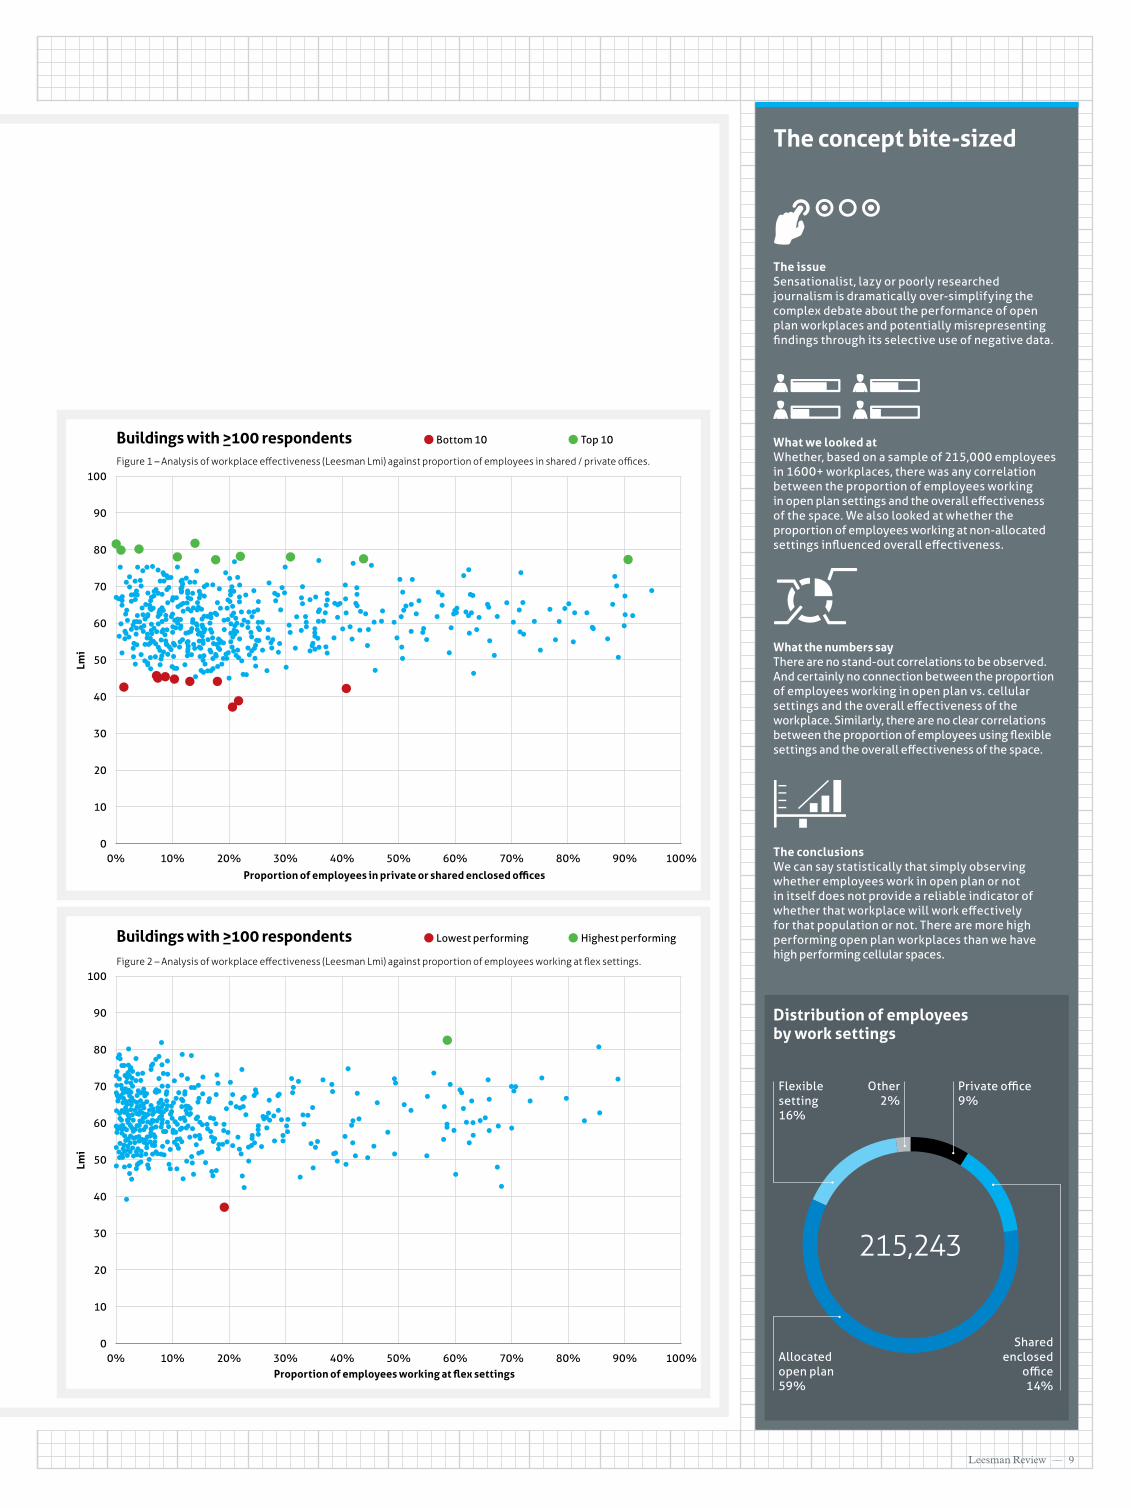
We looked at all of the offices in our database with over 100 respondents and plotted them on a graph (Figure 1) that compares the Lmi (the Leesman score of workplace effectiveness) against the proportion of respondents in enclosed offices. The message is clear if rather self-evident: both open environments and more enclosed office concepts can be successful, or can fail. In the workplaces where the
majority of respondents work in enclosed offices, individual employee Lmi scores range from 46.4 to 77.2, while the range for more open concepts is 36.8 to 81.7.
And while most of the locations with an Lmi below 50 are predominantly open environments, so are the high performers. Out of the top 10 workplaces (based on Lmi), there is only one location with more than 50% of the employees in a private or shared office – and it’s just barely inside the top ten. Out of all the buildings with an Lmi of 70 or above, only 11% are predominantly enclosed offices.
So why do we keep seeing studies that conclude that open plan workspaces are bad? One of the main challenges is sampling. Plotting the workplaces we’ve measured on a graph based on their Lmi and proportion of respondents in enclosed or open environments illustrates that some open concepts are perceived to be very poor, while others are very effective. Now imagine a study that looks at just one or two of these offices, and the organisation that agreed to participate in this study happens to be one of the dots at the bottom left of the graph. All of a sudden it becomes quite evident that we can’t conclude that all the other open offices are either good or bad, only based on that one office. But this is still happening.
Before flexible concepts such as non-allocated or ABW grab journalists’ attention as the new open plan, let’s have a look at whether the proportion of
employees in flexible settings is connected to workplace effectiveness (Lmi).
In the same way, flexible working can go horribly wrong, or be very successful (Figure 2). If flexible means that you’re choosing between identical desks in an open plan environment with bad acoustics and no variety, it is no surprise that the results are poor. But it can be very productive if activity profiles, behaviour and workplace design have reached alignment through a successful change journey. Just look at our highest performing workplace – in that office 59%, of the respondents primarily use a flexible setting. In the third highest, that rises to 86%. So let’s be really clear. There are good and bad workplaces and the reasons for them being so can almost certainly not be pinned singularly on whether they are open plan or not or whether they feature allocated or flexible desk strategies. There are multiple other variables at play. Yet journalistic sensationalism means employees moving from enclosed offices to more open and flex solutions are being fed a predefined notion of it being ‘the worst thing that could happen’. I’ve been saying this for a while – the biggest challenge of every single open plan office is not
the concept itself, it’s how it’s being talked about in press. And I think ABW is at risk of the same fate.
Those expressing opinions need to exercise restraint and, frankly, better understand the difference between research and a Google search. And those consuming those opinions should look beyond the headline and check sample sizes and the circumstances around a project before falling prey to shabby conclusions.
At Leesman, we are committed to providing the industry with statistically robust, independent insights on the relationship between employees and their workplace, that promote meaningful debate. Our database is now the largest of its kind anywhere in the world. And with additional real estate data points that we collect as a part of our Project Henley initiative, I promise our insights are only going to get more robust and more exciting.
Insight | Peggie Rothe
For as long as I can remember, there has been a witch hunt against open plan office environments.
If flexible means that you’re choosing between identical desks in an open plan environment with bad acoustics and no variety, it is no surprise that the results are poor.
It seems that what gets published is sometimes heavily influenced by the author’s own experience.
Leesman Review –– 9
The issue Sensationalist, lazy or poorly researched journalism is dramatically over-simplifying the complex debate about the performance of open plan workplaces and potentially misrepresenting findings through its selective use of negative data.
What we looked at Whether, based on a sample of 215,000 employees in 1600+ workplaces, there was any correlation between the proportion of employees working in open plan settings and the overall effectiveness of the space. We also looked at whether the proportion of employees working at non-allocated settings influenced overall effectiveness.
What the numbers say There are no stand-out correlations to be observed. And certainly no connection between the proportion of employees working in open plan vs. cellular settings and the overall effectiveness of the workplace. Similarly, there are no clear correlations between the proportion of employees using flexible settings and the overall effectiveness of the space.
The conclusions We can say statistically that simply observing whether employees work in open plan or not in itself does not provide a reliable indicator of whether that workplace will work effectively for that population or not. There are more high performing open plan workplaces than we have high performing cellular spaces.
Distribution of employees by work settings
Flexible setting16%
Private office9%
Allocated open plan59%
Shared enclosed
office14%
Other2%
The concept bite-sized
Proportion of employees in private or shared enclosed offices
Proportion of employees working at flex settings
Figure 1 – Analysis of workplace effectiveness (Leesman Lmi) against proportion of employees in shared / private offices.
Buildings with >100 respondents_ Bottom 10 Top 10
_Buildings with >100 respondents Lowest performing Highest performing
Lmi
90
80
70
60
50
40
30
20
10
0% 10% 20% 30% 40% 50% 60% 70% 80% 90% 100%0
100
Lmi
90
80
70
60
50
40
30
20
10
0% 10% 20% 30% 40% 50% 60% 70% 80% 90% 100%0
100Figure 2 – Analysis of workplace effectiveness (Leesman Lmi) against proportion of employees working at flex settings.
215,243
10 –– Issue 22
The Rise and Rise of Activity Based WorkingAcross the world, businesses of all sizes are seeking to understand the potential benefits of creating agile, more flexible workplaces. For the brave, the principles and promises of Activity Based Working (ABW) are becoming increasingly appealing.
But is it really working? Does it create a more effective workplace?
And perhaps most importantly, does it better support individual productivity? This is what Leesman set out to test in a 12-month examination.
74,500 employees later, of which 11,300 were working in ABW environments, and we have uncovered a mixed picture where averages
mask a dramatically diverse picture showing how ABW environments deliver significant performance improvements on multiple measurement lines for employees who modify behaviours to their new surroundings. But almost always, these employees are dramatically outnumbered by those who maintain distinctly traditional
workstyles, putting them in conflict with their new environment.
The report showed that Activity Based Working can deliver significant operational benefits for those who use the environments provided for them. The more an employee uses multiple work locations within the workplace, the
more they report that the space enables them to work more effectively. The more complex an employee’s daily work profile, the more beneficial it is for them to work in a mobile way that utilises multiple settings. And lastly that poor adoption of appropriate behaviour in activity based workplaces is a significant problem
that limits widespread organisational benefits.
The report also shows that role and activity complexity appear to the key driver for both ABW adoption and ABW benefits.
The full report is available to download at
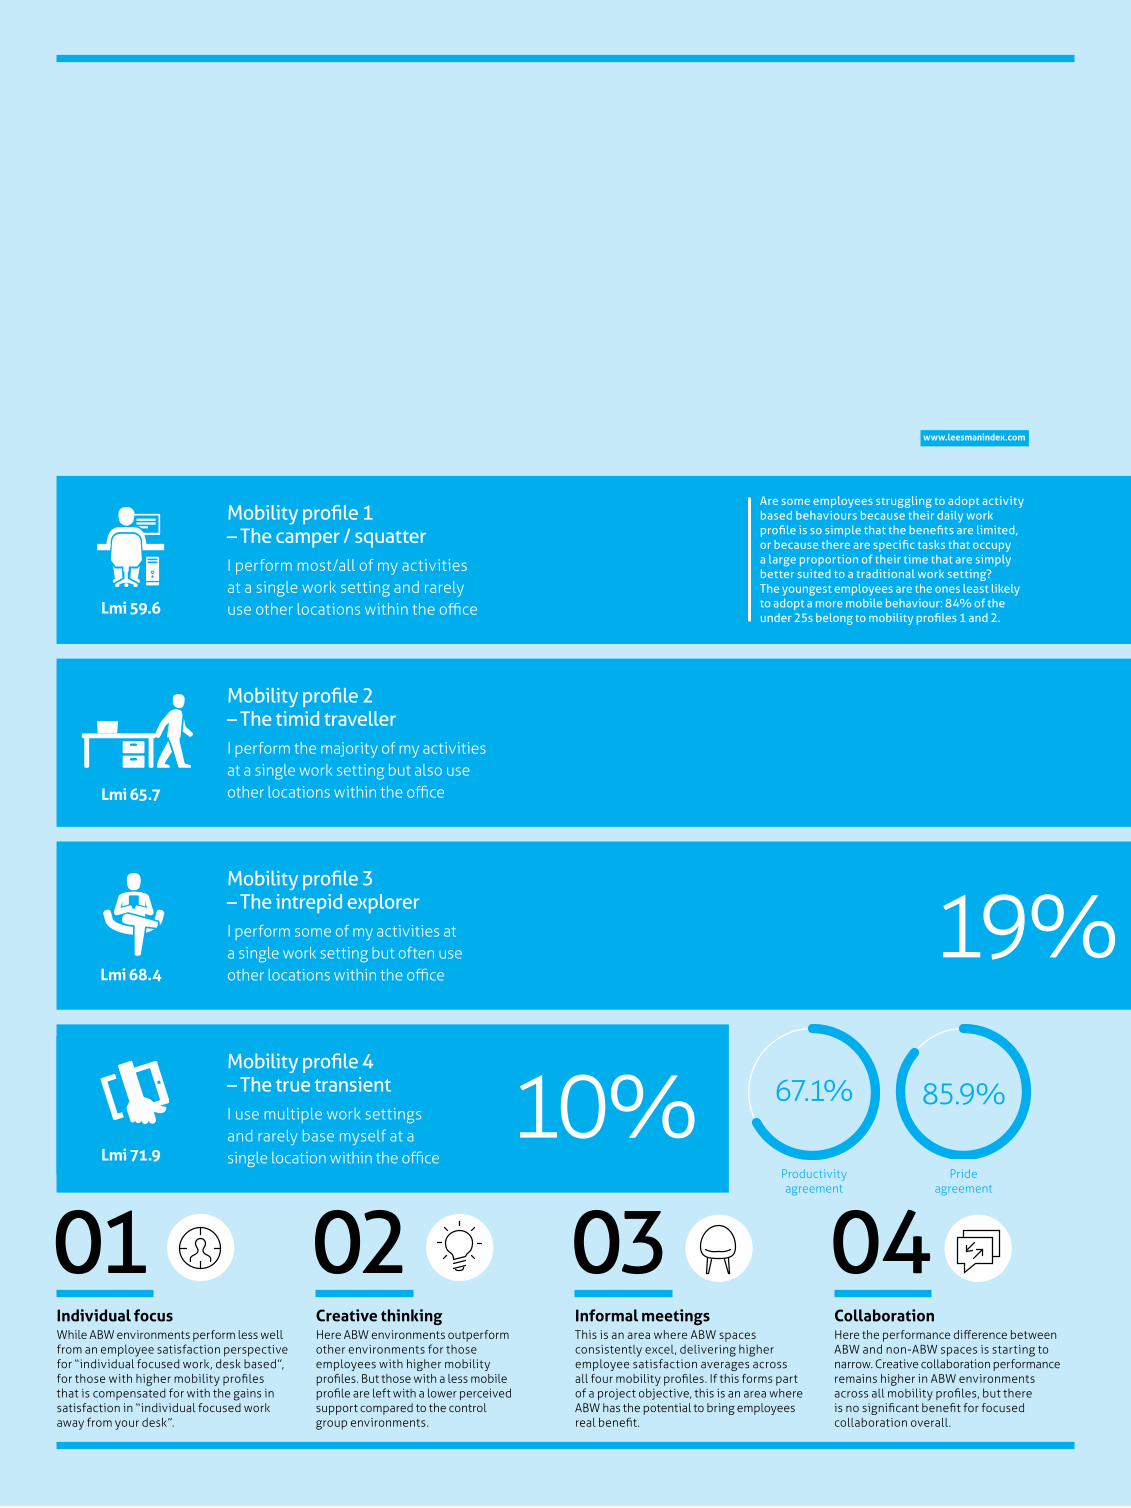
Mobility profile 1 – The camper / squatterI perform most/all of my activities at a single work setting and rarely use other locations within the officeLmi 59.6
Are some employees struggling to adopt activity based behaviours because their daily work profile is so simple that the benefits are limited, or because there are specific tasks that occupy a large proportion of their time that are simply better suited to a traditional work setting? The youngest employees are the ones least likely to adopt a more mobile behaviour: 84% of the under 25s belong to mobility profiles 1 and 2.
Mobility profile 2 – The timid travellerI perform the majority of my activities at a single work setting but also use other locations within the officeLmi 65.7
Mobility profile 3 – The intrepid explorerI perform some of my activities at a single work setting but often use other locations within the officeLmi 68.4
19%Mobility profile 4 – The true transientI use multiple work settings and rarely base myself at a single location within the office
10%Lmi 71.9
Productivity agreement
Pride agreement
85.9%67.1%
Individual focusWhile ABW environments perform less well from an employee satisfaction perspective for “individual focused work, desk based”, for those with higher mobility profiles that is compensated for with the gains in satisfaction in “individual focused work away from your desk”.
01Creative thinkingHere ABW environments outperform other environments for those employees with higher mobility profiles. But those with a less mobile profile are left with a lower perceived support compared to the control group environments.
02Informal meetingsThis is an area where ABW spaces consistently excel, delivering higher employee satisfaction averages across all four mobility profiles. If this forms part of a project objective, this is an area where ABW has the potential to bring employees real benefit.
03CollaborationHere the performance difference between ABW and non-ABW spaces is starting to narrow. Creative collaboration performance remains higher in ABW environments across all mobility profiles, but there is no significant benefit for focused collaboration overall.
04
www.leesmanindex.com
Leesman Review –– 11
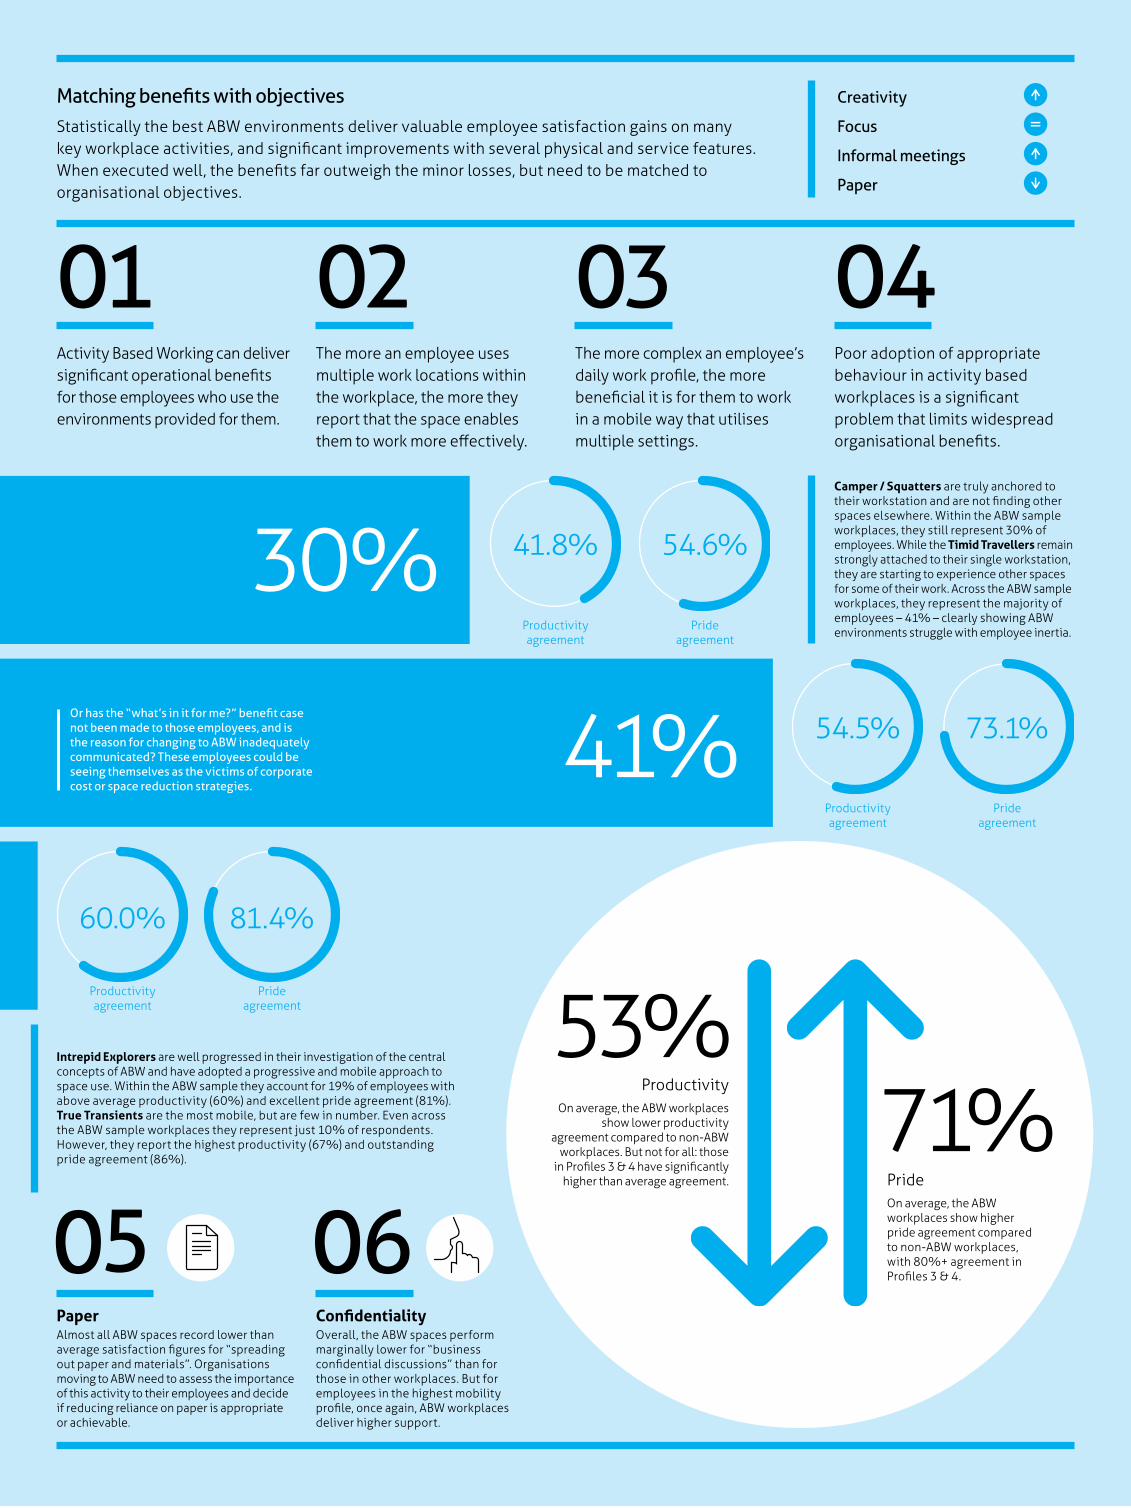
30%Or has the “what’s in it for me?” benefit case not been made to those employees, and is the reason for changing to ABW inadequately communicated? These employees could be seeing themselves as the victims of corporate cost or space reduction strategies.
41%
Activity Based Working can deliver significant operational benefits for those employees who use the environments provided for them.
01The more an employee uses multiple work locations within the workplace, the more they report that the space enables them to work more effectively.
02The more complex an employee’s daily work profile, the more beneficial it is for them to work in a mobile way that utilises multiple settings.
Poor adoption of appropriate behaviour in activity based workplaces is a significant problem that limits widespread organisational benefits.
03 04
Productivity agreement
Pride agreement
Camper / Squatters are truly anchored to their workstation and are not finding other spaces elsewhere. Within the ABW sample workplaces, they still represent 30% of employees. While the Timid Travellers remain strongly attached to their single workstation, they are starting to experience other spaces for some of their work. Across the ABW sample workplaces, they represent the majority of employees – 41% – clearly showing ABW environments struggle with employee inertia.
54.6%41.8%
Productivity agreement
Pride agreement
54.5% 73.1%
Productivity agreement
Pride agreement
60.0% 81.4%
Intrepid Explorers are well progressed in their investigation of the central concepts of ABW and have adopted a progressive and mobile approach to space use. Within the ABW sample they account for 19% of employees with above average productivity (60%) and excellent pride agreement (81%). True Transients are the most mobile, but are few in number. Even across the ABW sample workplaces they represent just 10% of respondents. However, they report the highest productivity (67%) and outstanding pride agreement (86%).
Creativity
Focus
Informal meetings
Paper
Matching benefits with objectivesStatistically the best ABW environments deliver valuable employee satisfaction gains on many key workplace activities, and significant improvements with several physical and service features. When executed well, the benefits far outweigh the minor losses, but need to be matched to organisational objectives.
PaperAlmost all ABW spaces record lower than average satisfaction figures for “spreading out paper and materials”. Organisations moving to ABW need to assess the importance of this activity to their employees and decide if reducing reliance on paper is appropriate or achievable.
05ConfidentialityOverall, the ABW spaces perform marginally lower for “business confidential discussions” than for those in other workplaces. But for employees in the highest mobility profile, once again, ABW workplaces deliver higher support.
06
53%Productivity
On average, the ABW workplaces show lower productivity
agreement compared to non-ABW workplaces. But not for all: those
in Profiles 3 & 4 have significantly higher than average agreement.
71%PrideOn average, the ABW workplaces show higher pride agreement compared to non-ABW workplaces, with 80%+ agreement in Profiles 3 & 4.
Worth a closer look
The opinions expressed by contributors represent those of the individual authors and unless clearly labelled as such do not represent the opinions of Leesman Ltd. The Leesman Review is the journal of Leesman, the world’s leading independent assessor of workplace effectiveness. We welcome contributions on the subjects that you think should interest us. Leesman is a registered trademark and all Leesman Review content is Copyright March 2017. Leesman, 5 Wormwood St, London EC2M 1RQ, 00 44 20 3239 5980, [email protected] | Design by fullyfledgeddesign.com
The Leader's Guide to Negotiation Simon Horton, Pearson
Negotiation is a core business skill. It is critical in everything we do from asking for a raise to deciding who gets the coffee. From achieving win-win outcomes to problem-solving and building trust, Simon Horton brings us a practical guide to getting the most out of your business interactions.
Lean In Sheryl Sandberg, Ebury Publishing
Sheryl Sandberg, draws on her experience of working in some of the world’s most successful businesses to shine a light on gender differences. Lean In offers practical advice to help women achieve their goals and understand the small changes that can be made to impact change on a more universal scale.
Next issue
Does a thirst for innovation, newness and difference sometimes push solutions past a point of functional usability? And while the best intentions may have been to improve user satisfaction, do these initiatives result in a lower overall effectiveness?
The next issue of the Leesman Review will discuss these questions with contributions from designers, facility managers and leading human factors experts to examine whether design innovation is too often deployed at the expense of basic practicality.
Of course the idea that something is not usable seems strange, but we will seek to outline how and where some of the basic aspects of usability seem to have been missed, forgotten or just patently ignored.
We will also consider whether it is fair to expect users of a new space to understand how to use it, or whether they should be taught or coached. Should workplaces self-evidently just work? Or do users need a comprehensive manual?
And lastly, as workplace becomes more complex and more measured, we will be looking at how the human and digital brains at IBM Watson are attempting to help make workplaces and the management systems applied to their infrastructure, infinitely more useable.
More on the web
www.3edges.co.ukwww.gallup.com www. lendlease.com www.leesmanindex.comwww.negotiation-mastery.comwww.stoddartreview.com
Regardless of your role in the workplace ecosystem, or whether you are US based or not, take my word for it, the hot off the press Gallup “State of the American Workplace” is your next most important read. Download a copy at www.gallup.com.
It is packed with typically bold but statistically robust insights. Some might shock you, some will alarm you and many will probably come as no surprise whatsoever. But there are two standouts that I believe need to probed, tested and discussed by every workplace professional and quickly elevated by them to the leadership teams or clients they report to.
Firstly, 60% of US employees say the ability to do what they do best in a role is “very important” to them. Male and female employees and employees of all generations place the greatest importance on this aspect of a job.
Gallup argues that this comes down to “matching the right person with the right role and the right culture” and that if employees are mismatched they struggle to succeed, and become bored, restless and disengaged. If we assume that most organisations recruit new candidates based on the strengths and potential they see in them, it seems obvious that this skills potential matching
equation would be central to optimising an individual’s personal performance and so to overall organisational performance.
But increasingly the data Leesman is collecting points to another parallel issue: that too often, the environment and infrastructure provided for that employee to do what they do best is simply not there. 28.6% of the 215,000+ employees in the Leesman database actively disagree that their workplace enables them to work productively.
I would posit that this is key to any human capital and performance management strategy, and organisations must now review whether they are delivering on their wider commitments to their current employees.
The second stand out for me was on the subject of “stability”, with 51% rating greater stability as “very important”. Employees need to believe in the future of the organisation and be able to see themselves as part of it. “Leaders and managers are critical in creating this vision. Leaders have a duty to show employees where the organisation is headed and inspire them to see a better tomorrow.”
My experience at Plantronics has taught me that workspace has a huge role to play in this equation. Businesses change, develop, acquire new parts and dispose of others. So for many, the physical work environment is one of the few stable components that remains while all around may appear to be ever changing.
And I would suggest therefore that for an employee to see themselves as part of a business, or more specifically to see themselves
as in that business, a key component in building that is long-term engagement and loyalty.
Further, the report emphasises that organisations need to clearly define their identity and effectively communicate that through what it terms the employee value proposition (EVP). An EVP answers the question, “What do I get for working here?”. I think we need to understand to what extent a great workplace, one that supports an employee doing what they are there to do, forms part of that proposition being fulfilled.
This was a key driver for me at Plantronics when we decided to move from our highly effective (Leesman
Lmi 75.7) European hub in Hoofddorp, just outside Amsterdam, to a purpose built “acoustic temple” half a kilometer away in Delta Development’s Park 20/20.
Of course there were multiple business reasons for doing this, with lease events playing a major part. But the opportunity to offer our existing and prospective employees a physical, tangible manifestation of what Plantronics is about and what they get working there was key.
I have no doubt that the new Plantronics space will score highly in its forthcoming Leesman Index post-occupancy evaluation and will be case-studied somewhere in a future Leesman Review. I am also assured that within the typical constraints of time, budget and space, that from foundations up, that space was designed, configured, equipped and furnished to enable the employees it accommodates do what they do best on a daily basis.
The State of the Estate
Subscribe
As we approach our 250,000 respondent milestone, you can stay in touch with our data and the debate around it by subscribing to the Leesman Review digitally or in print at
leesmanindex.com
Philip Vanhoutte, Smarter Working Champion and Chair of the Leesman Advisory Board.
Comment | Philip Vanhoutte
16% of employees are actively disengaged – they are miserable in the workplace and destroy what the most engaged employees build.
In 2015, IFMA Sweden and Tenant & Partner collaborated with Leesman to embark on an investigation into one of the most talked about workplace strategies – Activity Based Working.
We’ve just finished our global event series where we presented the full findings from this research. As we rapidly approach our 250,000 respondent milestone, we are getting ready to repeat
an independent review of the data and we’ll be publishing a research insight report on the productive employee later in the year.
www.leesmanindex.com
28.6% percent of the 215,243 employees in the Leesman database actively disagree that their workplace enables them to work productively.
The Rise and Rise of Activity Based Working