Embed Size (px)
Citation preview

working environments and deal with this seismic change. It’s hard to understand the magnitude of the storm when you are firmly in the eye of it but this is the biggest shift anyone has experienced in decades.
This Review is all about understanding this change, coping with it and making the most out of it. The workforce is in the midst of a burnout epidemic; the prolonged levels of chronic stress as a result of significant and sustained workplace pressures are leading
to a more disengaged, detached and isolated workforce. Organisations which spot these problems early are able to stem the flow of disengagement.
COVID-19 has also had a profound impact on where we work and live; so much so, that two Stanford economists note a trend that is quite literally reshaping our cities.
The anticipation is palpable; we see something big out on the horizon – are we ready?
it as a response to the sadness of leaving one place and the hope of a new future. The figures gaze across the Irish Sea, where they observe an offshore windfarm; the UK’s attempt to cope with change change.
Wherever you look, we as a society are at a tidal turning point, and the sands are shifting on a personal and professional level. Not only are employers grappling with their workplace futures; employees too are having to understand their new
In 2005, Antony Gormley installed 100 cast iron statues across 3km of Merseyside beach. Said to test time and tide, stillness and movement, Gormley himself describes
TURNING TIDES
Burnout is rooted in a disengaged, demotivated and cynical view of the world, where emotions are blunted. Reaching the limit, page 8
Issue 31

2
But first, forget the idea of future-proof. How many 2020 real estate plans, carefully crafted in 2019 or earlier, planned for the seismic impact of a fast-moving, global pandemic?
The future is many things. But at its core, it is uncharted and unpredictable. And so, if the pandemic has reminded us of anything, it is that future-proofing is really just measured guessing. And if you are going to guess, you’d better guess a few times and consider the many and varied implications of each.
Historically programmed with binary options, this is where the real estate and property industry struggles. Do we stay or do we go? Open plan or cellular? Now home or office. And now we have the office haters. Pitching office against home, they smugly remind us that their predictions of the demise of the office as the place where workers go were published years earlier for all to see.
Why do so many struggle to entertain blended, multi-coloured middle grounds, where collaged solutions are crafted not for procurement simplicity, but in response to multi-dimensional user needs?
Society seems to be adopting a similarly binary analysis of its challenges. Mask-wearers curse the mask-haters. Vaccine takers are bemused by the vaccine sceptics. And chances are, you are about to start telling them about your plans for their workplace future.
In the coming days, weeks and months, organisations will have to carefully consider where they sit on these topics. Do they believe the provocateurs who say that they don’t need offices and leases and headquarters? And that a newly nomadic workforce will develop the skills to stay at arm’s length, crafting their own workspaces at home or elsewhere? Or do they side with the traditionalists who are backing colleagues wanting to be together in collective endeavour, socialising over pizza or beer when the moment is right, not just when it has been scheduled?
Workplace does not have to settle for this binary match-up of traditionalist versus provocateurs. It is a time for opportunists from any camp to explore any number of scenarios somewhere in between these two extremes. Where employees are given a choice.
This is drawing CEOs to the media conversation like moths to a flame. But it is dangerous territory: cast out as dinosaurs if they dare to say they want colleagues back in offices, or seen as cash strapped if they say they want to dramatically reduce their real estate footprints.
Choice could well turn out to be the thing of competitive advantage in these debates. Because office haters conveniently ignore the fact that up to a third of employees in any given knowledge business do not have a space at home that can properly support
blockbusters including Bladerunner, The Minority Report, A Scanner Darkly, Total Recall, The Matrix and most recently, The Man in the High Castle. The Adjustment Team was turned into the much-overlooked 2011 science fiction thriller The Adjustment Bureau and explores key concepts from the book around choice and free will – or the perception of free will. In the film, “the Bureau” enacts adjustments to keep humanity on track. It is a filmic mashup of the New Testament and Cass Sunstein and Richard Thaler’s Nudge.
Yet, in the film, the Bureau is a guiding force, not the micro-manager. At the head of the Bureau is the Chairman. She sets the plan and – armed with Moleskins and complex pathway maps – her case officers ensure adherence, steering or nudging their subjects towards pre-determined outcomes to “stay on plan”. These nudges are for the benefit of the individual, and the
You are being told that your organisation is facing a series of binary workplace options. This is wrong and misleading. In fact, the future of workplace has more opportunities available to it than ever before.
Opinion | Tim Oldman – Founder & CEO, Leesman Leesman Review Issue 31
3
Finding the balance between freedom and control
Drag an employee back 2.5 days a week to a poor workplace and you will have dissent. Restrict one from coming to a great workplace for more than 2.5 days and you will have the same.
And what awaits if you offer them, or team heads, complete choice? Past experience proves that employees will almost certainly gravitate towards the middle days of the week, leaving offices empty on Mondays and Fridays. So, to what extent can employees be nudged to make decisions that are right for them and for the organisation and its spaces?
In 1954, science fiction writer Philip K Dick published The Adjustment Team – a tale of a real estate salesman Ed Fletcher’s uncomfortable brush with existentialism. It was one of a number of his short stories that painted a distorted picture of future worlds and that Hollywood would much later latch onto to inspire a slew of
them working. If their leadership team decides to opt for a ‘remote-first’ strategy, where do these folk go?
Or what of those employees who enjoyed an outstanding workplace experience pre-pandemic who are desperate to be back in those workplaces – places that brilliantly supported them alongside their colleagues? These spaces consistently report the highest levels of enjoyment, pride, productivity and knowledge transfer. And here, when asked, employees choose to be back four or more days a week.
So, herein lies the problem with choice. These employees choose four days, where employees with poor pre-pandemic workplace experience choose one day or less. The average, as is postulated in so much of the future-gazing media, may be 2.5 days per week. But that does not make it the de facto solution for all.
collective. Problems start when one of the overworked case officers falls asleep and misses a vital nudge.
Except in The Adjustment Bureau, the central character pushes back. He doesn’t accept the plan. He lobbies that his version of fate can work in a way that benefits him, his co-star and society. British actor Terence Stamp delivers a stunning monologue that describes exactly why mankind struggles to compute the subtle differences between free will, soft determinism, and chance.
“You don’t have free will, only the appearance of free will.”
Of course employees are not subjects in a game you can pick up and move around to follow pre-programmed paths. But organisations cannot simply ignore that a year of home-based working has changed employee predispositions. Of course, work is a thing you do. But for millions it is also a place you go. So where do employees want to be guided and where do they want free will? The flipside to the protagonist’s revolt in the film is that infinite free will is an affliction as of itself. It prioritises the individual, but an organisation has inherent collective aims.
The first practical repercussion of this is load-balancing your office space. We wish you the best of luck if you intend to allow employees free choice as to how often they return to the office. We offer even more good luck if you start to mandate which days you will allow those wishing to return, to return. Mondays and Fridays will become the middle seat on a budget airline – empty or assigned to a begrudging and/or frugal latecomer. Organisations imposing Orwellian brand values will inevitably damage their employer brand.
Being future-ready relies on a series of acknowledgements. First and not least, that the average pre-pandemic office did a pretty poor job of supporting the employees it accommodated. Next: that trusting employee free will and gifting ultimate choice might take you on a path where employees are allowed to colour outside the lines.
But workstyles have changed. We can either learn from the last 12 months and spark a renaissance or return to a dark age. Senior management’s job now is guidance and a strategy that prepares for adaptation.
Like the Bureau’s Chairman, organisations need to possess a plan, provide a foundation and then go for it. Decisions can be made as you progress, but keep a finger on the pulse of your employees’ needs. The point of the Bureau is as a guiding hand for success and achieving potential. An adjustment is a leg up to a collective aim
Interview | Jamie Harris, Editor, Leesman Insights
4
Leesman Review Issue 30
Two Stanford economists have observed a ‘hollowing out’ of city centres across the United States, in favour of suburbia. Their findings help explain how COVID-19 can reshape real estate; the consequences of which reach out farther and wider than simply where people want to live – but to the fundamental way in which we define cities.
COVID-19 has changed how and where we work. But aside from creating makeshift desk space at the kitchen table, it has also had a longer-lasting impact on where we work from in a more geographical sense.
“Historically there has been a lock-tie between where you live and where you work,” notes Arjun Ramani of Stanford University. “But that has been broken.”
Ramani and Nicholas Bloom authored a brief for the Stanford Institute for Economic Policy Research on how the pandemic is shaping the real estate market. The pandemic has plunged millions of workers, confined to their homes for a year, into an existential crisis. Residential properties have been the setting for working and socialising, instead of the office and other public settings. As such, many people are now much more acutely aware of every square metre of space that they inhabit. Their findings go some way to proving the existence of this self-realisation.
In the centres of the largest cities in the United States, such as New York City and San Francisco, they observed a slump in real estate demand since the start of the pandemic – a 10-15% drop in residential rents – in comparison to the suburbs. They also observed a similar trend in purchase prices, negating any pretence that this is a short-term effect.
One can also extrapolate a similar theory from UK house prices. The Office for National Statistics collected data on house price growth in 2020 by regions
want a larger space in which to
work from home – particularly if they are currently living in a smaller, more expensive city centre residential space with no dedicated office or desk – but there is also no longer longer a requirement for them to live right next to where they work. The pandemic has also reduced the value of living in a city centre, separate to a shorter commute; amenities such as theatres and restaurants are currently inaccessible.
“You’re seeing the centre of the city hollowing out,” says Ramani. “We’re calling this phenomenon the donut effect.”
(For the sake of consistency, I’m going to use the British English ‘doughnut’ from now on, but if you’re looking for Ramani and Bloom’s paper, you’re better off searching for ‘donut’.)
So we have a shift in workers’ preferences to live in the suburbs – the ‘doughnut’, moving away from the central ‘hole’. But while these factors might dissipate once vaccination programmes have rolled out – a city’s financial district
is unlikely to continue its resemblance of a ghost
town – earlier research from Bloom argues
that increases in working from home will be persistent. Leesman data supports this theory; of 48,000 respondents, 85% expressed a preference to
work from home a minimum of two
days per week. Perhaps
individuals are taking the opportunity they
have been given – away from the office – to
relocate elsewhere in the United States? Not so;
Ramani and Bloom note that housing demand hasn’t shifted
significantly from these larger conurbations to less expensive
cities. Ramani believes this desire for a hybrid working strategy, with a pull to the office at least once per week, is enabling a geographical shift to local areas, rather than a reallocation across the country. As Ramani explains: “What hybrid working doesn’t enable you to do is pick up your bags and move across the country.
Instead, people are now willing to live an hour away in exchange for a bigger house, because they don’t have to commute in every day.”
Consequently, the research indicates a surge in house prices in suburbia, and a fall in prices in the city centres. What sort of knock-on consequences could this effect have on the economy of those cities – and at a societal level?
Ramani makes some poignant remarks about decisions policymakers will need to consider should the doughnut effect stick. Will cities need to rethink their transport network and infrastructure? Theory dictates fewer, or less-frequent, trips on the NYC Subway or the London Underground. Certainly, rush hour would involve fewer workers crammed tightly inside carriages. But commuter trains will likely need to travel longer distances to reach the city centre – suburban rail lines may need be extended out of the traditional commuter belt.
THE D UGHNUT EFFECT
5
“You're seeing the centre of the city hollowing out.” In the centres of the largest cities in the United States,
they observed a slump in real estate demand since the start of the pandemic in comparison to the suburbs.
4
Leesman Review Issue 31
5
in England. The data indicated that the region with the lowest annual house price change, at just under 4 percentage points, was London. In comparison, the South West, East Midlands, North West and Yorkshire all saw prices skyrocket by more than 10%. While this doesn’t tell an identical story, preferences may indicate a desire for a similar relocation.
Searches for homes with gardens – by definition properties which need more space and consequently are more likely to be located in lower density areas – on property search website Rightmove rose by 84% year-on-year for renters and 42% for buyers in May 2020.
Why is this happening? Firstly, the requirement to work from home might be a driver in housing demand. Ramani and Bloom’s research found a correlation between population density and the share of jobs that can be done from home – and as such, a negative correlation between the areas with a higher share of work-from-home jobs and the percentage change in house prices. Not only do people generally
Transport franchises, such as Transport for London, will need to factor in lower revenues. Larger cities in the U.S. will need to factor in a loss in sales tax revenues. Ramani thinks that in the short-term, governments will continue to support cities while they try to recover from the pandemic, but eventually these cities will need to balance their budgets. Developers will also be wary of falling commercial rents. Says Ramani: “While there is less variation in commercial office space prices between larger and smaller cities, there appears to be a drop of 10-15% across the board.”
There are also long-term implications for consumer spending in hospitality and retail. Ramani explains: “[Bloom] has a paper that projects about a 10% drop in consumer spending in America’s largest metro areas. If you’re commuting to the office less frequently and moving away from the city centre towards a suburb, you’ll see a shift in consumer spending in the same direction.”
A lot of businesses in the city centres, particularly service businesses, are going to suffer – and a failure to return to pre-pandemic levels raises potential concerns of an increase in inequality, says Ramani.
“A lot of the service workers, on a typically lower wage, are going to be hurt, while the higher wage workers who have the ability to work from home are going to have the flexibility to do what they want.”
Dramatic stuff. Could a city’s central nervous system essentially collapse if people just decide not to go there? Is it a delicate house of cards which needs delicately rebuilding at the foundations? This is unlikely. In fact, historical data on population density helps to explain the value of a sprawling, bustling, vibrant city.
They weren’t always seen as immense, towering centres of work and living. “Back in the 1800s,” Ramani notes, “working from home was quite common. Workers would go into a city or to a market to get raw materials and goods and return home to work – for example in the manufacture of clothes.”
“As late as 1900, a third of people were working from home in France. It’s only later in the 20th Century where we have this type of arrangement where people go to work in a different physical location.”
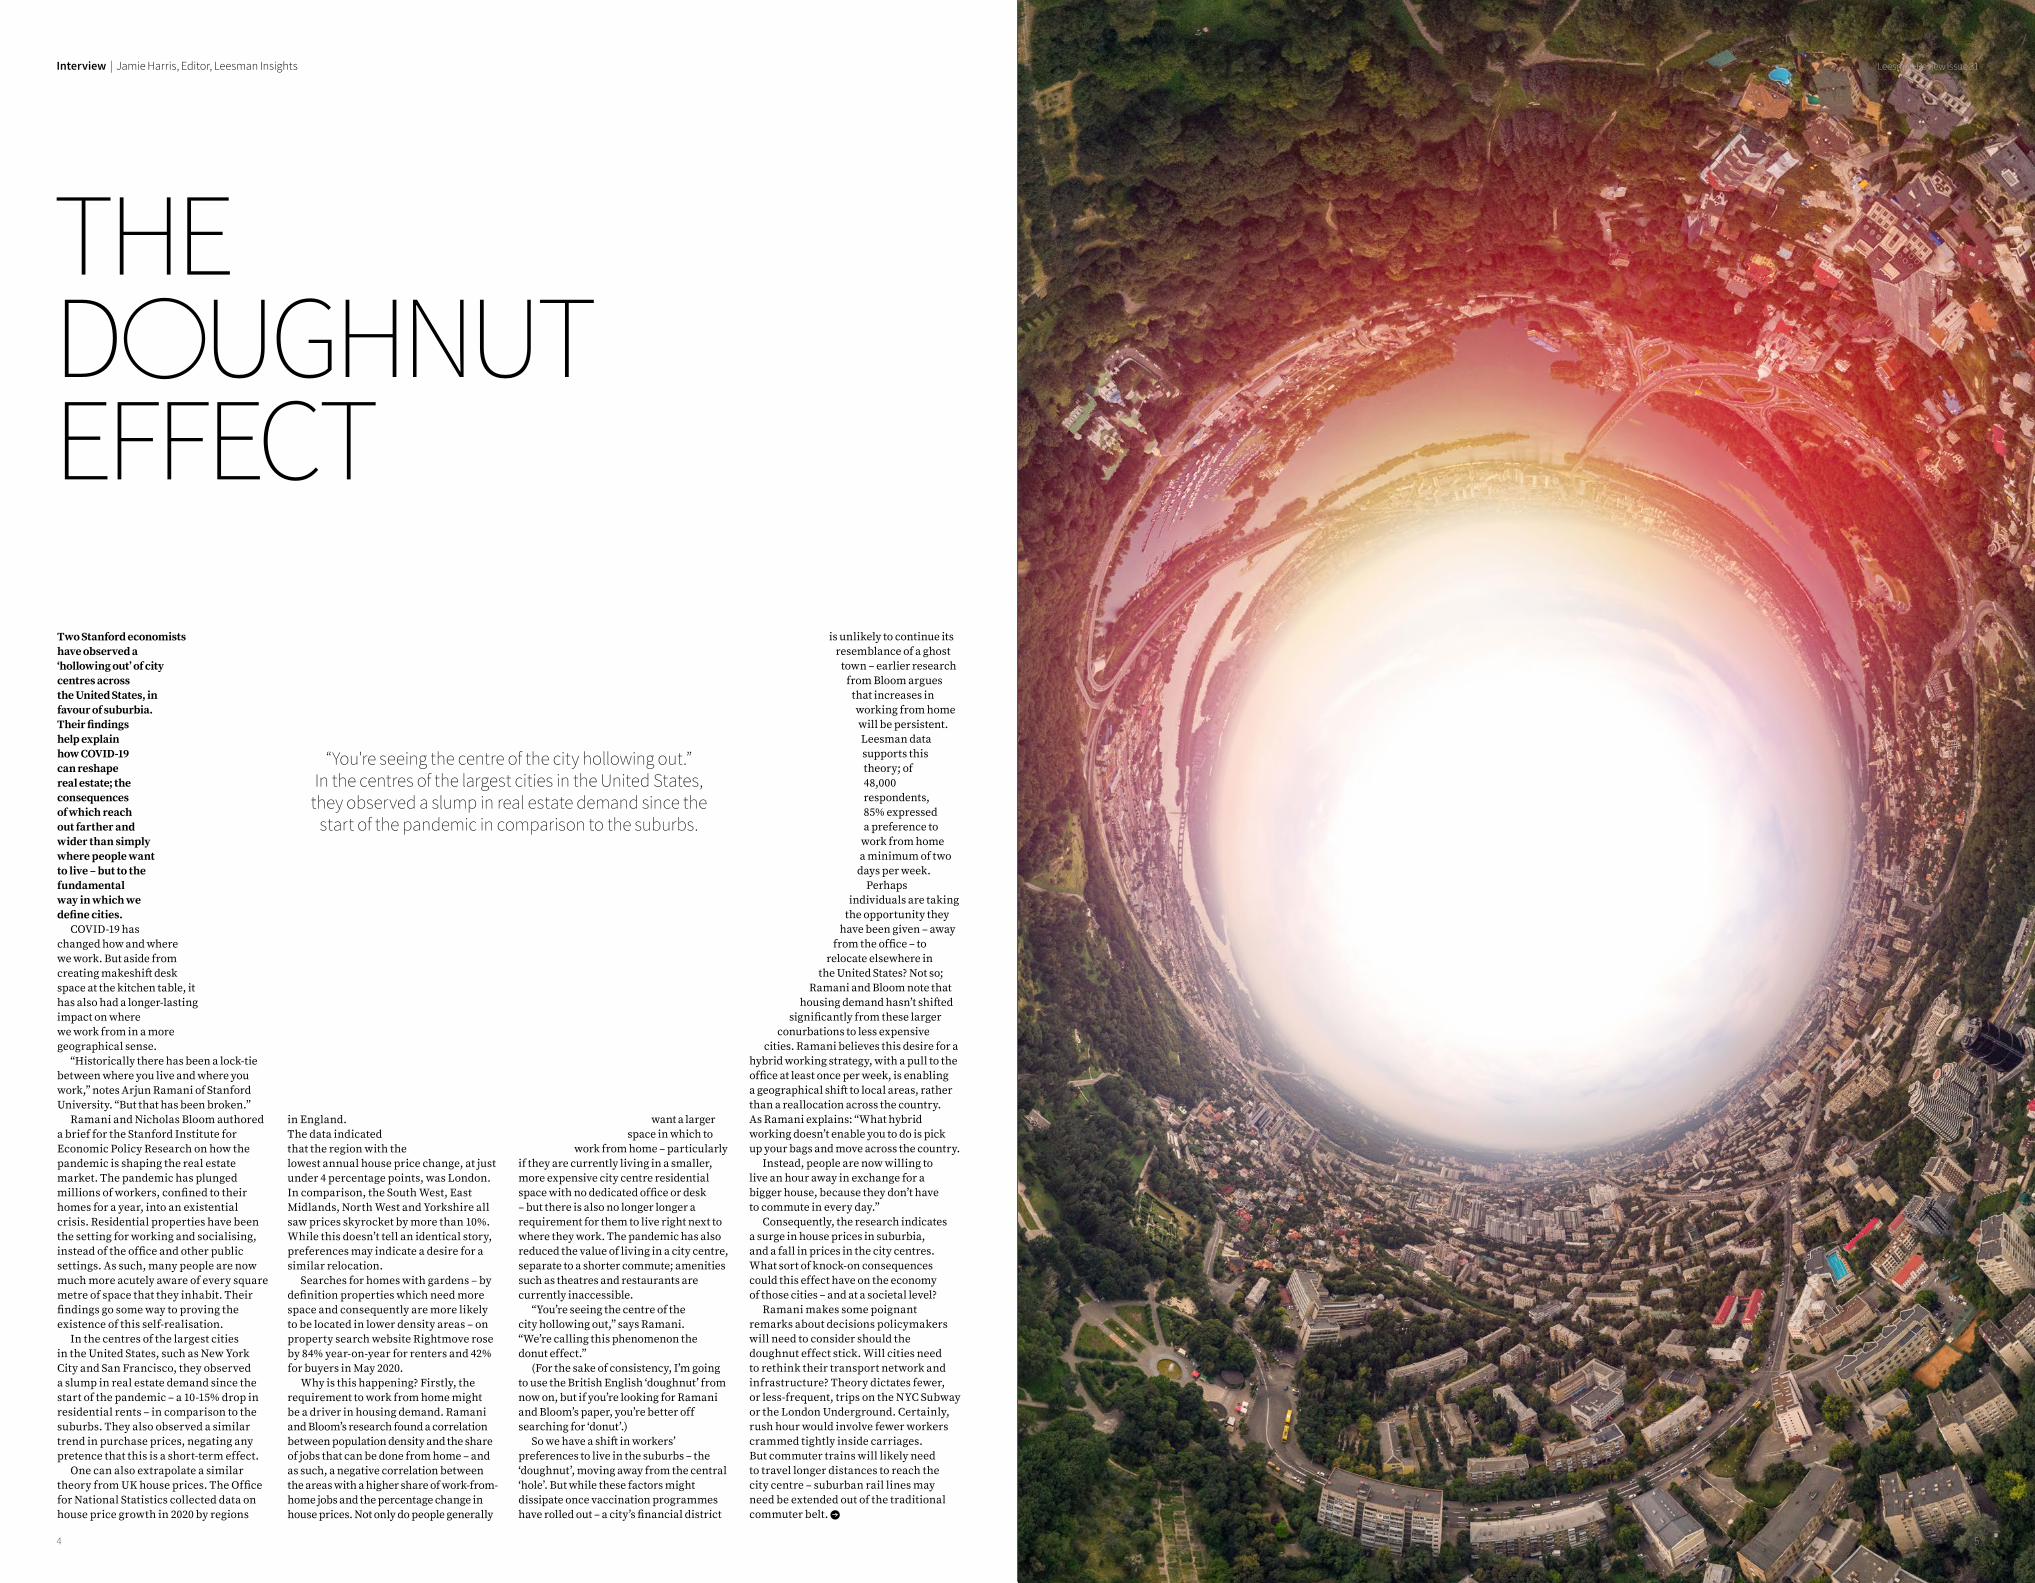
Ramani points to the concept of the ‘superstar city’ – extremely dense, metro areas, especially those with central business districts being a defining area. Cities which are examples of economics of agglomeration, a concept within urban economics related to the idea of economies of scale, in which the costs of production may significantly fall as a result of clusters of businesses and a pool of workers in close proximity to each other.
After the development of computers and the internet in the 1970s, 1980s and 1990s, city centres experienced an even bigger concentration of skilled workers, with cities growing faster than before.
“The question is why?” Why, asks, Ramani, with increasingly faster connectivity and increasingly more
question. Why, in large cities in which living costs
are much higher, do a disproportionate number of workers who could work remotely – and live anywhere – decide to pay such an exorbitant price of living? Their research finds that the denser a city, the more work can be done remotely. The economists called this oddity ‘the City Paradox’.
The answers to these questions are to do with increasing returns to collaboration. When people live in a city where a lot of other people in their industry also live, there’s a spillover of ideas; collaboration becomes much easier.
“Crucially, this also happens between firms,” he says. “One interesting finding is innovation actually increases in these dense, superstar cities, because it becomes easier to exchange ideas, and perhaps come up with a new organisation.” This type of innovation due to clustering is a key mechanism of why superstar cities reap significant economic benefits.
In a virtuous circle for these cities, recruiting also becomes easier. It becomes much easier to recruit skilled workers, such as software engineers in San Francisco, if all of them are in the same location. And by growing these common labour pools and clusters, that drives innovation on. This economic agglomeration and innovation spiral is also a reason why real estate prices
tend to be so high in these cities – the skilled workers flocking to
innovate together tend to be higher income workers. And it is this
virtuous circle which is also driving the doughnut effect
Ramani has observed: the higher income workers are
a mechanism for real estate demand.
The future is fascinating. What sort of impact might different hybrid working models have on the doughnut size? Could one take organisations who decide to work five days per week in the office, and compare
those employees with those working at firms
working just one day in the office? Would we see a
larger ‘hole’ for those who will be spending more time at
home? As much as economists love to theorise with rational
decision-making, it’s wise to add a healthy pinch of salt. Bloom ran
an experiment in 2015, which found considerable variation across different
workers. “About half of them don’t even like working from home,” explains Ramani. “They prefer to be in the office. For all these phenomena, there’s a lot of heterogeneity.”
A mix of preferences is just one factor why the workforce won’t be entirely dispersed. Furthermore, there is great value placed on learning from others and what the office provides that the home cannot, and cities are unlikely to ignore those returns on collaboration that served them so well in decades past.
What next for Ramani? “We’ve got this global experiment that’s lasted for more than a year – some of the stigma attached to working from home seems to have been reduced. We’ll keep on running the same types of analyses to see how real estate demand continues to change.”
And if the doughnut effect has a lasting impact? Not only might cities undergo a redistribution of its population, but cities might become more affordable for many of those that have been previously priced out. The ripple effects of lower city centre prices – and fewer five-days-per-week commuters – on consumer spending, long-term transport infrastructure plans and other less obvious correlations, are likely to be felt for many years to come
Why, in large cities in which living costs are much higher, do a disproportionate number of workers who could work
remotely – and live anywhere – decide to pay such an exorbitant price of living?
6
Leesman Review Issue 31
7
Interview
Early data shows that in the 1800s, 40% of people were working from home.
affordable technology, did this pool of people flock to cities?
Last year, four US-based economists posed
a similar
8
Interview | Jamie Harris – Editor, Leesman Insights Leesman Review Issue 31
9
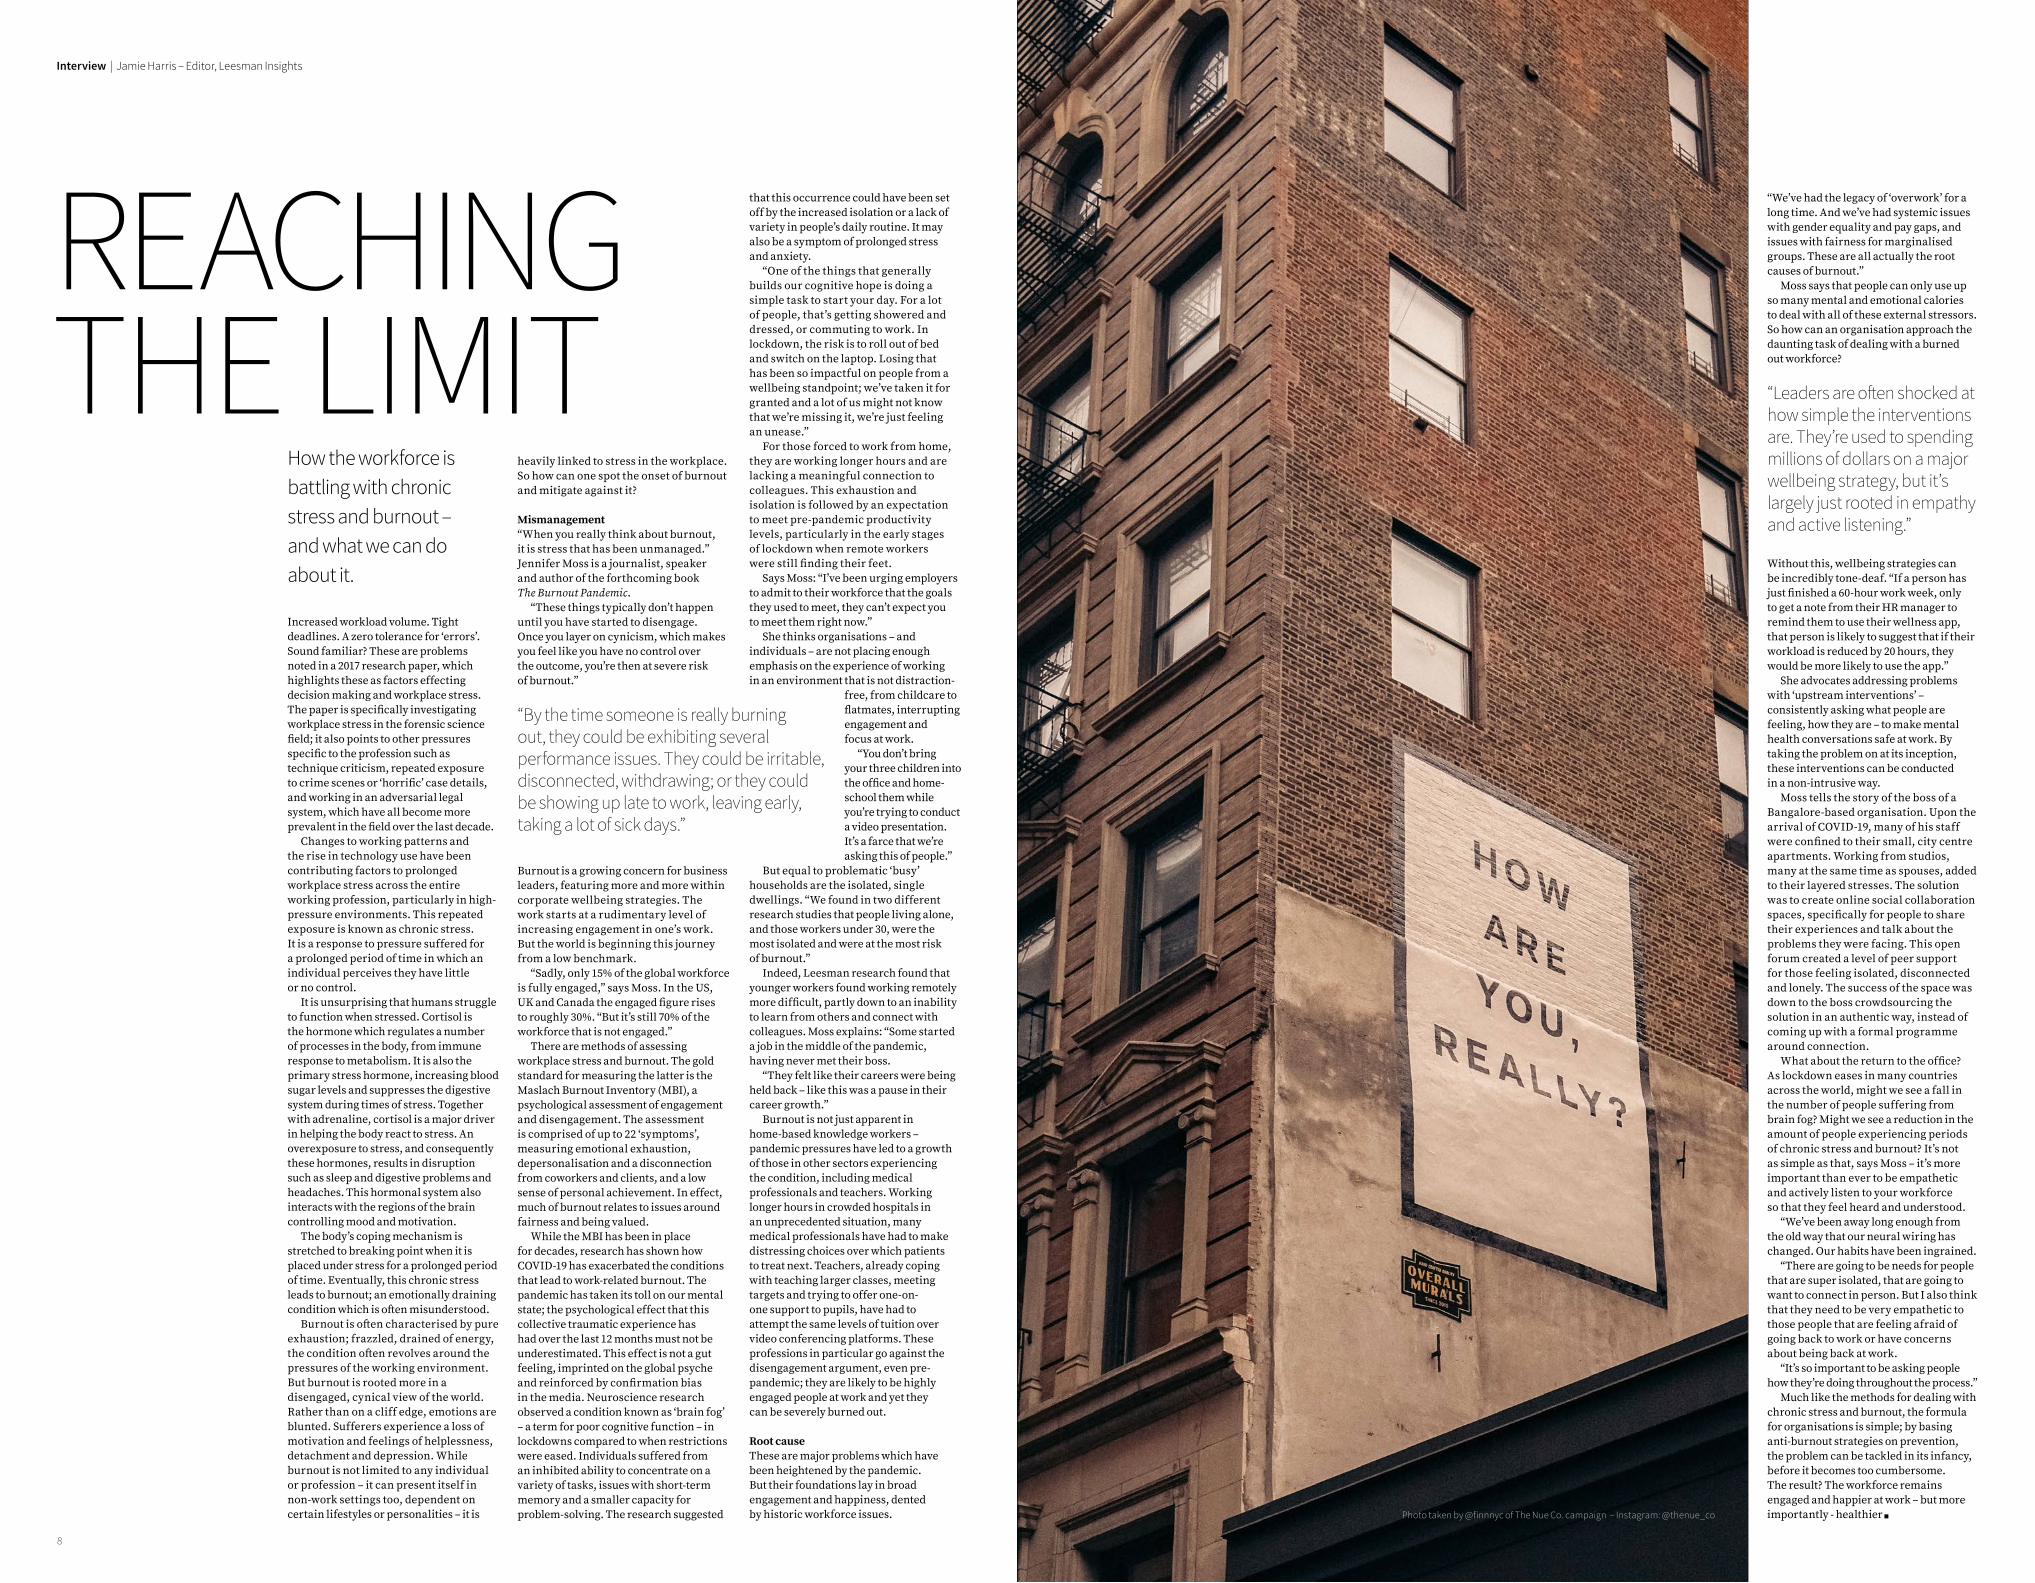
How the workforce is battling with chronic stress and burnout – and what we can do about it.
REACHING THE LIMIT
“We’ve had the legacy of ‘overwork’ for a long time. And we’ve had systemic issues with gender equality and pay gaps, and issues with fairness for marginalised groups. These are all actually the root causes of burnout.”
Moss says that people can only use up so many mental and emotional calories to deal with all of these external stressors. So how can an organisation approach the daunting task of dealing with a burned out workforce?
“Leaders are often shocked at how simple the interventions are. They’re used to spending millions of dollars on a major wellbeing strategy, but it’s largely just rooted in empathy and active listening.”
Without this, wellbeing strategies can be incredibly tone-deaf. “If a person has just finished a 60-hour work week, only to get a note from their HR manager to remind them to use their wellness app, that person is likely to suggest that if their workload is reduced by 20 hours, they would be more likely to use the app.”
She advocates addressing problems with ‘upstream interventions’ – consistently asking what people are feeling, how they are – to make mental health conversations safe at work. By taking the problem on at its inception, these interventions can be conducted in a non-intrusive way.
Moss tells the story of the boss of a Bangalore-based organisation. Upon the arrival of COVID-19, many of his staff were confined to their small, city centre apartments. Working from studios, many at the same time as spouses, added to their layered stresses. The solution was to create online social collaboration spaces, specifically for people to share their experiences and talk about the problems they were facing. This open forum created a level of peer support for those feeling isolated, disconnected and lonely. The success of the space was down to the boss crowdsourcing the solution in an authentic way, instead of coming up with a formal programme around connection.
What about the return to the office? As lockdown eases in many countries across the world, might we see a fall in the number of people suffering from brain fog? Might we see a reduction in the amount of people experiencing periods of chronic stress and burnout? It’s not as simple as that, says Moss – it’s more important than ever to be empathetic and actively listen to your workforce so that they feel heard and understood.
“We’ve been away long enough from the old way that our neural wiring has changed. Our habits have been ingrained.
“There are going to be needs for people that are super isolated, that are going to want to connect in person. But I also think that they need to be very empathetic to those people that are feeling afraid of going back to work or have concerns about being back at work.
“It’s so important to be asking people how they’re doing throughout the process.”
Much like the methods for dealing with chronic stress and burnout, the formula for organisations is simple; by basing anti-burnout strategies on prevention, the problem can be tackled in its infancy, before it becomes too cumbersome. The result? The workforce remains engaged and happier at work – but more importantly - healthier
heavily linked to stress in the workplace. So how can one spot the onset of burnout and mitigate against it?
Mismanagement“When you really think about burnout, it is stress that has been unmanaged.” Jennifer Moss is a journalist, speaker and author of the forthcoming book The Burnout Pandemic.
“These things typically don’t happen until you have started to disengage. Once you layer on cynicism, which makes you feel like you have no control over the outcome, you’re then at severe risk of burnout.”
Burnout is a growing concern for business leaders, featuring more and more within corporate wellbeing strategies. The work starts at a rudimentary level of increasing engagement in one’s work. But the world is beginning this journey from a low benchmark.
“Sadly, only 15% of the global workforce is fully engaged,” says Moss. In the US, UK and Canada the engaged figure rises to roughly 30%. “But it’s still 70% of the workforce that is not engaged.”
There are methods of assessing workplace stress and burnout. The gold standard for measuring the latter is the Maslach Burnout Inventory (MBI), a psychological assessment of engagement and disengagement. The assessment is comprised of up to 22 ‘symptoms’, measuring emotional exhaustion, depersonalisation and a disconnection from coworkers and clients, and a low sense of personal achievement. In effect, much of burnout relates to issues around fairness and being valued.
While the MBI has been in place for decades, research has shown how COVID-19 has exacerbated the conditions that lead to work-related burnout. The pandemic has taken its toll on our mental state; the psychological effect that this collective traumatic experience has had over the last 12 months must not be underestimated. This effect is not a gut feeling, imprinted on the global psyche and reinforced by confirmation bias in the media. Neuroscience research observed a condition known as ‘brain fog’ – a term for poor cognitive function – in lockdowns compared to when restrictions were eased. Individuals suffered from an inhibited ability to concentrate on a variety of tasks, issues with short-term memory and a smaller capacity for problem-solving. The research suggested
that this occurrence could have been set off by the increased isolation or a lack of variety in people’s daily routine. It may also be a symptom of prolonged stress and anxiety.
“One of the things that generally builds our cognitive hope is doing a simple task to start your day. For a lot of people, that’s getting showered and dressed, or commuting to work. In lockdown, the risk is to roll out of bed and switch on the laptop. Losing that has been so impactful on people from a wellbeing standpoint; we’ve taken it for granted and a lot of us might not know that we’re missing it, we’re just feeling an unease.”
For those forced to work from home, they are working longer hours and are lacking a meaningful connection to colleagues. This exhaustion and isolation is followed by an expectation to meet pre-pandemic productivity levels, particularly in the early stages of lockdown when remote workers were still finding their feet.
Says Moss: “I’ve been urging employers to admit to their workforce that the goals they used to meet, they can’t expect you to meet them right now.”
She thinks organisations – and individuals – are not placing enough emphasis on the experience of working in an environment that is not distraction-
free, from childcare to flatmates, interrupting engagement and focus at work.
“You don’t bring your three children into the office and home-school them while you’re trying to conduct a video presentation. It’s a farce that we’re asking this of people.”
But equal to problematic ‘busy’ households are the isolated, single dwellings. “We found in two different research studies that people living alone, and those workers under 30, were the most isolated and were at the most risk of burnout.”
Indeed, Leesman research found that younger workers found working remotely more difficult, partly down to an inability to learn from others and connect with colleagues. Moss explains: “Some started a job in the middle of the pandemic, having never met their boss.
“They felt like their careers were being held back – like this was a pause in their career growth.”
Burnout is not just apparent in home-based knowledge workers – pandemic pressures have led to a growth of those in other sectors experiencing the condition, including medical professionals and teachers. Working longer hours in crowded hospitals in an unprecedented situation, many medical professionals have had to make distressing choices over which patients to treat next. Teachers, already coping with teaching larger classes, meeting targets and trying to offer one-on-one support to pupils, have had to attempt the same levels of tuition over video conferencing platforms. These professions in particular go against the disengagement argument, even pre-pandemic; they are likely to be highly engaged people at work and yet they can be severely burned out.
Root causeThese are major problems which have been heightened by the pandemic. But their foundations lay in broad engagement and happiness, dented by historic workforce issues.
Increased workload volume. Tight deadlines. A zero tolerance for ‘errors’. Sound familiar? These are problems noted in a 2017 research paper, which highlights these as factors effecting decision making and workplace stress. The paper is specifically investigating workplace stress in the forensic science field; it also points to other pressures specific to the profession such as technique criticism, repeated exposure to crime scenes or ‘horrific’ case details, and working in an adversarial legal system, which have all become more prevalent in the field over the last decade.
Changes to working patterns and the rise in technology use have been contributing factors to prolonged workplace stress across the entire working profession, particularly in high-pressure environments. This repeated exposure is known as chronic stress. It is a response to pressure suffered for a prolonged period of time in which an individual perceives they have little or no control.
It is unsurprising that humans struggle to function when stressed. Cortisol is the hormone which regulates a number of processes in the body, from immune response to metabolism. It is also the primary stress hormone, increasing blood sugar levels and suppresses the digestive system during times of stress. Together with adrenaline, cortisol is a major driver in helping the body react to stress. An overexposure to stress, and consequently these hormones, results in disruption such as sleep and digestive problems and headaches. This hormonal system also interacts with the regions of the brain controlling mood and motivation.
The body’s coping mechanism is stretched to breaking point when it is placed under stress for a prolonged period of time. Eventually, this chronic stress leads to burnout; an emotionally draining condition which is often misunderstood.
Burnout is often characterised by pure exhaustion; frazzled, drained of energy, the condition often revolves around the pressures of the working environment. But burnout is rooted more in a disengaged, cynical view of the world. Rather than on a cliff edge, emotions are blunted. Sufferers experience a loss of motivation and feelings of helplessness, detachment and depression. While burnout is not limited to any individual or profession – it can present itself in non-work settings too, dependent on certain lifestyles or personalities – it is
“By the time someone is really burning out, they could be exhibiting several performance issues. They could be irritable, disconnected, withdrawing; or they could be showing up late to work, leaving early, taking a lot of sick days.”
Photo taken by @finnnyc of The Nue Co. campaign – Instagram: @thenue_co
10 11
Leesman Review Issue 31Expert insights | Leesman insights
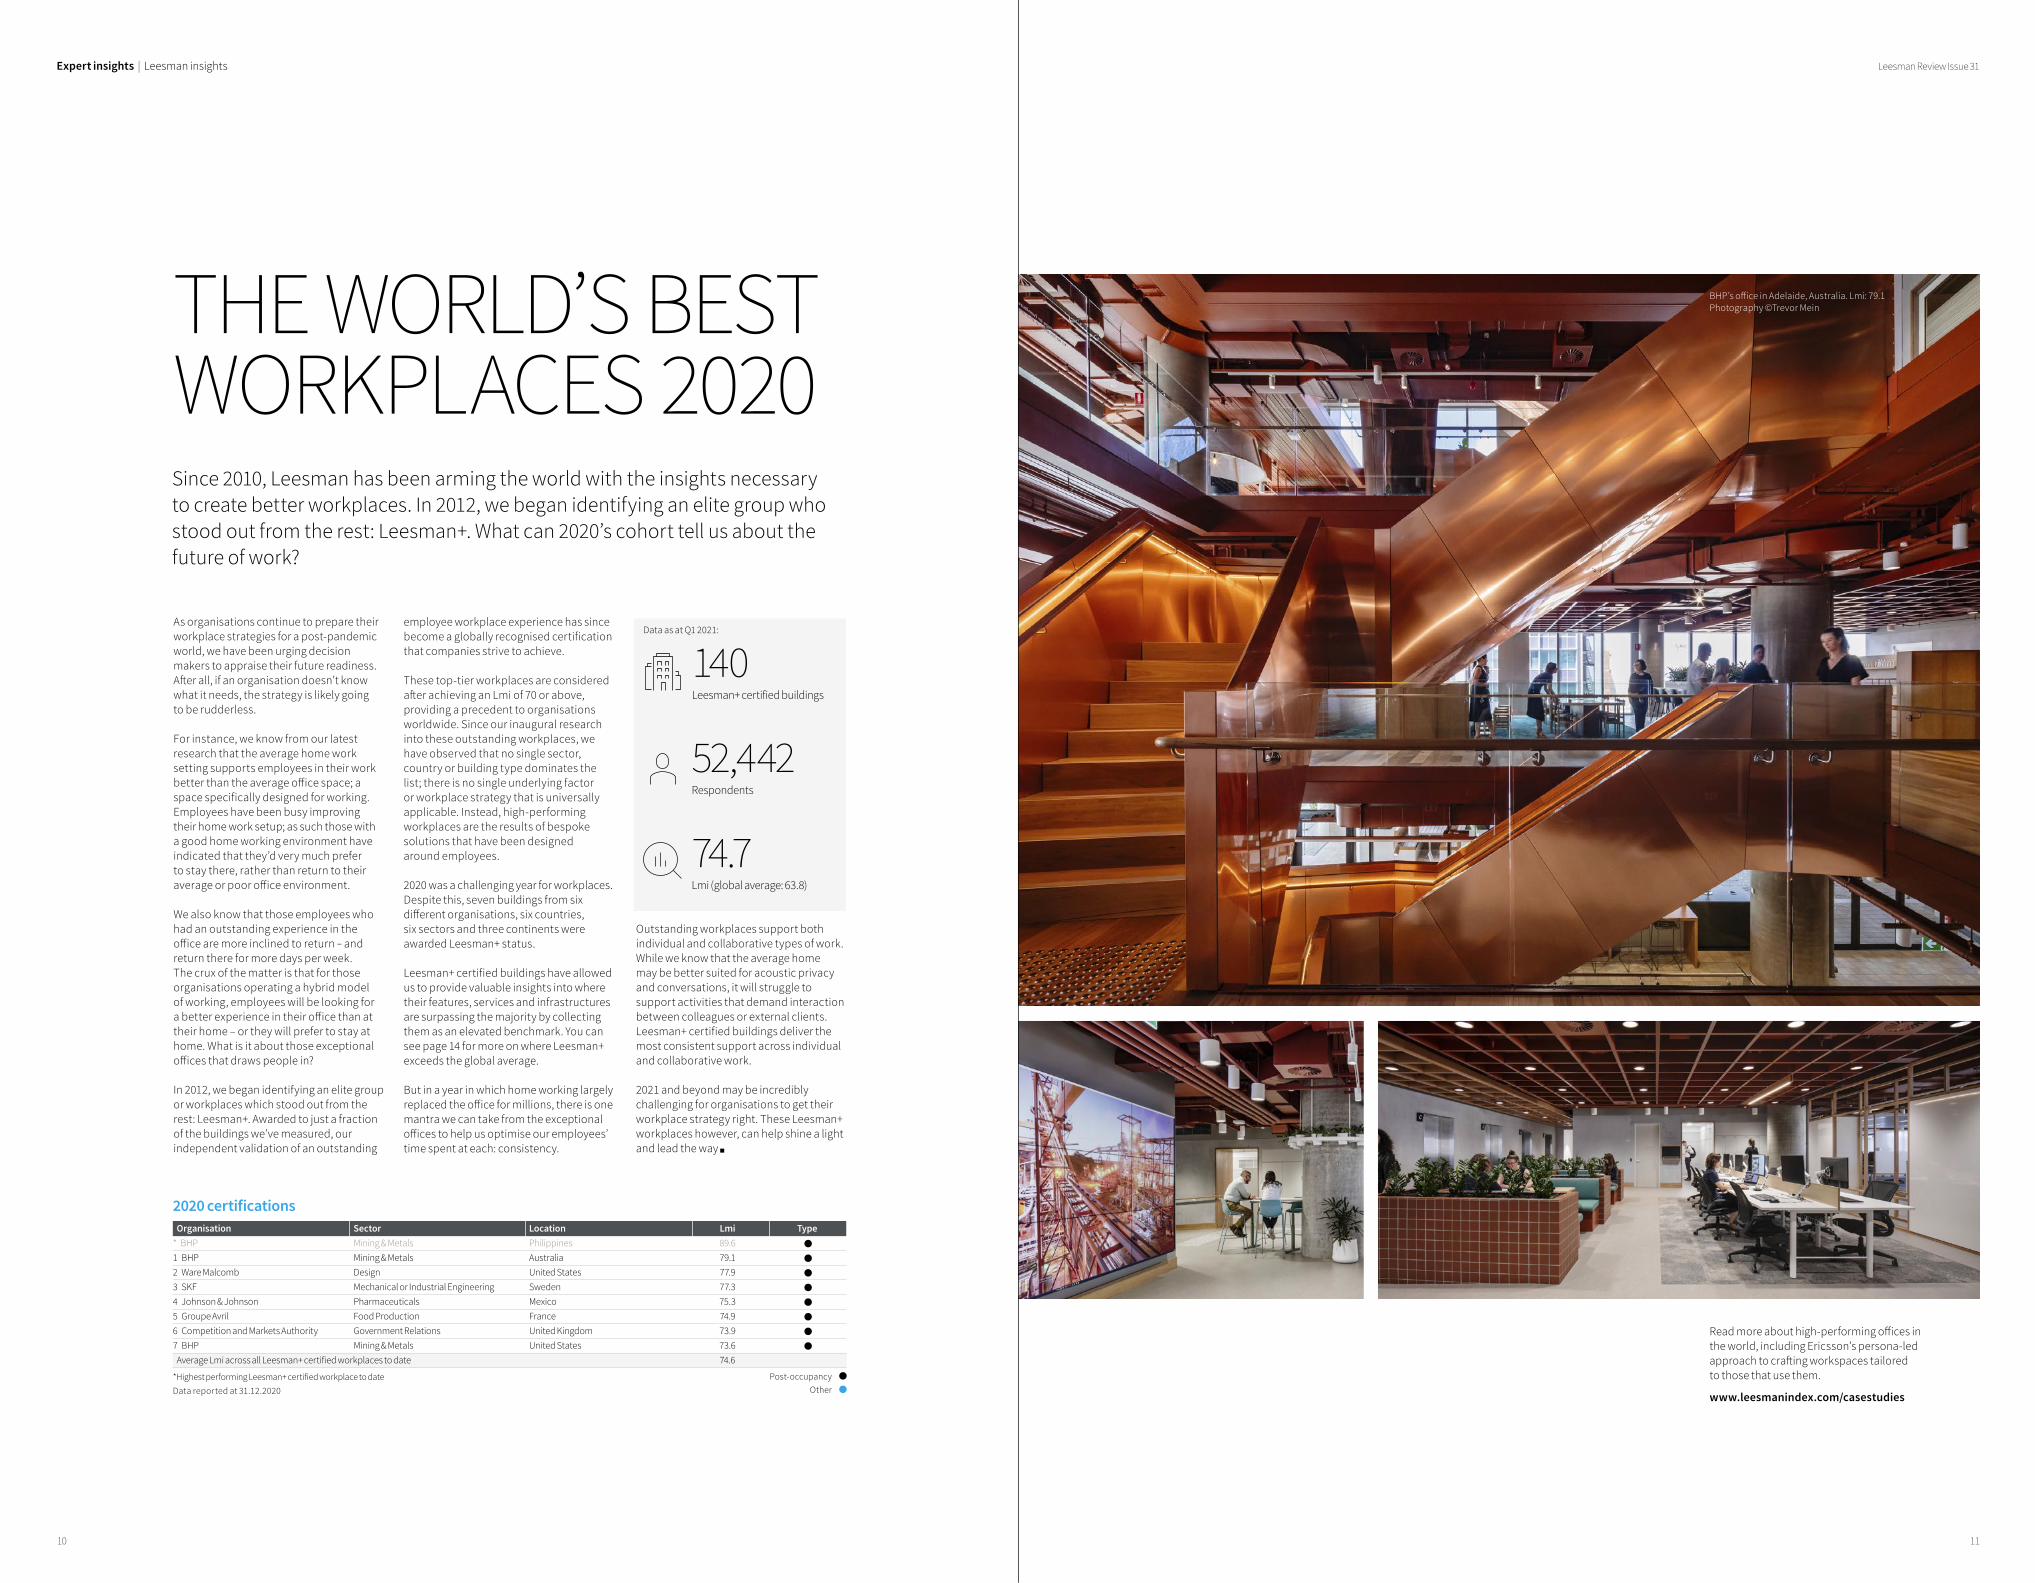
THE WORLD’S BEST WORKPLACES 2020Since 2010, Leesman has been arming the world with the insights necessary to create better workplaces. In 2012, we began identifying an elite group who stood out from the rest: Leesman+. What can 2020’s cohort tell us about the future of work?
Read more about high-performing offices in the world, including Ericsson’s persona-led approach to crafting workspaces tailored to those that use them.
www.leesmanindex.com/casestudies
employee workplace experience has since become a globally recognised certification that companies strive to achieve.
These top-tier workplaces are considered after achieving an Lmi of 70 or above, providing a precedent to organisations worldwide. Since our inaugural research into these outstanding workplaces, we have observed that no single sector, country or building type dominates the list; there is no single underlying factor or workplace strategy that is universally applicable. Instead, high-performing workplaces are the results of bespoke solutions that have been designed around employees.
2020 was a challenging year for workplaces. Despite this, seven buildings from six different organisations, six countries, six sectors and three continents were awarded Leesman+ status.
Leesman+ certified buildings have allowed us to provide valuable insights into where their features, services and infrastructures are surpassing the majority by collecting them as an elevated benchmark. You can see page 14 for more on where Leesman+ exceeds the global average.
But in a year in which home working largely replaced the office for millions, there is one mantra we can take from the exceptional offices to help us optimise our employees’ time spent at each: consistency.
As organisations continue to prepare their workplace strategies for a post-pandemic world, we have been urging decision makers to appraise their future readiness. After all, if an organisation doesn’t know what it needs, the strategy is likely going to be rudderless.
For instance, we know from our latest research that the average home work setting supports employees in their work better than the average office space; a space specifically designed for working. Employees have been busy improving their home work setup; as such those with a good home working environment have indicated that they’d very much prefer to stay there, rather than return to their average or poor office environment.
We also know that those employees who had an outstanding experience in the office are more inclined to return – and return there for more days per week. The crux of the matter is that for those organisations operating a hybrid model of working, employees will be looking for a better experience in their office than at their home – or they will prefer to stay at home. What is it about those exceptional offices that draws people in?
In 2012, we began identifying an elite group or workplaces which stood out from the rest: Leesman+. Awarded to just a fraction of the buildings we’ve measured, our independent validation of an outstanding
Outstanding workplaces support both individual and collaborative types of work. While we know that the average home may be better suited for acoustic privacy and conversations, it will struggle to support activities that demand interaction between colleagues or external clients. Leesman+ certified buildings deliver the most consistent support across individual and collaborative work.
2021 and beyond may be incredibly challenging for organisations to get their workplace strategy right. These Leesman+ workplaces however, can help shine a light and lead the way
Data as at Q1 2021:
140Leesman+ certified buildings
52,442Respondents
74.7Lmi (global average: 63.8)
BHP’s office in Adelaide, Australia. Lmi: 79.1Photography ©Trevor Mein
Post-occupancyOther
2020 certifications Organisation Sector Location Lmi Type* BHP Mining & Metals Philippines 89.6 1 BHP Mining & Metals Australia 79.1 2 Ware Malcomb Design United States 77.9 3 SKF Mechanical or Industrial Engineering Sweden 77.3 4 Johnson & Johnson Pharmaceuticals Mexico 75.3 5 Groupe Avril Food Production France 74.9 6 Competition and Markets Authority Government Relations United Kingdom 73.9 7 BHP Mining & Metals United States 73.6 Average Lmi across all Leesman+ certified workplaces to date 74.6
*Highest performing Leesman+ certified workplace to dateData reported at 31.12.2020
12 13
Leesman Review Issue 30Expert insight | Dr Peggie Rothe – Chief Insights & Research Officer, Leesman
THE OPEN PLAN ANGRY MOBRETURN
The witch hunt against open-plan environments is still in full swing. Despite everything we’ve learned about both home working and office-based experiences.
A few years prior to my publishing the rebuttal, an article I co-authored was referenced in The New Yorker, in an article titled ‘The open-office trap’. While our findings predominantly identified positive experiences among the participants, the article chose to focus on the small proportion of negative findings. Two days later, a Finnish business magazine retold that story from The New Yorker with the headline ‘All studies agree that open plan is a terrible idea’, even though that was far from what we had concluded. It also seems that what gets published is sometimes heavily influenced by the author’s own experiences.
I later sent an email to the same Finnish magazine, where I pointed out that their statement of there not being any difference between activity-based working (ABW) environments and open-plan offices was incorrect. The response I got was that the reporter had worked in both and she thought they were the same. So based on her personal experience, it was published in a nationwide business magazine.
Taking these attention-grabbing headlines at face value is extremely risky.
A case in point of this happening more recently is the claims of the death of the office and the office desk, most notably in the Wall Street Journal, which we responded to in January 2021.
It would be naïve to claim that the open-plan solution is completely without challenges. In fact, I would never deny that an open-plan office which is expected to support all activities from focused work to telephone conversations, mixed with poor acoustic and no variety of settings, is a poor solution. But that does not mean the entire concept is flawed and that all open environments are bad.
When research is conducted on poorly designed open-plan offices, I would expect to see results that show it is bad. Some of the damning headlines have in fact been based on findings from research, some of which have respondent numbers reaching statistically interesting sample sizes. But if all those respondents are from one or two organisations with poorly designed workplaces, it’s against all laws of statistics to generalise and conclude that open offices are generally flawed as a concept. It’s not until you have looked at enough different open-plan offices that you can make those kinds of claims. With more than 5,000 workplaces measured and over 3,000 of those with more than 50 responses, let’s have a look at what the Leesman database says.
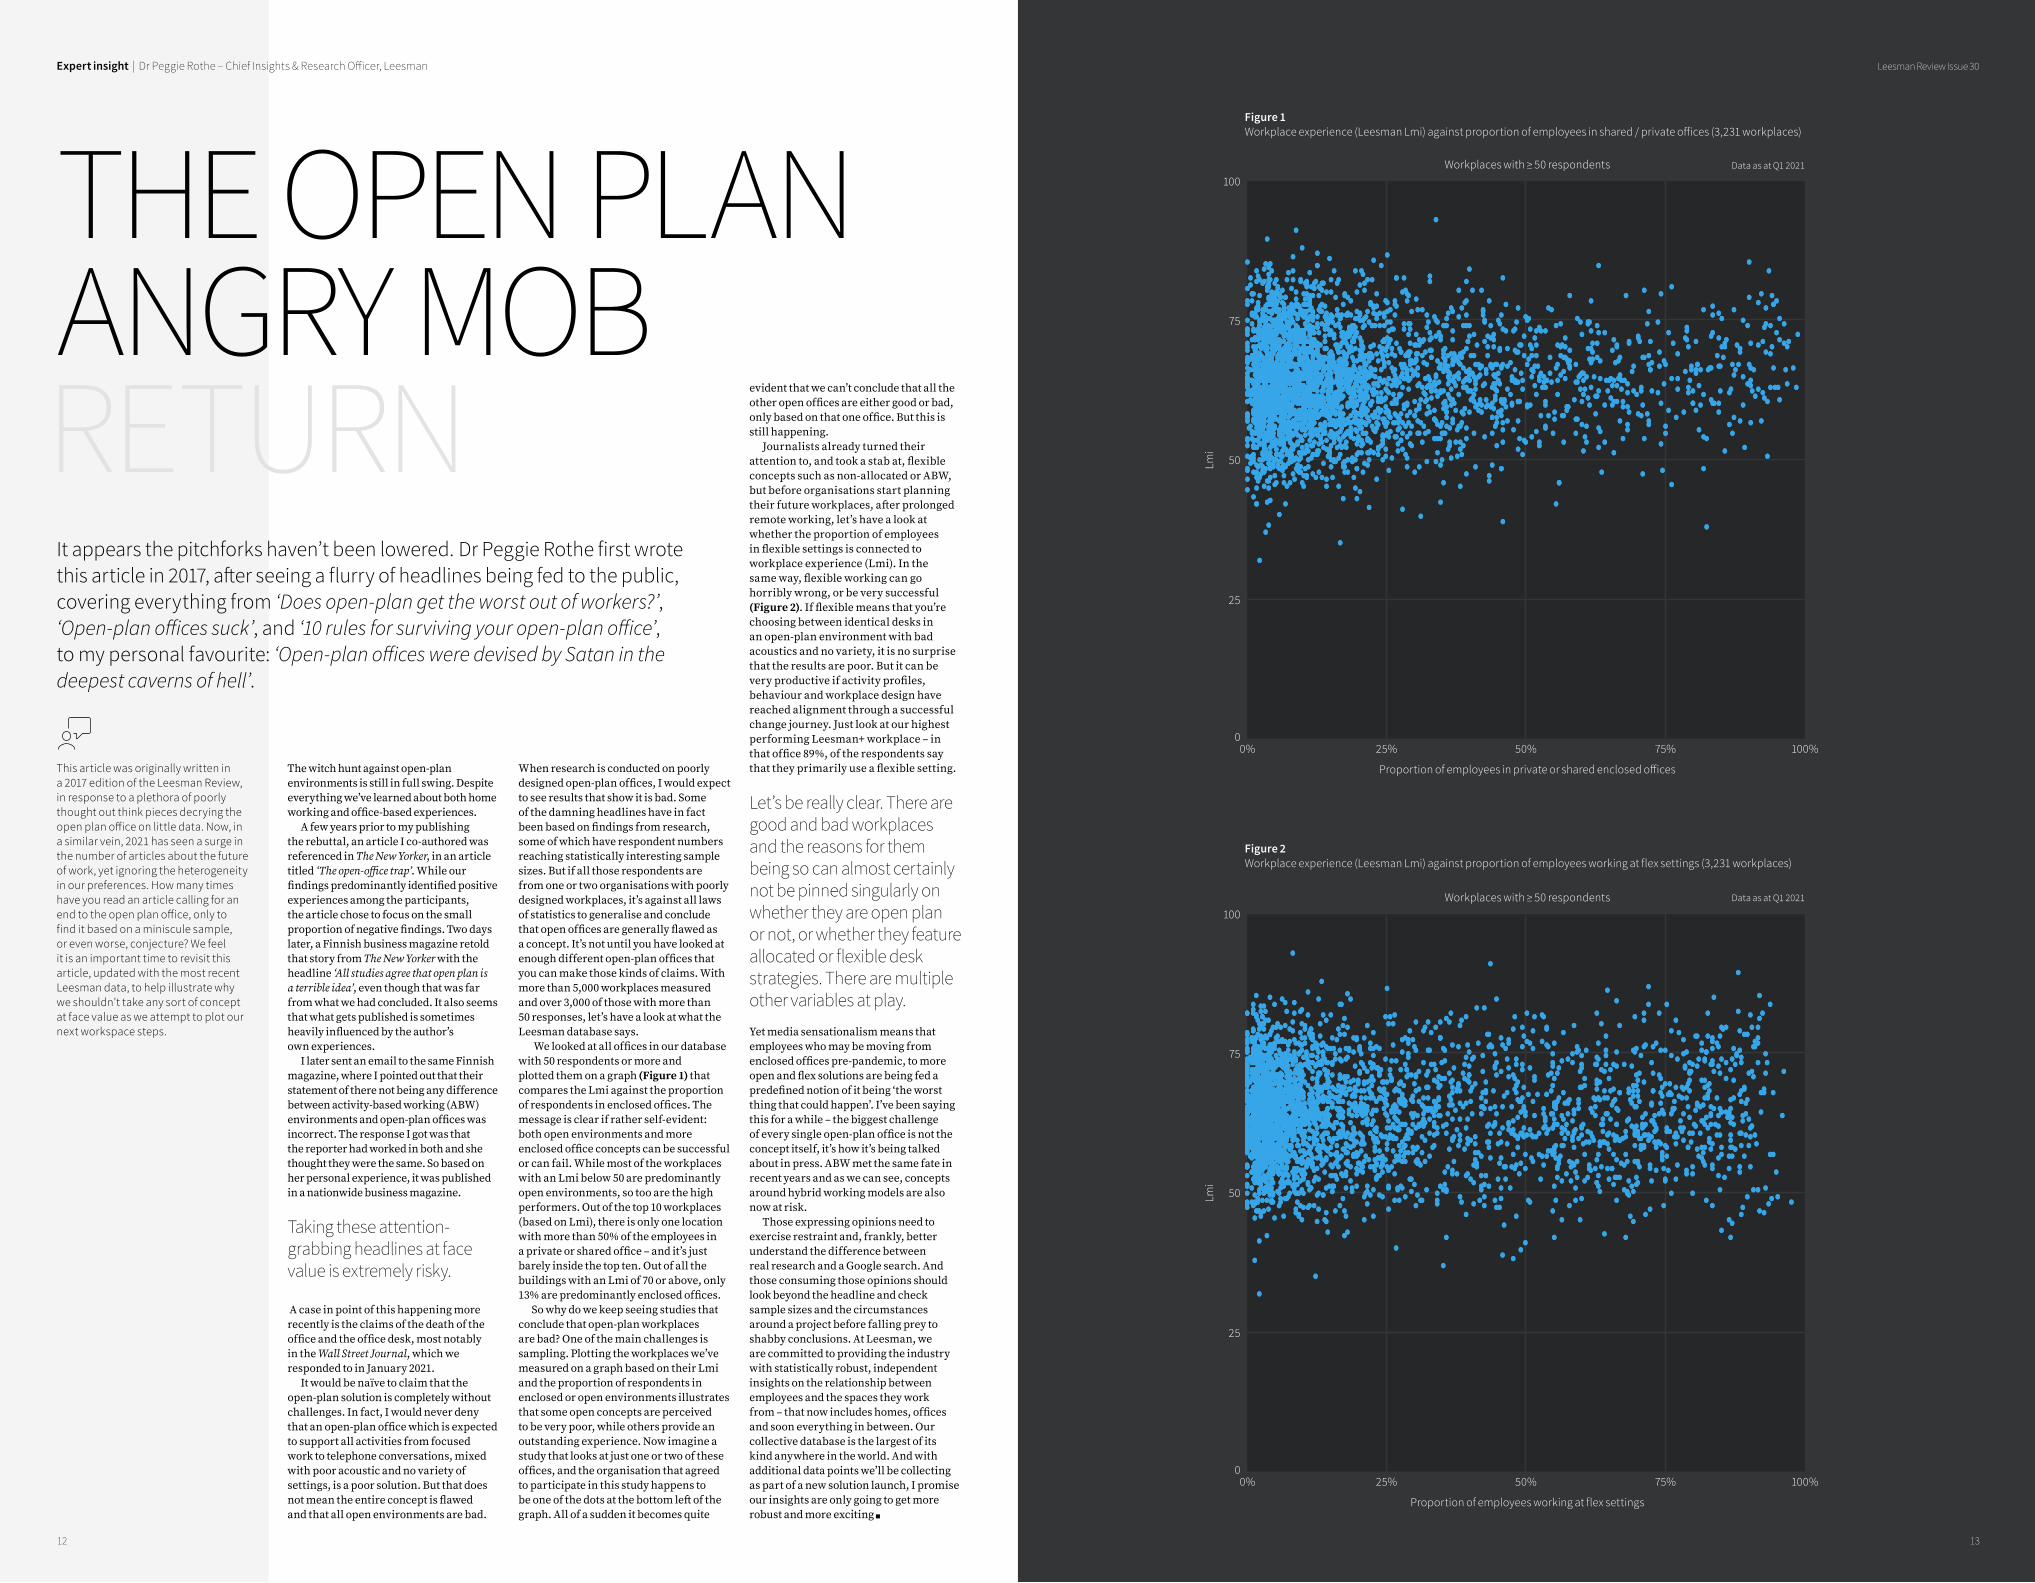
We looked at all offices in our database with 50 respondents or more and plotted them on a graph (Figure 1) that compares the Lmi against the proportion of respondents in enclosed offices. The message is clear if rather self-evident: both open environments and more enclosed office concepts can be successful or can fail. While most of the workplaces with an Lmi below 50 are predominantly open environments, so too are the high performers. Out of the top 10 workplaces (based on Lmi), there is only one location with more than 50% of the employees in a private or shared office – and it’s just barely inside the top ten. Out of all the buildings with an Lmi of 70 or above, only 13% are predominantly enclosed offices.
So why do we keep seeing studies that conclude that open-plan workplaces are bad? One of the main challenges is sampling. Plotting the workplaces we’ve measured on a graph based on their Lmi and the proportion of respondents in enclosed or open environments illustrates that some open concepts are perceived to be very poor, while others provide an outstanding experience. Now imagine a study that looks at just one or two of these offices, and the organisation that agreed to participate in this study happens to be one of the dots at the bottom left of the graph. All of a sudden it becomes quite
evident that we can’t conclude that all the other open offices are either good or bad, only based on that one office. But this is still happening.
Journalists already turned their attention to, and took a stab at, flexible concepts such as non-allocated or ABW, but before organisations start planning their future workplaces, after prolonged remote working, let’s have a look at whether the proportion of employees in flexible settings is connected to workplace experience (Lmi). In the same way, flexible working can go horribly wrong, or be very successful (Figure 2). If flexible means that you’re choosing between identical desks in an open-plan environment with bad acoustics and no variety, it is no surprise that the results are poor. But it can be very productive if activity profiles, behaviour and workplace design have reached alignment through a successful change journey. Just look at our highest performing Leesman+ workplace – in that office 89%, of the respondents say that they primarily use a flexible setting.
Let’s be really clear. There are good and bad workplaces and the reasons for them being so can almost certainly not be pinned singularly on whether they are open plan or not, or whether they feature allocated or flexible desk strategies. There are multiple other variables at play.
Yet media sensationalism means that employees who may be moving from enclosed offices pre-pandemic, to more open and flex solutions are being fed a predefined notion of it being ‘the worst thing that could happen’. I’ve been saying this for a while – the biggest challenge of every single open-plan office is not the concept itself, it’s how it’s being talked about in press. ABW met the same fate in recent years and as we can see, concepts around hybrid working models are also now at risk.
Those expressing opinions need to exercise restraint and, frankly, better understand the difference between real research and a Google search. And those consuming those opinions should look beyond the headline and check sample sizes and the circumstances around a project before falling prey to shabby conclusions. At Leesman, we are committed to providing the industry with statistically robust, independent insights on the relationship between employees and the spaces they work from – that now includes homes, offices and soon everything in between. Our collective database is the largest of its kind anywhere in the world. And with additional data points we’ll be collecting as part of a new solution launch, I promise our insights are only going to get more robust and more exciting
It appears the pitchforks haven’t been lowered. Dr Peggie Rothe first wrote this article in 2017, after seeing a flurry of headlines being fed to the public, covering everything from ‘Does open-plan get the worst out of workers?’, ‘Open-plan offices suck’, and ‘10 rules for surviving your open-plan office’, to my personal favourite: ‘Open-plan offices were devised by Satan in the deepest caverns of hell’.
This article was originally written in a 2017 edition of the Leesman Review, in response to a plethora of poorly thought out think pieces decrying the open plan office on little data. Now, in a similar vein, 2021 has seen a surge in the number of articles about the future of work, yet ignoring the heterogeneity in our preferences. How many times have you read an article calling for an end to the open plan office, only to find it based on a miniscule sample, or even worse, conjecture? We feel it is an important time to revisit this article, updated with the most recent Leesman data, to help illustrate why we shouldn’t take any sort of concept at face value as we attempt to plot our next workspace steps.
Proportion of employees in private or shared enclosed offices
0%0
100
75
50
25
100%50%25% 75%
Workplaces with ≥ 50 respondents Data as at Q1 2021
Data as at Q1 2021
Lmi
Figure 1 Workplace experience (Leesman Lmi) against proportion of employees in shared / private offices (3,231 workplaces)
Proportion of employees working at flex settings
0%0
100
75
50
25
100%50%25% 75%
Workplaces with ≥ 50 respondents
Lmi
Figure 2Workplace experience (Leesman Lmi) against proportion of employees working at flex settings (3,231 workplaces)
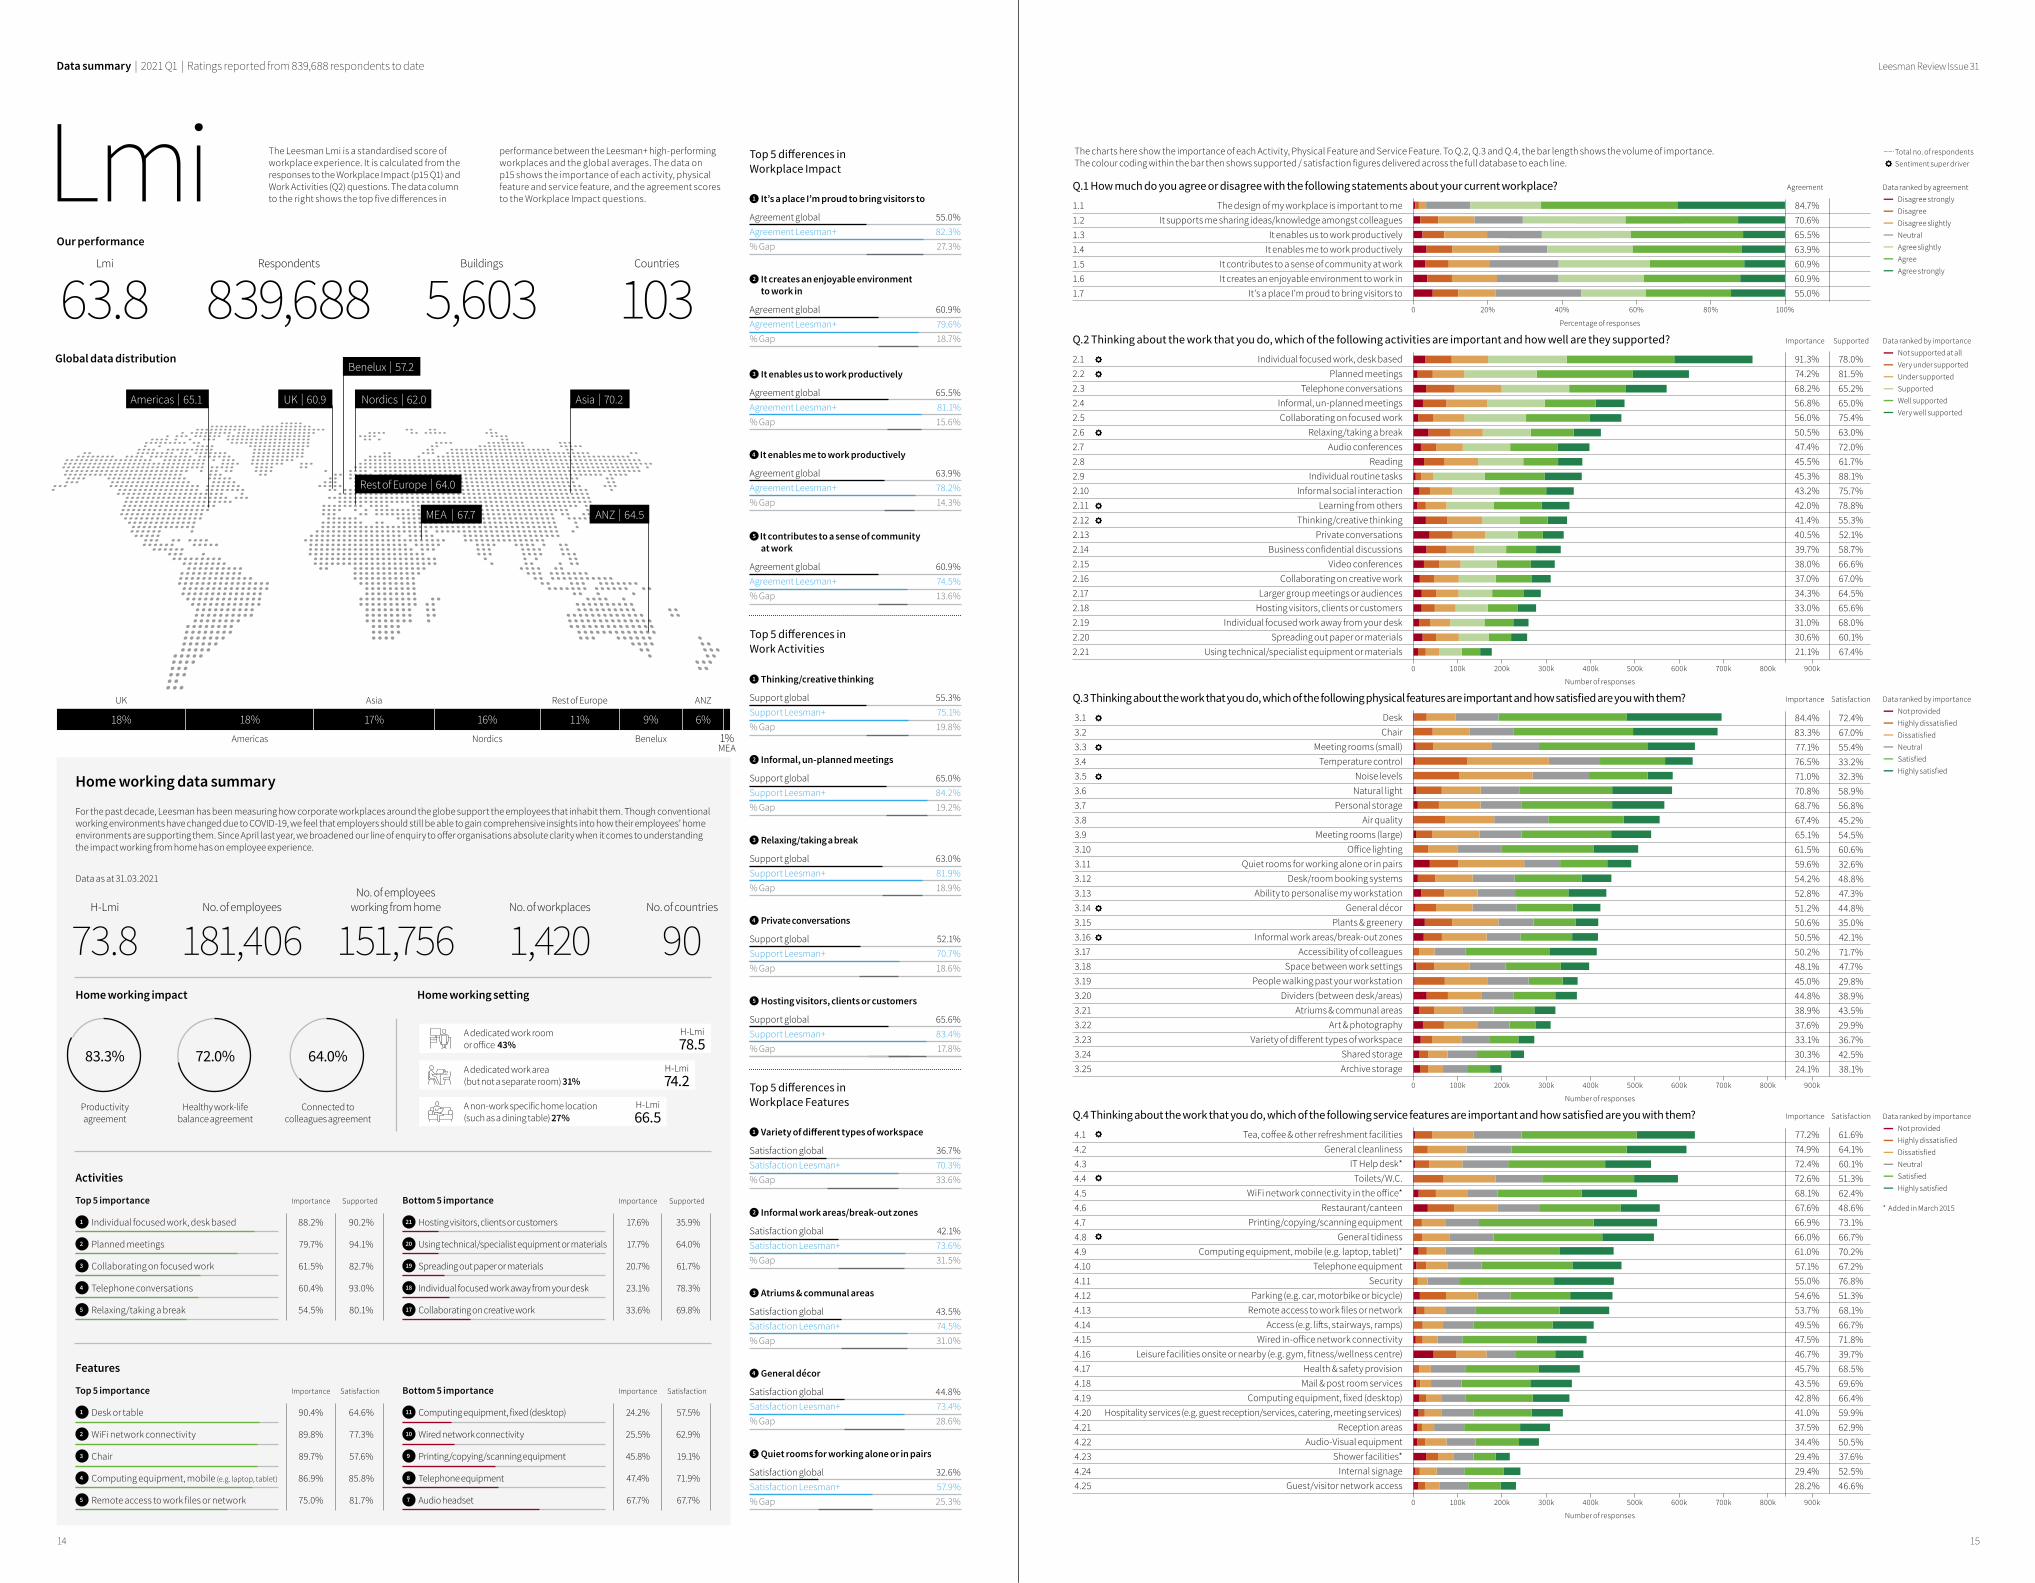
LmiOur performance
Lmi
63.8Respondents
839,688Buildings
5,603Countries
103
The Leesman Lmi is a standardised score of workplace experience. It is calculated from the responses to the Workplace Impact (p15 Q1) and Work Activities (Q2) questions. The data column to the right shows the top five differences in
2 It creates an enjoyable environment to work in
Agreement global 60.9%Agreement Leesman+ 79.6% % Gap 18.7%
3 It enables us to work productively
Agreement global 65.5%Agreement Leesman+ 81.1% % Gap 15.6%
4 It enables me to work productively
Agreement global 63.9%Agreement Leesman+ 78.2% % Gap 14.3%
1 It’s a place I’m proud to bring visitors to
Agreement global 55.0%Agreement Leesman+ 82.3%% Gap 27.3%
Top 5 differences in Workplace Impact
5 It contributes to a sense of community at work
Agreement global 60.9%Agreement Leesman+ 74.5% % Gap 13.6%
Top 5 differences in Work Activities
2 Informal, un-planned meetings
Support global 65.0%Support Leesman+ 84.2%% Gap 19.2%
1 Thinking/creative thinking
Support global 55.3%Support Leesman+ 75.1%% Gap 19.8%
3 Relaxing/taking a break
Support global 63.0%Support Leesman+ 81.9%% Gap 18.9%
5 Hosting visitors, clients or customers
Support global 65.6%Support Leesman+ 83.4%% Gap 17.8%
Top 5 differences in Workplace Features
5 Quiet rooms for working alone or in pairs
Satisfaction global 32.6%Satisfaction Leesman+ 57.9% % Gap 25.3%
4 General décor
Satisfaction global 44.8%Satisfaction Leesman+ 73.4% % Gap 28.6%
3 Atriums & communal areas
Satisfaction global 43.5%Satisfaction Leesman+ 74.5% % Gap 31.0%
2 Informal work areas/break-out zones
Satisfaction global 42.1%Satisfaction Leesman+ 73.6% % Gap 31.5%
1 Variety of different types of workspace
Satisfaction global 36.7%Satisfaction Leesman+ 70.3%% Gap 33.6%
Total no. of respondents Sentiment super driver
Data ranked by importance Not supported at all Very under supported Under supported Supported Well supported Very well supported
Data ranked by importance Not provided Highly dissatisfied Dissatisfied Neutral Satisfied Highly satisfied
Data ranked by importance Not provided Highly dissatisfied Dissatisfied Neutral Satisfied Highly satisfied
* Added in March 2015
Data ranked by agreement Disagree strongly Disagree Disagree slightly Neutral Agree slightly Agree Agree strongly
Importance
Importance
Importance
Agreement
0 20% 80%40% 100%60%
Number of responses
Number of responses
Percentage of responses
Number of responses
Satisfaction
Satisfaction
Supported
Data summary | 2021 Q1 | Ratings reported from 839,688 respondents to date
14 15
Leesman Review Issue 31
2.1 2.2 2.3 2.4 2.5 2.62.72.82.92.102.112.122.132.142.152.162.172.182.192.202.21
1.1 1.2 1.3 1.4 1.5 1.61.7
3.1 3.2 3.3 3.4 3.5 3.63.73.83.93.103.113.123.133.143.153.163.173.183.193.203.213.223.233.243.25
4.1 4.2 4.3 4.4 4.5 4.64.74.84.94.104.114.124.134.144.154.164.174.184.194.204.214.224.234.244.25
The charts here show the importance of each Activity, Physical Feature and Service Feature. To Q.2, Q.3 and Q.4, the bar length shows the volume of importance. The colour coding within the bar then shows supported / satisfaction figures delivered across the full database to each line.
100k 300k 400k200k 500k 800k 900k700k600k0
100k 300k 400k200k 500k 800k 900k700k600k0
100k 300k 400k200k 500k 800k 900k700k600k0
ANZ | 64.5
Benelux | 57.2
Rest of Europe | 64.0
MEA | 67.7
Nordics | 62.0UK | 60.9Americas | 65.1 Asia | 70.2
Global data distribution
1%MEA
ANZ
6%
UK
18%
Asia
17%
Rest of Europe
11%16%
Nordics
18%
Americas
9%
Benelux
Home working data summary
H-Lmi
73.8No. of employees
181,406No. of workplaces
1,420No. of countries
90No. of employees
working from home
151,756
Healthy work-life balance agreement
72.0%
Connected to colleagues agreement
64.0%
21 Hosting visitors, clients or customers 17.6% 35.9%
20 Using technical/specialist equipment or materials 17.7% 64.0%
19 Spreading out paper or materials 20.7% 61.7%
18 Individual focused work away from your desk 23.1% 78.3%
17 Collaborating on creative work 33.6% 69.8%
ImportanceBottom 5 importance Supported
1 Individual focused work, desk based 88.2% 90.2%
2 Planned meetings 79.7% 94.1%
3 Collaborating on focused work 61.5% 82.7%
4 Telephone conversations 60.4% 93.0%
5 Relaxing/taking a break 54.5% 80.1%
ImportanceTop 5 importance
Activities
Home working impact Home working setting
Features
Supported
11 Computing equipment, fixed (desktop) 24.2% 57.5%
10 Wired network connectivity 25.5% 62.9%
9 Printing/copying/scanning equipment 45.8% 19.1%
8 Telephone equipment 47.4% 71.9%
7 Audio headset 67.7% 67.7%
ImportanceBottom 5 importance Satisfaction
1 Desk or table 90.4% 64.6%
2 WiFi network connectivity 89.8% 77.3%
3 Chair 89.7% 57.6%
4 Computing equipment, mobile (e.g. laptop, tablet) 86.9% 85.8%
5 Remote access to work files or network 75.0% 81.7%
ImportanceTop 5 importance Satisfaction
performance between the Leesman+ high-performing workplaces and the global averages. The data on p15 shows the importance of each activity, physical feature and service feature, and the agreement scores to the Workplace Impact questions.
A dedicated work room or office 43%
A dedicated work area (but not a separate room) 31%
A non-work specific home location (such as a dining table) 27%
H-Lmi66.5
H-Lmi74.2
H-Lmi78.5
Data as at 31.03.2021
For the past decade, Leesman has been measuring how corporate workplaces around the globe support the employees that inhabit them. Though conventional working environments have changed due to COVID-19, we feel that employers should still be able to gain comprehensive insights into how their employees’ home environments are supporting them. Since April last year, we broadened our line of enquiry to offer organisations absolute clarity when it comes to understanding the impact working from home has on employee experience.
Productivity agreement
83.3%
Q.1 How much do you agree or disagree with the following statements about your current workplace?
The design of my workplace is important to me It supports me sharing ideas/knowledge amongst colleagues It enables us to work productively It enables me to work productively It contributes to a sense of community at work It creates an enjoyable environment to work in It's a place I'm proud to bring visitors to
Q.2 Thinking about the work that you do, which of the following activities are important and how well are they supported?
Individual focused work, desk based Planned meetings Telephone conversations Informal, un-planned meetings Collaborating on focused work Relaxing/taking a break Audio conferences Reading Individual routine tasks Informal social interaction Learning from others Thinking/creative thinking Private conversations Business confidential discussions Video conferences Collaborating on creative work Larger group meetings or audiences Hosting visitors, clients or customers Individual focused work away from your desk Spreading out paper or materials Using technical/specialist equipment or materials
Q.3 Thinking about the work that you do, which of the following physical features are important and how satisfied are you with them?
Desk Chair Meeting rooms (small) Temperature control Noise levels Natural light Personal storage Air quality Meeting rooms (large) Office lighting Quiet rooms for working alone or in pairs Desk/room booking systems Ability to personalise my workstation General décor Plants & greenery Informal work areas/break-out zones Accessibility of colleagues Space between work settings People walking past your workstation Dividers (between desk/areas) Atriums & communal areas Art & photography Variety of different types of workspace Shared storage Archive storage
Q.4 Thinking about the work that you do, which of the following service features are important and how satisfied are you with them? Tea, coffee & other refreshment facilities General cleanliness IT Help desk* Toilets/W.C. WiFi network connectivity in the office* Restaurant/canteen Printing/copying/scanning equipment General tidiness Computing equipment, mobile (e.g. laptop, tablet)* Telephone equipment Security Parking (e.g. car, motorbike or bicycle) Remote access to work files or network Access (e.g. lifts, stairways, ramps) Wired in-office network connectivity Leisure facilities onsite or nearby (e.g. gym, fitness/wellness centre) Health & safety provision Mail & post room services Computing equipment, fixed (desktop) Hospitality services (e.g. guest reception/services, catering, meeting services) Reception areas Audio-Visual equipment Shower facilities* Internal signage Guest/visitor network access
4 Private conversations
Support global 52.1%Support Leesman+ 70.7%% Gap 18.6%
84.7%70.6%65.5%63.9%60.9%60.9%55.0%
91.3%74.2%68.2%56.8%56.0%50.5%47.4%45.5%45.3%43.2%42.0%41.4%40.5%39.7%38.0%37.0%34.3%33.0%31.0%30.6%21.1%
78.0%81.5%65.2%65.0%75.4%63.0%72.0%61.7%88.1%75.7%78.8%55.3%52.1%58.7%66.6%67.0%64.5%65.6%68.0%60.1%67.4%
77.2%74.9%72.4%72.6%68.1%67.6%66.9%66.0%61.0%57.1%55.0%54.6%53.7%49.5%47.5%46.7%45.7%43.5%42.8%41.0%37.5%34.4%29.4%29.4%28.2%
61.6%64.1%60.1%51.3%62.4%48.6%73.1%66.7%70.2%67.2%76.8%51.3%68.1%66.7%71.8%39.7%68.5%69.6%66.4%59.9%62.9%50.5%37.6%52.5%46.6%
84.4%83.3%77.1%76.5%71.0%70.8%68.7%67.4%65.1%61.5%59.6%54.2%52.8%51.2%50.6%50.5%50.2%48.1%45.0%44.8%38.9%37.6%33.1%30.3%24.1%
72.4%67.0%55.4%33.2%32.3%58.9%56.8%45.2%54.5%60.6%32.6%48.8%47.3%44.8%35.0%42.1%71.7%47.7%29.8%38.9%43.5%29.9%36.7%42.5%38.1%
Provocateur’s Page | Alf Rehn
“We've all met the person who likes to say they are a really creative person. And we go: ‘No, you're not. You're just annoying.’”
Professor Alf Rehn rarely holds back when talking about his favourite subject. Here’s what we learned in an hour in Rehn’s company.
We have a society which rewards creativity and which reveres innovation. Would you like to work in a creative workplace? It's very difficult to answer no to that question because who wants to live their life in some kind of Kafkaesque bureaucracy hell. But what does it really mean? A creative workspace can be one where there's constant challenge, where there are lots of ideas. When a boss comes to the workplace and says: “We have to become more innovative,” I get hives. Without meaning, they're just words.
They want to feel that what they're doing is actually creating something greater than themselves and not just changing the icing on the muffin.
That's often what happens. They see that innovation is what somebody else gets to do: “I'm too old,” “I'm not in the right department,” “I'm too female.” Lots of things can make you feel that you're not allowed to be part of the creative crew.
We need to create a little friction – not too much – that can hone an original, somewhat dull and lifeless idea into something sharp and sparkly.We human beings are a little weird because we are either think that there should be no critique or there should be all critique. You’ve been listened to; you’re engaged with on a human-to-human basis. If no one follows up with points, you will realise that you're being patronised.
Leaders need to be much more like farmers. A farmer who just yells at his seeds to grow, will not succeed. He can stand there on the field and shout all day long, if that's what he's into doing. That's not going to change anything. The farmer who starts by making sure that the soil is of the right kind, making sure that the seeds are planted not too far apart, but not too close either; who provides the seeds with manure and water and sunlight; who tends to the soil much more than they shout at it, will see their
seeds bloom faster or grow quicker. And yet that is how we engage with innovation. We shout and we demand and we bring in high price consultants and draw lots of really weird looking flow charts. But that's not where innovation comes from.
Innovation comes from there being a culture in which ideas are appreciated, but also debated; critique is a great thing for innovation and culture as well.
We've got stuck in a rut.I speak to organisations and I can see that light is starting to go out of people’s eyes. They tell me that people like me (consultants) normally come at the same time every year. There was almost a schedule to how innovation engagements were run in organisations. In the end they were fatigued by it all. Just like in a relationship, even the most wonderful thing can become fatiguing if it becomes just an empty ritual. It’s wonderful if you bring flowers to your partner, but if every Thursday you mechanically bring a bouquet of flowers and you start dumping them on the table, you will take something away from what was originally a beautiful gesture. If innovation consultants come and run a workshop every six months, people will realise that it isn't meaningful.
Sometimes, hindering innovation can have an invigorating effect.One CEO I knew who forbid the internal use of the term innovation in his company. This CEO instituted a moratorium for a period, stopping innovation projects.
I was observing this close hand. At first people said: “This is the death of the company,” but he held fast and something quite magical happened. All those people in the organisation – for whom innovation didn’t resonate – felt freed. They could go about just doing the wrong thing. They didn't have to sit in on workshops and seminars and meetings that they felt were ‘innovation theatres’. And they did stuff like whittling down their inboxes and sorting out stuff that should have been sorted out ages ago, and actually felt inspired. And those who'd loved innovation started saying:
ALF REHN
This issue’s provocateur is Professor Alf Rehn, professor of innovation, design and management at the University of Southern Denmark. In his speaking engagements and his book, Innovation for the Fatigued, Rehn discusses the basics of developing a creativity culture – even in a pandemic.
The opinions expressed by contributors represent those of the individual authors and unless clearly labelled as such do not represent the opinions of Leesman Ltd.
The Leesman Review is the journal of Leesman, the world’s leading independent assessor of workplace experience. We welcome contributions on the subjects that you think should interest us. Leesman is a registered trademark and all Leesman Review content is copyright April 2021.
Leesman91 Wimpole StreetLondon W1G 0EF +44 (0)20 3239 5980 [email protected]
“I’m going to show him once the moratorium is over.” When the moratorium was over, not only did those who really burned for change and innovation come out stronger than ever before, so did the people who previously didn’t care for innovation. They started engaging again because all of a sudden they had the energy. They felt now that we’re starting on an even keel. It seems illogical that having a moratorium on innovation could create more innovation, but I saw it in action.
Creativity is also hard, time-consuming work.One resource that companies seem to have a hard time of letting go of is time. If I ask an organisation how easy it is for somebody to take a day off to work on their idea, they look at me as if I’ve said something horrendous about their partner. Essentially, ideas take no resource at all except time.
One of the things I see people fail with in creativity is the fact that they imagine that there is this creativity fairy, and if they believe, creative ideas can just come to them. Boom.
Whereas I know that working with artists, working with inventors, working with business people, I see the sweat and the toil and the really terrible prototypes and the sketches that never went anywhere. We need to do more ‘bad work’, in that we need to be prepared to write or think, even though we’re not feeling perfectly in the mood.
Most of the things that we truly know about creativity, we've known for a hundred years.It's things like you need to take breaks. You need diversity. Sometimes creativity pops up when you least expect it. Having proper background research is still good. We might put different examples on it, but the basics we've known for 100 years. And why am I cross about this? Because you'd think that after a hundred years, I wouldn't have to go up to CEOs and say, you know what? You need more diversity on your teams, and they tell me to prove it. We've proven it a hundred thousand times over. It is fact; it is the natural law of creativity – diversity and diverse perspectives improve ideas. This should be as well-known as the law of gravity
Why are creativity and innovation comparable to muddling long-term relationships and bad farmers? Here, a professor of innovation explains what we get wrong about these concepts – and how we can get it right.